Equity Story September 2021
69
Public Equity story 1 September 2021
Transcript of Equity Story September 2021

Public
Equity story
1
September 2021
Contents
Sections
1 Investment case 4
2 Business lines 9
3 Corporate responsibility 30
4 Financials 33
5 Shareholding structure and governance 38
Appendices 41

Investment case
1
Fa
cin
g P
ag
e4
F
A
C
I
N
G
P
A
G
E
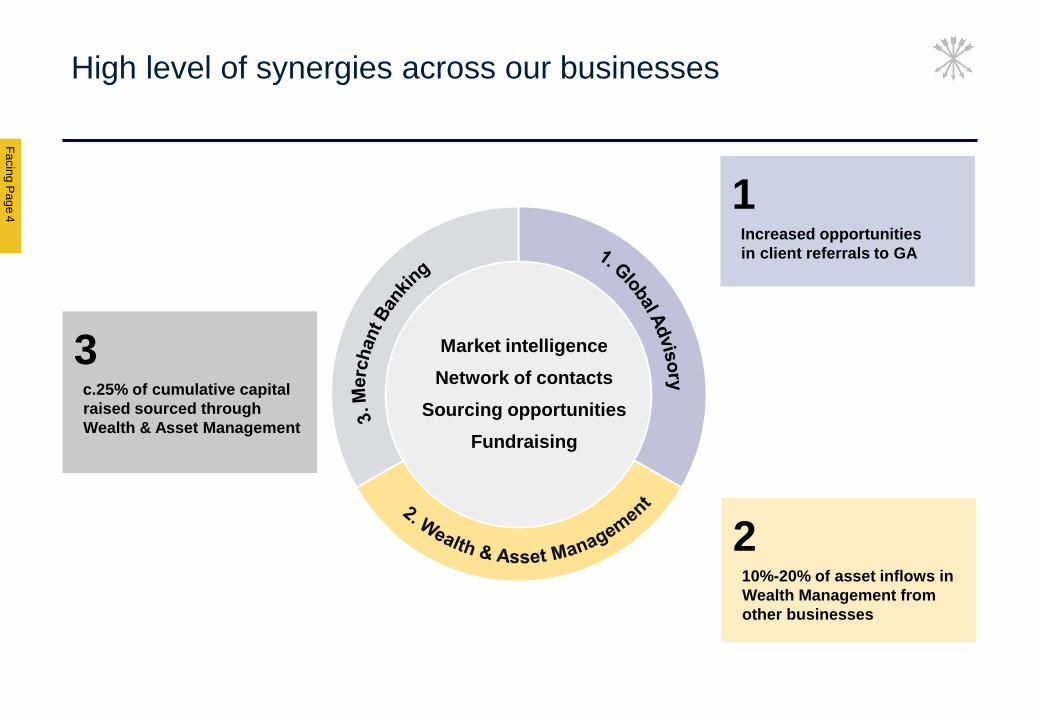
High level of synergies across our businesses
3c.25% of cumulative capital
raised sourced through
Wealth & Asset Management
210%-20% of asset inflows in
Wealth Management from
other businesses
1Increased opportunities
in client referrals to GA
Market intelligence
Network of contacts
Sourcing opportunities
Fundraising
Public
Global Advisory Wealth & Asset management Merchant Banking
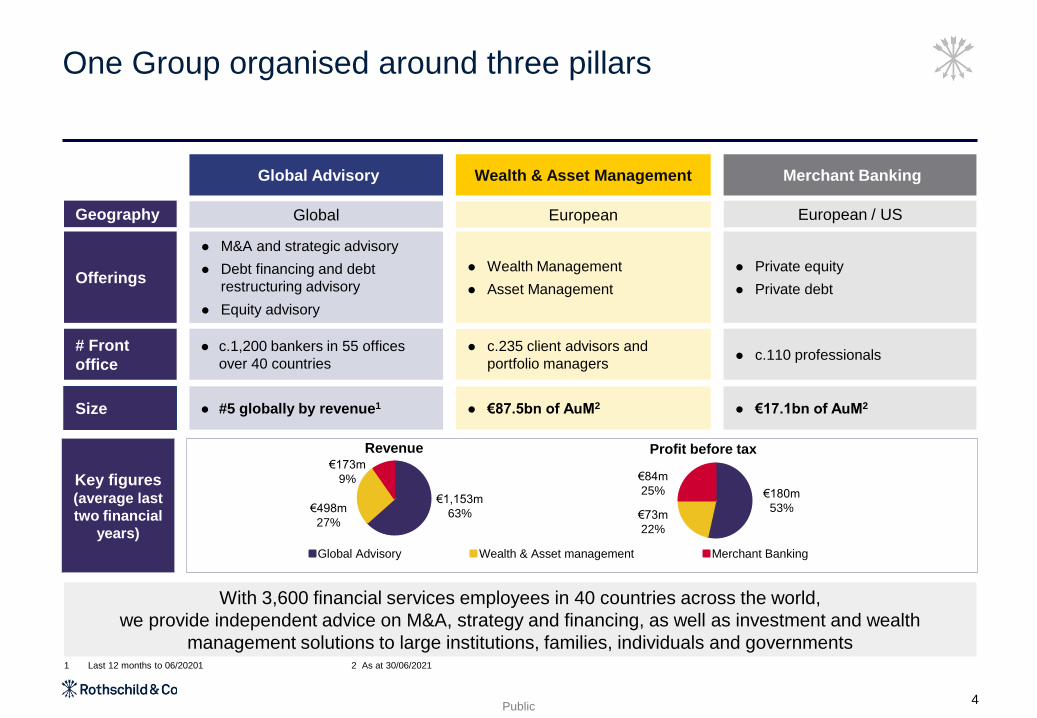
One Group organised around three pillars
With 3,600 financial services employees in 40 countries across the world,
we provide independent advice on M&A, strategy and financing, as well as investment and wealth
management solutions to large institutions, families, individuals and governments
Global Advisory Wealth & Asset Management Merchant Banking
Offerings
⚫ M&A and strategic advisory
⚫ Debt financing and debt
restructuring advisory
⚫ Equity advisory
⚫ Wealth Management
⚫ Asset Management
⚫ Private equity
⚫ Private debt
# Front
office
⚫ c.1,200 bankers in 55 offices
over 40 countries
⚫ c.235 client advisors and
portfolio managers⚫ c.110 professionals
Geography Global European European / US
Size ⚫ #5 globally by revenue1⚫ €87.5bn of AuM2
⚫ €17.1bn of AuM2
4
Key figures(average last
two financial
years)
€1,153m
63%€498m
27%
€173m
9%
€180m
53%€73m
22%
€84m
25%
Profit before taxRevenue
1 Last 12 months to 06/20201 2 As at 30/06/2021
Fa
cin
g P
ag
e5
F
A
C
I
N
G
P
A
G
E
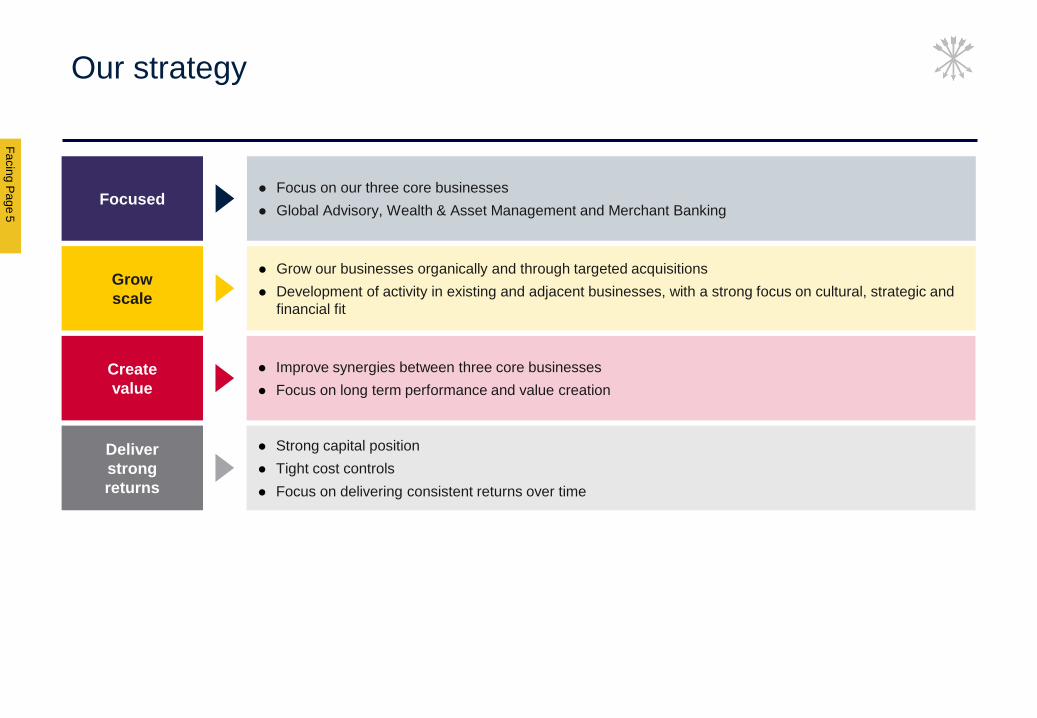
Grow
scale
⚫ Grow our businesses organically and through targeted acquisitions
⚫ Development of activity in existing and adjacent businesses, with a strong focus on cultural, strategic and
financial fit
Focused⚫ Focus on our three core businesses
⚫ Global Advisory, Wealth & Asset Management and Merchant Banking
Create
value
⚫ Improve synergies between three core businesses
⚫ Focus on long term performance and value creation
Deliver
strong
returns
⚫ Strong capital position
⚫ Tight cost controls
⚫ Focus on delivering consistent returns over time
Our strategy
Public
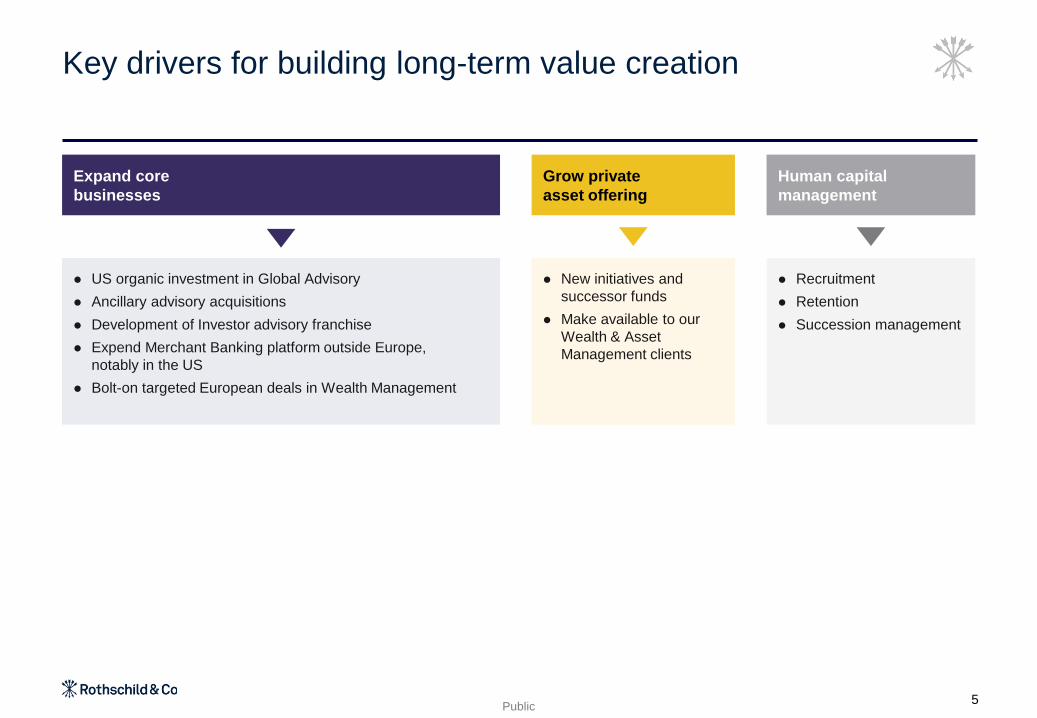
Key drivers for building long-term value creation
⚫ US organic investment in Global Advisory
⚫ Ancillary advisory acquisitions
⚫ Development of Investor advisory franchise
⚫ Expend Merchant Banking platform outside Europe,
notably in the US
⚫ Bolt-on targeted European deals in Wealth Management
Expand core
businesses
Grow private
asset offering
⚫ New initiatives and
successor funds
⚫ Make available to our
Wealth & Asset
Management clients
Human capital
management
⚫ Recruitment
⚫ Retention
⚫ Succession management
5
Fa
cin
g P
ag
e
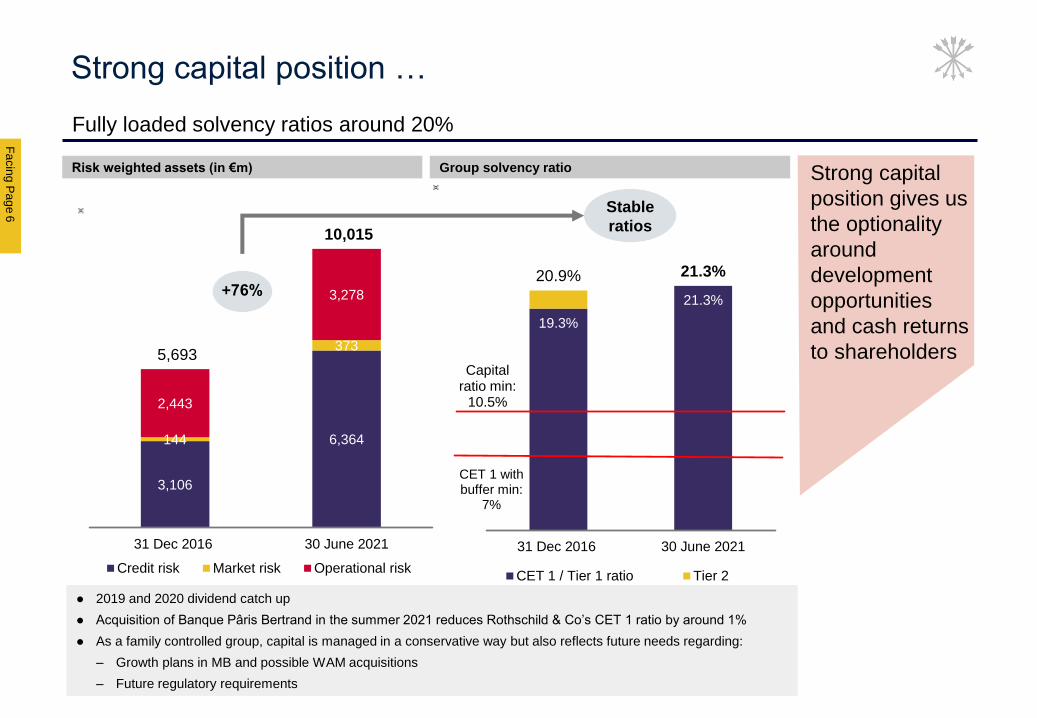
3,106
6,364144
373
2,443
3,278
5,693
10,015
31 Dec 2016 30 June 2021
Credit risk Market risk Operational risk
6
F
A
C
I
N
G
P
A
G
E
Strong capital position …
Fully loaded solvency ratios around 20%
Risk weighted assets (in €m) Group solvency ratio
+76%
Stable
ratios
Strong capital
position gives us
the optionality
around
development
opportunities
and cash returns
to shareholders
⚫ 2019 and 2020 dividend catch up
⚫ Acquisition of Banque Pâris Bertrand in the summer 2021 reduces Rothschild & Co’s CET 1 ratio by around 1%
⚫ As a family controlled group, capital is managed in a conservative way but also reflects future needs regarding:
– Growth plans in MB and possible WAM acquisitions
– Future regulatory requirements
19.3%
21.3%
20.9% 21.3%
31 Dec 2016 30 June 2021
CET 1 / Tier 1 ratio Tier 2
Capital ratio min:
10.5%
CET 1 with buffer min:
7%
Public
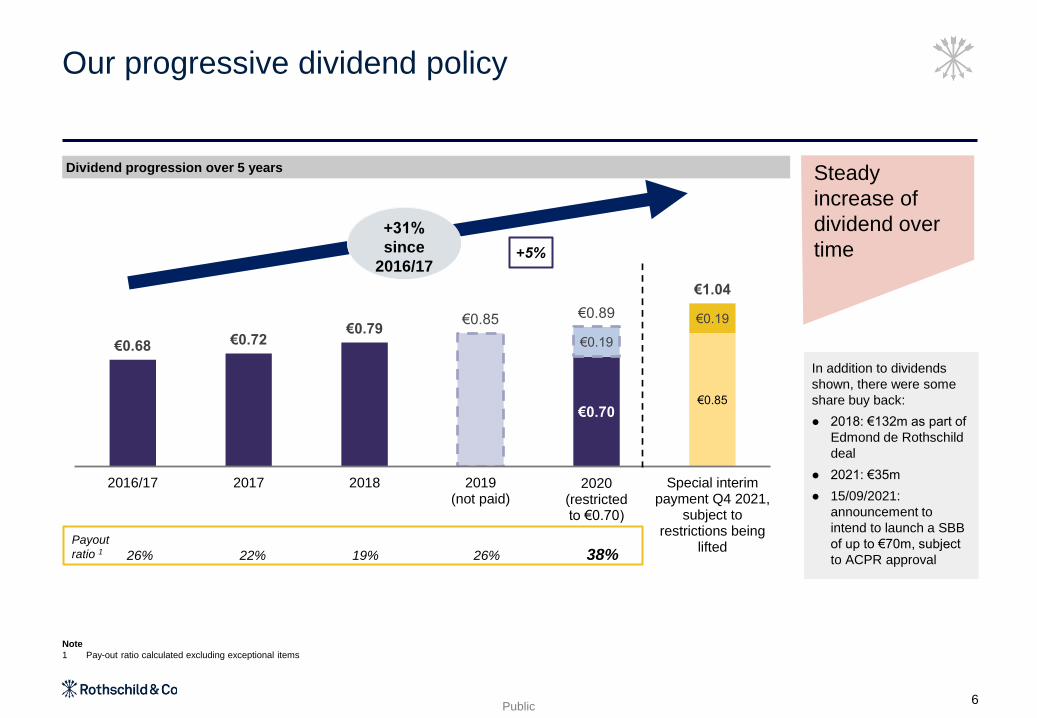
Our progressive dividend policy
Dividend progression over 5 years
+31%
since
2016/17
Steady
increase of
dividend over
time
6
€0.70€0.85
€0.19
€0.19
€0.68 €0.72€0.79
€0.85 €0.89
€1.04
2016/17 2017 2018 2019(not paid)
2020 (restricted to €0.70)
Special interimpayment Q4 2021,
subject torestrictions being
lifted
+ 5%
Payout
ratio 1 26% 22% 19% 26% 38%
Note
1 Pay-out ratio calculated excluding exceptional items
In addition to dividends
shown, there were some
share buy back:
⚫ 2018: €132m as part of
Edmond de Rothschild
deal
⚫ 2021: €35m
⚫ 15/09/2021:
announcement to
intend to launch a SBB
of up to €70m, subject
to ACPR approval
Public
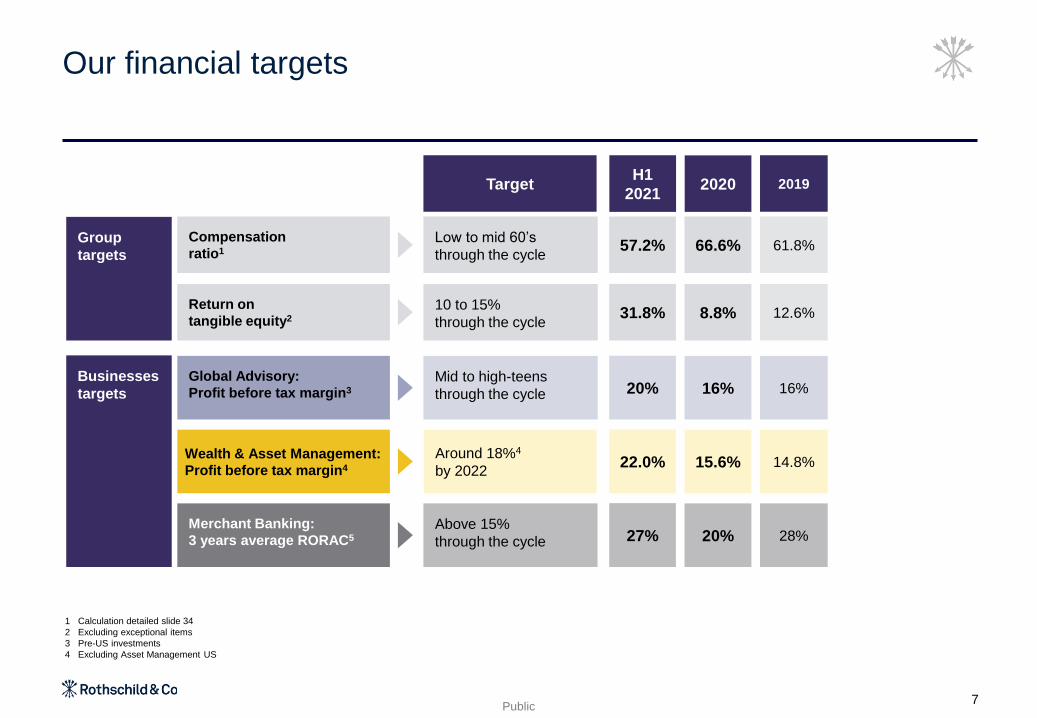
Our financial targets
1 Calculation detailed slide 34
2 Excluding exceptional items
3 Pre-US investments
4 Excluding Asset Management US
7
Group
targets
Businesses
targets
Target
Mid to high-teens
through the cycle
Around 18%4
by 2022
Above 15%
through the cycle
Global Advisory:
Profit before tax margin3
Wealth & Asset Management:
Profit before tax margin4
Merchant Banking:
3 years average RORAC5
2019
16%
14.8%
28%
2020
16%
15.6%
20%
Low to mid 60’s
through the cycle
Compensation
ratio1 61.8%66.6%
10 to 15%
through the cycle
Return on
tangible equity2 12.6%8.8%
H1
2021
20%
22.0%
27%
57.2%
31.8%

Business lines
2
Public
Global Advisory1
Wealth & Asset Management2
Merchant Banking3
9
Fa
cin
g P
ag
e1
1
F
A
C
I
N
G
P
A
G
E
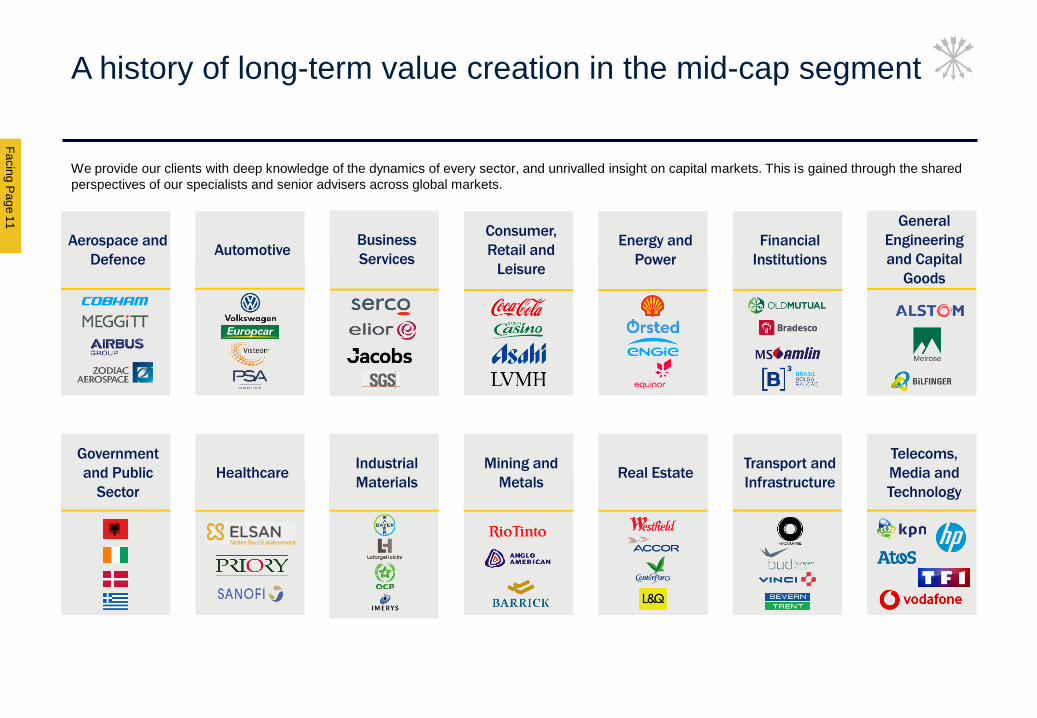
A history of long-term value creation in the mid-cap segment
We provide our clients with deep knowledge of the dynamics of every sector, and unrivalled insight on capital markets. This is gained through the shared
perspectives of our specialists and senior advisers across global markets.
Aerospace and
DefenceAutomotive
Business
Services
Consumer,
Retail and
Leisure
Energy and
Power
Financial
Institutions
General
Engineering
and Capital
Goods
Government
and Public
Sector
Transport and
Infrastructure
Telecoms,
Media and
Technology
HealthcareIndustrial
Materials
Mining and
MetalsReal Estate

Public
Introduction to Global Advisory
10
We field c.1,200 advisory bankers in
over 40 countries
- more than any other
advisory house
GlobalGeography
⚫ M&A and strategic advisory
⚫ Debt and restructuring
advisory
⚫ Equity advisory
⚫ Investor advisory
⚫ Rating advisory
⚫ Sovereign advisory
Offerings
⚫ c.1,200 bankers of which
c.250 MDs# Front
office
820in Europe
220in US and
Canada
100in Asia-
Pacific
30in Latin
America
30in Africa &
Middle East
Key
numbers
€1.45bn of revenue
LTM 06 2021
(63% of Group
revenue)
€264m of PBT
LTM 06 2021
(45% of Group
PBT)
#5 globally by
revenue
(LTM 06 2021)
#3 globally by
number of
completed
transactions
Fa
cin
g P
ag
e1
5
F
A
C
I
N
G
P
A
G
E
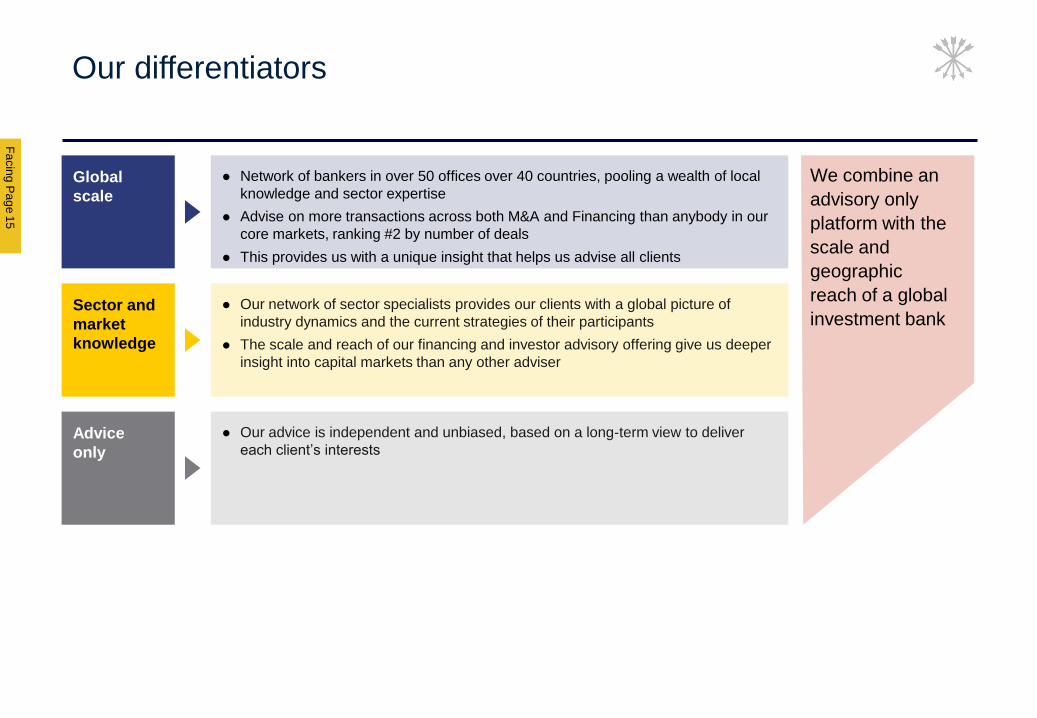
Global
scale
Advice
only
Sector and
market
knowledge
⚫ Network of bankers in over 50 offices over 40 countries, pooling a wealth of local
knowledge and sector expertise
⚫ Advise on more transactions across both M&A and Financing than anybody in our
core markets, ranking #2 by number of deals
⚫ This provides us with a unique insight that helps us advise all clients
⚫ Our advice is independent and unbiased, based on a long-term view to deliver
each client’s interests
⚫ Our network of sector specialists provides our clients with a global picture of
industry dynamics and the current strategies of their participants
⚫ The scale and reach of our financing and investor advisory offering give us deeper
insight into capital markets than any other adviser
We combine an
advisory only
platform with the
scale and
geographic
reach of a global
investment bank
Our differentiators
Public
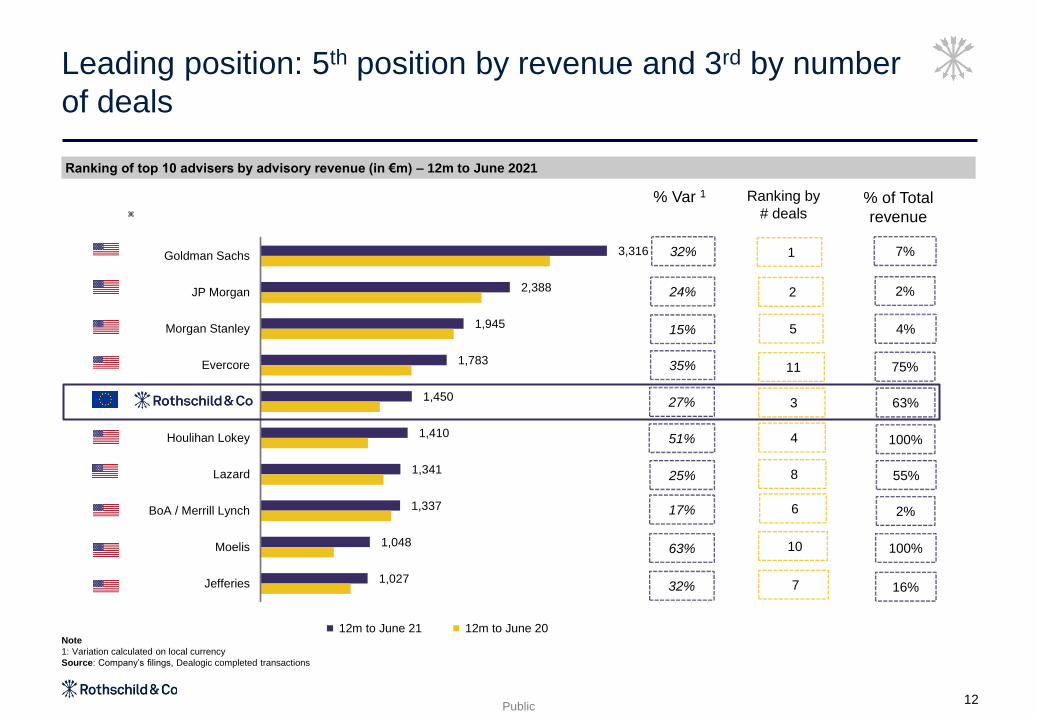
Leading position: 5th position by revenue and 3rd by number
of deals
12
3,316
2,388
1,945
1,783
1,450
1,410
1,341
1,337
1,048
1,027
Goldman Sachs
JP Morgan
Morgan Stanley
Evercore
Houlihan Lokey
Lazard
BoA / Merrill Lynch
Moelis
Jefferies
12m to June 21 12m to June 20
1 7%
10
6
8
4
3
11
5
2
7 16%
100%
2%
55%
100%
63%
75%
4%
2%
32%
24%
15%
35%
27%
51%
25%
17%
63%
32%
Ranking of top 10 advisers by advisory revenue (in €m) – 12m to June 2021
Ranking by
# deals% of Total
revenue
Note
1: Variation calculated on local currency
Source: Company’s filings, Dealogic completed transactions
% Var 1
Fa
cin
g P
ag
e1
3
F
A
C
I
N
G
P
A
G
E
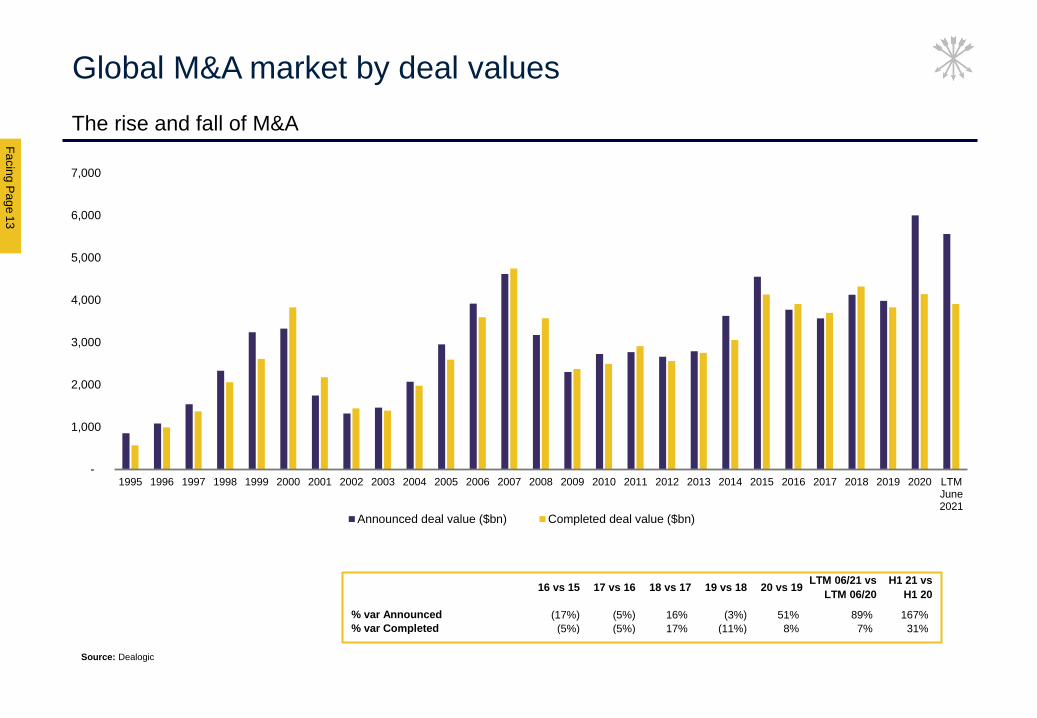
Global M&A market by deal values
The rise and fall of M&A
Source: Dealogic
-
1,000
2,000
3,000
4,000
5,000
6,000
7,000
1995 1996 1997 1998 1999 2000 2001 2002 2003 2004 2005 2006 2007 2008 2009 2010 2011 2012 2013 2014 2015 2016 2017 2018 2019 2020 LTMJune2021
Announced deal value ($bn) Completed deal value ($bn)
16 vs 15 17 vs 16 18 vs 17 19 vs 18 20 vs 19LTM 06/21 vs
LTM 06/20
H1 21 vs
H1 20
% var Announced (17%) (5%) 16% (3%) 51% 89% 167%
% var Completed (5%) (5%) 17% (11%) 8% 7% 31%
Public
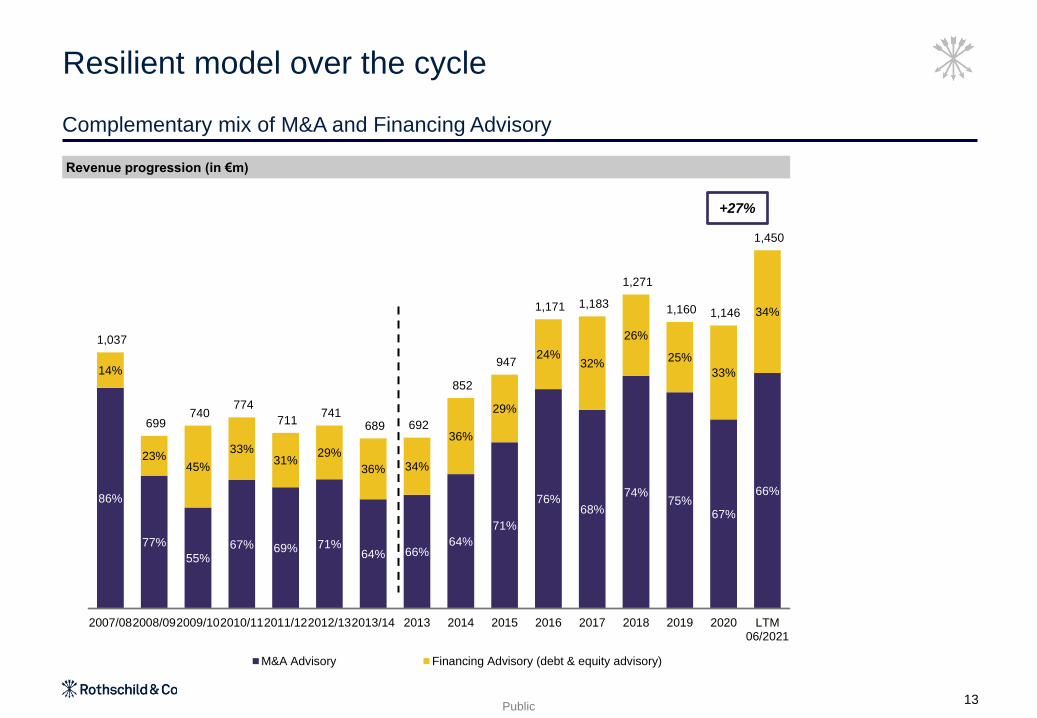
Resilient model over the cycle
Complementary mix of M&A and Financing Advisory
Revenue progression (in €m)
13
86%
77%
55%67% 69% 71%
64% 66%64%
71%
76%68%
74%75%
67%
66%
14%
23%45%
33%31%
29%
36% 34%
36%
29%
24%32%
26%
25%
33%
34%
1,037
699 740
774
711 741
689 692
852
947
1,171 1,183
1,271
1,160 1,146
1,450
2007/082008/092009/102010/112011/122012/132013/14 2013 2014 2015 2016 2017 2018 2019 2020 LTM06/2021
M&A Advisory Financing Advisory (debt & equity advisory)
+27%
Fa
cin
g P
ag
e1
9
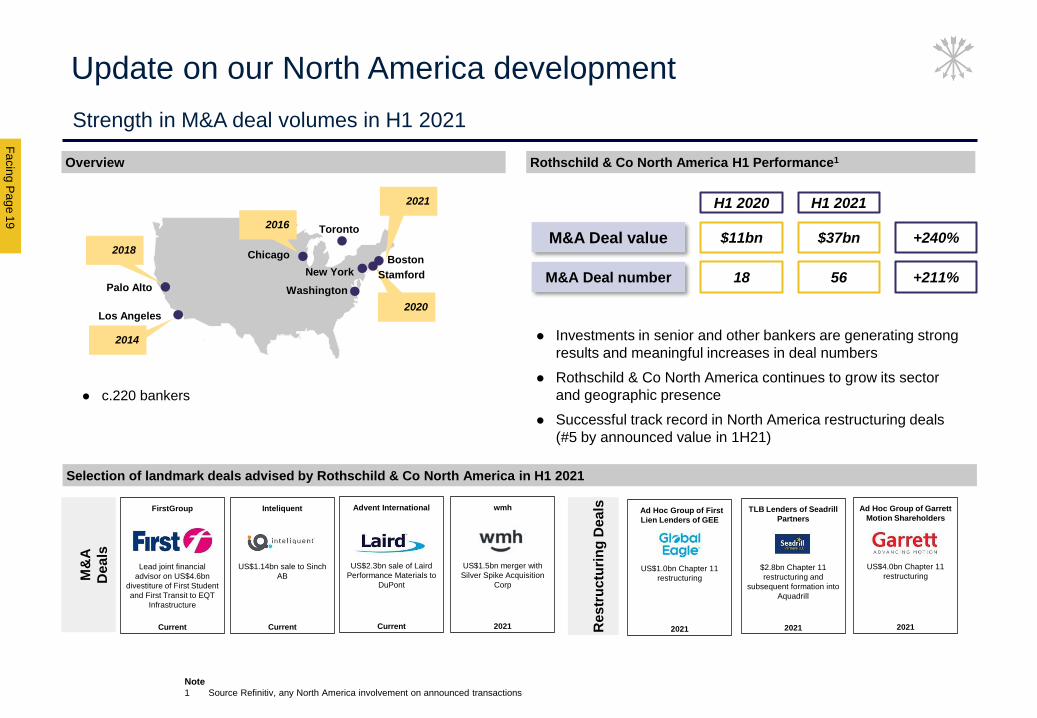
Strength in M&A deal volumes in H1 2021
F
A
C
I
N
G
P
A
G
E
Selection of landmark deals advised by Rothschild & Co North America in H1 2021
Rothschild & Co North America H1 Performance1Overview
M&
A
De
als
Re
str
uc
turi
ng
De
als
⚫ Investments in senior and other bankers are generating strong
results and meaningful increases in deal numbers
⚫ Rothschild & Co North America continues to grow its sector
and geographic presence
⚫ Successful track record in North America restructuring deals
(#5 by announced value in 1H21)
+240%
+211%
M&A Deal value
M&A Deal number
$11bn $37bn
H1 2021H1 2020
18 56
Ad Hoc Group of First
Lien Lenders of GEE
US$1.0bn Chapter 11
restructuring
2021
TLB Lenders of Seadrill
Partners
$2.8bn Chapter 11
restructuring and
subsequent formation into
Aquadrill
2021
Ad Hoc Group of Garrett
Motion Shareholders
US$4.0bn Chapter 11
restructuring
2021
FirstGroup
Lead joint financial
advisor on US$4.6bn
divestiture of First Student
and First Transit to EQT
Infrastructure
Current
Inteliquent
US$1.14bn sale to Sinch
AB
Current
Advent International
US$2.3bn sale of Laird
Performance Materials to
DuPont
Current
wmh
US$1.5bn merger with
Silver Spike Acquisition
Corp
2021
2020
Chicago
New York
WashingtonPalo Alto
Los Angeles
Stamford
Boston
2021
Toronto
⚫ c.220 bankers
2018
2014
2016
Note
1 Source Refinitiv, any North America involvement on announced transactions
Update on our North America development
Public
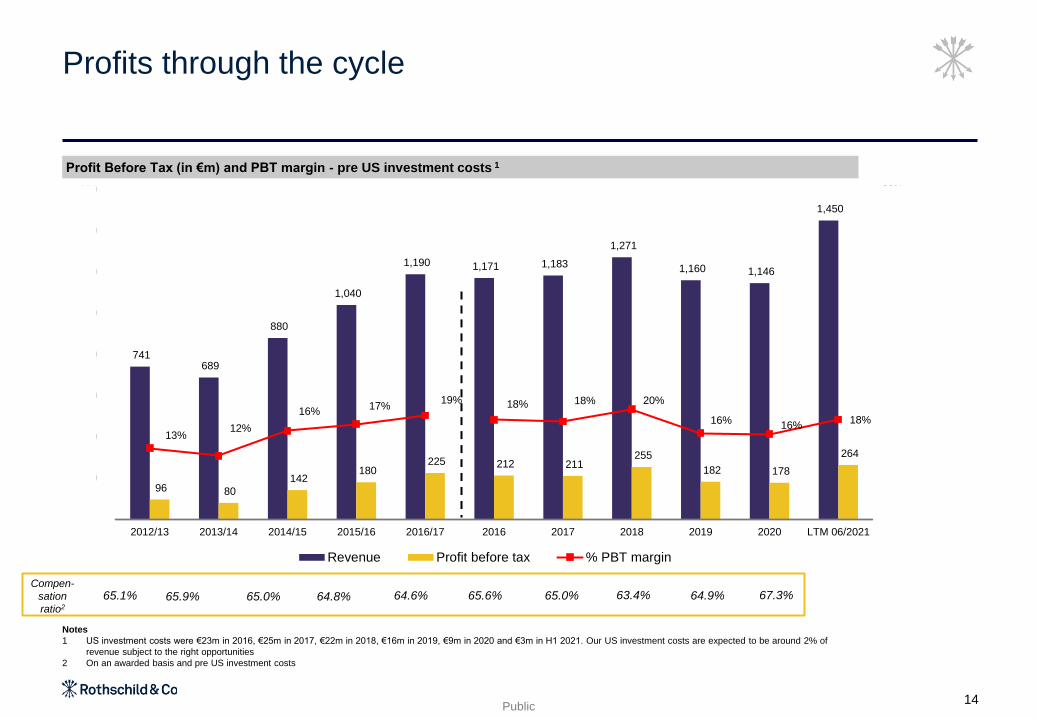
741 689
880
1,040
1,190 1,171 1,183
1,271
1,160 1,146
1,450
96 80
142 180
225 212 211 255
182 178
264
13%12%
16%17%
19% 18% 18% 20%
16% 16%18%
-
10%
20%
30%
40%
50%
60%
-
200
400
600
800
1,000
1,200
1,400
1,600
2012/13 2013/14 2014/15 2015/16 2016/17 2016 2017 2018 2019 2020 LTM 06/2021
Revenue Profit before tax % PBT margin
Profits through the cycle
Profit Before Tax (in €m) and PBT margin - pre US investment costs 1
Notes
1 US investment costs were €23m in 2016, €25m in 2017, €22m in 2018, €16m in 2019, €9m in 2020 and €3m in H1 2021. Our US investment costs are expected to be around 2% of
revenue subject to the right opportunities
2 On an awarded basis and pre US investment costs
Compen-
sation
ratio2
14
65.1% 65.9% 65.0% 64.8% 64.6% 65.6% 65.0% 63.4% 64.9% 67.3%
Fa
cin
g P
ag
e1
5
F
A
C
I
N
G
P
A
G
E
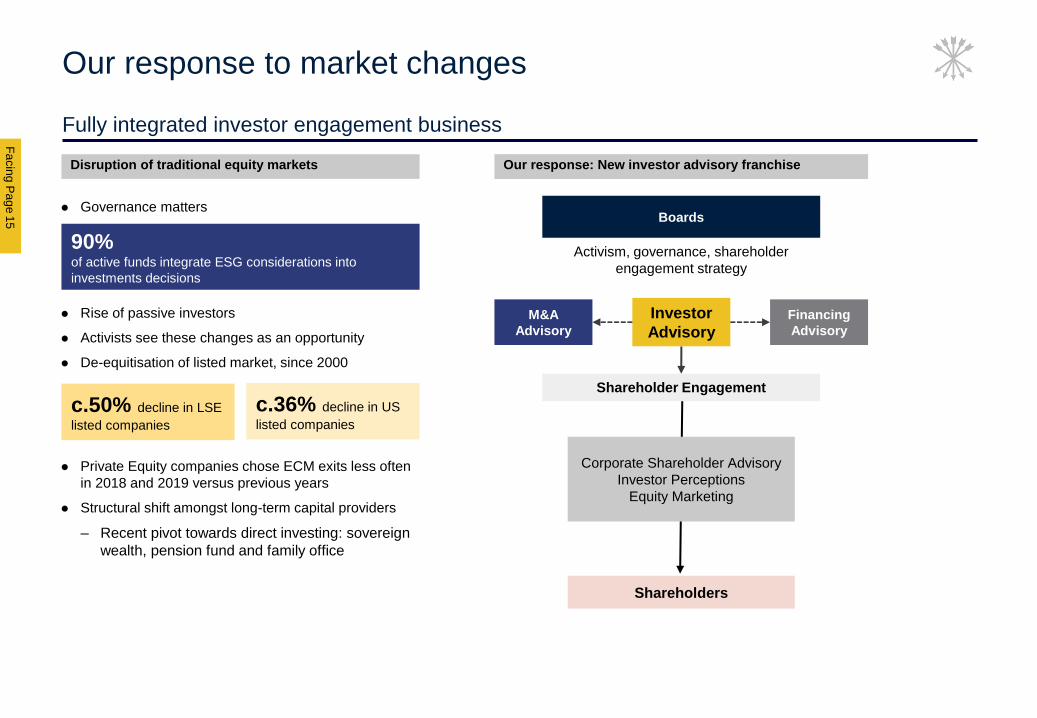
Activism, governance, shareholder
engagement strategy
Our response to market changes
Fully integrated investor engagement business
Shareholders
Boards
Corporate Shareholder Advisory
Investor Perceptions
Equity Marketing
Investor
AdvisoryM&A
Advisory
Financing
Advisory
⚫ Governance matters
⚫ Rise of passive investors
⚫ Activists see these changes as an opportunity
⚫ De-equitisation of listed market, since 2000
⚫ Private Equity companies chose ECM exits less often
in 2018 and 2019 versus previous years
⚫ Structural shift amongst long-term capital providers
– Recent pivot towards direct investing: sovereign
wealth, pension fund and family office
Shareholder Engagement
Disruption of traditional equity markets Our response: New investor advisory franchise
c.50% decline in LSE
listed companies
c.36% decline in US
listed companies
90%of active funds integrate ESG considerations into
investments decisions
Public
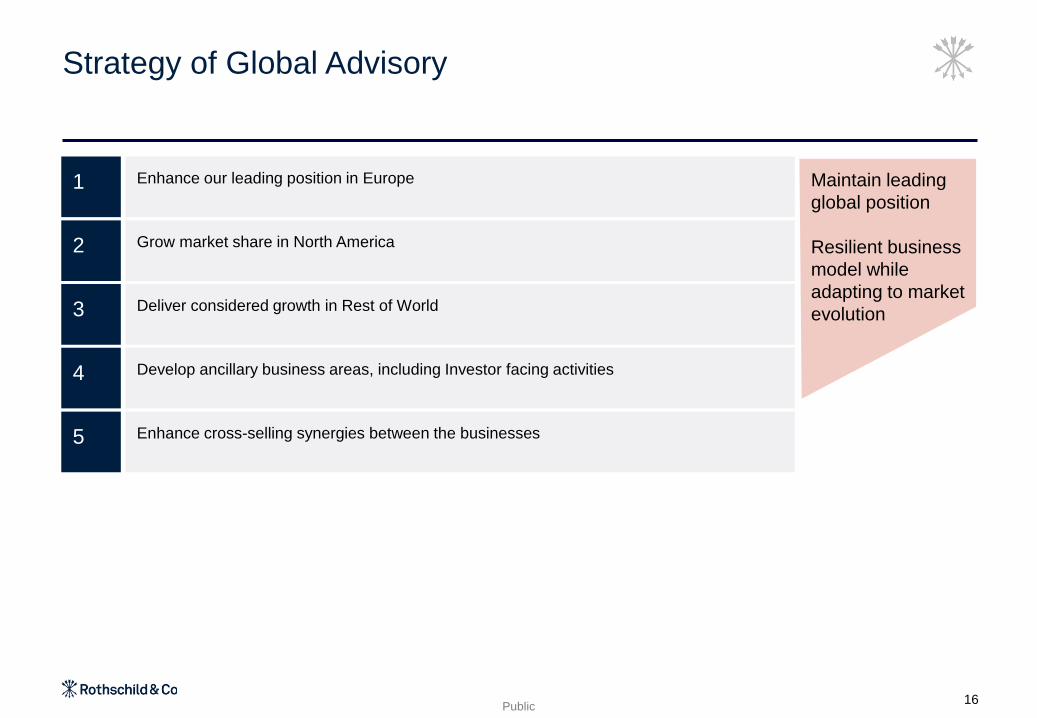
Strategy of Global Advisory
Maintain leading
global position
Resilient business
model while
adapting to market
evolution
Enhance our leading position in Europe1
Grow market share in North America2
Deliver considered growth in Rest of World3
Develop ancillary business areas, including Investor facing activities4
Enhance cross-selling synergies between the businesses5
16
Public
Global Advisory1
Wealth & Asset Management2
Merchant Banking3
17
Fa
cin
g P
ag
e1
8
F
A
C
I
N
G
P
A
G
E
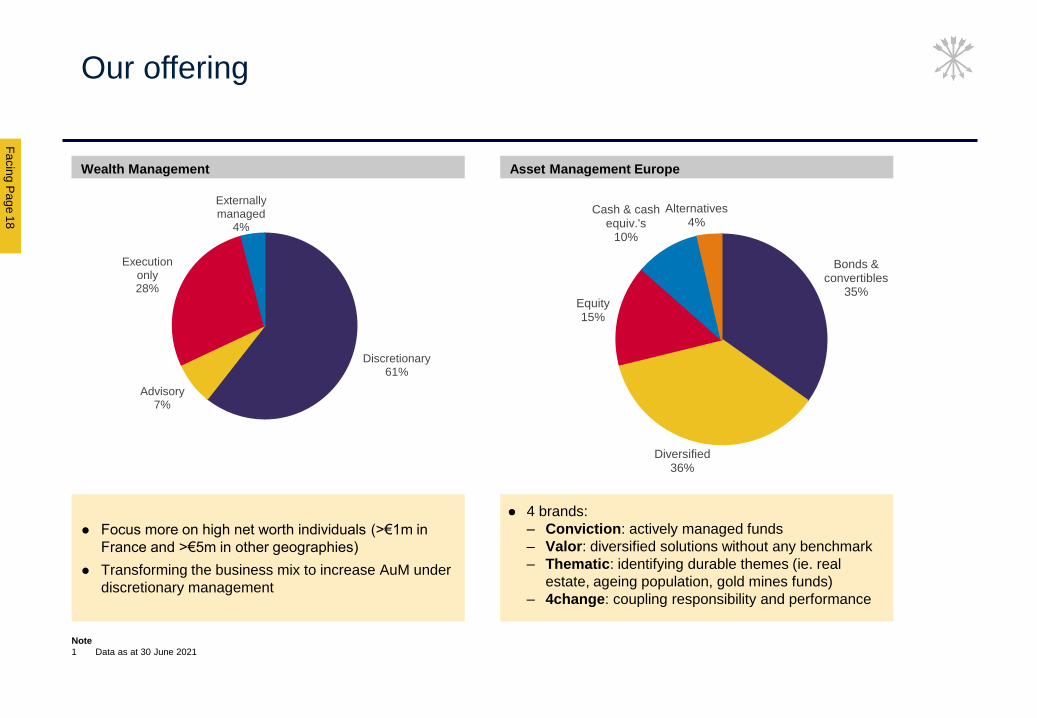
Our offering
Wealth Management Asset Management Europe
⚫ Focus more on high net worth individuals (>€1m in
France and >€5m in other geographies)
⚫ Transforming the business mix to increase AuM under
discretionary management
Note
1 Data as at 30 June 2021
⚫ 4 brands:
– Conviction: actively managed funds
– Valor: diversified solutions without any benchmark
– Thematic: identifying durable themes (ie. real
estate, ageing population, gold mines funds)
– 4change: coupling responsibility and performance
Discretionary61%
Advisory7%
Execution only28%
Externally managed
4%
Chart Title
Bonds & convertibles
35%
Diversified36%
Equity15%
Cash & cash equiv.'s
10%
Alternatives4%
Chart Title
Public
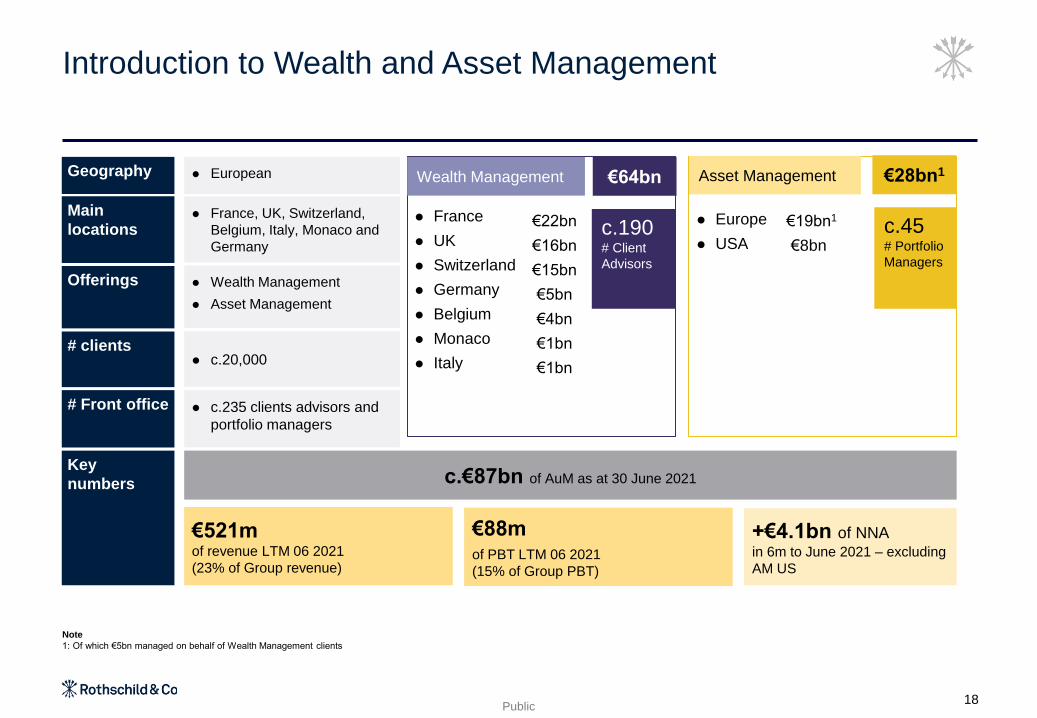
Introduction to Wealth and Asset Management
⚫ EuropeanGeography
⚫ Wealth Management
⚫ Asset Management
Offerings
⚫ c.235 clients advisors and
portfolio managers
# Front office
⚫ France, UK, Switzerland,
Belgium, Italy, Monaco and
Germany
Main
locations
⚫ c.20,000# clients
Note
1: Of which €5bn managed on behalf of Wealth Management clients
€64bnWealth Management
⚫ France
⚫ UK
⚫ Switzerland
⚫ Germany
⚫ Belgium
⚫ Monaco
⚫ Italy
c.190# Client
Advisors
€22bn
€16bn
€15bn
€5bn
€4bn
€1bn
€1bn
Asset Management €28bn1
c.45# Portfolio
Managers
⚫ Europe
⚫ USA
€19bn1
€8bn
Key
numbers c.€87bn of AuM as at 30 June 2021
€521m of revenue LTM 06 2021
(23% of Group revenue)
€88m of PBT LTM 06 2021
(15% of Group PBT)
+€4.1bn of NNA in 6m to June 2021 – excluding
AM US
18
Public
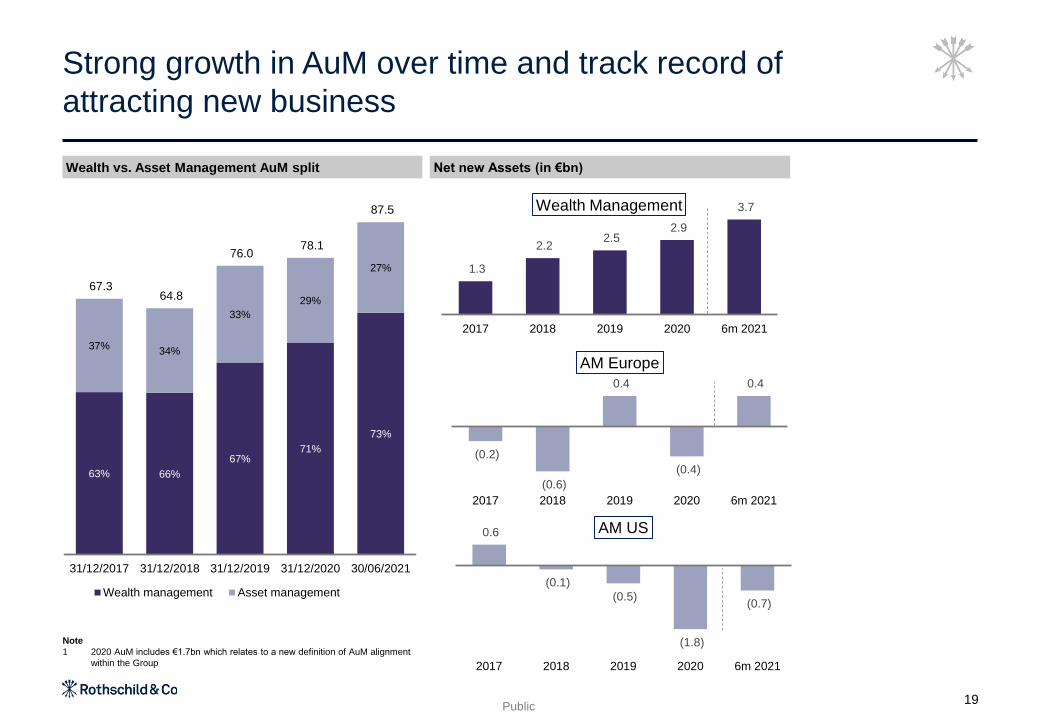
Strong growth in AuM over time and track record of
attracting new business
Wealth vs. Asset Management AuM split Net new Assets (in €bn)
19
Note
1 2020 AuM includes €1.7bn which relates to a new definition of AuM alignment
within the Group
63% 66%
67%71%
73%
37%34%
33%
29%
27%
67.3 64.8
76.0 78.1
87.5
31/12/2017 31/12/2018 31/12/2019 31/12/2020 30/06/2021
Wealth management Asset management
1.3
2.2 2.5
2.9
3.7
2017 2018 2019 2020 6m 2021
Wealth Management
(0.2)
(0.6)
0.4
(0.4)
0.4
2017 2018 2019 2020 6m 2021
AM Europe
0.6
(0.1)
(0.5)
(1.8)
(0.7)
2017 2018 2019 2020 6m 2021
AM US
Fa
cin
g P
ag
e
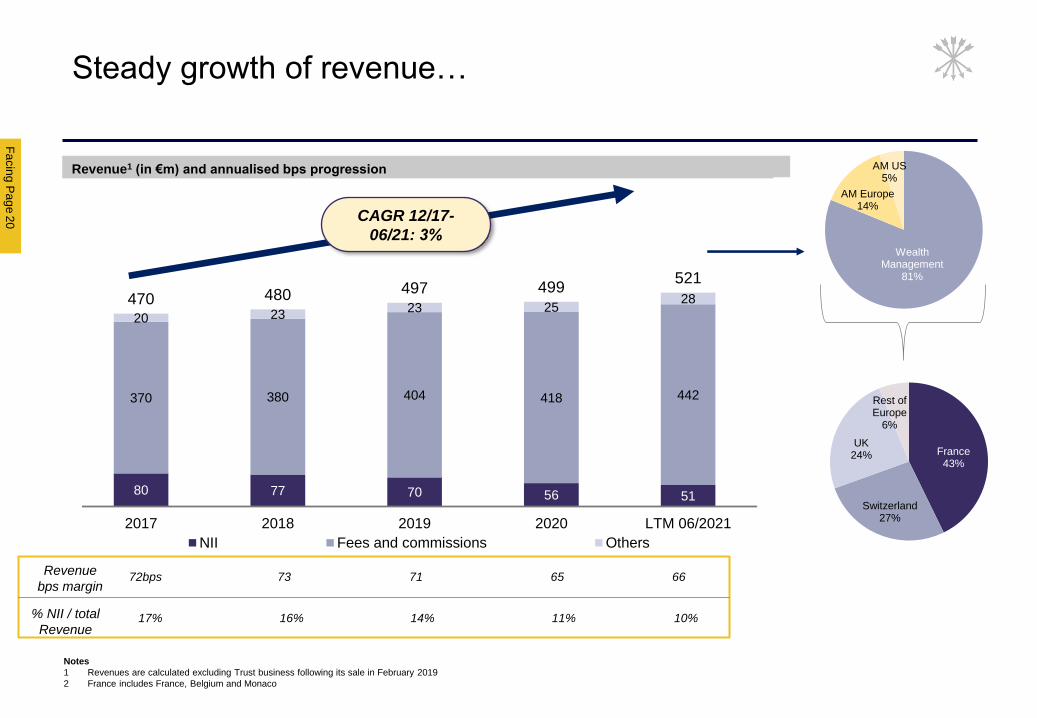
80 77 70 56 51
370 380 404 418 442
20 2323 25
28470 480 497 499521
2017 2018 2019 2020 LTM 06/2021
NII Fees and commissions Others
20
F
A
C
I
N
G
P
A
G
E
F
A
C
I
N
G
P
A
G
E
Steady growth of revenue…
Revenue1 (in €m) and annualised bps progression
Notes
1 Revenues are calculated excluding Trust business following its sale in February 2019
2 France includes France, Belgium and Monaco
Revenue
bps margin72bps 73 71 65 66
% NII / total
Revenue17% 16% 14% 11% 10%
CAGR 12/17-
06/21: 3%Wealth
Management81%
AM Europe14%
AM US5%
France43%
Switzerland27%
UK24%
Rest of Europe
6%
Public
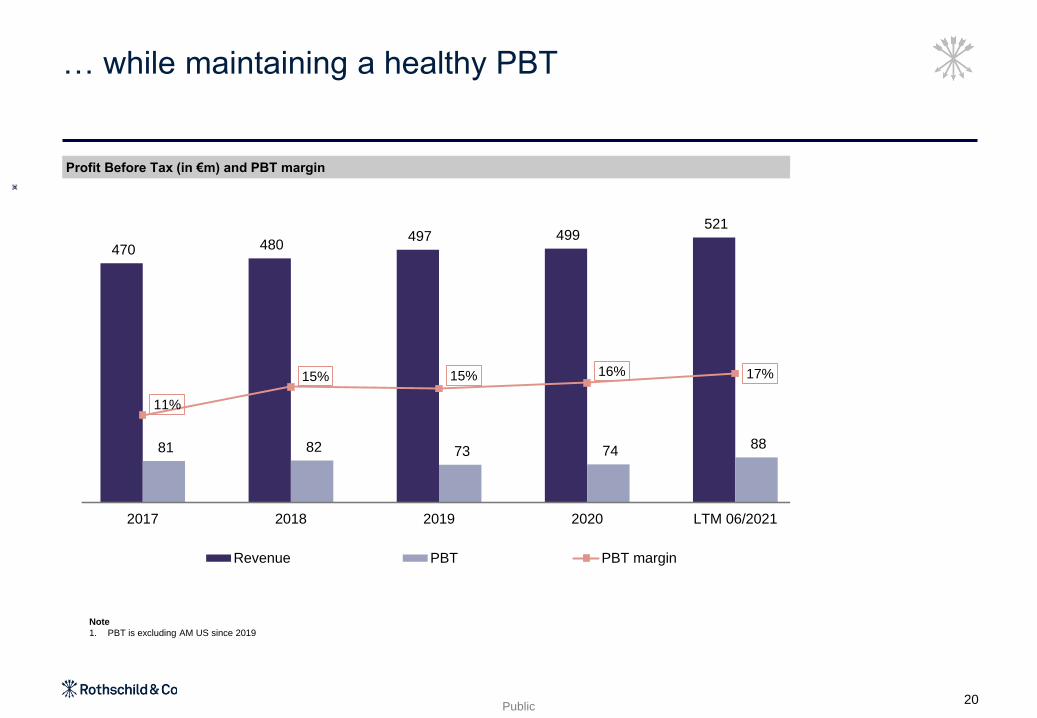
470 480 497 499
521
81 82 73 74 88
11%
15% 15% 16% 17%
-
5%
10%
15%
20%
25%
30%
35%
40%
-
100
200
300
400
500
600
2017 2018 2019 2020 LTM 06/2021
Revenue PBT PBT margin
… while maintaining a healthy PBT
Profit Before Tax (in €m) and PBT margin
20
Note
1. PBT is excluding AM US since 2019
Fa
cin
g P
ag
e2
9
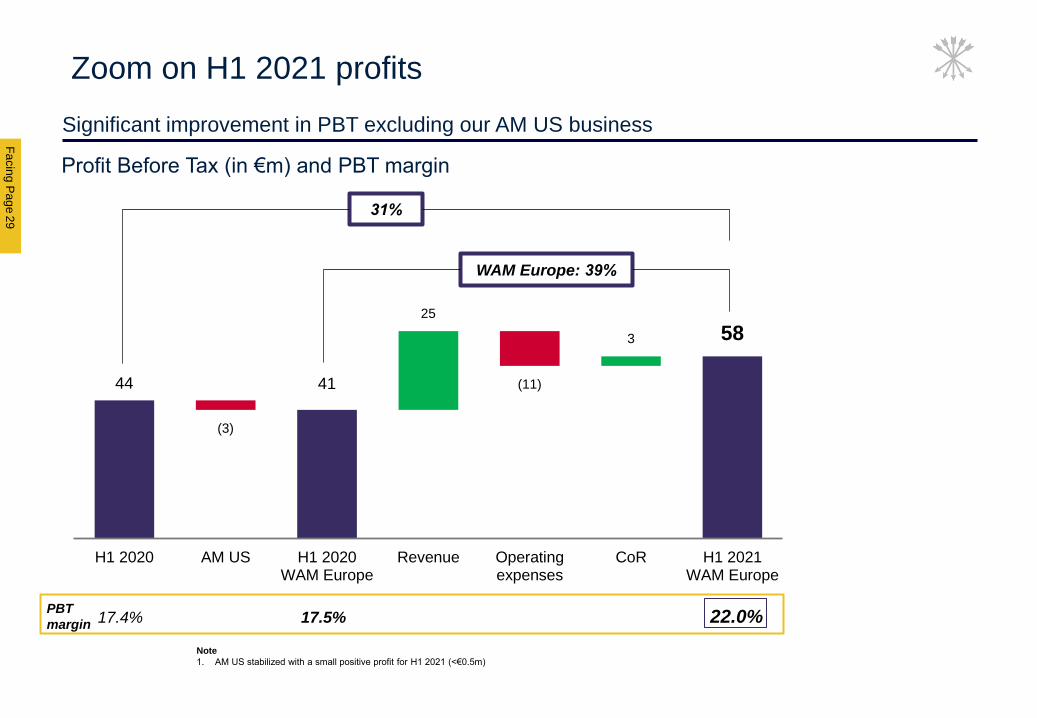
Significant improvement in PBT excluding our AM US business
F
A
C
I
N
G
P
A
G
E
Profit Before Tax (in €m) and PBT margin
44 41
58
25
3
(3)
(11)
H1 2020 AM US H1 2020WAM Europe
Revenue Operatingexpenses
CoR H1 2021WAM Europe
PBT
margin 17.4% 17.5% 22.0%
WAM Europe: 39%
31%
Note
1. AM US stabilized with a small positive profit for H1 2021 (<€0.5m)
Zoom on H1 2021 profits
Public
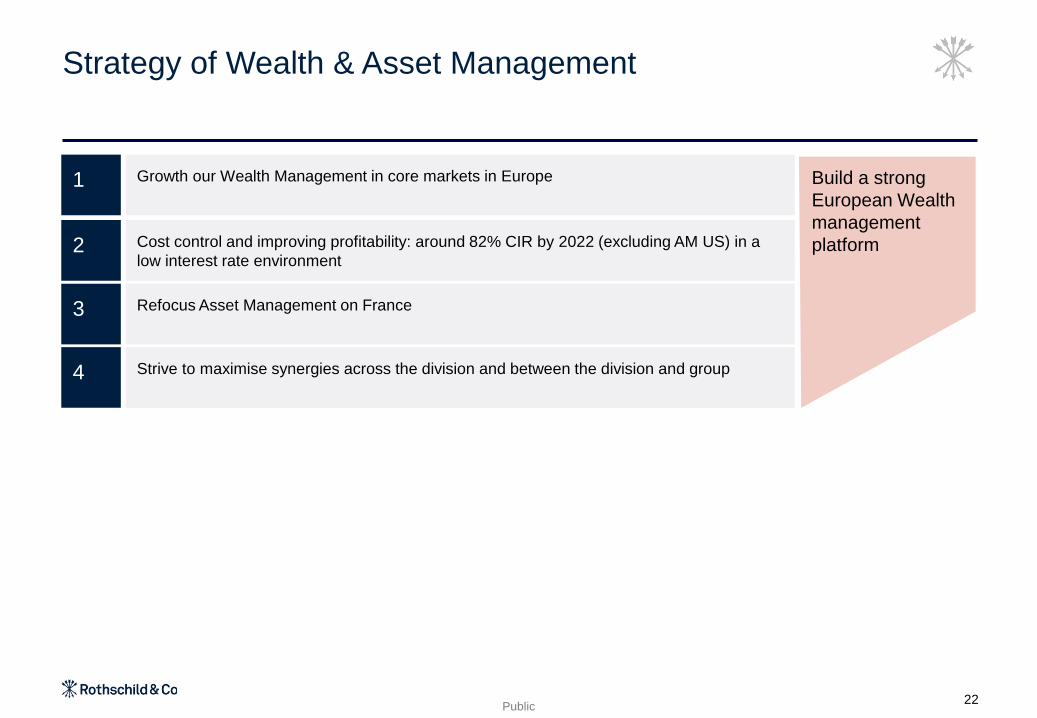
Build a strong
European Wealth
management
platform
Strategy of Wealth & Asset Management
Growth our Wealth Management in core markets in Europe1
Cost control and improving profitability: around 82% CIR by 2022 (excluding AM US) in a
low interest rate environment2
Refocus Asset Management on France3
Strive to maximise synergies across the division and between the division and group4
22

Public
Global Advisory1
Wealth & Asset Management2
Merchant Banking3
23
Fa
cin
g P
ag
e2
4
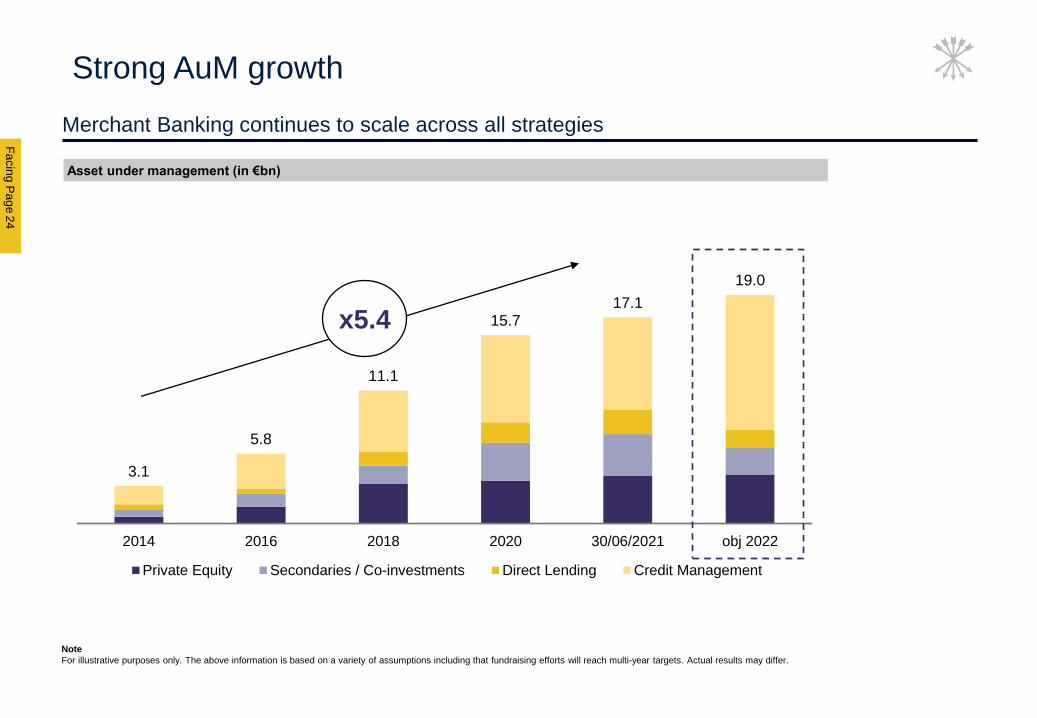
Merchant Banking continues to scale across all strategies
F
A
C
I
N
G
P
A
G
E
3.1
5.8
11.1
15.717.1
19.0
2014 2016 2018 2020 30/06/2021 obj 2022
Private Equity Secondaries / Co-investments Direct Lending Credit Management
Asset under management (in €bn)
Strong AuM growth
x5.4
Note
For illustrative purposes only. The above information is based on a variety of assumptions including that fundraising efforts will reach multi-year targets. Actual results may differ.
Public
Offerings
Geography
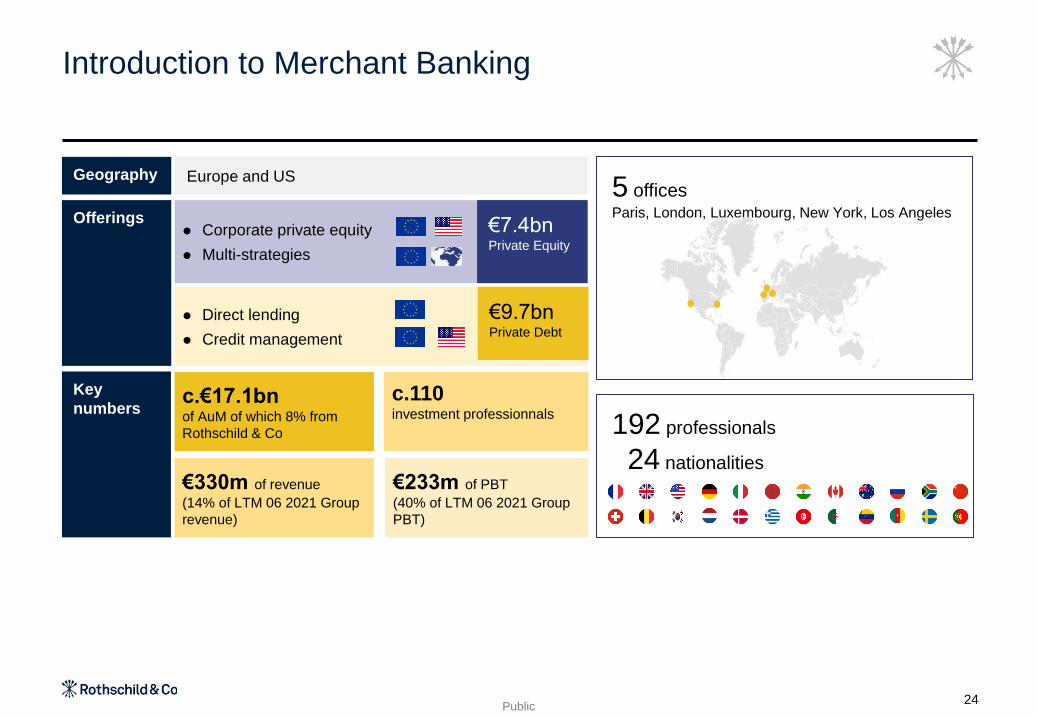
Introduction to Merchant Banking
Key
numbersc.110 investment professionnals
c.€17.1bn of AuM of which 8% from
Rothschild & Co
€330m of revenue
(14% of LTM 06 2021 Group
revenue)
€233m of PBT
(40% of LTM 06 2021 Group
PBT)
Europe and US
⚫ Direct lending
⚫ Credit management
€9.7bnPrivate Debt
⚫ Corporate private equity
⚫ Multi-strategies
€7.4bn Private Equity
5 officesParis, London, Luxembourg, New York, Los Angeles
192 professionals
24 nationalities
24
Fa
cin
g P
ag
e2
5
F
A
C
I
N
G
P
A
G
E
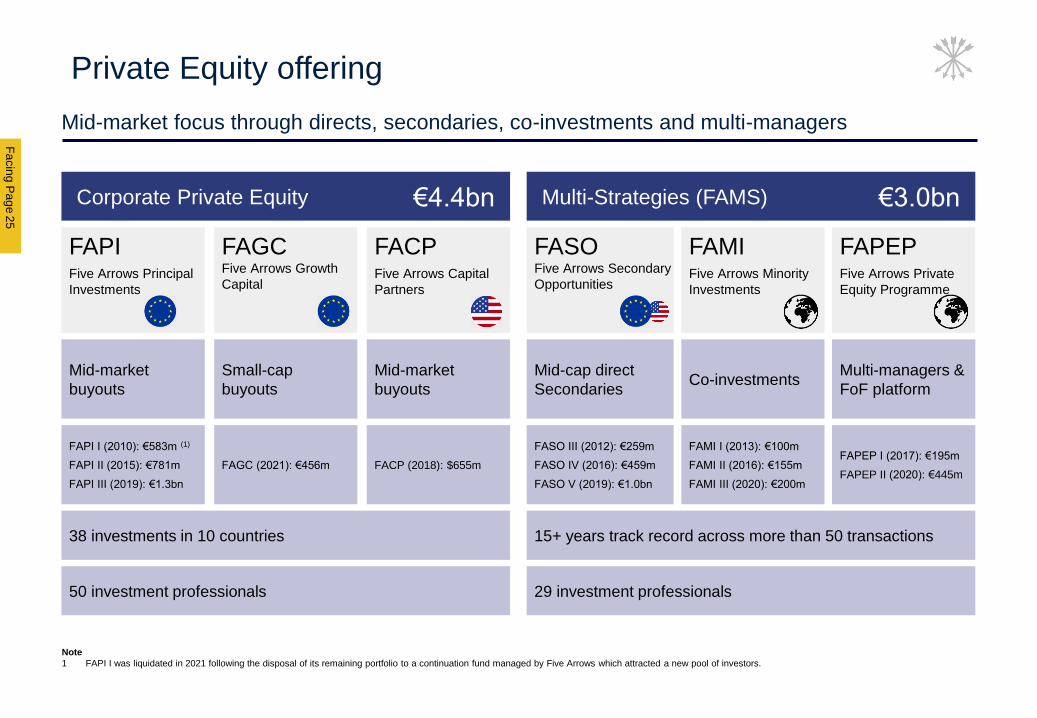
Mid-market focus through directs, secondaries, co-investments and multi-managers
Private Equity offering
Multi-Strategies (FAMS)Corporate Private Equity
Mid-market
buyouts
Mid-cap direct
SecondariesCo-investments
Multi-managers &
FoF platform
Mid-market
buyouts
FACPFive Arrows Capital
Partners
FAPIFive Arrows Principal
Investments
FASOFive Arrows Secondary
Opportunities
FAPEPFive Arrows Private
Equity Programme
FAMIFive Arrows Minority
Investments
Small-cap
buyouts
FAGCFive Arrows Growth
Capital
FAPI I (2010): €583m (1)
FAPI II (2015): €781m
FAPI III (2019): €1.3bn
FASO III (2012): €259m
FASO IV (2016): €459m
FASO V (2019): €1.0bn
FAPEP I (2017): €195m
FAPEP II (2020): €445m
FAMI I (2013): €100m
FAMI II (2016): €155m
FAMI III (2020): €200m
FACP (2018): $655mFAGC (2021): €456m
15+ years track record across more than 50 transactions
29 investment professionals50 investment professionals
38 investments in 10 countries
€4.4bn €3.0bn
Note
1 FAPI I was liquidated in 2021 following the disposal of its remaining portfolio to a continuation fund managed by Five Arrows which attracted a new pool of investors.
Public
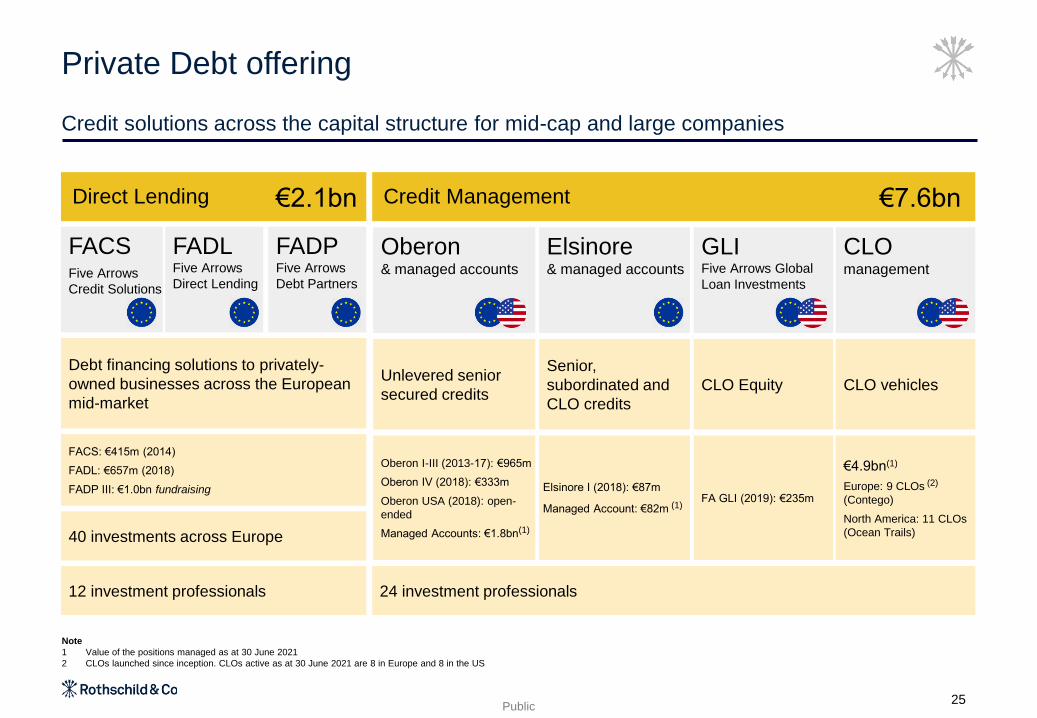
Credit solutions across the capital structure for mid-cap and large companies
Private Debt offering
25
Direct Lending Credit Management
Debt financing solutions to privately-
owned businesses across the European
mid-market
Unlevered senior
secured credits
Senior,
subordinated and
CLO credits
CLO Equity CLO vehicles
FACS: €415m (2014)
FADL: €657m (2018)
FADP III: €1.0bn fundraising
Oberon I-III (2013-17): €965m
Oberon IV (2018): €333m
Oberon USA (2018): open-
ended
Managed Accounts: €1.8bn(1)
Elsinore I (2018): €87m
Managed Account: €82m (1)FA GLI (2019): €235m
€4.9bn(1)
Europe: 9 CLOs (2)
(Contego)
North America: 11 CLOs
(Ocean Trails)
24 investment professionals12 investment professionals
40 investments across Europe
FACSFive Arrows
Credit Solutions
€2.1bn €7.6bn
FADLFive Arrows
Direct Lending
FADPFive Arrows
Debt Partners
CLO management
Oberon& managed accounts
GLIFive Arrows Global
Loan Investments
Elsinore& managed accounts
Note
1 Value of the positions managed as at 30 June 2021
2 CLOs launched since inception. CLOs active as at 30 June 2021 are 8 in Europe and 8 in the US
Fa
cin
g P
ag
e2
6
F
A
C
I
N
G
P
A
G
E
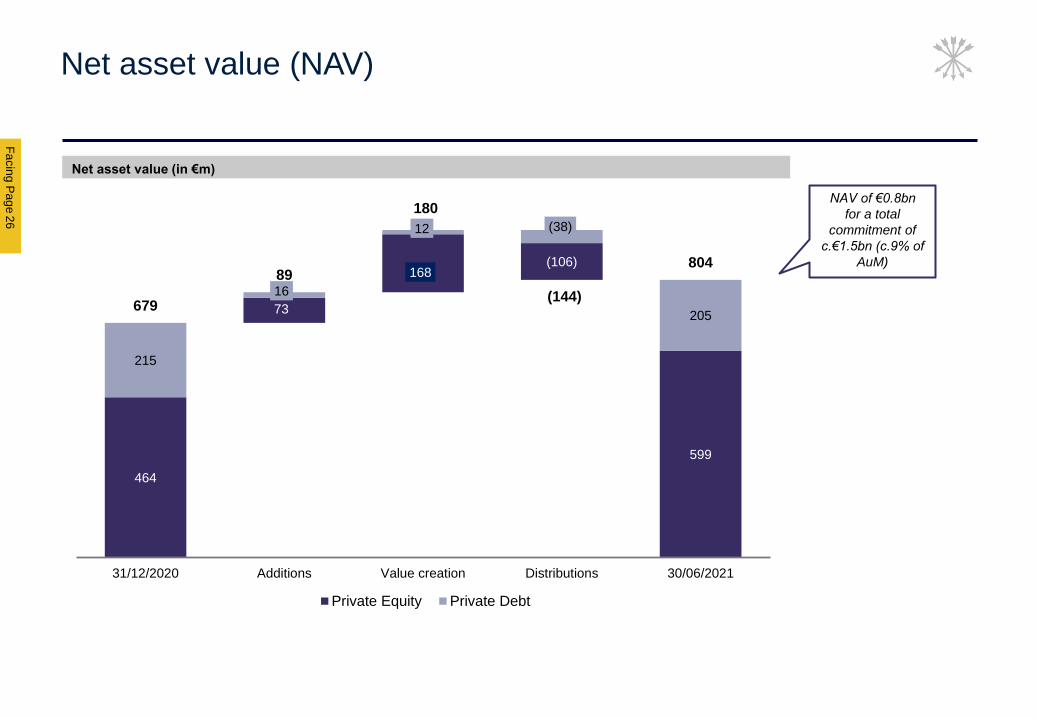
Net asset value (NAV)
Net asset value (in €m)
NAV of €0.8bn
for a total
commitment of
c.€1.5bn (c.9% of
AuM)
464
73
168 (106)
599
215
16
12 (38)
205 679
89
180
(144)
804
31/12/2020 Additions Value creation Distributions 30/06/2021
Private Equity Private Debt
Public
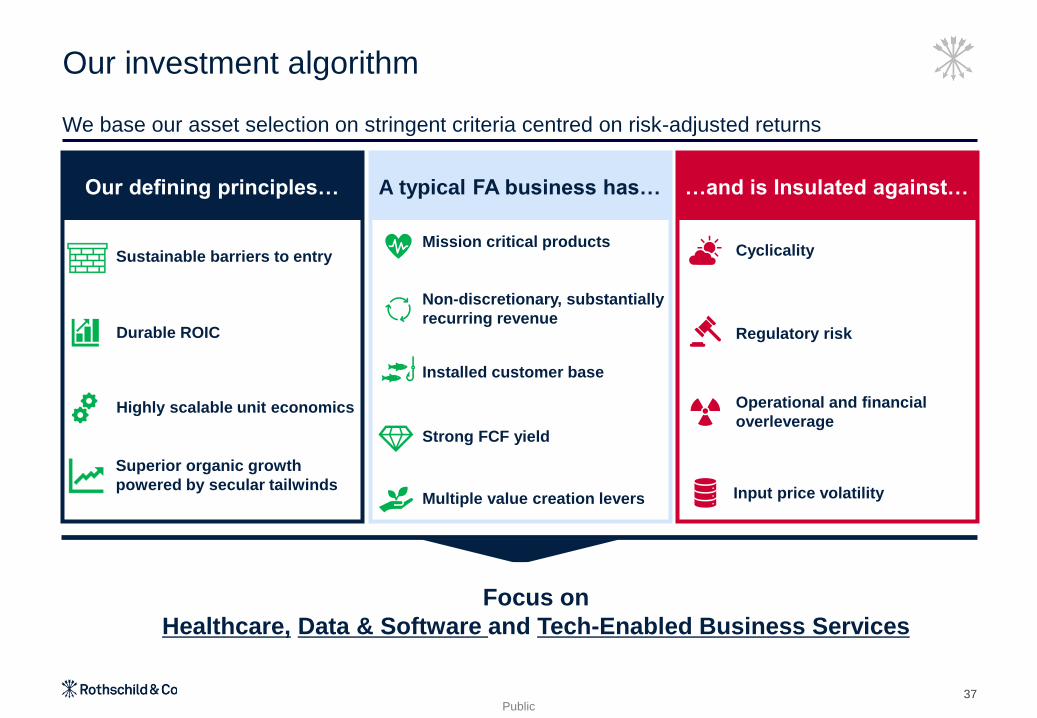
Our investment algorithm
37
We base our asset selection on stringent criteria centred on risk-adjusted returns
Our defining principles… A typical FA business has… …and is Insulated against…
Focus on
Healthcare, Data & Software and Tech-Enabled Business Services
Durable ROIC
Sustainable barriers to entry
Strong FCF yield
Superior organic growth
powered by secular tailwindsMultiple value creation levers
Mission critical products
Non-discretionary, substantially
recurring revenue
Installed customer base
Highly scalable unit economics
Cyclicality
Regulatory risk
Operational and financial
overleverage
Input price volatility
Fa
cin
g P
ag
e
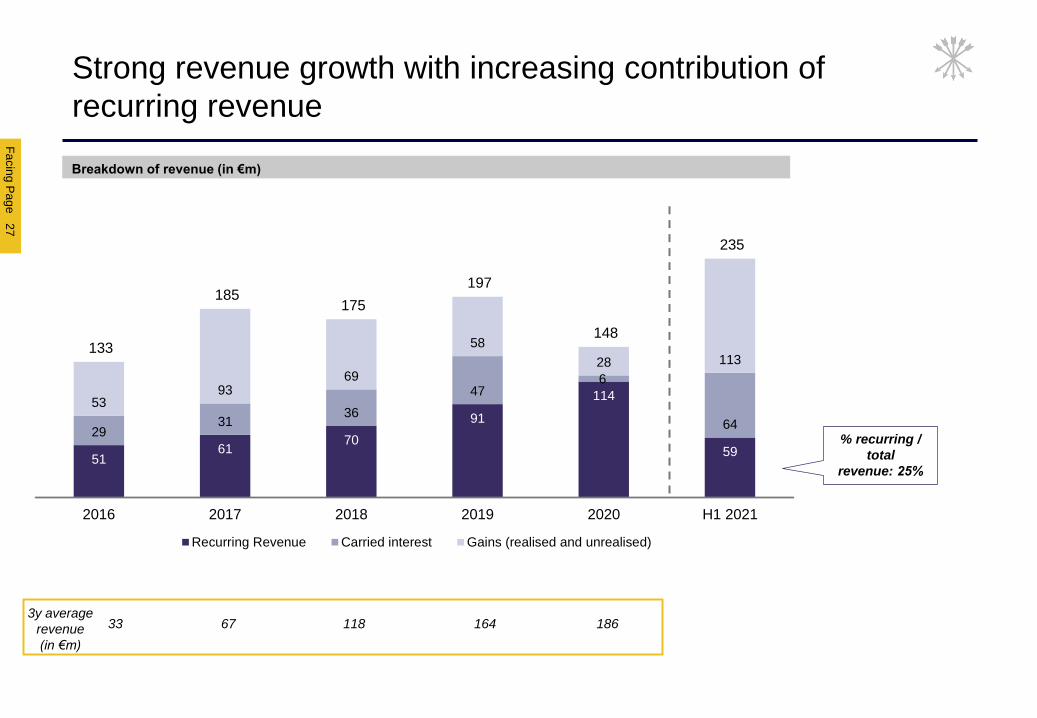
5161
70
91
114
59
2931
36
476
64
5393
69
58
28 113133
185 175
197
148
235
2016 2017 2018 2019 2020 H1 2021
Recurring Revenue Carried interest Gains (realised and unrealised)
F
A
C
I
N
G
P
A
G
E
Strong revenue growth with increasing contribution of
recurring revenue
Breakdown of revenue (in €m)
27
3y average
revenue
(in €m)
33 67 118 164 186
% recurring /
total
revenue: 25%
Public
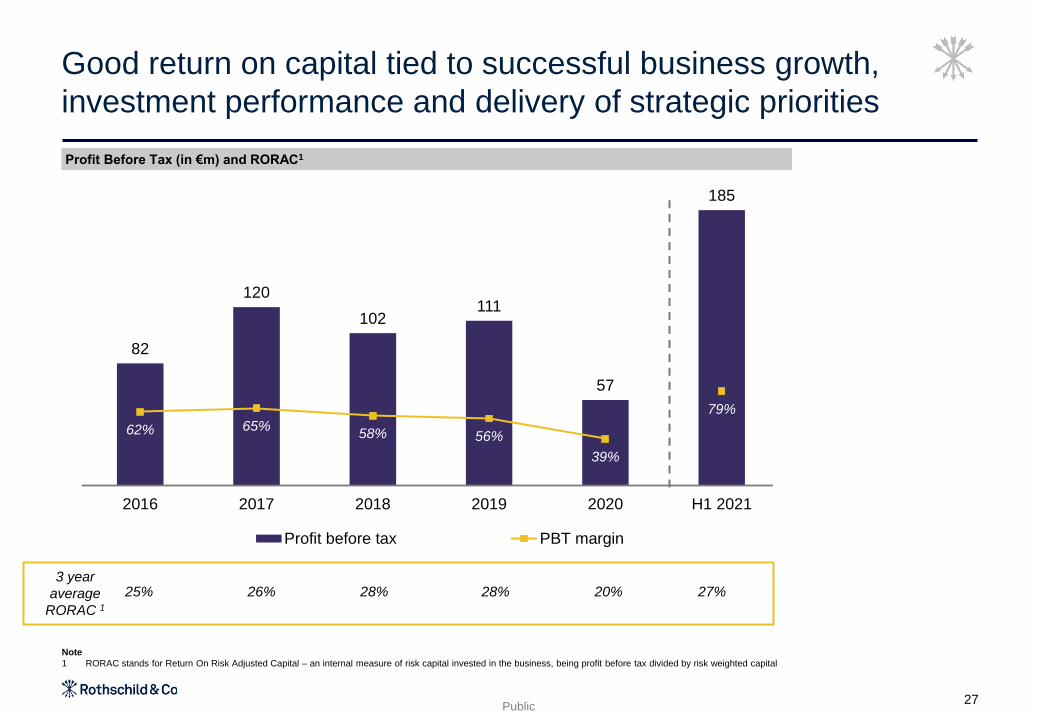
82
120
102111
57
185
62% 65%58% 56%
39%
79%
-
50.0%
100.0%
150.0%
200.0%
250.0%
0
20
40
60
80
100
120
140
160
180
200
2016 2017 2018 2019 2020 H1 2021
Profit before tax PBT margin
Good return on capital tied to successful business growth,
investment performance and delivery of strategic priorities
Profit Before Tax (in €m) and RORAC1
27
Note
1 RORAC stands for Return On Risk Adjusted Capital – an internal measure of risk capital invested in the business, being profit before tax divided by risk weighted capital
3 year
average
RORAC 125% 26% 28% 28% 20% 27%
Public
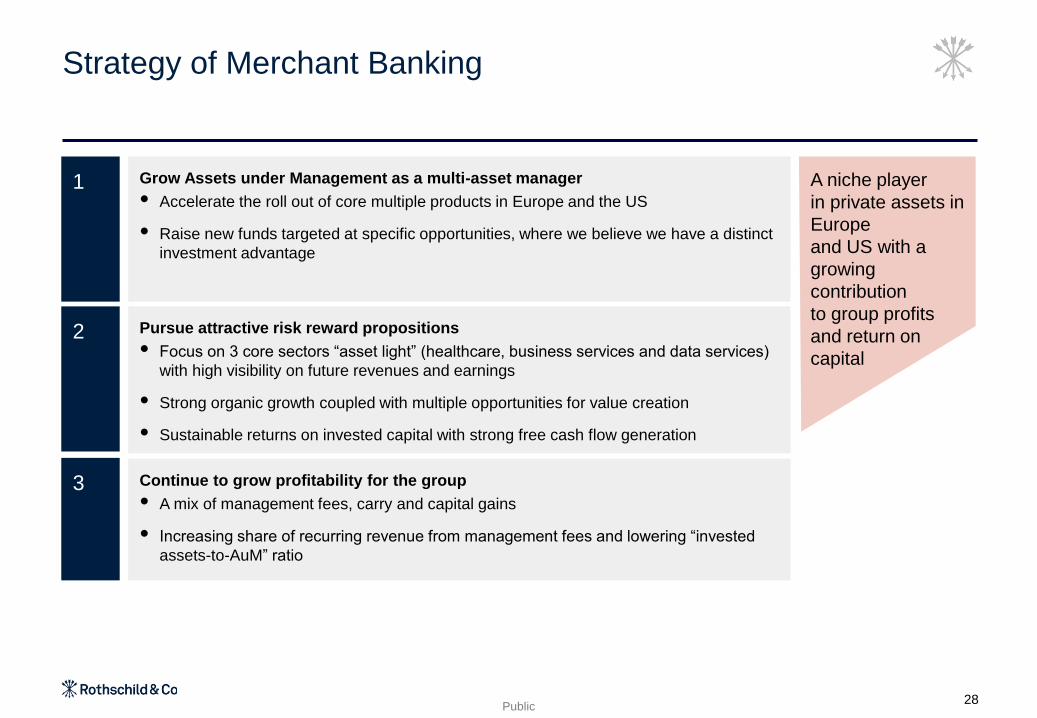
Strategy of Merchant Banking
28
A niche player
in private assets in
Europe
and US with a
growing
contribution
to group profits
and return on
capital
Grow Assets under Management as a multi-asset manager
⚫ Accelerate the roll out of core multiple products in Europe and the US
⚫ Raise new funds targeted at specific opportunities, where we believe we have a distinct
investment advantage
1
Pursue attractive risk reward propositions
⚫ Focus on 3 core sectors “asset light” (healthcare, business services and data services)
with high visibility on future revenues and earnings
⚫ Strong organic growth coupled with multiple opportunities for value creation
⚫ Sustainable returns on invested capital with strong free cash flow generation
2
Continue to grow profitability for the group
⚫ A mix of management fees, carry and capital gains
⚫ Increasing share of recurring revenue from management fees and lowering “invested
assets-to-AuM” ratio
3
Corporate responsibility
3
Fa
cin
g P
ag
e3
0
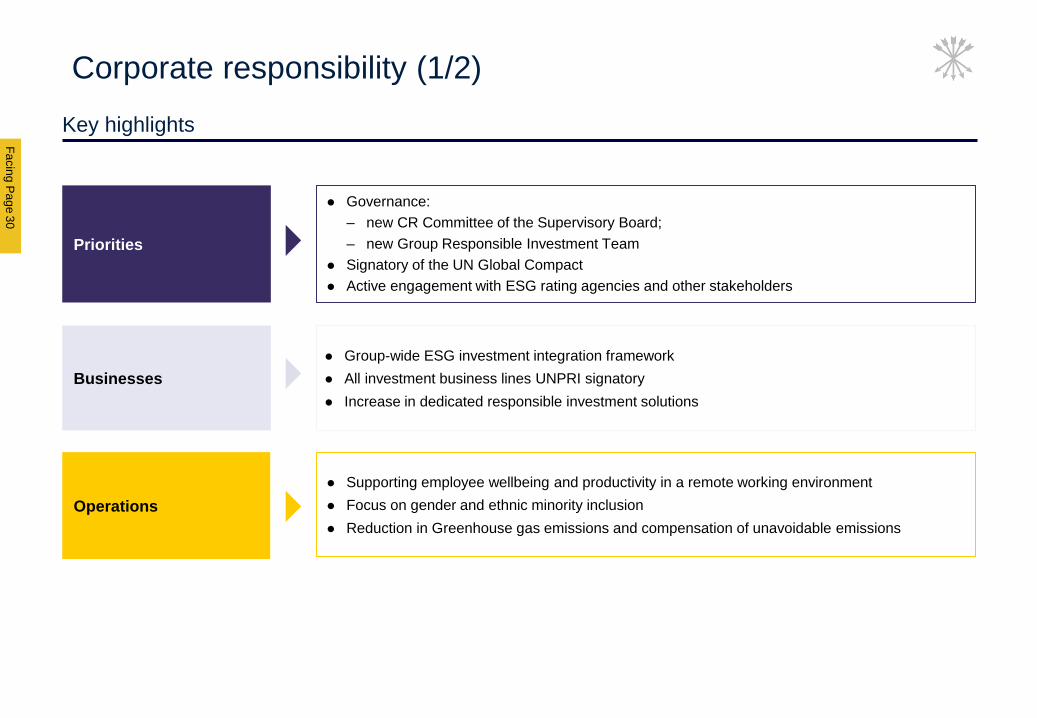
Key highlights
F
A
C
I
N
G
P
A
G
E
Corporate responsibility (1/2)
Priorities
Operations
⚫ Governance:
– new CR Committee of the Supervisory Board;
– new Group Responsible Investment Team
⚫ Signatory of the UN Global Compact
⚫ Active engagement with ESG rating agencies and other stakeholders
⚫ Supporting employee wellbeing and productivity in a remote working environment
⚫ Focus on gender and ethnic minority inclusion
⚫ Reduction in Greenhouse gas emissions and compensation of unavoidable emissions
Businesses
⚫ Group-wide ESG investment integration framework
⚫ All investment business lines UNPRI signatory
⚫ Increase in dedicated responsible investment solutions
Public
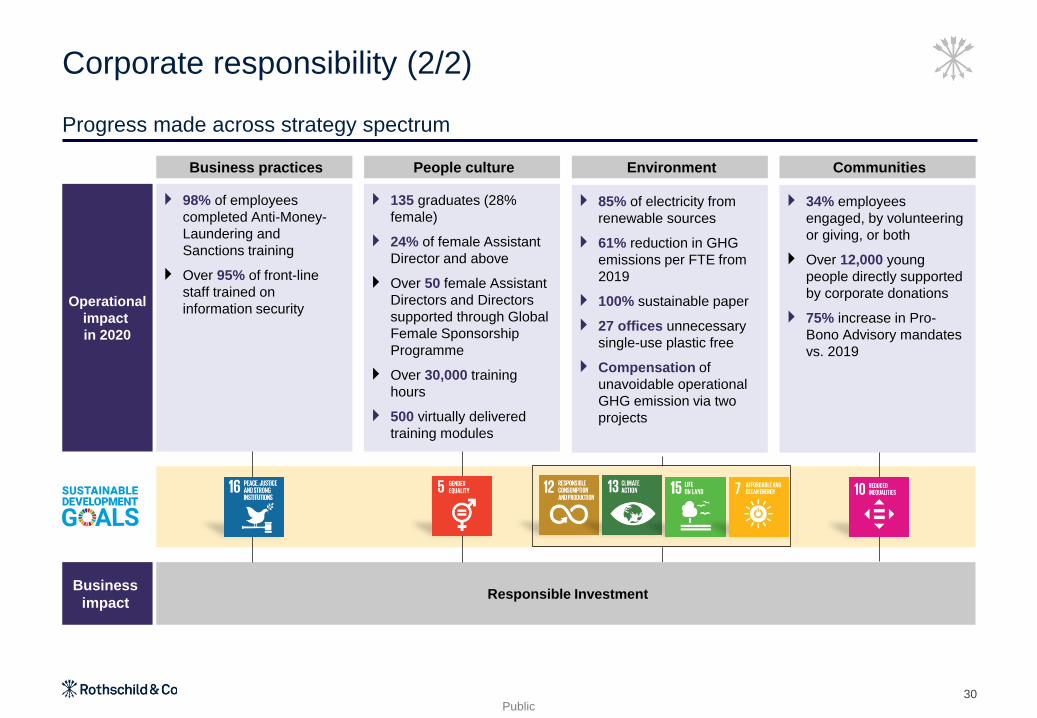
Corporate responsibility (2/2)
Progress made across strategy spectrum
30
Business practices People culture Environment Communities
Responsible Investment
98% of employees
completed Anti-Money-
Laundering and
Sanctions training
Over 95% of front-line
staff trained on
information security
135 graduates (28%
female)
24% of female Assistant
Director and above
Over 50 female Assistant
Directors and Directors
supported through Global
Female Sponsorship
Programme
Over 30,000 training
hours
500 virtually delivered
training modules
85% of electricity from
renewable sources
61% reduction in GHG
emissions per FTE from
2019
100% sustainable paper
27 offices unnecessary
single-use plastic free
Compensation of
unavoidable operational
GHG emission via two
projects
34% employees
engaged, by volunteering
or giving, or both
Over 12,000 young
people directly supported
by corporate donations
75% increase in Pro-
Bono Advisory mandates
vs. 2019
Business
impact
Operational
impact
in 2020
Public31
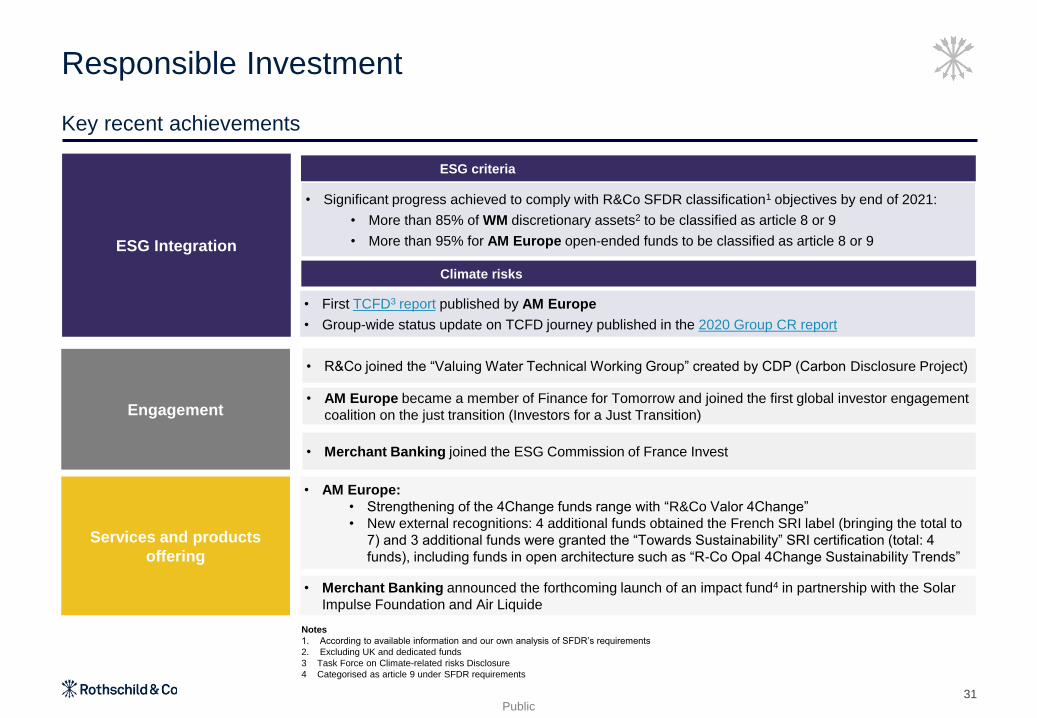
Responsible Investment
Key recent achievements
Engagement
Services and products
offering
• Significant progress achieved to comply with R&Co SFDR classification1 objectives by end of 2021:
• More than 85% of WM discretionary assets2 to be classified as article 8 or 9
• More than 95% for AM Europe open-ended funds to be classified as article 8 or 9
• AM Europe became a member of Finance for Tomorrow and joined the first global investor engagement
coalition on the just transition (Investors for a Just Transition)
• R&Co joined the “Valuing Water Technical Working Group” created by CDP (Carbon Disclosure Project)
• Merchant Banking announced the forthcoming launch of an impact fund4 in partnership with the Solar
Impulse Foundation and Air Liquide
ESG Integration
• AM Europe:
• Strengthening of the 4Change funds range with “R&Co Valor 4Change”
• New external recognitions: 4 additional funds obtained the French SRI label (bringing the total to
7) and 3 additional funds were granted the “Towards Sustainability” SRI certification (total: 4
funds), including funds in open architecture such as “R-Co Opal 4Change Sustainability Trends”
• First TCFD3 report published by AM Europe
• Group-wide status update on TCFD journey published in the 2020 Group CR report
Climate risks
ESG criteria
• Merchant Banking joined the ESG Commission of France Invest
Notes
1. According to available information and our own analysis of SFDR’s requirements
2. Excluding UK and dedicated funds
3 Task Force on Climate-related risks Disclosure
4 Categorised as article 9 under SFDR requirements

Financials
4
Fa
cin
g P
ag
e3
3
F
A
C
I
N
G
P
A
G
E
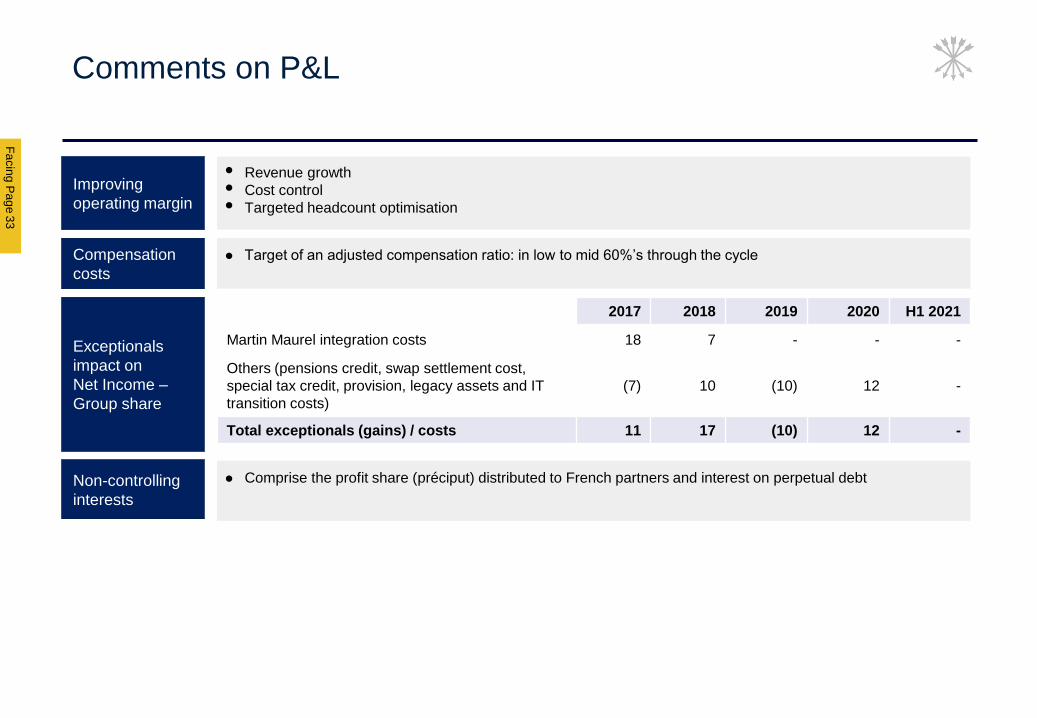
Comments on P&L
Improving
operating margin
⚫ Revenue growth ⚫ Cost control⚫ Targeted headcount optimisation
2017 2018 2019 2020 H1 2021
Martin Maurel integration costs 18 7 - - -
Others (pensions credit, swap settlement cost,
special tax credit, provision, legacy assets and IT
transition costs)
(7) 10 (10) 12 -
Total exceptionals (gains) / costs 11 17 (10) 12 -
Compensation
costs
⚫ Target of an adjusted compensation ratio: in low to mid 60%’s through the cycle
Exceptionals
impact on
Net Income –
Group share
Non-controlling
interests
⚫ Comprise the profit share (préciput) distributed to French partners and interest on perpetual debt
Public
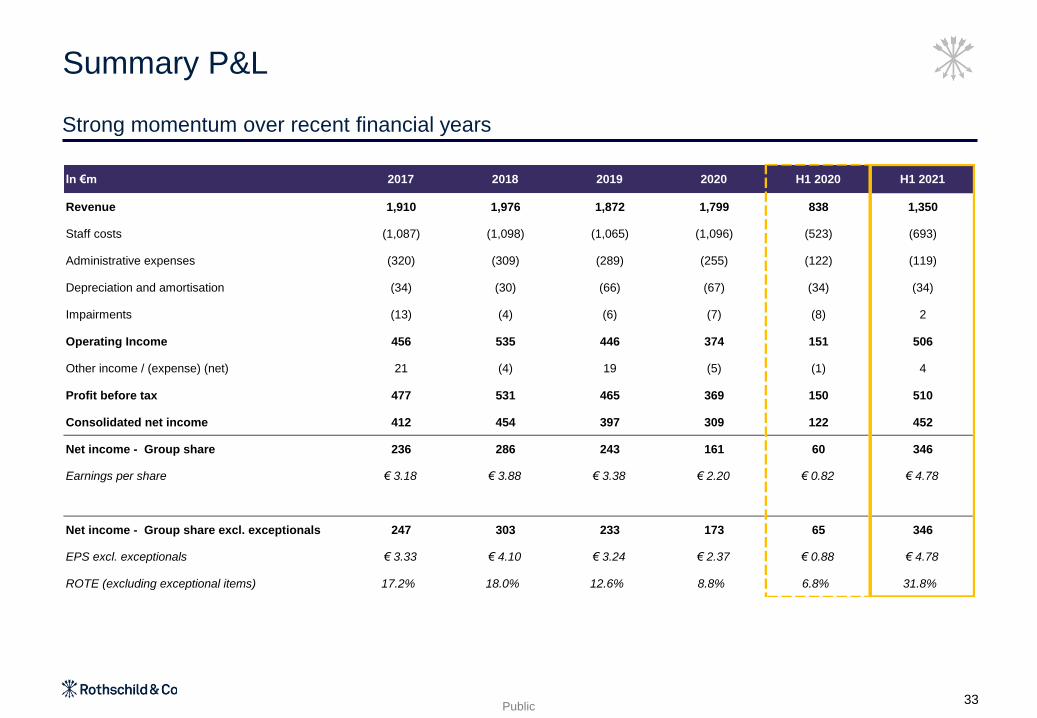
Strong momentum over recent financial years
Summary P&L
33
In €m 2017 2018 2019 2020 H1 2020 H1 2021
Revenue 1,910 1,976 1,872 1,799 838 1,350
Staff costs (1,087) (1,098) (1,065) (1,096) (523) (693)
Administrative expenses (320) (309) (289) (255) (122) (119)
Depreciation and amortisation (34) (30) (66) (67) (34) (34)
Impairments (13) (4) (6) (7) (8) 2
Operating Income 456 535 446 374 151 506
Other income / (expense) (net) 21 (4) 19 (5) (1) 4
Profit before tax 477 531 465 369 150 510
Consolidated net income 412 454 397 309 122 452
Net income - Group share 236 286 243 161 60 346
Earnings per share € 3.18 € 3.88 € 3.38 € 2.20 € 0.82 € 4.78
Net income - Group share excl. exceptionals 247 303 233 173 65 346
EPS excl. exceptionals € 3.33 € 4.10 € 3.24 € 2.37 € 0.88 € 4.78
ROTE (excluding exceptional items) 17.2% 18.0% 12.6% 8.8% 6.8% 31.8%
Fa
cin
g P
ag
e3
5
F
A
C
I
N
G
P
A
G
E
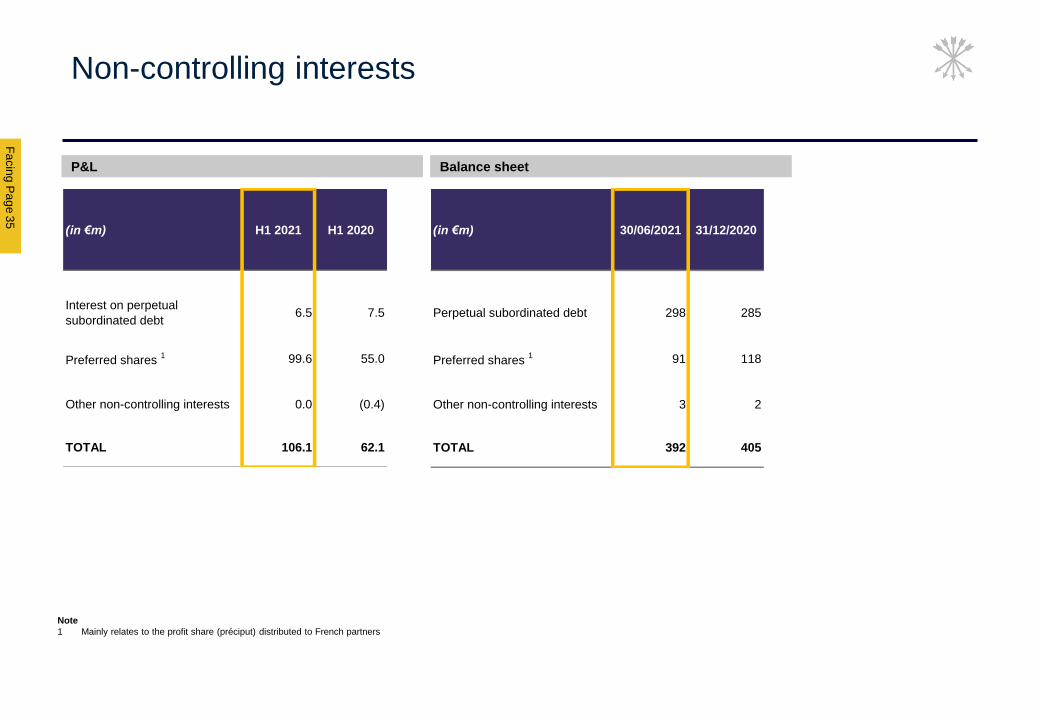
Balance sheetP&L
Non-controlling interests
Note
1 Mainly relates to the profit share (préciput) distributed to French partners
(in €m) H1 2021 H1 2020
Interest on perpetual
subordinated debt6.5 7.5
Preferred shares 1 99.6 55.0
Other non-controlling interests 0.0 (0.4)
TOTAL 106.1 62.1
(in €m) 30/06/2021 31/12/2020
Perpetual subordinated debt 298 285
Preferred shares 1 91 118
Other non-controlling interests 3 2
TOTAL 392 405

Public34
Compensation ratio target: low to mid 60%’s through the
cycle
Notes
1 Total staff costs include profit share (préciput) paid to French Partners and effects of accounting for deferred bonuses over the period in which they are earned, as opposed to
“awarded” basis but exclude redundancy costs, revaluation of share-based employee liabilities and acquisition costs treated as employee compensation under IFRS
2 Adjustments = GA US investment costs, defined as compensation earned in respect of the first 12 month period of employment plus any make-wholes payable in the reporting
period
⚫ 50% of personnel costs within Rothschild & Co is discretionary
(in €m) 2016 2017 2018 2019 2020 H1 2021
Revenue 1,713 1,910 1,976 1,872 1,799 1,350
Total staff costs1 (1,119) (1,211) (1,225) (1,176) (1,207) (773)
Compensation ratio 65.3% 63.4% 62.0% 62.8% 67.1% 57.3%
Adjusted accounting Compensation ratio
(INCLUDING deferred bonus accounting)2 64.0% 62.4% 60.8% 61.8% 66.6% 57.2%
Adjusted awarded Compensation ratio (EXCLUDING deferred bonus accounting)
65.0% 62.1% 62.3% 61.6% 66.5% 58.9%
Headcount 2,946 3,502 3,633 3,559 3,675 3,797
Fa
cin
g P
ag
e5
0
F
A
C
I
N
G
P
A
G
E
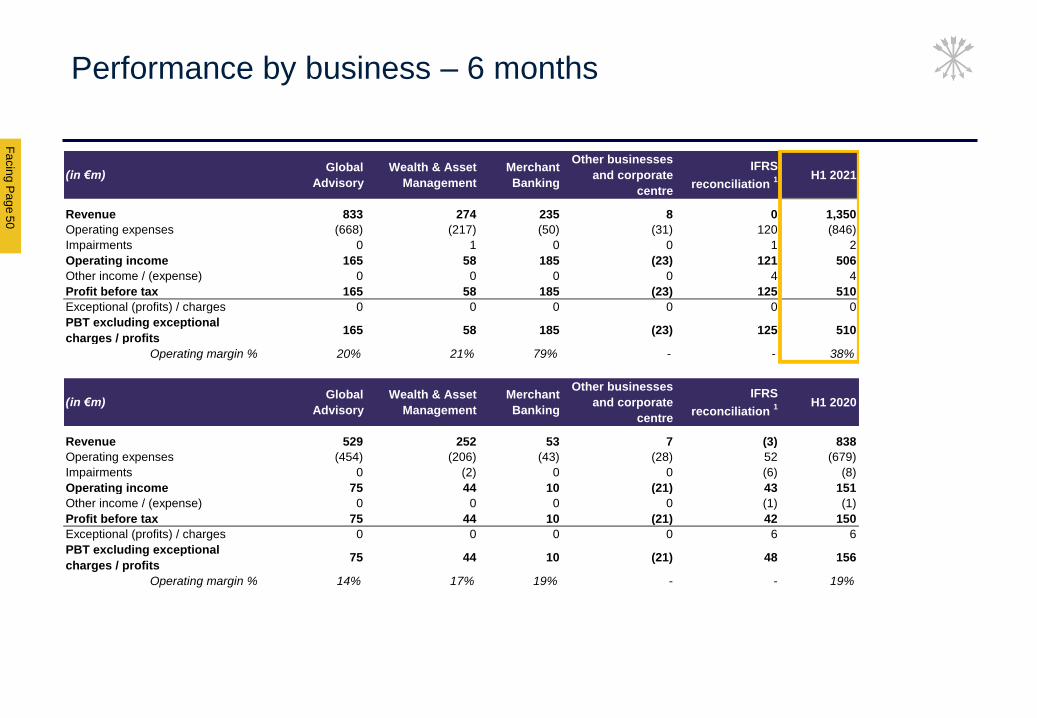
(in €m)Global
Advisory
Wealth & Asset
Management
Merchant
Banking
Other businesses
and corporate
centre
IFRS
reconciliation 1 H1 2021
Revenue 833 274 235 8 0 1,350
Operating expenses (668) (217) (50) (31) 120 (846)
Impairments 0 1 0 0 1 2
Operating income 165 58 185 (23) 121 506
Other income / (expense) 0 0 0 0 4 4
Profit before tax 165 58 185 (23) 125 510
Exceptional (profits) / charges 0 0 0 0 0 0
PBT excluding exceptional
charges / profits165 58 185 (23) 125 510
Operating margin % 20% 21% 79% - - 38%
(in €m)Global
Advisory
Wealth & Asset
Management
Merchant
Banking
Other businesses
and corporate
centre
IFRS
reconciliation 1 H1 2020
Revenue 529 252 53 7 (3) 838
Operating expenses (454) (206) (43) (28) 52 (679)
Impairments 0 (2) 0 0 (6) (8)
Operating income 75 44 10 (21) 43 151
Other income / (expense) 0 0 0 0 (1) (1)
Profit before tax 75 44 10 (21) 42 150
Exceptional (profits) / charges 0 0 0 0 6 6
PBT excluding exceptional
charges / profits75 44 10 (21) 48 156
Operating margin % 14% 17% 19% - - 19%
Performance by business – 6 months
Public
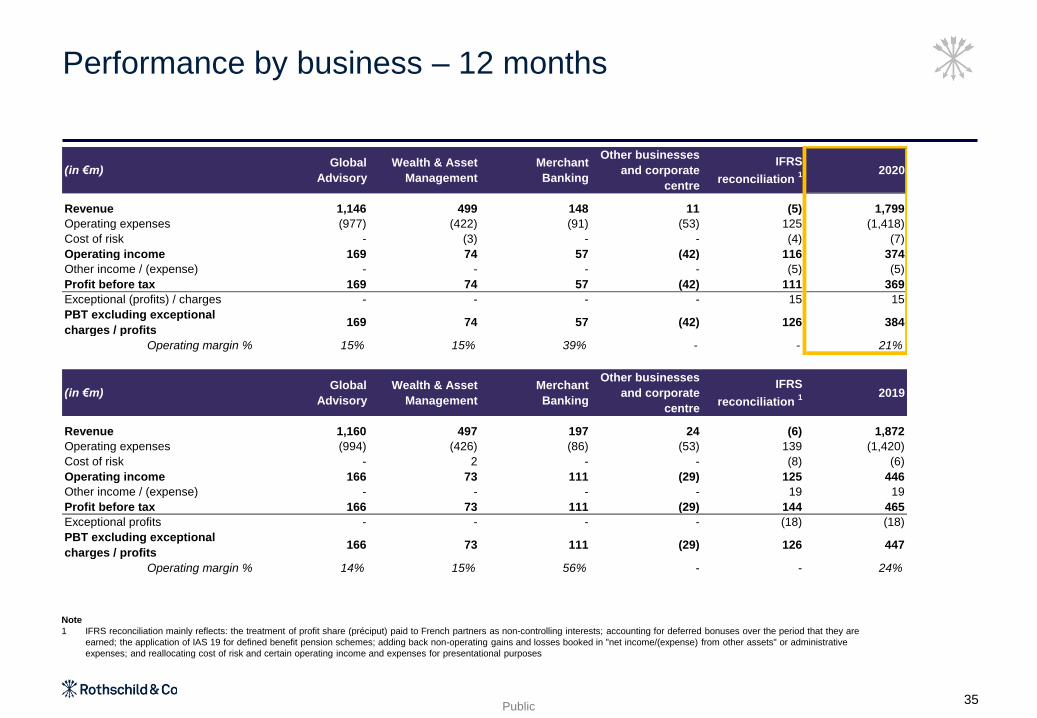
Performance by business – 12 months
35
(in €m)Global
Advisory
Wealth & Asset
Management
Merchant
Banking
Other businesses
and corporate
centre
IFRS
reconciliation 1 2020
Revenue 1,146 499 148 11 (5) 1,799
Operating expenses (977) (422) (91) (53) 125 (1,418)
Cost of risk - (3) - - (4) (7)
Operating income 169 74 57 (42) 116 374
Other income / (expense) - - - - (5) (5)
Profit before tax 169 74 57 (42) 111 369
Exceptional (profits) / charges - - - - 15 15
PBT excluding exceptional
charges / profits169 74 57 (42) 126 384
Operating margin % 15% 15% 39% - - 21%
(in €m)Global
Advisory
Wealth & Asset
Management
Merchant
Banking
Other businesses
and corporate
centre
IFRS
reconciliation 1 2019
Revenue 1,160 497 197 24 (6) 1,872
Operating expenses (994) (426) (86) (53) 139 (1,420)
Cost of risk - 2 - - (8) (6)
Operating income 166 73 111 (29) 125 446
Other income / (expense) - - - - 19 19
Profit before tax 166 73 111 (29) 144 465
Exceptional profits - - - - (18) (18)
PBT excluding exceptional
charges / profits166 73 111 (29) 126 447
Operating margin % 14% 15% 56% - - 24%
Note
1 IFRS reconciliation mainly reflects: the treatment of profit share (préciput) paid to French partners as non-controlling interests; accounting for deferred bonuses over the period that they are
earned; the application of IAS 19 for defined benefit pension schemes; adding back non-operating gains and losses booked in "net income/(expense) from other assets" or administrative
expenses; and reallocating cost of risk and certain operating income and expenses for presentational purposes
Fa
cin
g P
ag
e3
6
F
A
C
I
N
G
P
A
G
E
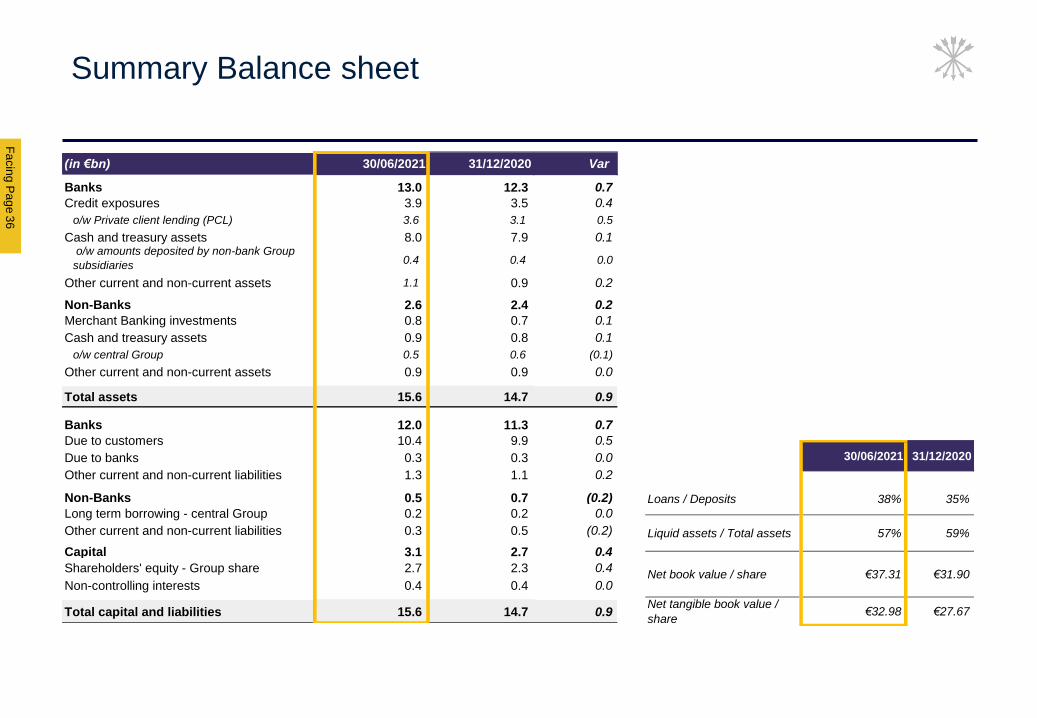
Summary Balance sheet
30/06/2021 31/12/2020
Loans / Deposits 38% 35%
Liquid assets / Total assets 57% 59%
Net book value / share €37.31 €31.90
Net tangible book value /
share€32.98 €27.67
(in €bn) 30/06/2021 31/12/2020 Var
Banks 13.0 12.3 0.7
Credit exposures 3.9 3.5 0.4
o/w Private client lending (PCL) 3.6 3.1 0.5
Cash and treasury assets 8.0 7.9 0.1 o/w amounts deposited by non-bank Group
subsidiaries 0.4 0.4 0.0
Other current and non-current assets 1.1 0.9 0.2
Non-Banks 2.6 2.4 0.2
Merchant Banking investments 0.8 0.7 0.1
Cash and treasury assets 0.9 0.8 0.1
o/w central Group 0.5 0.6 (0.1)
Other current and non-current assets 0.9 0.9 0.0
Total assets 15.6 14.7 0.9
Banks 12.0 11.3 0.7
Due to customers 10.4 9.9 0.5
Due to banks 0.3 0.3 0.0
Other current and non-current liabilities 1.3 1.1 0.2
Non-Banks 0.5 0.7 (0.2)
Long term borrowing - central Group 0.2 0.2 0.0
Other current and non-current liabilities 0.3 0.5 (0.2)
Capital 3.1 2.7 0.4
Shareholders' equity - Group share 2.7 2.3 0.4
Non-controlling interests 0.4 0.4 0.0
Total capital and liabilities 15.6 14.7 0.9
Public36
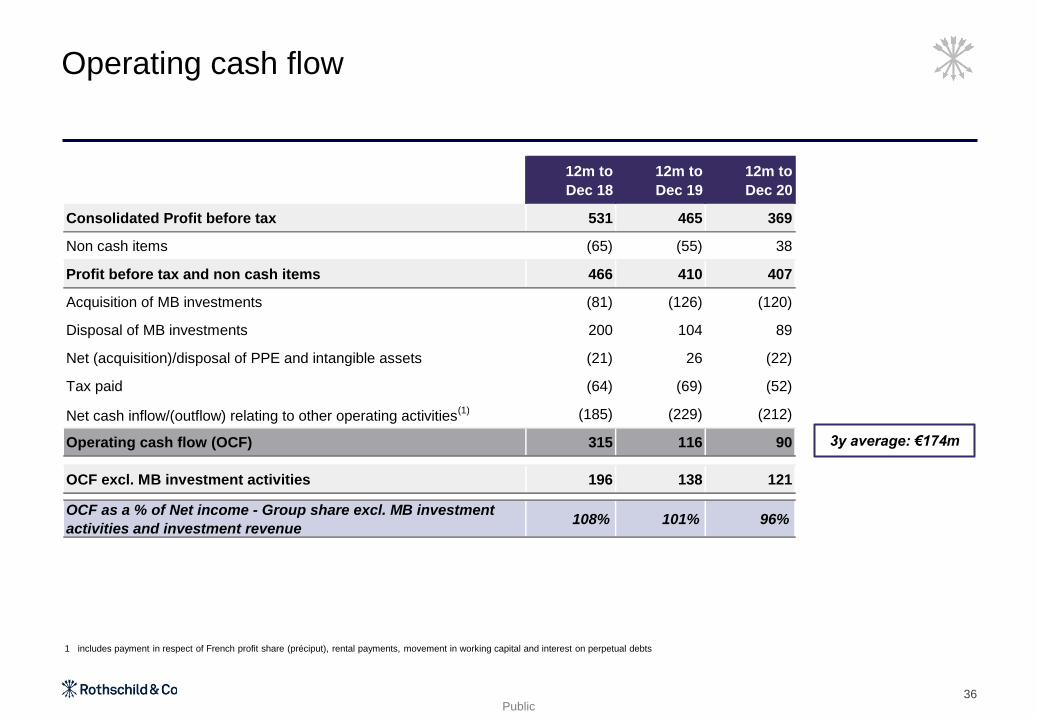
Operating cash flow
1 includes payment in respect of French profit share (préciput), rental payments, movement in working capital and interest on perpetual debts
12m to
Dec 18
12m to
Dec 19
12m to
Dec 20
Consolidated Profit before tax 531 465 369
Non cash items (65) (55) 38
Profit before tax and non cash items 466 410 407
Acquisition of MB investments (81) (126) (120)
Disposal of MB investments 200 104 89
Net (acquisition)/disposal of PPE and intangible assets (21) 26 (22)
Tax paid (64) (69) (52)
Net cash inflow/(outflow) relating to other operating activities(1) (185) (229) (212)
Operating cash flow (OCF) 315 116 90
OCF excl. MB investment activities 196 138 121
OCF as a % of Net income - Group share excl. MB investment
activities and investment revenue108% 101% 96%
3y average: €174m
Shareholding structure and
governance
5
Fa
cin
g P
ag
e3
8
F
A
C
I
N
G
P
A
G
E
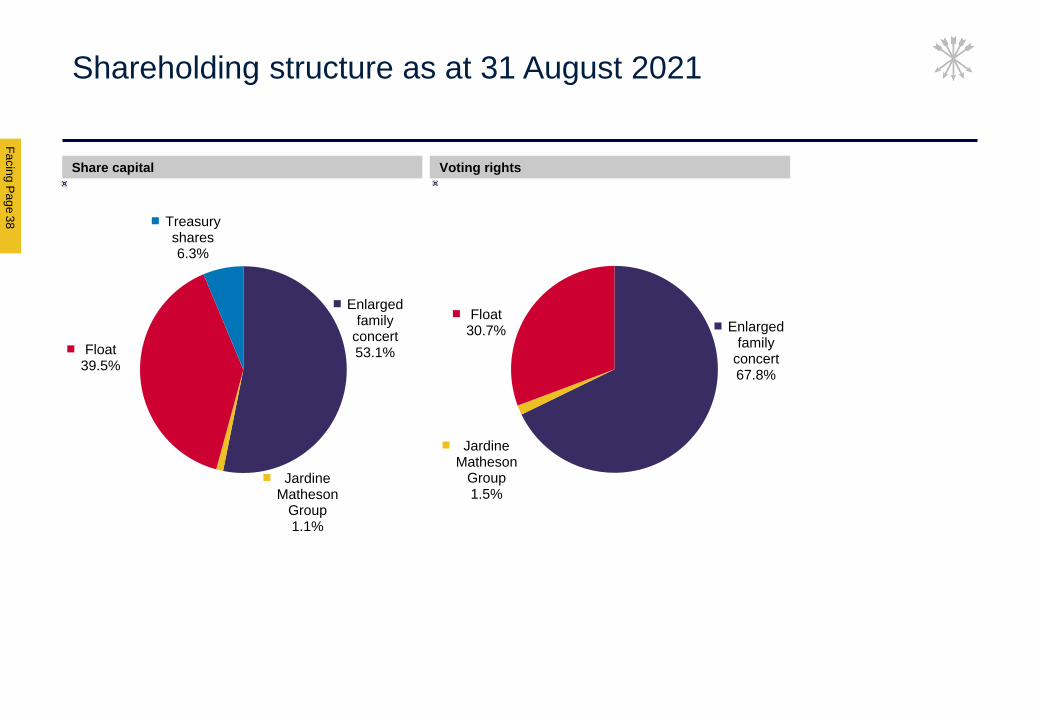
Shareholding structure as at 31 August 2021
Share capital Voting rights
Enlarged family
concert53.1%
Jardine Matheson
Group1.1%
Float39.5%
Treasury shares6.3%
Enlarged family
concert67.8%
Jardine Matheson
Group1.5%
Float30.7%
Public
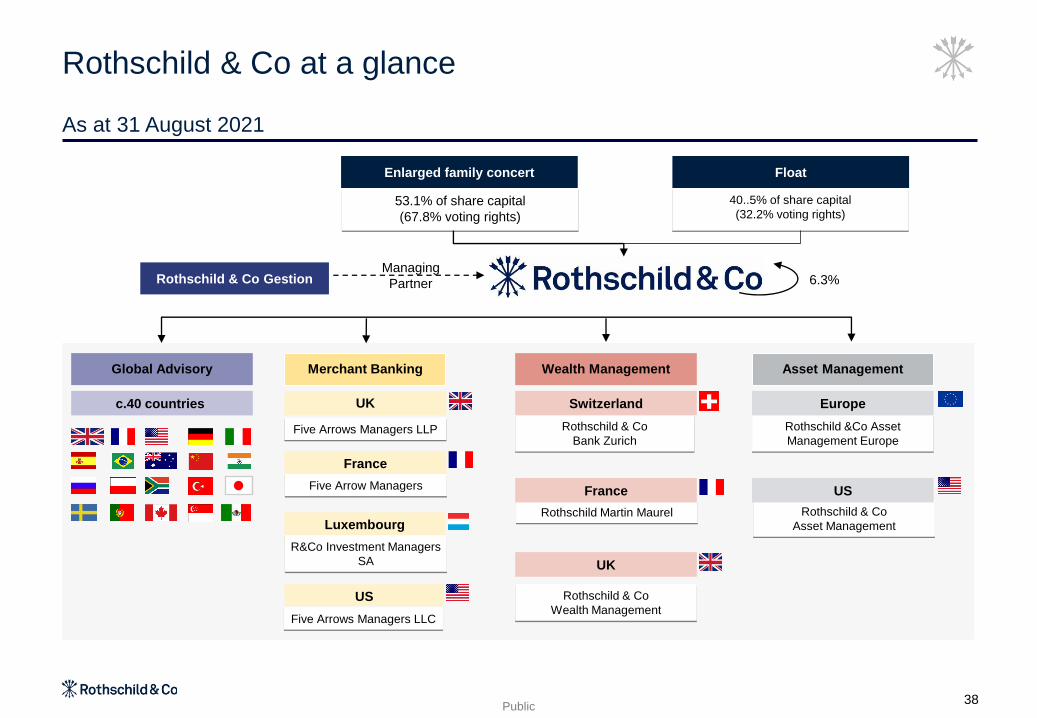
As at 31 August 2021
Rothschild & Co at a glance
Five Arrows Managers LLP
53.1% of share capital
(67.8% voting rights)
Enlarged family concert
40..5% of share capital
(32.2% voting rights)
Rothschild & Co GestionManaging
Partner 6.3%
Global Advisory
c.40 countries
Merchant Banking
Luxembourg
R&Co Investment Managers
SA
France
Five Arrow Managers
UK
Float
Five Arrows Managers LLC
US
Rothschild & Co
Bank Zurich
Switzerland
Asset ManagementWealth Management
Rothschild Martin Maurel
France
Rothschild & Co
Wealth Management
UK
Rothschild &Co Asset
Management Europe
Europe
Rothschild & Co
Asset Management
US
38
Public
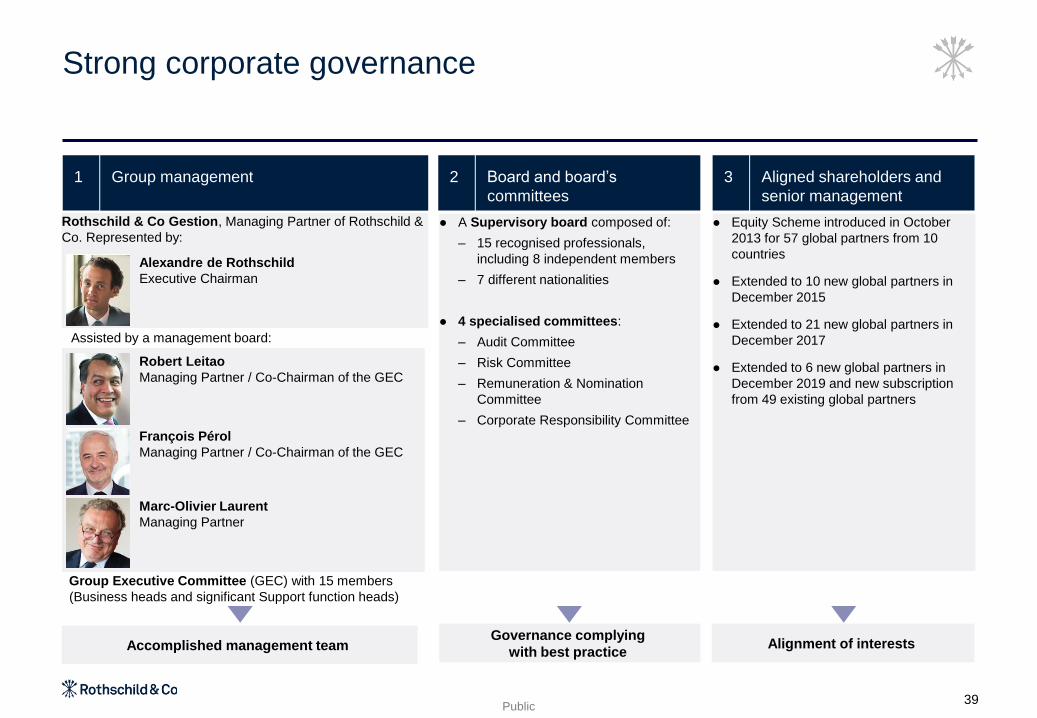
Group Executive Committee (GEC) with 15 members
(Business heads and significant Support function heads)
Strong corporate governance
⚫ A Supervisory board composed of:
– 15 recognised professionals,
including 8 independent members
– 7 different nationalities
⚫ 4 specialised committees:
– Audit Committee
– Risk Committee
– Remuneration & Nomination
Committee
– Corporate Responsibility Committee
⚫ Equity Scheme introduced in October
2013 for 57 global partners from 10
countries
⚫ Extended to 10 new global partners in
December 2015
⚫ Extended to 21 new global partners in
December 2017
⚫ Extended to 6 new global partners in
December 2019 and new subscription
from 49 existing global partners
Rothschild & Co Gestion, Managing Partner of Rothschild &
Co. Represented by:
Accomplished management teamGovernance complying
with best practiceAlignment of interests
Board and board’s
committees
Group management1 2 Aligned shareholders and
senior management
3
Alexandre de Rothschild
Executive Chairman
Assisted by a management board:
Robert Leitao
Managing Partner / Co-Chairman of the GEC
François Pérol
Managing Partner / Co-Chairman of the GEC
Marc-Olivier Laurent
Managing Partner
39

Appendices
Fa
cin
g P
ag
e
0
600
1,200
1,800
2,400
Announced - NA Completed - NA
41
F
A
C
I
N
G
P
A
G
E
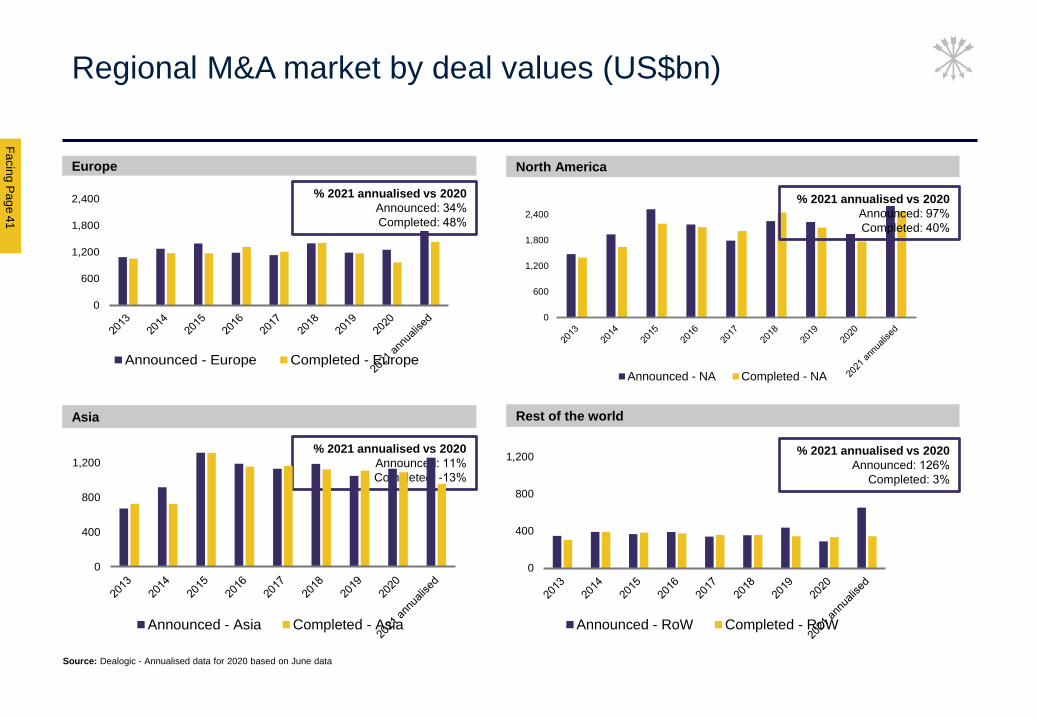
Europe North America
Asia Rest of the world
Regional M&A market by deal values (US$bn)
Source: Dealogic - Annualised data for 2020 based on June data
% 2021 annualised vs 2020
Announced: 34%
Completed: 48%
% 2021 annualised vs 2020
Announced: 97%
Completed: 40%
% 2021 annualised vs 2020
Announced: 126%
Completed: 3%
% 2021 annualised vs 2020
Announced: 11%
Completed: -13%
0
600
1,200
1,800
2,400
Announced - Europe Completed - Europe
0
400
800
1,200
Announced - RoW Completed - RoW
0
400
800
1,200
Announced - Asia Completed - Asia
Public
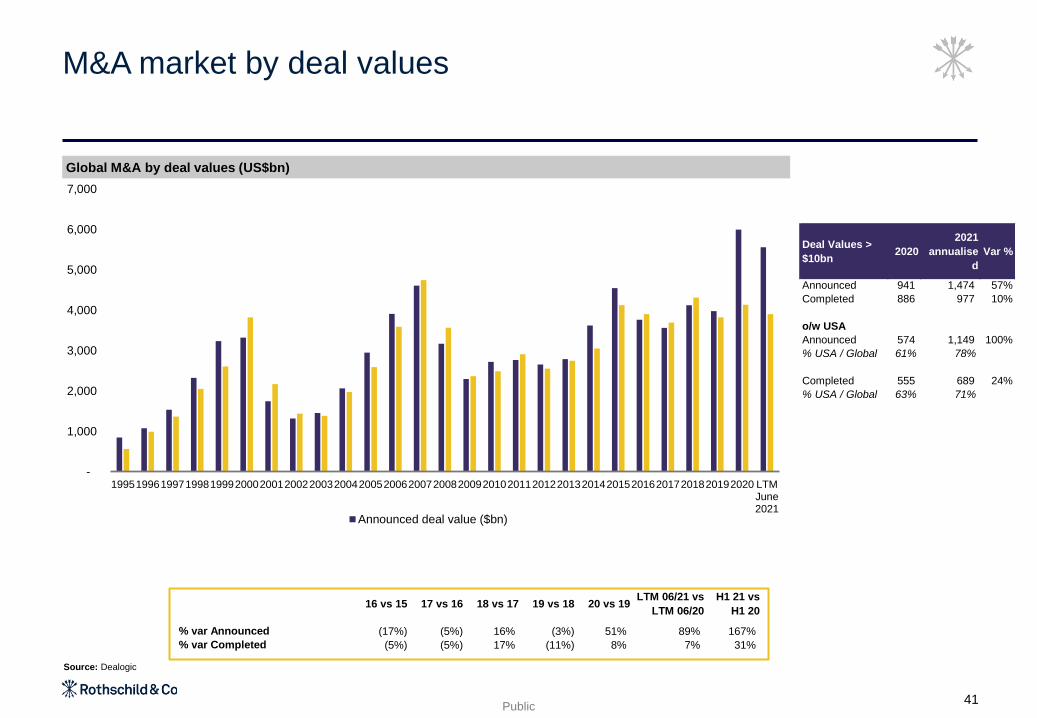
M&A market by deal values
Global M&A by deal values (US$bn)
41
Source: Dealogic
16 vs 15 17 vs 16 18 vs 17 19 vs 18 20 vs 19LTM 06/21 vs
LTM 06/20
H1 21 vs
H1 20
% var Announced (17%) (5%) 16% (3%) 51% 89% 167%
% var Completed (5%) (5%) 17% (11%) 8% 7% 31%
-
1,000
2,000
3,000
4,000
5,000
6,000
7,000
19951996199719981999200020012002200320042005200620072008200920102011201220132014201520162017201820192020 LTMJune2021
Announced deal value ($bn)
Deal Values >
$10bn2020
2021
annualise
d
Var %
Announced 941 1,474 57%
Completed 886 977 10%
o/w USA
Announced 574 1,149 100%
% USA / Global 61% 78%
Completed 555 689 24%
% USA / Global 63% 71%
Fa
cin
g P
ag
e4
2
F
A
C
I
N
G
P
A
G
E
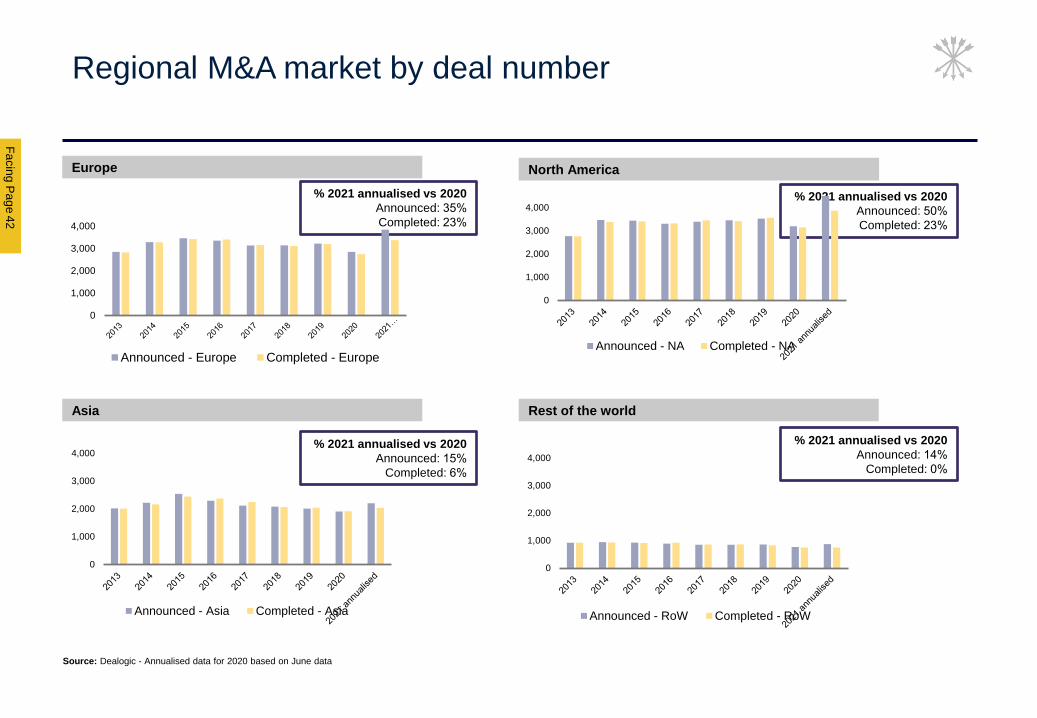
Europe North America
Asia Rest of the world
Regional M&A market by deal number
% 2021 annualised vs 2020
Announced: 35%
Completed: 23%
% 2021 annualised vs 2020
Announced: 15%
Completed: 6%
% 2021 annualised vs 2020
Announced: 50%
Completed: 23%
% 2021 annualised vs 2020
Announced: 14%
Completed: 0%
Source: Dealogic - Annualised data for 2020 based on June data
0
1,000
2,000
3,000
4,000
Announced - Europe Completed - Europe
0
1,000
2,000
3,000
4,000
Announced - NA Completed - NA
0
1,000
2,000
3,000
4,000
Announced - Asia Completed - Asia
0
1,000
2,000
3,000
4,000
Announced - RoW Completed - RoW
Public
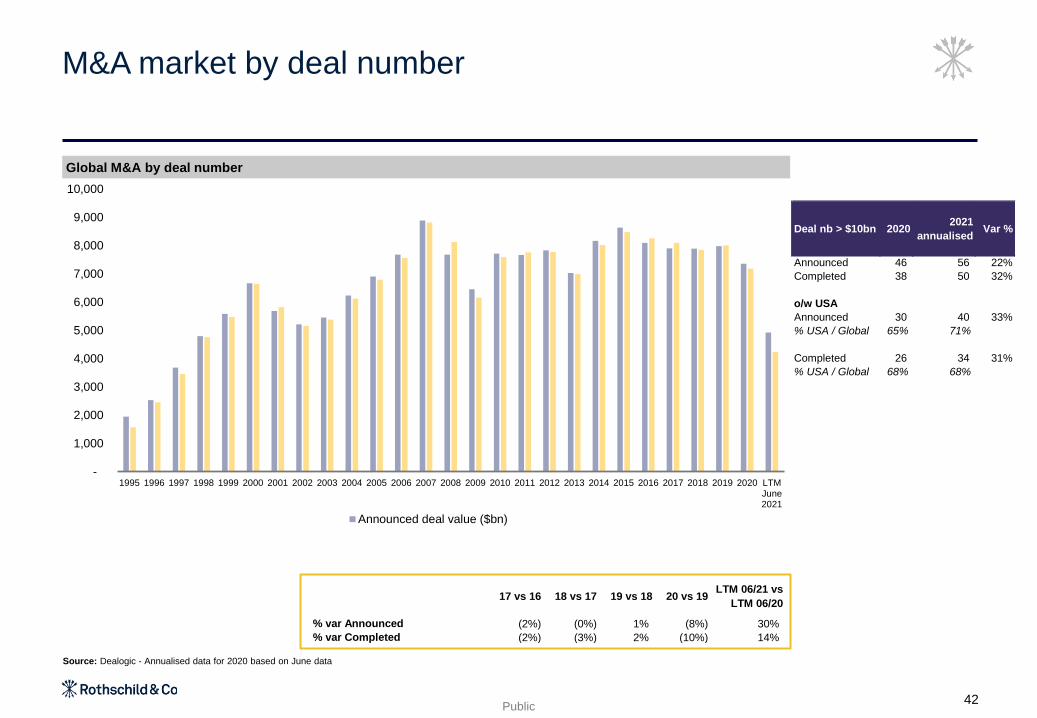
M&A market by deal number
Global M&A by deal number
42
Source: Dealogic - Annualised data for 2020 based on June data
-
1,000
2,000
3,000
4,000
5,000
6,000
7,000
8,000
9,000
10,000
1995 1996 1997 1998 1999 2000 2001 2002 2003 2004 2005 2006 2007 2008 2009 2010 2011 2012 2013 2014 2015 2016 2017 2018 2019 2020 LTMJune2021
Announced deal value ($bn)
17 vs 16 18 vs 17 19 vs 18 20 vs 19LTM 06/21 vs
LTM 06/20
% var Announced (2%) (0%) 1% (8%) 30%
% var Completed (2%) (3%) 2% (10%) 14%
Deal nb > $10bn 20202021
annualisedVar %
Announced 46 56 22%
Completed 38 50 32%
o/w USA
Announced 30 40 33%
% USA / Global 65% 71%
Completed 26 34 31%
% USA / Global 68% 68%
Fa
cin
g P
ag
e4
3
F
A
C
I
N
G
P
A
G
E
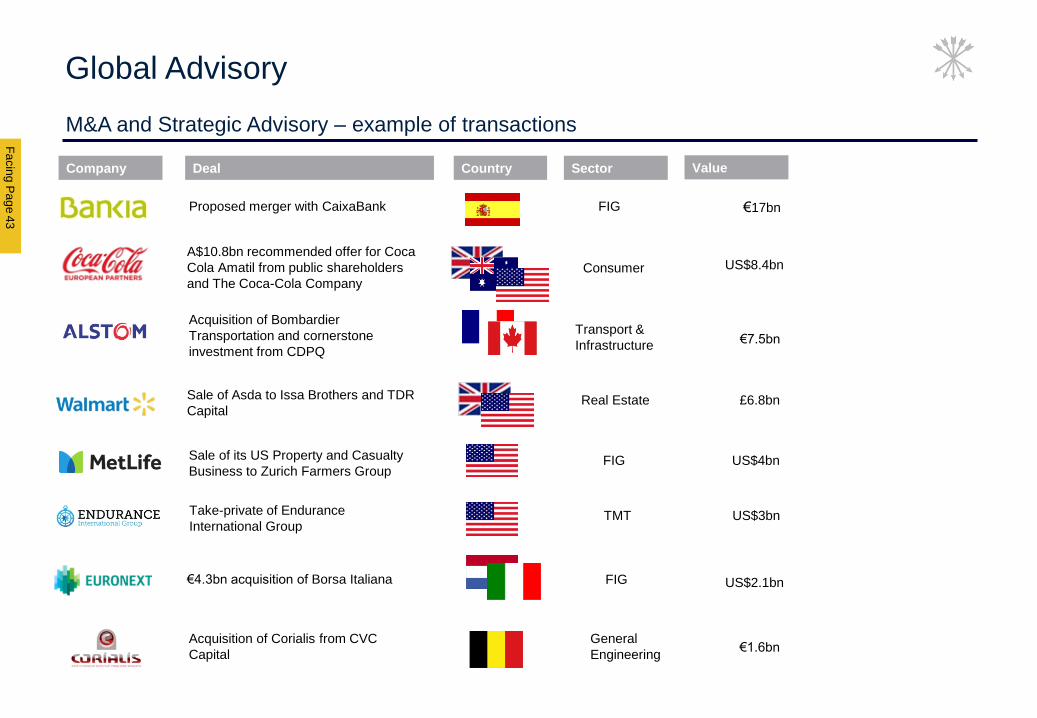
M&A and Strategic Advisory – example of transactions
Global Advisory
Company Deal Country Sector Value
A$10.8bn recommended offer for Coca
Cola Amatil from public shareholders
and The Coca-Cola Company
Consumer US$8.4bn
Acquisition of Corialis from CVC
Capital
General
Engineering €1.6bn
Sale of its US Property and Casualty
Business to Zurich Farmers GroupFIG US$4bn
€4.3bn acquisition of Borsa Italiana FIG US$2.1bn
Proposed merger with CaixaBank FIG €17bn
Acquisition of Bombardier
Transportation and cornerstone
investment from CDPQ
Transport &
Infrastructure€7.5bn
Sale of Asda to Issa Brothers and TDR
CapitalReal Estate £6.8bn
Take-private of Endurance
International GroupTMT US$3bn
Public
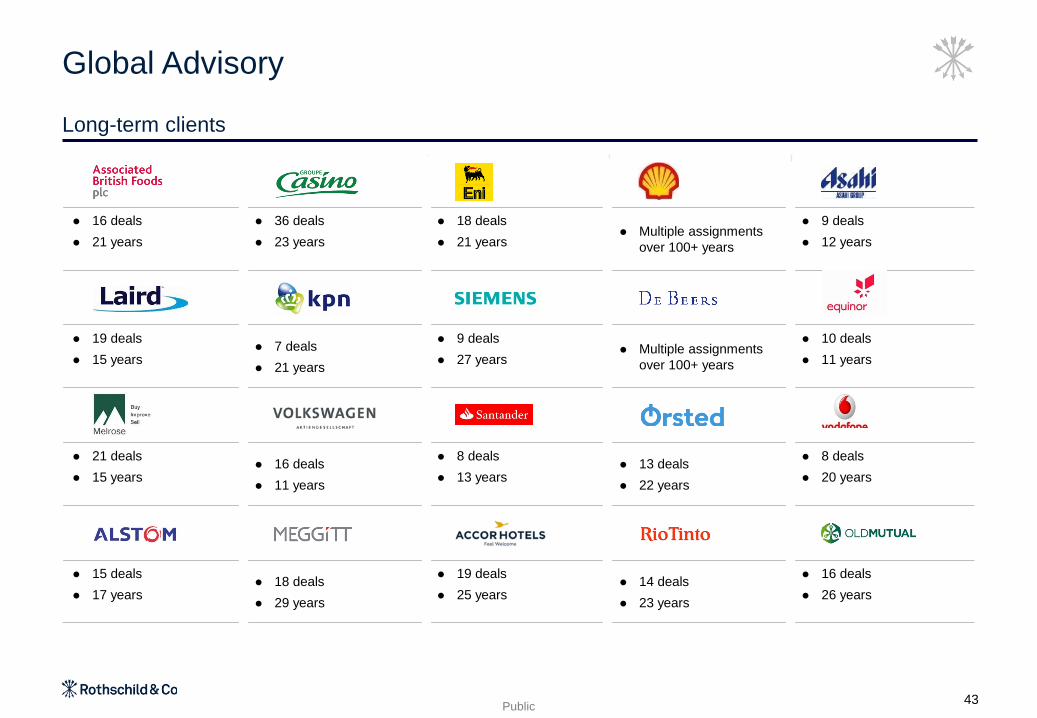
⚫ 16 deals
⚫ 21 years
⚫ 36 deals
⚫ 23 years
⚫ 18 deals
⚫ 21 years⚫ Multiple assignments
over 100+ years
⚫ 9 deals
⚫ 12 years
⚫ 19 deals
⚫ 15 years⚫ 7 deals
⚫ 21 years
⚫ 9 deals
⚫ 27 years⚫ Multiple assignments
over 100+ years
⚫ 10 deals
⚫ 11 years
⚫ 21 deals
⚫ 15 years⚫ 16 deals
⚫ 11 years
⚫ 8 deals
⚫ 13 years⚫ 13 deals
⚫ 22 years
⚫ 8 deals
⚫ 20 years
⚫ 15 deals
⚫ 17 years⚫ 18 deals
⚫ 29 years
⚫ 19 deals
⚫ 25 years⚫ 14 deals
⚫ 23 years
⚫ 16 deals
⚫ 26 years
Global Advisory
Long-term clients
43
Fa
cin
g P
ag
e4
4
F
A
C
I
N
G
P
A
G
E
Global Advisory
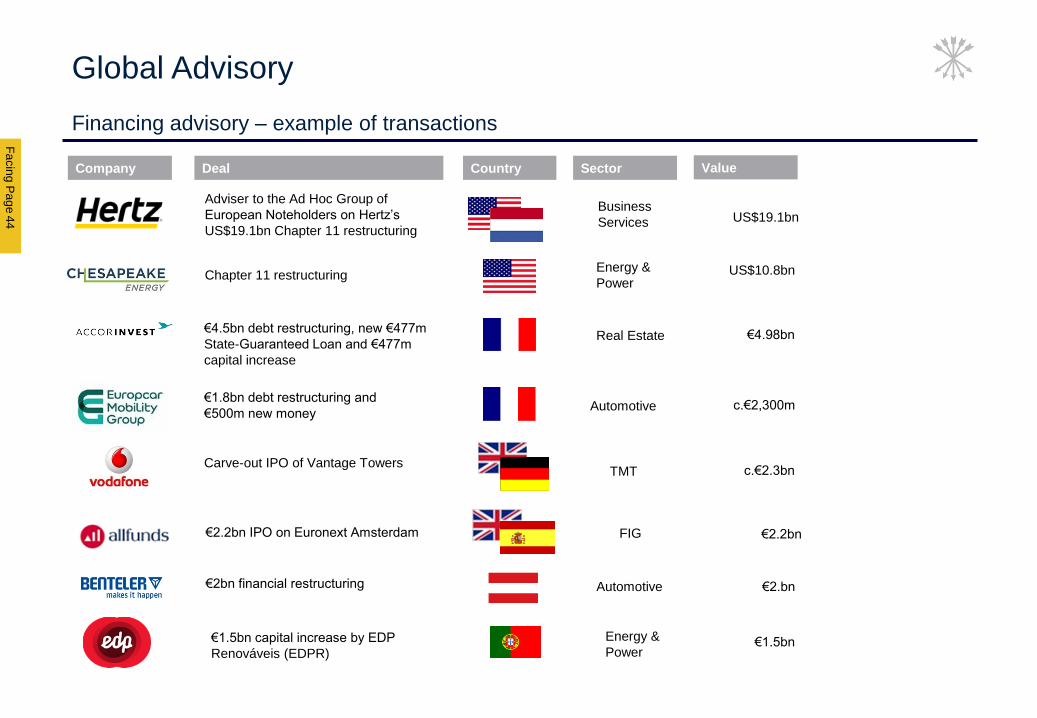
Financing advisory – example of transactions
Company Deal Country Sector Value
US$19.1bn Business
Services
Adviser to the Ad Hoc Group of
European Noteholders on Hertz’s
US$19.1bn Chapter 11 restructuring
€1.5bn Energy &
Power€1.5bn capital increase by EDP
Renováveis (EDPR)
US$10.8bnChapter 11 restructuring Energy &
Power
c.€2.3bn TMTCarve-out IPO of Vantage Towers
€4.98bnReal Estate€4.5bn debt restructuring, new €477m
State-Guaranteed Loan and €477m
capital increase
€2bn financial restructuring Automotive €2.bn
c.€2,300m€1.8bn debt restructuring and
€500m new moneyAutomotive
€2.2bnFIG€2.2bn IPO on Euronext Amsterdam
Public
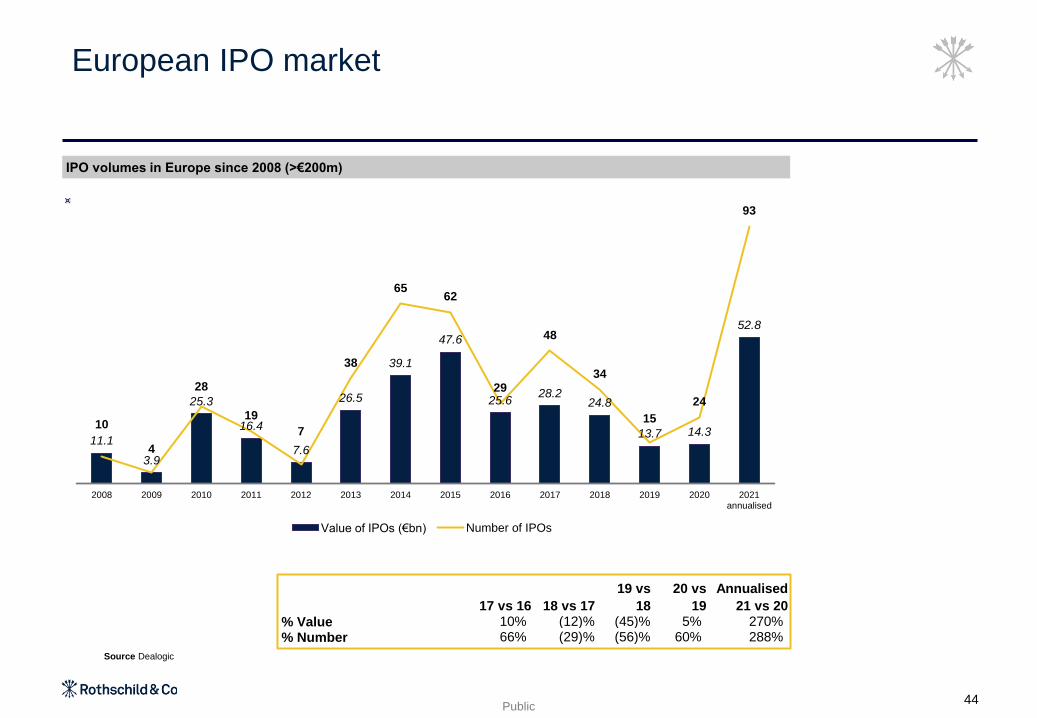
IPO volumes in Europe since 2008 (>€200m)
European IPO market
Source Dealogic
44
11.1
3.9
25.3
16.4
7.6
26.5
39.1
47.6
25.628.2
24.8
13.7 14.3
52.8
10
4
28
19
7
38
6562
29
48
34
15
24
93
2008 2009 2010 2011 2012 2013 2014 2015 2016 2017 2018 2019 2020 2021annualised
Value of IPOs (€bn) Number of IPOs
17 vs 16 18 vs 17
19 vs
18
20 vs
19
Annualised
21 vs 20
% Value 10% (12)% (45)% 5% 270%
% Number 66% (29)% (56)% 60% 288%
Fa
cin
g P
ag
e6
7
F
A
C
I
N
G
P
A
G
E
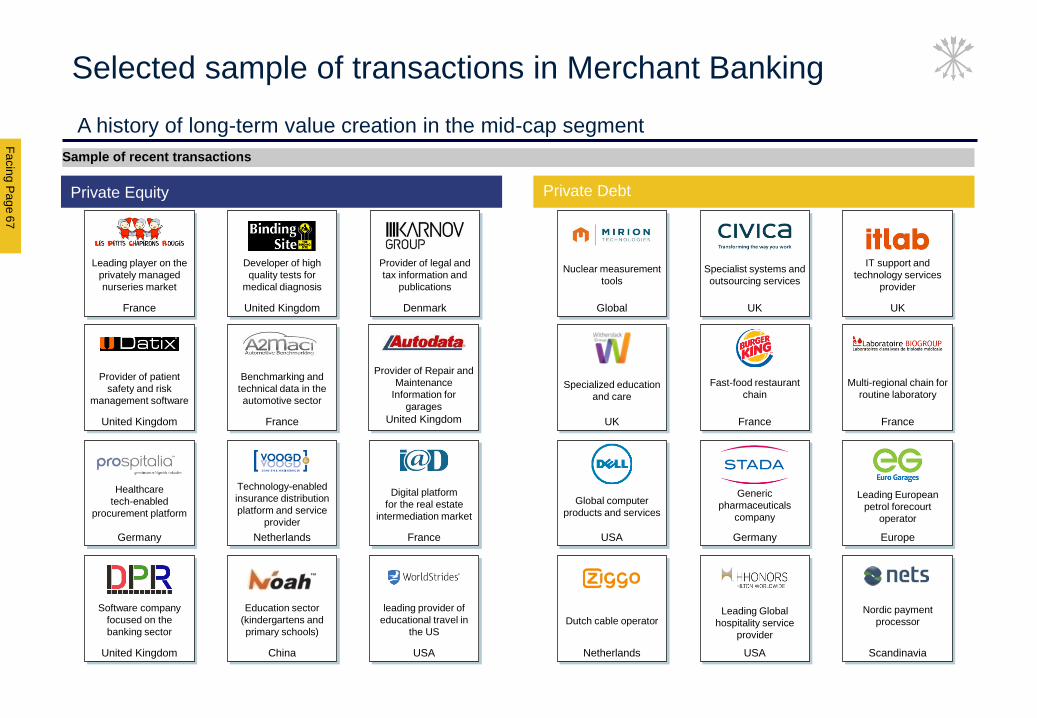
Sample of recent transactions
Multi-regional chain for
routine laboratory
France
Netherlands
Dutch cable operator
Nuclear measurement
tools
Global
Specialized education
and care
UK
Europe
Leading European
petrol forecourt
operator
Scandinavia
Nordic payment
processor
Digital platform
for the real estate
intermediation market
France
Leading player on the
privately managed
nurseries market
France
Provider of legal and
tax information and
publications
Denmark
Provider of patient
safety and risk
management software
United Kingdom
Provider of Repair and
Maintenance
Information for
garages
United Kingdom
Healthcare
tech-enabled
procurement platform
Germany
Software company
focused on the
banking sector
United Kingdom
Developer of high
quality tests for
medical diagnosis
United Kingdom
Benchmarking and
technical data in the
automotive sector
France
Technology-enabled
insurance distribution
platform and service
provider
Netherlands
Education sector
(kindergartens and
primary schools)
China
leading provider of
educational travel in
the US
USA
USA
Global computer
products and services
Germany
Generic
pharmaceuticals
company
Fast-food restaurant
chain
France
USA
Leading Global
hospitality service
provider
Specialist systems and
outsourcing services
UK
IT support and
technology services
provider
UK
Private DebtPrivate Equity
Selected sample of transactions in Merchant Banking
A history of long-term value creation in the mid-cap segment
Public
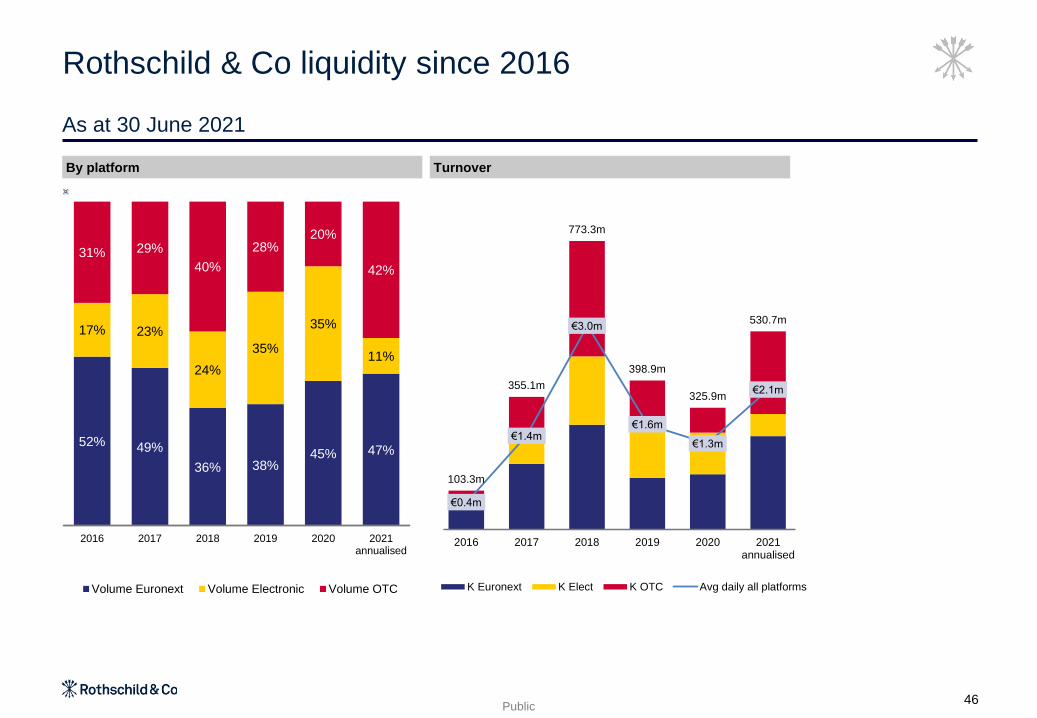
103.3m
355.1m
773.3m
398.9m
325.9m
530.7m
€0.4m
€1.4m
€3.0m
€1.6m
€1.3m
€2.1m
€0.0m
€0.5m
€1.0m
€1.5m
€2.0m
€2.5m
€3.0m
€3.5m
€4.0m
€4.5m
€5.0m
-
100.0m
200.0m
300.0m
400.0m
500.0m
600.0m
700.0m
800.0m
900.0m
2016 2017 2018 2019 2020 2021annualised
K Euronext K Elect K OTC Avg daily all platforms
Rothschild & Co liquidity since 2016
As at 30 June 2021
By platform Turnover
46
52% 49%
36% 38%45% 47%
17% 23%
24%
35%
35%
11%
31% 29%
40%
28%20%
42%
2016 2017 2018 2019 2020 2021annualised
Volume Euronext Volume Electronic Volume OTC
Public2
F
A
C
I
N
G
P
A
G
E
This presentation has been prepared solely for information purposes and must not be construed as or
considered as constituting or giving any investment advice. It does not take into account, in any way
whatsoever, the investment objectives, financial situation or specific needs of its recipients.
This presentation and its contents may not be copied or disseminated, in part or as a whole, without prior
written consent of Rothschild & Co.
This presentation may contain forward-looking information and statements pertaining to Rothschild & Co SCA
(“Rothschild & Co”), its subsidiaries (together, the “Rothschild & Co Group”) and its and their results. Forward-
looking information is not historical. It reflects objectives that are based on management’s current
expectations or estimates and is subject to a number of factors and uncertainties, that could cause actual
figures to differ materially from those described in the forward-looking statements including those discussed or
identified in the documentation publicly released by Rothschild & Co, including its annual report.
Rothschild & Co does not undertake to update such forward-looking information and statements unless
required by applicable laws and regulations. Subject to the foregoing, Rothschild & Co has no obligation to
update or amend such information and statements, neither as a result of new information or statements, nor
as a result of new events or for any other reason.
No representation or warranty whatsoever, express or implied, is made as to the accuracy, completeness,
consistency or the reliability of the information contained in this document. It may not be considered by its
recipients as a substitute to their judgment.
This presentation does not constitute an offer to sell or a solicitation to buy any securities.
This presentation is qualified in its entirety by the information contained in Rothschild & Co’ financial
statements, the notes thereto and the related annual financial report. In case of a conflict, such financial
statements, notes and financial reports must prevail. Only the information contained therein is binding on
Rothschild & Co and the Rothschild & Co Group. If the information contained herein is presented differently
from the information contained in such financial statements, notes and reports, only the latter is binding on
Rothschild & Co and the Rothschild & Co Group.
For more information on Rothschild & Co: www.rothschildandco.com
Disclaimer