Equity & Debt Strategy - Kotak Mahindra Bank · Equity & Debt Strategy Mid Aug –Sept’ 2017. ......
15
Equity & Debt Strategy Mid Aug – Sept’ 2017
Transcript of Equity & Debt Strategy - Kotak Mahindra Bank · Equity & Debt Strategy Mid Aug –Sept’ 2017. ......

Equity & Debt Strategy
Mid Aug – Sept’ 2017

Equity Market Update &
Equity MF Strategy

Confidential | 3
17,000
17,400
17,800
18,200
18,600
19,000
9,400
9,500
9,600
9,700
9,800
9,900
10,000
10,100
10,200
30-Jun-17 06-Jul-17 12-Jul-17 18-Jul-17 24-Jul-17 30-Jul-17
NIFTY Index Nsemcap index
Strong Earning of HDFC
Bank and Reliance
CPI falls to 1.54%
Cess on Cigarettes hiked
-2,243
10,023
3,965 3,764
-2,080-5,122
-2,587 -3,432
11,4089,425 9,165 8,255
-10,000
-5,000
0
5,000
10,000
15,000
Apr 17 May 17 Jun 17 Jul 17
FII DII MF
10.6%
8.2%7.4%
6.2% 5.9%4.4%
-1.4%
-3.8%-5.0%
0.0%
5.0%
10.0%
15.0%
Energy Bank Realty Infra IT Auto Pharma FMCG
Both Large and Mid Cap index did well in July Both FII and MFs continue to be net buyers
In July, NSE Energy index was up 10.6% while FMCG led
by ITC was down 3.8%
Source: Bloomberg, AMFI, KIE As of 31st July 2017 YoY% unless specified * Equity + ELSS + 65% of Balanced
cr
Monthly Inflows to Equity MF* continue to be strong
Rs. cr
12,078
14,06715,720
13,012
0
4,000
8,000
12,000
16,000
20,000
Mar 17 Apr 17 May 17 Jun 17
Nifty was up 6% in July post good results by HDFC Bank and Reliance
Confidential | 4
1.8 1.7
1.51.4
0.0
0.4
0.8
1.2
1.6
2.0
Mar 17 Apr 17 May 17 Jun 17
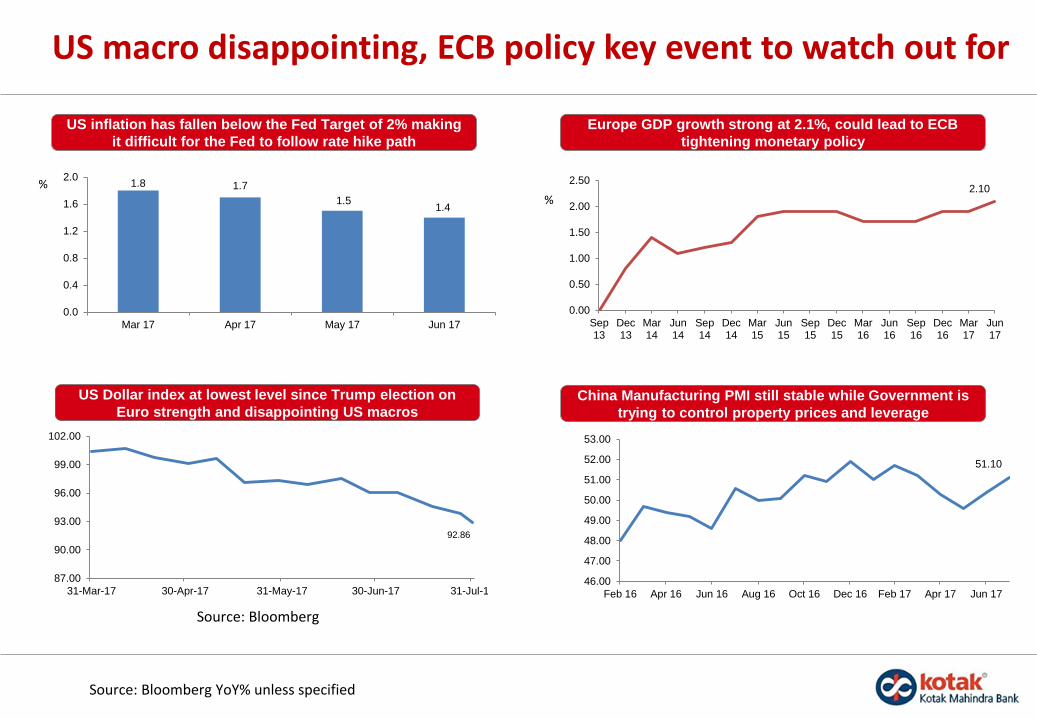
US macro disappointing, ECB policy key event to watch out for
US inflation has fallen below the Fed Target of 2% making
it difficult for the Fed to follow rate hike path
Europe GDP growth strong at 2.1%, could lead to ECB
tightening monetary policy
US Dollar index at lowest level since Trump election on
Euro strength and disappointing US macros
Source: Bloomberg
China Manufacturing PMI still stable while Government is
trying to control property prices and leverage
Source: Bloomberg YoY% unless specified
2.10
0.00
0.50
1.00
1.50
2.00
2.50
Sep13
Dec13
Mar14
Jun14
Sep14
Dec14
Mar15
Jun15
Sep15
Dec15
Mar16
Jun16
Sep16
Dec16
Mar17
Jun17
92.86
87.00
90.00
93.00
96.00
99.00
102.00
31-Mar-17 30-Apr-17 31-May-17 30-Jun-17 31-Jul-17
51.10
46.00
47.00
48.00
49.00
50.00
51.00
52.00
53.00
Feb 16 Apr 16 Jun 16 Aug 16 Oct 16 Dec 16 Feb 17 Apr 17 Jun 17
%%

Confidential | 5
Government has accelerated expenditure, Infra and Agri to benefit
115.7
37.7
92.4
0.0
20.0
40.0
60.0
80.0
100.0
120.0
140.0
Mar 17 Apr 17 May 17
0.3
7.3
11.9
4.0
10.0
14.7
8.6
-11.2-15.0
-10.0
-5.0
0.0
5.0
10.0
15.0
20.0
Mar 17 Apr 17 May 17 Jun 17
2W Sales Passenger Vehicle Sales
Government has frontloaded its capex leading to
substantially higher expenditure
2 Wheeler sales were less impacted by GST reflecting
strong rural demand
Source: Nomura, KIE, CS, DB YoY% unless specified
Higher expenditure focussed on Agri, food procurement
of Rabi crops substantially increased to support farmers
42,351
15,162
85,925
25,133
0
20,000
40,000
60,000
80,000
100,000
Ministry of Consumer, Food and PublicDistribution
Ministry of Chemicals and Fertilizers
Apr-May 2017 Apr-May 2018
Both FII and MF have been increasing their exposure in
mid-small cap stocks
35.00%
40.00%
45.00%
50.00%
55.00%
60.00%
Mar-16 Jun-16 Sep-16 Dec-16 Mar-17
FII MF
% of Portfolio in non Top 30 stocksRs. cr
%

Confidential | 6
Rest of the economy still struggling
82% of the stocks are trading above their 200 Day daily
moving average
Source: KIE, CS, Morgan Stanley YoY% unless specified
Low inventory levels across sectors could be a new
normal post GST which will hurt manufacturing this year
0%
10%
20%
30%
40%
50%
60%
70%
80%
90%
100%
2007 2008 2009 2010 2011 2012 2013 2014 2015 2016 2017
0
10
20
30
40
50
30-Apr-17 31-May-17 07-Jun-17 14-Jun-17 21-Jun-17 28-Jun-17 07-Jul-17
Days of inventory - Pharma
27.2
17.9
8.3
4.4
0.0
5.0
10.0
15.0
20.0
25.0
30.0
Mar 17 Apr 17 May 17 Jun 17
Exports Growth has started to slow down due to INR
strength
Manufacturing PMI hits 8 year low on GST disruption, new
orders also contracted
52.5 52.551.6
50.9
47.9
53.6 53.8 52.6
51.3
46.2
42.0
44.0
46.0
48.0
50.0
52.0
54.0
56.0
Mar 17 Apr 17 May 17 Jun 17 Jul 17
India PMI - Manufacturing PMI New Orders

Confidential | 7
Earnings and Valuation –Liquidity and Hope of strong Earnings growth in FY17-18 has led to slightly expensive valuations
Nifty at 18.2x Bloomberg one year forward earnings
estimate, Mid Caps at premium vs historic level
MSCI India P/E Premium over MSCI EM is still close to
long term average
Nifty Q12018 EPS is expected to fall by 5%, Pharma has
disappointed while Energy has done well
Banking and Automobile sector to lead Earnings growth in
coming next 2 Fiscal Years
Source: Bloomberg, KIE Estimates Outperformed if PAT>1.05x Expected, Underperformed if PAT<0.95 of expectedYoY% unless specified, ^ CY17-18
12
8
12
18
Outperformed Underperformed As Expected Not Released
12M Forward
PE
41%
34%
36%
38%
40%
42%
44%
46%
Mar 17 Apr 17 May 17 Jun 17 Jul 17
0
10
20
30
40
50
0
5
10
15
20
25
30
35
40
45
Automobiles Banking Consumers Energy Pharma Techology Nifty 50 Nifty 50 (ex-energy)
Earnings Growth FY19E P/2019E
% x
18.219.6
15.1 15.3
0.0
5.0
10.0
15.0
20.0
25.0
Large Cap Mid Cap
Current 12M Forward PE 5 Year Average
7.7%
1.3%
5 Year Average

Confidential | 8
Key Triggers – GST Implementation and Monsoon
• Global Economic data : World economy improving. Expectation of fiscal stimulus from Republican Government
• Lower Domestic Interest rates: Many Banks have cut their MCLR sharply which should help in reviving credit demand
• Resolution of NPA: Effective addressal by government of NPA issue in Indian Banks
Positive Triggers
• US Policies: Revival of Trump/Reflation trade could lead to EM outflows again
• Earnings: Consensus expected earnings growth for domestic equities is high at around 20%, any downgrade would make the valuations more expensive
• GST implementation: Demand revival getting delayed post GST
• Geo-Political Risk: Political uncertainty in UK, Germany, Netherland
• Monetary Policy: Faster than expected monetary tightening in Europe and US
Risks

Confidential | 9
India Equities: Valuations & Strategy – Maintain Neutral Stance
At current levels of approx. 9711 (11th August, 2017), Nifty is trading at a 1 year forward PE of 19.1X. Also the ratio of potential upside to downside is biased towards downside at current valuations.
Risk-Reward Scenario based on earnings growth & valuations:
New Deployments:
Equities continue to rally to life time highs on theback of foreign and domestic liquidity. RuralConsumption and Government spending hasstarted to show signs of uptick, although mostdomestic indicators are struggling due to dualimpact of Demonetization and now GST. Post RBI’s25bps rate cut in the August policy, we see furtherpolicy action dependent on the inflation trajectory.
Mutual Funds: As domestic liquidity continues todrive markets, we advise new investments inMutual Funds to be deployed 25% in lumpsumand subsequent in tranches via SIPs/STPs
On a risk-reward basis we continue to maintain Neutral stance
• Recommended allocation within equity mutual funds is as under:
• 100% Large Cap allocation (Prefer Large Caps due to relatively Favorable Valuations)
• This allocation to Large caps can also be taken through Opportunistic Funds which currently have a bias towards Large cap
• For investors who want equity exposure but have low appetite for volatility, they can take equity exposure through
Balanced Funds. Balanced funds have 20% to 30% allocated to Debt which provides cushion to the portfolio return during
market volatility.
Source: EPS Estimates by KIE
Nifty @ 9711 Fwd PE(X)Fwd EPS Estimate
Estimate Target
Nifty Level% Upside / Downside
1 Year Upside 18 588 Q4-FY19 10,584 8.99%
Downside 16 508 Q1-FY19 8,128 -16.30%

Debt Market Update &
Debt MF Strategy

Confidential | 11
Indicators
Policy Action
• RBI cuts Repo rate by 25 bps in August policy
• Further rate cuts will depend on inflation trajectory
• One member pushed for 50 bps cut
Inflation
• CPI came at all time low of 1.54% in June 2017
• RBI expects CPI to be little over 4% by March 2018
• We expect CPI to remain below 2% in July 2017
10 Year G-Sec Benchmark Yield
• 10 Yr yield likely to remain in range
• 6.35% – 6.55% range likely in near future
Liquidity
• Liquidity surplus still at Rs. 2.9 trn
• RBI will do one more Rs. 10,000 cr of OMO sale
• RBI is timing OMOs gradually
INR
• Appreciated to 63.7
• Likely to remain in a range
Key Risks
• US policies; Fed hikes; Global monetary tightening
• Impact of 7CPC HRA allowance implementation on CPI
• State and PSU implementation of 7CPC
• Farm loan waivers can impact fiscal deficit by 1% to 1.3% of GDP
G-Sec Supply
• The gross G-Sec supply to be Rs. 5.8 trn
• SDL issuance of Rs. ~4 trn+ expected; QFY18
issuance expected to be Rs. ~1.2 trn
Debt Market: Key Variables

Confidential | 12Source: Bloomberg
As of 3rd Aug 2017
RBI cuts repo rate by 25 bps - Expects inflation to bounce back in H2
1.54%
3.72%
Aug16
Sep16
Oct16
Nov16
Dec16
Jan17
Feb17
Mar17
Apr17
May17
Jun17
0.00%
1.00%
2.00%
3.00%
4.00%
5.00%
6.00%
Inflation at a all time low, core inflation also below 4%
CPI
Core Inflation
2,811
0
1,000
2,000
3,000
4,000
01 03 05 07 09 11 13 15 17 19 21 23 25 27 29 31
Am
ou
nt
in R
s. B
n
Liquidity remains high as RBI going slow with OMO Sales
43
6.43
6.00
0
10
20
30
40
50
60
70
80
6.00
6.50
7.00
7.50
8.00
Spre
ad (
bp
s)
% Y
ield
Benchmark yield didn’t move much as 25bps was mostly factored in by the market
Spread 10 Year G Sec Repo Rate
* Avg Spread over Repo in Falling rate regime – 61 bpsAverage Spread over Repo in Rising rate regime – 71 bps
-16
-11
-15 -15-16 -17
-8
6.43
-20
-15
-10
-5
0
5.60
6.00
6.40
6.80
7.20
1Y 2Y 3Y 4Y 5Y 8Y 10Y
Sp
read
(b
ps
)
% Y
ield
Bonds rallied on inflation data and strong FII buying
Change Current G-Sec Yield 1M earlier G-Sec Yield

Confidential | 13
FII flows continue to be robust on back of strong macros
63.71
Sep16
Oct16
Nov16
Dec16
Jan17
Feb17
Mar17
Apr17
May17
Jun17
Jul 17 Aug17
60.00
64.00
68.00
72.00
INR has appreciated to 63.7 level
Source: Bloomberg
As of 31st July 2017
2,894
Dec 16 Jan 17 Feb 17 Mar 17 Apr 17 May 17 Jun 17 Jul 17
-4,000
-3,000
-2,000
-1,000
0
1,000
2,000
3,000
4,000
5,000
US
D M
illi
on
FIls continue to pour money in debt
52.72
Nov 16 Dec 16 Jan 17 Feb 17 Mar 17 Apr 17 May 17 Jun 17 Jul 17
30
35
40
45
50
55
60
65
70
Crude bounces back above 50 level
Brent
$/bbl
99.3%
99.8%
Aug16
Sep16
Oct16
Nov16
Dec16
Jan17
Feb17
Mar17
Apr17
May17
Jun17
Jul 17
60.0%
70.0%
80.0%
90.0%
100.0%FII Debt Utilization has increased substantially and
is almost 100%
Government Corporate

Confidential | 14
India Fixed Income: Strategy
Substantial part of the portfolio should to be played through a mix of high rated and credit accrual strategies. Exit from duration funds only for investors who have completed 3 years and can deploy with another 3 years view.
Investment Focus:
Passive Accrual-Oriented Debt funds
High quality portfolios (~100% AAA / Sovereign) Portfolio is run on a passive accrual basis i.e buying a bond and holding it till maturity thereby earning from the accruing of
interest Higher predictability of return, lower volatility & lower interest rate risk
High Yield Credit-Oriented Funds
Low volatility on account of maturity of portfolio between 3 – 5 years, attractive and stable accrual yields Experienced teams to carefully evaluate and tightly monitor high yielding debt instruments
Short Term Bond Funds
Actively managed to run a low avg. maturity of 2-3 years, attractive risk-reward Lower volatility and interest rate risk than Dynamic Bond Funds, better suited from a risk-adjusted basis in volatile markets
Continue to recommend ultra short term relative to liquid funds (up to 3 Months)For short term parking of funds for a minimum of 6 months, Arbitrage funds preferred over ultra short term funds on back of better tax adjusted returns
Source : AMCs, other Financial websites
Confidential | 15
DisclaimerThe aforesaid is for information purposes only and should not be construed to be investment advice under SEBI (Investment Advisory) Regulations.
In the preparation of the material contained in this document, Kotak Mahindra Bank has used information that is publicly available, including information developed in-house. Some of the material used in the document may have been obtained from members/persons other than the Kotak Mahindra Bank and/or its affiliates and which mayhave been made available to Kotak Mahindra Bank and/or its affiliates. Information gathered & material used in this document is believed to be from reliable sources. KotakMahindra Bank however does not warrant the accuracy, reasonableness and/or completeness of any information. For data reference to any third party in this material nosuch party will assume any liability for the same. Kotak Mahindra Bank and/or any affiliate of Kotak Mahindra Bank does not in any way through this material solicit any offerfor purchase, sale or any financial transaction/commodities/products of any financial instrument dealt in this material. All recipients of this material should before dealingand or transacting in any of the products referred to in this material make their own investigation, seek appropriate professional advice
We have included statements/opinions/recommendations in this document which contain words or phrases such as "will", "expect" "should" and similar expressions orvariations of such expressions, that are "forward looking statements". Actual results may differ materially from those suggested by the forward looking statements due torisks or uncertainties associated with our expectations with respect to, but not limited to, exposure to market risks, general economic and political conditions in India andother countries globally, which have an impact on our services and / or investments, the monetary and interest policies of India, inflation, deflation, unanticipatedturbulence in interest rates, foreign exchange rates, equity prices or other rates or prices, the performance of the financial markets in India and globally, changes indomestic and foreign laws, regulations and taxes and changes in competition in the industry. By their nature, certain market risk disclosures are only estimates and could bematerially different from what actually occurs in the future. As a result, actual future gains or losses could materially differ from those that have been estimated
Kotak Mahindra Bank (including its affiliates) and any of its officers directors, personnel and employees, shall not liable for any loss, damage of any nature, including but notlimited to direct, indirect, punitive, special, exemplary, consequential, as also any loss of profit in any way arising from the use of this material in any manner. The recipientalone shall be fully responsible/ are liable for any decision taken on the basis of this material. The investments discussed in this material may not be suitable for all investors.Any person subscribing to or investing in any product/financial instruments should do so on the basis of and after verifying the terms attached to such product/financialinstrument. Financial products and instruments are subject to market risks and yields may fluctuate depending on various factors affecting capital/debt markets. Please notethat past performance of the financial products and instruments does not necessarily indicate the future prospects and performance thereof. Such past performance mayormay not be sustained in future. Kotak Mahindra Bank (including its affiliates) or its officers, directors, personnel and employees, including persons involved in thepreparation or issuance of this material may; (a) from time to time, have long or short positions in, and buy or sell the securities mentioned herein or (b) be engaged in anyother transaction involving such securities and earn brokerage or other compensation in the financial instruments/products/commodities discussed herein or act as advisoror lender / borrower in respect of such securities/financial instruments/products/commodities or have other potential conflict of interest with respect to anyrecommendation and related information and opinions. The said persons may have acted upon and/or in a manner contradictory with the information contained here. Nopart of this material may be duplicated in whole or in part in any form and or redistributed without the prior written consent of Kotak Mahindra Bank. This material is strictlyconfidential to the recipient and should not be reproduced or disseminated to anyone else
This material is not a research report as per the SEBI (Research Analyst) Regulations, 2014.
Mutual Fund investments are subject to market risks, read all scheme related documents carefully.