
Equity & Debt Strategy - Kotak Mahindra Bank · pick up in 2014. Asia to be flattish. US growth was...
29
Equity & Debt Strategy Mid Mar - Apr ‘14
Transcript of Equity & Debt Strategy - Kotak Mahindra Bank · pick up in 2014. Asia to be flattish. US growth was...
Equity & Debt Strategy Mid Mar - Apr ‘14
2
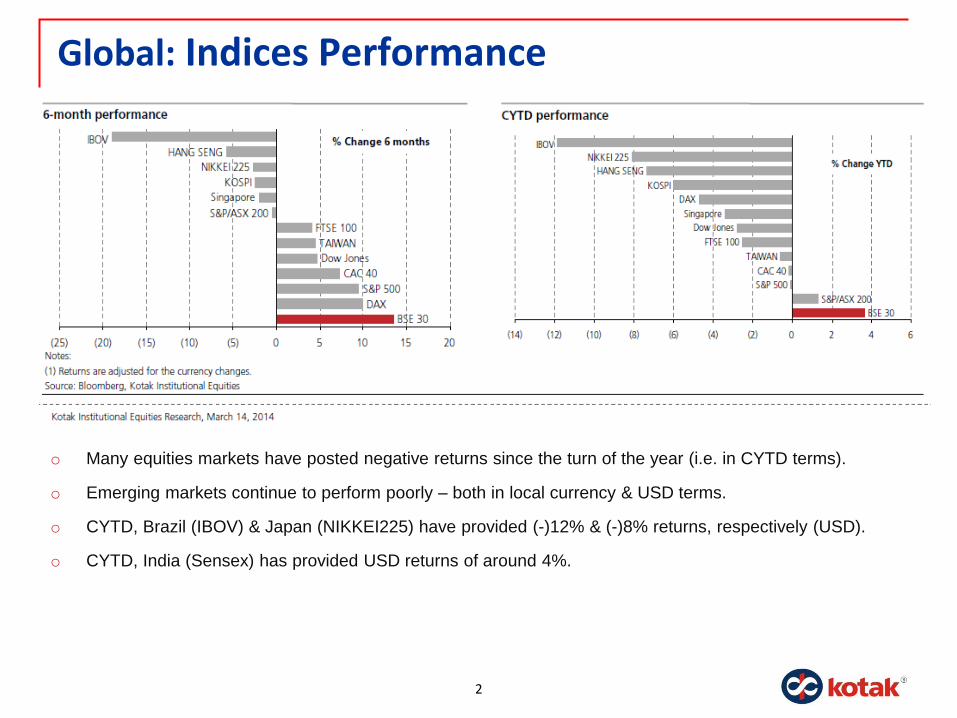
Global: Indices Performance
o Many equities markets have posted negative returns since the turn of the year (i.e. in CYTD terms).
o Emerging markets continue to perform poorly – both in local currency & USD terms.
o CYTD, Brazil (IBOV) & Japan (NIKKEI225) have provided (-)12% & (-)8% returns, respectively (USD).
o CYTD, India (Sensex) has provided USD returns of around 4%.

3
India: Sectoral Performance
o Technology (up 19%) & Pharma (up 19%) have seen maximum outperformance in last one year. Worst
relative performance in the last one year is seen in Utilities (-28%) & Metals (-19%).
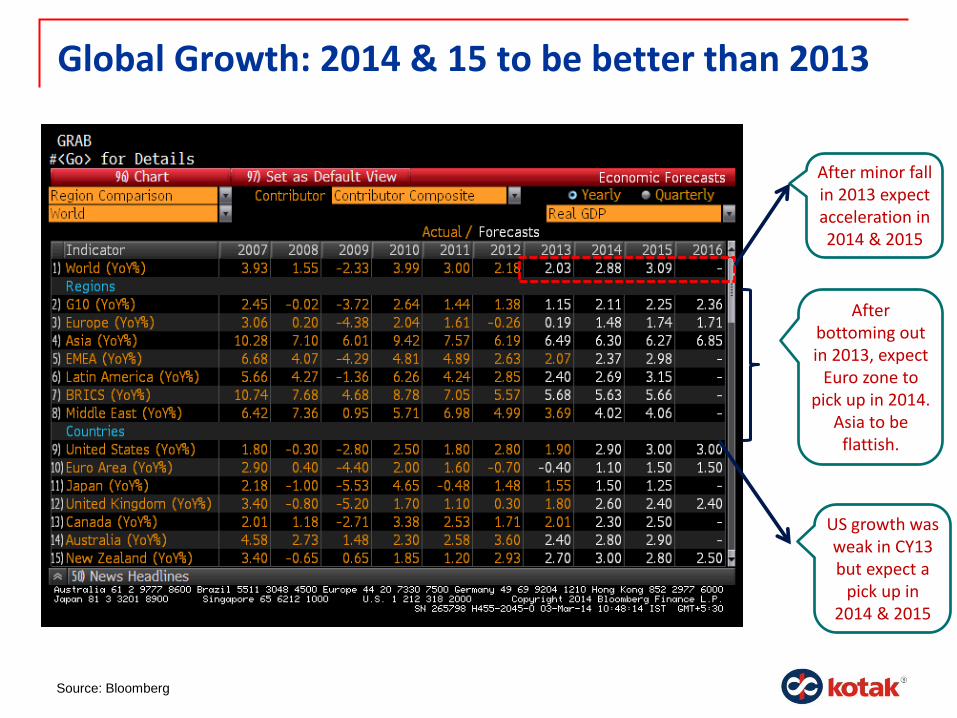
Global Growth: 2014 & 15 to be better than 2013
Source: Bloomberg
After minor fall in 2013 expect acceleration in 2014 & 2015
After bottoming out in 2013, expect
Euro zone to pick up in 2014.
Asia to be flattish.
US growth was weak in CY13 but expect a
pick up in 2014 & 2015
5
International: News o Fed Chairman Janet Yellen pledged to maintain scaling back of stimulus in “measured steps”. Fed has cut the
pace of bond buying program by USD 10 bn each in Dec'13 & Jan'14.
o Fed has backed away from their year-old commitment to consider raising interest rates when unemployment falls
below 6.5%. With joblessness falling faster, Fed could soon revise its guidance on keeping the rates at record-
low.
o US factories expansion was at an 8-month low as colder winter weather slowed demand & production halting
recent momentum. The Institute for Supply Management‟s factory index decreased to 51.3, from 56.5 the prior
month.
o The ECB and Bank of England kept their main interest rates unchanged. ECB pledged to keep interest rates „at
present or lower levels for an extended period of time‟.
o EU inflation in Feb'14 exceeded forecasts, easing pressure on the ECB to take action. Consumer prices grew
0.8%, the same pace as in the previous two months. The unemployment rate was at a near-record of 12% in
Jan'14.
o Gauges of EU manufacturing & German business confidence are at the highest levels in 2.5 years. An ECB
survey showed EU banks expect to stop tightening corporate credit standards this quarter which could help
rekindle lending.
o U.K. inflation unexpectedly slowed to 1.9% (2% in Dec'13), below the BoE's 2% target for the first time since
Nov'09. BoE forecasts inflation to remain close to its goal over next 3 years. U.K. unemployment unexpectedly
rose to 7.2% in Q4 (from 7.1% earlier), reinforcing the case for BoE to keep its interest rate at a record low.
o China, the largest foreign U.S. creditor, reduced its holdings of U.S. Treasury debt in Dec'13 by USD 47.8 bn
(3.6%), to USD 1.27 tn, the most in two years. At the same time, international investors increased holdings by
USD 78 bn (1.4%) in Dec'13, pushing foreign holdings to a record USD 5.79 tn of total USD 11.9 tn.
o Kazakhstan devalued its currency, the Tenge by ~19% due to Fed tapering-lead capital outflows. This follows a
5.4% weakening of Russia‟s Rubble this year.
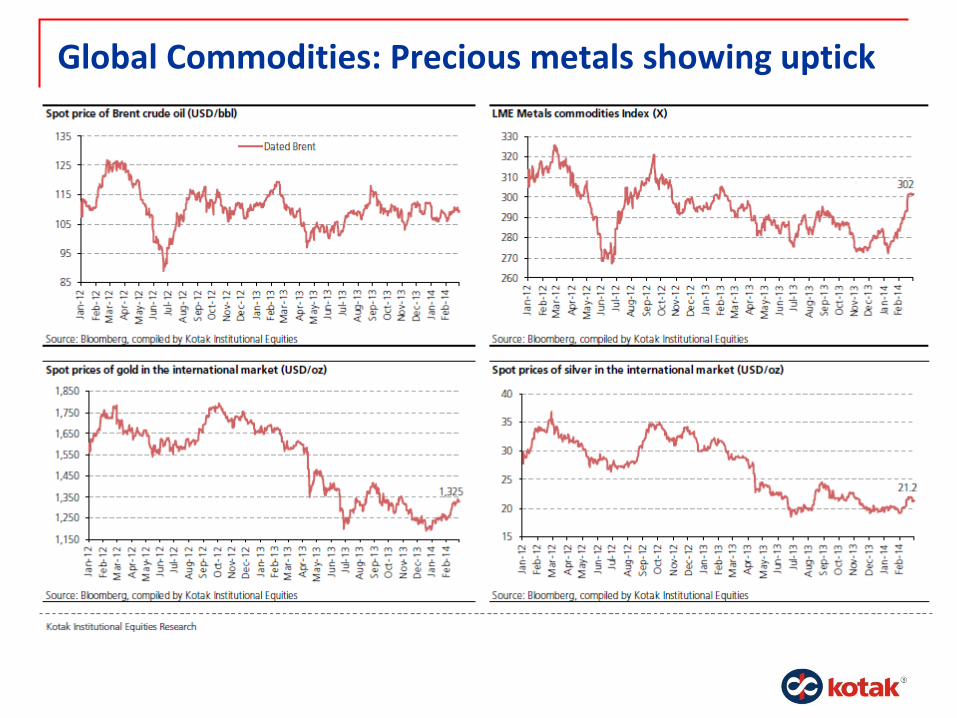
Global Commodities: Precious metals showing uptick
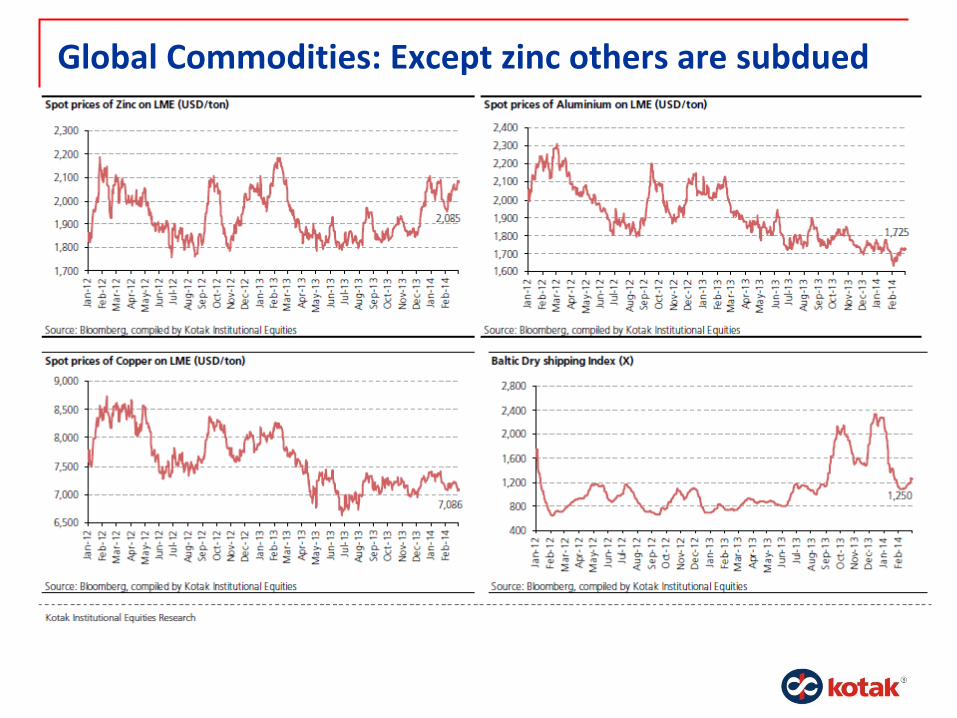
Global Commodities: Except zinc others are subdued
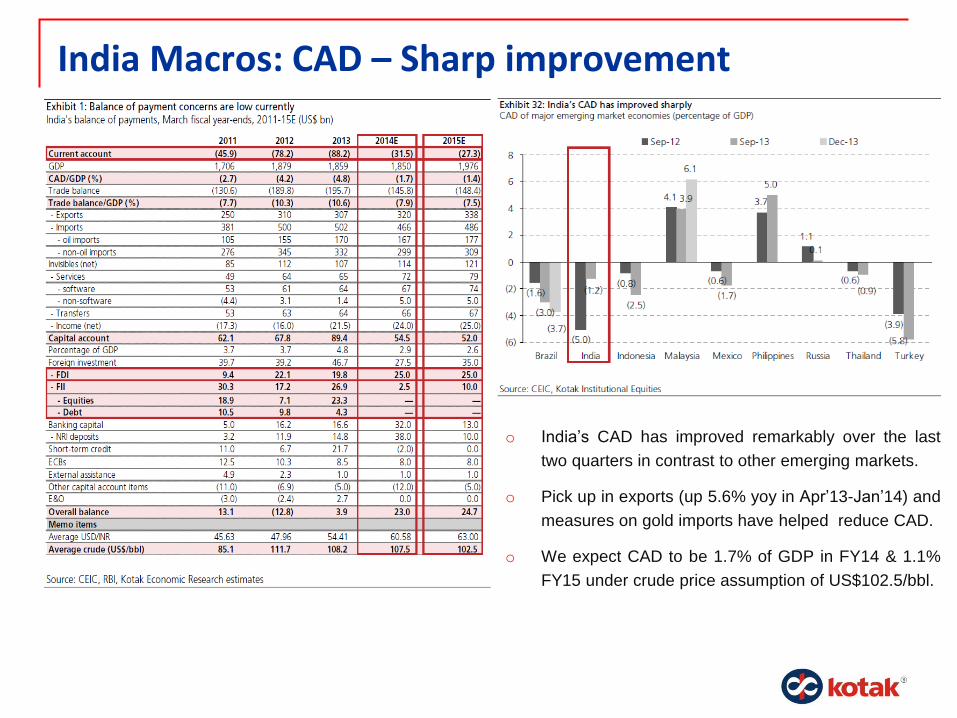
India Macros: CAD – Sharp improvement
o India‟s CAD has improved remarkably over the last
two quarters in contrast to other emerging markets.
o Pick up in exports (up 5.6% yoy in Apr‟13-Jan‟14) and
measures on gold imports have helped reduce CAD.
o We expect CAD to be 1.7% of GDP in FY14 & 1.1%
FY15 under crude price assumption of US$102.5/bbl.
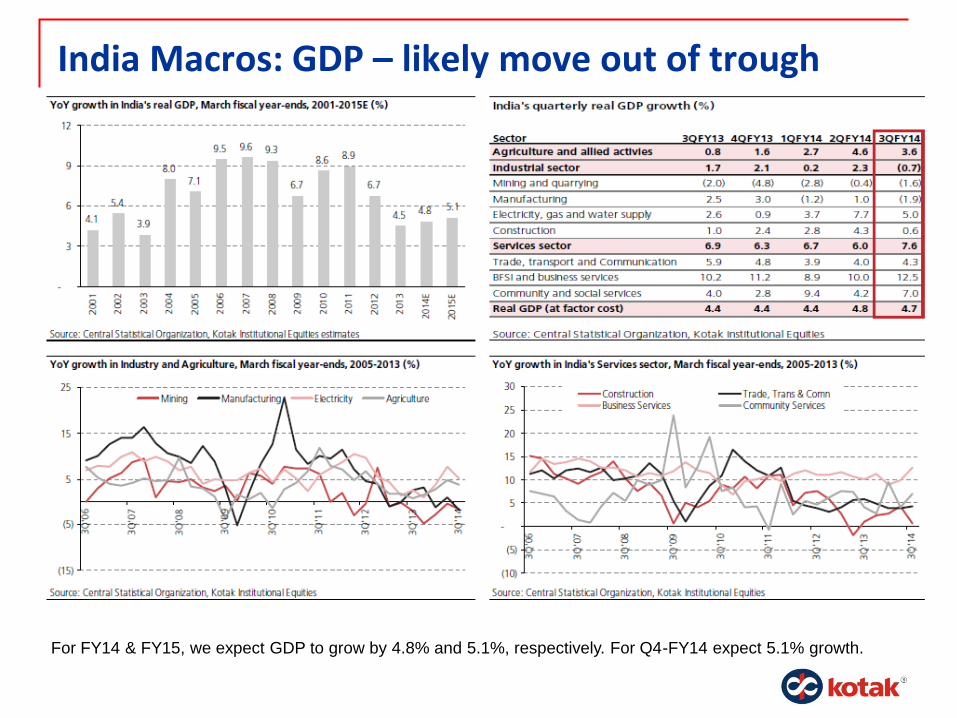
India Macros: GDP – likely move out of trough
For FY14 & FY15, we expect GDP to grow by 4.8% and 5.1%, respectively. For Q4-FY14 expect 5.1% growth.
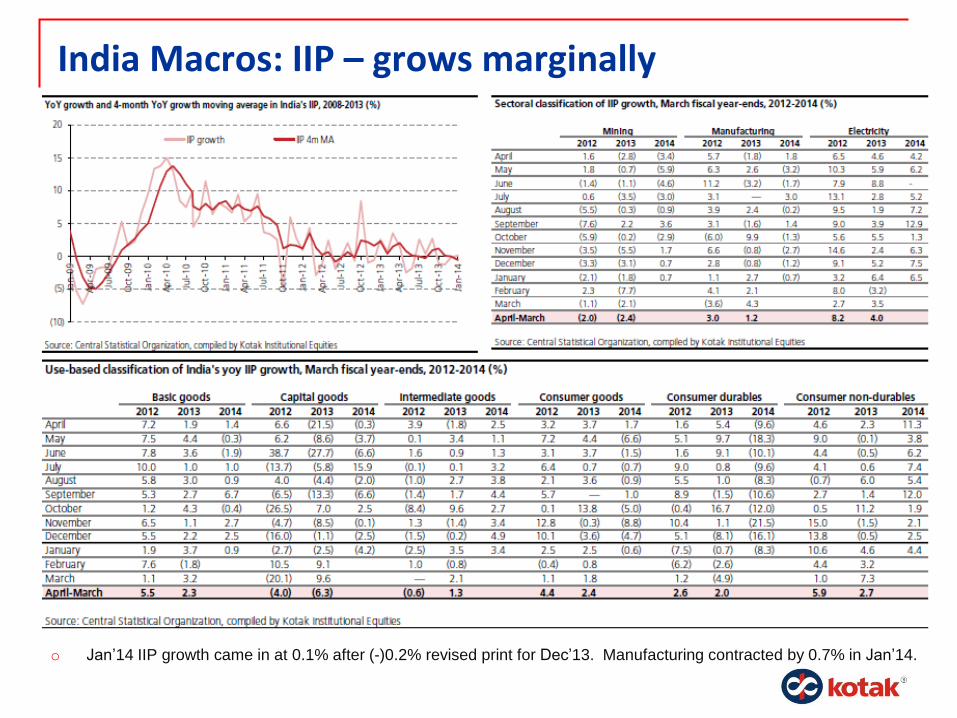
India Macros: IIP – grows marginally
o Jan‟14 IIP growth came in at 0.1% after (-)0.2% revised print for Dec‟13. Manufacturing contracted by 0.7% in Jan‟14.
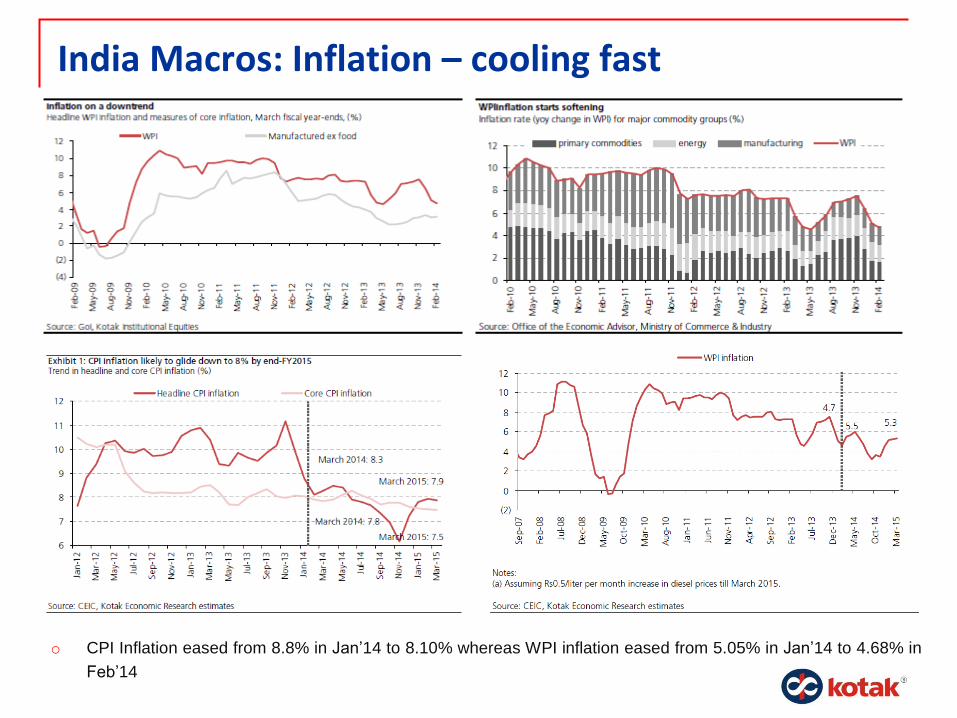
India Macros: Inflation – cooling fast
o CPI Inflation eased from 8.8% in Jan‟14 to 8.10% whereas WPI inflation eased from 5.05% in Jan‟14 to 4.68% in
Feb‟14

Earnings: FY15E Sensex earnings to be broad based
o KIE expects Net Profit of Sensex (i.e. BSE-30) to grow at 10% & 15.6% in FY14 & FY15, respectively
o FY14 Net profits are largely driven by outsourcing sectors that have benefited from the steep INR depreciation
o FY15 Net Profits is expected to be broad based with only Industrials likely to show a de-growth.
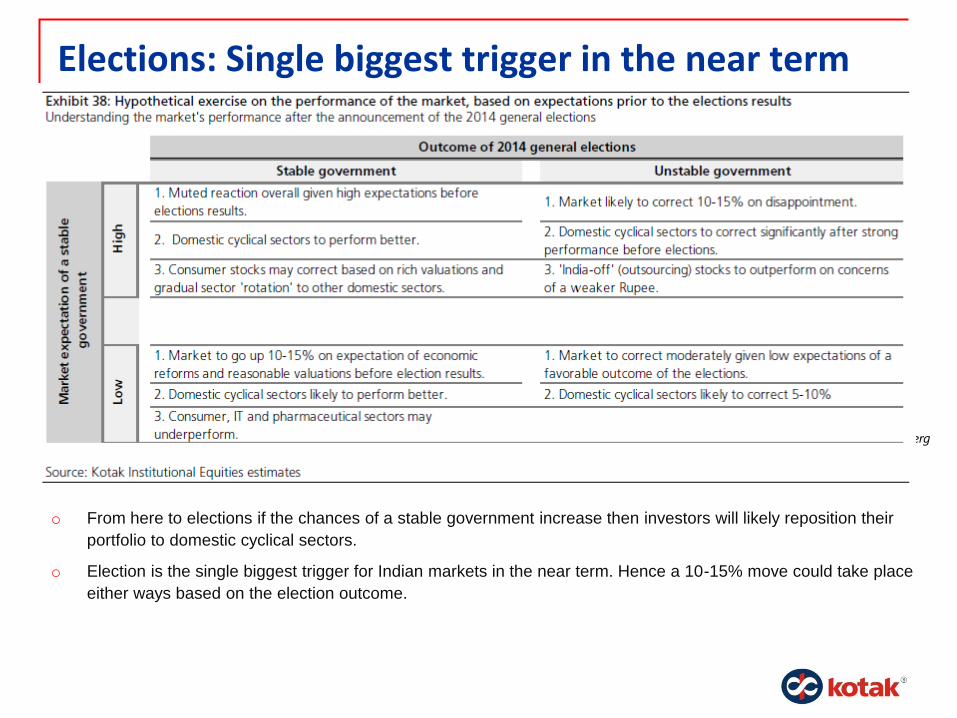
Elections: Single biggest trigger in the near term
o From here to elections if the chances of a stable government increase then investors will likely reposition their
portfolio to domestic cyclical sectors.
o Election is the single biggest trigger for Indian markets in the near term. Hence a 10-15% move could take place
either ways based on the election outcome.
Source: Bloomberg
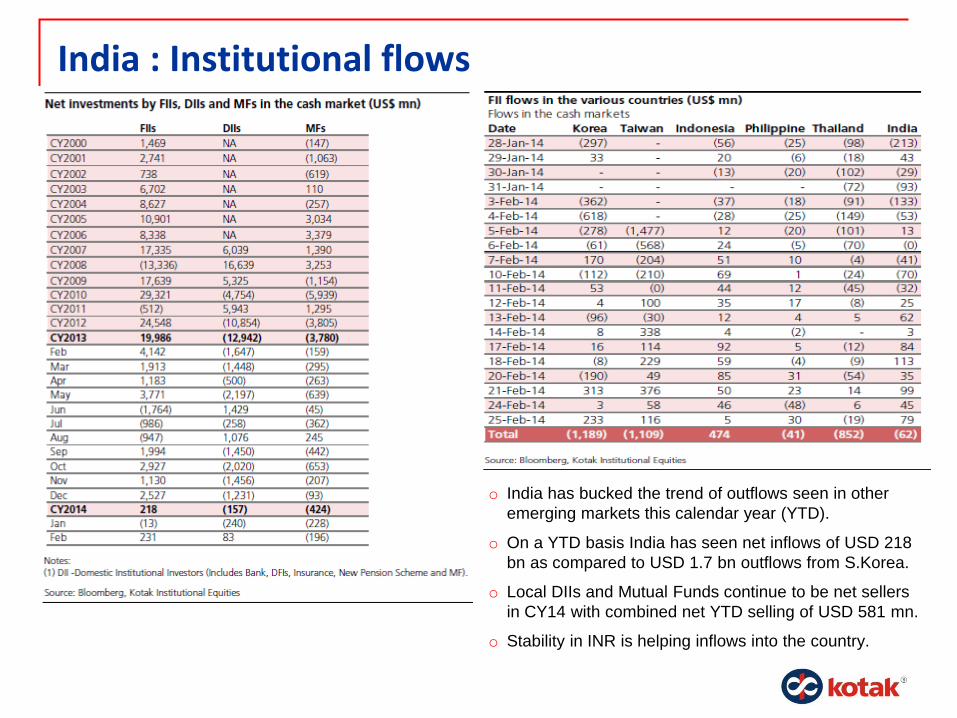
India : Institutional flows
o India has bucked the trend of outflows seen in other
emerging markets this calendar year (YTD).
o On a YTD basis India has seen net inflows of USD 218
bn as compared to USD 1.7 bn outflows from S.Korea.
o Local DIIs and Mutual Funds continue to be net sellers
in CY14 with combined net YTD selling of USD 581 mn.
o Stability in INR is helping inflows into the country.
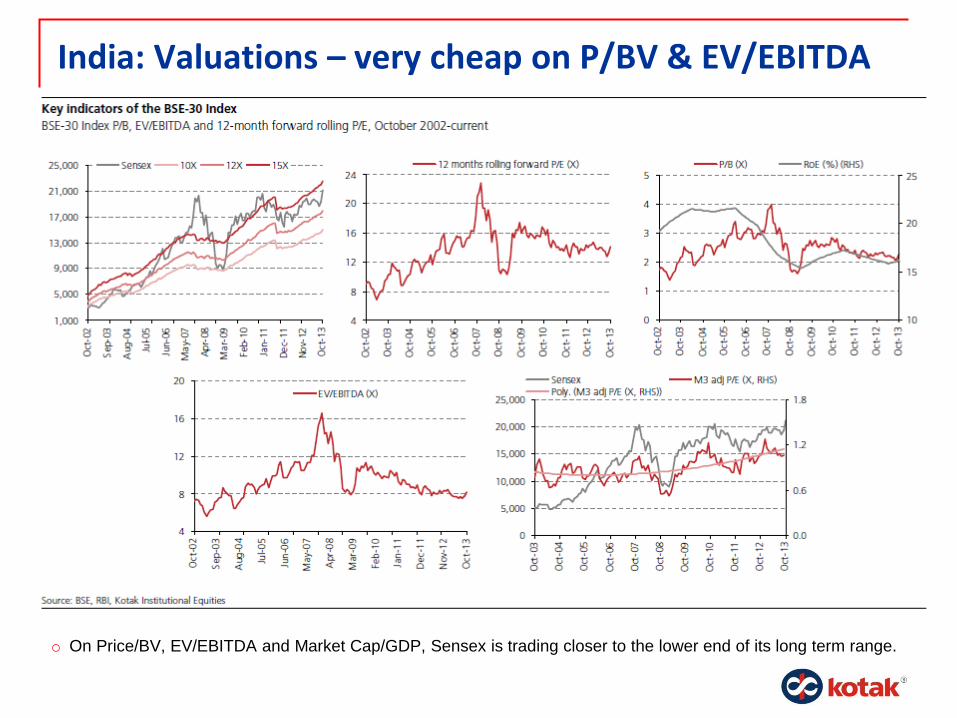
India: Valuations – very cheap on P/BV & EV/EBITDA
o On Price/BV, EV/EBITDA and Market Cap/GDP, Sensex is trading closer to the lower end of its long term range.

India: Nifty Parameters – on trailing basis
o On all valuation parameters Nifty is trading way below its 5 & 10 Year average.
o Except for PE ratio, all other valuation parameters are trading at ~25-30% discount to their 10 year averages.
o The negatives for Nifty are: sharp rise in debt/Equity ratio; fall in RoE and RoCE.
Source: Bloomberg
Field CY 04 CY 05 CY 06 CY 07 CY 08 CY 09 CY 10 CY 11 CY 12 CY 13 CY 14E CY 15E 5 Yr Avg 10 Yr Avg
Price/Earnings 13.6 17.1 17.7 21.9 11.7 23.5 20.2 13.9 16.0 16.2 15.1 12.9 16.6 17.2
Price/Cashflow 8.7 11.8 18.5 22.7 8.8 14.3 13.8 12.1 19.5 13.3 10.7 9.3 14.7 14.3
Price/Sales 1.8 2.3 2.5 3.6 1.5 2.6 2.6 1.6 1.8 1.9 1.4 1.3 1.9 2.2
Price/EBITDA 9.3 10.0 12.8 14.7 6.5 11.0 11.3 7.7 9.1 8.5 7.7 6.7 9.1 10.1
Price/Book Value 3.3 4.0 4.6 5.8 2.2 3.5 3.5 2.4 2.7 2.5 2.3 2.1 2.8 3.4
EV/Sales 2.0 2.5 2.6 3.8 1.8 3.1 3.1 2.0 2.3 2.3 1.7 1.6 2.4 2.5
EV/EBITDA 10.2 10.6 13.4 15.5 7.7 13.1 13.5 9.7 11.3 10.4 9.4 8.2 11.2 11.5
Dividend Payout ratio 24.5 26.6 23.4 20.0 21.9 21.6 22.3 22.8 22.5 23.6 22.8 22.9
Dividend Yield 1.9 1.6 1.3 0.8 1.8 1.0 1.2 1.6 1.5 1.5 1.7 1.9 1.5 1.4
Trailing 12M EBITDA Margin 19.1 23.2 19.1 24.3 22.9 23.2 22.6 20.5 19.9 21.7 21.2 21.7
Profit Margin 13.0 13.4 13.5 16.0 12.2 11.2 12.4 11.3 11.0 11.0 11.4 12.5
Return on assets 5.1 5.5 6.3 7.4 5.4 3.4 3.9 3.6 3.4 3.1 5.5 5.9 3.5 4.7
Return on Equity 26.1 26.1 28.3 29.4 21.8 17.2 18.0 17.7 17.5 16.4 17.4 17.7 17.4 21.8
Return on cap. 15.2 15.6 17.0 18.0 13.5 8.9 9.5 9.6 8.7 9.0 9.2 12.5
Total Debt to EV 0.2 0.2 0.2 0.1 0.3 0.3 0.3 0.4 0.4 0.4 0.3 0.3
Total Debt to Total Equity 80.9 70.1 71.3 73.2 77.2 108.1 107.7 114.1 120.2 106.9 112.2 93.0
Debt to assets 16.2 15.1 17.1 18.9 20.4 22.6 23.6 22.8 22.8 21.3 22.6 20.1
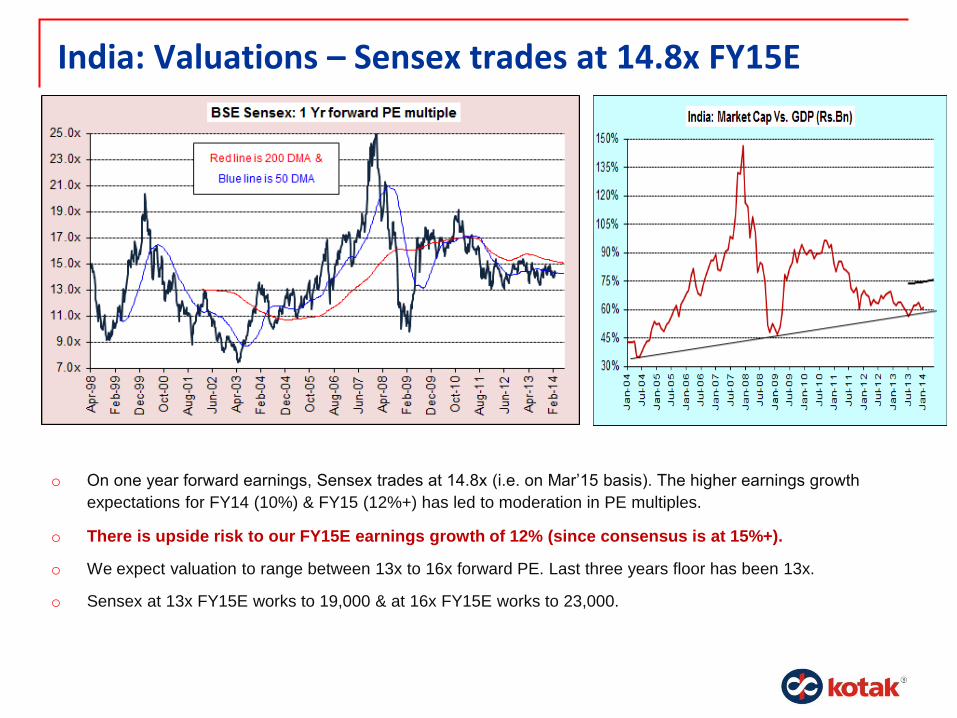
India: Valuations – Sensex trades at 14.8x FY15E
o On one year forward earnings, Sensex trades at 14.8x (i.e. on Mar‟15 basis). The higher earnings growth
expectations for FY14 (10%) & FY15 (12%+) has led to moderation in PE multiples.
o There is upside risk to our FY15E earnings growth of 12% (since consensus is at 15%+).
o We expect valuation to range between 13x to 16x forward PE. Last three years floor has been 13x.
o Sensex at 13x FY15E works to 19,000 & at 16x FY15E works to 23,000.
Outlook: Neutral on equities Earnings visibility and improvement in quality of earnings gives us comfort
o We are comfortable on the earnings growth trajectory for FY14 & FY15E since 75% of Nifty companies provide
good visibility. Quality of earnings in terms of margins has turned out to be better in the last two quarters.
Earnings seemed to have bottomed leaving scope for operating leverage to play out in future
o Earnings seemed to have bottomed out but economy may take another 2-3 quarters to bottom out. Soft
commodity prices and higher utilization levels can provide pricing power to corporates thereby leading to higher
operating margins.
Nifty trades at ~25-30% discount to its 10 year averages on most valuation parameters
o On most parameters ranging from PE ratio, Price/BV, EV/EBITDA to Market Cap/GDP, Nifty is trading below its 5
& 10 year averages. Excluding P/E ratio on most parameters, Nifty trades at ~25-30% discount to its 10 year
average.
Global revival in capital expenditure and increased M&A activity bodes well for equities
o Unlike last three years when corporates spent huge sums on buy backs this year they are allocating more money
towards Capex. M&A activity has picked up and is likely to escalate further in CY14. Both these signs are good
for equities.
Sensex has taken support at 13x forward PE in the last 3 years (translates to 19,000 on the Sensex)
o In the worst of times, Sensex has not traded below 13x forward PE in the last three years. Hence, at 13x forward
PE the Sensex floor moves up to 19,000 on FY15E. In case of a stable government, the PE range can shift to
15-18x which can translate into Sensex level of 25,000 in one year and 28,000 in two years (CAGR of 18%).
All parameters affecting Indian equity markets have seen improvement in the last four months
o Various parameters affecting Indian equities have seen improvement in the last four months . (i.e. Global GDP
growth, Global PMIs, Fed Tapering, currency, twin deficits, earnings visibility, valuations, FII flows & Politics).
Only factor that is negative is high interest rates, which seems to have peaked out given the fall in inflation.

India: Key risks
o Unknown risks like sharp currency devaluation or sharp hike in interest rates by specific countries
o Global rally has been mainly fueled by liquidity which can turn less benign due to Fed Tapering.
o Any major deviation in stance taken by Central Banks could impact equities (i.e. turning hawkish).
o Any major Geopolitical risk and disruption in supplies of crude oil to hurt India.
o Any negative outcome in Lok Sabha elections (i.e. weak coalition).
o If interest rates remain at elevated levels then it could further increase banks NPAs.
o Developed markets are up 20-30% in CY13. Any correction in them could put pressure on EMs.
20
Equity MF Strategy We are comfortable on Indian equities purely on account of earnings visibility and valuations. We have no where
accounted for any re-rating that could come if we have a stable government at the center (post elections).
Beaten down sectors and stocks are completely marginalized (i.e.25% weight) and their relevance or impact on
earnings is not significant. With this mix if earnings growth is 12-13% or above, then it is quite meaningful.
We expect equities to deliver double digit returns in CY14/FY15 on the back of double digit earnings growth expected
in FY15. Re-rating will depend on election outcome.
Our Sensex EPS for FY14E & FY15E is Rs.1309 & Rs.1466, respectively which is still 8-10% below the consensus
estimates. There is upside risk to earnings growth in FY15, which should be positive for equities.
Our practical Sensex range as of now is 19,000 to 23,000 factoring in PE range 13-16x (i.e. till elections). If stable
govt. comes into power then the range will go up to 15-18x. In worst case PE will range between 11-14x.
Strategy:-
Going forward, we recommend allocation of 80%-100% of equity portfolio in recommended Large Cap Mutual Funds
and 0%-20% of equity portfolio in recommended Opportunistic / Mid Cap Funds in the current scenario.
Opportunistic or Multi-Cap Funds are schemes which maintains a blended portfolio comprising of large cap and mid &
small cap companies. Over the past couple of years, these funds have a tilt towards large cap companies.
21
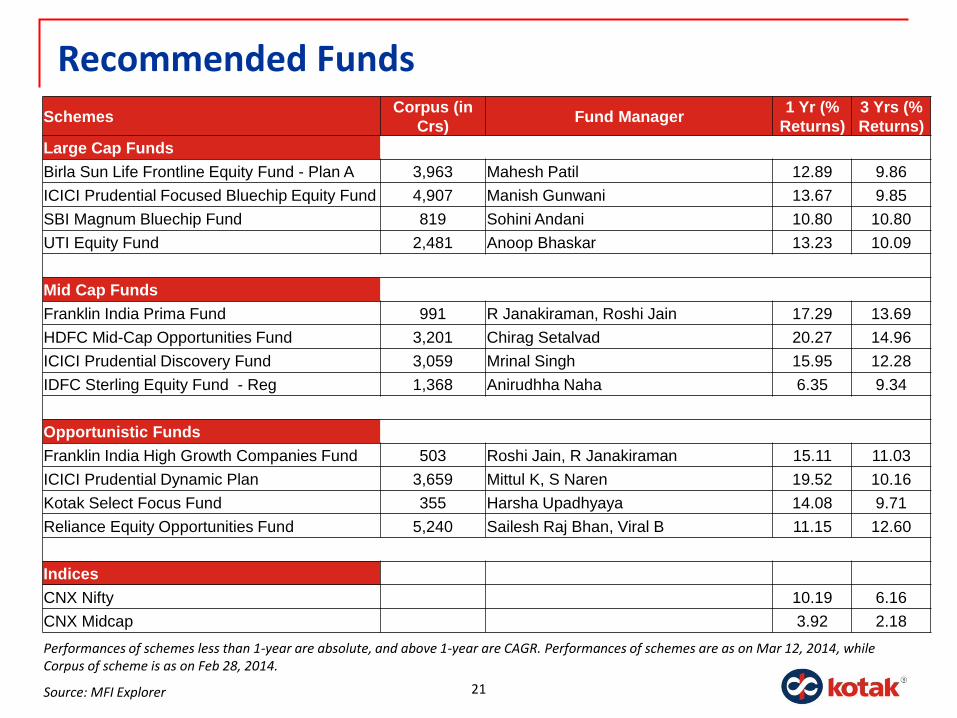
Recommended Funds
Performances of schemes less than 1-year are absolute, and above 1-year are CAGR. Performances of schemes are as on Mar 12, 2014, while Corpus of scheme is as on Feb 28, 2014.
Source: MFI Explorer
Schemes Corpus (in
Crs) Fund Manager
1 Yr (%
Returns)
3 Yrs (%
Returns)
Large Cap Funds
Birla Sun Life Frontline Equity Fund - Plan A 3,963 Mahesh Patil 12.89 9.86
ICICI Prudential Focused Bluechip Equity Fund 4,907 Manish Gunwani 13.67 9.85
SBI Magnum Bluechip Fund 819 Sohini Andani 10.80 10.80
UTI Equity Fund 2,481 Anoop Bhaskar 13.23 10.09
Mid Cap Funds
Franklin India Prima Fund 991 R Janakiraman, Roshi Jain 17.29 13.69
HDFC Mid-Cap Opportunities Fund 3,201 Chirag Setalvad 20.27 14.96
ICICI Prudential Discovery Fund 3,059 Mrinal Singh 15.95 12.28
IDFC Sterling Equity Fund - Reg 1,368 Anirudhha Naha 6.35 9.34
Opportunistic Funds
Franklin India High Growth Companies Fund 503 Roshi Jain, R Janakiraman 15.11 11.03
ICICI Prudential Dynamic Plan 3,659 Mittul K, S Naren 19.52 10.16
Kotak Select Focus Fund 355 Harsha Upadhyaya 14.08 9.71
Reliance Equity Opportunities Fund 5,240 Sailesh Raj Bhan, Viral B 11.15 12.60
Indices
CNX Nifty 10.19 6.16
CNX Midcap 3.92 2.18
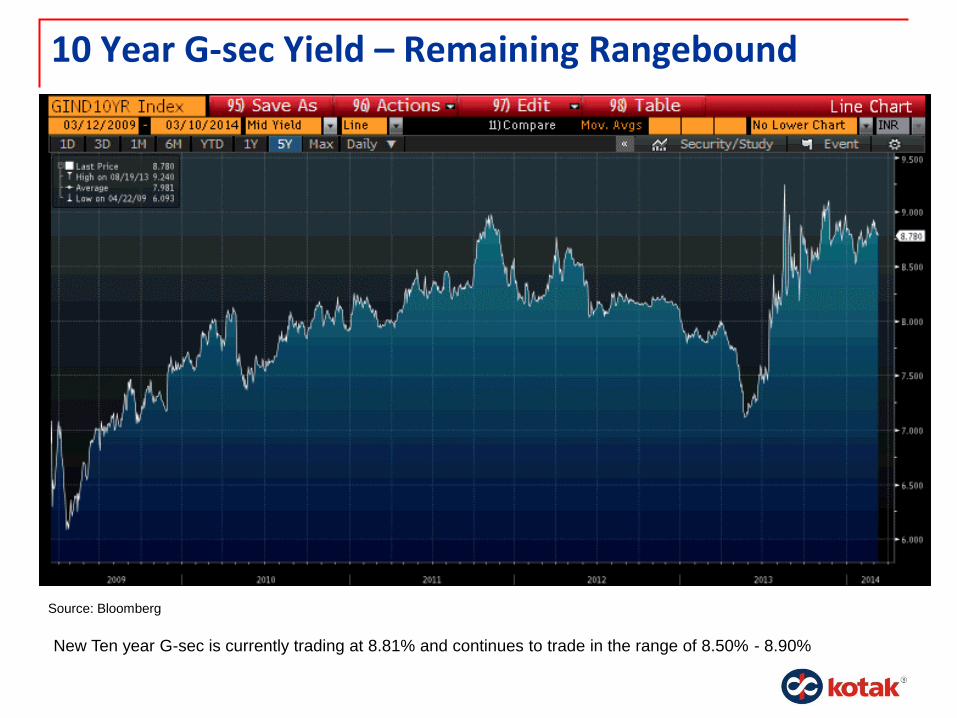
10 Year G-sec Yield – Remaining Rangebound
New Ten year G-sec is currently trading at 8.81% and continues to trade in the range of 8.50% - 8.90%
Source: Bloomberg

AAA Corp Bond Spread & G Sec Spread
o The graph in top left panel tracks the movement of 10 year G Sec yields (yellow line) versus 10 year AAA
corporate bond yields (white line) for last 5 years.
o The graph in lower left panel tracks the spread between the 10 year G Sec yields versus 10 year corporate bond
o Spread currently is 90 bps while historical average spread is 110 bps
Source: Bloomberg
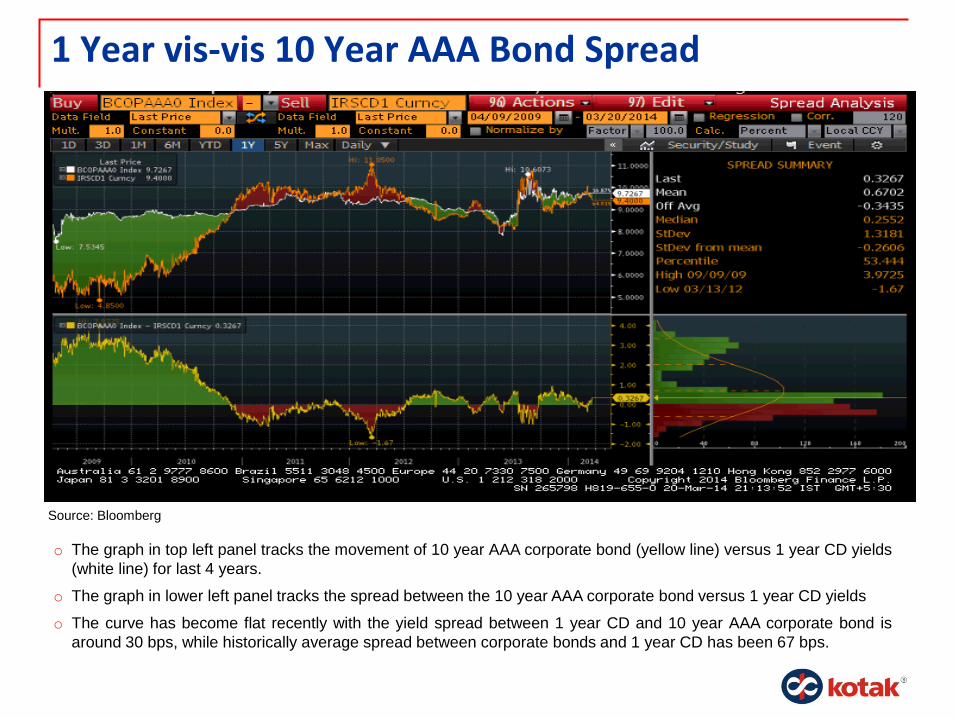
1 Year vis-vis 10 Year AAA Bond Spread
o The graph in top left panel tracks the movement of 10 year AAA corporate bond (yellow line) versus 1 year CD yields
(white line) for last 4 years.
o The graph in lower left panel tracks the spread between the 10 year AAA corporate bond versus 1 year CD yields
o The curve has become flat recently with the yield spread between 1 year CD and 10 year AAA corporate bond is
around 30 bps, while historically average spread between corporate bonds and 1 year CD has been 67 bps.
Source: Bloomberg
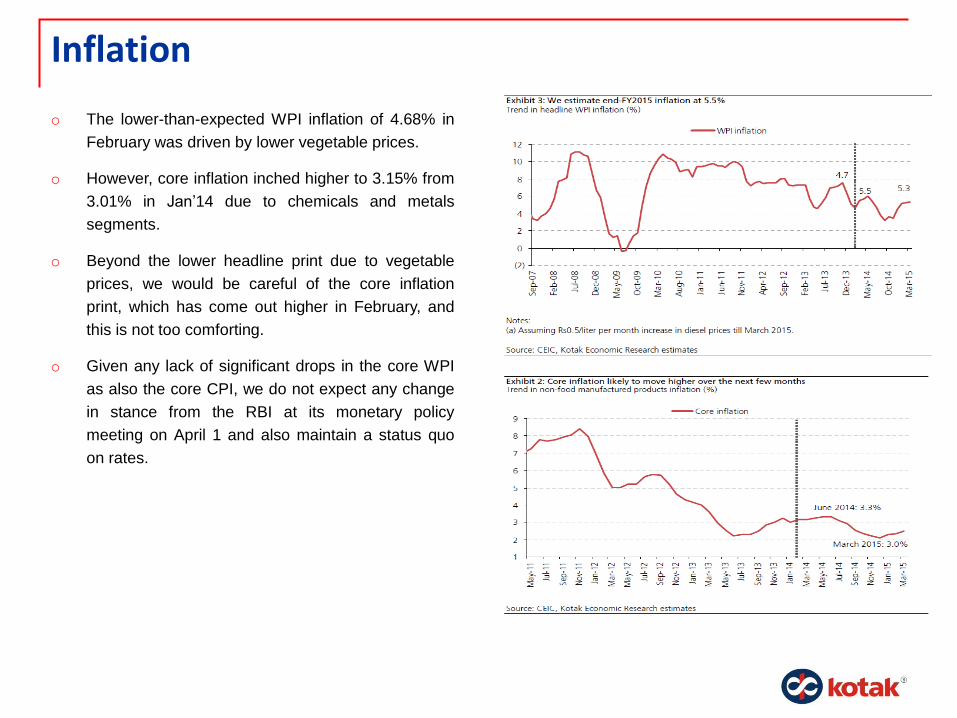
Inflation
o The lower-than-expected WPI inflation of 4.68% in
February was driven by lower vegetable prices.
o However, core inflation inched higher to 3.15% from
3.01% in Jan‟14 due to chemicals and metals
segments.
o Beyond the lower headline print due to vegetable
prices, we would be careful of the core inflation
print, which has come out higher in February, and
this is not too comforting.
o Given any lack of significant drops in the core WPI
as also the core CPI, we do not expect any change
in stance from the RBI at its monetary policy
meeting on April 1 and also maintain a status quo
on rates.
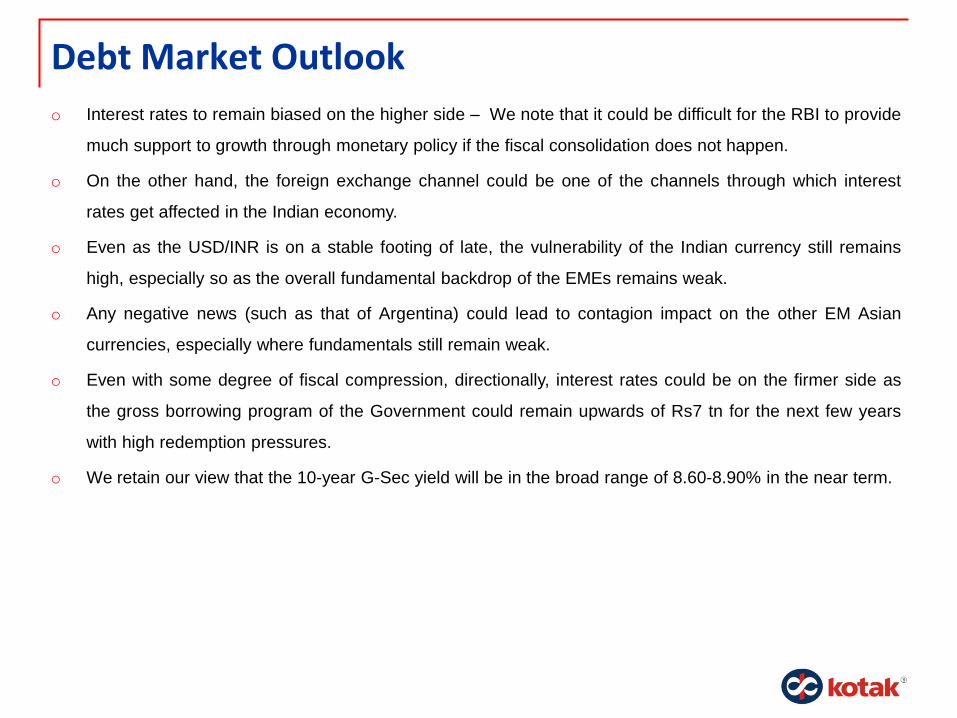
Debt Market Outlook
o Interest rates to remain biased on the higher side – We note that it could be difficult for the RBI to provide
much support to growth through monetary policy if the fiscal consolidation does not happen.
o On the other hand, the foreign exchange channel could be one of the channels through which interest
rates get affected in the Indian economy.
o Even as the USD/INR is on a stable footing of late, the vulnerability of the Indian currency still remains
high, especially so as the overall fundamental backdrop of the EMEs remains weak.
o Any negative news (such as that of Argentina) could lead to contagion impact on the other EM Asian
currencies, especially where fundamentals still remain weak.
o Even with some degree of fiscal compression, directionally, interest rates could be on the firmer side as
the gross borrowing program of the Government could remain upwards of Rs7 tn for the next few years
with high redemption pressures.
o We retain our view that the 10-year G-Sec yield will be in the broad range of 8.60-8.90% in the near term.
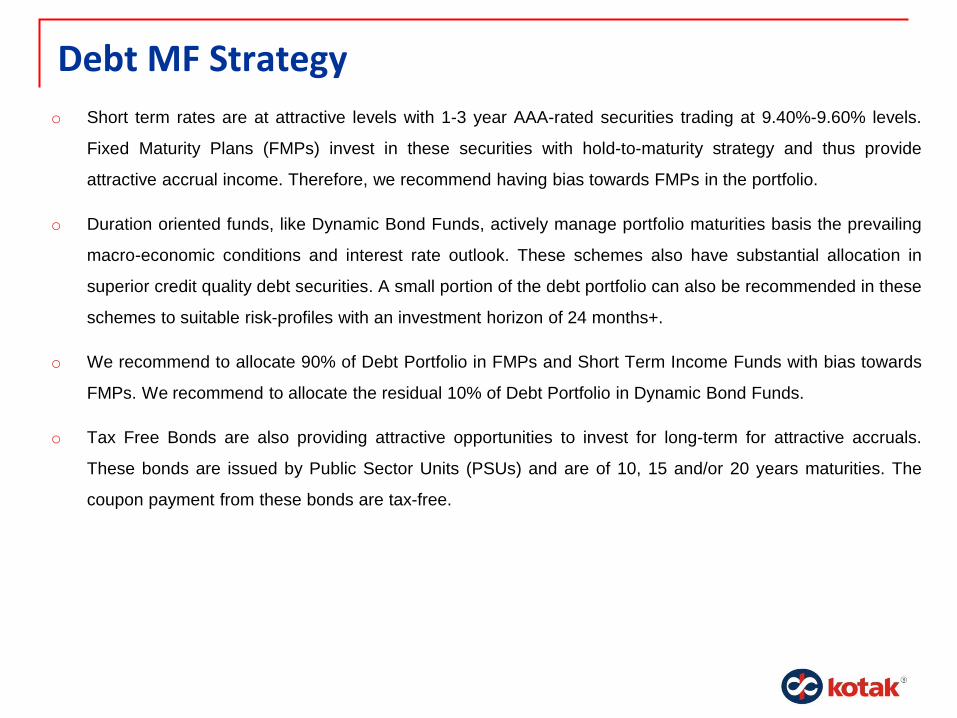
Debt MF Strategy
o Short term rates are at attractive levels with 1-3 year AAA-rated securities trading at 9.40%-9.60% levels.
Fixed Maturity Plans (FMPs) invest in these securities with hold-to-maturity strategy and thus provide
attractive accrual income. Therefore, we recommend having bias towards FMPs in the portfolio.
o Duration oriented funds, like Dynamic Bond Funds, actively manage portfolio maturities basis the prevailing
macro-economic conditions and interest rate outlook. These schemes also have substantial allocation in
superior credit quality debt securities. A small portion of the debt portfolio can also be recommended in these
schemes to suitable risk-profiles with an investment horizon of 24 months+.
o We recommend to allocate 90% of Debt Portfolio in FMPs and Short Term Income Funds with bias towards
FMPs. We recommend to allocate the residual 10% of Debt Portfolio in Dynamic Bond Funds.
o Tax Free Bonds are also providing attractive opportunities to invest for long-term for attractive accruals.
These bonds are issued by Public Sector Units (PSUs) and are of 10, 15 and/or 20 years maturities. The
coupon payment from these bonds are tax-free.
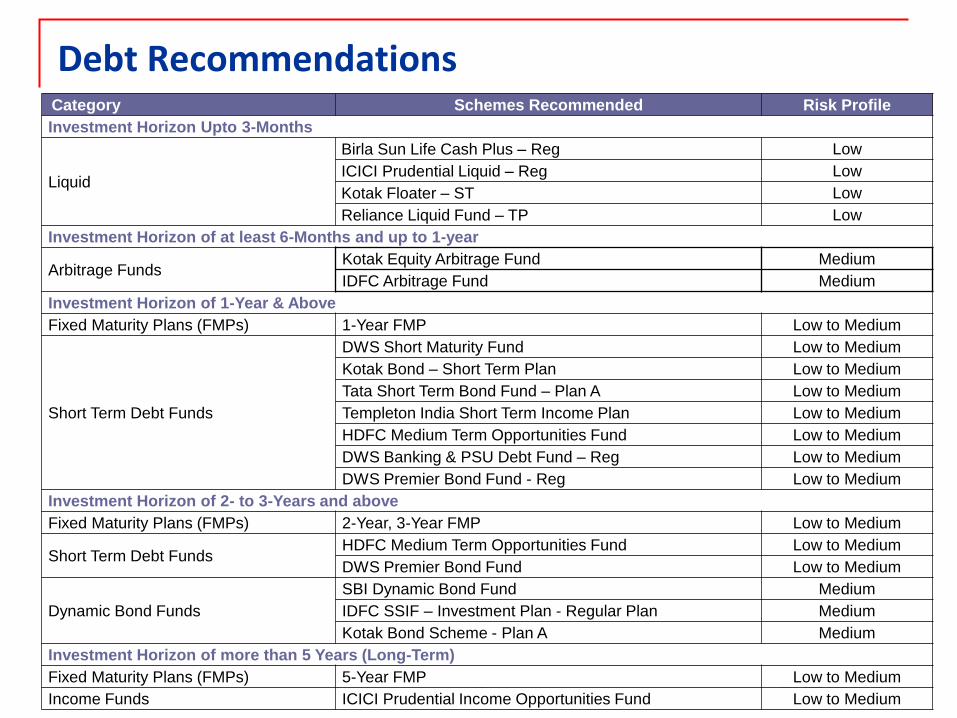
Debt Recommendations
28
Category Schemes Recommended Risk Profile
Investment Horizon Upto 3-Months
Liquid
Birla Sun Life Cash Plus – Reg Low
ICICI Prudential Liquid – Reg Low
Kotak Floater – ST Low
Reliance Liquid Fund – TP Low
Investment Horizon of at least 6-Months and up to 1-year
Arbitrage Funds Kotak Equity Arbitrage Fund Medium
IDFC Arbitrage Fund Medium
Investment Horizon of 1-Year & Above
Fixed Maturity Plans (FMPs) 1-Year FMP Low to Medium
Short Term Debt Funds
DWS Short Maturity Fund Low to Medium
Kotak Bond – Short Term Plan Low to Medium
Tata Short Term Bond Fund – Plan A Low to Medium
Templeton India Short Term Income Plan Low to Medium
HDFC Medium Term Opportunities Fund Low to Medium
DWS Banking & PSU Debt Fund – Reg Low to Medium
DWS Premier Bond Fund - Reg Low to Medium
Investment Horizon of 2- to 3-Years and above
Fixed Maturity Plans (FMPs) 2-Year, 3-Year FMP Low to Medium
Short Term Debt Funds HDFC Medium Term Opportunities Fund Low to Medium
DWS Premier Bond Fund Low to Medium
Dynamic Bond Funds
SBI Dynamic Bond Fund Medium
IDFC SSIF – Investment Plan - Regular Plan Medium
Kotak Bond Scheme - Plan A Medium
Investment Horizon of more than 5 Years (Long-Term)
Fixed Maturity Plans (FMPs) 5-Year FMP Low to Medium
Income Funds ICICI Prudential Income Opportunities Fund Low to Medium
29
Disclaimers
The aforesaid is for information purposes only and should not be construed to be investment advice under SEBI (Investment Advisory) Regulations.
In the preparation of the material contained in this document, Kotak Mahindra Bank has used information that is publicly available, including information developed in-house. Some of the material used in the document may have been obtained from members/persons other than the Kotak Mahindra Bank and/or its affiliates and which may have been made available to Kotak Mahindra Bank and/or its affiliates. Information gathered & material used in this document is believed to be from reliable sources. Kotak Mahindra Bank however does not warrant the accuracy, reasonableness and/or completeness of any information. For data reference to any third party in this material no such party will assume any liability for the same. Kotak Mahindra Bank and/or any affiliate of Kotak Mahindra Bank does not in any way through this material solicit any offer for purchase, sale or any financial transaction/commodities/products of any financial instrument dealt in this material. All recipients of this material should before dealing and or transacting in any of the products referred to in this material make their own investigation, seek appropriate professional advice
We have included statements/opinions/recommendations in this document which contain words or phrases such as "will", "expect" "should" and similar expressions or variations of such expressions, that are "forward looking statements". Actual results may differ materially from those suggested by the forward looking statements due to risks or uncertainties associated with our expectations with respect to, but not limited to, exposure to market risks, general economic and political conditions in India and other countries globally, which have an impact on our services and / or investments, the monetary and interest policies of India, inflation, deflation, unanticipated turbulence in interest rates, foreign exchange rates, equity prices or other rates or prices, the performance of the financial markets in India and globally, changes in domestic and foreign laws, regulations and taxes and changes in competition in the industry. By their nature, certain market risk disclosures are only estimates and could be materially different from what actually occurs in the future. As a result, actual future gains or losses could materially differ from those that have been estimated
Kotak Mahindra Bank (including its affiliates) and any of its officers directors, personnel and employees, shall not liable for any loss, damage of any nature, including but not limited to direct, indirect, punitive, special, exemplary, consequential, as also any loss of profit in any way arising from the use of this material in any manner. The recipient alone shall be fully responsible/ are liable for any decision taken on the basis of this material. The investments discussed in this material may not be suitable for all investors. Any person subscribing to or investing in any product/financial instruments should do so on the basis of and after verifying the terms attached to such product/financial instrument. Financial products and instruments are subject to market risks and yields may fluctuate depending on various factors affecting capital/debt markets. Please note that past performance of the financial products and instruments does not necessarily indicate the future prospects and performance thereof. Such past performance mayor may not be sustained in future. Kotak Mahindra Bank (including its affiliates) or its officers, directors, personnel and employees, including persons involved in the preparation or issuance of this material may; (a) from time to time, have long or short positions in, and buy or sell the securities mentioned herein or (b) be engaged in any other transaction involving such securities and earn brokerage or other compensation in the financial instruments/products/commodities discussed herein or act as advisor or lender / borrower in respect of such securities/financial instruments/products/commodities or have other potential conflict of interest with respect to any recommendation and related information and opinions. The said persons may have acted upon and/or in a manner contradictory with the information contained here. No part of this material may be duplicated in whole or in part in any form and or redistributed without the prior written consent of Kotak Mahindra Bank. This material is strictly confidential to the recipient and should not be reproduced or disseminated to anyone else
Mutual Fund investments are subject to market risks, read all scheme related documents carefully.