epubs.surrey.ac.ukepubs.surrey.ac.uk/810745/1/Modification of stress... · Web viewmodulus of 5.4...
46
Modification of stress-strain behaviour in aromatic polybenzoxazines using core shell rubbers Elliot Douse, 1 Sotirios Kopsidas, 1 David Jesson 2 , Ian Hamerton *3 1 Department of Chemistry, 2 Department of Mechanical Engineering Sciences, Faculty of Engineering and Physical Sciences, University of Surrey, Guildford, Surrey, GU2 7XH, U.K. 3 The Advanced Composites Centre for Innovation and Science, Department of Aerospace Engineering, University of Bristol, Queen’s Building, University Walk, Bristol, BS8 1TR, U.K. *To whom correspondence should be addressed. ABSTRACT: 2,2-bis(3,4-dihydro-3-phenyl-2H-1,3-benzoxazine)propane (BA-a) is blended with a commercial core shell rubber (CSR), Genioperl P52, based on a siloxane core and an acrylic shell, at a range of loadings (1 – 32 wt %). Scanning electron microscopy and energy-dispersive X-ray analysis reveals an even distribution with good cohesion between the resin and CSR particles. Measurements carried out by dynamic mechanical analysis and thermogravimetric analysis show modest improvements in glass transition temperature (3 %) and significant enhancement of thermal stability (20 %) when CSR (32 wt %) was incorporated. Such improvements are linearly related to CSR content. Moderate reductions in modulus (30 %) were observed with the highest (32 wt %) loadings of CSR and were also linearly proportional to CSR content. Thermal analysis demonstrated a small inhibitory effect, with activation energy raised by 4 % with the blend containing 32 wt % CSR and 3 % in the blend containing 8 wt % CSR. It was found that mechanical stirring of the CSR particles into the molten BA-a monomer was the most practical solution for dispersion and 1
Transcript of epubs.surrey.ac.ukepubs.surrey.ac.uk/810745/1/Modification of stress... · Web viewmodulus of 5.4...

Modification of stress-strain behaviour in aromatic polybenzoxazines using core shell rubbers
Elliot Douse,1 Sotirios Kopsidas,1 David Jesson2, Ian Hamerton*3
1Department of Chemistry, 2Department of Mechanical Engineering Sciences, Faculty of Engineering and
Physical Sciences, University of Surrey, Guildford, Surrey, GU2 7XH, U.K.
3The Advanced Composites Centre for Innovation and Science, Department of Aerospace Engineering,
University of Bristol, Queen’s Building, University Walk, Bristol, BS8 1TR, U.K.
*To whom correspondence should be addressed.
ABSTRACT: 2,2-bis(3,4-dihydro-3-phenyl-2H-1,3-benzoxazine)propane (BA-a) is blended with a
commercial core shell rubber (CSR), Genioperl P52, based on a siloxane core and an acrylic shell, at a range
of loadings (1 – 32 wt %). Scanning electron microscopy and energy-dispersive X-ray analysis reveals an
even distribution with good cohesion between the resin and CSR particles. Measurements carried out by
dynamic mechanical analysis and thermogravimetric analysis show modest improvements in glass transition
temperature (3 %) and significant enhancement of thermal stability (20 %) when CSR (32 wt %) was
incorporated. Such improvements are linearly related to CSR content. Moderate reductions in modulus (30
%) were observed with the highest (32 wt %) loadings of CSR and were also linearly proportional to CSR
content. Thermal analysis demonstrated a small inhibitory effect, with activation energy raised by 4 % with
the blend containing 32 wt % CSR and 3 % in the blend containing 8 wt % CSR. It was found that
mechanical stirring of the CSR particles into the molten BA-a monomer was the most practical solution for
dispersion and effectively broke down CSR agglomerates in the bulk and produced void free samples upon
curing, although some minor defects were apparent with higher loadings of core shell rubber. Four batches
of dog bone specimens (containing 0, 8, 16 and 32 wt % CSR) were manufactured and underwent tensile
testing. An average increase in extension was observed from 0.82 mm for the pristine poly(BA-a), to 1.14
mm (32 wt % CSR) was achieved. The introduction of CSR has a deleterious impact on tensile strength
(24.67 MPa, pristine poly(BA-a) compared with 20.48 MPa containing 32 wt % CSR; Young’s modulus of
5.4 GPa for pristine poly(BA-a) compared with 3.1 GPa containing 32 wt % CSR). Following tensile tests,
scanning electron microscopy reveals rubber cavitation as the principal toughening mechanism.
Keywords: Polybenzoxazines, core shell rubbers, stress strain behaviour, mechanical properties, thermal
behaviour.
INTRODUCTION Polymers and their composites are being applied increasingly in the aerospace industry1;
recently, composites have been used extensively in commercial airliners, most notably in the case of the
Airbus A350 and Boeing 787 which comprise up to 50 % composite by volume2,3. Composites are now being
1
applied in the primary structure of aircraft so their integrity is very important. Developing methods to
improve toughness of neat resins and trying to understand how the toughening agent works is the first step in
developing robust composites. Polybenzoxazines (PBZs) show promising thermal and mechanical
performance for these applications, but improvements in toughness are required before this can be a reality.
The potential for the use of oligomers based on engineering thermoplastics have been examined for some
years as modifiers in aerospace composite matrices4,5, due to their inherent toughness and the ability to blend
them more easily than high molecular weight species without incurring the penalty of high melt viscosity.
Core shell rubber (CSR) particles offer an alternative method of toughening by containing a rubbery,
elastomeric core, which provides impact resistance while a glassy grafted shell gives rigidity to the particle6.
Grafting a polymeric shell to the elastomeric core can provide good compatibility between the shell and
matrix polymer, allowing formation of a miscible polymer blend7. The elastomeric core of the CSR particle
is typically made from a polybutadiene, polystyrene or polysiloxane (the latter is used in this case). The
shell is typically designed to be compatible with the resin, usually a polymethylmethacrylate (PMMA) is
used. Particles are produced in a range of sizes, varying from 100 nm to 350 nm. The core to shell ratio can
also be varied, with as little as 7 wt % of shell giving increased toughening8. In this paper, we report
improvements in physical and mechanical properties recorded for a commercial PBZ monomer through the
incorporation of comparatively small quantities of a commercial CSR.
EXPERIMENTAL
Materials
2,2-bis(3,4-Dihydro-3-phenyl-2H-1,3-benzoxazine)propane (BA-a) was supplied by Huntsman Advanced
Materials (Basel, Switzerland) as Araldite MT35600, the core shell rubber, Genioperl P52, was provided by
Wacker Chemicals (Germany). Having been characterized using 1H NMR, FTIR spectroscopy (see
Supplementary data, Figures S1 and S2) and elemental analysis, all reagents were used as received without
further purification. The room temperature vulcanising silicone (Xiameter RTV-3481) and curing agent
(Notcutt 3481 Coloured Fast Catalyst), were obtained from Notcutt Ltd., U.K. In the interests of brevity the
characterisation data for the monomer and CSR have been deposited as supplementary information.
Blending of small-scale polymer samples for miscibility studies
For the solvated dispersion, the following procedure was used: BA-a (2 g) was placed in a glass sample
bottle and dissolved in chloroform (5 ml). Once solvation had been achieved, the pre-determined quantity of
CSR powder (1, 2, 4, 8, 16, 32 wt %) was added to create the blend. In order to create a homogeneous
dispersion, the solution was stirred magnetically (1 hour). The BA-a/CSR blends were placed on a flat glass
dish and heated to 100 °C on a hot plate with agitation. The product formed a tacky, opaque solid, which
increased in whiteness with increasing concentration of CSR. The solid was ground into small pieces and
2

then freeze dried for 24 hours before being analysed by FTIR, 1H and 13C NMR spectroscopy, DSC and
TGA. For the molten blend method, the BA-a was melted on a hot plate at 100 °C and the pre-determined
quantity of CSR powder (1, 2, 4, 8, 16, 32 wt %) was added to create the blend (Supplementary data, Figure
S3). The molten blend was then stirred magnetically at 100 °C (1 hour). The solid was cut to shape and
analysed using DMTA.
Blending and cure of polymer samples for mechanical analysis
For the blending procedure, a small-scale reactor was assembled, comprising a 500 ml round-bottomed
vessel, with an overhead mechanical stirrer passing through the middle neck. The vessel was placed in a
heating mantle and the temperature within the reactor was monitored using a thermometer. Blends of
approximately 300 g containing 0, 8, 16 and 32 wt % CSR concentration were prepared. The neat resin,
MT35600 was heated (120-140 °C, 15-20 minutes) in order to obtain a well flowing melt, without advancing
the cure state unduly, to which was added the desired (predetermined) quantity of CSR and allowed to cool.
The reactor was assembled and heated (120 °C) and stirred (180-250 rpm, 10-15 min) to effect a
homogeneous blend. Blends were transferred in the molten state to a wide neck container (Supplementary
data S3), cooled and stored in the dark for a short time prior to use.
Manufacture of specimen mould
For the manufacture of specimens, a mould was first prepared from silicone resin (Xiameter RTV-3481) and
curing agent (Notcutt 3481 Coloured Fast Catalyst). The base and catalyst were added in a plastic beaker at
100:10 weight ratio and were manually stirred together using a glass rod. The mixture had a pink colour and
was cast into a PTFE (Teflon) mould and allowed to develop its full mechanical properties after 5 days of
curing at ambient conditions. The silicone mould was placed on top of a glass plate, with a release paper to
prevent the adhesion of the cured resin to the glass surface.
Manufacture of Tensile Specimens
‘Dog-bone’ specimens (Scheme 1) were prepared following the curing schedule described below. This
corresponds to the most efficient for a batch calculated to produce a total of 10 specimens, but this is by no
means optimized and would require further work to do so. The blend was placed in the vacuum oven (-0.06
MPa) and heated to 125 °C (30 min), the degassed melt was poured into the silicone mould and transferred
into an oven and heated (150 °C, 60 min, 180 °C, 2 hr). Finally, the temperature was raised (2 K/min) to 200
°C, held isothermally (2 hr) before being cooled overnight.
3

SCHEME 1. Schematic showing the dimensions and geometry of the tensile test specimen.
Instrumentation and test methods
Fourier Transform Infrared (FT-IR) spectra were recorded (at a resolution of 4 cm -1) using a Perkin Elmer
(System 2000) FT-IR spectrometer using an attenuated total reflectance attachment.
Nuclear magnetic resonance (NMR) spectra were obtained at 298 K using a Bruker AC300 spectrometer
using CDCl3 and TMS as an internal standard. 1H and 13C NMR spectra were recorded at 300 MHz and 65
MHz respectively.
Differential scanning calorimetry (DSC) was undertaken using a TA Instruments Q1000 running TA Q
Series Advantage software on samples (4.0 0.005 mg) in hermetically sealed aluminium pans.
Experiments were conducted under flowing nitrogen (50 cm3/min.) at heating rates of 5, 10, 15, and 20
K/min. from room temperature to 300 C, cooled to room temperature at 20 K/min, then rescanned to 250 C
at 10 K/min (to determine the glass transition temperature, Tg). In order to gauge the reactivity of the
monomer in the bulk, dynamic DSC analysis was performed on all of the systems.
Thermogravimetric analysis (TGA) was performed on a TA Instruments Q500 (operating TA Q Series
Advantage) on the previously cured DSC samples (3.0 ± 0.5 mg), which had a well-defined thermal history.
Samples were placed in a platinum crucible and were heated from room temperature to 800 C at 10 K/min in
nitrogen (60 cm3/min).
Dynamic mechanical thermal analysis (DMTA) (in single cantilever mode at a frequency of 1 Hz and 0.1 %
strain) was carried out on cured neat resin samples (2 mm x 10 mm x 17 mm) using a TA Q800 in static air
from room temperature to 260 C at 2 K/min.
Scanning electron microscopy (SEM) analysis was performed on a JEOL USA JSM-7100F Analytical Field
Emission SEM. Sample preparation for SEM analysis of blends consisted of encasing each cured sample in
epoxy resin and grinding the surface down with progressively finer grades of SiC abrasive papers (P500,
P1200, P2400 and P4000) with a final polishing step using DP-MOL finishing cloth with OP-S (colloidal
silica), to give a 1 m finish. Energy-dispersive X-ray spectroscopy (EDS) was used to determine the
elemental analysis as it relies on an interaction of some source of X-ray excitation and the sample. In this
particular case, the analysis revealed the presence (and dispersion) of silicon, which was present only in the
CSR, but not the PBZ matrix. For the mechanical tests, the fractured surfaces were analysed using SEM
with the same microscope. Sample preparation for SEM examination consisted of isolating the cross-section
area, by dry cutting the broken specimen and applying a gold coating (2 nm thickness) to minimise charging.
An accelerating voltage of 5 kV was used.
Determination of Tensile Strength and Tensile Modulus
4

Tensile testing was conducted using an Instron 6025 5500R Universal Testing Machine, with a 100 kN
frame and using a 5 kN load cell (Supplementary data, Figure S4). The specimens were tested using
pneumatic air grips (operating under a pressure of 483 kPa), at a displacement rate of 0.5 mm/min and a test
temperature of 21 C, according to ISO 527 test method9. Whilst the overall gauge length (Dimension C in
Scheme 1) of the specimen was 40 mm, a clip-on extensometer (Instron Dynamic 2620-602) with a gauge
length of 12.5 mm (i.e. nominally ± 6.25 mm around the midpoint) and a maximum displacement of 2.5 mm
was attached to the specimen. Load-displacement and strain data were collected using Bluehill 2 software
(Instron, UK) and analysed using Microsoft Excel. To determine stress (σ), the applied load was divided by
the area at the point of breakage. The area was determined by multiplying the width (Dimension D in
Scheme 1) with the thickness, d (d ∼3 mm) at the cross-section. Four different measurements were made
along the width in order to determine the average thickness (daver). Dimensions were recorded using a digital
micrometer. Stress-strain curves were plotted for specimens that did not fail in the grips. The tensile (or
Young’s) modulus, Ε was determined as the slope of the linear portion of the produced curve10; the measured
value of ultimate stress at the point of failure is known as the tensile strength.
RESULTS AND DISCUSSION
Thermal analysis to explore polymerisation behaviour
Differential scanning calorimetry (DSC) was carried out to observe how the addition of CSR particles affects
the curing behaviour and Tg of the resulting polymer blends. DSC data (Table 1) reveal a distinct change in
the melting temperature (Tm) with the addition of only small quantities of CSR particles. This has been
attributed to the CSR particles interacting with the monomer associatively, requiring an increased energy
input in order to disrupt the attractive forces and melt the solid. This effect is present almost immediately at
very low concentrations and remains even at higher concentrations. The max peak exotherm shows a very
slight reduction with increasing CSR concentration, which suggests that the activation energy is lowered
with increasing CSR concentration. Evaluation of the energy associated with benzoxazine ring opening
polymerisation (ΔHp) shows a decreasing value with increasing CSR concentration. This leads to the
conclusion that the CSR particles are inhibiting the degree of polymerisation. This is likely due to the fact
that the CSR particles are preventing reaction at their surface as surrounding benzoxazine groups are
shielded from reacting with each other and cannot react with the inert CSR particle, thus lowering the
number of bonds formed per mole of monomer. Another trend observed is the increasing glass transition
temperature, showing a positive increase with higher loadings of CSR. One explanation for this result is the
intercalation of CSR particles in the resin has caused increased chain entanglement, reducing the rotation and
mobility of the surrounding network. This is a very positive, yet unexpected result as the addition of softer
materials with a lower Tg has actually increased the glass transition temperature of the material significantly.
TABLE 1 DSC Data for cured BA-a/CSR blends heated at 10 K/minute under nitrogen (50 cm3/min.)
5
A number of replicate DSC experiments were performed on selected blends at different heating rates and
show good agreement (Table 2). The plots of fractional conversion and reaction rate for BA-a (see
Supplementary data Figure S5) are consistent and these data allowed kinetic parameters to be determined.
TABLE 2 DSC Data for selected BA-a/CSR blends (various heating rates under nitrogen, 50 cm3/min.)
Determination of cure kinetics using DSC
Kinetic analysis of the dynamic cure of the monomers was based on the rate equation given in Equation 1
where the rate constant (k(T)) is temperature dependent according to Arrhenius’ law11 shown in Equation 2.
d αd t
≡ β d ad T
=k (T ) f (α) …Equation 1
where k(T) is a temperature-dependent rate constant, f(α) the differential conversion function and β = dT/dt is
a constant heating rate.
k (T )=A exp(−Ea
RT )…Equation 2
where A is the pre-exponential factor, Ea is activation energy and T is the absolute temperature.
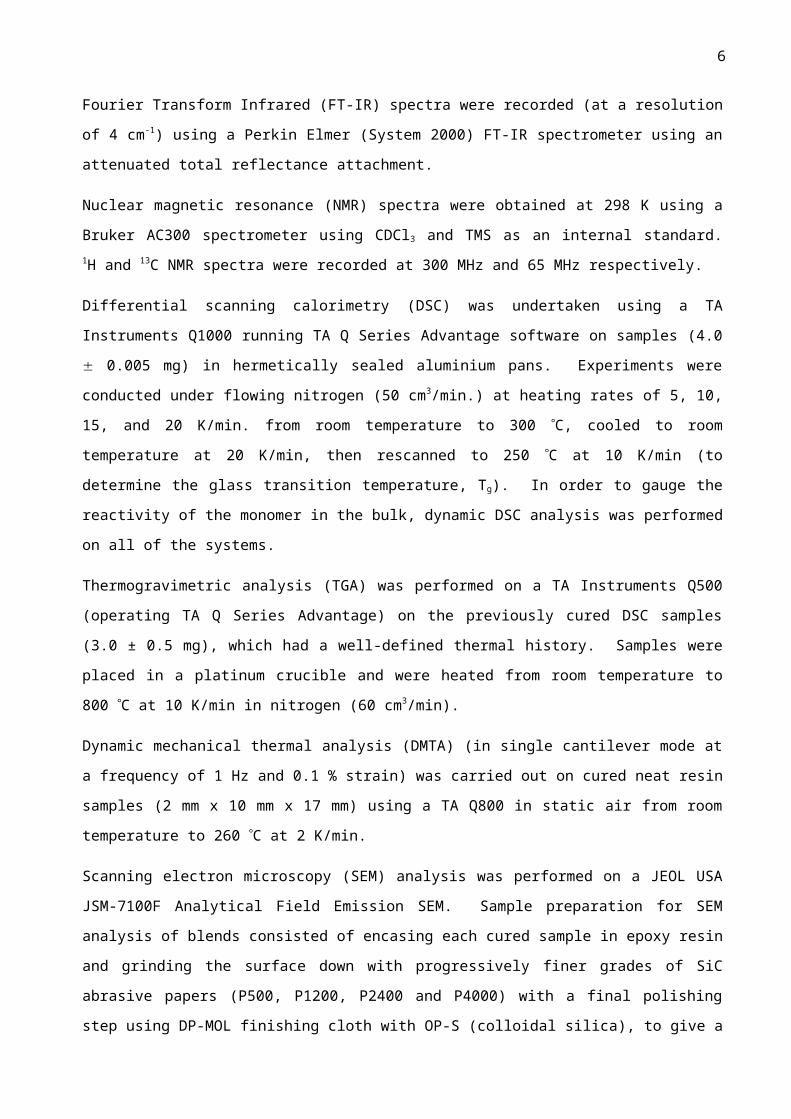
Two different methods of kinetic analysis (proposed independently by Kissinger and Ozawa) have been used
in this work that use variations of the aforementioned equations. The Kissinger method relates the
exothermic peak maximum temperature (Tmax) to the activation energy (Ea) for data obtained at various
heating rates (β) through Equation 3. The graphical representation (Fig. 1) of Equation 3 allows the
determination of activation energy, pre-exponential factor (A) and rate constant (k), results, which are
presented in Table 3.
TABLE 3 Comparison of kinetic parameters for selected BA-a/CSR blends
ln ( βT max
2 )=ln( AREa )− Ea
R T max2 …Equation 3
6

The Ozawa method is similar to the Kissinger method, where the inverse relationship between the logarithm
of heating rate to exothermic peak temperature in Equation 4 (also Fig. 1) allows graphical determination of
activation from the slope of the resulting line. The results are also presented in Table 3.
lnβ=ln( A Ea
R )−lnF (α )−5.331−1.052( Ea
RTmax )…Equation 4
where F(α) is a constant function.
All analyses using both of the aforementioned methods showed a good linear relationship between heating
rate and exothermic peak temperature with R2 values no lower than 0.99 throughout.
FIGURE 1 Kissinger and Ozawa plots for polymerisation of BA-a
Determining thermal stability of blends
Thermogravimetric analysis (TGA) was conducted to evaluate the mass loss as a function of temperature for
the poly(BA-a) and in cured blends containing various concentrations of CSR (Table 4). Previous studies 12,13
conducted on poly(BA-a) have shown that the initial mass loss occurs at around 260-280 °C, with the loss of
amine species accounting for the majority of the loss. The bulk of the mass loss occurs between 300-450 °C,
associated with the degradation of phenolic moieties14,15. Finally, the formation of char tends to occur at
temperatures above 500 °C and the typical yield for poly(BA-a) resin has been identified 16 to be around 30 %
at 800 °C, which is in close agreement with the present work. The effect of blending CSR on the thermal
stability of the poly(BA-a) is quite marked and a trend of increasing thermal stability, coupled with
increasing char yield, is apparent. Interestingly, the data for the CSR reveal a steep decline in weight
between 400-500 °C, with mass remaining constant after 500 °C (and a very low char yield of 1.32 %), yet
addition of this material to poly(BA-a) resin increases the char yield significantly (6% at the highest level),
suggesting covalent incorporation. The maximum rate of mass loss for the blend containing 32 wt % CSR is
not only located in a higher temperature regime, but also is of a greater magnitude (ca. 1.65 %/°C)
presumably due to the larger CSR content degrading more rapidly than the poly(BA-a) homopolymer.
TABLE 4 TGA data for BA-a/CSR blends acquired at 10 K/min (nitrogen)
FIGURE 2 TGA data for CSR (top) and poly(BA-a) (bottom) at 20 K/min under nitrogen.
7

Other work17 has demonstrated that the addition of 10.8 wt % of a CSR (not chemically related to the material
used here) gave a decreased char yield in a butadiene-acrylic copolymer, but this is in stark contrast to the
current work. Other methods of toughening PBZ with oligosiloxanes have also shown an increased thermal
stability with increased char yield18.
Studies to optimise blending procedures. To examine the microstructure of the blended systems the cured
blends were analysed using scanning electron microscopy (SEM) and energy dispersive X-ray spectroscopy
(EDS). It was decided that before mechanical testing of cured PBA-a/CSR blends, optical analysis should be
conducted to determine how effectively the CSR particles were dispersed during each dispersal method -
solvent or melt, and the best method of dispersal would be used for mechanical testing. Ideally both methods
should have dispersed the core shell rubber agglomerates of size 20-40 μm into their individual particle sizes
of 170-200 nm. Samples analysed contain 4 wt % CSR.
Solvent Dispersion
Analysis of samples dispersed with solvent give a very uniform, homogenous dispersion (Figure 3). CSR
particles can be identified by small dimples or craters, where the particle has been removed during the
grinding and polishing process leaving a hole. This has been confirmed with EDS analysis, showing a high
concentration of silicon from the PDMS core present around the edges of each hole. The entire cross section
of the sample (approximately 0.5 µm) was just as uniformly dispersed with no agglomerates or large voids
present.
FIGURE 3 SEM (left) and EDS (right) images of solvent dispersed sample. Dark grey dots show Si
identified by EDS (see Supplementary data, Figure S6 for coloured image).
Overall, this method of dispersal is very effective at reducing agglomeration of the CSR clusters. However,
other problems arise from evaporating the solvent following dispersal. As the monomer is a solid, a
moderately high temperature is required to melt the material, wherein the solvent struggles to reach the top of
the sample and evaporate. This is because the top layer is cooler from not being in direct contact with the hot
plate and thus a more viscous film is created, preventing the solvent from escaping. Consequently, fairly
high temperatures were required to remove the majority of the solvent in the resin. The method was modified
by placing the solvated sample on a glass dish at 100 °C and agitating the blend frequently. Even after
prolonged heating on the hot plate the cooled solid was still fairly tacky, showing that solvent is still present
in the sample. This sticky solid was then freeze-dried in attempt to remove the last remnants of solvent.
8

Melt Dispersion
Analysis of samples prepared via melt dispersion show a very different morphology. Samples display a
variety of phase separation and agglomeration (Figure 4). These defects are mainly present at the surface, an
example of which can be seen in Figure 5. Despite the large agglomerates found at the surface, it appears
that the bulk of the material contains a good distribution of CSR particles.
FIGURE 4 Cross sectional area of melt-dispersed sample, showing CSR agglomerates close to the surface.
Clearly the melt-dispersed samples have not been dispersed as effectively as in the solvation process. This
may be because the solvated samples produce a much lower viscosity solution to disperse the agglomerates.
Melt dispersed samples still are very viscous at 100 °C, making de-agglomeration much more difficult as
translational movement is limited. It is proposed that the reason the agglomerates are found close to the
surface is because under degassing conditions the agglomerates rise to the top of the sample.
FIGURE 5 (top) Example of agglomerate at magnification (area outlined was analysed by EDS); SEM
(bottom left) and EDS (bottom right) images of agglomerate. Dark grey dots show Si identified by EDS (see
Supplementary data, Figure S7 for coloured images).
As the sample undergoes degassing in the vacuum oven the sample is in a liquid state, allowing volatiles and
air to be removed from the sample. As the sample begins to bubble, bulky agglomerates are pushed to the
surface as volatiles escape from the bulk to the surface. The agglomerates then remain there until the resin
gels and they become fixed in position. It is unlikely that the blend exhibits lower critical solution
temperature behaviour in which phase separation occurs at higher temperature. This is because no phase
separation was found in the previous solvated blend, heated at the same rate and time as the melt dispersed
sample. An example of an agglomerate found on the surface is shown in Figure 5, it is evident that the
agglomerates range in size, anywhere from 5-100 μm. Evidently, dispersal produced with this method will
give unreliable mechanical data as the strength of the material varies throughout the sample.
Overall the best method of dispersion is the solvated method. This method produces a homogenous blend
with no agglomerates or defects throughout the entire sample, favourable for producing the highest fracture
energy19. The melt dispersive method on the other hand produces large agglomerates close to the surface,
however the bulk is mainly defect free. It appears that the melt dispersive method has not had enough sheer
9

force to disperse the agglomerates. Another important factor which can be assessed optically is the cohesion
of the CSR particle to the resin matrix. Cohesion between the CSR particle and the resin is essential for
increased toughness as cavitation is most favourable, a major mechanism identified for improved toughness
in CSR particles20. From analysis of the SEM images it is observed that the CSR particles are not present in
their entirety, only a void or hole left where the particle once was. This could imply a low level of cohesion,
as the force imparted during grinding and polishing and sample preparation has easily picked out the particle
to leave a void. However, large deposits of Si are clearly present, as identified by EDS, recorded at a spatial
resolution of 1 m under the experimental conditions used. This suggests an entirely different situation
whereby the softer rubber material is abraded more quickly than the resin, leaving residual Si from the PDMS
core.
FIGURE 6 SEM image showing CSR dispersion in bulk of melted BA-a sample.
It is believed that the second situation is more likely in which a good level of cohesion is present and the CSR
particles are sanded down not plucked out. This is because Si is clearly present in the voids, this leads to the
conclusion that the particle cannot have been plucked out entirely and some fragments must remain bonded to
the resin surface. Also it has been observed in DSC (Table 1) and confirmed subsequently in DMTA (Table
5, and see Supplementary data Figure S8) that incorporation leads to a small increase in Tg (6-7 K) and there
is good evidence to support the formation of the PBZ (Supplementary data, Figure S9). This increment has
been associated with the intercalation of CSR particles in the resin causing increased chain entanglement and
reducing chain mobility. This once again suggests a high degree of cohesion is present as the shell is
entangled within the resin.
TABLE 5 Dynamic mechanical data for BA-a/CSR blends
Analysis of the DMTA data show the influence of CSR on physical properties as a broadly linear
relationship with increasing Tg, but perhaps a less convincing one for the drop in room temperature modulus.
Having demonstrated some attractive properties from DMTA data for the small-scale blends, the decision
was made to scale up to perform mechanical tests.
FIGURE 7 Plot of DMTA data for poly(BA-a) containing different concentrations of CSR (N.B. Tg
determined from tan (top) and loss modulus (bottom) maxima in the lower traces (see Supplementary data,
Figure S10 for coloured images).
10

Tensile Mechanical Tests
Although the solvent dispersion had proved to be more effective on the smaller scale, for scale up (to ca. 300
g) the difficulty in solvent removal and the high melt viscosity of the blends had prompted the use of the
molten blend approach. As earlier outlined, the melt approach holds considerable advantages in terms of
straightforwardness, timesaving and reliability, but there were to be some challenges to address. A
significant modification was to replace magnetic stirring with an overhead mechanical stirrer utilising a
metallic blade, which could provide considerably higher shearing forces. The initial batch of BA-a
specimens was manufactured, implementing a similar curing schedule from the smaller scale procedure
(melting the neat resin at 125 C, 30 min before casting the molten resin into the silicone). The cast material
was transferred to a vacuum oven and the temperature was raised to 125 C, the vacuum was applied and the
temperature maintained for 30 min. The BA-a flowed well to fill the mould and the degassed specimens
were allowed to cool to room temperature and were then transferred to a furnace for the final curing stages,
heated to 180 and 200 C for 2 h respectively.
The same process was more difficult to apply for the batches of specimens containing CSR, particularly
those with 32 wt % CSR). The high filler concentration resulted in a significantly greater melting
temperature (140 C) and a high melt viscosity. This made the casting process extremely difficult, and the
cast material was degassed at an elevated temperature, of 150 C (30 min). The material experienced
foaming during degassing, due to the high solid content, and flowed over the boundary of the mould,
necessitating cooling, removal and refilling of the mould with chopped pieces of the cooled blend. The
sample was transferred to the furnace and heated once again to 160 C (2 hr) to achieve a molten state prior
to the final curing, to ensure that the material had flowed to fill the mould. The specimens containing 32 wt
% CSR were extensively post-treated with coarse sandpaper in an attempt to smooth down the rough
surfaces. The final morphology of the specimens (Supplementary data Figure S11) was the least satisfactory
of those produced, but the decision was taken to proceed to testing.
The manufacturing process would require further work to achieve optimization, since all the manufactured
specimens contained a slight meniscus (observed as curvature along the width), arising from the greater
thickness of the sides compared to the bulk. This made the accurate determination of the surface area a
difficult task. Consequently, four replicate measurements along the width of the fracture were taken and
thickness was determined as the average value. A summary of the results obtained from tensile testing is
presented in Table 6 with the mean values and the associated standard errors. A preliminary examination of
the tensile data reveals a large scatter in the data. This is anticipated from the point of view that the majority
of specimens had shortcomings arising from the manufacturing process, as outlined earlier. As can be easily
understood, defects, such as the presence of even a small void, can undermine the mechanical endurance of a
11

specimen under high loads. Consequently, the data were interpreted critically, rather than being considered
absolute. Nevertheless, certain trends were apparent, such as an average increase in extension with
increasing rubber content. The italicized results highlighted in Table 6, were excluded from the statistical
analysis, as these specimens were found to contain a large void at the point of failure, leading to a
significantly poor performance.
TABLE 6 Tensile testing data (N.B., outliers italicised)
A bar graph representation of the aforementioned mean values with varying CSR content is provided (Figure
8), with error bars to represent the standard deviations in the data. In terms of extension and tensile strength
it is evident that the cured blends containing 16 wt % CSR perform considerably poorer than their 0 and 8 wt
% counterparts. However, the 16 wt % specimens contained a significant amount of microvoids at the sides
of the dogbone; a limitation that arose from inadequate degassing of the original blend (time limitations
prevented a repeat). This had a clear impact on the mechanical properties (although the standard deviations
recorded for extension and tensile strength are very low).
FIGURE 8 Bar graph of (a) extension, (b) tensile strength and (c) Young’s modulus of the poly(BA-a)
blends containing various CSR concentrations.
In order to identify the effect of CSR on the three properties; the mean values of extension, tensile strength
and Young’s modulus were plotted respectively against CSR concentration (Fig. 8). There appears to be a
linear relationship between extension and CSR content, with the exception of the 16 wt % data point (shown
in red). An average increase in extension from 0.82 mm for the unmodified poly(BA-a) resin to 1.14 mm (an
increase of 28 %) for the formulation containing 32 wt % CSR was recorded. This was anticipated, since the
CSR particles comprise an elastomeric PDMS core, which has the ability of undergoing elastic deformation,
but the enhancement in elasticity of the PBZ matrix is evident as the amount of CSR is raised. Similar
increases in strain, proportional to the amount of loading, have been reported for epoxy composites
containing PDMS-based core shell microspheres21.
FIGURE 9 Graphs of mean extension, tensile strength and Young’s modulus against CSR concentration.
A similar linear relationship was observed between tensile strength and CSR concentration (Figure 9),
although once again the 16 wt % data point (shown in red) appears to deviate considerably from the line of
12

best fit; for reasons that have already been outlined. The tensile strength decreases from 24.7 MPa for the
unfilled resin to 20.5 MPa for the 32 wt % CSR-modified benzoxazine. This appears quite striking, but it is
well established that the incorporation of particles can reduce the tensile strength of thermosetting
polymers22. A linear reduction in tensile strength with increasing CSR content has been well documented in
the literature for CSR-modified epoxies20,21. Technical information provided by the manufacturer23 states that
the tensile strength is equal to 59 MPa, which is higher than the corresponding value for the unmodified resin
obtained from the current study. Typical values of tensile strength for epoxy resins (the most commonly
studied class of thermosets) lie in the range between 30 and 120 MPa10, which confirms that the
manufactured specimens underperformed to a certain degree.
The tensile (Young’s) modulus was expected to decrease with the addition of CSR particles, since the
presence of the soft elastomeric particles will reduce the stiffness of the relatively rigid PBZ24. This is clearly
observed for the 0, 8 and 16 wt % CSR concentrations (Fig. 9). Furthermore, tensile modulus appears to
decrease linearly with increasing amount of CSR, in the aforementioned concentration range, as illustrated in
Figure 9. Kinloch et al. have demonstrated24 a similar linear trend for CSR-modified epoxy polymers. What
is surprising is the fact that the modulus increases slightly from 2,818 MPa at 16 wt % CSR concentration to
3,051 MPa at 32 wt %. It should be noted that the mechanical reliability of specimens should not play a part
in the determination of tensile modulus, as this property is dependent on the elasticity, which is characteristic
of a material. This explains why the 16 wt % data point lies within the line of best fit, in contrast to the other
two linear relationships.
One line of reasoning might be that beyond a certain concentration of the CSR particles phase-separation no
longer takes place and have instead become incorporated into the PBZ matrix resulting in plasticisation 24.
This could be the case if one considers the presence of acidic moieties in the outer shell of the CSR particles,
as was suggested by the FT-IR spectral analysis. Apart from initiating the ring-opening of the benzoxazine
monomers, the CSR would have the potential to bond covalently to the initiation site and become integrated
into the cross-linked network. Nevertheless, this finding contradicts the data obtained from DMTA, which
demonstrated a clear linear relationship (R2 = 0.86) between room temperature storage modulus and CSR
loading throughout the concentration range, between 0 and 32 wt %. For comparison, the tensile modulus
for the neat poly(BA-a) was found to be slightly less than the value of 6.7 GPa provided by the
manufacturer’s data sheet22. Typical values of tensile modulus for epoxies are found in the range between
2.6 and 3 GPa while for polyimides this range lies between 3 and 5 GPa10.
Alternatively, the significant change in properties observed for 32 wt % CSR may simply be related to the
dispersion of this phase. Jesson and Watts25 have presented an analysis based on a calculation for the inter-
particle spacing (Equation 5).
13

C = r.3√ 4 π3 V f
…Equation 5
If one assumes a body centred cubic packing, individual CSR particles of 170 - 200 nm and a well-dispersed
phase (as evidenced by the SEM data) then the inter-particle spacing at Vf = 0.32 will be 30 - 35 nm, where
the interphase might typically cover 20 - 200 nm, depending on the level of interaction. It might be
reasonable to assume that at the higher loading of CSR, the interphase surrounding the particles is beginning
to overlap.
The effect of CSR on the plastic behaviour of the PBZ was examined by conducting a tensile test10 on the
unfilled poly(BA-a) and the blend containing 32 wt % CSR. Load/extension curves for the materials, were
obtained and converted to stress/strain curves and these are presented (Fig. 10) for the two extremes of
unfilled and filled polymers. The Young’s modulus was calculated for each polymer from the gradient of the
linear portion of the stress-strain curves. This linear region is expected to be the same for both compression
and tension modes and materials exhibiting such behaviour are most commonly known as linear elastic10. It
has to be reiterated that elastic deformation is non-permanent, which means that when the applied load is
released the material returns into its original condition, but in order to satisfactorily define the elastic region,
both tensile and compressive behaviour will have to be characterised.
FIGURE 10 Comparison of stress-strain responses of (a) poly(BA-a) and (b) the poly(BA-a) blend
containing 32 wt % CSR.
At higher stresses, elasticity is lost and most materials undergo plastic deformation to alter their shape in a
permanent way10. The stress at which a material starts to deform plastically is known as yield strength and
the process is commonly known as yielding. It is apparent from the presented curves that the cured blend
containing 32 wt % CSR has a much lower yield strength than the unmodified poly(BA-a), but possesses a
significantly greater ability to undergo plastic deformation prior to failure, an observation which is consistent
with the elastomeric nature of the CSR particles. The fracture morphology of the surfaces of the broken
specimens were examined using SEM to investigate how the different amounts of CSR influence the fracture
behaviour. SEM images (Figure 11) taken from the respective PBZ/CSR surfaces confirmed that, as
expected, poly(BA-a) exhibited a characteristically smooth fracture surface, typical of a glassy (thermoset)
polymer. The surface morphology of the poly(BA-a) blends containing 8- and 16 wt % CSR look
considerably rougher, as would indeed be expected. Nevertheless, it is quite surprising that the morphology
of the blend containing 32 wt % looks very different from the other two blends and even more striking is the
fact that the surface looks much smoother.
14
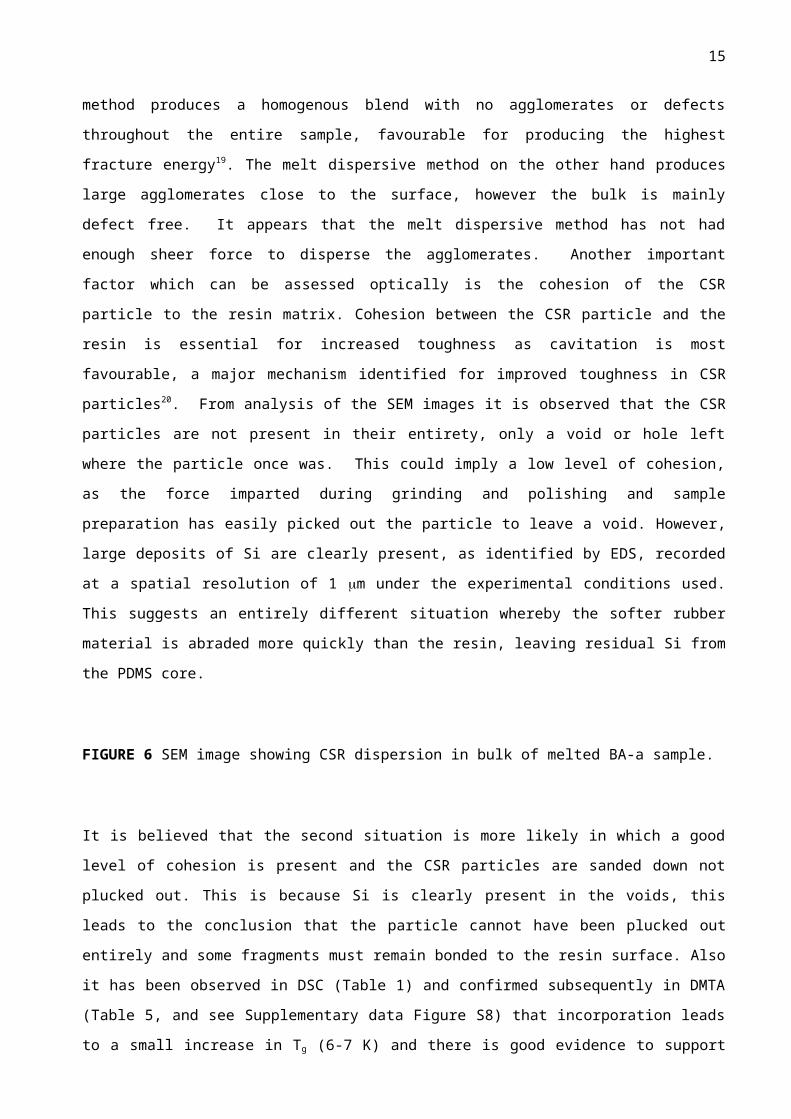
FIGURE 11 SEM images of fractured poly(BA-a) surfaces containing: (a) 0 wt %, (b) 8 wt %, (c) 16 wt %
and (d) 32 wt % CSR.
In order to account for the difference in morphology as well as attempt to understand the deformation
mechanism, the specimens were examined at higher magnification (Figure 12). The captured image reveals
the existence of a high number of small voids, which are found dispersed throughout the sample. At a first
glance, one might consider that this is due to the presence of trapped air bubbles; but such an assumption is
highly unlikely as the size of the cavities is far too small. On the contrary, the identification of spherical
cavities strongly reinforces the presented argument of rubber cavitation as the primary toughening
mechanism in microsphere-reinforced thermoset polymers18,20,21,23. This rubber cavitation is believed to arise
from the de-bonding of the cores from the shells of the CSR particles, followed by plastic void growth of the
BZ matrix and shell21,23. The observation that no such spherical cavities are present in the morphology of the
respective 8 and 16 wt % fractured surfaces indicates to the direction that shear yielding is the principal
toughening mechanism in that concentration range.
FIGURE 12 SEM image of fractured poly(BA-a) surface containing 32 wt% CSR.
CONCLUSIONS
This work has shown that well-dispersed blends of a core shell rubber (CSR) in a commercial benzoxazine
can be obtained by mechanical stirring of CSR powder into the molten monomer. Specimens of varying CSR
concentration, in the range between 0 and 32 wt % were prepared and despite the presence of some defects,
clear trends were identified associated with the effect of CSR on selected properties (e.g. extension, tensile
strength and Young’s modulus). More specifically, increasing CSR concentration to a maximum of 32 wt %
was found to increase extension (by +39 %) whilst it had a negative impact on tensile strength (-17 %) and
Young’s modulus (-44 %). the principal toughening mechanism, with shear yielding occurring at lower
concentrations of CSR. The addition of CSR to the polybenzoxazine resin allows the system to undergo a
plastic deformation process. SEM examination of the fractured surfaces of the same specimens identified
rubber cavitation as the principal toughening mechanism, with shear yielding occurring at lower
concentrations of CSR. The ability to deform plastically increases with CSR content, and whilst toughness
has not been quantified as part of the current program, this increase in plasticity suggests a significant
improvement over the neat resin.
15

ACKNOWLEDGEMENTS
We thank Dr Mark Whiting, Mr Peter Haynes, Mrs. Violeta Doukova, Sujit Gurung (University of Surrey)
for assistance with EDS interpretation, mechanical testing, thermal analysis and optical analysis respectively.
The monomer was kindly supplied by Huntsman Advanced Materials (Basel, Switzerland) and the core shell
rubbers by Wacker (Dr Oliver Schaeffer, Burghausen, Germany).
References
16

1 I. Hamerton, L. Mooring, The use of thermosets in aerospace application, Chapter 7 in Thermosets, Structure,
Properties and Applications, Q. Guo (Ed.) Woodhead Publishing: Oxford, 2012, pp. 189-227.
2 F. Meyer, G. Sanz, A. Eceiza, I. Mondragon, J. Mijović, Polymer 1995, 36, 1407-1414.
3 S.-S. Chang, Polymer 1992, 33, 4768-4778.
4 J. L. Hedrick, I. Yilgõr, G. L. Wilkes, J. E. McGrath, Polym. Bull. 1985, 13, 201-208.
5 H. D. Stenzenberger, W. Roemer, P. M. Hergenrother, B. Jensen, W. Breitigam, 35th Internat. SAMPE Symp.
Exhib., Anaheim, April 2-5, 1990, Proceedings. Book 2 (A90-50056 23-23). Covina, CA, SAMPE 1990, 2175-
2188.
6 J. Murphy, Additives for Plastics Handbook (2nd ed.) Elsevier Science Ltd., 2001
7 F. Wolff-Fabris, V. Alstadt, Electron Beam Curing of Composites, Hanser, 2011
8 G. Wu, J. Zhao, Eur. Polym. J. 2004, 40, 2451.
9 ISO-527-1 (1993) Plastics-determination of tensile properties-part 1: general principles. ISO, Geneva.
10 M. F. Ashby, D. R. H. Jones, Engineering Materials 1: An introduction to their properties and applications;
Chapter 3 - The Elastic Moduli; Chapter 8 - The Yield Strength, Tensile Strength, Hardness and Ductility, 2nd ed.,
Butterworth- Heinemann, 1996.
11 C. Jubsilp, S. Damrongsakkul, T. Takeichi, S. Rimdusit, Thermochim. Acta 2006, 447, 131.
12 I. Hamerton, S. Thompson, B. J. Howlin, C. A. Stone, Macromolecules, 2013, 46, 7605-7615.
13 H. Low, H. Ishida, J. Polym. Sci. Part B Polym. Phys. 1998, 36, 1935.
14 Handbook of Polybenzoxazine Resins, H. Ishida, T. Agag (Eds.) Elsevier: New York, 2011.
15 K. Hemvichian, A. Laobuthee, S. Chirachanchai, H. Ishida, Polym. Degrad. Stab. 2002, 76, 1.
16 H. Ishida, D. Sanders, J. Polym. Sci., Part B: Polym. Phys. 2000, 38, 3289.
17 I. Hamerton, L. T. McNamara, B. J. Howlin, P. A. Smith, P. Cross, S. Ward, Macromolecules, 2014, 47, 1946-
1958.
18 H. Ardhyananta, M. Haniff Wahid, Polymer 2008, 49, 4909.
19 L. Becu, A. Maazouz, H. Sautereau, J. F. Gerard, J. Appl. Polym. Sci. 1997, 65, 2419-2431.
20 F. Ramsteiner, F.; Heckmann, W. Polymer 2002, 43, 5995.
21 P. Kumar Roy, N. Iqbal, D. Kumar, C. Rajagopal, J. Polym. Res. 2014, 21, 348-356.
22 G. Giannakopoulos, K. Masania, A. C. Taylor, J. Mater. Sci. 2011, 46, 327-338.
23 http://promodentchem.com/downloads/brand-analogs/7588.pdf (Access Date:

20/04/2015); Huntsman Araldite MT35600 Benzoxazine Resin, Data Sheet.
24 J. Chen, A. J. Kinloch, S. Sprenger, A. C. Taylor, Polymer 2013, 54, 4276-4289.
25 D. A. Jesson, J. F. Watts, Polym. Rev. 2012, 52, 321-354.
SCHEME 1. Schematic showing the dimensions and geometry of the tensile test specimen.
FIGURE 1 Kissinger and Ozawa plots for polymerisation of BA-a

FIGURE 2 TGA data for poly(BA-a) (top) and CSR (bottom) at 20 K/min under nitrogen.

FIGURE 3 SEM (left) and EDS (right) images of solvent dispersed sample. Dark grey dots show Si identified by
EDS.
FIGURE 4 Cross sectional area of melt-dispersed sample, showing CSR agglomerates close to the surface.

FIGURE 5 (top) Example of agglomerate at magnification (area outlined was analysed by EDS); SEM (bottom
left) and EDS (bottom right) images of agglomerate. Dark grey dots show Si identified by EDS.

FIGURE 6 SEM image showing CSR dispersion in bulk of melted BA-a sample.

FIGURE 7 Plot of DMTA data for poly(BA-a) containing different concentrations of CSR (N.B. Tg determined
from tan (top) and loss modulus (bottom) maxima in the lower traces.

FIGURE 8
Bar graph of extension (top), tensile strength (centre) and Young’s modulus (bottom) of the poly(BA-a) blends
containing various CSR concentrations.


FIGURE 9 Graphs of mean extension (top), tensile strength (centre) and Young’s modulus (bottom) against CSR
concentration.
FIGURE 10 Comparison of stress-strain responses of (a) poly(BA-a) and (b) the poly(BA-a) blend containing 32
wt % CSR.

FIGURE 11 SEM images of fractured poly(BA-a) surfaces containing: (a) 0 wt %, (b) 8 wt %, (c) 16 wt % and (d)
32 wt % CSR.
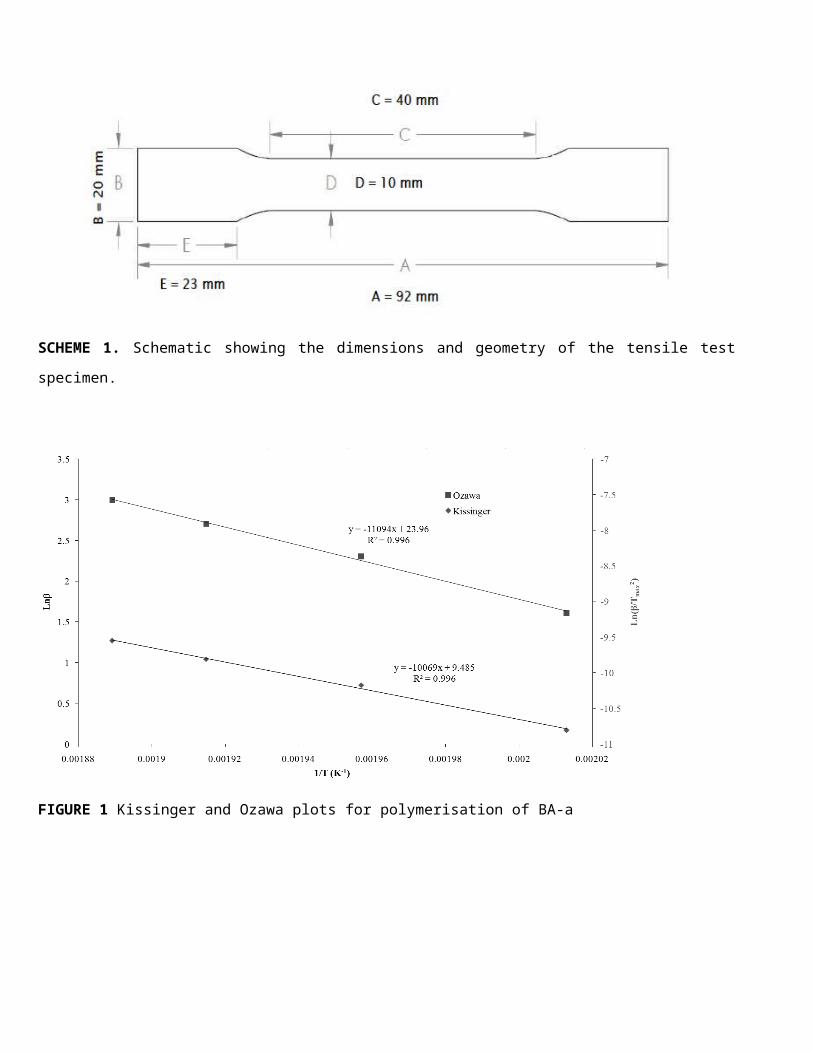
FIGURE 12 SEM image of fractured poly(BA-a) surface containing 32 wt% CSR.
TABLE 1 DSC Data for cured BA-a/CSR blends heated at 10 K/minute under nitrogen (50 cm3/min.)
CSR
(wt%)
Tm
(C)
Hm To
(C)
Tmax
(C)
Hp Glass transition (C)
(J/g) (kJ/mol) (J/g) (kJ/mol
Bz)
Tgo Tgf Tgm
0 39.1 4.4 9.4 200.0 239.5 343.2 371.0 136.1 181.2 158.7
1 101.9 50.5 110.3 198.4 238.9 345.7 377.4 129.6 178.0 153.9
2 102.4 45.1 99.4 201.2 237.7 313.9 346.1 135.5 181.5 158.6
4 98.3 43.8 98.3 200.0 237.1 309.5 347.9 140.5 177.2 158.9
8 98.4 30.6 98.4 194.3 235.7 296.2 345.8 143.6 184.1 163.9
16 98.2 47.3 98.2 188.9 234.7 288.7 362.0 153.4 189.0 170.8
32 96.8 18.1 96.8 187.1 234.2 231.0 329.6 188.7 219.0 203.8
Key:

Tm = Melting temperature, ΔHm = Melting endotherm (per monomer unit), To = Onset of polymerisation exotherm,
Tmax = Peak maximum of exotherm, ΔHp = Polymerisation enthalpy (per benzoxazine ring), Tgo = Onset of glass
transition temperature (rescan), Tgm = Midpoint of glass transition (extrapolated), Tgf = Completion of glass
transition (rescan).
TABLE 2 DSC Data for selected BA-a/CSR blends (various heating rates under nitrogen, 50 cm3/min.)
CSR (wt %) Heating rate
(K/min)
Tmax (C) Hp
(J/g) (kJ/mol Bz)
0 5 233.6 366.1 84.7
10 237.8 297.5 68.8
15 249.1 321.1 74.3
20 256.2 320.0 74.0
8 5 220.7 493.8 105.1
10 235.7 508.8 108.3
15 245.1 518.2 110.3
20 252.3 525.5 111.8
32 5 219.6 492.8 77.5
10 234.2 507.3 79.8
15 243.6 516.8 81.3
20 250.8 524.0 82.4
Key:
Tmax = Peak maximum of exotherm, ΔHp = Polymerisation enthalpy (per benzoxazine ring).
TABLE 3 Comparison of kinetic parameters for selected BA-a/CSR blends

CSR (wt %) Ozawa Method Kissinger Method
Activation energy
(kJ/mol)
Activation energy
(kJ/mol)
Pre-exponential factor
(A x 107) at 393 K
Rate constant
(k x 10-4, s-1)
0 87.7 83.7 13.3 9.9
8 90.0 86.2 27.9 9.8
32 90.9 87.2 37.7 9.8
TABLE 4 TGA data for BA-a/CSR blends acquired at 10 K/min (nitrogen)
CSR
content
(wt %)
Temperature (C) at which weight loss (%) recorded Tmax (C) Yc (%)
10 % 20 % 30 % 40 % 50 % 60 % 70 %
0 303 351 377 402 433 476 699 382 29.4
1 326 361 386 411 444 492 - 383 32.4
2 328 362 387 412 447 503 - 383 33.3
4 331 365 390 417 452 519 - 383 34.5
8 331 366 391 420 456 530 - 386 35.4
16 337 373 401 433 471 554 - 384 36.5
32 348 384 419 445 478 542 - 441 35.4
100 332 361 379 398 421 443 443 444 1.3
Key:
Tmax = Temperature at which maximum rate of mass loss recorded, Yc = Residual mass recorded at 800 C
TABLE 5 Dynamic mechanical data for BA-a/CSR blends

CSR Content (wt %) Glass transition temperature (C) Room temperature
modulus (MPa)From loss modulus From tan
0 175 191 3460
1 176 191 3260
2 175 191 3250
4 175 190 3000
8 177 192 2750
16 178 194 2760
32 182 197 2310
TABLE 6 Tensile testing data (N.B., outliers italicised)

CSR (wt %) Extension (mm) Tensile strength (MPa) Young’s modulus (MPa)
0 0.76 24.05 5,656
0.79 22.79 5,568
0.72 20.11 5,593
1.00 31.72 4,978
0.82 (Mean) 0.07
(SEM)
24.67 (Mean) 2.49
(SEM)
5,449 (Mean) 158.0
(SEM)
8 0.58 13.69 4,629 (void present)
1.09 26.82 4,494
1.02 28.57 4,297
0.92 22.14 3,608
0.43 9.42 2,001 (large void present)
0.84 23.68 4,508
0.77 18.61 3,866
0.92 22.65 3,821
0.93
(Mean)
0.05
(SEM)
23.75 (Mean) 1.78
(SEM)
4,099 (Mean) 191.5
(SEM)
16 0.62 11.01 2,185
0.65 13.16 2,502
0.45 9.19 3,249 (large void present)
0.69 15.41 3,248
0.60 15.84 3,147
0.66
(Mean)
0.03
(SEM)
14.06 (Mean) 0.99
(SEM)
2,818 (Mean) 227.5
(SEM)
32 0.85 16.94 3,631
1.00 23.67 2,966
1.07 17.47 3,436
1.78 24.64 2,528

Key SEM = standard error of the mean.