Epidemiology of Infectious Corneal Ulcers at Tertiary Centers in Vancouver, BC Karolien Termote,...
12
Epidemiology of Infectious Corneal Ulcers at Tertiary Centers in Vancouver, BC Karolien Termote, Aaron W Joe, Andrea L Butler, Simon J Holland, Sonia N Yeung None of the authors have a financial interest in the subject matter of this poster.
-
Upload
frederick-sutton -
Category
Documents
-
view
213 -
download
0
Transcript of Epidemiology of Infectious Corneal Ulcers at Tertiary Centers in Vancouver, BC Karolien Termote,...

Epidemiology of Infectious Corneal Ulcers at Tertiary Centers in Vancouver, BC
Karolien Termote, Aaron W Joe, Andrea L Butler, Simon J Holland, Sonia N Yeung
None of the authors have a financial interest in the subject matter of this poster.

PURPOSE
To study the epidemiology of cultured infectious corneal ulcers in Vancouver, BC, Canada.
Which are the most frequent pathogens? What is their sensitivity profile? Which pathogens are associated with contactlens wear?

METHODS
This is a multicenter, retrospective, observational case series and chart review.
Predetermined search terms were entered into the hospitals’ electronic microbiology databases to create a cohort of patients that had undergone corneal scrapings for ulcers from April 2006 to March 2011.
All specimens were plated on culture media. Cultured species were identified, and antimicrobial sensitivities were performed.
Clinical charts were then reviewed to identify associated contactlens wear.

RESULTS: DEMOGRAPHICS
Inclusion of 281 scrapings from 280 patients
140 males; 140 females
Average age 56,97 yrs
50,4% right eyes
2006-20082009-2011 Total
Corneal cultures (N) 153 128 281
Positive cultures (N) 115 96 211
Recovery (%) 75,2% 75,0% 75,1%
Table 1: Culture Recovery Rate
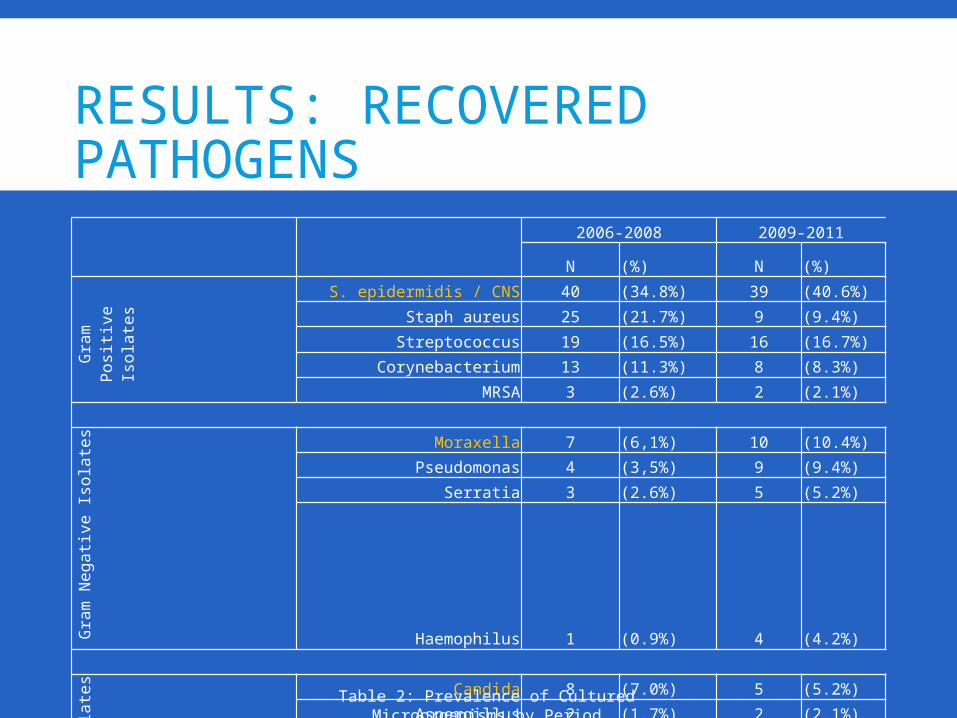
RESULTS: RECOVERED PATHOGENS
2006-2008 2009-2011
N (%) N (%)
Gram Positive Isolates
S. epidermidis / CNS 40 (34.8%) 39 (40.6%)
Staph aureus 25 (21.7%) 9 (9.4%)
Streptococcus 19 (16.5%) 16 (16.7%)
Corynebacterium 13 (11.3%) 8 (8.3%)
MRSA 3 (2.6%) 2 (2.1%)
Gram Negative Isolates
Moraxella 7 (6,1%) 10 (10.4%)
Pseudomonas 4 (3,5%) 9 (9.4%)
Serratia 3 (2.6%) 5 (5.2%)
Haemophilus 1 (0.9%) 4 (4.2%)
Fungal Isolates Candida 8 (7.0%) 5 (5.2%)
Aspergillus 2 (1.7%) 2 (2.1%)
Other 3 (2.6%) 1 (1.0%)
Acanthamoeba 6 (5.2%) 5 (5.2%)
Table 2: Prevalence of Cultured Microorganisms by Period

RESULTS: GRAM STAIN
2006-2008
2009-2011
Total Gram Positive (N) 115 85Total Gram Negative (N) 19 33
Ratio (G+:G-) 1:0.16 1:0.39
Table 3: Ratio of Gram Positive / Gram Negative Isolates

RESULTS: MONO- VS POLYMICROBIAL
2006-2008
2009-2011
Monomicrobial Isolates (%) 73.0% 72.9%Polymicrobial Isolates (%) 27.0% 27.1%
2006-2008 2009-2011Monomicrobial G+ Isolates (%) 67,2% 49,8%Monomicrobial G- Isolates (%) 15,1% 34,2% Monomicrobial Acanthamoeba (%) 7,1% 5,7%Polymicrobial with G+ (%) 97,0% 96,6%Polymicrobial with G- (%) 15,9% 27,8%Polymicrobial with Acanthamoeba (%) 0% 3,8%
Table 4: Mono-/Polymicrobial Isolates by Period
Table 5: Etiology of Mono-/Polymicrobial Isolates by Period

RESULTS: SENSITIVITY TO ANTIBIOTICS
Table 6: In Vitro Sensitivity to Antibiotics by Period
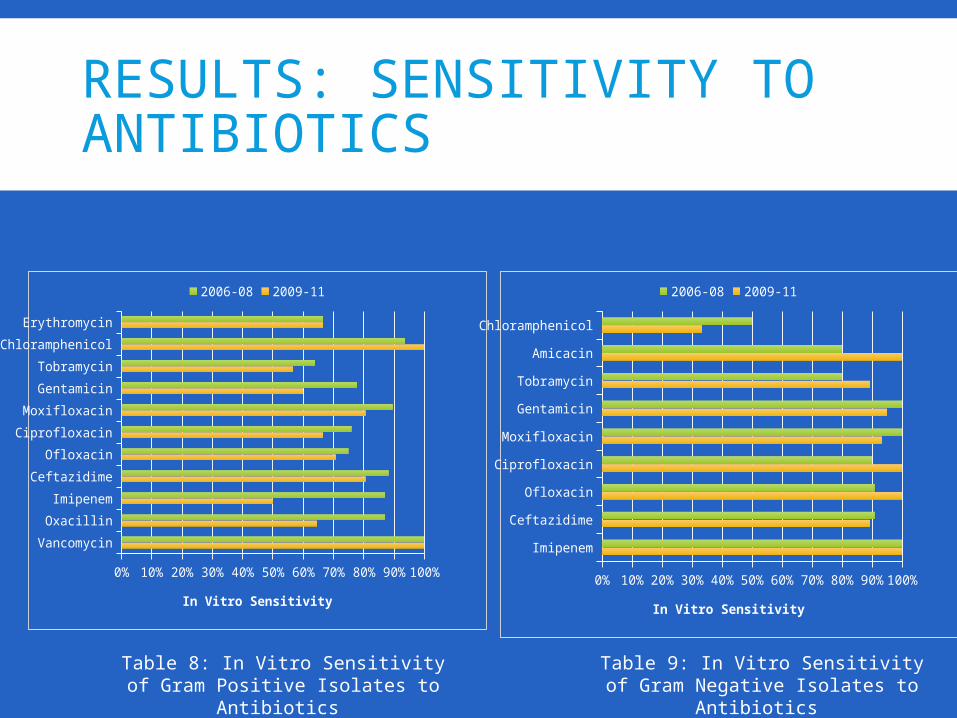
RESULTS: SENSITIVITY TO ANTIBIOTICS
Imipenem
Ceftazidime
Ofloxacin
Ciprofloxacin
Moxifloxacin
Gentamicin
Tobramycin
Amicacin
Chloramphenicol
0% 10% 20% 30% 40% 50% 60% 70% 80% 90%100%
2006-08 2009-11
In Vitro Sensitivity
Vancomycin
Oxacillin
Imipenem
Ceftazidime
Ofloxacin
Ciprofloxacin
Moxifloxacin
Gentamicin
Tobramycin
Chloramphenicol
Erythromycin
0% 10% 20% 30% 40% 50% 60% 70% 80% 90%100%
2006-08 2009-11
In Vitro Sensitivity
Table 8: In Vitro Sensitivity of Gram Positive Isolates to
Antibiotics
Table 9: In Vitro Sensitivity of Gram Negative Isolates to
Antibiotics

RESULTS: SENSITIVITY TO ANTIBIOTICS
CNS MoraxellaOfloxacin 65,4% 100,0%Ciprofloxacin 65,4% 100,0%Moxifloxacin 80,8% 100,0%Gentamicin 84,0% 100,0%Tobramycin 84,6% 100,0%
Table 10: Sensitivity of Most Prevalent Gram Positive and Gram Negative Species to Empirically
Used Antibiotics

RESULTS: CONTACTLENS ASSOCIATION
CL non-CL
Gram Positive Isolates %
Staph aureus 0,0% 14,0%
MRSA 2,3% 1,7%
S. epidermidis / CNS 25,6% 28,1%
Streptococcus 9,3% 12,8%
Corynebacterium 2,3% 8,3%
Total Gram Positive 46,5% 74,8%
Gram Negative Isolates %
Pesudomonas 14,0% 2,9%
Moraxella 2,3% 6,6%
Serratia 4,7% 1,2%
Haemophilus 0,0% 0,8%
Total Gram Negative 20,9% 17,8%
Fungal Isolates %
Candida 7,0% 4,1%
Aspergillus 2,3% 1,2%
Other 2,3% 1,2%
Total Fungal 11,6% 6,6%
Acanthamoeba 20,9% 0,8%

CONCLUSION
Positive culture results were most commonly Gram positive bacteria, followed by Gram negative bacteria, then fungi, and finally parasites.
We found an increase in Gram negative isolates over time, both in mono- and polymicrobial ulcers.
General sensitivity to moxifloxacin, gentamicin and oxacillin decreased over time.
Frequently empirically used antibiotics have poorer coverage for Gram positive isolates than for Gram negative isolates.
Contactlens related ulcers were, in comparison to non contactlens related ulcers, more often caused by Gram negative pathogens, fungi and Acanthamoeba species.