
EPA Traceability Protocol for Assay and Certification of ...
174
EPA Traceability Protocol for Assay and Certification of Gaseous Calibration Standards Office of Research and Development National Risk Management Research Laboratory EPA 600/R-12/531 | May 2012 | www.epa.gov/ord
Transcript of EPA Traceability Protocol for Assay and Certification of ...

EPA Traceability Protocol for Assay and Certifi cation of Gaseous Calibration Standards
Offi ce of Research and DevelopmentNational Risk Management Research Laboratory
EPA 600/R-12/531 | May 2012 | www.epa.gov/ord


EPA/600/R-12/531 May 2012
EPA Traceability Protocol for Assay and Certification of Gaseous
Calibration Standards
by
Robert S. Wright Air Pollution Prevention and Control Division
National Risk Management Research Laboratory Research Triangle Park, NC 27711
National Risk Management Research Laboratory Office of Research and Development
U.S. Environmental Protection Agency Research Triangle Park, NC 27711

EPA Traceability Protocol for Gaseous Calibration Standards
ii
. Cover photo: Gas cylinders stored at the National Institute of Standards and
Technology laboratory in Gaithersburg, Maryland (photo courtesy of National Institute of Standards and Technology)
Industrial facility at sunset (photo courtesy of Mikael Miettinen,
Göteborg, Sweden, http://www.flickr.com/photos/mikaelmiettinen/)
Notice
This document has been reviewed in accordance with U.S. Environmental Protection Agency policy and approved for publication. Mention of trade names or commercial products does not constitute endorsement or recommendation for use.

EPA Traceability Protocol for Gaseous Calibration Standards
iii
Contents Section 1 - Summary of Changes ......................................................................... 1 Section 2 - EPA Traceability Protocol for Assay and Certification of Compressed Gas Calibration Standards .................................................................................... 5
2.1 General Information ................................................................................. 5 2.2 Procedure G1: Assay and Certification of a Compressed Gas Calibration Standard without Dilution .............................................................. 37 2.3 Procedure G2: Assay and Certification of a Compressed Gas Calibration Standard using Dilution ................................................................. 47 2.4 Procedure G3: Assay and Certification of a Zero Air Material as Conforming to 40 CFR Part 72.2 ..................................................................... 63
Section 3 - EPA Traceability Protocol for Assay and Certification of Permeation Device Calibration Standards ............................................................................. 71
3.1 General Information ............................................................................... 71 3.2 Procedure P2: Assay and Certification of Permeation Device Calibration Standards based on a Compressed Gas Reference Standard ....................... 79 3.3 Procedure P3: Assay and Certification of Permeation Device Calibration Standards based on a Mass Reference Standard ........................................... 89
Section 4 - EPA Traceability Protocol for Assay and Certification of Dynamic Gas Dilution Systems ................................................................................................. 97
4.1 Procedure D1: Assay and Certification of a Dynamic Gas Dilution System ............................................................................................................ 97
Section 5 - References ..................................................................................... 115 Appendix A - Statistical Spreadsheet for Procedures G1 and G2 ..................... 121 Appendix B - Statistical Spreadsheet for Procedure P3 .................................... 133 Appendix C - Statistical Spreadsheet for Stability Determination ...................... 139 Appendix D - Matrix Notation ............................................................................ 142 Appendix E - Statistical Spreadsheet for Procedure G3 ................................... 151 Appendix F - Statistical Spreadsheet for Procedure D1 .................................... 156

EPA Traceability Protocol for Gaseous Calibration Standards
iv
Figures Number Page
2-1 Example regression curve and confidence bands for multipoint calibration
15
2-2 Apparatus for the assay of calibration standards without dilution 38
2-3 Two designs for assay apparatus with dilution (Procedure G2) 49
3-1 One possible design of the apparatus for the assay of
permeation device calibration standards referenced to a compressed gas reference standard
81
3-2 Chamber for storing permeation tubes 91
3-3 Example of Appendix B spreadsheet graphic output 95
4-1 One possible design of a gas dilution system for the generation
of pollutant gas mixtures using dynamic dilution methods 99
Tables Number Page 2-1 Summary of Compressed Gas SRMs, NTRMs, and RGMs that
are available from NIST and their Concentration Ranges 8
2-2 NIST and VSL Primary Gas Mixture Suites that are declared to
be Equivalent 9
2-3 Maximum Certification Periods for Calibration Standards in
Passivated Aluminum Cylinders 31
EPA Traceability Protocol for Gaseous Calibration Standards
v
Acknowledgments This traceability protocol is a revision of an earlier protocol1 that was itself revised in 1997. The original protocol was prepared in 1978. This revision was reviewed by personnel of U.S. EPA, the National Institute of Standards and Technology (NIST), the South Coast Air Quality Management District (AQMD), and the Van Swinden Laboratorium (VSL, the national metrology institute of the Netherlands) as it was being prepared. The author thanks the following individuals for their assistance in providing technical information, reviewing this revision of the protocol, and providing comments: Lara Autry (EPA) Thien Bui (EPA) Raul Dominguez (AQMD) Dave Duewer (NIST) William Dorko (NIST) Lyn Gameson (NIST) Frank Guenther (NIST) Michael Papp (EPA) John Schakenbach (EPA) Avraham Teitz (EPA) Blaza Toman (NIST) Rob Wessel (VSL) Several specialty gas producers and other organizations provided useful comments and suggestions for improving this revision of the protocol. The author thanks the following organizations for their assistance in providing technical information, reviewing this revision, and providing comments: Airgas Air Liquide Applied Gas Bios International Environics Linde Matheson NorLab Praxair Scott-Marrin Takachiho The spreadsheet modifications for this revision were made by Dr. Brian Lopes and Dr. Kevin Ross, who were then working in the Statistics Department of the University of North Carolina at Chapel Hill, and by Avraham Teitz of EPA Region 2. The spreadsheets were first constructed by Dr. Michael Messner, who was then working at RTI International.

EPA Traceability Protocol for Gaseous Calibration Standards
vi

EPA Traceability Protocol for Gaseous Calibration Standards
1
Section 1 - Summary of Changes The U.S. Environmental Protection Agency (EPA) in Research Triangle Park, North Carolina has revised the 1997 version of its traceability protocol for the assay and certification of compressed gas and permeation-device calibration standards.1 The protocol allows producers of these standards, users of gaseous standards, and other analytical laboratories to establish traceability of EPA Protocol Gases to gaseous reference standards produced by the National Institute of Standards and Technology (NIST). Parts 50, 58, 60, 72, and 75 of Title 40 of the Code of Federal Regulations (CFR) require using Standard Reference Materials (SRMs) or gaseous standards traceable to SRMs for calibrating and auditing ambient air and stationary source pollutant monitoring systems2-7. This revision of the protocol has several major and minor changes from the 1997 revision, including those listed below: 1. NIST-Traceable Reference Material Primes (NTRM*s) and Research
Gas Materials (RGMs) are acceptable analytical reference standards for the assay of candidate standards (see Subsection 2.1.3);
2. Candidate standards can be made traceable to an expanded list of
NIST and VSL reference standards and the concentration ranges of these reference standards have been expanded. This list includes zero air materials (see Subsection 2.1.3);
3. The statistical test that is used to determine the stability of reactive
gas mixtures has been changed from Student's t-test to Schuirmann's two one-sided tests (TOST), which will be used to determine if the mean concentrations from the two assays differ by 1.0 percent or less. TOST is used in the pharmaceutical industry to show analytical method equivalency. It is superior to Student's t-test because it does not allow substantial concentration differences to pass the statistical significance test if measurement precision is poor. That is, being able to find that a candidate standard's concentration is stable (i.e., within the TOST acceptance criterion) is more important than not being able to find that the concentration is unstable (see Subsection 2.1.5.2);
4. The uncertainty of the concentration of a candidate standard will now
be expressed as the expanded uncertainty (U) as described in the Guide to the Expression of Uncertainty in Measurements (GUM), published by International Organization for Standardization (ISO). The calculated value of U must be given in the certification documentation. The use of an uncalculated or blanket estimate of U (e.g. +/- 1 percent) is not acceptable. (see Subsection 2.1.6);

EPA Traceability Protocol for Gaseous Calibration Standards
2
5. The Excel spreadsheets associated with the protocol have been updated to reflect the revisions to the protocol. If a specialty gas producer wishes to use an equivalent statistical technique to calculate the expanded uncertainty, the producer must first submit a detailed description of the technique and any supporting software to EPA for statistical evaluation and approval (see Subsection 2.1.6);
6. The specialty gas producer's Protocol Gas Verification Program
(PGVP) vendor identification number is required in the certification documentation (see Subsection 2.1.7);
7. The certification expiration date is defined as the certification date plus
the certification period plus one day and is required in the certification documentation (see Subsection 2.1.7);
8. Maximum certification periods for certified standards have been
extended in Table 2-3. Specialty gas producers may elect to certify candidate standards for less than these periods if they believe that they cannot prepare standards whose stability attains the maximum certification period. The default certification period is that given in Table 2-3. Each producer has discretion in this matter. (see Subsection 2.1.9);
9. If the time period between the initial and second assays is at least 6
months and if the mean concentrations from the two assays are demonstrated to be within 1.0 percent of each other using TOST, candidate standards whose concentrations are lower than the concentration range given in Table 2-3 may be certified for the full certification period given in Table 2-3 rather than only six months as was specified in earlier versions of the protocol (see Subsection 2.1.9);
10. Standards may be recertified if the cylinder pressure after the assays
have been completed is greater than 100 psig (see Subsection 2.1.11);
11. The minimum cylinder pressure has been changed to 100 psig (see
Subsection 2.1.12); 12. The PGVP is the primary accuracy assessment for EPA Protocol
Gases. EPA air pollution monitoring regulations specify that the regulated community must use EPA Protocol Gases from PGVP participants (see Subsection 2.1.13);
13. A new procedure and an associated spreadsheet have been prepared
for the assay and certification of a compressed gas zero air material
EPA Traceability Protocol for Gaseous Calibration Standards
3
as conforming to 40 CFR Part 72.2 (see Subsection 2.4). At this time, EPA does not require the regulated community to use NIST-traceable zero air materials for the calibration of ambient air or continuous emission monitors that are required by 40 CFR Parts 50, 58, 60, and 75. However, end users may elect to purchase these standards from specialty gas producers who elect to assay and certify them;
14. Section 3 concerns the assay and certification of permeation device
reference standards. It is largely unchanged from the 1997 version although some wording and reference citations have changed. However, Procedure P1 for comparison of a candidate standard to a permeation device reference standard has been omitted because such reference standards are no longer sold by NIST.
15. A new procedure has been written and a new spreadsheet has been
prepared for the assay and certification of dynamic gas dilution systems (see Section 4). At this time, EPA does not require the regulated community to use NIST-traceable dynamic gas dilution systems for the calibration of ambient air or continuous emission monitors that are required by 40 CFR Parts 50, 58, 60, and 75. However, end users may elect to use these systems for calibrations.
The producers of reference standards that are assayed and certified under this protocol are allowed one year after the publication of this revision of the protocol to implement the changes that have been made to this protocol. After the year has elapsed, producers must follow the procedures given in this revision of the protocol if they wish to sell reference standards as "EPA Protocol Gases". They must also participate in the PGVP (see Subsection 2.1.13).


EPA Traceability Protocol for Gaseous Calibration Standards
5
Section 2 - EPA Traceability Protocol for Assay and Certification of Compressed Gas Calibration Standards 2.1 General Information 2.1.1 Purpose and Scope of the Protocol Use of this protocol is mandatory for certifying the calibration gases being used for the calibration and audit of ambient air quality analyzers and continuous emission monitors that are required by 40 CFR Parts 50, 58, 60, and 75 2-5. This protocol describes three procedures for assaying candidate standards (i.e., not-yet-certified standards) and for certifying that their concentrations are traceable to a National Institute of Standards and Technology (NIST) compressed gas reference standards [i.e., Standard Reference Materials (SRMs), NIST-Traceable Reference Materials3 [NTRMs, including NTRM-Primes (NTRM*s) for which NIST analyzes every sample in the production lot], and NIST Research Gas Materials (RGMs)]. It may be used to assay and certify only candidate standards that have the same components and concentration ranges as NIST-traceable reference standards. A multiple-component candidate standard may be assayed and certified under this protocol if NIST-traceable reference standards that contain the same individual components as are in the candidate standard exist. This protocol may be used by specialty gas producers, end users, or other laboratories to assay candidate standards. The assay involves the direct comparison of the candidate standards to NIST-traceable reference standards without dilution (i.e., Procedure G1) or the indirect comparison of the candidate standards to reference standards with dilution (i.e., Procedure G2). A candidate standard having a concentration that is lower or higher than that of the reference standard may be certified under this protocol if both standards' concentrations (or diluted concentrations) fall within the well-characterized region of the analyzer's calibration curve. This protocol places no restrictions on cylinder sizes and the same analytical procedures must be used in assays of all cylinder sizes. Standards that are certified under this protocol must remain in the cylinders in which they were originally assayed. Unassayed standards in cylinders that have been transfilled from cylinders assayed under this protocol cannot be certified as being EPA Protocol Gases This protocol may be used to assay and certify zero air materials. Certified impurity concentrations can be certified using Procedures G1 or G2. Procedure G3 can be used to certify that zero air materials conform to the purity specifications of 40 CFR Part 72.2 (i.e., concentrations of SO2, NOX, and THC are not greater than 0.1 ppm; whose concentration of CO is not greater than1 ppm; and whose concentration of CO2 is not greater than 400 ppm)7.

EPA Traceability Protocol for Gaseous Calibration Standards
6
2.1.2 Using the Protocol The assay/certification protocol described here is designed to minimize both systematic and random errors in the assay process. Therefore, the protocol must be carried out exactly as it is described. The assay procedures in this protocol include one or more possible designs for the assay apparatus. The analyst is not required to use these designs and may use alternative components and configurations that produce equivalent-quality measurements. The protocol is like a basic recipe that cooks will follow while substituting different ingredients. 2.1.3 Reference Standards The EPA monitoring regulations define a "traceable" standard as one that has been compared and certified, either directly or via not more than one intermediate standard, to a primary standard such as an SRM or a Certified Reference Materials (CRM).3,4 The monitoring regulations require that calibration gases used for calibration and audit of ambient air quality analyzers and continuous emission monitors be traceable to NIST-traceable reference standards, which are listed in Table 2-1. NIST's Policy on Metrological Traceability (see www.nist.gov/traceability/) has adopted the international definition of metrological traceability: "property of a measurement result whereby the result can be related to a reference through a documented unbroken chain of calibrations, each contributing to the measurement uncertainty." This protocol extends metrological traceability to standards that are assayed and certified by maintaining the unbroken chain of calibrations to NIST reference standards, by documenting the assay procedure and the assay results, and by estimating the uncertainty of certified standards. In 2010, NIST and VSL (Van Swinden Laboratorium, the National Metrology Institute of the Netherlands) issued a joint Declaration of Equivalence (DOE, see http://www.vsl.nl/files/DOE_Scan.pdf) that specific VSL Primary Reference Materials (PRMs) and VSL CRMs are equivalent to the corresponding SRMs within stated uncertainties. The current SRM-equivalent PRMs and CRMs that are available from VSL are listed in Table 2-2. Other gas mixtures may be added to the DOE in the future. PRMs or CRMs from another national metrology organization will be considered equivalent to SRMs when a DOE is issued jointly by NIST and the organization. PRMs and CRMs that are not declared to be equivalent to SRMs cannot be used as reference standards under this protocol. The generic terms "PRM" and "CRM" are used to refer to any SRM-equivalent standard that is listed in a DOE. Comparison of a candidate standard directly to an SRM, an NTRM, an RGM, a PRM or a CRM is preferred and recommended. However, the use of a Gas Manufacturer's Intermediate Standard (GMIS) (see Subsection 2.1.3.1) in the comparison is permitted. A GMIS is an intermediate reference standard that

EPA Traceability Protocol for Gaseous Calibration Standards
7
has been compared directly to an SRM, an NTRM, an RGM, a PRM or a CRM according to Procedure G1. It is an acceptable reference standard for the assay of candidate standards. However, purchasers of standards that have been compared to a GMIS should be aware that, in conformity with the above definition, such a standard could only be used directly for calibration or audit. Such a standard could not be used as a second-generation intermediate reference standard to assay other candidate standards. Accordingly, the reference standard used for assaying and certifying a candidate standard under this protocol must be an SRM, an NTRM, an RGM, a PRM, a CRM or a GMIS. A summary of the compressed gas SRMs, NTRMs, and RGMs that are certified by NIST is given in Table 2-1. A summary of the PRMs and CRMs that are equivalent to NIST reference standards is given in Table 2-2. The reference standard must be within its certification period. Flow rate reference standards or gas dilution systems must be traceable to NIST flow rate, volume, mass or time reference standards by original calibration at a NIST-accredited state weights and measures laboratory or at a testing and calibration laboratory that is accredited by the National Voluntary Laboratory Accreditation Program (NVLAP), the American Association for Laboratory accreditation (A2LA) or by the International Laboratory Accreditation Conference (ILAC) under ISO/IEC 17025 (General Requirements for the Competence of Testing and Calibration Laboratories).10,11, 12 They must be recertified on an annual basis using NIST-traceable reference standards although this recertification may be performed in the analytical laboratory in which the candidate standards are assayed. These volume reference standards are required for assays using Procedure G2 (see Subsection 2.3.4). Alternatively, flow rate reference standards or gas dilution systems may be traceable to the flow rate, volume, mass or time reference standards of other national metrology institutes (e.g., KRISS in South Korea, NEL in the United Kingdom, PTB in Germany) provided that these institutes are participants in the Working Group for Fluid Flow (WGFF) of the International Committee for Weights and Measures (CIPM).

EPA Traceability Protocol for Gaseous Calibration Standards
8
TABLE 2-1. Summary of Compressed Gas SRMs, NTRMs, and RGMs that are
available from NIST and their Concentration Rangesa
Certified component
Balance gas
SRM b range
NTRMb range RGMb range Certification period (years)
Ammonia Nitrogen Not available Not available 5 to 50 ppm 1
Carbon dioxide Air 345 to 390 ppm 340 to 400 ppm 350 to 420 ppm 8
Carbon dioxide Nitrogen 500 ppm to 16 % 2 ppm to 20 % Contact NIST 8
Carbon monoxide Air 100 to 500 ppb 100 to 500 ppb 40 to 400 ppb TBDc
Carbon monoxide Air 10 to 45 ppm 10 to 45 ppm Contact NIST 8
Carbon monoxide Nitrogen 10ppm to 13% 0.1 ppm to 15% Contact NIST 8
Formaldehyde Nitrogen Not available Not available 0.5 to 10 ppm 1 Hydrogen chloride Nitrogen Not available Not available Contact NIST TBD
Hydrogen sulfide Nitrogen 5 to 20 ppm 1 to 400 ppm Contact NIST 3
Methane Air 1 to 100 ppm 1 to 1000 ppm 1.7 to 2.2 ppm 8 Methane Nitrogen Not available 0.5 ppm to 4% Contact NIST 8 Methanol or ethanol
Nitrogen or Air Not available Not available 75 to 500 ppm 4
Natural gas componentsd
Natural gas Not Available Contact NIST Contact NIST 4
Nitric oxide Nitrogen 0.5 to 50 ppm 0.5 to 50 ppm Contact NIST 3 Nitric oxide Nitrogen 50 to 3,000 ppm 50 to 3,000 ppm Contact NIST 8 Nitrous oxide Air TBD 300 ppb to 5% 300 to 350 ppb 6 Total oxides of nitrogen (NOX)e Air 100 ppm 10 to 100 ppm 5 to 100 ppm 6
Oxygen Nitrogen 2 to 21 % 0.4 to 25 % Contact NIST 8 Propane Air 0.1 to 500 ppm 0.1 to 500 ppm Contact NIST 8 Propane Nitrogen 100 ppm to 2 % 5 ppb to 2% Contact NIST 8 Sulfur dioxide Nitrogen 5 ppm 5 to 50 ppm Contact NIST 4 Sulfur dioxide Nitrogen 50 to 3,500 ppm 50 to 5,000 ppm Contact NIST 8 Volatile organics Nitrogen 5 ppb Contact NIST Contact NIST 4 Zero air materialf Air Not available Not available Contact NIST TBD
a All SRMs may not be available at all times. Other SRMs may be developed in the future and could be used as reference standards. Contact NIST for information about SRM availability. b Concentrations are by mole; ppb = parts per billion; ppm = parts per million. c To be determined. d Natural gas components are methane, ethane, propane, n-butane, iso-butane, n-pentane, iso-pentane, helium, nitrogen, and carbon dioxide. e NIST defines its total NOX standards as containing nitrogen dioxide plus contaminant nitric acid. f Concentrations of SO2, NOX, and total hydrocarbons (THC) are not >0.1 ppm; concentration of CO is not >1 ppm; and concentration of CO2 is not >400 ppm as per 40 CFR Part 72.2.

EPA Traceability Protocol for Gaseous Calibration Standards
9
TABLE 2-2. NIST and VSLa Primary Gas Mixture Suites that are declared to be
Equivalent Certified
component Balance gas Concentrationb
range for gas mixture suite
Maximum allowable
differencec
Stability period (years)
Carbon dioxide Nitrogen 10 ppm to 20 % 0.3 % relative 3
Carbon dioxide Air 100 to 500 ppm 0.5 % relative 3
Carbon monoxide
Nitrogen or Air 1 ppm to 10 % 0.3 % relative 3
Ethanol Nitrogen or Air 75 to 500 ppm 0.5 % relative 3
Hydrogen sulfide Nitrogen 10 to 1000 ppm 1.0 % relative 2 or 3f
Natural gasd Nitrogen Typical 0.5 % relative (0.3 % for CH4)
3
Nitric oxide Nitrogen 0.5 ppm to 1 % 0.5 % relative 2 or 3f
Nitrogen dioxide
Nitrogen or Air 10 ppm to 1 % 0.5 % relative 2
Oxygen Nitrogen 10 ppm to 25 % 0.2 % relative 3
Propane Nitrogen or Air 1 ppm to 1 % 0.3 % relative 1, 2 or 3f
Sulfur dioxide Nitrogen 1 ppm to 1 % 0.5 % relative 2 or 3f
Volatile organic compoundse
Nitrogen 1 ppb to 1 ppm 2 % relative 2
a Information about Reference Gas Mixtures can be obtained from: VSL [i.e., the Van Swinden Laboratorium, the National Metrology Institute of the Netherlands] Thijsseweg 11, 2629 JA Delft, NL P.O. Box 654, 2600 AR Delft NL Telephone: 31 (0) 15 269 1550 FAX: 31 (0) 15 261 2971 E-mail: [email protected] Website: www.vsl.nl b Within the listed ranges, any concentration is available. PRMs are prepared individually in 5-L cylinders according to ISO Standard 6142 (Gas Analysis–Preparation of calibration gas mixtures-weighing methods). After preparation, the composition is verified against VSL Primary Standard Gas Mixtures. CRMs are available in larger size cylinders and are gravimetrically prepared by an accredited supplier. They are certified by VSL against VSL Primary Standard Gas Mixtures. c Maximum allowable difference between NIST and VSL primary standard gas mixture suites. d Methane, ethane, propane, n-butane, iso-butane, n-pentane, iso-pentane, 2,2-dimethylpropane (neopentane), n-hexane, carbon dioxide, and helium. e Ethane, ethene, propane, propene, iso-butane, iso-butene, 1-butene, n-butane, 2-methyl butane, iso-pentane, n-pentane, 1-pentene, 1,3-butadiene, trans-2-pentene, 2-methyl pentane, 2,2,4-trimethyl pentane, n-hexane, n-heptane, benzene, toluene, n-octane, and o-xylene. f Stability period is dependent on the concentration of the PRM/CRM.

EPA Traceability Protocol for Gaseous Calibration Standards
10
2.1.3.1 Gas Manufacturer's Intermediate Standard— A GMIS is a compressed gas calibration standard that has been assayed by direct comparison to an SRM, an NTRM, an RGM, a PRM or a CRM, that has been assayed and certified according to Procedure G1, and that also meets the following requirements: 1. A candidate GMIS must be assayed on at least three separate dates that are
uniformly spaced over at least a 3-month period. During each of these assays, the candidate GMIS must be measured at least three times. All these assays must use the same SRM, NTRM, RGM, PRM or CRM as the reference standard to avoid errors associated with the use of different reference standards for different assays.
2. For each assay, the analyst must calculate the mean concentration and U for
the three or more measurements of the candidate GMIS according to the statistical procedures described in Appendix A or an EPA-approved equivalent statistical technique (see Subsection 2.1.6). The value of U must be less than or equal to 1.0 percent of the mean concentration.
3. After the three or more assays have been completed, the analyst must
calculate the overall mean concentration and U for the candidate GMIS using the spreadsheet described in Appendix C or an EPA-approved equivalent statistical technique (see Subsection 2.1.6). If an EPA-approved equivalent statistical technique is used, it must be identified as such in the certificate documentation and it must be described in media readily accessible to end users.
4. If the mean estimated concentrations from individual assays differ by less
than 1.0 percent using Schuirmann's two one-sided test (TOST)13-18, the candidate GMIS can be considered to be stable and can be used as a reference standard for assays of candidate standards. If the TOST acceptance criterion is not attained, the candidate GMIS may be unstable or there may be analytical problems associated with the assays or the reference standards. The analyst must either disqualify the candidate GMIS or investigate why the TOST acceptance criterion is not attained. The analyst may discard the data from a questionable assay and then conduct another assay. The candidate GMIS can be used as a reference standard if it is stable, but it cannot be used if it appears to be unstable.
5. The certification period for a GMIS is the same as for an EPA Protocol Gas of
the same composition and concentration. 6. A GMIS must be recertified after its original certification period ends. Three
or more discrete measurements of the candidate standard must be made during a single recertification assay. Use the spreadsheet described in Appendix C or an EPA-approved equivalent statistical technique (see

EPA Traceability Protocol for Gaseous Calibration Standards
11
Subsection 2.1.6) to compare the mean concentration from the recertification assay with the mean concentration from the previous assays. If the mean concentrations differ by less than 1.0 percent using TOST, the GMIS can be recertified. If the reassayed GMIS fails to meet the TOST acceptance criterion, it must undergo a full certification as described in Step 1 above before it can be used again. There is no requirement that the same reference standard must be used in the original assays and the recertification assay, but this practice is desirable if possible.
2.1.3.2 Reference Standards for Multipoint Calibrations— The reference standards for the multipoint calibration must be diluted or undiluted SRMs, RGMs, PRMs, CRMs, NTRMs, or GMISs (see Subsection 2.1.3) or dynamically diluted pure gases. Pure gases may be dynamically diluted to prepare gas mixtures for use in multipoint calibrations, but such mixtures may not be used as the reference standards for the span gas check or for the assay of the candidate standard. Pure gases may not be diluted by more than a factor of 100. Information concerning this standard (e.g., cylinder identification number, certified concentration, expanded uncertainty, certification expiration date, cylinder pressure, etc.) must be recorded in the laboratory's records. 2.1.3.3 Reference Standards for Span Gas Checks— The reference standard for the span gas checks must be a diluted or undiluted SRM, RGM, PRM, CRM, NTRM, or GMIS as specified in Subsection 2.1.3. The reference standard for the span gas check need not be the same as one of those used for the multipoint calibration or for the assay of the candidate standard. Information concerning this standard (e.g., cylinder identification number, certified concentration, expanded uncertainty, certification expiration date, cylinder pressure, etc.) must be recorded in the laboratory's records. 2.1.3.4 Reference Standards for Assay of Candidate Standards— The reference standard used for the assay of the candidate standard must be an SRM, an RGM, a PRM, a CRM, an NTRM or a GMIS. This standard need not be the same as any of the reference standards used for the span gas check or for the multipoint calibration. Information concerning the reference standard (e.g., cylinder identification number, certified concentration, expanded uncertainty, certification expiration date, cylinder pressure, etc.) must be recorded in the laboratory's records. 2.1.3.5 Zero Gas for Multipoint Calibrations and Zero Gas Checks— Zero gas used for multipoint calibrations, zero gas checks or for dilution of any candidate or reference standard must be clean, dry, zero-grade air or nitrogen containing no detectable concentration of the pollutant of interest. It may come from compressed gas cylinders or from zero gas generators. The use of NIST-traceable zero air material is recommended, but not required. The zero gas must match the balance gas in the candidate standard and the reference standard, unless it has been demonstrated that the pollutant gas analyzer is insensitive to

EPA Traceability Protocol for Gaseous Calibration Standards
12
differences in the balance gas composition. It also must contain no contaminant that causes a detectable response in the analyzer or that suppresses or enhances the analyzer's response to the pollutant. The oxygen content of zero air must be approximately that of ambient air, unless it has been demonstrated that varying the oxygen content does not suppress or enhance the analyzer's response. The water vapor concentration in the zero gas must be less than 5 ppm. Information concerning the zero gas (e.g., cylinder identification number, cylinder pressure, etc.) must be recorded in the laboratory's records.
For analyzers such as gas chromatographs, the analyst may suspect that the zero gas reading may not accurately represent the zero-intercept of the calibration equation. The analyst may substitute a low-concentration, NIST-traceable reference standard for the zero gas, providing that the concentration of this standard is less than the concentration of the candidate standard. 2.1.3.6 Zero Gas for Assay of Candidate Standards and Zero Air Material— The zero gas used for the assay of candidate standards need not be the same zero gas as used for the multipoint calibrations and zero gas checks, but it must conform to the specifications in Subsection 2.1.3.5. The zero gas used for the assay of zero air material must be an NIST-traceable zero air material. Information concerning the zero gas (e.g., cylinder identification number, cylinder pressure, etc.) must be recorded in the laboratory's records. 2.1.3.7 Minimum Cylinder Pressure for Reference Standards A reference standard must not be used when its gas pressure is below 0.7 megapascals (i.e., 100 psig). NIST has found that some gas mixtures (e.g., nitric oxide in nitrogen) have exhibited a concentration change when the cylinder pressure fell below this value. There is no minimum cylinder pressure specification for zero gas. 2.1.3.8 Recertification of Reference Standards— Recertification requirements for SRMs, NTRMs, and RGMs are specified by NIST. Recertification requirements for PRMs and CRMs are specified by VSL. See Subsection 2.1.3.1 for GMIS recertification requirements. 2.1.4 Analyzer Calibration 2.1.4.1 General Analyzer Calibration Requirements— The assay procedures described in this protocol employ a data reduction technique to calculate the concentration of a candidate standard that corrects for minor analyzer calibration variations (i.e., drift). This technique does not require the absolute accuracy of the analyzer's calibration curve at the time of the assay. The analyzer must: (1) have a calibration curve that is well-characterized for the pollutant of interest (see Subsection 2.1.4.2); (2) have good resolution and low noise; and (3) have a calibration that is known and that is reasonably stable or recoverable during the assay session.

EPA Traceability Protocol for Gaseous Calibration Standards
13
2.1.4.2 Analyzer Multipoint Calibration— The analyzer used for the assay must have had a multipoint calibration within 1 month prior to the assay date. When the assay is on the same day as the calibration, the calibration data are directly used to calculate the certified concentration and expanded uncertainty of the candidate standard using the spreadsheets described in Appendix A or using an EPA-approved equivalent statistical technique (see Subsection 2.1.6). When the assay date is different from the calibration date, these data are not used to directly calculate the certified concentration although they are used to estimate the expanded uncertainty. Zero gas and reference standard measurements on a different assay date are compared to the multipoint calibration data (see Subsections 2.2.6.4 and 2.3.8.4). If only minor calibration drift has occurred since the multipoint calibration, these measurements are used to calculate the certified concentration of the candidate standard. If excessive calibration drift has occurred, the multipoint calibration must be repeated. The analyzer's zero and span controls may be adjusted before the start of the multipoint calibration. If a zero or span adjustment is made, allow the analyzer to stabilize for at least one hour before beginning the multipoint calibration. The waiting period is necessary because some analyzers' calibrations drift for a period of time following a zero or span control adjustment. The multipoint calibration must consist of one or more measurements of the analyzer responses to at least five different concentrations. The use of an NIST-traceable zero air material in the calibration is recommended, but is not required (see Section 2.1.3.3). Record these measurements and the analyzer's zero and span control settings in the laboratory's records. These calibration concentrations should be approximately evenly spaced over the concentration range. The concentrations may be produced by undiluted reference standards or by dilution of reference standards using a gas dilution system. See Subsection 2.1.3.2 for reference standard requirements. If a gas dilution system is used in the assay apparatus, it must have a specified accuracy of no worse than 1.0 percent of the undiluted reference standard concentration. Additionally, the gas dilution system must be checked by the analyst at monthly intervals to verify that its calibration has not drifted significantly since its last calibration or recertification. Use an NIST-traceable flow rate reference standard to check at least one flow rate setting for each pollutant and dilution gas stream in the assay apparatus. Record the indicated and actual flow rates in the laboratory's records. Calculate the relative difference (in percent) between the indicated and actual volumes or flow rates. That is, Relative Difference = 100 (Indicated Flow Rate - Actual Flow Rate) (Actual Flow Rate)

EPA Traceability Protocol for Gaseous Calibration Standards
14
If the relative differences for the pollutant and diluent flow rates are less than 1.0 percent, the calibrations of the gas dilution system has not drifted significantly since its last calibration or recertification and the pollutant gas analyzer calibration can proceed. If the relative differences for either the pollutant flow rate or the diluent flow rate exceed 1.0 percent, significant drift has occurred and the device must be recertified before the assay is conducted. If the analyzer has multiple concentration ranges, a multipoint calibration must be done for all ranges that will be used later for the assay of candidate standards. A multipoint calibration that is conducted on one range is not valid for an assay that is conducted on another range. Data from the multipoint calibration must be evaluated using least-squares regression analysis.19 This analysis technique will be used to determine the analyzer's calibration curve and to characterize the uncertainty associated with the calibration. The concentration values are the independent (i.e., X) values in the analysis and their units may be parts per million, mole percent, or any other appropriate units. The analyzer response values are the dependent (i.e., Y) values in the analysis and their units may be volts, millivolts, percent of scale or any other measurable analyzer response units. The analyzer response values must have a resolution that is less than or equal to 1 percent of the maximum measured analyzer response. Because an analyzer’s response has a random error component, repeated measurements of the same reference standard will not produce identical analyzer responses. The analyst may investigate the analyzer’s precision by making replicate measurements of reference standards at different concentrations. Least-squares regression analysis is normally conducted under the assumption that the precision is the same at all concentrations. However, this statistical assumption may not be true for some real-world analyzers and the analyst may need to use alternate statistical procedures to analyze the multipoint calibration data. Performing replicate measurements at different concentrations and calculating the standard deviation of the analyzer responses at each concentration may allow the analyst to assess whether the precision is the same at all concentrations. Calculate the least-squares regression coefficients of the calibration equation using the spreadsheets described in Appendix A or using an EPA-approved equivalent statistical technique (see Subsection 2.1.6). If an EPA-approved equivalent statistical technique is used, it must be identified as such in the certificate documentation and it must be described in media readily accessible to end users. The spreadsheets allow the multipoint calibration data to be fitted to straight-line, quadratic, cubic, or quartic linear regression models. EPA discourages the use of the cubic and quartic models and believes that better fits

EPA Traceability Protocol for Gaseous Calibration Standards
15
of the data can be obtained by performing multipoint calibrations over more limited concentration ranges and by using straight-line or quadratic models. Inclusion of cubic and quartic models in the spreadsheets is for experimental use or for situations in which there is a theoretical basis for the use of such higher-order models. Analysts should be aware that apparent higher-order calibration curves may be caused by artifacts such as inaccurate reference standards or leaks in a gas dilution system. They should not use higher-order regression models to fit multipoint calibration data that have inadequate precision and that should be fitted to lower-order regression models. Additionally, a multipoint calibration should not change orders from one month to the next. The spreadsheet described in Appendix A will suggest the best regression model for the multipoint calibration data, but the analyst is expected to choose the model that best fits the measurement process on theoretical grounds. Plot the values from the multipoint calibration and the regression curve with confidence bands as shown in Figure 2-1. These plots will provide a graphical representation of the calibration and will permit a qualitative assessment of the uncertainty associated with the calibration. Record the regression coefficients, their expanded uncertainties, and other statistical results from the spreadsheet in the laboratory's records. Enough information should be recorded so that the analyst can calculate the expanded uncertainty of the certified concentration of a candidate standard that is assayed at some later date and to reconstruct these calculations at some later date should questions arise about the calibration data or the spreadsheet calculations. Figure 2-1. Example regression curve and confidence bands for multipoint calibration
However, a quantitative assessment of the calibration's uncertainty is needed to allow the analyst to determine whether the multipoint calibration data adequately characterizes the "true" calibration curve for the analyzer. The

EPA Traceability Protocol for Gaseous Calibration Standards
16
criterion to be used to evaluate the uncertainty of the multipoint calibration is U for a concentration predicted from the regression line using measured values of the analyzer response. This value can be calculated using the spreadsheets described in Appendix A or using an EPA-approved equivalent statistical technique. Record the uncertainty calculations in the laboratory's records. All measurements of candidate standards must fall within the well-characterized region of the analyzer's calibration curve, which lies between the largest and smallest measured concentrations of the multipoint calibration and for which U for the regression-predicted analyzer response is ≤±1 percent of the measured response for the largest concentration in the calibration. For example, assume that a calibration was conducted between 0 and 100 ppm and that the measured responses ranged between 0 and 10 volts. The example calibration is well-characterized for all concentrations between 0 and 100 ppm for which U is ≤±0.1 volt (i.e., ±1 percent of 10 volts). Step 4 of the spreadsheet described in Appendix A allows the analyst to enter various concentrations and obtain the corresponding regression-predicted analyzer response and confidence limits. In effect, U is a measure of how well the multipoint calibration data fit an equation which the analyst assumes is the "true" calibration equation for the analyzer. Comparison of values of U from straight-line and quadratic equations permits the analyst to select the equation that best represents the data. A multipoint calibration may fail to meet this uncertainty criterion for several possible reasons: • inadequate analytical precision; • inaccuracy of the reference standards or the gas dilution system; or • excessive uncertainty in the analyzer's calibration equation due to too
few measurements (either too few replicate measurements at the same concentration or too few different concentrations in the calibration) or to incorrect assumptions about the form of the equation.
The effect of inadequate analytical precision can be reduced by increasing the number of replicate measurements at each calibration concentration or by increasing the number of different concentrations used in the multipoint calibration. Additionally, precision can be improved by using an averaged analyzer response, rather than an instantaneous analyzer response, for each measurement. The most accurate reference standards that are available should be used. An inaccurate gas dilution system can be detected by comparing measurements of the concentration of a diluted reference standard to the theoretically equal concentration of another, undiluted reference standard. It can also be detected by comparing measurements of two theoretically equal concentrations obtained by dilution of two reference standards having significantly different concentrations. An inaccurate gas dilution system must not be used for the multipoint calibration. The effect of excessive uncertainty in a

EPA Traceability Protocol for Gaseous Calibration Standards
17
straight-line calibration equation can be eliminated by using a quadratic calibration equation or by transforming the calibration data mathematically so that they may be fitted to a straight line regression equation. See Reference 16 for a discussion of such linearizing transformations of data. Note that possibly a more restrictive uncertainty criterion applies for the assay of the candidate standard. The value of U for the estimated concentration of the candidate standard must be ≤±1 percent of the concentration of the reference standard (see Subsections 2.2.2 and 2.3.2). For example, assume that (1) an analyzer's calibration equation is well characterized from 0 to 100 ppm and (2) a 70-ppm candidate standard is being assayed at a later date using a 50-ppm reference standard. Then, U must be ≤±0.5 ppm, rather than ≤±1.0 ppm which is derived from the multipoint calibration. 2.1.4.3 Uncertainty of the Calibration Curve— The data reduction technique used in this protocol is based on the assumption that the analyzer has a well-characterized calibration curve. The accuracy of the certified concentration of a candidate standard is dependent upon this assumption. The analyst cannot assume that the analyzer's calibration curve is a straight line between the measured values for the zero gas and the reference standard. The analyst must calculate the calibration equation and the uncertainty for its predicted concentrations by statistical analysis of the measurements obtained during the multipoint calibration. The total uncertainty of the certified concentration for a candidate standard is composed of several components. The first component is the uncertainty associated with the certified concentration of the reference standard. This uncertainty is minimized by using an SRM, an RGM, a PRM, a CRM, an NTRM, or a GMIS as the reference standard. The second component is the precision of the measurements of the reference and candidate standards. This uncertainty is minimized by making replicate measurements of these standards. The third component is the uncertainty associated with the concentrations that are predicted from the analyzer's calibration curve. This uncertainty concerns whether an assumed calibration equation accurately represents the "true" calibration curve. This third component of uncertainty does not exist if the concentrations of the reference and candidate standards are equal. The assumed calibration equation and the true calibration curve will pass through the data for the reference standard regardless of whether they diverge elsewhere and the equation will be accurate for that single concentration. However, the uncertainty does exist if the concentrations of the reference and candidate standards differ. The assumed and true calibration curves may pass through different points for concentrations not equal to that of the reference standard. Analytical errors will develop because of this difference.

EPA Traceability Protocol for Gaseous Calibration Standards
18
The measure of this uncertainty that is most directly useful to the analyst is the value of U for a regression-predicted concentration given one or more measurements of the candidate standard. This value may be calculated using the spreadsheet described in Appendix A or using an EPA-approved equivalent statistical technique (see Subsection 2.1.6). Several points should be noted about this value. First, its magnitude decreases as n increases where n is the number of measurements in the multipoint calibration. Second, its magnitude decreases as n increases, where n is the number of measurements of the candidate standard. Third, its magnitude increases as the mean measured analyzer response ( 'Y ) for the candidate standard diverges from the overall mean measured analyzer response (Y ) for the multipoint calibration. These points mean that it becomes easier to satisfy the uncertainty criterion as one increases the number of measurements in the multipoint calibration and in the assay of the candidate standard. Additionally, the absolute uncertainty of the regression predicted concentration is larger at the extremes of the calibrated concentration range than at the middle of the range. For analyzers having an inherently nonlinear, but precise response, the calibration equation can be calculated using quadratic or higher-order polynomial regression analysis. Alternatively, a nonlinear equation may be linearized with a simple mathematical transformation of the multipoint calibration data. Examples of some linearizing transformations are given in Reference 19. The multipoint calibration data may need to undergo several different transformations before the optimum transformation is determined. Using appropriately transformed calibration data, a calibration equation can be calculated with an acceptable value of U for the regression-predicted concentration. Subsequently, data obtained from the assay of the candidate standard must be similarly transformed to calculate a concentration for the candidate standard. 2.1.4.4 Zero and Span Gas Checks— On any day after the multipoint calibration that the analyzer will be used for the assay of a candidate standard, its calibration drift must be measured. This drift is calculated relative to the analyzer response during the multipoint calibration. The purpose of the zero and span gas checks is to verify that the calibration drift has remained within acceptable limits since the multipoint calibration. The criterion that is used to assess the drift is the relative difference between the analyzer's current response and the corresponding value from the multipoint calibration. The following equation is used for this calculation: Relative Difference = 100 [ Current Response - Calibration Response ] [Calibration Response for Reference Standard] This calculation is performed in Step 6 of the Appendix A spreadsheet. Note that the relative difference is always calculated relative to the calibration response for the reference standard, even when the zero gas is being

EPA Traceability Protocol for Gaseous Calibration Standards
19
measured. This calculation is based on the statistical assumption that the precision is the same at all concentrations. Long-term calibration drift cannot be determined to be excessive if the zero and span gas measurements do not exceed what can be explained by the short-term precision of the measurements. This calculation is performed for the zero gas measurements and for the reference standard measurements. If the reference standard was not measured during the multipoint calibration, use the regression-predicted response for a concentration equal to that of the reference standard. If the relative differences for the zero and span gas checks are each less than or equal to 5.0 percent, the analyzer's current calibration is considered to be approximately the same as during the multipoint calibration and the assay may be conducted. The zero and span controls do not have to be adjusted following the zero and span checks because the data reduction technique used in this protocol does not depend on the absolute accuracy of the analyzer calibration equation at the time of the assay. If the relative differences for the zero or span gas checks are greater than 5.0 percent, the analyzer is considered to be out of calibration. A new multipoint calibration may be conducted before the candidate standard is assayed or the analyzer's zero and span controls may be adjusted to return the analyzer's response to the original calibration levels. For some analyzers such as nondispersive infrared instruments, daily changes in environmental variables such as barometric pressure may shift the calibration. After any adjustment of controls, the analyst should repeat the zero and span gas checks and recalculate the relative differences to verify that the analyzer is in calibration. The zero gas and reference standard measurements that are performed for the assay of the candidate standard may also be used for the zero and span gas checks. Between the time of the multipoint calibration and the time of the zero and span gas checks, the analyst may adjust the analyzer’s zero and span controls for assays that will not be certified according to this protocol. However, these controls must be returned to their settings at the multipoint calibration before the zero and span gas checks or assays under this protocol. 2.1.5 Assay/Certification of Candidate Standards See Subsections 2.2, 2.3, and 2.4 for Procedures G1, G2, and G3,
respectively 2.1.5.1 Incubation of Newly Prepared Candidate Standards— Newly prepared candidate standards must be incubated at least 4 days before being assayed and certified.

EPA Traceability Protocol for Gaseous Calibration Standards
20
2.1.5.2 Stability Test for Reactive Gas Mixtures— Newly prepared candidate standards that contain reactive gas mixtures, including ammonia (NH3), hydrogen chloride (HCl), hydrogen sulfide (H2S), nitric oxide (NO), oxides of nitrogen (NOx), and sulfur dioxide (SO2), and that have not been previously certified, must be assayed on at least two dates that are separated by at least 7 days. Candidate standards that contain nonreactive gas mixtures, including carbon dioxide (CO2), carbon monoxide (CO), methane (CH4), nitrous oxide (N2O), oxygen (O2), and propane (C3H8), do not require a second assay. Zero air materials do not require a second assay. Conduct an initial assay of the candidate standard and determine a concentration for the standard. Make three or more discrete measurements of the candidate standard during the initial assay. "Discrete" means that the analyst must change the gas mixture being sampled by the analyzer between measurements by turning gas flow control valves or by other means. Record these measurements in the laboratory's records. Reassay the candidate standard at least 7 days after the first assay. Make three or more discrete measurements of the candidate standard during the second assay. Record these measurements in the laboratory's records. Use the spreadsheet described in Appendix C or an EPA-approved equivalent statistical technique (see Subsection 2.1.6) to determine if the mean estimated concentrations from first and second assays differ by less than 1.0 percent or less. If this acceptance criterion is attained, the candidate standard is considered to be stable and can be certified. If this acceptance criterion is not attained, the candidate standard may be unstable or there may be analytical problems associated with the assays or the reference standards. The analyst must either disqualify the candidate standard or investigate why the acceptance criterion was not attained. In earlier versions of this protocol, Student's t-test was used to determine whether there was a statistically significant difference between the mean concentrations from the two assays. It penalized high-precision measurements because a slight, analytically inconsequential concentration difference could be found to be statistically significant if the uncertainties of the two assays are sufficiently small. Conversely, a substantial concentration difference could pass Student's t-test, if measurement precision was large. In this version of the protocol, Schuirmann's two one-sided test (TOST)13-18 is used in Appendix C to determine if the two mean estimated concentrations differ by 1.0 percent or less. TOST is used in the pharmaceutical industry to show analytical method equivalency. It is superior to Student's t-test because it does not allow substantial concentration differences to pass the statistical significance test if measurement precision is poor. That is, being able to find that a candidate standard's concentration is stable (i.e., within the TOST acceptance criterion) is

EPA Traceability Protocol for Gaseous Calibration Standards
21
more important than not being able to find that the concentration is unstable. See Appendix D for a further discussion of TOST calculations with examples. If a candidate standard's concentration is not found to be stable (i.e., not within the TOST acceptance criterion), the analyst may elect to discard the candidate standard or may elect to conduct a third assay of the candidate standard to assess whether stability has been achieved. The analyst must add the additional data to the Appendix C spreadsheet. The analyst must wait an additional 7 days or more and conduct the third assay. If the data for the third assay is found to be equivalent to the data for either of the two previous assays, the candidate standard can be certified using the data from the two equivalent assays, which will be used to calculate the overall estimated concentration and the total uncertainty. Data from a nonequivalent assay should be discarded. The analyst must disqualify the candidate standard if none of the three sets of data are found to be equivalent. The analyst is expected to investigate and document the cause of the lack of agreement among the three assays and is expected to correct any problems that are discovered. Record the equivalent data and any discarded data in the laboratory’s records. If the data from the two assays are found to be statistically equivalent and yet the analyst is concerned that these data suggest potential instability, the analyst may elect to conduct a third assay to confirm that stability has been achieved. The analyst must wait an additional 7 days or more and conduct the third assay and must add the additional data to the Appendix C spreadsheet. Record the additional data in the laboratory’s records. 2.1.5.3 Assay/Certification of Multicomponent Candidate Standards— This protocol may be used to assay and certify a multiple-component standard if compressed gas SRMs, NTRMs, RGMs, PRMs or CRMs exist that contain the individual components of the multiple-component standard. Some or all of the components may be assayed and certified according to this protocol and the remaining components may be assayed and certified by other methods. The certification documentation and certification label (see Subsections 2.1.7 and 2.1.8) must clearly state which components of the standard are certified according to this protocol and which are not. If any component in the multiple-component standard interferes with the assay of any other component, the analyst must conduct an interference study to determine an interference correction equation. For example, NIST found multiple interferences (i.e., NDIR analysis of NO or SO2 in the presence of CO2; NDUV analysis of NO in the presence of SO2; and chemiluminescence analysis of NO in presence of CO2) during its 2010 audit of multiple-component EPA Protocol Gases for EPA37. This interference study must be conducted using the same analyzer or analyzers as will be used to assay the standard. The study must use single-
EPA Traceability Protocol for Gaseous Calibration Standards
22
component and multiple-component reference standards that have been assayed using interference-free analyzers. The study must cover the same range of concentrations for all components as will exist for the standards being assayed and certified according to this protocol. Data from the interference study must be evaluated using multiple-variable least-squares regression analysis. The analyst should consult with a statistician before beginning the study or evaluating its data. The regression analysis must produce an interference correction equation and an estimate of the standard uncertainty (uCORRECTED) associated with the corrected concentrations for the assayed components. The interference correction equation will be valid for the range of concentrations covered in the study for which the uncertainty of the corrected concentration is ≤1 percent of the corrected concentration. The analyst must add the interference correction uncertainty to the total uncertainty of the standard. The certification documentation must include a statement that the certified concentration of a specified component has been corrected for interferences from other specified components. An interference study is not needed if the assay analyzer is interference free. 2.1.5.4 Assay/Certification of Trace Contaminants in Candidate Standards— This protocol may be used to assay and certify the concentration of a trace contaminant in a candidate standard if compressed gas SRMs, NTRMs, RGMs, PRMs or CRMs exist for the trace contaminant. Such an assay and certification may be needed if the main component and the trace contaminant both produce an analyzer response in an end user's pollutant gas analyzer. For example, both NO and NO2 produce a response in the NOX channel of a chemiluminescent NO/NOX analyzer. A specialty gas producer may wish to certify the NOX concentration of a standard by separately assaying the standard's NO and NO2 concentrations using a Fourier transform infrared (FTIR) analyzer, rather than a chemiluminescent NO/NOX analyzer. If the producer uses a chemiluminescent NO/NOX analyzer to certify the NO and NOX concentrations of a standard, then no special procedure is required because this analyzer has separate NO and NOX channels and can measure NOX directly. The following steps give a simplified procedure for determining the trace contaminant concentration: 1. Perform monthly multipoint calibrations of the pollutant gas analyzer for the
main component and the trace contaminant using reference standards for both components and using either Procedure G1 or Procedure G2.
2. On the day of the assay of the candidate standard, perform zero and span
gas checks for the main component as described in Subsection 2.2.6.4 or in Subsection 2.3.8.4. If the calibration drift for the main component is within the acceptance criterion (i.e., relative differences for the zero and span gas checks less than or equal to 5.0 percent), then the analyst may assume that

EPA Traceability Protocol for Gaseous Calibration Standards
23
excessive calibration drift has not occurred for the trace contaminant. However, if the calibration drift is excessive, then the analyzer is considered to be out of calibration. Follow the procedures for out-of-calibration analyzers that are described in Subsection 2.2.6.4 or in Subsection 2.3.8.4.
3. Perform the assays for the trace contaminant during the same assay session
as the assays of the main component of the candidate standard. Measurement of the trace contaminant reference standard is not necessary.
4. Calculate the concentration of the trace contaminant and its uncertainty using
the spreadsheet described in Appendix A (or an EPA-approved equivalent statistical technique, see Subsection 2.1.6). Enter data from the trace contaminant measurements in the spreadsheet cells in Step 5 where candidate standard data for the same day as the calibration normally would be entered. Record these values in the laboratory's records. The trace contaminant concentration cannot be greater than 2.0 percent of the main component concentration.
The certification documentation and certification label (see Subsections 2.1.7 and 2.1.8) must clearly state the trace contaminant concentration and its uncertainty. A producer can elect to also report the sum of the main component concentration and the trace contaminant concentration and the uncertainty of that sum (see Subsection 2.1.6). 2.1.6 Expanded Uncertainty of the Concentration of the Candidate Standard The expanded uncertainty (U) is the combined standard uncertainty (uc) multiplied by a coverage factor (k), which is equal to 2.8,9 The value of U is equivalent to a 95- percent confidence interval in statistics. It is due to many different error sources, including the uncertainty in the reference standards, uncertainty in the analyzer multipoint calibration, uncertainty in the zero/span correction factors, random measurement error, uncertainty in interference corrections, and uncertainty in gas dilution. This protocol provides statistical spreadsheets to calculate and combine these uncertainty components. There may be additional uncertainty sources that cannot be assessed with the limited data that are produced when implementing this protocol. The calculated value of U must be given in the certification documentation. The use of an uncalculated or blanket estimate of U (e.g. +/- 1 percent) is not acceptable.
The analyst must use the Appendix A spreadsheet (or an EPA-approved equivalent statistical technique) to calculate an estimated concentration and an estimated U for each assay of the candidate standard. The estimate of U includes only the uncertainty component associated with the assay. It does not include the uncertainty components associated with the reference standard, interference correction or dilution. These uncertainty components are added in

EPA Traceability Protocol for Gaseous Calibration Standards
24
the Appendix C spreadsheet after the overall estimated concentration is determined from all assays of the candidate standard.
The analyst must use the Appendix C spreadsheet (or an EPA-approved
equivalent statistical technique) to calculate the overall estimated concentration and U for all assays of the candidate standard. This spreadsheet uses the output from the Appendix A spreadsheet for one, two or three assays. Only one assay is needed for candidate standards that contain nonreactive gas mixtures. Two or three assays are needed for candidate standards that contain reactive gas mixtures. The overall estimated concentration and U for the candidate standard are to be reported in the certification documentation.
If a specialty gas producer or other laboratory wishes to use an equivalent
statistical technique to calculate the overall estimated concentration and U for the candidate standard, then a detailed description of the technique and any supporting software must be submitted to EPA Traceability Protocol Project, Technical Services Branch, U.S. EPA, Mail Code E343-03, Research Triangle Park, NC 27711 for statistical evaluation and approval. The description must be in sufficient detail to demonstrate equivalence to the spreadsheets described in Appendices A and C. Example calculations demonstrating equivalence must be included. Any information about the technique that is submitted to EPA will be treated as confidential business information. Upon approval by EPA, the use of this equivalent statistical technique must be noted in the certificate documentation and a description of the technique must be presented in media readily accessible to end users. Although this protocol does not specify an acceptance criterion for U for candidate standard concentrations, EPA's Acid Rain Program has specified in 40 CFR Part 75 that an EPA Protocol Gas must have a specialty gas producer-certified uncertainty (95- percent confidence interval) that must not be greater than 2.0 percent of the certified concentration (tag value) of the gas mixture5. In general, an end user's purchase specifications for an EPA Protocol Gas should include a specification for U that meets its needs and any regulatory requirements concerning the uncertainty of the certified concentration. The certified value of U for SRMs, NTRMs, RGMs, PRMs, and CRMs is expressed on their certificates of analysis as the combined standard uncertainty (uc) multiplied by a coverage factor (k), which is equal to 2.8,9 The combined standard uncertainty includes the uncertainties of known sources of systematic error as well as the random error of measurement. A value of one-half of U for the reference standard should be used in calculating U of candidate standards that are certified under this protocol (see Appendix C). For those cases when the candidate standard is assayed on the same day as the multipoint calibration, the candidate standard's concentration is determined directly from the calibration curve. The combined standard

EPA Traceability Protocol for Gaseous Calibration Standards
25
uncertainty of the concentration is calculated by using the spreadsheets described in Appendices A and C or an EPA-approved equivalent statistical technique (see below). It combines the uncertainty of the assay (uASSAY) with the uncertainty of the reference standard (uSTANDARD) using the following equation:
= +2 2STANDARD ASSAY( ) ( )c uu u
For those cases in which the candidate standard is assayed on a date following the multipoint calibration, uASSAY includes the uncertainty associated with the drift in the zero and span gas measurements. If a trace contaminant in the candidate standard has been measured in addition to the measurement of the main component, calculate the standard uncertainty of the sum of the main component and the trace component from the uncertainty of the main component (uMAIN) and the uncertainty of the trace component (uTRACE) using the following equation:
= +2 2MAIN TRACE( ) ( )c uu u
If an interference-correction equation has been used to obtain a corrected concentration for the candidate standard, the standard uncertainty for the corrected concentration (uCORRECTION) must be included in the assessment of the total analytical uncertainty of the candidate standard's concentration using the following equation:
= + +2 2 2STANDARD ASSAY CORRECTIONU (U ) (U ) (U )C
If dilution has been used in the assay of the candidate standard, the standard uncertainty for the dilution (uDILUTION) must be included in the assessment of the total analytical uncertainty of the candidate standard's concentration using the following equation:
= + + +2 2 2 2STANDARD ASSAY CORRECTIONU (U ) (U ) (U ) (U )C DILUTION
The UDILUTION does not have to be included in the calculation of UC if
exactly the same settings for the Procedure G2 gas dilution apparatus are used for the analysis of the reference standard and the candidate standard. In this case, no variability in the results is introduced by using a constant dilution setting.
Generally, U should be rounded to one significant figure unless the
leading figure is a 1 in which case two significant figures should be reported17.
The estimate of U (e.g., +/- 20 ppm) may be supplemented, but not replaced) by a statement of the equivalent fractional uncertainty (e.g., +/- 1 percent), if desired, using the following equation:

EPA Traceability Protocol for Gaseous Calibration Standards
26
UFRACTIONAL = 100(U/ Certified Concentration) The same rule-of-thumb regarding significant figures applies to the
fractional uncertainty. 2.1.7 Certification Documentation for Certified Standards and Zero Air Materials 2.1.7.1 Certification Documentation for Assays using Procedure G1 or G2— For each standard (i.e., an EPA Protocol Gas, a GMIS or a zero air material) that is assayed using Procedure G1 or G2, the assay results must be documented in a written report, which contains at least the following information: 1. Cylinder identification number (e.g., stamped cylinder number). 2. The certified concentrations for the assayed components of the standard, in
ppb by mole, ppm by mole or in mole percent. Use the spreadsheet described in Appendices A and C (or an EPA-approved equivalent statistical technique) to calculate the certified concentrations, which are the weighted means of all assayed concentrations for which the standard is considered to be stable. They generally should be reported to at least 3 significant figures. The last significant figure that is reported must be of the same order of magnitude as U (e.g., 2530 ppm +/- 20 ppm, not 2533 ppm +/- 20 ppm) as is discussed below. If a candidate standard contains components that interfere with it measurement of components being certified by more than 1.0 percent of the estimated concentration of the certified component, then the magnitude of the interference must be included in the calculation of the certified concentration. For example, consider a candidate standard containing NO, SO2, and CO2 in nitrogen whose NO concentration is being measured using a chemiluminescent analyzer. The CO2 in the candidate standard will interfere with the NO measurement and the CO2 interference must be included in the calculation of the NO concentration if the magnitude of interference exceeds 1.0 percent of the estimated NO concentration.
If a zero air material was assayed using Procedure G1 or G2, the certification
documentation must include the impurity concentrations of the assayed components and a statement to the effect that it conforms to the purity specifications of 40 CFR Part 72.2. Use the spreadsheet described in Appendix A or an EPA-approved equivalent statistical technique to calculate the impurity concentrations, which are the means of all measurements of the zero air material. The significant figures in the certified impurity concentrations generally should be the same as U (e.g., 0.01 ppm +/- 0.03 ppm, not 0.012 ppm +/- 0.30 ppm) as is discussed below.
3. A calculated estimate of U for the standard (see Section 2.1.6). The use of
an uncalculated, blanket value for U (e.g., +/- 1 percent) is not acceptable. The estimate is expressed as a 95-percent confidence interval, which is the

EPA Traceability Protocol for Gaseous Calibration Standards
27
combined standard uncertainty (uc) multiplied by a coverage factor (k), which is equal to 2.8,9 It must include the uncertainties associated with the reference standards, the analyzer multipoint calibration, the analyses of the standard, any gas dilutions, and any interference correction. Use the spreadsheet described in Appendix C or an EPA-approved equivalent statistical technique (see Section 2.1.6) to calculate U. If an EPA-approved equivalent statistical technique is used rather that the Appendix C spreadsheet, it must be identified as such in the certificate documentation and must be described in media readily accessible to end users. As a rule-of-thumb, U should be rounded to one significant figure unless the leading figure is a 1 in which case two significant figures should be reported20. The estimate of U (e.g., +/- 20 ppm) may be supplemented by a statement of the equivalent fractional uncertainty (e.g., +/- 1.0 percent) if desired
If a zero air material was assayed using Procedure G1 or G2, the certification
documentation must include a calculated estimate of U for the impurity concentrations in the zero air material using the statistical procedures described above.
4. The assayed component(s) and balance gas in the gas mixture. If the
composition or origin of the balance gas (e.g, oxygen percentage or synthetic vs. scrubbed ambient air) has a measurable effect on the end user's pollutant gas analyzers, it must described in the certification documentation.
5. Cylinder pressure at certification and the statement that the standard should
not be used when the pressure is below 0.7 megapascals (i.e., 100 psig). 6. Dates of the assays and certification. The certification date is the date of the
last assay. 7. Certification expiration date (i.e., the certification date plus the certification
period plus one day) (see Subsection 2.1.9). 8. Information about the reference standard used in the assay: NIST SRM
number, NIST sample number, cylinder identification number, certified concentration, expanded uncertainty, and certification expiration date for an SRM; cylinder identification number, certified concentration, expanded uncertainty, and certification expiration date for an NTRM, an RGM, a PRM, a CRM or a GMIS. The certification documentation must identify the reference standard as being an SRM, an NTRM, an RGM, a PRM, a CRM or a GMIS. For a candidate standard that is assayed using a GMIS, the certification documentation must include information about the reference standard that was used for the GMIS' assay (see above).
9. Statement that the assay/certification was performed according to this
protocol and that lists the assay procedure (i.e., Procedure G1 or G2) used.

EPA Traceability Protocol for Gaseous Calibration Standards
28
10. The analytical method that was used in the assay and the date of the most
recent multipoint calibration of the instrument. 11. Identification of the specialty gas producer or other laboratory (i.e., producer's
or laboratory's name, city, and state, and PGVP vendor ID issued by EPA for the production location) where the candidate standard was assayed, even if another organization prepared the candidate standard or will sell it to an end user. This identification must be given in the same or larger font as the other required information in the report.
The IDs are listed at www.epa.gov/airmarkets/emissions/pgvp-vendorID.html. 12. Chronological record of all certifications for the standard. 13. If applicable, a statement that the certified concentration for one component
has been corrected for interferences from other specified components. This certification documentation must be given to the end user of the standard. The specialty gas producer or other laboratory that assayed the standard must maintain laboratory records and certification documentation for at least the standard's certification period or until such time as the standard is blown down after being returned by the end user to the producer. A specialty gas producer or other vendor may redocument an assayed and certified standard that it has purchased from another specialty gas producer and that it wishes to sell to a third party. However, the new certification documentation must clearly identify the specialty gas producer or other laboratory (i.e., name, city, and state) where the standard was assayed and present all the information that is contained in the original report. The documentation may, at the producer's discretion, include identification of the producer or laboratory that prepared the candidate standard if different from the producer or laboratory that assayed and certified the standard. 2.1.7.2 Certification Documentation for Assays using Procedure G3— For a zero air material that is assayed using Procedure G3, the assay results must be documented in a written report, which contains at least the following information: 1. Cylinder identification number (e.g., stamped cylinder number). 2. If a zero air material was assayed using Procedure G3, use the spreadsheet
described in Appendix E or an EPA-approved equivalent statistical technique (see Subsection 2.1.6) to calculate whether the purity specifications of 40 CFR Part 72.2 have been attained. If the specifications have been attained, the certification documentation must include a statement to this effect.

EPA Traceability Protocol for Gaseous Calibration Standards
29
3. If the zero air material was assayed using Procedure G3, no uncertainty estimate need be calculated or documented.
4. A statement that there is no expiration date for the certification 5. Information about the NIST-traceable zero air material used in the assay:
cylinder identification number, certified concentration, expanded uncertainty, and certification expiration date. The certification documentation must identify the NIST-traceable zero air material as being an SRM, an NTRM, an RGM, a PRM, a CRM or a GMIS. For a GMIS, the NIST-traceable zero air material that was used for its assay must be identified in the documentation for the zero air material being certified.
6. Information about the reference standard used in the assay: cylinder
identification number, certified concentration, expanded uncertainty, and certification expiration date for the reference standard. The certification documentation must identify the reference standard as being an SRM, an NTRM, an RGM, a PRM, a CRM or a GMIS. For a GMIS, the reference standard that was used for its assay must be identified in the documentation for the zero air material being certified.
7. Statement that the assay/certification was performed according to this
protocol and that lists the assay procedure (i.e., Procedure G3) used. 8. The analytical method that was used in the assay and the date of the most
recent multipoint calibration of the instrument. 9. Identification of the specialty gas producer or other laboratory (i.e., producer's
or laboratory's name, city, and state, and PGVP vendor ID issued by EPA for the production location) where the zero air material was assayed, even if another organization prepared the zero air material or will sell it to an end user. This identification must be given in the same or larger font as the other required information in the report.
10. If the composition or origin of the balance gas (e.g, oxygen percentage or
synthetic vs. scrubbed ambient air) has a measurable effect on the end user's pollutant gas analyzers, it must described in the certification documentation.
This certification documentation must be given to the end user of the zero air material. The specialty gas producer or other laboratory that assayed the standard must maintain laboratory records and certification documentation for at least the standard's certification period or until such time as the standard is blown down after being returned by the end user to the producer. A specialty gas producer or other vendor may redocument a zero air material that it has purchased from another specialty gas producer and that it wishes to sell to a third party. However, the new certification documentation must clearly identify the

EPA Traceability Protocol for Gaseous Calibration Standards
30
specialty gas producer or other laboratory (i.e., name and location) where the zero air material was assayed and present all the information that is contained in the original report. 2.1.8 Certification Label A label or tag must be attached to the standard bearing the information described in Items 1-5, 7, 9, and 11 of Subsection 2.1.7.1 for each standard assayed using Procedure G1 or G2 and in Items 1, 2, 4, 7, and 9 of Subsection 2.1.7.2 for each zero air material assayed using Procedure G3. 2.1.9 Certification Periods for Standards The certification of a standard is valid for only a specified period following its certification date, which is the date of its last assay. In general, the certification period should be no longer than the period for which similar gas mixtures (e.g., SRMs or similar standards) over specific concentration ranges have been shown to be stable as documented in the peer review literature or in concentration stability data submitted by NIST and specialty gas producers for review by EPA.21-29 Maximum certification periods for various standards that are certified or recertified under this protocol are specified in Table 2-3. The certification period for a GMIS is the same as for an EPA Protocol Gas. A multiple-component standard can be certified for a maximum period equal to that of its most briefly certifiable component. For example, a standard containing sulfur dioxide, carbon monoxide, and propane in nitrogen can be certified for up to 4 years because the shortest certification period is 4 years. These certification periods are for standards that are contained in passivated aluminum cylinders, except for hydrogen chloride mixtures where nickel-coated steel cylinders may also be used and for zero air material where steel cylinders may be used. In general, the certification period for standards that are contained in nonaluminum cylinders is 6 months. However, an exception is made for the following three nonreactive gas mixtures: CO2 with a concentration >0.5 percent; O2 with a concentration >0.5 percent; and C3H8 with a concentration >0.1 percent. The certification period for standards containing these three nonreactive gas mixtures in nonaluminum cylinders is the same as is given in Table 2-3 for passivated aluminum cylinders. Specialty gas producers may elect to certify candidate standards for less than the maximum certification period in Table 2-3 if they believe that they cannot prepare standards whose stability attains the maximum certification period. The default certification period is that given in Table 2-3. Each producer has discretion in this matter.

EPA Traceability Protocol for Gaseous Calibration Standards
31
TABLE 2-3. Maximum Certification Periodsa for Calibration Standards in
Passivated Aluminum Cylinders Components Balance gas Concentration range Period (years)
Ambient volatile organics Nitrogen 1 ppb to 1 ppm 4
Ammonia Nitrogen 5 to 50 ppm 2 Carbon dioxide Airb 100 to 500 ppm 8 Carbon dioxide Nitrogen 10 ppm to 20% 8 Carbon monoxide Air 1 ppm to 10% 8 Carbon monoxide Nitrogen 1 ppm to 15% 8 Formaldehyde Nitrogen 0.5 to 10 ppm 1 Hydrogen chloridec Nitrogen 10 to 5000 ppm 2 Hydrogen sulfide Nitrogen 5 to 1000 ppm 3 Methane Air 1 to 1000 ppm 8 Methanol or ethanol Nitrogen or Air 75 to 500 ppm 4
Natural gas componentsd Natural gas Contact NIST 8
Nitric oxide O2-free nitrogene 0.5 to 20 ppm 3 Nitric oxide O2-free nitrogene 20 ppm to 1% 8 Nitrous oxide Air TBD by NIST 6 Oxides of nitrogenf Air 10 ppm to 1% 6 Oxygen Nitrogen 10 ppm to 25% 8 Propane Air 0.1 to 500 ppm 8 Propane Nitrogen 100 ppm to 2% 8 Sulfur dioxide Nitrogen 1 to 50 ppm 4 Sulfur dioxide Nitrogen 50 ppm to 1% 8 Zero air materialg Air Not applicable Unlimited Multicomponent mixtures
— — See text
Mixtures with lower concentrations
— — See text
a Specialty gas producers may elect to certify candidate standards for less than the maximum certification period. Each producer has discretion in this matter. See text. b "Air" is defined as a mixture of oxygen and nitrogen where the minimum concentration of oxygen is 10 percent and the concentration of nitrogen is greater than 60 percent. c Hydrogen chloride may be contained in passivated aluminum or nickel-coated steel cylinders. d Natural gas components are methane, ethane, propane, n-butane, iso-butane, n-pentane, iso-pentane, helium, nitrogen, and carbon dioxide. e O2-free nitrogen contains ≤ 100 ppb of oxygen. f NIST defines its total NOX standards as containing nitrogen dioxide plus contaminant nitric acid. g Concentrations of SO2, NOX, and THC are not >0.1 ppm; concentration of CO is not >1 ppm; and concentration of CO2 is not >400 ppm as per 40 CFR Part 72.2. Zero air material may be contained in steel cylinders.
EPA Traceability Protocol for Gaseous Calibration Standards
32
There is a risk that regulator-related contamination or improper storage by the end user may alter the stability of the certified concentrations in an EPA Protocol Gas. This protocol cannot account for the misuse of EPA Protocol Gases. The solution to this potential problem is to educate end users in the proper storage and use of EPA Protocol Gases to avoid stability problems. It is also possible that instability may be associated with the cylinder passivation technique, which varies among producers and which is generally proprietary information. Each producer should investigate its own passivation techniques and select certification periods that are appropriate for those techniques. This protocol allows the certification of standards with concentrations that are lower than those given in Table 2-3. If the concentration of the candidate standard is less than the applicable concentration range given in Table 2-3 and if the time period between the initial and second assays is less than 6 months, then the initial certification period for this standard is 6 months. After this period, the standard must be recertified before further use. If the time period between the initial and second assays is at least 6 months and if the mean concentrations from the two assays are demonstrated to be within 1.0 percent of each other using Schuirmann's TOST (see Subsection 2.1.5.2), then the standard can be certified for the period shown in Table 2-3. 2.1.10 Certification Periods for Zero Air Materials The certification of a zero air material is unlimited and there is no expiration date for the certification. 2.1.11 Recertification of Standards If a standard is to be used after its certification period has ended, it must be recertified in accordance with this protocol. It may be recertified only if the gas pressure remaining in the cylinder after the assays have been completed is greater than 0.7 megapascals (i.e., 100 psig). Zero air materials do not need to be recertified. The recertification assay must be performed using the same analytical procedure (e.g., Procedure G1) as was used for the original assay of the standard. The purpose of this assay is to determine whether the standard has remained stable since its original certification. To recertify a standard, three or more discrete measurements of the candidate standard must be made during a single recertification assay. There is no requirement that the same reference standard must be used in the original and recertification assays, although this practice is desirable if possible. Record the results of the recertification assay in the laboratory's records. Use the spreadsheet described in Appendix C (or an EPA-approved equivalent statistical technique) to compare the measured concentrations from the recertification assay with the measured concentrations from the previous
EPA Traceability Protocol for Gaseous Calibration Standards
33
assays. If the TOST acceptance criterion is attained, the standard can be recertified. The recertification period is the same as that given in Table 2-3. If the measured concentrations are shown to be not equivalent, the standard must undergo a full certification (e.g., Procedure G1) before it can be used again. The spreadsheet described in Appendix C can include data from only three assays. If more than three assays are conducted, only the data from the three most recent assays should be used in the spreadsheet. A standard that was certified under this protocol may be recertified by a laboratory other than the one that performed the original certification. In such a case, the recertification documentation must list the information from the original certification documentation plus the corresponding information from the recertification assays. Both the original and the recertification laboratories must be identified in the recertification documentation. If the TOST acceptance criterion is not attained, a second recertification assay may be conducted. If the two recertification assays attain the TOST acceptance criterion, the standard can be recertified. If the TOST acceptance criterion is still not attained after the second recertification assay, the analyst must either disqualify the standard for further use under this protocol or investigate why there is an apparent difference between the original assays and the recertification assay. This difference may be due to an actual instability of the gas mixture, to a reference standard problem, to an analytical instrumentation problem, or to some other problem. If the analyst can find a reasonable explanation for the difference and if this reason is not instability, then the standard can be recertified. The analyst must append a brief report on the results of the investigation to the recertification documentation and to the laboratory's records. Standards having certified concentrations that are lower than those given in Table 2-3 may be recertified for the period given in Table 2-3 provided at least 6 months have elapsed between the initial certification and the recertification. For example, a 0.5-ppm sulfur dioxide in nitrogen standard will have an initial certification period of 6 months. After a successful recertification, this standard will have a recertification period of 4 years. The certification date is the date of the last assay. A multiple-component standard can be recertified for a period equal to that of its most briefly certifiable component. For example, a standard containing ammonia, carbon monoxide, and propane in nitrogen can be recertified for 2 years because the shortest certification period is 2 years for ammonia. In this case, the certification date is the date of the last ammonia assay.

EPA Traceability Protocol for Gaseous Calibration Standards
34
2.1.12 Minimum Cylinder Pressure A certified standard should not be used when its gas pressure is below 0.7 megapascals (i.e., 100 psig). NIST has found that some gas mixtures (e.g., nitric oxide in nitrogen) have exhibited a concentration change when the cylinder pressure fell below this value. There is no minimum cylinder pressure specification for zero air materials. 2.1.13 Protocol Gas Verification Program (PGVP) Periodically, the U.S. EPA will assess the accuracy of a blind sample of compressed gas calibration standards that have been assayed and certified according to this protocol. The analytical results, identifying the specialty gas producers or other analytical laboratories that assayed and certified the standards, will be published as public information. In the 1980s and 1990s, EPA conducted a series of EPA-funded accuracy assessments of EPA Protocol Gases sold by producers30-34. The intent of these audits was to: • increase the acceptance and use of EPA Protocol Gases as calibration
gases; • provide a quality assurance (QA) check for the producers of these gases; and • help end users identify producers who can consistently provide accurately
certified gases. Either directly or through third parties, EPA procured EPA Protocol Gases from the producers, assessed the accuracy of the gases' certified concentrations through independent analyses, and inspected the accompanying certificates of analysis for completeness and accuracy. The producers were not aware that EPA had procured the gases for these audits. The accuracy of the EPA Protocol Gases' certified concentrations was assessed using SRMs as the reference standards. If the difference between the audit's measured concentration and the producer's certified concentration was more than +/- 2.0 percent or if the documentation was incomplete or inaccurate, EPA notified the producer to resolve and correct the problem. The results of the accuracy assessments were published in peer-reviewed journals and were posted on EPA's Technology Transfer Network website. The accuracy assessments were discontinued in 1998. In 2002, there was interest by the specialty gas producers and EPA to reestablish this program. In 2009, the Office of the Inspector General (OIG) published the report EPA Needs an Oversight Program for Protocol Gases35. OIG recommended that the Office of Air and Radiation (OAR) implement oversight programs to

EPA Traceability Protocol for Gaseous Calibration Standards
35
assure the quality of EPA Protocol Gases used to calibrate continuous emissions monitoring systems and ambient air monitors. It also recommended that EPA's Office of Research and Development (ORD) update and maintain this traceability protocol to ensure that the monitoring programs' objectives are met. To address the OIG findings for ambient air monitoring, EPA's Office of Air Quality Planning and Standards (OAQPS), in cooperation with EPA Regions 2 and 7 developed an Ambient Air Protocol Gas Verification Program (AA-PGVP). This program establishes gas metrology laboratories in Regions 2 and 7 to verify the certified concentrations of EPA Protocol Gases used to calibrate ambient air quality monitors. It is expected to: • ensure that producers selling EPA Protocol Gases participate in the AA-
PGVP, and • provide end users with information about participating producers and
verification results. The AA-PGVP QA requirements in 40 CFR Part 58, Appendix A require:
"2.6 Gaseous and Flow Rate Audit Standards. Gaseous pollutant concentration standards (permeation devices or cylinders of compressed gas) used to obtain test concentrations for CO, SO2, NO, and NO2 must be traceable to either a National Institute of Standards and Technology (NIST) Traceable Reference Material (NTRM), NIST Standard Reference Materials (SRM) and Netherlands Measurement Institute (NMi) Primary Reference Materials (valid as covered by Joint Declaration of Equivalence) or a NIST-certified Gas Manufacturer's Internal Standard (GMIS), certified in accordance with one of the procedures given in reference 4 of this appendix. Vendors advertising certification with the procedures provided in reference 4 of this appendix and distributing gases as 'EPA Protocol Gas' must participate in the EPA Protocol Gas Verification Program or not use 'EPA' in any form of advertising."
The AA-PGVP is considered a verification program because its current level of evaluation does not allow for a large enough number of samples of EPA Protocol Gases from any one specialty gas producer to yield a statistically rigorous assessment of the accuracy of any specific producer's standards. It will not provide end users with a scientifically defensible estimate of whether standards of acceptable quality can be purchased from any specific producer. Rather, the results provide information to end users that the specialty gas producer is participating in the program and the information in the verification report may be helpful when selecting a producer. The results from the first two years of the AA-PGVP have been published36. More information about the AA-PGVP can be found at OAQPS' AA-PGVP website, www.epa.gov/ttnamti1/aapgvp.html. In a parallel effort, EPA's Office of Air and Radiation (OAR) Clean Air Markets Division (CAMD) conducted assessments in 2003 and 2010 of a blind sample of EPA Protocol Gases containing CO2, NO, and SO2 that are used to calibrate continuous emission monitors under the Acid Rain Program37. EPA has

EPA Traceability Protocol for Gaseous Calibration Standards
36
promulgated amendments to 40 CFR Part 75 that require that EPA Protocol Gases used for Part 75 purposes be obtained from specialty gas producers that participate in a source-level PGVP38. These amendments state:
"On and after May 27, 2011 for each unit subject to this part that uses EPA Protocol gases, the owner or operator must obtain such gases from either an EPA Protocol gas production site that is on the EPA list of sites participating in the PGVP on the date the owner or operator procures such gases or from a reseller that sells to the owner or operator unaltered EPA Protocol gases produced by an EPA Protocol gas production site that was on the EPA list of participating sites on the date the reseller procured such gases."
Any specialty gas producer choosing to participate in the source-level PGVP must notify EPA each year. Each year, EPA will hire a third party to blindly procure up to 4 cylinders from each participating producer. After being notified that its cylinders are being audited by EPA (after cylinders have been received), a producer would cancel its invoice or credit the third party’s account, and pay NIST to analyze its cylinders and provide a report to EPA. NIST expects to analyze all cylinders and provide a report to EPA within 6 months of receipt of the cylinders and has established cost containment/efficiency measures to help it do so. EPA will post audit results on-line. The results will indicate whether cylinder meets the Part 75 performance specification of + 2.0% of cylinder tag value. End users can decide from whom they wish to purchase gases. Recordkeeping/reporting will be required to help ensure that EPA Protocol Gases being used by Part 75 sources are from Acid Rain PGVP participants, and to inform cylinder selection for future audits. More information about the Emission PGVP can be found at CAMD's website, www.epa.gov/airmarkets/emissions/rules.html.

EPA Traceability Protocol for Gaseous Calibration Standards
37
2.2 Procedure G1: Assay and Certification of a Compressed Gas Calibration Standard without Dilution 2.2.1 Applicability This procedure may be used to assay the concentration of a candidate compressed gas calibration standard, based on the concentration of a compressed gas reference standard of the same gas mixture. This procedure allows a specialty gas producer, a standard user, or other analytical laboratory to certify that the assayed concentration for the candidate standard is traceable to the reference standard. The procedure employs a pollutant gas analyzer to compare the candidate and reference standards' concentrations by direct measurement without dilution of either gas. This procedure may be used for the assay of more than one candidate standard during the same assay session. Criteria that apply to the assay of one candidate standard apply to the assay of multiple candidate standards. 2.2.2 Limitations The concentration of the candidate standard may be greater than or lesser than the concentration of the reference standard. However, both concentrations must lie within the well-characterized region of the multipoint calibration (see Subsection 2.1.4.2). Additionally, the expanded uncertainty associated with each assay of the candidate standard (i.e. Cell B248 times Cell B251 or Cell B333 times Cell B336 in the Appendix A spreadsheet) must be ≤±1 percent of the reference standard concentration. This criterion may be more restrictive than the corresponding criterion for the multipoint calibration, but it allows the analyst greater flexibility in the selection of a reference standard for the assay of a particular candidate standard while still keeping control of the uncertainty due to the assay of the candidate standard. For example, assume that a 70-ppm candidate standard is being assayed using a 50-ppm reference standard and that the analyzer’s calibration was found to be well-characterized between 20 and 80 ppm. The expanded uncertainty for the example candidate standard’s estimated concentration must be less than or equal to ±0.5 ppm. The balance gas must be the same in both the candidate standard and the reference standard, unless it has been demonstrated that the analyzer's response is insensitive to differences in the balance gas composition. 2.2.3 Assay Apparatus Figure 2-2 illustrates one possible design of the apparatus for the assay of compressed gas calibration standards without dilution. This apparatus is designed to allow the convenient routing of the gas mixtures to the pollutant gas analyzer. Inert materials (e.g., Teflon®, stainless steel, borosilicate glass or

EPA Traceability Protocol for Gaseous Calibration Standards
38
silanized glass) and clean, noncontaminating components should be used in those portions of the apparatus that are in contact with the gas mixtures being assayed.
Figure 2-2. Apparatus for the assay of calibration standards without dilution The gas mixture to be measured is selected by rotation of two three-way valves (i.e., V1 and V2). Pressure regulators and gas flow controllers (i.e., C1 and C2) control the flow rates from the individual cylinders. The gas flow controllers may be needle values, capillary tubes, thermal mass flow controllers, or other flow control devices. The gas mixtures are routed to the analyzer through a union tee tube fitting. Gas in excess of the analyzer's demand is vented, which helps to ensure that the gas entering the analyzer is at near-ambient pressure. Normally, the excess gas is vented to the atmosphere without any obstructions in the tubing. However, the excess gas can be routed through an uncalibrated rotameter by rotation of a three-way valve (i.e., V3). The

EPA Traceability Protocol for Gaseous Calibration Standards
39
rotameter is used to demonstrate that the total gas flow rate exceeds the sample flow rate of the analyzer and that no room air is being drawn in through the vent line. The apparatus may be modified in several ways that will not diminish its performance. For example, the two three-way valves could be replaced by solenoid valves, by a single four-way valve with three input ports and one output port or by a rotating multiposition step valve. See also Subsection 2.1.2 concerning the acceptability of alternative designs for the assay apparatus. 2.2.4 Pollutant Gas Analyzer The pollutant gas analyzer must have a well-characterized calibration curve and must be capable of measuring directly the concentration of both the candidate and the reference standards without dilution. See Subsection 2.1.4.1 concerning general analyzer calibration requirements and Subsection 2.1.4.1 concerning the well-characterized calibration curve. It must have good resolution, good precision, a stable response, and low output signal noise. In addition, the analyzer should have good specificity for the pollutant of interest so that it has no detectable response to any other component or contaminant that may be contained in either the candidate or reference standards. When selecting an analyzer for the assay of a specific gas mixture, the analyst should investigate potential analytical inferences between gas mixture components. If any component in a multiple-component standard interferes with the assay of any other component, the analyst must conduct an interference study to determine an interference correction equation. If the candidate and reference standards contain dissimilar balance gases (e.g., air versus nitrogen or different pro-portions of oxygen in the balance air), it must have been demonstrated that the analyzer's response is not sensitive to differences in the balance gas composition. This demonstration can be accomplished by showing that no difference exists in the analyzer's response when measuring a compressed gas calibration standard that has been diluted with identical flow rates of different balance gases. The analyzer should be connected to a high-precision data acquisition system (DAS), which must produce a numeric and graphic record of the analyzer's response during the assay. The DAS should have four-digit resolution for the numerical values of the response. More precise values will be obtained if this system has a data-averaging capability. The specialty gas producer or other laboratory that assayed the candidate standard must maintain laboratory records for at least the standard's certification period or until such time as the standard is blown down after being returned by the end user to the producer. If the analyzer has not been in continuous operation, turn it on and allow it to stabilize (e.g., for at least 12 hours) before beginning the measurements.

EPA Traceability Protocol for Gaseous Calibration Standards
40
2.2.5 Assay Gases 2.2.5.1 Candidate Standard— See Subsections 2.1.5 and 2.2.2. 2.2.5.2 Reference Standard— See Subsection 2.1.3.2. If the multipoint calibration data have been fitted to a linear (i.e., straight-line) regression model, then only a single reference standard need be measured during the assay of the candidate standard. If these data have been fitted to a quadratic or higher-order regression model, then at least two reference standards must be measured. One reference standard is adequate to determine the slope of a linear equation, but additional reference standards are needed to determine the curvature of quadratic and higher-order polynomial equations. The concentrations of the additional reference standards should be located at the maximum difference between the polynomial curve and the corresponding straight line between the zero gas and the highest-concentration reference standard. 2.2.5.3 Zero Gas— See Subsection 2.1.3.4. The analyst may substitute a low-concentration, NIST-traceable reference standard for the zero gas during zero gas checks and assays if there is reason to believe that the zero gas reading may not accurately represent the zero-intercept of the calibration equation. Information concerning the zero gas should be recorded in the laboratory's records. 2.2.6 Analyzer Calibration 2.2.6.1 Multipoint Calibration— See Subsections 2.1.4.2 and 2.1.4.3. 2.2.6.2 Analyzer Range— The range of the analyzer must include the concentrations of the zero gas, the candidate standard and the reference standard. The concentrations of the candidate and reference standards must fall within the well-characterized region of the analyzer's calibration curve. In general, the analyst should use a range that will produce the largest on-scale analyzer response. 2.2.6.3 Linearity— The data reduction technique used in this procedure requires that the analyzer have a well-characterized, but not necessarily linear, calibration curve (see Subsection 2.1.4.2 concerning the well-characterized calibration curve). High-concentration-range analyzers of the type that are required for this procedure may not be inherently linear, but in such cases they usually have a predictable, non-linear calibration curve that can be described by a polynomial equation or can be mathematically transformed to produce a straight-line calibration curve that is suitable for use in this procedure (see Subsection 2.1.4.3

EPA Traceability Protocol for Gaseous Calibration Standards
41
concerning the transformation). Any such polynomial equation or mathematical transformation should be verified during the multipoint calibration. Caution should be exercised in using a transformed calibration curve because zero or span control adjustments to the analyzer may produce unexpected effects in the transformed calibration curve. 2.2.6.4 Zero and Span Gas Checks— See Subsections 2.1.7.3 and 2.1.7.4. Prior to carrying out the assay of the candidate standard, use zero and span gases to check for calibration drift in the analyzer since the multipoint calibration. Zero gas and span gas checks must be performed on any day after the multipoint calibration that candidate standards are assayed. If multiple assays are being performed on the same analyzer range, the analyst needs to perform only a single set of zero gas and span gas checks for this range. However, another set must be performed if the range is changed. The gas mixtures to be used during the zero and span gas checks need not be, but can be, the reference standards used for the assay of the candidate standard or for the multipoint calibration. The reference standard for the span gas check must be traceable to an SRM, an RGM, a PRM, a CRM, or an NTRM. Information concerning this standard (e.g., cylinder identification number, certified concentration, expanded uncertainty, certification expiration date, etc.) must be recorded in the laboratory's records. The zero gas must meet the requirements in Subsection 2.1.3.4. The use of NIST-traceable zero air material for the zero gas check is recommended, but not required. The analyst may substitute a low-concentration, NIST-traceable reference standard for the zero gas if there is reason to believe that the zero gas reading may not accurately represent the zero-intercept of the calibration equation. Make three or more discrete measurements of the zero gas and three or more discrete measurements of the span gas reference standard. "Discrete" means that the analyst must change the gas mixture being sampled by the analyzer between measurements. For example, the analyst might alternate between measurements of the reference standard and measurements of the zero gas. Record these measurements in the laboratory's records. Next, verify that the analyzer's precision is acceptable. Calculate the mean and standard deviation of the analyzer's responses to the zero gas. Repeat the calculations for the reference standard measurements. These calculations are performed in Step 6 of the spreadsheet described in Appendix A. Record these calculations in the laboratory's records. The standard error of the mean for each set of measurements must be less than or equal to 1.0 percent of the mean response to the reference standard. That is,
≤100
RSRsn

EPA Traceability Protocol for Gaseous Calibration Standards
42
where s = standard deviation of the analyzer's response; n = the number of measurements of the gas mixture; and
RSR = the mean analyzer response to the reference standard. The value of the standard error of the mean can be made smaller by increasing the number of measurements. This calculation will enable the analyst to determine how many replicate measurements are needed during the assay of the candidate standard to obtain acceptable precision. The analyst may wish to use a data logger or data acquisition system with averaging capability to obtain more precise measurements. If the value of the standard error is not acceptable, then the analyzer must be repaired or another analyzer must be used. Next, verify that excessive zero drift has not occurred since the multipoint calibration. For the zero gas measurements, calculate the relative difference (in percent) between the current mean analyzer response during the zero gas check and the corresponding response that is predicted from the multipoint calibration regression equation. That is, Relative Difference = 100 (Current Zero Response - Calibration Zero Response) (Zero-Corrected Response for Reference Standard) Note that the relative difference is calculated relative to the zero-corrected response for the reference standard from the multipoint calibration. If the reference standard was not measured during the multipoint calibration, use the regression-predicted response for a concentration equal to that of this standard. Repeat this relative difference calculation for the span gas reference standard measurements. That is, Relative Difference = 100 (Current Span Response - Calibration Span Response) (Zero-Corrected Response for Reference Standard) These relative difference calculations are performed in Step 6 of the Appendix A spreadsheet. Record these calculations in the laboratory's records. Then, if the relative differences for the zero and span gas checks are less than or equal to 5.0 percent, the analyzer's current calibration is considered to be approximately the same as during the multipoint calibration and the assay may be conducted. The zero and span controls need not be adjusted and the assay may be conducted. The data reduction technique does not require that some calibration drift has not occurred since the multipoint calibration. Some minor calibration drift is acceptable because the effect of any drift will be corrected during the reduction of the assay data.

EPA Traceability Protocol for Gaseous Calibration Standards
43
However, if the relative difference for either the zero or the span gas check is greater than 5.0 percent, then the analyzer is considered to be out of calibration. A new multipoint calibration may be conducted before the candidate standard is assayed or the analyzer's zero and span controls may be adjusted to return the analyzer's response to the original calibration levels. For some analyzers such as nondispersive infrared instruments, daily changes in environmental variables such as barometric pressure may shift the calibration. After any adjustment of controls, the analyst should repeat the zero and span gas checks and recalculate the relative differences to verify that the analyzer is sufficiently in calibration. The analyzer will be considered to be out of calibration if the relative differences remain greater than 5.0 percent. 2.2.7 Assay Procedure 1. Verify that the assay apparatus is properly configured, as described in
Subsection 2.2.3 and shown in Figure 2-1. Inspect the analyzer to verify that it appears to be operating normally and that all controls are set to their expected values. Record these control values in the laboratory's records.
2. Verify that a multipoint calibration has been performed within 1 month prior to
the assay date and that it demonstrates acceptable instrument performance (see Subsection 2.1.4.2). Additionally, verify that the zero and span gas checks indicate that the analyzer is in calibration (see Subsection 2.2.6.4). Finally, verify that the concentrations of the candidate and reference standards fall within the well-characterized region of the analyzer's calibration curve (see Subsection 2.1.4.2).
3. Measure and adjust the flow rates of the gas mixtures (i.e., reference
standard(s), candidate standard, and zero gas) to approximately the same value that will provide enough flow for the analyzer and sufficient excess to assure that ambient air will not be drawn into the vent line.
4. In succession, measure the zero gas, the reference standard(s), and the
candidate standard(s) using the analyzer. Use valves V1 and V2 to select each of the gas mixtures for measurement. Allow sufficient time between measurements to completely purge the analyzer of the previous gas and for the analyzer to achieve a stable reading. If the response for each measurement is not stable, the precision of the measurements will decline and the candidate standard may not be certifiable under this protocol. Record the analyzer response for each measurement in the laboratory's records, using the same response units (e.g., volts, area counts, etc.) as was used for the multipoint calibration. At this point, do not convert these data into concentration values using the calibration equation or perform any mathematical transformations (see Subsection 2.1.4.3) if the data were so transformed. These steps will be done later. Also, do not make any zero

EPA Traceability Protocol for Gaseous Calibration Standards
44
control, span control, or other adjustments to the analyzer during these measurements.
The analyst may assay multiple candidate standards during the same assay
session. For example, a single set of measurements may involve a zero gas, a reference standard and three candidate standards. Criteria that apply to the assay of one candidate standard apply to the assay of multiple candidate standards. The analyst should be aware that the effect of any short-term calibration drift will be greater when multiple candidate standards are assayed. This greater effect is due to the longer period of time between reference standard measurements. Unacceptable uncertainties of the estimated concentrations for the candidate standards may occur as a result of the longer assay session.
5. Conduct at least two additional sets of measurements, as described in step 4
above. However, for these subsequent sets of measurements, change the order of the three measurements (e.g., measure reference standard, zero gas, and candidate standard for the second set and measure zero gas, candidate standard, and reference standard for the third set). Changing the order that the gas mixtures are measured helps the analyst to discover any effect of that one measurement has on subsequent measurements. The number of sets of measurements will have been determined during analysis of the multipoint calibration data such that the expanded uncertainty of the regression-predicted concentration of the candidate standard is ≤1 percent of the concentration of the reference standard.
6. If any one or more of the measurements of a set of measurements is invalid
or abnormal for any reason, discard all three measurements and repeat the measurements. Such measurements may be discarded if the analyst can demonstrate that the experimental conditions were inappropriate during these measurements. Data cannot be discarded just because they appear to be outliers but may be discarded if they satisfy statistical criteria for outliers.39 In the case of outliers, all of the measurements do not have to be discarded. Only the outliers should be discarded. As part of the laboratory records, the analyst must record any discarded data and briefly explain in the laboratory's records why these data were discarded.
7. The spreadsheets described in Appendices A and C (or an EPA-approved
equivalent statistical technique) must be used to calculate an overall estimated concentration and the expanded uncertainty of the candidate standard based on data from the assay measurements and from the multipoint calibration. Record the estimated concentration and the expanded uncertainty in the laboratory’s records.
If the assay date is different from the calibration date and if there is no
statistical difference between the two sets of data (i.e., the calibration data

EPA Traceability Protocol for Gaseous Calibration Standards
45
and the zero and span gas check data), entering both sets of data in the Xi and Yi columns in Step 1 of the Appendix A spreadsheet will produce a smaller expanded uncertainty for the estimated concentration than if only the calibration data were entered in these columns. However, a larger expanded uncertainty will be produced if there is a statistical difference between the two sets of data and if both are entered in these columns. The analyst should check which approach yields the smaller value for the expanded uncertainty.
The Appendix A spreadsheet calculates the percentage of the uncertainty that
is due to the multipoint calibration. This percentage is needed for the total uncertainty calculations in Appendix C when two or more assays fall under the same multipoint calibration. Record this value in the laboratory’s records.
8. If the multipoint calibration data and the assay data underwent any
mathematical transformations before their statistical analysis, perform the reverse transformations for the estimated concentration and the expanded uncertainty. Record the transformed values in the laboratory’s records.
2.2.8 Stability Test for Newly Prepared Candidate Standards See Subsection 2.1.5.2. 2.2.9 Certification Documentation See Subsections 2.1.7 and 2.1.8. 2.2.10 Recertification Requirements See Subsections 2.1.11 and 2.1.12.


EPA Traceability Protocol for Gaseous Calibration Standards
47
2.3 Procedure G2: Assay and Certification of a Compressed Gas Calibration Standard using Dilution 2.3.1 Applicability This procedure may be used to assay the concentration of a diluted candidate standard, based on the concentration of a diluted reference standard of the same composition. It allows a specialty gas producer, an end user, or other laboratory to certify that the assayed concentration for the candidate standard is traceable to an NIST-traceable gaseous reference standard and to NIST-certified flow rate, pressure, volume, mass or time reference standards. Dilution of the candidate and reference standards with zero gas allows greater flexibility in the range of concentrations of both the candidate and reference standards that can be assayed. The procedure employs a low-concentration-range (i.e., ambient air quality level) pollutant gas analyzer to compare quantitatively diluted gas samples of both the candidate and reference standards. This analyzer is more likely to have an inherently linear response than a high-concentration-range analyzer. However, dilution introduces additional error into the assay which would not be present if the standards were assayed without dilution. This additional error is measured by an accuracy check of the assay apparatus which is performed as part of the multipoint calibration. This procedure may be used for the assay of multiple candidate standards at the same time. Criteria that apply to the assay of one candidate standard apply to the assay of multiple candidate standards. 2.3.2 Limitations This procedure is not intended to be used for the assay and certification of a GMIS that could be used as an analytical reference material in the assay of candidate standards. Procedure G1 should be used for GMISs.
The concentration of the diluted candidate standard may be greater than or lesser than the concentration of the diluted reference standard. However, both concentrations must lie within the well-characterized region of the analyzer's multipoint calibration (see Subsection 2.1.4.2). Additionally, the magnitude of the expanded uncertainty for the estimated concentration of the candidate standard must be ≤±1 percent of the reference standard concentration. This criterion may be more restrictive than the corresponding criterion for the multipoint calibration, but it allows the analyst greater flexibility in the selection of a reference standard for the assay of a particular candidate standard. For example, assume that a 70-ppm candidate standard is being assayed using a 50-ppm reference standard and that the analyzer’s calibration was found to be well characterized between 20 and 80

EPA Traceability Protocol for Gaseous Calibration Standards
48
ppm. The expanded uncertainty for the example candidate standard’s estimated concentration must be ≤±0.5 ppm.
An NIST-traceable system for flow measurement and gas dilution is required (see Subsections 2.1.3 and 2.3.4).
The balance gas in both the candidate and reference standards must be identical, unless either a high dilution flow rate ratio (i.e., at least 50 parts zero gas to 1 part standard) is used for the assay or it has been demonstrated that the analyzer is insensitive to differences in the balance gas. 2.3.3 Assay Apparatus Dilution may be accomplished by using dynamic dilution methods or static volumetric dilution methods. Examples of dynamic methods include capillary tubes, critical orifices, volumetric piston pumps, and thermal mass-flow controllers. An example static method involves filling an evacuated, fixed-volume White (i.e., multipass) gas cell with measured pressures of a candidate or reference standard and zero gas and then measuring the concentration of resulting gas mixture using a Fourier transform infrared (FTIR) spectrometer. This procedure mainly focuses on dynamic methods, but it can be applied to static methods by substituting NIST-traceable pressure measurements for the NIST-traceable flow rate measurements that are described in this procedure. The components of the assay apparatus can be assembled in several different configurations without diminishing performance. Two possible designs of the assay apparatus are illustrated in Figures 2-3 and 2-4. The former figure shows a configuration in which discrete components (i.e., three-way valves, gas flow controllers, and a mixing chamber) are used to dilute the reference and candidate standards. The latter figure shows a configuration in which a commercially-available gas dilution system is used to dilute the standards. Both designs share the important characteristic that the candidate standard is diluted by the same components that dilute the reference standard. Inert materials (e.g., Teflon®, stainless steel, borosilicate glass or silanized glass) and clean, noncontaminating components should be used in those portions of the apparatus that are in contact with the gas mixtures being assayed.

EPA Traceability Protocol for Gaseous Calibration Standards
49
Figure 2-3 Two designs for assay apparatus with dilution (Procedure G2)
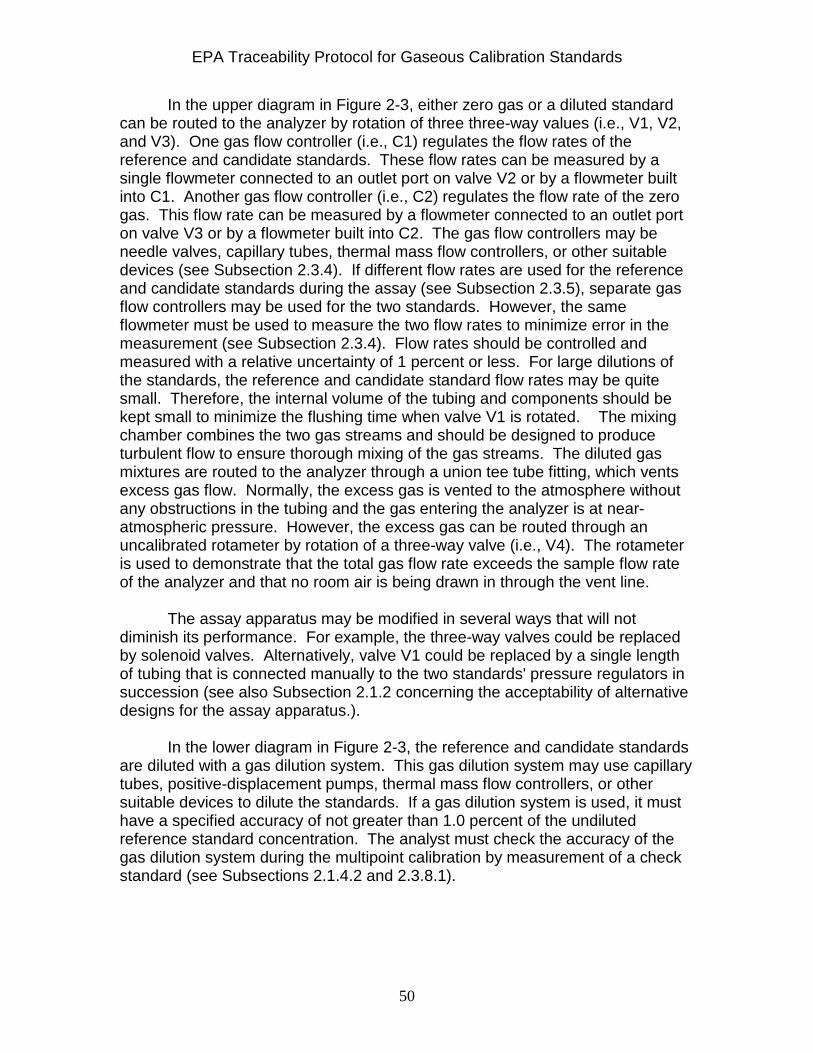
EPA Traceability Protocol for Gaseous Calibration Standards
50
In the upper diagram in Figure 2-3, either zero gas or a diluted standard can be routed to the analyzer by rotation of three three-way values (i.e., V1, V2, and V3). One gas flow controller (i.e., C1) regulates the flow rates of the reference and candidate standards. These flow rates can be measured by a single flowmeter connected to an outlet port on valve V2 or by a flowmeter built into C1. Another gas flow controller (i.e., C2) regulates the flow rate of the zero gas. This flow rate can be measured by a flowmeter connected to an outlet port on valve V3 or by a flowmeter built into C2. The gas flow controllers may be needle valves, capillary tubes, thermal mass flow controllers, or other suitable devices (see Subsection 2.3.4). If different flow rates are used for the reference and candidate standards during the assay (see Subsection 2.3.5), separate gas flow controllers may be used for the two standards. However, the same flowmeter must be used to measure the two flow rates to minimize error in the measurement (see Subsection 2.3.4). Flow rates should be controlled and measured with a relative uncertainty of 1 percent or less. For large dilutions of the standards, the reference and candidate standard flow rates may be quite small. Therefore, the internal volume of the tubing and components should be kept small to minimize the flushing time when valve V1 is rotated. The mixing chamber combines the two gas streams and should be designed to produce turbulent flow to ensure thorough mixing of the gas streams. The diluted gas mixtures are routed to the analyzer through a union tee tube fitting, which vents excess gas flow. Normally, the excess gas is vented to the atmosphere without any obstructions in the tubing and the gas entering the analyzer is at near-atmospheric pressure. However, the excess gas can be routed through an uncalibrated rotameter by rotation of a three-way valve (i.e., V4). The rotameter is used to demonstrate that the total gas flow rate exceeds the sample flow rate of the analyzer and that no room air is being drawn in through the vent line. The assay apparatus may be modified in several ways that will not diminish its performance. For example, the three-way valves could be replaced by solenoid valves. Alternatively, valve V1 could be replaced by a single length of tubing that is connected manually to the two standards' pressure regulators in succession (see also Subsection 2.1.2 concerning the acceptability of alternative designs for the assay apparatus.). In the lower diagram in Figure 2-3, the reference and candidate standards are diluted with a gas dilution system. This gas dilution system may use capillary tubes, positive-displacement pumps, thermal mass flow controllers, or other suitable devices to dilute the standards. If a gas dilution system is used, it must have a specified accuracy of not greater than 1.0 percent of the undiluted reference standard concentration. The analyst must check the accuracy of the gas dilution system during the multipoint calibration by measurement of a check standard (see Subsections 2.1.4.2 and 2.3.8.1).

EPA Traceability Protocol for Gaseous Calibration Standards
51
The gas dilution system used in this procedure need not be certified as NIST-traceable using the procedures given in Section 4 because this procedure is adequate for establishing the traceability of candidate standards using dilution. 2.3.4 Flowmeters and Gas Dilution Systems for Dilution of Gas Mixtures The flow rate/control reference standards or gas dilution systems must be traceable to NIST primary flow rate, volume, mass or time reference standards by original calibration by its manufacturer and by annual recertification at a NIST-accredited state weights and measures laboratory or at a calibration laboratory that is accredited by the National Voluntary Laboratory Accreditation Program (NVLAP), the American Association for Laboratory accreditation (A2LA) or by the International Laboratory Accreditation Conference (ILAC) under ISO/IEC 17025 (General Requirements for the Competence of Testing and Calibration Laboratories).10,11,12 Alternatively, flow rate reference standards or gas dilution systems may be traceable to the flow rate, volume, mass or time reference standards of other national metrology institutes (e.g., KRISS in South Korea, NEL in the United Kingdom, PTB in Germany) provided that these institutes are participants in the Working Group for Fluid Flow (WGFF) of the International Committee for Weights and Measures (CIPM). The flow rate reference standards may be primary standards or secondary standards. A primary standard is defined as a device or object used as the reference in a calibration that is acknowledged to be of the highest metrological quality and that derives its measurement without reference to some other standard of the same quantity. The reference standards' certifications must cover the range of flow rates that will be used by the gas dilution systems and their uncertainties of the flow rates must be documented in a calibration certificate. Their uncertainties must be evaluated and expressed according to accepted metrological practice (see Reference 9) and must not be greater than plus or minus 1 percent of set-point for the flow rates that will be used for gas dilution. Uncertainties that are much less than plus or minus 1 percent of reading are desirable so that the uncertainties of the gas mixture concentrations are decreased. They must be stable, repeatable, and linear and have good resolution. Figure 2-2 shows flow measurement ports on valves V2 and V3. In this configuration, a single flowmeter can be used to measure both the standard flow rate and the zero gas flow rate. Such an approach would reduce measurement errors arising from differences in the calibration of multiple flowmeters. Alternatively, the reference standard and zero gas flow rates can be measured separately at the outlet of the mixing chamber or the outlet of the gas dilution system. In either case, a NIST-traceable volumetric flowmeter such as a wet test meter, a thermal mass flowmeter, or a soap bubble flowmeter can be used (see Subsection 2.1.3). Each flow rate must be measured separately while the other

EPA Traceability Protocol for Gaseous Calibration Standards
52
flow rates are set to zero. Care must be exercised to ensure that each measured flow rate remains constant when combined with the other flow rate(s) and between the time of measurement and the time of the assay. Additionally, care must be taken to ensure that the flowmeter does not cause any back pressure in the gas stream and any resulting change in the flow rate through the flow controller. If in-line flowmeters are mounted directly downstream of the flow controllers, they may not operate at atmospheric pressure because of back pressure from downstream components. Also, this back pressure may vary as a function of the total flow rate. Thus, the flowmeters must compensate for the variable in-line pressure. Thermal mass flowmeters do not need to be corrected for pressure effects. Measurements from pressure-sensitive flowmeters such as rotameters or from volumetric flowmeters such as piston-type positive-displacement flowmeters, wet test meters or soap-film flowmeters must be carefully corrected for the actual gas pressure during the flow measurement. An in-line flowmeter must not contaminate or react with the gas mixture passing through it. All volumetric flow-rate measurements must be corrected or referenced to the same temperature and pressure conditions, such as EPA-standard conditions (i.e., 760 millimeters of mercury (mm Hg), 25 °C) or the ambient temperature and pressure conditions prevailing in the laboratory during the assay. Measurements using wet test meters and soap-film flowmeters also must be corrected for the saturation of the gas stream with water vapor in the moist interiors of these flowmeters. The equation to correct the flow rate for temperature, pressure, and humidity effects is given below:
− =
SM WV
S M
TVolume P PFlow rateTime P T
where PM = measured barometric pressure (mm Hg); PWV = partial pressure of water vapor (mm Hg); PS = standard pressure (mm Hg); TS = standard temperature (298.2 K); and TM = measured ambient temperature (273.2 + °C). If using a flowmeter that does not use water or a soap bubble for measurement the term PWV can be ignored. Measurement of reference and candidate standard flow rates with the same flowmeter and measurement of both dilution zero gas flow rates with the same flowmeter tend to reduce measurement errors, associated with the use of multiple flowmeters. These errors are more pronounced at higher dilution flow rate ratios. Note that the impact of any flow measurement error is reduced if the

EPA Traceability Protocol for Gaseous Calibration Standards
53
same dilution ratio can be used for both the reference standard and candidate standard measurements. 2.3.5 Selection of Gas Dilution Flow Rates or Gas Concentration Settings The flow rates or settings used for the zero gas, reference standard, and candidate standard should be selected carefully to provide diluted concentrations for both the candidate and reference standards that fall in the well-characterized region of the analyzer's calibration curve. The diluted concentration of the candidate standard may be greater than or lesser than the diluted concentration of the reference standard. Any assay error due to the dilution process will be reduced if the same dilution flow-rate ratio or concentration setting can be used for both the candidate and reference standards. Select the diluted concentrations of the reference and candidate standards, and select flow rates or concentration settings that will produce the highest analyzer responses within the well-characterized region of the analyzer's calibration curve. If possible, select flow rates or a flowmeter range such that the flow rates to be measured fall in the upper half of the range. If the same dilution flow-rate ratio or concentration setting cannot be used for both the candidate and reference standards, select different ratios or settings for the candidate and reference standards to produce concentrations that are approximately equal and that fall in the well-characterized region of the analyzer's calibration curve. Select flow rates or settings such that only one of the apparatus controls must be adjusted when switching from the reference standard to the candidate standard, or vice versa. Where a choice of analyzer ranges is available, higher dilution ratios or lower concentration settings will reduce the consumption of the standards. 2.3.6 Pollutant Gas Analyzer The pollutant gas analyzer must have a well-characterized calibration curve and must have a range that is capable of measuring the diluted concentration of both the candidate and the reference standards (see Subsection 2.1.4.1 concerning general analyzer calibration requirements). It must have good resolution, good precision, a stable response, and low output signal noise. A suitable analyzer with acceptable performance specifications may be selected from the list of EPA-designated reference and equivalent method analyzers.40 In addition, the analyzer should have, but is not required to have, good specificity for the pollutant of interest so that it has no detectable response to any other component or contaminant that may be contained in either the candidate or reference standards. When selecting an analyzer for the assay of a specific gas mixture, the analyst should investigate potential analytical inferences between gas mixture components. If any component in a multiple-component standard interferes with the assay of any other component, the analyst must conduct an interference study to determine an interference correction equation. If the

EPA Traceability Protocol for Gaseous Calibration Standards
54
candidate and reference standards contain dissimilar balance gases (e.g., air versus nitrogen or different proportions of oxygen in the balance air), either a high dilution flow-rate ratio (i.e., at least 50 parts zero gas to 1 part standard) should be used or it must have been demonstrated that the analyzer's response is not sensitive to differences in the balance gas composition. This demonstration may be accomplished by showing that no difference exists in an analyzer's response when measuring a compressed gas calibration standard that has been diluted with identical flow rates of different balance gases. The analyzer should be connected to a high-precision data acquisition system, which must produce an electronic record of the analyzer's response during the assay. A high-precision digital panel meter, a digital voltmeter, a data logger or some other data acquisition system with four-digit resolution can be used to obtain numerical values of the analyzer's response. More precise values will be obtained if this system has a data-averaging capability. The specialty gas producer or other laboratory that assayed the candidate standard must maintain laboratory records for at least the standard's certification period or until such time as the standard is blown down after being returned by the final user to the producer. If the analyzer has not been in continuous operation, turn it on and allow it to stabilize (e.g., for at least 12 hours) before beginning any measurements. 2.3.7 Assay Gases 2.3.7.1 Candidate Standard— See Subsections 2.1.5, 2.3.2, and 2.3.5. 2.3.7.2 Reference Standard— See Subsections 2.1.3, 2.1.12, 2.3.2, and 2.3.5. The reference standard used for the assay of the candidate standard must be an SRM, an RGM, a PRM, a CRM, an NTRM or a GMIS. This standard need not be the same as any of the reference standards used for the span gas check or for the multipoint calibration. Information concerning the reference standard (e.g., cylinder identification number, certified concentration, certification expiration date, etc.) must be recorded in the laboratory’s records. If the multipoint calibration data have been fitted to a linear (i.e., straight-line) model, then only a single reference standard need be measured during the assay of the candidate standard. If these data have been fitted to a quadratic or higher-order polynomial model, then at least two reference standards must be measured. One reference standard is adequate to determine the slope of a linear equation, but additional reference standards are needed to determine the curvature of quadratic or higher-order polynomial equations. The concentrations of the additional reference standards should be located at the maximum

EPA Traceability Protocol for Gaseous Calibration Standards
55
difference between the polynomial curve and the corresponding straight line between the zero gas and the highest-concentration reference standard. 2.3.7.3 Zero Gas— The zero gas used for dilutions must be clean, dry, zero-grade air or nitrogen containing no detectable concentration of the pollutant of interest (see Subsection 2.1.3.5). Use the same zero gas for dilution of both candidate standards and reference standards. The use of an NIST-traceable zero air material for the zero gas check is recommended, but not required (see Subsection 2.4). The analyst may substitute a low-concentration, NIST-traceable reference standard for the zero gas in zero gas checks and assays if there is reason to believe that the zero gas reading may not accurately represent the zero-intercept of the calibration equation. Information concerning the zero gas must be recorded in the laboratory's records. 2.3.8. Analyzer Calibration 2.3.8.1 Multipoint Calibration— See Subsections 2.1.4.2 and 2.1.4.3. Following completion of the multipoint calibration, the accuracy of the assay apparatus must be checked to verify that the error associated with the dilution is not excessive. This accuracy check involves the measurement of an undiluted or diluted check standard. The check standard must be an SRM, an RGM, a PRM, a CRM, an NTRM or a GMIS as specified in Subsection 2.1.3.1. It must have a certified concentration that is different from that of the reference standard used in the multipoint calibration. Information concerning this standard (e.g., cylinder identification number, certified concentration) must be recorded in the laboratory's records. If an undiluted check standard is used, its concentration must fall in the well-characterized region of the calibration curve. If a diluted check standard is used, the diluted concentration must fall in the well-characterized region. The point on the calibration curve at which the dilution-related uncertainty is checked will depend on the undiluted reference standards that are available to be used for the accuracy check. Make three or more discrete measurements of the undiluted or diluted check standard. "Discrete" means that the analyst must change the gas mixture being sampled by the analyzer between measurements. For example, the analyst might alternate between measurements of the check standard and the zero gas. Record these measurements in the laboratory's records. Next the analyst must verify that the dilution error is not excessive. For the check standard measurements, calculate the relative difference (in percent) between the mean analyzer response to the undiluted or diluted check standard and the corresponding response that is predicted from the multipoint calibration

EPA Traceability Protocol for Gaseous Calibration Standards
56
regression equation and the undiluted or diluted check standard concentration. That is, Relative Difference = 100 (Mean Analyzer Response - Predicted Response) (Predicted Response) If the relative difference is greater than 1.0 percent, the dilution error is considered to be excessive. The analyst must investigate why the relative difference is excessive. The problem may be due to errors in the reference standard and check standard concentrations, errors in assay apparatus or to some other source. Assays may not be conducted until the relative difference for a subsequent accuracy check is less than or equal to 1.0 percent. 2.3.8.2 Analyzer Range— The range of the analyzer must include the concentrations of the zero gas and of the diluted candidate and reference standards (see Subsection 2.3.5). The concentrations of the diluted reference and candidate standards must fall within the well-characterized region of the analyzer's calibration curve. Because the selection of the dilution ratio or ratios to be used in the assay provides great flexibility in the choice of concentrations to be measured by the analyzer, the analyzer range should be selected based on optimum accuracy, stability, and linearity. 2.3.8.3 Linearity— The data reduction technique used in this procedure requires that the analyzer have a well-characterized, but not necessarily linear, calibration curve (see Subsection 2.1.4.2). Many lower-concentration analyzers of the type that may be used for this procedure have straight-line calibration curves. If not, they usually have a predictable nonlinear calibration curve that can be described by a polynomial equation or can be mathematically transformed to produce a straight-line calibration curve suitable for use in this procedure. Any such polynomial equation or mathematical transformation should be verified during the multipoint calibration. Caution should be exercised in using a transformed calibration curve because zero or span control adjustments to the analyzer may produce unexpected effects in the transformed calibration curve. 2.3.8.4 Zero and Span Gas Checks— See Subsections 2.1.3.2 and 2.1.3.3. Prior to carrying out the assay of the candidate standard, use zero and span gases to check for calibration drift in the analyzer since the multipoint calibration. Zero gas and span gas checks must be performed on any day after the multipoint calibration that candidate standards are assayed. If multiple assays are being performed on the same analyzer range, the analyst needs to perform only a single set of zero gas and span gas checks. However, another set must be performed if the range is changed.

EPA Traceability Protocol for Gaseous Calibration Standards
57
The gas mixtures to be used during the zero and span gas checks need not be the same as any of the reference standards used for the assay of the diluted candidate standard or for the multipoint calibration. The reference standard for the span gas check must be traceable to an SRM, an RGM, a PRM, a CRM, or an NTRM. The zero gas must meet the requirements in Subsection 2.1.3.4. The use of NIST-traceable zero air material for the zero gas check is recommended, but not required. Information concerning these standards (e.g., cylinder identification number, certified concentration, uncertainty, certification expiration date, etc.) must be recorded in the laboratory's records. Make three or more discrete measurements of the zero gas and three or more independent measurements of the diluted reference standard. Record these measurements in the laboratory's records. Next, the analyst must verify that the analyzer's precision is acceptable. Calculate the mean and standard deviation of the analyzer's response to the zero gas. Repeat these calculations for the diluted reference standard measurements. These calculations are performed in Step 6 of the spreadsheet described in Appendix A. Record these calculations in the laboratory's records. The standard error of the mean for each set of measurements must be less than or equal to 1.0 percent of the mean response to the diluted reference standard. That is,
≤100
DRSRSn
where s = standard deviation of the analyzer's response; n = the number of measurements of the gas mixture; and DRSR = the mean analyzer response to the diluted reference standard. The value of the standard error of the mean can be made smaller by increasing the number of measurements. This calculation will enable the analyst to determine how many replicate measurements are needed during the assay of the diluted candidate standard to obtain acceptable precision. The analyst may wish to use a data logger or data acquisition system with data averaging capability to obtain more precise measurements. If the value of the standard error of the mean is not acceptable, then the analyzer must be repaired or another analyzer must be used for the assay. Next the analyst must verify that excessive calibration drift has not occurred since the multipoint calibration. For the zero gas measurements, calculate the relative difference (in percent) between the mean analyzer response during the zero gas check and the corresponding response that is predicted from the multipoint calibration regression equation. That is,

EPA Traceability Protocol for Gaseous Calibration Standards
58
Relative Difference = 100 (Current Zero Response - Calibration Zero Response) (Calibration Response for Diluted Reference Standard) Note that the relative difference is calculated relative to the zero-corrected response for the diluted reference standard from the multipoint calibration. If the diluted reference standard was not measured during the multipoint calibration, use the regression-predicted response for a concentration equal to that of this standard. Repeat this relative difference calculation for the diluted reference standard measurements. That is, Relative Difference = 100 (Current Span Response - Calibration Span Response) (Calibration Response for Diluted Reference Standard) These relative difference calculations are performed in Step 6 of the Appendix A spreadsheet. Record these calculations in the laboratory's records. Then, if the relative differences for the zero and span checks are less than or equal to 5.0 percent, the analyzer's current calibration is considered to be approximately the same as during the multipoint calibration and the assay may be conducted. The zero and span controls need not be adjusted and the assay may be conducted. The data reduction technique does not require that some calibration drift has not occurred since the multipoint calibration. Some minor calibration drift is acceptable because the drift will be corrected for during the reduction of the assay data. However, if the relative difference for either the zero or the span gas checks is greater than 5.0 percent, then the analyzer is considered to be out of calibration. A new multipoint calibration may be conducted before the candidate standard is assayed or the analyzer's zero and span controls may be adjusted to return the analyzer's response to the original calibration levels. For some analyzers such as nondispersive infrared instruments, daily changes in environmental variables such as barometric pressure may shift the calibration. After any adjustment of the controls, the analyst should repeat the zero and span gas checks and recalculate the relative differences to verify that the analyzer is sufficiently in calibration. The analyzer will be considered to be out of calibration if the relative differences remain greater than 5.0 percent. The zero gas and diluted reference standard measurements that are performed for the assay of the diluted candidate standard may also be used for the zero gas and span gas checks.

EPA Traceability Protocol for Gaseous Calibration Standards
59
2.3.9 Assay Procedure 1. Verify that the assay apparatus is properly configured as shown in Figure 2-3
or Figure 2-4 and as described in Subsection 2.3.3. Inspect the analyzer to verify that it appears to be operating normally and that all controls are set to their expected values. Record these values in the laboratory's records.
2. Verify that the calibrations of the flow rate/control reference standards or gas
dilution systems have not drifted significantly since their last calibration or recertification. This verification need not be done more frequently than monthly, but that it must have been done within a month before the assay. Use an NIST-traceable flow rate/control reference standard to check at least one flow rate setting for each pollutant and dilution gas stream in the assay apparatus. Record the indicated and actual flow rates in the laboratory's records. Calculate the relative difference (in percent) between the indicated and actual volumes or flow rates. That is,
Relative Difference = 100 (Indicated Flow Rate - Actual Flow Rate) (Actual Flow Rate)
If the relative differences for the pollutant and diluent flow rates are less than 1.0 percent, the calibrations of the flow rate/control reference standards or gas dilution systems have not drifted significantly since their last calibration or recertification. The assay can proceed. If the relative differences for either the pollutant flow rate or the diluent flow rate exceed than 1.0 percent, then significant drift has occurred and the device should be recertified before the assay is conducted.
3. Verify that a multipoint calibration of the analyzer has been performed within 1
month prior to the assay date and that it demonstrates acceptable instrument performance and that the dilution error that is not excessive (see Subsections 2.1.4.2, 2.3.6, and 2.3.8.1). Additionally, verify that the zero and span gas checks indicate that the analyzer is in calibration (see Subsection 2.3.8.4). Finally, verify that the concentrations of the diluted reference and candidate standards fall within the well-characterized region of the analyzer's calibration curve (see Subsection 2.1.4.2).
4. Determine and establish the flow rates or concentration settings of the gas
mixtures (i.e., reference standard(s), candidate standard, and zero gas) that will be used for the assay (see Subsections 2.3.4, 2.3.5, and 2.3.8.2). Also check that the total flow rate coming from the mixing chamber will provide enough flow for the analyzer and sufficient excess to ensure that no ambient air will be drawn into the vent line. Changes in the sample pressure may change the calibration curve. When using the same flow rates for both candidate and reference standards, carefully set the delivery pressures of the

EPA Traceability Protocol for Gaseous Calibration Standards
60
two standards' pressure regulators to the same value so that there is no change in the flow rate when switching from one standard to the other.
Calculate the diluted reference standards' concentration using the following
equation: Diluted Standard Conc. = (Undiluted Standard Conc.)(Standard Flow Rate)
(Standard Flow Rate + Zero Gas Flow Rate) Record the measured flow rates and the undiluted and diluted reference
standard concentrations in the laboratory's records. 5. In succession, measure the zero gas, the diluted reference standard(s) and
the diluted candidate standard using the analyzer. For each measurement, adjust the flow rates, if necessary, to those determined in Step 4, and allow sufficient time between measurements to completely purge the analyzer of the previous gas and for the analyzer to achieve a stable reading. If the reading is not stable, the precision of the measurements will decline and the candidate standard might not be certifiable under this protocol. Record the analyzer response for each measurement, using the same response units (e.g., volts, area counts, etc.) as was used for the multipoint calibration. At this point, do not convert the data into concentration values using the calibration equation. Do not perform any mathematical transformations of the data. These steps will be done later. Do not make any zero control, span control, or other adjustments to the analyzer during this set of measurements. Record these analyzer responses in the laboratory's records.
The analyst may assay multiple candidate standards during the same assay
session. For example, a single set of measurements may involve a zero gas, a diluted reference standard, and three diluted candidate standards. Criteria that apply to the assay of one candidate standard apply to the assay of multiple candidate standards. The analyst should be aware that the effect of any short-term calibration drift will be greater when multiple candidate standards are assayed. This greater effect is due to the longer period of time between reference standard measurements. Unacceptable uncertainties of the estimated concentrations for the diluted candidate standards may occur as a result of the longer assay session.
6. Conduct at least two additional sets of measurements, as described in step 5
above. However, for these subsequent sets of measurements, change the order of the three measurements (e.g., measure the reference standard, zero gas, and candidate standard for the second set and measure the zero gas, candidate standard, and reference standard for the third set, etc.). Changing the order that the gas mixtures are measured helps the analyst to discover any effect that one measurement has on subsequent measurements. The number of sets of measurements will have been determined during the

EPA Traceability Protocol for Gaseous Calibration Standards
61
analysis of the multipoint calibration data such that the expanded uncertainty for the regression-predicted concentration of the candidate standard is ≤1 percent of the concentration of the reference standard.
7. If any one or more of the measurements of a set of measurements is invalid
or abnormal for any reason, discard all three measurements and repeat the measurements. Such measurements may be discarded if the analyst can demonstrate that the experimental conditions were inappropriate during these measurements. Data cannot be discarded just because they appear to be outliers but may be discarded if they satisfy statistical criteria for outliers.39 In the case of outliers, all of the measurements do not have to be discarded. Only the outliers should be discarded. As part of the laboratory records, the analyst must record any discarded data and briefly explain in the laboratory's records why these data were discarded.
8. The spreadsheets described in Appendices A and C (or an EPA-approved
equivalent statistical technique) must be used to calculate an overall estimated concentration and the expanded uncertainty of the candidate standard based on data from the assay measurements and from the multipoint calibration. Record the estimated concentration and the expanded uncertainty in the laboratory’s records.
If the assay date is different from the calibration date and if there is no
statistical difference between the two sets of data (i.e., the calibration data and the zero and span gas check data), entering both sets of data in the Xi and Yi columns in Step 1 of the Appendix A spreadsheet will produce a smaller expanded uncertainty for the estimated concentration than if only the calibration data were entered in these columns. However, a larger expanded uncertainty will be produced if there is a statistical difference between the two sets of data and if both are entered in these columns. The analyst should check which approach yields the smaller value for the expanded uncertainty.
The Appendix A spreadsheet calculates the percentage of the uncertainty that
is due to the multipoint calibration. This percentage is needed for the total uncertainty calculations in Appendix C when two or more assays fall under the same multipoint calibration. Record this value in the laboratory’s records.
The uncertainty associated with the dilution of the reference standard and the
candidate standard needs to be included in the calculation of the expanded uncertainty in those cases in which the gas dilution apparatus' settings are different for the reference standard than for the candidate standard. However, this uncertainty component does not have to be included in the calculation of the expanded uncertainty if exactly the same settings for the gas dilution apparatus are used for the analysis of the reference standard and the candidate standard. In this case, no variability in the results is introduced by using a constant dilution setting.

EPA Traceability Protocol for Gaseous Calibration Standards
62
9. If the multipoint calibration data and the assay data underwent any
mathematical transformations before their statistical analysis, perform the reverse transformations for the estimated concentration and the expanded uncertainty. Record the transformed values in the laboratory’s records.
10. Finally, the certified undiluted concentration for a candidate standard
containing an unreactive gas mixture and requiring only a single assay can be calculated from the mean concentration of the diluted candidate standard as follows:
Certified Undiluted Conc. = (Mean Diluted Conc) (Total Gas Flow Rate) (Standard Gas Flow Rate) where Total Gas Flow Rate = Standard Gas Flow Rate + Zero Gas Flow Rate 2.3.10 Stability Test for Newly Prepared Standards See Subsection 2.1.5.2. 2.3.11 Certification Documentation See Subsections 2.1.7 and 2.1.8. 2.3.12 Recertification Requirements See Subsection 2.1.11.

EPA Traceability Protocol for Gaseous Calibration Standards
63
2.4 Procedure G3: Assay and Certification of a Zero Air Material as Conforming to 40 CFR Part 72.2 2.4.1 Applicability This procedure may be used to measure whether the impurity concentrations of a candidate zero air material are less than the impurity specifications of 40 CFR Part 72.27 (i.e., a calibration gas whose concentrations of SO2, NOX, and THC are not greater than 0.1 ppm; whose concentration of CO is not greater than 1 ppm; and whose concentration of CO2 is not greater than 400 ppm). Under 40 CFR Part 72.2, a zero air material means a calibration gas certified by a specialty gas producer, ambient air conditioned and purified by a continuous emission monitoring system (CEMS), conditioned and purified ambient air provided by a conditioning system concurrently supplying dilution air to the CEMS or a multicomponent mixture certified by the supplier of the mixture that the concentration of the component being zeroed is less than or equal to the applicable concentration specification. This procedure does not determine an overall estimated concentration and an expanded uncertainty (U) for the zero air material. Rather, it is a go/no-go check for the analyzer response from a candidate zero air material. The data from the multipoint calibration and the assay measurements are used to predict an analyzer response that would be produced by the maximum allowable impurity concentration. That analyzer response minus the uncertainty of the measurements establishes a go/no-go acceptance criterion for the analyzer response that demonstrates conformance with the specification. For example, if the predicted analyzer response for 1 ppm CO is 50 with an expanded uncertainty of +/-2, then a candidate zero air material whose reading is below 48 passes the go/no-go acceptance criterion and conforms to the CO concentration specification. These statistical calculations are performed by the Appendix E spreadsheet. See Reference 50 for information about statistical conformance with specifications.
This procedure allows a specialty gas producer, a standard user or other
analytical laboratory to determine whether a candidate zero air material meets the Part 72.2 impurity specifications. It is analytically simpler than Procedures G1 and G2. It employs a pollutant gas analyzer to compare the candidate's and reference standards' contents by direct measurement. Only a single measurement of each candidate is required. The go/no-go check allows the analyst to make an immediate assessment (as soon as a stable reading is obtained) of the candidate's conformance with the go/no-go acceptance criterion, rather than having to use the Appendix E spreadsheet to make a separate calculation for each candidate zero air material being assayed in the same analytical session.
The reference standards used for assaying a candidate under this procedure are an NIST-traceable zero air material and an NIST-traceable upscale reference standard, both of which must be a SRM, an NTRM, an RGM, a

EPA Traceability Protocol for Gaseous Calibration Standards
64
PRM, a CRM or a GMIS. It employs a pollutant gas analyzer to compare the candidate's and reference standards' contents by direct measurement.
This procedure may be used for the assay of more than one candidate during the same assay session. Criteria that apply to the assay of one candidate apply to the assay of multiple candidates.
At this time, EPA does not require the regulated community to use NIST-
traceable zero air materials for the calibration of ambient air or continuous emission monitors that are required by 40 CFR Parts 50, 58, 60, and 75. However, end users may elect to purchase these standards from specialty gas producers who elect to assay and certify them. 2.4.2 Limitations This procedure is not intended to be used for the assay and certification of the impurity concentrations of bulk zero air material such as could be used to fill individual cylinders that might be sold as NIST-traceable zero air materials. Rather, it is intended to be used for the assay of the impurity concentrations of candidate zero air materials in individual cylinders because the concentrations in these cylinders may differ from those in the bulk gas because of residual impurities that were in the cylinders before filling. Because of the simplified analytical and statistical techniques that are employed in this procedure, zero air materials cannot be certified as containing specific impurity concentrations using this procedure. Rather, they can be certified as conforming to the impurity specifications of Part 72.2. This procedure is not intended to be used for the assay and certification of a zero air GMIS that could be used as a reference standard in the assay of candidate zero air materials. Procedure G1 should be used for the assay and certification of a candidate zero air GMIS. 2.4.3 Assay Apparatus Figure 2-2 illustrates one possible design of apparatus for the assay of candidate zero air materials without dilution. See Subsections 2.1.3 and 2.2.3 for a discussion of this apparatus. The apparatus may be modified in several ways that will not diminish its performance. 2.4.4 Pollutant Gas Analyzer See Section 2.2.4 for the requirements for the pollution gas analyzer. Use the most sensitive operating range that allows measurement of the zero gas, the candidate zero air material, the upscale reference standard, and the reference standards used in the multipoint calibration. The detection limit for the analyzer

EPA Traceability Protocol for Gaseous Calibration Standards
65
must be less than the go/no-go acceptance criterion. If the analyzer has not been in continuous operation, turn it on and allow it to stabilize (e.g., for at least 12 hours) before beginning any measurements. 2.4.5 Analyzer Calibration 2.4.5.1 Multipoint Calibration— See Subsections 2.1.4.2, 2.1.4.3, and 2.3.5.1 for the requirements for the pollution gas analyzer's multipoint calibration. The analyzer used for the assay must have had a multipoint calibration within one month prior to the assay date that demonstrates acceptable instrument performance. The reference standards used in the multipoint calibration must include an NIST-traceable zero air material. The reference standards may be diluted with an NIST-traceable zero air material for the multipoint calibration. Note that the uncertainty of the calibration curve may comprise a larger fraction of the expanded uncertainty for a candidate zero air material than for a candidate standard whose concentration is near the upper end of the analyzer's range. The inclusion of more measurements or more concentrations in the multipoint calibration will reduce the uncertainty of the calibration curve, which may allow a clearer determination of whether a candidate zero air material conforms to the impurity specifications of Part 72.2. Note that an analyzer whose calibration equation on a less-sensitive range can be easily fitted to a straight-line regression model may need to be fitted to a quadratic or higher-order regression model when a more sensitive range is used to assay candidate zero air materials. The calibration curve may have a hook at lower concentrations. If an incorrect regression model is used for such data, the statistical analysis of these data may produce incorrect estimates of impurity concentrations. To investigate this possibility, include multiple reference standards at the low end of the range during the multipoint calibration. 2.4.5.3 Linearity— See Subsection 2.3.5.3 for a discussion of the linearity of the pollution gas analyzer's calibration curve. 2.4.6 Assay Gases 2.4.6.1 Candidate Zero Air Material— See Subsections 2.1.6 and 2.2.2. 2.4.6.2 Upscale Reference Standard— See Subsections 2.1.2 and 2.2.2. The upscale reference standard used for the assay of the candidate zero air material must be an SRM, an RGM, a PRM, a CRM, an NTRM or a GMIS. This standard need not be, but can be, one of the reference standards used for the multipoint calibration. It may be diluted

EPA Traceability Protocol for Gaseous Calibration Standards
66
with an NIST-traceable zero air material for the assay of the candidate zero air material. Information concerning the standard (e.g., cylinder identification number, certified concentration, uncertainty, certification expiration date, etc.) must be recorded in the laboratory's records. If the multipoint calibration data have been fitted to a linear (i.e., straight-line) regression model, then only a single upscale reference standard need be measured during the assay of the candidate zero air material. If these data have been fitted to a quadratic or higher-order regression model, then at least two upscale reference standards must be measured during the assay. One upscale reference standard is adequate to determine the slope of a linear equation, but additional upscale reference standards are needed to determine the curvature of quadratic and higher-order polynomial equations. The concentrations of the additional upscale reference standards should be located at the maximum difference between the polynomial curve and the corresponding straight line between the zero gas and the highest-concentration upscale reference standard. 2.4.6.3 Zero Gas— The use of a NIST-traceable zero air material is required (see Section 2.1.3.3). It must be an SRM, an RGM, a PRM, a CRM, an NTRM or a GMIS. It need not be, but can be, the zero gas that is used for the multipoint calibration. Information concerning the zero gas (e.g., cylinder identification number, certified concentration, uncertainty, etc.) must be recorded in the laboratory's records. 2.4.7 Assay Procedure 1. Verify that the assay apparatus is properly configured, as described in
Subsection 2.2.3 and shown in Figure 2-1. Inspect the analyzer to verify that it appears to be operating normally and that all controls are set to their expected values. Record these control values in the laboratory's records.
2. Verify that a multipoint calibration has been performed within 1 month prior to
the assay date and that demonstrates acceptable instrument performance (see Subsections 2.1.4.2 and 2.1.4.3). Additionally, verify that the concentrations of the candidate zero air material and the reference standards fall within the well-characterized region of the analyzer's calibration curve.
3. Measure and adjust the flow rates of the gas mixtures (i.e., upscale reference
standard(s), candidate zero air material, and zero gas) to approximately the same value that will provide enough flow for the analyzer and sufficient excess to assure that no ambient air will be drawn into the vent line.
4. Make three or more discrete measurements of the zero gas, three or more
discrete measurements of the upscale reference standard, and at least one measurement of the candidate zero air material(s). Use Valves V1 and V2 to select each of the gases for measurement. "Discrete" means that the analyst

EPA Traceability Protocol for Gaseous Calibration Standards
67
must change the gas being sampled by the analyzer between measurements. The analyst may assay multiple zero air materials during the same assay session. For example, the analyst might cycle through measurements of the upscale reference standard, the zero gas, the first candidate zero air material, and then repeat this cycle substituting in second and third candidate zero air materials. Allow sufficient time between measurements to completely purge the analyzer of the previous gas and for the analyzer to achieve a stable reading. Changing the order that the gas mixtures are measured helps the analyst to discover any effect of that one measurement may have on subsequent measurements. For each discrete measurement, allow ample time for the analyzer to achieve a stable response. If the response for each measurement is not stable, the precision of the measurements will decline and the candidate standard may not be certifiable under this protocol.
Criteria that apply to the assay of one candidate standard apply to the assay
of multiple candidate standards. The analyst should be aware that the effect of any short-term calibration drift will be greater when multiple candidate zero air materials are assayed. This greater effect is due to the longer period of time between reference standard measurements.
5. Record the analyzer response for each measurement in the laboratory's records, using the same response units (e.g., volts, area counts, etc.) as was used for the multipoint calibration. At this point, do not convert these data into concentration values using the calibration equation. Do not perform any necessary mathematical transformation at this point. The conversion and transformation will be done later. Do not make any zero control, span control, or other adjustments to the analyzer during these measurements.
6. If any one or more of the measurements is invalid or abnormal for any reason,
discard all three measurements and repeat the measurements. Such measurements may be discarded if the analyst can demonstrate that the experimental conditions were inappropriate during these measurements. Data cannot be discarded just because they appear to be outliers but may be discarded if they satisfy statistical criteria for testing outliers.39 The analyst must record any discarded data and a brief explanation as to why these data were discarded in the laboratory's records.
7. Verify that the analyzer's precision is acceptable. Calculate the mean and
standard deviation of the analyzer's responses to the zero gas. Repeat the calculations for the analyzer's responses to upscale reference standard. These calculations are performed in Step 5 of the spreadsheet described in Appendix E. Record these calculations in the laboratory's records. The standard error of the mean for each set of measurements must be less than or equal to 1.0 percent of the mean response to the upscale reference standard. That is,

EPA Traceability Protocol for Gaseous Calibration Standards
68
≤100
URSRSn
where s = standard deviation of the analyzer's response; n = the number of measurements of the zero gas; and
URSR = the zero-corrected mean analyzer response to the upscale reference standard.
If the value of the standard error of the mean is not acceptable, then the analyzer must be repaired or another analyzer must be used for the assay.
8. Verify that excessive calibration drift has not occurred since the multipoint
calibration. For the zero gas measurements, calculate the relative difference (in percent) between the current mean analyzer response during the assay and the corresponding response that is predicted from the multipoint calibration regression equation. That is,
Relative Difference = 100 (Assay Zero Response - Calibration Zero Response) (Zero-Corrected Upscale Reference Standard Response)
This calculation is performed in Step 5 of the Appendix E spreadsheet. Note that the relative difference is calculated relative to the zero-corrected response for the upscale reference standard from the multipoint calibration. If this standard was not measured during the multipoint calibration, use the regression-predicted response for a concentration equal to that of this standard.
Repeat this relative difference calculation for the upscale reference standard measurements. Record these calculations in the laboratory's records.
Then, if the relative differences for the zero gas and upscale reference
standard checks are less than or equal to 5.0 percent, the analyzer's current calibration is considered to be approximately the same as during the multipoint calibration and the multipoint calibration does not have to be repeated. The data reduction technique does not require that no calibration drift has occurred since the multipoint calibration. Some minor calibration drift is acceptable because the effect of any drift will be corrected during the reduction of the assay data.
However, if the relative difference for either the zero gas or the upscale
reference standard check is greater than 5.0 percent, then the analyzer is out of calibration. Either a new multipoint calibration must be conducted or the analyzer's zero and span controls must be adjusted to return the analyzer's response to the original calibration levels. For some analyzers such as

EPA Traceability Protocol for Gaseous Calibration Standards
69
nondispersive infrared instruments, daily changes in environmental variables such as barometric pressure may shift the calibration.
After any new multipoint calibration, repeat the measurements of the zero gas, the candidate zero air material, and the upscale reference standard. Record these measurements in the laboratory's records. After any adjustment of controls, repeat the measurements of the zero gas, the candidate zero air material, and the upscale reference standard. Record these measurements in the laboratory's records. Recalculate the relative differences to verify that the analyzer has returned to being in calibration. The analyzer will be considered to be still out of calibration if the relative differences remain greater than 5.0 percent. In such case, the analyzer may need to be repaired before the assay is repeated.
9. The spreadsheet described in Appendix E or an EPA-approved equivalent
statistical technique must be used to determine whether the candidate zero air material meets the Part 72.2 impurity specifications.
The spreadsheet also calculates the percentage of the uncertainty that is due
to the multipoint calibration. This percentage is needed for the total uncertainty calculations when two or more assays fall under the same multipoint calibration. Record this value in the laboratory’s records.
The analyst should investigate any of the measurements that appear to be
outliers. Such data may be discarded if the analyst can demonstrate that the experimental conditions were inappropriate during these measurements. Data cannot be discarded just because they appear to be outliers, but may be discarded if they satisfy statistical criteria for testing outliers.39 The analyst must record any discarded data and a brief summary of the investigation in the laboratory’s records.
10. If the multipoint calibration data and the assay data underwent any
mathematical transformations before their statistical analysis, perform the reverse transformations for the estimated concentration and the expanded uncertainty. Record the transformed values in the laboratory’s records.
11. The specialty gas producer or other laboratory that assayed the candidate
zero air material must maintain laboratory records until such time as the cylinder is blown down after being returned by the end user to the producer.
2.4.12 Recertification Requirements Zero air materials contained in compressed gas cylinders do not need to be
recertified, but those that are generated by an ambient air purification system must be recertified on a yearly basis or after system maintenance.


EPA Traceability Protocol for Gaseous Calibration Standards
71
Section 3 - EPA Traceability Protocol for Assay and Certification of Permeation Device Calibration Standards 3.1 General Information 3.1.1 Purpose and Scope of the Protocol This protocol describes two procedures for assaying the permeation rate of a candidate permeation device calibration standard and for certifying that the assayed permeation rate is traceable to National Institute of Standards and Technology (NIST) reference standards. This protocol is mandatory for certifying the permeation device calibration standards used for the pollutant monitoring that is required by the regulations of the Code of Federal Regulations, Chapter 40, Parts 50 and 582,3 for the calibration and audit of ambient air quality analyzers. This protocol covers the assay and certification of sulfur dioxide (SO2) and nitrogen dioxide (NO2) permeation device calibration standards. It may be used by permeation device producers, standard users, or other analytical laboratories. The assay procedure may involve the comparison of the candidate standards to compressed gas reference standards (i.e., Procedure P2), or to mass reference standards (i.e., Procedure P3). Earlier versions of this protocol included a procedure (i.e., Procedure P1) for comparison of a candidate standard to permeation device reference standards. This procedure has been eliminated because NIST no longer certifies SRM permeation device reference standards. 3.1.2 Reference Standards The compressed gas reference standards that may be used under this protocol are NIST Standard Reference Materials (SRMs), Van Swinden Laboratorium (VSL, the National Metrology Institute of the Netherlands) Primary Reference Materials (PRMs) that are equivalent to SRMs, NIST-Traceable Reference Materials (NTRMs), or gas manufacturer's intermediate standards (GMISs). These standards are described in Subsection 2.1.2 of this report. NIST's reported uncertainty of SRMs, NTRMs, and PRMs is expressed as the expanded uncertainty (U), which is the combined uncertainty (uC) multiplied by a coverage factor (k) almost always equal to 2.9 It includes allowances for the uncertainties of known sources of systematic error as well as the random error of measurement. A value of one-half of U for these reference standards should be used in calculating the total analytical uncertainty of standards that are certified under this protocol using the Appendix C spreadsheet (or an EPA-approved equivalent statistical technique, see Subsection 2.1.6). Mass reference standards must be traceable to NIST mass standards.41-43 Additionally, they must have an individual tolerance of no more than 0.05

EPA Traceability Protocol for Gaseous Calibration Standards
72
milligrams (mg). Examples of mass reference standards that meet these specifications are American National Standards Institute/American Society for Testing and Materials (ANSI/ASTM) Classes 1, 3, and 4. The mass reference standards must be recertified on a regular basis (e.g., yearly) at a NIST-accredited State weights and measures laboratory or at a calibration laboratory that is accredited by the National Voluntary Laboratory Accreditation Program (NVLAP)10,11, which is administered by NIST, or by the American Association for Laboratory Accreditation (A2LA) or by the International Laboratory Accreditation Conference (ILAC) under ISO/IEC 17025 (General Requirements for the Competence of Testing and Calibration Laboratories).10,11,12 Alternatively, mass reference standards may be traceable to mass reference standards of other national metrology institutes (e.g., KRISS in South Korea, NEL in the United Kingdom, PTB in Germany). The recalibration frequency is to be determined from records of previous recalibrations of these standards. Two separate sets of mass reference standards are recommended. Working calibration standards should be used for routine permeation device weighings and should be kept next to the analytical balance in a protective container. Laboratory primary standards are kept in a protective container, handled very carefully when in use and kept in a secure location when not in use. The working standards should be compared to the laboratory primary standards every 3 or 6 months to check for mass shifts associated with handling or contamination. The current masses of the working standards as traced to the laboratory primary standards should be recorded in the laboratory's records and should be used to check the calibration of the analytical balance. Always use smooth, nonmetallic forceps for handling mass reference standards. The standards are handled only with these forceps, which are not used for any other purpose. Mark these forceps to distinguish them from the forceps that are used to handle permeation devices. Handle the standards carefully to avoid damage that may alter their masses. The temperature sensor must have an uncertainty of no more than 0.05 degrees Celsius (°C). It must have a manufacturer's calibration certificate showing traceability to NIST standards. It must be recertified on a regular schedule (e.g., yearly) according to NIST guidelines44,45 by the user, a NIST-accredited State weights and measures laboratory or at a calibration laboratory that is accredited by NVLAP, A2LA or by ILAC under ISO/IEC 17025. Alternatively, temperature sensor calibrations may be traceable to temperature standards of other national metrology institutes. 3.1.3 Selecting a Procedure Procedure P2 is applicable to the assay and certification of candidate permeation device calibration standards using an ambient air quality analyzer. It provides for the assay to be referenced to a compressed gas reference standard.

EPA Traceability Protocol for Gaseous Calibration Standards
73
Procedure P3 is applicable to the assay and certification of candidate standards using an analytical balance. It provides for the assay to be referenced to a mass reference standard. 3.1.4 Using the Protocol The assay/certification protocol described here is designed to minimize both systematic and random errors in the assay process. Therefore, the protocol should be carried out exactly as it is described. The assay procedures in this protocol include one possible design for the assay apparatus. The analyst is not required to use this design and may use alternative components and configurations that produce equivalent-quality measurements. The protocol is like a basic recipe that cooks will follow while substituting different ingredients. The accuracy of the concentration of gas mixtures that are produced by permeation devices may decrease due to physical or chemical sorption of the permeated gas in the permeation system. This sorption will have a larger effect on the inaccuracy as the concentration decreases. Nonreactive materials (e.g., Teflon®, stainless steel, borosilicate glass or silanized glass) and clean, noncontaminating components should be used in those portions of the permeation system that are in contact with the gas mixtures being assayed. 3.1.5 Certification Documentation Each certified permeation device calibration standard must be documented in a written certification report containing the following information: 1. Permeation device identification number;
2. The contents of the permeation device;
3. Certified permeation rate [in nanograms (ng) per minute];
4. Overall uncertainty estimate associated with the candidate standard. This
estimate must include the uncertainty associated with the assay and the uncertainty associated with the reference standard.
5. The certification temperature (in °C to the nearest 0.1°C);
6. The dilution gas (air or nitrogen) used in the assay (for Procedure P2);
7. Date of the assay/certification;
8. Identification of the reference standards used in the assay: producer,
cylinder identification number, certified concentration, estimated

EPA Traceability Protocol for Gaseous Calibration Standards
74
uncertainty, and identification of the reference standard as being an SRM, an NTRM, an RGM, a PRM, a CRM or a GMIS; manufacturer, model number and serial number for a mass or temperature reference standard. The certification documentation must identify the type of reference standard (i.e., gaseous or mass) used in the assay;
9. Statement that the assay/certification was performed according to this
protocol and that lists the assay procedure (e.g., Procedure P2) used; 10. The analytical method that was used in the assay; 11. Identification of the laboratory where the standard was assayed; 12. Chronological record of all certifications for the standard by the laboratory; 13. Statement that the standard will retain its certification only as long as 5
percent of the original liquid weight or a visible amount of liquid remains in it; and
14. Any environmental exposure conditions (e.g., temperature and moisture)
that will invalidate the certification. This certification documentation must be given to the purchaser of the standard. The permeation device producer must maintain laboratory records and certification documentation for 3 years after the standard's certification date. A permeation device producer or other vendor may redocument an assayed and certified standard that it has purchased from another permeation device producer and that it wishes to sell to a third party. However, the new certification documentation must clearly list the permeation device producer or other laboratory where the standard was assayed. 3.1.6 Certification Label The standard must be labeled with its identification number. 3.1.7 Assay/Certification of Candidate Permeation Device Calibration Standards 3.1.7.1 Permeation Device Design— Permeation devices are designed and constructed in various ways, but all devices consist of a sealed chamber containing liquified gas and a permeable area through which the gas is allowed to permeate. The permeated gas is swept and diluted with a measured volumetric flow rate of dry air or nitrogen to create a quantitative concentration of the pollutant gas.

EPA Traceability Protocol for Gaseous Calibration Standards
75
3.1.7.2 Precautions for Use and Storage of Permeation Devices— The permeation rate of all permeation devices is critically dependent on temperature; a permeation device is useful as a concentration standard only when its temperature is precisely controlled and accurately measured and when an accurately metered dilution gas flow rate is provided. The reproducibility of the certified permeation rate of a permeation device may be adversely affected by exposure of the device to temperatures greater than the specified operating or storage temperature range for the device or by exposure to excessive moisture. NO2 permeation devices must be stored under dry conditions and preferably at a temperature between 20 and 35 °C, or as otherwise recommended by the manufacturer. SO2 permeation devices may be refrigerated for storage. A series of NIST SO2 permeation tubes SRMs were studied at NIST for their long-term stability at temperatures of 20, 25 and 30° C 46.47. Contrary to previous reports, their steady-state permeation rates were not constant, but showed a very slight downward trend with time. The amount of decay in the permeation rate is less than 2% of its initial rate over the life of the tube. In normal day-to-day use, permeation rate changes occurring over the entire steady-state life of the tube would not be discernible. The NIST S02 permeation tube SRMs had been certified to an uncertainty of ± 2% which is well beyond the variation in permeation rate usually observed during short-term use. There is a limited temperature range at which NO2 permeation devices can be used as standards. This temperature range is conservatively given as 20 to 35 °C.48, 49 Low or high temperature storage of NO2 permeation devices is not recommended. NO2 permeation devices must be stored in and used in dry dilution gas. One study showed that NO2 permeation rates were significantly lower in moderately humid air (i.e., 30 to 40 percent relative humidity) than in dry air on the preceding day.47 Furthermore, the permeation rates did not return to the original levels after dry air had passed over the device for 24 hours. Another study found that NO2 concentrations from a permeation device declined by about one-third as relative humidity levels increased from 0 to 100 percent.50 Candidate standards being certified under Procedure P3 must be stored under constant temperature conditions between assays. A storage container for this application is described in the procedure. When stored at a temperature other than the assay temperature, some permeation devices require an equilibration period at the assay temperature to reach thermal equilibrium and a stable, accurate permeation rate. When transferred from a different storage temperature, thin-walled permeation devices should be maintained at the assay temperature with a fixed dilution flow rate for

EPA Traceability Protocol for Gaseous Calibration Standards
76
at least 48 hours before use or before certification. Temperature changes of >10 °C may require equilibration periods of up to 15 days for NO2 permeation devices to attain a stable permeation rate.48,51 Upon return to the original temperature, some devices may not return to the same permeation rate as before the temperature change. Other types of permeation devices may require longer equilibration periods. Observe any manufacturer's recommendations for equilibration and use. 3.1.7.3 Equilibration of Newly Prepared Permeation Devices— A newly prepared permeation device must be equilibrated for at least 48 hours at the assay temperature before being assayed for the first time. NIST found that permeation tubes made of TFE and FEP Teflon® containing inorganic gases must be conditioned at a temperature of above 40°C for a minimum of 24 hours to assure stable and reproducible operation47. Once conditioned, the equilibration time from a storage temperature at -15°C to an operation temperature of 30°C for sulfur dioxide and other inorganic gas permeation tubes range from 24 hours to 48 hours. For smaller step changes in temperature, the permeation rate reaches 95 % of the new value in approximately 30 minutes. The equilibration period may be 100 hours or longer for some permeation devices.51 This period will vary as a function of the permeating compound, the material and the thickness of the permeating surface and the temperature. 3.1.7.4 Certification Conditions for Permeation Devices— A standard will retain its certification only as long as 5 percent of the original liquid weight or a visible amount of liquid remains in it. It loses its certification if it is exposed for prolonged periods of time to excessive moisture or to temperatures greater than 15 °C above its certification temperature. A decertified standard must be reassayed before it can be certified for further use. 3.1.8 Technical Variances Permeation device producers, standard users, and other analytical laboratories may petition the U.S. EPA for technical variances to the assay procedures in this protocol. A technical variance allows the use of a specific alternative assay procedure for candidate standards, which can be certified under this protocol. The petitioner must send a written request with a detailed description of the alternative assay procedure and supporting analytical data to EPA Traceability Protocol Project, Technical Services Branch, U.S. EPA, Mail Code E343-03, Research Triangle Park, NC 27711. The supporting analytical data must demonstrate the equivalence of the alternative assay procedure with the procedures given in this protocol. Schuirmann's TOST13-18 is the recommended statistical technique to demonstrate such equivalence if technically possible. Technical variances may also be given for alternative temperature ranges of certifying or storing permeation devices provided that supporting analytical data are provided with the written request.

EPA Traceability Protocol for Gaseous Calibration Standards
77
Permeation device producers, standard users, and other analytical laboratories may petition the U.S. EPA to allow the assay and certification of permeation devices that contain gases or liquified gases other than SO2 and NO2. The petitioner must send a written request with a detailed description of the permeation device and supporting analytical data to the EPA Traceability Protocol Project at the address given above. The supporting analytical data must demonstrate that the permeation rate for the proposed device can be accurately determined, that only the specified compound is permeating, that the rate is stable over the lifetime of the device, and that the rate is not changed by temperature and humidity effects.

EPA Traceability Protocol for Gaseous Calibration Standards
79
3.2 Procedure P2: Assay and Certification of Permeation Device Calibration Standards based on a Compressed Gas Reference Standard 3.2.1 Applicability This procedure may be used to assay the permeation rate of a candidate SO2 and NO2 permeation device calibration standard, based on the concentration of a compressed gas reference standard of the same pollutant compound, and to certify that the assayed permeation rate is traceable to the reference standard. The procedure employs a low-concentration range (i.e., ambient air quality level) pollutant gas analyzer to compare quantitatively diluted concentrations from the permeation device calibration standard with quantitatively diluted concentrations from the compressed gas reference standard. This procedure may be used for the assay of multiple candidate standards during the same assay session. Criteria that apply to the assay of one candidate standard apply to the assay of multiple candidate standards. This procedure may be used by permeation device producers, standard users or other analytical laboratories. 3.2.2 Limitations 1. The concentration of the diluted candidate standard may be greater than
or less than the concentration of the diluted reference standard. However, the diluted concentrations from both standards must lie within the well-characterized region of the analyzer's calibration curve (see Subsection 2.1.4.2). Additionally, U for the regression-predicted concentration of the diluted candidate standard must be ≤1.0 percent of the concentration of the diluted reference standard. This uncertainty estimate is obtained from the statistical analysis of the multipoint calibration data using the spreadsheet described in Appendix A or using an EPA-approved equivalent statistical technique (see Subsection 2.1.6). This criterion means that the uncertainty associated with the multipoint calibration determines the concentration range over which a diluted candidate standard may be assayed.
2. An accurate dilution and flow measurement system is required. 3. A source of clean, dry zero gas is required (see Subsection 2.1.3.5). It
may come from compressed gas cylinders or from zero gas generators. 4. This procedure is designed to assay the permeation rate of a candidate
standard that is mounted in a specially designed assay dilution system. The procedure does not accommodate the certification of a candidate standard that is mounted in its own self-contained dilution/flow measurement system.

EPA Traceability Protocol for Gaseous Calibration Standards
80
3.2.3 Assay Apparatus Figure 3-1 illustrates the components and configuration of one possible design for the assay apparatus, including a common dilution system for both the reference and candidate standards. The configuration is designed to allow convenient routing of zero gas and diluted concentrations of the reference standard and the candidate standard, in turn, to the analyzer for measurement, as selected by valves V1, V2, and V3. Three gas flow controllers (i.e., C1, C2, and C3) regulate the total dilution flow rate for the candidate standard, the purge gas flow rate, and the reference standard flow rate. These gas flow controllers may be needle valves, capillary tubes, thermal mass flow controllers, or other suitable devices. The flow rates should be controlled to within 1.0 percent variation during the assay. The dilution flow rates for the reference and candidate standards is measured by a single, common flowmeter (i.e., M1). The reference standard and purge gas flow rates may be measured at the vent port of valve V2 or by flowmeters M2 and M3 that are mounted in the two gas streams. When the candidate standard is being measured, valve V1 directs a portion of the total dilution flow through the candidate standard chamber. This sweep flow rate is regulated by gas flow controller C1 and is measured by gas flowmeter M2. This flowmeter need not be accurately calibrated because only the total dilution flow rate, measured by flowmeter M1, is used in the dilution calculations. When the reference standard is being measured, valve V1 directs the purge gas through the candidate standard chamber. The purge gas prevents the buildup of high pollutant concentrations in the chamber. It is vented through valve V2 and is not measured by flowmeter M1. If it is necessary to use different dilution flow rates for the reference standard and the candidate standard (see Subsection 3.2.6), separate flow controllers for the two dilution flow rates may be used. However, the same flowmeter should be used to measure both dilution flow rates to help reduce systematic flow measurement errors. The mixing chamber combines the gas streams and should provide turbulence to ensure thorough mixing of the two gas streams. The diluted gas mixtures are routed to the analyzer through a union tee tube fitting, which vents excess gas flow. Normally, the excess gas is vented to the atmosphere without any obstructions in the tubing and the gas entering the analyzer is at near-atmospheric pressure. However, the excess gas can be routed through an uncalibrated rotameter by rotation of a three-way valve (i.e., V4). The rotameter is used to demonstrate that the total gas flow rate exceeds the sample flow rate of the analyzer and that no room air is being drawn in through the vent line. Check the apparatus carefully for leaks and correct all leaks before use.

EPA Traceability Protocol for Gaseous Calibration Standards
81
Figure 3-1. One possible design of the apparatus for the assay of permeation device calibration standards referenced to a compressed gas reference standard The assay apparatus illustrated in Figure 3-1 may be modified by the addition of multiple chambers, which may be set to different temperatures. The mean temperature of the candidate standard chamber must be controlled to within 0.05 °C of the setpoint with a temperature stability of ±0.05 °C. It must be measured with a NIST-traceable temperature sensor having a measurement uncertainty of not more than 0.05 °C (see Subsection 3.1.2). 3.2.4 Pollutant Gas Analyzer See Subsection 2.2.4. The pollutant gas analyzer must have a well-characterized calibration curve and a range capable of measuring the diluted concentrations of both the candidate and reference standards. It must have good resolution, good precision, a stable response, and low output signal noise. It must have good specificity for the pollutant of interest so that it has no detectable response to any contaminant that may be contained in the standards. A suitable analyzer with acceptable performance specifications may be selected from the list of EPA-designated reference and equivalent method analyzers37. If

EPA Traceability Protocol for Gaseous Calibration Standards
82
the balance gas of the reference standard must be different from the zero gas used for dilution (e.g., air versus nitrogen or different proportions of oxygen), either a high dilution ratio (i.e., at least 50 parts zero gas to 1 part standard) should be used, or the analyzer must be proven to be not sensitive to differences in the balance gas composition. The latter may be demonstrated by showing no difference in an analyzer's response when measuring a calibration standard that has been diluted with identical flow rates of the different balance gases. The analyzer should be connected to a high-precision data acquisition system (DAS), which must produce numeric values and a graphic record of the analyzer response during the assay. More precise values will be obtained if the DAS has some data averaging capability. The numeric values and the graphic record must be maintained for 3 years after the standard’s certification date. If the analyzer has not been in continuous operation, turn it on and allow it to stabilize (e.g., for at least 12 hours) before beginning any measurements. 3.2.5 Analyzer Calibration 3.2.5.1 Multipoint Calibration— See Subsections 2.1.4.2 and 2.1.4.3 for information about the multipoint calibration. If an undiluted check standard is used, its concentration must fall in the well-characterized region of the calibration curve. If a diluted check standard is used, the diluted concentration must fall in the well-characterized region. Following completion of the multipoint calibration, the accuracy of the assay apparatus must be checked to verify that the error associated with the dilution is not excessive. This accuracy check involves the measurement of an undiluted or diluted check standard. The check standard must be a NIST SRM, a SRM-equivalent PRM, an NTRM, or a GMIS as specified in Subsection 2.1.3. It must have a certified concentration that is different from that of the reference standard used in the multipoint calibration. Information concerning this standard (e.g., cylinder identification number, certified concentration) must be recorded in the laboratory's records. Make three or more discrete measurements of the undiluted or diluted check standard. "Discrete" means that the analyst must change the gas mixture being sampled by the analyzer between measurements. For example, the analyst might alternate between measurements of the check standard and the zero gas. Record these measurements in the laboratory's records. Next the analyst must verify that the dilution error is not excessive. For the check standard measurements, calculate the relative difference (in percent) between the mean analyzer response and the corresponding response that is predicted from the multipoint calibration regression equation and the undiluted or diluted check standard concentration. That is,

EPA Traceability Protocol for Gaseous Calibration Standards
83
Relative Difference = 100 [ Mean Analyzer Response - Predicted Response] [Predicted Response]
If the relative difference is >1.0 percent, the dilution error is considered to be excessive. The analyst must investigate why it is excessive (e.g., errors in the reference standard and check standard concentrations, errors in assay apparatus or to some other source). Assays may not be conducted until the relative difference for a subsequent accuracy check is ≤ 1.0 percent. 3.2.5.2 Analyzer Range— See Subsection 2.2.6.2 for information about analyzer range. 3.2.5.3 Linearity— See Subsection 2.2.6.3 for information about linearity. 3.2.5.4 Zero and Span Gas Checks— See Subsection 2.2.6.4 for information about zero and span gas checks. 3.2.6 Selection of Gas Dilution Flow Rates The dilution flow rates used for the reference standard and the candidate standard should be selected carefully to provide diluted concentrations for both standards that fall in the well-characterized region of the analyzer's calibration curve. Additionally, the magnitude of U for the estimated concentration of the diluted candidate standard must be ≤ ±1.0 percent of the concentration of the diluted reference standard. It is desirable to measure both dilution flow rates with the same flowmeter (i.e., M1). This practice reduces measurement errors associated with the use of multiple flowmeters. 3.2.7 Flowmeter Type and Flowmeter Calibration Flowmeters M1 and M3, shown in Figure 3-1, measure in-line flow rates and do not operate at atmospheric pressure because of backpressure from downstream components. Also, this backpressure is variable, depending on the total dilution and reference standard flow rates. Thus, the flowmeters must compensate for the variable in-line pressure. Thermal mass flowmeters do not need to be corrected for pressure effects. Measurements from pressure-sensitive flowmeters such as rotameters or wet test meters must be carefully corrected for the actual in-line pressure during the flow rate measurements. Alternatively, the flow rates can be measured at the outlet of the dilution apparatus, with the excess gas flow vent temporarily plugged. In this case, a volumetric meter such as a piston-type positive-displacement flowmeter, a wet test meter or a soap-film flowmeter can be used, and flow measurements may be conveniently referenced to atmospheric pressure. Each flow rate must be measured independently while the other flow rate is set to zero. Great care must
EPA Traceability Protocol for Gaseous Calibration Standards
84
be exercised to ensure that each measured flow rate remains constant when combined with the other flow rate and between the time of measurement and the time of the assay. The flowmeters used should be stable, repeatable, linear, and have good resolution. The flowmeters must not contaminate or react with the gas mixture passing through them. If possible, select flow rates or flowmeter ranges such that the measured flow rates fall in the upper half of the flowmeters' ranges. The flowmeters should be carefully calibrated at several flow rates to prove linearity. The calibration of the zero gas flowmeter should be accurate to ≤ 1.0 percent, referenced to an accurate flow or volume standard traceable to a NIST primary standard (see Subsection 3.1.2). This flowmeter calibration should be checked and recertified on a regular schedule (e.g., yearly). The recertification frequency is to be determined from stability information such as a chronological control chart of calibration data. All volumetric flow-rate measurements must be corrected or referenced to the same temperature and pressure conditions, such as EPA-standard conditions (i.e., 760 millimeters of mercury (mm Hg) and 25 °C) or the ambient temperature and pressure conditions prevailing in the laboratory during the assay. Measurements using wet test meters and soap-film flowmeters also must be corrected for the saturation of the gas stream with water vapor in the moist interiors of these flowmeters. The equation to correct the flow rate for temperature, pressure, and humidity effects is given below:
Flow Rate = (Volume/Time)(PM – PWV/PS)(TS/TM) where PM = measured barometric pressure (mm Hg); PWV = partial pressure of water vapor (mm Hg); PS = standard pressure (mm Hg); TS = standard temperature (298.2 K); and TM = measured ambient temperature (273.2 + EC). 3.2.8 Candidate Standard See Subsections 3.1.7.1 and 3.2.2. Follow the manufacturer's instructions for equilibration and for use of the candidate standard and for selecting the temperature at which it is to be assayed and certified. The candidate standard should be assayed at the same temperature at which it will be subsequently used. The mean operating temperature of the candidate standard chamber must be controlled to within 0.05 °C of the setpoint with a temperature stability of ±0.05 °C. This temperature must be measured with a NIST-traceable temperature sensor with a measurement uncertainty ±0.05 °C or less (see Subsection 3.1.2).

EPA Traceability Protocol for Gaseous Calibration Standards
85
3.2.9 Reference Standard See Subsections 2.1.3 and 3.1.2 for information about the reference standard. 3.2.10 Zero Gas See Subsection 2.1.3.6 for information about the zero gas. If possible, the zero gas should be the same as the balance gas of the reference standard. 3.2.11 Assay Procedure 1. Verify that the assay apparatus is properly configured as shown in Figure
3-1 and described in Subsection 3.2.3. Inspect the analyzer to verify that it is operating normally and that all controls are set to their appropriate values. Record these control values in the laboratory's records.
2. Determine and establish the operating temperature for the candidate
standard in its temperature-controlled chamber. Install the candidate standard, start the purge gas flow, and allow ample time for the device to equilibrate (see Subsection 3.1.7.3). Record the temperature in the laboratory's records.
3. Verify that the flowmeters are properly calibrated (see Subsection 3.2.7). 4. Verify that a multipoint calibration of the analyzer has been performed
within the past month demonstrating acceptable instrument performance (see Subsection 2.1.4.2). Additionally, verify that the zero and span gas checks indicate that the analyzer is in calibration (see Subsection 2.1.4.4).
5. Determine and establish the reference standard flow rate and the dilution
flow rates and diluted concentrations for the reference standard and the candidate standard that will be used for the assay (see Subsection 3.2.7). Ensure that the diluted reference standard and diluted candidate standards concentrations are within the well-characterized region of the analyzer's calibration curve (see Subsection 2.1.4.2). Also check that both dilution flow rates will provide enough flow for the analyzer, with sufficient excess to ensure that no ambient air will be drawn into the vent line. Also adjust the flow rate of the portion of the dilution flow that passes over the candidate standard (i.e., flow controller C3), and adjust the purge flow rate (i.e., flow controller C2) to approximately the same value.
Calculate the diluted concentration using the following equation: Diluted Conc. = (Undiluted Standard Conc.)(Standard Flow Rate)
(Standard Flow Rate + Zero Gas Flow Rate)

EPA Traceability Protocol for Gaseous Calibration Standards
86
Calculate the diluted candidate standard concentration (in ppm) using the following equation:
Diluted Standard Conc. = (10-3)(MV/MW)(Perm Rate/Dilution Flow Rate) where MV = molar volume of the dilution gas (liters/mole); = (0.08206) TM MW = molecular weight of the dilution gas (grams/mole); the permeation rate is given in nanograms/minute; and the dilution flow rate is given in liters/minute. Use an estimated permeation rate for the candidate standard in this
calculation. Record the measured flow rates and the undiluted and diluted reference
standard concentrations in the laboratory's records. 6. In succession, measure the zero gas, the diluted reference standard and
the diluted candidate standard using the analyzer. Use valves V1, V2, and V3 to select each of the three gas mixtures for measurement. For each measurement, adjust the flow rates, if necessary, to those determined in Step 5, and allow ample time for the analyzer to achieve a stable reading. If the reading for each measurement is not stable, the precision of the measurements will decline and the candidate standard might not be certifiable under this protocol. Record the analyzer response for each measurement, using the same response units (e.g., volts, area counts, etc.) as was used for the multipoint calibration. At this point, do not convert the data into concentration values using the calibration equation. Do not perform any mathematical transformations of the data. These steps will be done later. Do not make any zero control, span control, or other adjustments to the analyzer during this set of measurements. Record the responses in the laboratory's records.
The analyst may assay multiple candidate standards during the same
assay session. For example, a single set of measurements may involve a zero gas, a diluted reference standard, and three diluted candidate standards. Criteria that apply to the assay of one candidate standard apply to the assay of multiple candidate standards. The analyst should be aware that the effect of any short-term calibration drift will be greater when multiple candidate standards are assayed. This greater effect is due to the longer period of time between reference standard measurements. Unacceptable uncertainties of the estimated concentrations for the diluted candidate standards may occur as a result of the longer assay session.

EPA Traceability Protocol for Gaseous Calibration Standards
87
7. Conduct at least two additional sets of measurements, as described in step 6 above. However, for these subsequent sets of measurements, change the order of the three measurements (e.g., measure the reference standard, zero gas, and candidate standard for the second set and measure the zero gas, candidate standard, and reference standard for the third set, etc.). Changing the order that the gas mixtures are measured helps the analyst to discover any effect that one measurement has on subsequent measurements. The number of sets of measurements will have been determined during the analysis of the multipoint calibration data such that U of the regression-predicted concentration of the candidate standard ≤1 percent of the concentration of the reference standard.
8. If any one or more of the measurements of a set of measurements is
invalid or abnormal for any reason, discard all three measurements and repeat the measurements. Such measurements may be discarded if the analyst can demonstrate that the experimental conditions were inappropriate during these measurements. Data cannot be discarded just because they appear to be outliers but may be discarded if they satisfy statistical criteria for outliers.39 In the case of outliers, all of the measurements do not have to be discarded. Only the outliers should be discarded. As part of the laboratory records, the analyst must record any discarded data and briefly explain in the laboratory's records why these data were discarded.
9. The spreadsheet described in Appendix A or an EPA-approved equivalent
statistical technique (see Subsection 2.1.6) must be used to calculate the estimated concentration and U for the diluted candidate standard based on data from the assay measurements and from the multipoint calibration. The use of both sets of data in the statistical analysis produces an estimated concentration with smaller uncertainty while correcting for any minor calibration drift that may have occurred since the multipoint calibration. Record the estimated concentration and U in the laboratory’s records.
The spreadsheet also calculated the percentage of the uncertainty that is
due to the multipoint calibration. This percentage is needed for the total uncertainty calculations when two or more assays fall under the same multipoint calibration. Record this value in the laboratory’s records.
10. If the multipoint calibration data and the assay data underwent any
mathematical transformations before their statistical analysis, the analyst must perform to reverse transformations for the estimated concentration and U. Record the transformed values in the laboratory’s records.
11. Finally, calculate the certified permeation rate (in nanograms/minute) and
uncertainty for the candidate standard using the equations below:

EPA Traceability Protocol for Gaseous Calibration Standards
88
Perm Rate = (103)(MW/MV)(Estimated Conc.)(Dilution Flow Rate) Uncertainty = (103)(MW/MV)(U)(Dilution Flow Rate) 3.2.12 Equilibration Test for Newly Prepared Permeation Devices A permeation device that has not been previously assayed must be tested for a stable permeation rate as follows: Reassay the permeation rate at least 24 hours after the first assay and compare the two assayed concentrations. The Appendix C spreadsheet or an EPA-approved equivalent statistical technique (see Subsection 2.1.6) must be used to evaluate the stability of the permeation rate by comparison of the two assays. If the mean estimated concentrations from the assays differ by less than 1.0 percent from the overall mean estimated concentration using Schuirmann's two one-sided test (TOST)13-18, the permeation rate can be considered to be stable and the candidate standard may be certified for use. Otherwise, equilibrate the device longer at the operating temperature and repeat the test, using the second and third assays as if they were the first and second. This process may be repeated until the rate stabilizes. Permeation devices that are not stable may not be used for calibration or audit purposes. Candidate standards that fail the initial and the repeat stability tests are unstable and are disqualified for further use under this protocol. 3.2.13 Certification Documentation See Subsections 3.1.5 and 3.1.6.

EPA Traceability Protocol for Gaseous Calibration Standards
89
3.3 Procedure P3: Assay and Certification of Permeation Device Calibration Standards based on a Mass Reference Standard 3.3.1 Applicability This procedure may be used to assay the permeation rate of a candidate SO2 or NO2 permeation device calibration standard based on mass reference standards, and to certify that the assayed permeation rate is traceable to the reference standard. The procedure employs an analytical balance to measure the weight loss in the candidate standard. It may be used for the assay of multiple candidate standards during the same assay session. Criteria that apply to the assay of one candidate standard apply to the assay of multiple candidate standards. This procedure may be used by permeation device producers, standard users, or other analytical laboratories. 3.3.2 Limitations This procedure is intended only for the assay of candidate standards containing SO2 or NO2. These liquid compounds must be anhydrous grade (i.e., minimum purity 99.99 percent) or phosphorous pentoxide-dried commercial-purity grade (i.e., minimum purity 99.5 percent). An accurate analytical balance with a NIST-traceable calibration is required to weigh the candidate standard. A temperature-controlled chamber for maintaining the candidate standard at a constant, NIST-traceable temperature between weighings is required. A source of clean, dry zero gas is required (see Subsection 2.1.3.5). 3.3.3 Assay Apparatus 3.3.3.1 Analytical Balance— Choose a balance with adequate vibration-stabilization control and appropriate specifications for total weighing capacity, accuracy, precision, and readability. The balance should be chosen such that the manufacturer's specified uncertainty (i.e., three times the standard deviation or "reproducibility") of the balance divided by the weight of the candidate standard does not exceed 0.001. The balance must be calibrated annually using NIST-traceable mass reference standards by the manufacturer or a manufacturer's representative (see Subsection 3.1.2). If possible, locate the balance in a climate-controlled, draft-free room, preferably dedicated to the use of balances. If this is not possible, the general guidelines listed below are to be followed to control environmental factors that may affect balance performance:

EPA Traceability Protocol for Gaseous Calibration Standards
90
- Locate the balance away from potential sources of drafts such as doors,
windows, aisles with frequent traffic, ventilation ducts, and equipment with fans or moving parts.
- Locate the balance out of direct sunlight and away from local heating or
cooling sources such as open flames, hot plates, water baths, ventilation ducts, windows, and heat-producing lamps.
- Locate the balance on a sturdy base (ideally, a stone weighing table) and
away from any equipment that produces vibrations. If this is not possible, isolate the balance from such equipment by placing a stabilizing slab under the balance or composite damping-pads under the balance legs.
- Ensure that the balance-support is sufficiently level to permit leveling of
the balance according to the manufacturer's instructions. 3.3.3.2 Temperature-Controlled Chamber— A temperature-controlled chamber is required for storing the candidate standard between weighings. One possible design for the chamber is depicted in Figure 3-248. Clean, dry zero gas enters the chamber at the bottom after passing through the heat exchanger tubing (i.e., several turns of copper tubing). The zero gas' flow rate must be sufficient to purge the chamber thoroughly. The chamber and the heat exchanger are immersed in a thermostatted bath to the level shown in the figure. The bath must control the mean temperature of the chamber to within 0.05 °C of the setpoint with a temperature stability of ±0.05 °C. The temperature of the bath or the chamber must be measured and recorded in the laboratory's records on at least a daily basis. A NIST-traceable temperature sensor must be used for this measurement (see Subsection 3.1.2). It must be calibrated annually using NIST-traceable temperature reference standards and must have an uncertainty similar to that of these reference standards. The output of a temperature-sensing device may be recorded by a DAS. 3.3.3.3 Electrostatic Charge Neutralization— Electrostatic charge buildup will prevent an analytical balance from operating properly. Static charge is the accumulation of electrical charges on the surface of a nonconductive material, which could be the permeation device or part of the analytical balance. Common symptoms of this problem include noisy readout, drift, and sudden readout shifts.

EPA Traceability Protocol for Gaseous Calibration Standards
91
Figure 3-2. Chamber for storing permeation tubes48.

EPA Traceability Protocol for Gaseous Calibration Standards
92
To reduce static charge within the balance, it may be necessary to place a radioactive antistatic strip containing a very small amount (i.e., 500 picocuries) of Polonium-210 (Po210) in the weighing chamber. It may also be necessary to put each permeation device on a strip before it is weighed. Po210 antistatic strips are used to reduce electrostatic charge buildup in the analytical balance's weighing chamber and on individual permeation devices by charge neutralization. They will neutralize electrostatic charges on items placed within an inch of them. These strips are safe, commonly available, and very inexpensive. Po210 has a half-life of 138 days. Change the strips semiannually and dispose of the old strips according to the manufacturer's recommendations. Antistatic solutions are available for coating (and recoating at appropriate and relatively infrequent intervals) the interior and exterior nonmetallic surfaces of the chamber. This coating facilitates the draining of electrostatic charges from these surfaces to a common electrical ground to which the metallic conductive surfaces are connected. Earth-grounded conductive mats placed on the weighing table surface and under the analyst's shoes are used to reduce electrostatic charge buildup. Do not assume that the electrical grounding of the analytical balance eliminates all buildup because the ground may not be perfect. Even though a permeation device's weight might stabilize within 60 seconds and no weight drift is observed during that period, the balance may still be influenced by electrostatic charge buildup. It may still be necessary to repeat the neutralization procedure and to use antistatic strips inside the weighing chamber. One may reduce the effect of buildup on permeation devices by putting them in an aluminum foil boat on the balance pan during weighings. Charge neutralization times may need to be longer than 60 seconds. Electrostatic charge buildup becomes greater as the air becomes drier. A 60-second neutralization may work sufficiently in ambient indoor air conditioned to 37 percent relative humidity and 23 °C, but not in zero nitrogen. This latter environment may require that the permeation device sit for more time on the antistatic strip. The neutralization may have to be done inside the weighing chamber or a second small chamber, which is used just for charge neutralization. 3.3.4 Weighing Interval The minimum time period between weighings of the candidate standard is a function of the expected permeation rate, the specified uncertainty for the rate, and the analytical balance's readability (i.e., the smallest scale division). The following equation is based on a ±1 percent uncertainty specification for the permeation rate:
100(readability)Minimum weighing interval = (expected permeation rate)

EPA Traceability Protocol for Gaseous Calibration Standards
93
where the weighing interval is in minutes; the readability is in grams; and the expected permeation rate is in grams per minute. 3.3.5 Assay Procedure 1. Turn on the balance and allow it to warm up for the period specified in the
operator's manual. To ensure maximum stability, it is recommended to keep the balance turned on at all times. This procedure enables the balance to be operational at all times and eliminates the need for a warmup period before analyses. Newer balances are always turned on (except for their displays) when they are plugged in.
2. Check the balance level and, if necessary, adjust the level according to
the manufacturer's instructions. 3. Ensure that the balance room temperature is between 15 and 30 °C or, if
given, within the balance manufacturer's specifications and that the balance and mass reference standards are equilibrated to the balance room temperature. Record the temperature in the laboratory's records.
4. Zero (i.e., tare) and calibrate the balance according to the manufacturer’s
directions. Record the tare reading in the laboratory’s records. Many newer balances calibrate themselves automatically or only require a key to be touched to calibrate themselves.
5. On each day that the candidate standard is to be assayed, verify the
balance's calibration using an NIST-traceable mass reference standard. Use smooth, nonmetallic forceps to handle the standards. This standard must have a mass that is similar to that of the candidate standard. Record the date, balance identification, standard's identification, certified weight of the standard, and the measured weight of the standard in the laboratory's records. Calculate the relative difference (in percent) between the standard's certified and measured weights as follows:
100 (measured weight - certified weight)Relative difference =
(certified weight)
Record the relative difference in the laboratory's records. If the relative
difference is >0.1 percent, the balance cannot be used under this protocol until it has been recalibrated or repaired and until a subsequent verification has a relative difference of ≤0.1 percent.
6. Review the recorded bath or chamber temperature readings since the
most recent weighing of the candidate standard, or since the standard was first put into the temperature-controlled chamber. Record the minimum and maximum temperatures in the laboratory's records. The minimum

EPA Traceability Protocol for Gaseous Calibration Standards
94
and maximum temperatures must not have deviated from the setpoint by more than 0.1 °C. If these temperatures deviate by more than this amount, the current assay and all previous assays are invalidated.
7. Record the current chamber temperature in the laboratory's records. 8. Verify that the candidate standard has been in the temperature-controlled
chamber for a long enough time for its permeation rate to have stabilized. 9. Remove the candidate standard from the temperature-controlled chamber
and place it on the balance's pan using stainless steel forceps or a similar noncontaminating device. Note that Teflon® permeation tubes may have an electrostatic charge buildup due to the passage of the dry gas over them between weighings. Such charges should be removed from the candidate standard before weighing by Po210 antistatic strips or similar devices. Note that electronic force balances may require that candidate standards be thermally equilibrated before they can be weighed.
10. Record the date, time and the candidate standard's identification number
and current weight in the laboratory's records. 11. Return the candidate standard to the temperature-controlled chamber.
The standard should be outside the chamber only for a long enough time to weigh it using reasonable laboratory technique.
3.3.6 Number of Weighings of the Candidate Standard The candidate standard must be weighed at least six times after its permeation rate has stabilized at the certification temperature. After the six or more weighings, the analyst may assess the stability and uncertainty of the permeation rate by using the spreadsheet described in Appendix B or an EPA-approved equivalent statistical technique (see Subsection 2.1.6). The analyst may calculate a provisional permeation rate from the measured weights and the time between weighings using the following equation:
(previous weight - current weight)Provisional permeation rate = elapsed time between weighings
Based on this data analysis, the analyst may perform additional weighings to reduce the uncertainty or to replace data that are discarded because they were obtained before the permeation rate stabilized. 3.3.7 Calculation of Certified Permeation Rate The certified permeation rate for the candidate standard is the slope of the least squares regression line for data from at least six weighings of the candidate

EPA Traceability Protocol for Gaseous Calibration Standards
95
standard after the permeation rate has stabilized. This statistical analysis technique produces permeation rate estimates that are more precise than those calculated from weight differences between individual weighings. Although the minimum number of weighings is six, more precise estimates will be obtained for more weighings. Calculate the certified permeation rate and its uncertainty using the spreadsheet given in Appendix B or using an EPA-approved equivalent statistical technique (see Subsection 2.1.6). Figure 3-3 presents an example of the spreadsheet's graphic output.
4.15
4.2
4.25
4.3
4.35
4.4
0 10000 20000 30000 40000 50000 60000 70000 80000 90000
Wei
ght
Elapsed Time
Case 2 Calibration Curve, with 99.999% Confidence Bands (t = 17.9) for Estimation (red) and Prediction (blue)
Figure 3-3. Example of Appendix B spreadsheet graphic output
The permeation rate is the slope (b1) of the least squares regression line where the x-values are the elapsed times from the initial weighing and the y-values are the measured weights of the candidate standard. The spreadsheet also calculates the predicted initial weight (b0) of the permeation device and 95-percent confidence limits (CLs) for b0 and b1. After the data from the six or more weighings have been entered in the spreadsheet, examine the 95-percent CLs for b0. If the measured weight from the initial weighing falls outside of these limits, the candidate standard may not have been completely equilibrated at the initial weighing. The analyst may elect to discard the data from the initial weighing to reduce the uncertainty of the certified permeation rate.

EPA Traceability Protocol for Gaseous Calibration Standards
96
Examine the upper and lower 95-percent CLs for b1. They should differ from b1 by no more than 1 percent of its value. That is,
Upper CL(b1) - b1 ≤ (b1)/1000
b1 - lower CL(b1) ≤ (b1)/1000 If these two criteria are met, the candidate standard can be certified with a permeation rate equal to b1 and an uncertainty equal to the larger of the two values. If the criteria are not met, the analyst must make additional weighings of the candidate standard as described in Subsection 3.3.5. These additional measurements will be pooled with the previously collected measurements. The pooled data will be used to obtain new estimates of the b1 and its uncertainty. When an acceptable value for the uncertainty is obtained, record it and the slope in the laboratory's records. If an acceptable value is not obtained, the candidate standard cannot be certified under this protocol. The analyst should investigate any of the measurements that appear to be outliers. Such data may be discarded if the analyst can demonstrate that the experimental conditions were inappropriate during these measurements. Data cannot be discarded just because they appear to be outliers but may be discarded if they satisfy statistical criteria for testing outliers39. The analyst must record any discarded data and a brief summary of the investigation in the laboratory's records. 3.3.8 Uncertainty of Certified Permeation Rate for Candidate Standard The total analytical uncertainty of the certified permeation rate includes the uncertainty of regression slope and the uncertainty of the mass reference standard that was used to verify the balance’s calibration. The two components are combined using the following equation for the propagation of errors:
1/22 2Uncertainty (Total) Uncertainty (Slope) Uncertainty (Mass)Permeation Rate Slope Mass
= +
3.3.9 Certification Documentation See Subsections 3.1.5 and 3.1.6.

EPA Traceability Protocol for Gaseous Calibration Standards
97
Section 4 - EPA Traceability Protocol for Assay and Certification of Dynamic Gas Dilution Systems 4.1 Procedure D1: Assay and Certification of a Dynamic Gas Dilution System 4.1.1 Applicability This protocol describes a procedure for assaying gas dilution systems and for certifying that the concentrations in the pollutant gas mixtures that they generate are traceable to NIST-certified gaseous, flow rate, volume, mass or time reference standards. In general, a pollutant gas mixture containing a known concentration is prepared by diluting an NIST-traceable gaseous reference standard with a zero gas. The flow rates of the reference standard and the zero gas must be traceable to NIST-traceable flow rate, volume, mass or time reference standards. Dynamic gas dilution systems employ various dilution methods to prepare pollutant gas mixtures. Examples of these methods include capillary tubes, critical orifices, volumetric piston pumps, and thermal mass-flow controllers. This protocol may be used by the manufacturers of gas dilution systems, other laboratories, and end users. This protocol and its associated spreadsheet (see Appendix F) allow an analyst to estimate the uncertainty of concentrations of pollutant gas mixtures that are generated by gas dilution systems being certified. This estimate includes the uncertainty of the gas dilution and the uncertainty of the NIST-traceable gaseous reference standard being diluted. The uncertainty of the gas dilution is determined from annual multipoint flow rate calibrations and the uncertainty of the NIST-traceable flow rate, volume, mass or time reference standards. The uncertainty of the gaseous reference standard is determined from its certificate of analysis. The accuracy of the annual multipoint flow rate calibration is verified by an annual calibration check using nonreactive gaseous reference standards and a pollutant gas analyzer. An annual reactive gas calibration check is required for gas dilution systems that involve reactive gases, such as ammonia (NH3), hydrogen chloride (HCl), hydrogen sulfide (H2S), oxides of nitrogen (NOX), and sulfur dioxide (SO2). The gas mixtures generated by gas dilution systems certified under this protocol may be used for calibrations and audits of ambient air quality analyzers, including both field and laboratory based instrumentation, and continuous emission monitors for pollutant monitoring that is required by the regulations in 40 CFR Parts 50, 58, 60, and 753-6. Note that EPA Method 20552 may also be used for the verification of gas dilution systems for field instrument calibrations of EPA Methods 3A, 6C, 7E, 10,

EPA Traceability Protocol for Gaseous Calibration Standards
98
15, 16, 20, 25A and 25B that are required by the regulations in 40 CFR Part 60 as well as performance specifications according to 40 CFR Part 60, Appendix F. At this time, EPA does not require the regulated community to use NIST-traceable dynamic gas dilution systems for the calibration of ambient air or continuous emission monitors that are required by 40 CFR Parts 50, 58, 60, and 75. However, end users may elect to use them for calibrations. 4.1.2 Limitations This protocol is not intended for the blanket certification of multiple gas dilution systems that may be identical in operating principle, construction, and materials. It is intended for the certification of individual gas dilution systems. This protocol is not intended for the certification of static gas dilution systems. 4.1.3 Assay Apparatus Figure 4-1 illustrates one possible design of a gas dilution system for the generation of pollutant gas mixtures using dynamic dilution methods. This apparatus is designed to allow the quantitative mixing of a pollutant gas with a zero gas using gas flow control devices. It also is designed to allow the measurement of the pollutant gas flow rate and the zero gas flow rate. Inert materials (e.g., Teflon®, stainless steel, borosilicate glass or silanized glass) and clean, noncontaminating components are to be used in those portions of the apparatus that are in contact with the pollutant gas and the gas mixture being generated. The pathways of the gas streams through the gas dilution system are controlled by rotation of two three-way valves. Pressure regulators, shutoff valves, and gas flow control devices regulate the flow from the cylinders. The gas flow control devices may be needle values, capillary tubes, volumetric piston pumps, thermal mass flow controllers, or other flow control devices. The pollutant gas and zero gas flow rates are measured at ports that are connected to the three-way valves. The pollutant gas stream and the zero gas stream must be mixed in a chamber whose design ensures that the resulting gas mixture is thoroughly homogenized. The gas mixture output is connected to the sample line of the pollutant gas analyzer. Figure 4-1 shows separate flow measurement ports for the pollutant gas stream and the zero gas stream. In this configuration, a single flow rate reference standard can be used to measure either the pollutant gas flow rate or the zero gas flow rate. Such an approach reduces measurement errors arising from differences in the calibration of multiple reference standards. Alternatively, the flow rates can be measured at the outlet port of the gas dilution system with one of the gas streams shut off. The gas dilution system's design must ensure that the flow rate in one gas stream remains constant when combined with the other gas stream.

EPA Traceability Protocol for Gaseous Calibration Standards
99
3-WayValve
PollutantGas
Cylinder
ZeroGas
Cylinder
ShutoffValve
ShutoffValve
Gas Flow
Control
Gas Flow
Control3-WayValve
Pollutant FlowMeasurement
Port
Dilution FlowMeasurement
Port
MixingChamber
Gas Dilution System
Figure 4-1. One possible design of a gas dilution system for the generation of pollutant gas mixtures using dynamic dilution methods
Diluted Gas Output Port
Pollutant Flowrate Reference Standard
Dilution Flowrate Reference Standard
Pollutant Gas Analyzer to be
Calibrated

EPA Traceability Protocol for Gaseous Calibration Standards
100
If a flow rate reference standard is mounted directly downstream of a flow control device, it causes back pressure in the gas dilution system and a resulting change in the flow rate through the flow control device or a resulting increase in the gas pressure entering the standard. This back pressure may vary as a function of the flow rate. Thus, the reference standard may need to compensate for the variable inlet pressure. Thermal mass flow controllers do not need to be corrected for such pressure effects, but measurements by inlet-pressure-sensitive, volumetric-flow-rate reference standards must be corrected. The apparatus may be modified in several ways that will not diminish its performance. For example, the calibration could be performed using a flow rate reference standard that is mounted in-line upstream of the flow control device. 4.1.4 Pollutant Gas Analyzer The pollutant gas analyzer being calibrated must have a well-characterized calibration curve and must be capable of directly measuring the concentration of the pollutant gas mixture that is generated by the gas dilution system. It must have good resolution, good precision, a stable response, and low output signal noise. An analyzer with acceptable performance specifications may be selected from the list of EPA-designated reference and equivalent method analyzers.40 In addition, the analyzer should have good specificity for the pollutant of interest so that it has no detectable response to any other component or contaminant that may be contained in the pollutant gas mixture. If any component in a multiple-component pollutant gas mixture interferes with the assay of any other component, the analyst must conduct an interference study to determine an interference correction equation. If multiple balance gases are used in the gas dilution system (e.g., air versus nitrogen or different percentages of oxygen in air), it must have been demonstrated that the analyzer's response is not sensitive to differences in balance gas composition. This demonstration can be accomplished by showing that no difference exists in the analyzer's response when measuring a compressed gas calibration standard that has been diluted with identical flow rates of different balance gases. The analyzer must be connected to a high-precision data acquisition system, which must produce an electronic record of the analyzer's response during the assay. A high-precision digital panel meter, a digital voltmeter, a data logger or some other data acquisition system with four-digit resolution can be used to obtain numerical values of the analyzer's response. More precise values will be obtained if this system has a data-averaging capability. If the analyzer has not been in continuous operation, turn it on and allow it to stabilize (e.g., for at least 12 hours) before beginning the measurements.

EPA Traceability Protocol for Gaseous Calibration Standards
101
4.1.5 Reference Standards The EPA monitoring regulations define a "traceable" gaseous calibration standard as one that has been compared and certified, either directly or via not more than one intermediate standard, to a primary standard such as an SRM or a CRM.3,4 The monitoring regulations require that calibration gases used for calibration and audit of ambient air quality analyzers and continuous emission monitors be traceable to NIST reference standards. Gaseous reference standards used for assaying and certifying a gas dilution system must be SRMs, NTRMs, RGMs, PRMs, CRMs or GMISs. See Subsection 2.1.3 for a description of these standards. This procedure will use a reference standard that is diluted and a check standard that is not diluted in the annual gas calibration checks. Zero gas used in gas dilution systems should be clean, dry, zero-grade air or nitrogen containing no detectable concentration of the pollutant of interest. It may come from compressed gas cylinders or from zero gas generators. The use of NIST-traceable zero air material is recommended, but is not required. The zero gas should match the balance gas in the gaseous reference standard, unless it has been demonstrated that the pollutant gas analyzer being calibrated is insensitive to differences in the balance gas composition. It also should contain no contaminant that causes a detectable response in the analyzer or that suppresses or enhances the analyzer's response to the pollutant. The oxygen content of zero air should be approximately that of ambient air, unless it has been demonstrated that varying the oxygen content does not suppress or enhance the analyzer's response. The water vapor concentration in the zero gas should be less than 5 ppm. Information concerning the zero gas (e.g., cylinder identification number, impurity levels, cylinder pressure, etc.) must be recorded in the laboratory's records. The flow rate reference standards for calibrating gas dilution systems must be traceable to NIST primary flow rate, volume, mass or time reference standards 54 by original calibration by their manufacturer and by annual recertification at a NIST-accredited state weights and measures laboratory or at a calibration laboratory that is accredited by the National Voluntary Laboratory Accreditation Program (NVLAP), the American Association for Laboratory accreditation (A2LA) or by the International Laboratory Accreditation Conference (ILAC) under ISO/IEC 17025 (General Requirements for the Competence of Testing and Calibration Laboratories).10-12 Their certifications must cover the range of flow rates that will be used by the gas dilution systems. The expanded uncertainties (U) of the standards must be documented in a calibration certificate or they must be available through the manufacturer or calibration facility. Their expanded uncertainties must not be greater than plus or minus 1 percent of reading for the flow rates that will be used for gas dilution. Expanded uncertainties that are much less than plus or minus 1 percent of reading are desirable so that the uncertainties of the gas mixture concentrations are decreased. They must be stable, precise, linear, and have good resolution.

EPA Traceability Protocol for Gaseous Calibration Standards
102
Alternatively, flow rate reference standards or gas dilution systems may be traceable to the flow rate, volume, mass or time reference standards of other national metrology institutes (e.g., KRISS in South Korea, NEL in the United Kingdom, PTB in Germany) provided that these institutes are participants in the Working Group for Fluid Flow (WGFF) of the International Committee for Weights and Measures (CIPM). 4.1.6 Calibrations of the Dynamic Gas Dilution System On an annual basis, three aspects of a gas dilution system's performance must be evaluated. First, the flow-rate performance must be determined by a multipoint calibration with NIST-traceable flow rate reference standards. Second, the multipoint calibration must be verified using a pollutant gas analyzer by direct comparison of an undiluted, nonreactive gaseous check standard with a diluted, nonreactive pollutant gas mixture generated by the gas dilution system. For applications in which the dynamic gas dilution system will be used with reactive gas mixtures, the inertness of the wetted interior surfaces of the dynamic gas dilution system is checked using a pollutant gas analyzer by direct comparison of an undiluted, reactive gaseous check standard with a diluted reactive pollutant gas mixture generated by the gas dilution system. On a monthly basis, the calibration of the gas dilution system is checked for drift by a single-point flow rate check using the same flow rate reference standards that were used during the annual multipoint flow rate calibration. 4.1.6.1 Annual Multipoint Flow Rate Calibration— The dynamic gas dilution system must have had a multipoint flow rate calibration demonstrating acceptable performance within 1 year prior to it being used to generate pollutant gas mixtures. This calibration will be performed separately on the pollutant gas and zero gas streams. It will cover the full range of flow rates that will be used for gas dilution. The multipoint calibration must consist of one or more measurements of the dynamic gas dilution system's pollutant gas and zero gas streams at five or more different flow rates. Each gas stream must be measured separately. Measurement of each gas stream with the same flow-rate reference standard reduces the uncertainty that associated with the use of multiple standards. The flow rates should be approximately evenly spaced over the operating range. The calibration is valid only for the range lying between the largest and smallest measured flow rates. Record the reference standard's measurements and the gas dilution system's flow rate set-point values in the laboratory's records. If the gas dilution system has multiple flow rate ranges or multiple flow control devices, a multipoint calibration must be done for all ranges and flow control devices that will be used later for generating pollutant gas mixtures.

EPA Traceability Protocol for Gaseous Calibration Standards
103
All volumetric-flow-rate measurements must be corrected for or referenced to the same temperature and pressure conditions, such as EPA-standard conditions (i.e., 760 millimeters of mercury (mm Hg), 25 °C) or the ambient temperature and pressure conditions prevailing in the laboratory during the calibration. The equation to correct the flow rate for temperature, pressure, and humidity effects is given below:
− =
SM WV
S M
TVolume P PFlow rateTime P T
where PM = measured barometric pressure (mm Hg); PWV = partial pressure of water vapor (mm Hg); PS = standard pressure (mm Hg); TS = standard temperature (298.2 K); and TM = measured ambient temperature (273.2 + °C). The data reduction technique used in this procedure is based on the assumption that the gas dilution system has a well-characterized calibration curve. The accuracy of the concentration of a diluted pollutant gas mixture is dependent upon this assumption. The analyst cannot assume that the calibration curve is a straight line. The analyst must determine the calibration equation and the uncertainty for its predicted concentrations by statistical analysis of the measurements obtained during the multipoint calibration (see Appendix F). Data from the multipoint calibration must be evaluated using least-squares regression analysis.19 This analysis technique will be used to determine the flow rate calibration curve and to characterize the uncertainty associated with the flow rate. The reference standard measurements are the dependent (i.e., Y) values in the analysis and their units may be liters per minute or any other appropriate unit. The gas dilution system's settings are the independent (i.e., X) values in the analysis and their units may be liters per minute or any other appropriate unit. The measurements and the set-points should have a resolution that is finer than 1 percent of the maximum measurement or set-point. Calculate the least-squares regression coefficients using the spreadsheets described in Appendix F or using an EPA-approved equivalent statistical technique (see Subsection 2.1.6). If an EPA-approved equivalent statistical technique is used, it must be identified as such in the certificate documentation and it must be described in media readily accessible to end users. Record the regression coefficients and other statistical results in the laboratory's records. The spreadsheets allow the multipoint calibration data to be fitted to straight-line or quadratic linear regression models. EPA discourages the use of

EPA Traceability Protocol for Gaseous Calibration Standards
104
the cubic and quartic models and believes that better fits of the data can be obtained by performing multipoint calibrations over more limited concentration ranges and by using straight-line or quadratic models. Additionally, a multipoint calibration should not change regression model orders from one year to the next. The spreadsheet described in Appendix F will suggest the best regression model for the multipoint calibration data, but the analyst should choose the model that best fits the measurement process on theoretical grounds. Because a flow rate reference standard's measurement process has a random error component, repeated measurements of the same flow controller setting will not produce identical measured values. The analyst may wish to investigate the precision by making replicate flow rate measurements at several different settings. Least-squares regression analysis normally assumes that the precision is the same at all flow rates. However, this statistical assumption may not be true for some reference standards and the analyst may need to use alternate statistical procedures to analyze the multipoint calibration data. 4.1.6.2 Uncertainty of the Flow-Rate Calibration Curve— The total uncertainty of the pollutant and zero gas flow rates is composed of several components. The first component is the uncertainty of the flow-rate reference standards that are used in the annual multipoint flow-rate calibration. It is obtained from the calibration certificate for the standards. It is normally presented as the expanded uncertainty (U) and as a percentage of the reading. The second uncertainty component is the precision of the measurements of the flow-rate reference standard. It is minimized by increasing the number of replicate measurements at each flow rate or by increasing the number of different flow rates used in the multipoint calibration. Additionally, precision can be improved by using an averaged reference standard response, rather than an instantaneous response, for each measurement. The third uncertainty component is the uncertainty associated with the flow rates that are predicted from the calibration curve. It is a measure of how well the calibration data fit an equation which the analyst assumes is the "true" calibration equation for the gas dilution system. The form of the component that is most directly useful to the analyst is the value of the expanded uncertainty (U) for a regression-predicted flow rate given one or more measurements of the flow rate reference standard. See Subsection 2.1.6 for a discussion of U. This value may be calculated using the spreadsheet described in Appendix F or using an EPA-approved equivalent statistical technique (see Subsection 2.1.6). Comparison of values of U from straight-line and quadratic equations permits the analyst to select the equation that best represents the data. Two points should be noted about the third uncertainty component. First, its magnitude decreases as n increases where n is the number of measurements
EPA Traceability Protocol for Gaseous Calibration Standards
105
in the multipoint flow rate calibration. Second, its magnitude increases as the mean measured response ( 'Y ) for the flow-rate reference standard diverges from the overall mean measured response (Y ) for the multipoint calibration. That is, the absolute uncertainty of the regression predicted concentration is larger at the extremes of the calibrated concentration range than at the middle of the range. A multipoint calibration will be considered to be well-characterized for all flow rates that are within the range of the multipoint calibration measurements and for which U for the regression-predicted analyzer response is ≤±1 percent of the measured response for the largest flow rate in the multipoint calibration. For example, assume that a multipoint calibration was conducted between 0 and 10 liters per minute. In this example, the calibration is well-characterized for all flow rates for which U is ≤±0.1 liters per minute, which is equal to ±1 percent of 10 liters per minute. Note that Cells D29, H27, B44, and H44 of the day-of-use worksheet in the Appendix F spreadsheet allows the analyst to enter pollutant gas and zero gas flow controller settings and to obtain the regression-predicted flow rates and the corresponding relative standard uncertainties (i.e., uc/flow rate) associated solely with the calibration. To determine whether these predicted flow rates are in the well-characterized region of the calibration curve, multiply these uncertainties by the quantity 2 x (largest calibration flow rate/predicted flow rate) and compare the resulting value to 0.01, which is the acceptance criterion for the well-characterized region. A multipoint calibration may fail to meet this uncertainty acceptance criterion for several possible reasons: • inadequate analytical precision; • inaccuracy of the reference standards; or • excessive uncertainty due to incorrect assumptions about the form of
the calibration equation. For analyzers having an inherently nonlinear, but precise response, the effect of excessive uncertainty in a straight-line calibration equation may be eliminated by using a quadratic calibration equation or by transforming the nonlinear calibration data mathematically so that they may be fitted to a straight line regression equation. See Reference 19 for a discussion of such linearizing transformations of data. The analyst may need to try several different transformations before the optimum transformation is determined. Using appropriately transformed calibration data, a calibration equation can be calculated with an acceptable value of U for the regression-predicted concentration. Subsequently, data obtained from the annual gas calibration checks, the monthly flow check, and the day-of-use must be similarly transformed to obtain regression-predicted flow rates.

EPA Traceability Protocol for Gaseous Calibration Standards
106
A quantitative assessment of the calibration's uncertainty is needed to allow the analyst to determine whether the multipoint calibration data adequately characterizes the "true" calibration curve of the flow controllers. The statistical parameter to be used to characterize the uncertainty of the multipoint calibration is U for a flow rate predicted from the regression line using measured flow rates. This parameter can be calculated using the spreadsheet described in Appendix F. Record the uncertainty calculations in the laboratory's records. 4.1.6.3 Annual Nonreactive Gas Calibration Check— Following completion of the multipoint calibration, the accuracy of the multipoint calibration must be checked to verify that the error associated with the dilution is not excessive. This calibration check involves the measurement of a diluted nonreactive reference standard and an undiluted nonreactive check standard, both of which must be an SRM, an RGM, a PRM, a CRM, an NTRM or a GMIS as specified in Subsection 2.1.3.1. Both standards must have the same reactive gas composition. The diluent gas must be the same as the balance gas for both standards. The check standard must have a certified concentration that is at least an order of magnitude (i.e., a factor of 10) less than the certified concentration of the reference standard that is diluted by the gas dilution system. Its concentration must fall in the well-characterized region of the pollutant gas analyzer's calibration curve. Information concerning this check standard (e.g., cylinder identification number, certified concentration, uncertainty, traceability to NIST) must be recorded in the laboratory's records. The reference standard and a zero gas are to be connected to the inlet of the gas dilution system. The pollutant and zero gas flow controllers' settings must be adjusted such that the concentration of the diluted reference standard is within +/- 1.0 percent of the concentration of the undiluted check standard. Note that the annual gas check worksheet in the Appendix F spreadsheet or an EPA-approved equivalent statistical technique (see Subsection 2.1.6) allows the analyst to enter the reference standard concentration, the check standard concentration, and various pollutant and zero gas flow rates to match the two concentrations. The worksheet also determines the correct settings for the pollutant and zero gas flow controllers to match the two concentrations and the relative concentration difference (RCD) between the two concentrations. That is
RCD = 100 (Diluted Concentration - Undiluted Concentration) (Undiluted Concentration)
Make three or more discrete measurements of both the undiluted check standard and the diluted reference standard using the pollutant gas analyzer. "Discrete" means that the analyst must change the gas mixture being sampled by the analyzer between measurements. For example, the analyst might alternate between measurements of the undiluted check standard and the diluted reference standard. Document these measurements in the laboratory's records.

EPA Traceability Protocol for Gaseous Calibration Standards
107
Calculate the mean and standard deviation of both sets of measurements using the annual gas check worksheet in the Appendix F spreadsheet. Next the analyst must verify that the systematic error (bias) of the dilution is not excessive by comparing the mean analyzer responses for the diluted reference standard and the undiluted check standard. Calculate the relative agreement between the two responses using the annual gas check worksheet in the Appendix F spreadsheet. That is, Relative Agreement = (Mean Diluted Response - Mean Undiluted Response) (Mean Undiluted Response) The acceptance criterion for the relative agreement includes the relative standard uncertainties for the concentrations of the reference and check standards, the uncertainties of the pollutant and zero gas flow rates for the reference standard, the relative standard deviations for the individual measurements of the diluted reference standard and undiluted check standard, and the RCD. That is,
2 2 22 2 21 2 1 221 2 1 2
ref flow flowcheck conc concu u uu s sCriterion RCDref check flow flow meanconc meanconc = + + + + + +
This calculation is performed using the annual gas check worksheet in the Appendix F spreadsheet. Document the RCD, the relative agreement, and the acceptance criterion in the laboratory's records. If the agreement is greater than the acceptance criterion, the dilution error is considered to be excessive. The analyst must investigate why the relative difference is excessive. The problem may be due to errors in the reference standard and check standard concentrations, errors in assay apparatus or to some other source. Pollutant gas analyzer calibrations may not be conducted until the agreement for a subsequent gas check is less than or equal to the criterion for that gas check. 4.1.6.4 Annual Reactive Gas Calibration Check— For applications in which the dynamic gas dilution system will be used with reactive gas mixtures [including ammonia (NH3), hydrogen chloride (HCl), hydrogen sulfide (H2S), nitric oxide (NO), oxides of nitrogen (NOX), and sulfur dioxide (SO2)], the annual gas calibration check must be repeated for each of the reactive gas mixtures. This additional calibration check is needed because reactive gases may be lost to the interior walls of a dynamic gas dilution system that does not cause such wall losses for nonreactive gas mixtures55. It involves the measurement of a diluted reactive reference standard and an undiluted reactive check standard, both of which must be SRMs, RGMs, PRMs, CRMs, NTRMs or GMISs as specified in Subsection 2.1.3.1. Both standards must have the same reactive gas composition. The diluent gas must be the same as the

EPA Traceability Protocol for Gaseous Calibration Standards
108
balance gas for both reactive gas standards. The undiluted reactive check standard must have a certified concentration that is at least an order of magnitude less (i.e., a factor of 10) than the concentration of the reactive reference standard that is diluted. Information concerning both standards (e.g., cylinder identification number, certified concentration, uncertainty, traceability to NIST) and the diluent gas must be recorded in the laboratory's records. The reference standard and a zero gas are to be connected to the inlet of the gas dilution system. The pollutant and zero gas flow controllers' settings must be adjusted such that the concentration of the diluted reference standard is within +/- 1.0 percent of the concentration of the undiluted check standard. Note that the annual gas check worksheet in the Appendix F spreadsheet allows the analyst to enter the reference standard concentration, the check standard concentration, and various pollutant and zero gas flow rates to match the two concentrations. The worksheet also determines the correct settings for the pollutant and zero gas flow controllers to match the two concentrations and the relative concentration difference (RCD) between the two concentrations. That is
RCD = 100 (Diluted Concentration - Undiluted Concentration) (Undiluted Concentration)
Make three or more discrete measurements of the diluted reactive reference standard and of the undiluted reactive check standard. Document these measurements in the laboratory's records. Calculate the mean and standard deviation of both sets of measurements using the annual gas check worksheet in the Appendix F spreadsheet. Next the analyst must verify that the dilution-plus-wall-loss error is not excessive by comparing the mean analyzer responses for the diluted reference standard and the undiluted check standard. Calculate the relative agreement between the two responses using the annual gas check worksheet in the Appendix F spreadsheet or using an EPA-approved equivalent statistical technique (see Subsection 2.1.6). That is, Relative Agreement = (Mean Diluted Response - Mean Undiluted Response) (Mean Undiluted Response) The acceptance criterion for the relative agreement includes the relative standard uncertainties for the concentrations of the reference and check standards, the uncertainties of the pollutant and zero gas flow rates for the reference standard, the relative standard deviations for the individual measurements of the diluted reference standard and undiluted check standard, and the RCD. That is,
2 2 22 2 21 2 1 221 2 1 2
ref flow flowcheck conc concu u uu s sCriterion RCDref check flow flow meanconc meanconc = + + + + + +

EPA Traceability Protocol for Gaseous Calibration Standards
109
This calculation is performed using the annual gas check worksheet in the Appendix F spreadsheet. Document the RCD, the relative agreement, and the acceptance criterion in the laboratory's records. If the agreement is greater than the acceptance criterion, the dilution error is considered to be excessive. The analyst must investigate why the relative difference is excessive. The problem may be due to errors in the reference standard and check standard concentrations, errors in assay apparatus or to some other source. Pollutant gas analyzer calibrations may not be conducted until the agreement for a subsequent gas check is less than or equal to the criterion for that gas check. 4.1.6.5 Monthly Flow Rate Quality Control Check— The dynamic gas dilution system must have had a single-point flow rate quality control (QC) check demonstrating acceptable performance within 1 month prior to the day that it is used to generate pollutant gas mixtures to calibrate pollutant gas analyzers. This QC check need not be done every month, but only in those months in which the system will be used. It will be performed separately on the pollutant gas and zero gas streams. The QC check is valid only for the flow-rate range that was measured during the annual multipoint calibration and not other flow-rate ranges. It will be performed at a single flow rate that lies in the middle of the range that was measured during the annual multipoint calibration. If the dynamic gas dilution system has multiple flow-rate ranges or multiple flow control devices, a single-point flow rate QC check must be done for all ranges and flow control devices that will be used later for generating pollutant gas mixtures. The single-point flow rate QC check must consist of one or more measurements of the gas dilution system's pollutant gas and zero gas streams. Each gas stream must be measured separately. Measurement of each gas stream with the same flow-rate reference standard reduces measurement errors that are associated with the use of multiple standards. The zero gas can be used in the place of the pollutant gas for this QC check if the analyst wished to conserve the pollutant gas. Record the reference standard's measurements and the gas dilution system's flow rate set-point values in the laboratory's records. Next the analyst must verify that the flow-rate shift is not excessive. For the annual multipoint calibration measurements and the monthly QC check measurements, calculate the relative difference (in percent) between the mean QC check flow rate and the corresponding flow rate that is predicted from the annual multipoint calibration regression equation. That is, Relative Difference = 100 (Mean Analyzer Response - Predicted Response)
(Predicted Response)

EPA Traceability Protocol for Gaseous Calibration Standards
110
This relative difference is calculated using the monthly flow check worksheet in the Appendix F spreadsheet. Document the relative difference in the laboratory's records. If the relative difference is greater than 1.0 percent, the calibration error is considered to be excessive. The analyst must investigate why the relative difference is excessive. The problem may be due to errors in the reference standard and check standard concentrations, errors in assay apparatus or to some other source. Assays may not be conducted until the relative difference for a subsequent check is less than or equal to 1.0 percent. 4.1.7 Day-of-Use Calculations After the annual flow-rate calibrations, the annual nonreactive and reactive gas checks, and the monthly flow-rate checks have been successfully completed, the day-of-use worksheet in the Appendix F worksheet or an EPA-approved equivalent statistical technique (see Subsection 2.1.6) can be used to determine the correct flow-controller settings that are needed to obtain a desired pollutant gas concentration and to calculate the expanded uncertainty of this concentration. Because data from the annual multipoint calibration already has been entered in the spreadsheet, the linear regression parameters obtained in the calibration will be used in these calculations. The pollutant gas that is used may differ from that used in the annual flow-rate calibrations and the annual nonreactive and reactive gas checks, but the pollutant gas and zero gas flow rates that are selected must fall within the well characterized region of the respective calibration curves. Note that Cells D29, H27, B44, and H44 of the day-of-use worksheet in the Appendix F spreadsheet allows the analyst to enter pollutant gas and zero gas flow controller settings and to obtain the regression-predicted flow rates and the corresponding relative standard uncertainties (i.e., uc/flow rate) associated solely with the calibration. To determine whether these predicted flow rates are in the well-characterized region of the calibration curve, multiply these uncertainties by the quantity 2 x (largest calibration flow rate/predicted flow rate) and compare the resulting value to 0.01, which is the acceptance criterion for the well-characterized region. 4.1.8 Expanded Uncertainty of the Concentration at the Output of the System The expanded uncertainty (U) of the diluted concentration at the output of the gas dilution system is the combined standard uncertainty (uC) multiplied by a coverage factor (k), which is equal to 2.8,9 It is due to many different error sources, including the uncertainty in the flow-rate reference standard(s), uncertainty in the annual multipoint calibration, uncertainty in the annual nonreactive or reactive gas calibration check, uncertainty in monthly flow-rate QC checks, and random measurement error. The spreadsheet in Appendix F combines these uncertainty components and calculates U. There may be additional uncertainty sources that cannot be assessed with the limited data that

EPA Traceability Protocol for Gaseous Calibration Standards
111
are produced when implementing this protocol. The calculated value of U must be given in the certification documentation. The use of an uncalculated or blanket estimate of U (e.g. +/- 1 percent) is not acceptable.
As a rule-of-thumb, U should be rounded to one significant figure unless
the leading figure is a 1 in which case two significant figures should be reported8.
The estimate of U (e.g., +/- 20 ppm) may be supplemented, but not replaced) by a statement of the equivalent fractional uncertainty (e.g., +/- 1 percent), if desired, using the following equation:
UFRACTIONAL = 100(U/ Concentration of the System Output)
The same rule-of-thumb regarding significant figures applies to the
fractional uncertainty.
If an analyst wishes to use an equivalent statistical technique to calculate the expanded uncertainty, the analyst must first submit a detailed description of the technique and any explanatory software to EPA Traceability Protocol Project, Technical Services Branch, U.S. EPA, Mail Code E343-03, Research Triangle Park, NC 27711 for statistical evaluation and approval. The description must be in sufficient detail to demonstrate equivalence to the spreadsheets described in Appendix F. Example calculations demonstrating equivalence must be included. Any information about the technique that is submitted to EPA will be treated as confidential business information. Upon approval by EPA, this equivalent statistical technique must be identified as such in the certificate documentation and it must be described in media readily accessible to end users. 4.1.9 Certification Documentation for the Dynamic Gas Dilution System For each dynamic gas dilution system that is assayed using this protocol, the assay results must be documented in a written report, which contains at least the following information: 1. A statement that the assay/certification was performed according to this
protocol; 2. The manufacturer, the model, and the serial number of the dynamic gas
dilution system; 3. The flow-rate ranges for which the dynamic gas dilution system is certified
based on the annual multipoint calibration; 4. The dynamic gas dilution system's calibration equation based on the annual
multipoint calibration. The calibration equation can be supplemented by a graphical representation of the calibration curve if desirable;

EPA Traceability Protocol for Gaseous Calibration Standards
112
5. A calculated estimate of U for the dynamic gas dilution system. The use of an
uncalculated, blanket value for U (e.g., +/- 1 percent) is not acceptable. The estimate is expressed as a 95-percent confidence interval, which is the combined standard uncertainty (uc) multiplied by a coverage factor (k), which is equal to 2.8,9 It must include the uncertainty in the flow-rate reference standard(s), uncertainty in the annual multipoint calibration, uncertainty in the annual nonreactive or reactive gas calibration check, uncertainty in monthly flow-rate QC checks, and random measurement error. Use the spreadsheet described in Appendix F or an EPA-approved equivalent statistical technique to calculate U. If an EPA-approved equivalent statistical technique is used rather that the Appendix F spreadsheet, it must be identified as such in the certificate documentation and must be described in media readily accessible to end users. As a rule-of-thumb, U should be rounded to one significant figure unless the leading figure is a 1 in which case two significant figures should be reported12. The estimate of U (e.g., +/- 20 milliliters per minute) may be supplemented by a statement of the equivalent fractional uncertainty (e.g., +/- 1.0 percent) if desired (see Section 4.1.5);
6. Dates of the annual multipoint calibration; 7. Certification expiration date (i.e., the multipoint calibration date plus one year
plus one day); 8. Information about the flow-rate reference standard(s) (i.e., the manufacturer,
the model, the serial number, and measurement principle) that was used in the multipoint calibration and the QA checks, its traceability to NIST, and the date of its most recent certification;
9. The relative difference(s) that was calculated from the annual nonreactive
(and reactive) gas calibration check(s); 10. Information about the undiluted reference standard and the diluted check
standard that were used in the annual nonreactive (and reactive) gas calibration check(s): NIST SRM number, NIST sample number, cylinder identification number, certified concentration, expanded uncertainty, and certification expiration date for an SRM; cylinder identification number, certified concentration, expanded uncertainty, and certification expiration date for an NTRM, an RGM, a PRM, a CRM or a GMIS. The certification documentation must identify the reference standard as being an SRM, an NTRM, an RGM, a PRM, a CRM or a GMIS. For a GMIS, the reference standard that was used for its assay must be identified in the documentation for the candidate standard being certified.
11. Identification of the dynamic gas dilution system manufacturer or other
laboratory (i.e., laboratory name, laboratory location, and PGVP vendor ID

EPA Traceability Protocol for Gaseous Calibration Standards
113
issued by EPA for the production location) where the dynamic gas dilution system was calibrated, even if another organization will sell it to an end user. This identification must be given in the same or larger font as the other required information in the report.
This certification documentation must be given to the end user of the standard. The dynamic gas dilution system manufacturer or other laboratory that calibrated the system must maintain laboratory records and certification documentation for at least one year after the annual multipoint calibration. A distributor of dynamic gas dilution systems may redocument a system that it has purchased from another manufacturer and that it wishes to sell to a third party. However, the new certification documentation must clearly identify the manufacturer or other laboratory (i.e., name and location) where the system was calibrated and present all the information that is contained in the original report. 4.1.10 Certification Label A label or tag must be attached to the dynamic gas dilution system bearing the information described in Items 1-5, 7, and 11 of Subsection 4.1.6. 4.1.11 Certification Periods for the Dynamic Gas Dilution System The certification of a dynamic gas dilution is valid for only one year following its annual multipoint calibration. 4.1.12 Technical Variances Gas dilution system producers, standard users, and other analytical laboratories may petition the U.S. EPA for technical variances to the assay procedures in this protocol. A technical variance allows the use of a specific alternative assay procedure for gas dilution systems, which can be certified under this protocol. The petitioner must send a written request with a detailed description of the alternative assay procedure and supporting analytical data to EPA Traceability Protocol Project, Technical Services Branch, U.S. EPA, Mail Code E343-03, Research Triangle Park, NC 27711. The supporting analytical data must demonstrate the equivalence of the alternative assay procedure with the procedures given in this protocol. Schuirmann's TOST13-18 is the recommended statistical technique to demonstrate such equivalence if technically possible.


EPA Traceability Protocol for Gaseous Calibration Standards
115
Section 5 - References 1. U.S. Environmental Protection Agency. "EPA Traceability Protocol for
Assay and Certification of Gaseous Calibration Standards." EPA/600/R-97/121, Research Triangle Park, NC. 1997. 52 pp.
2. U.S. Environmental Protection Agency. Code of Federal Regulations.
Title 40, Chapter I, Subchapter C, Part 50. "National Primary and Secondary Ambient Air Quality Standards." Washington, DC. Office of the Federal Register. July 1, 2010.
3. U.S. Environmental Protection Agency. Code of Federal Regulations.
Title 40, Chapter I, Subchapter C, Part 58. "Ambient Air Quality Surveillance." Washington, DC. Office of the Federal Register. July 1, 2010.
4. U.S. Environmental Protection Agency. Code of Federal Regulations.
Title 40, Chapter I, Subchapter C, Part 60. "Standards of Performance for New Stationary Sources." Washington, DC. Office of the Federal Register. July 1, 2010.
5. U.S. Environmental Protection Agency. Code of Federal Regulations.
Title 40, Chapter I, Subchapter C, Part 75. "Continuous Emission Monitoring." Washington, DC. Office of the Federal Register. July 1, 2010.
6. F.R. Guenther, W.D. Dorko, W.R. Miller, and G.C. Rhoderick. The NIST
Traceable Reference Program for Gas Standards. National Institute of Standards and Technology. Special Publication 260-126. 1996. 40 pp.
7. U.S. Environmental Protection Agency. Code of Federal Regulations.
Title 40, Chapter I, Subchapter C, Part 72. "Acid Rain Program General Provisions." Washington, DC. Office of the Federal Register. July 1, 2010.
8. American National Standards Institute (ANSI) and National Conference of
Standards Laboratories (NCSL), U.S. Guide to Expression of Uncertainty in Measurement, ANSI NCSL Z540.2 1997 R2007, 1997.
9. B.N. Taylor and C.E. Kuyatt. Guidelines for Evaluating and Expressing the
Uncertainty of NIST Measurement Results: 1994 Edition. National Institute of Standards and Technology. Technical Note 1297. 1994. (http://physics.nist.gov/pubs/guidelines/TN1297/tn1297.pdf, accessed April18, 2011).

EPA Traceability Protocol for Gaseous Calibration Standards
116
10. G.L. Harris. State Weights and Measures Laboratories: State Standards Program Description. National Institute of Standards and Technology. Special Publication 791. 1994. 130 pp.
11. V.R. White. National Voluntary Laboratory Accreditation Program: 1997
Directory. National Institute of Standards and Technology. Special Publication 810. 1997. 225 pp.
12. International Organization for Standardization (ISO) and International
Electrotechnical Commission (IEC). General Requirements for the Competence of Testing and Calibration Laboratories, Second Edition, ISO/IEG 17025:2005(E), Geneva, Switzerland, 2005.
13. D.J. Schuirmann. "A Comparison of the Two One-Sided Tests Procedure
and the Power Approach for Assessing the EQuivalence of Average Bioavailability", Journal of Pharmokinetics and Biopharmaceutics. 15(6): 657-680. 1987.
14. S.J. Richter and C. Richter. "A Method for Determining Equivalence in
Industrial Applications", Quality Engineering, 14(3):375-380. 2002. 15. H. Rita and P. Ekholm. "Showing Similarity of Results given by Two
Methods: A Commentary", Environmental Pollution, 145(2):383-386. 2007. 16. G.B. Limentani et al. "Beyond the t-Test: Statistical Equivalence Testing",
Analytical Chemistry. 77(11):221A-226A. 2005. 17. D. Chambers et al. "Analytical Method Equivalency: An Acceptable
Analytical Practice", Pharmaceutical Technology. 29(9):64-80. 2005. 18. K.R.Lung et al. "Statistical Method for the determination of Equivalence of
Automated Test Procedures", Journal of Automated Methods and Management in Chemistry. 25(6):123-127. 2003.
19. M.G. Natrella. Experimental Statistics, National Bureau of Standards
Handbook No. 91, U.S. Government Printing Office. Washington, DC. 1963. pp. 5-1 to 5-46 (reprinted by Dover Publications under the same title, 2005).
20. J. R. Taylor. Introduction to Error Analysis: The Study of Uncertainties in
Physical Measurements, Second Edition, University Science Books, Sausalito, CA, 1997.
21. W.D. Dorko. personal communication, 2011.
EPA Traceability Protocol for Gaseous Calibration Standards
117
22. R.C. Shores, F. Smith, and D.J. von Lehmden. "Stability Evaluation of Sulfur Dioxide, Nitric Oxide and Carbon Monoxide Gases in Cylinders." EPA/600/4-86, U.S. Environmental Protection Agency, Research Triangle Park, NC. 1984. 52 pp.
23. S.G. Wechter. "Preparation of Stable Pollution Gas Standards Using
Treated Aluminum Cylinders." In Calibration in Air Monitoring, ASTM STP 598, American Society for Testing and Materials. Philadelphia, PA. 1976. pp. 40-54.
24. National Council of the Paper Industry for Air and Stream Improvement,
Inc. "An Investigation of the Stability of H2S in Air Cylinder Gases." NCASI Special Report No. 90-09, New York, NY. 1990. 13 pp.
25. W.R. Miller and G.C. Rhoderick. "Stability of compressed gas mixtures
containing low level volatile organic compounds in aluminum cylinders," Fresenius J Anal Chem. 351(2-3):221-229. 1995.
26. G.C. Rhoderick. " Long-term stability of hydrocarbons in NIST gas
standard reference material (SRM) 1800," Anal Bioanal Chem. 383(1):98-106. 2005.
27. G.C. Rhoderick. "Development of a 100 nmol mol−1 propane-in-air SRM
for automobile-exhaust testing for new low-emission requirements," Anal Bioanal Chem. 387(7):2425–2432. 2007.
28. W.R. Miller and F.R. Guenther. "The certification of a nominal 20 μmol/mol
H2S/N2 standard reference material using two independent methods," Anal Bioanal Chem. 387(7):2433–2439. 2007.
29. K. Nishi. "Preparation of Stable Hydrogen Chloride Standard Gases at
Low Concentrations," presented at 8th APMP/TCQM Gas CRM Workshop. 2010 (see www.nmij.jp/~nmijclub/gas/docimgs/A0-01_Agenda_APMP_GAS_CRM_WS_NMIJ_2010.pdf, accessed August 1, 2011)
30. R.S. Wright et al. Performance Audits of EPA Protocol Gases and
Inspection and Maintenance Calibration Gases, Journal of the Air Pollution Control Association, 37(4):384-385, 1987.
31. R.S. Wright et al. Accuracy Assessment of EPA Protocol Gases in 1988,
Journal of the Air and Waste Management Association, 39(9):1225-1227, 1989.
32. E.A. Coppedge et al. Accuracy Assessment of EPA Protocol Gases
Purchased in 1991, Journal of the Air and Waste Management Association, 42(12):1617-1619, 1992.

EPA Traceability Protocol for Gaseous Calibration Standards
118
33. R.C. Shores et al. "Stability Evaluation of Multicomponent EPA Protocol
Gases", Measurement of Toxic and Related Air Pollutants, Air and Waste Management Association Publication No. VIP-39, U.S. EPA Publication No. EPA-600/R-94/136, 1994.
34. A.P. Hines, Analysis of Protocol Gases: An On-Going Quality Assurance
Audit (Results through January 1998), http://www.epa.gov/ttn/emc/ord/ana-pro.pdf, accessed April 11, 2011.
35. U.S. Environmental Protection Agency. EPA Needs an Oversight
Program for Protocol Gases. Office of Inspector General Report No. 09-P-0235, 2009. (http://www.epa.gov/oig/reports.htm, accessed April 18, 2011).
36. U.S. Environmental Protection Agency. U.S. EPA Ambient Air Monitoring
Protocol Gas Verification Program, Annual Report, CY 2010, Office of Air Quality Planning and Standards, 2011 (www.epa.gov/ttn/amtic/files/ambient/qaqc/aagvp2010report.pdf, accessed April 18, 2011).
37. National Institute of Standards and Technology. Environmental Protection
Agency Blind Audit 2010, NIST Report of Analysis 639.03-11-026a, 2011 (http://www.epa.gov/airmarkets/emissions/docs/Final%202010%20Audit%20Report.pdf, accessed April 11, 2011).
38. U.S. Environmental Protection Agency. Protocol Gas Verification Program
and Minimum Competency Requirements for Air Emission Testing, Federal Register, Vol. 76, No. 59, Pages 17288-17325, Monday, March 28, 2011
39. American Society for Testing and Materials. Standard Practice for Dealing
with Outlying Observations. ASTM Standard Practice E 178-80, 1980. 40. U.S. Environmental Protection Agency. List of Designated Reference and
Equivalent Methods. Current edition available from U.S. Environmental Protection Agency, National Exposure Research Laboratory, Human Exposure and Atmospheric Sciences Division (MD-D205-03),, Research Triangle Park, NC 27711 or from the Ambient Monitoring Technology Information Center (AMTIC) at http://www.epa.gov/ttn/amtic/criteria.html.
41. American National Standards Institute (ANSI) and American Society for
Testing and Materials (ASTM). Standard Specification for Laboratory Weights and Precision Mass Standards. ANSI/ASTM Standard E 617-91, 1991.

EPA Traceability Protocol for Gaseous Calibration Standards
119
42. W. Kupper. "High Accuracy Mass Measurements, From Micrograms to Tons," Instrument Society of America Transactions. 29(4). 1990.
43. G. Harris. "Ensuring Accuracy and Traceability of Weighing Instruments,"
ASTM Standardization News. 21(4):44-51. 1993. 44. J.A. Wise. NIST Measurement Services: Liquid-in-Glass Thermometer
Calibration Service. National Institute of Standards and Technology Special Publication 250-23. 1988.
45. J.A. Wise. A Procedure for the Effective Recalibration of Liquid-in-Glass
Thermometers. National Institute of Standards and Technology Special Publication 819. 1991.
46. G. D. Mitchell, W. D. Dorko and P. A. Johnson. "Long-term stability of
sulfur dioxide permeation tube standard reference materials", Fresenius' Journal of Analytical Chemistry, 344(6):229-233. 1992.
47. G. D. Mitchell. “A Review of Permeation Tubes and Permeators”,
Separation and Purification Methods, 29(1), 2000, 119-128. 48. E.E. Hughes et al. "Performance of a Nitrogen Dioxide Permeation
Device." Analytical Chemistry. 49(12):1823-1829. 1977. 49. W.J. Mitchell et al. “Simple Systems for Calibrating and Auditing SO2
Monitors at Remote Sites.” Atmospheric Environment. 26A(1):191-194. 1992.
50. F.P. Scaringelli et al. “Preparation of Known Concentrations of Gases and
Vapors with Permeation Devices Calibrated Gravimetrically.” Analytical Chemistry. 42(8):871-876. 1970.
51. D.L. Williams. "Permeation Tube Equilibration Times and Long-Term
Stability." Calibration in Air Monitoring. ASTM Publication STP 598. American Society for Testing and Materials. 1976. pp. 183-197.
52. U.S. Environmental Protection Agency. Method 205 - Verification of Gas
Dilution Systems for Field Instrument Calibrations (www.epa.gov/ttn/emc/methods/method205.html, accessed August 1, 2011).
53. EURACHEM/CITAC Guide Use of Uncertainty Information in Compliance
Assessment, First Edition. A Williams, S L R Ellison, M Roesslein (eds.) ASIN: B002AD0U9Q. 2007. Available from the Eurachem Secretariat (see http://www.eurachem.org, accessed August 1, 2011).

EPA Traceability Protocol for Gaseous Calibration Standards
120
54. J.D. Wright. "Laboratory Primary Standards", Flow Measurement, Second Edition. 2001. D. W. Spitzer, Editor. ISA - The Instrumentation, Systems, and Automation Society, Research Triangle Park, NC. ISBN 1-55617-736-4.
55. R.S. Wright and R.W. Murdoch. "Labratory Evaluation of Gas Dilution
Systems for Analyzer Calibration and Calibration Gas Analysis", Air & Waste, 44(4):428-430. 1994.

EPA Traceability Protocol for Gaseous Calibration Standards
121
Appendix A - Statistical Spreadsheet for Procedures G1 and G2 1. ReadMe Worksheet Purpose This worksheet supports linear, quadratic, cubic, and quartic models: Linear: y = β0 + β1x + ε Quadratic: y = β0 + β1x + β2x2 + ε Cubic: y = β0 + β1x + β2x2 + β3x3 + ε Quartic: y = β0 + β1x + β2x2 + β3x3 + β4x4 + ε
The inputs are: x = the concentration of the certified calibration standard y = the measured instrument response ε = a random effect due to variation of influence quantities
It is assumed that the concentrations of the calibration standards (x) have negligible uncertainties. The output quantities are estimated parameters (βs) and related uncertainties. The workbook then helps the user perform the following functions:
• determine which model (linear, quadratic, etc.) is better • determine the replication of unknowns needed for uncertainty control • determine whether zero and span responses are acceptable • estimate the concentration and expanded uncertainty of candidate
standards analyzed on the same day as the initial calibration or a subsequent day.
Warning EPA discourages the use of cubic and quartic models and believes that better fits of the data can be obtained by performing multipoint calibrations over more limited concentration ranges and by using straight-line or quadratic models. Inclusion of cubic and quartic models in the spreadsheet is for experimental use or for situations in which there is a theoretical basis for the use of such higher-order models. Analysts should be aware that apparent higher-order calibration curves may be caused by artifacts such as inaccurate reference standards or leaks in a gas dilution system. They should not use higher-order regression models to fit multipoint calibration data that have inadequate precision and that should be fitted to lower-order regression models. If analysts suspect that

EPA Traceability Protocol for Gaseous Calibration Standards
122
precision is inadequate, they should make replicate measurements at each different concentration. Additionally, a multipoint calibration should not change regression model orders from one month to the next. Organization The workbook consists of several worksheets, which are displayed as tabs at the bottom of the screen. The functions of these worksheets are described below: ReadMe describes the workbook, explaining how to use the
worksheets Measurement Data allows for user input of calibration and other analytical
data and includes statistical calculations for polynomial regression
Curves 1 displays the calibration data, the best-fit line, and its confidence bands
Residuals 1 displays the difference between the observed responses and those estimated by the best-fit calibration line
Curves 2 displays the calibration data, the best-fit quadratic curve, and its confidence bands
Residuals 2 displays the difference between the observed responses and those estimated by the quadratic regression line
Curves 3 displays the calibration data, the best-fit cubic curve, and its confidence bands
Residuals 3 displays the difference between the observed responses and those estimated by the best fit cubic regression line
Curves 4 displays the calibration data, the best-fit cubic curve, and its confidence bands
Residuals 4 displays the difference between the observed responses and those estimated by the best-fit quartic regression line
Chart Data includes the data used to create the Curves and Residuals charts.
Conventions The Measurement Data worksheet includes instructions that guide the user through the steps in its use. The worksheet is also color coded to simplify use. Shaded cells that are bordered in blue lines are for input of data. These cells are unprotected, but all other cells of the Measurement Data worksheet are protected. The only other unprotected cell in the workbook is cell F4 of the Chart Data worksheet. That cell controls the width of the confidence bands plotted in the Curves 1 and Curves 2 charts.

EPA Traceability Protocol for Gaseous Calibration Standards
123
Derived values and statements are colored red. These cells contain formulas and are protected to prevent alteration. Spreadsheet background colors indicate the order of the polynomial supported by the calculations in the area.
Light green is used for the linear model. Yellow is used for the quadratic model. Gray is used for the cubic model Light blue is used for the quartic model.
Use The Measurement Data worksheet guides the user through six steps. STEP 1 Enter Calibration Data In this step, up to 50 calibration points may be entered. Each calibration point has two parts– the certified concentration of the calibration gas standard and the instrument response when testing the standard. These values are entered in two columns. The spreadsheet performs computations in Columns I through P (linear), Q through X (quadratic), Y through AZ (cubic), and BA and above (quartic). STEP 2 Review the Parameter Estimates In this step, the user reviews the estimates of the intercepts (0), slopes (1) and other coefficients (2, 3, and 4) for the four models, examines their confidence intervals and the residual error variances (s2). The result of an F-test indicates which of the models is best. The linear model is recommended unless the quadratic or higher-order model significantly reduces the residual error. STEP 3 Review the Charts In this step, the user reviews the charts named Curves 1, Residuals 1, Curves 2, Residuals 2, etc. These charts help the user understand why one model performs better than the other. STEP 4 Assess Magnitude of Uncertainty In this step, the user enters the assumed concentration of a candidate standard and selects a replication number, r. Based on the calibration results, the worksheet estimates the expanded uncertainty associated with an approximate level of confidence of 95% that would result from measuring such a standard r

EPA Traceability Protocol for Gaseous Calibration Standards
124
times. The user can use this as a guide for deciding whether to proceed with analysis, producing additional calibration points, or taking some corrective action. STEP 4a Check Uncertainty Associated with Dilution Following completion of the multipoint calibration, the accuracy of the assay apparatus must be checked to verify that the error associated with the dilution is not excessive. This accuracy check involves the measurement of an undiluted or diluted check standard. Make 3 or more discrete measurements of the undiluted or diluted check standard. Enter the response values in the step 4a section of the Measurement Data worksheet. The spreadsheet calculates the relative difference between the mean analyzer response and the corresponding response from the multipoint calibration regression equation and the undiluted or diluted check standard concentration. If the relative difference is greater than 1.0%, the dilution error is considered to be excessive. Assays may not be conducted until the relative difference for a subsequent accuracy check is less than or equal to 1.0%. STEP 5 Assay Candidate Standard on Same Day In this step, the user enters the responses to a candidate standard that is tested on the same day as the calibration of STEP 1. The worksheet provides an estimate of the candidate's concentration and its 95% uncertainty. The worksheet also indicates whether the variability in responses is larger than expected (unacceptable). STEP 6 Assay Candidate Standard on Different Day from Initial Calibration In this step, the user enters the responses to a candidate standard that is tested on a different day from the calibration of STEP 1. The worksheet first assesses the zero and span responses. If the zero and span responses are acceptable, the user proceeds to enter the results from testing a candidate standard. The results include those for zero and nonzero reference standards. The table below specifies the minimum number of different reference standard concentrations needed for each model, in addition to the zero standard. Failure to meet these requirements will result in serious calculation errors and invalid results. Model Minimum number of different nonzero reference standards required Linear 1 Quadratic 2 Cubic 3 Quartic 4 Whenever possible the concentrations of the additional reference standards should be located at points which correspond to large differences between the

EPA Traceability Protocol for Gaseous Calibration Standards
125
polynomial calibration curve and the corresponding straight line between the zero gas and the highest-concentration standard. The spreadsheet determines whether the regression curve has changed since the initial calibration. The data are corrected for any change and the estimated concentration of the candidate standard is provided together with its expanded uncertainty associated with an approximate level of confidence of 95%. The spreadsheet also determines whether the relative combined standard uncertainty of the mean response is acceptable (less than 1% of the mean response). This additional check is meant to guard against hysteresis or other errors that are not corrected by the spreadsheet's adjustments. 2. Measurement Data Worksheet This spreadsheet is for the EPA protocol gases calculation. STEP 1 Enter Calibration Data Enter the calibration data in the shaded spaces below. The first column (I) simply counts the calibration points that you enter. The second column (X) is for the certified concentrations of the calibration gas standards. The third column (Y) is for the instrument responses corresponding to the calibration standards. The number of points cannot exceed 50.
i Xi Yi Color Code 1 0.000 0.2194 2 0.500 0.7141 red = derived value (protected) 3 1.000 1.2885 4 1.500 1.9132 blue = entered value (unprotected) 5 2.000 2.5910 6 2.500 3.2866 black = fixed text (protected) 7 3.000 4.1078 8 3.500 4.9446 9 4.000 5.8145 10 4.500 6.7230 11 5.000 7.7284 12 5.500 8.7566 13 6.000 9.8013 14 6.500 10.8818 15 7.000 12.0982 16 7.500 13.3122 17 8.000 14.5840 18 8.500 15.9238 19 9.000 17.3271

EPA Traceability Protocol for Gaseous Calibration Standards
126
STEP 2 Review the Parameter Estimates Review the estimates of the coefficients (b0, (b1,...) for the linear and quadratic models, their confidence, and the residual error variances (s2).
Linear Model Expanded Uncertainty Parameter Estimate Lower Upper b0 = -1.0778 -1.7351 -0.4204 b1 = 1.9005 1.7757 2.0253 s2 = 0.4986 0.2807 1.1205 s = 0.7061 0.5298 1.0585 df = 17 t = 2.1098 Quadratic Model Expanded Uncertainty Parameter Estimate Lower Upper b0 = 0.1964 0.1960 0.1968 b1 = 1.0011 1.0010 1.0012 b2 = 0.0999 0.0999 0.0999 s2 = 0.0005 0.0003 0.0011 s = 0.0220 0.0164 0.0335 df = 16 t = 2.1199 The approximate level of confidence associated with the expanded uncertainties is 95%. The corresponding intervals take the form estimate +/- t*u, where: estimate is the quantity of interest, u is its uncertainty, and t is a coverage factor. For each model, the coverage factor, t, is determined from the t-distribution with appropriate degrees of freedom (df). Note that the uncertainties are not displayed, but can easily be derived from the estimate, expanded uncertainty, and the coverage factor. Comparing the two models: F ratio = 1026.76 F critical = 2.3167 (5% significance level) The quadratic model produces a significantly smaller error variance. The quadratic model appears to be the better choice. If cubic or quartic models are supported by compelling scientific theory or data, then review the following estimates for those models. Otherwise, go to Step 3.

EPA Traceability Protocol for Gaseous Calibration Standards
127
Cubic Model Expanded Uncertainty Parameter Estimate Lower Upper b0 = 0.1952 0.1593 0.2310 b1 = 1.0030 0.9676 1.0385 b2 = 0.0994 0.0901 0.1087 b3 = 0.0000 -0.0006 0.0007 s2 = 0.0005 0.0003 0.0012 s = 0.0227 0.0168 0.0352 df = 15 t = 2.1315
See above notes on calculation of expanded uncertainties. Comparing quadratic and cubic models: F ratio = 0.9385 F critical = 2.3849 (5% significance level) The error variances are not significantly different at the 5% level. The quadratic model appears to be a better choice than cubic. Quartic Model Expanded Uncertainty Parameter Estimate Lower Upper b0 = 0.2206 0.1900 0.2512 b1 = 0.9285 0.8786 0.9783 b2 = 0.1390 0.1156 0.1625 b3 = -0.0069 -0.0109 -0.0030 b4 = 0.0004 0.0002 0.0006 s2 = 0.0003 0.0001 0.0007 s = 0.0165 0.0121 0.0261 df = 14 t = 2.1448
Comparing quadratic and cubic models: F ratio = 1.8954 F critical = 2.4630 (5% significance level) The error variances are not significantly different at the 5% level. The cubic model appears to be a better choice than quartic. STEP 3 Review the Charts View the charts named Curves 1 and Residuals 1. Curves 1 shows bands illustrating expanded uncertainties for the estimated regression. Compare these bands with those of the quadratic regression, Curves 2. (Note: You can change

EPA Traceability Protocol for Gaseous Calibration Standards
128
the associated approximate confidence level by changing the "p-value" in cell F4 of the worksheet named Chart Data.) Residuals 1 shows how the calibration points deviated from the calibration line. Look for a simple pattern (such as a quadratic curve) in the chart. If such a pattern appears, the quadratic model may be better. View Residual 2, the deviations from the best-fit quadratic curve. If Residual 2 effectively removes the simple pattern observed in Residual 1 and if the magnitude of the deviations has been significantly reduced (as evidenced by a reduction in the uncertainty u2), then the quadratic model is superior. An F-test can be run to determine if the two overall uncertainties are significantly different. F = 1026.764 Prob. of greater F = 4.51E-21 The quadratic model produces a significantly smaller error variance. The quadratic model appears to be the better choice. If cubic or quartic models are supported by compelling scientific theory or data, then view their Curves and Residuals charts. STEP 4 Assess Magnitude of Uncertainty Enter the concentration at which you would like to evaluate the uncertainty of estimation and prediction. Also enter r, the number of assays to be performed. Increasing r reduces the prediction uncertainty, but with diminishing effect. Concentration = 6 r = 3 Review the estimated mean response (estimate that only takes into account the calibration uncertainty), and the confidence intervals. Review the predicted mean response and its confidence intervals. To satisfy the EPA protocol requirements, the 95% confidence limits for the concentration should be 1% of the concentration. Estimates below are based on the quadratic model. Tab-Right to view estimates based on the other model. Expanded Uncertainty Estimate Lower Upper Instrument Response = 9.8006 9.7858 9.8155 Expanded Uncertainty Prediction Lower Upper Instrument Response = 9.8006 9.7698 9.8314 Concentration = 6.0000 5.9860 6.0140 95% uncertainty in prediction = 0.23%
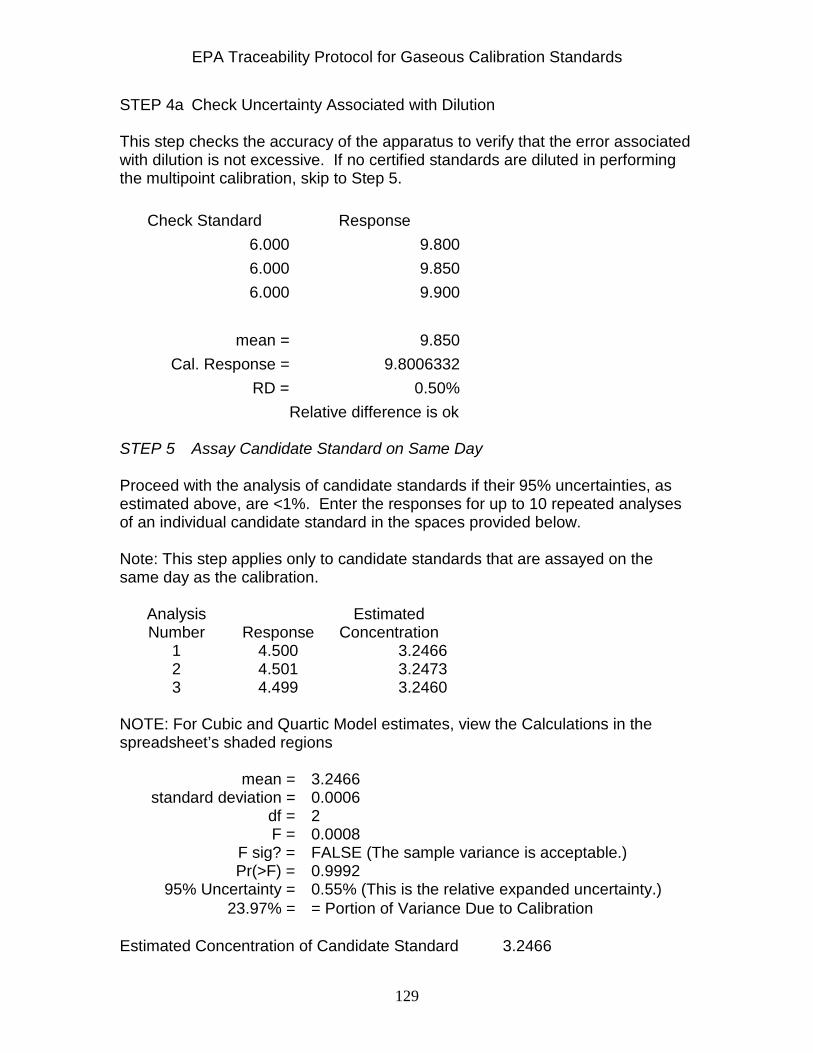
EPA Traceability Protocol for Gaseous Calibration Standards
129
STEP 4a Check Uncertainty Associated with Dilution This step checks the accuracy of the apparatus to verify that the error associated with dilution is not excessive. If no certified standards are diluted in performing the multipoint calibration, skip to Step 5.
Check Standard Response 6.000 9.800 6.000 9.850 6.000 9.900
mean = 9.850
Cal. Response = 9.8006332 RD = 0.50%
Relative difference is ok STEP 5 Assay Candidate Standard on Same Day Proceed with the analysis of candidate standards if their 95% uncertainties, as estimated above, are <1%. Enter the responses for up to 10 repeated analyses of an individual candidate standard in the spaces provided below. Note: This step applies only to candidate standards that are assayed on the same day as the calibration.
Analysis Number
Response
Estimated Concentration
1 4.500 3.2466 2 4.501 3.2473 3 4.499 3.2460
NOTE: For Cubic and Quartic Model estimates, view the Calculations in the spreadsheet’s shaded regions
mean = 3.2466 standard deviation = 0.0006
df = 2 F = 0.0008
F sig? = FALSE (The sample variance is acceptable.) Pr(>F) = 0.9992
95% Uncertainty = 0.55% (This is the relative expanded uncertainty.) 23.97% = = Portion of Variance Due to Calibration
Estimated Concentration of Candidate Standard 3.2466
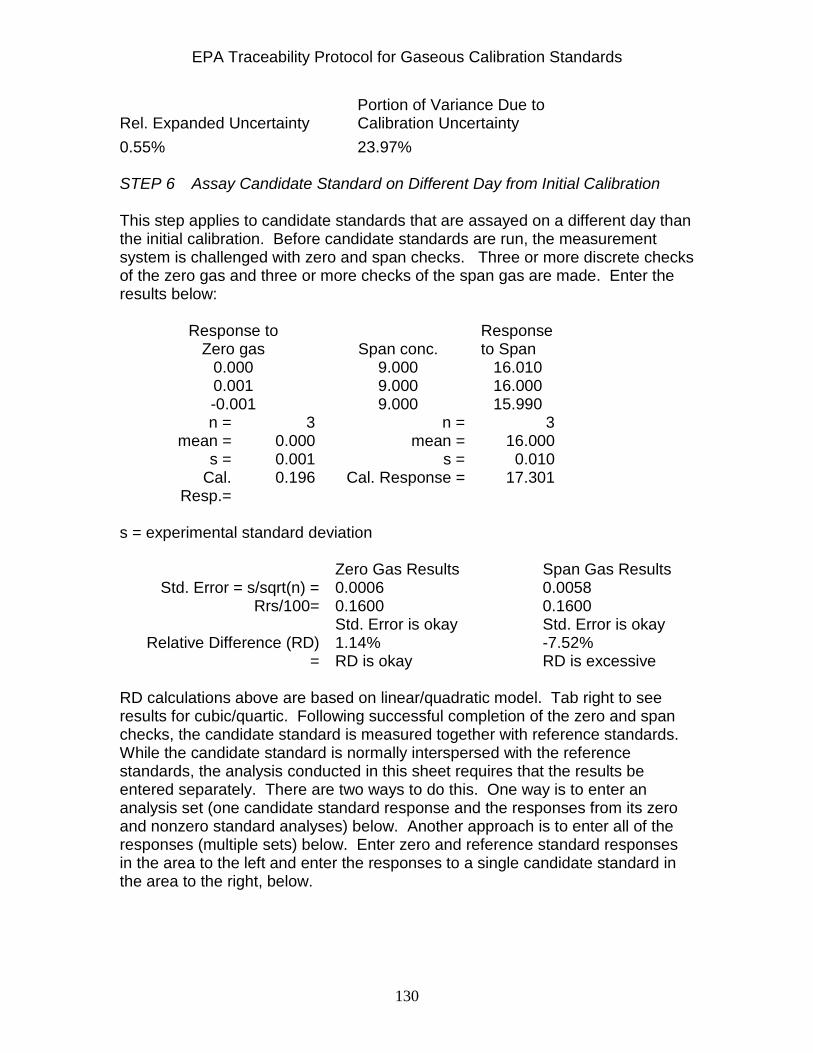
EPA Traceability Protocol for Gaseous Calibration Standards
130
Rel. Expanded Uncertainty Portion of Variance Due to Calibration Uncertainty
0.55% 23.97% STEP 6 Assay Candidate Standard on Different Day from Initial Calibration This step applies to candidate standards that are assayed on a different day than the initial calibration. Before candidate standards are run, the measurement system is challenged with zero and span checks. Three or more discrete checks of the zero gas and three or more checks of the span gas are made. Enter the results below:
Response to Zero gas
Span conc.
Response to Span
0.000 9.000 16.010 0.001 9.000 16.000 -0.001 9.000 15.990 n =
mean = s =
Cal. Resp.=
3 0.000 0.001 0.196
n = mean =
s = Cal. Response =
3 16.000
0.010 17.301
s = experimental standard deviation
Zero Gas Results Span Gas Results Std. Error = s/sqrt(n) =
Rrs/100= 0.0006 0.1600 Std. Error is okay
0.0058 0.1600 Std. Error is okay
Relative Difference (RD) =
1.14% RD is okay
-7.52% RD is excessive
RD calculations above are based on linear/quadratic model. Tab right to see results for cubic/quartic. Following successful completion of the zero and span checks, the candidate standard is measured together with reference standards. While the candidate standard is normally interspersed with the reference standards, the analysis conducted in this sheet requires that the results be entered separately. There are two ways to do this. One way is to enter an analysis set (one candidate standard response and the responses from its zero and nonzero standard analyses) below. Another approach is to enter all of the responses (multiple sets) below. Enter zero and reference standard responses in the area to the left and enter the responses to a single candidate standard in the area to the right, below.
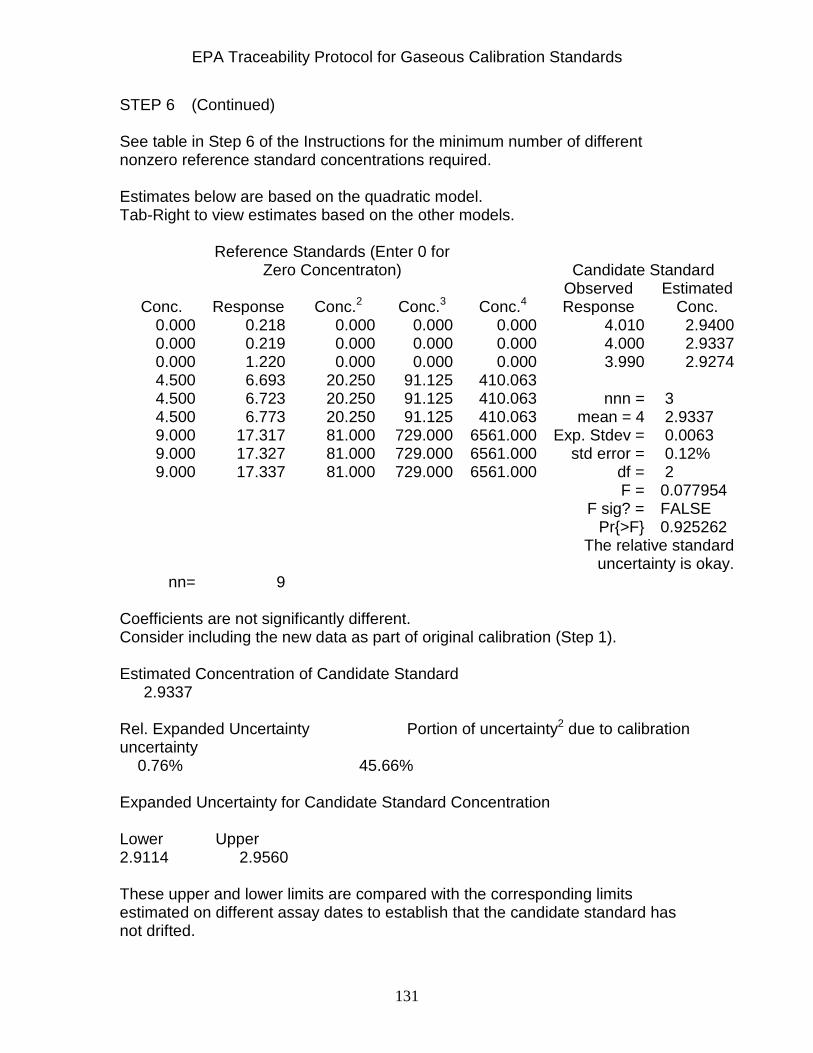
EPA Traceability Protocol for Gaseous Calibration Standards
131
STEP 6 (Continued) See table in Step 6 of the Instructions for the minimum number of different nonzero reference standard concentrations required. Estimates below are based on the quadratic model. Tab-Right to view estimates based on the other models.
Reference Standards (Enter 0 for Zero Concentraton)
Candidate Standard
Conc.
Response
Conc.2
Conc.3
Conc.4
Observed Response
Estimated Conc.
0.000 0.218 0.000 0.000 0.000 4.010 2.9400 0.000 0.219 0.000 0.000 0.000 4.000 2.9337 0.000 1.220 0.000 0.000 0.000 3.990 2.9274 4.500 6.693 20.250 91.125 410.063 4.500 6.723 20.250 91.125 410.063 nnn = 3 4.500 6.773 20.250 91.125 410.063 mean = 4 2.9337 9.000 17.317 81.000 729.000 6561.000 Exp. Stdev = 0.0063 9.000 17.327 81.000 729.000 6561.000 std error = 0.12% 9.000 17.337 81.000 729.000 6561.000 df = 2
F = 0.077954 F sig? = FALSE Pr{>F} 0.925262 The relative standard
uncertainty is okay. nn= 9
Coefficients are not significantly different. Consider including the new data as part of original calibration (Step 1). Estimated Concentration of Candidate Standard 2.9337 Rel. Expanded Uncertainty Portion of uncertainty2 due to calibration uncertainty 0.76% 45.66% Expanded Uncertainty for Candidate Standard Concentration Lower Upper 2.9114 2.9560 These upper and lower limits are compared with the corresponding limits estimated on different assay dates to establish that the candidate standard has not drifted.

EPA Traceability Protocol for Gaseous Calibration Standards
132

EPA Traceability Protocol for Gaseous Calibration Standards
133
Appendix B - Statistical Spreadsheet for Procedure P3 1. ReadMe Spreadsheet What this Workbook Is All About This workbook enables the user to estimate the rate at which the weight of a permeation tube decreases. A linear relationship between the tube's weight and elapsed time is established. If the estimated weight at time zero is significantly different from the actual weight at time zero, then at least the earliest data pair should be removed from the analysis. Uncertainty of the slope estimate (the rate of weight loss or drift) will be determined. The traceability protocol requires that this estimate have a relative uncertainty of less than 1%. How the Workbook Is Organized The workbook consists of several worksheets, which are displayed as tabs on the bottom of the screen. Each worksheet performs a distinct function as described below.
ReadMe describes the workbook and explains how to use the worksheets
Data allows for user input of the calibration data (elapsed time and weight)
ANOVA performs analysis of variance and determines whether the intercept term is needed
Calibration Results calculates the drift and its uncertainty Curve graphically displays the drift line together with its
confidence bands Residual graphically displays the vertical difference between
the observed and estimated weights Report summarizes the assay results for a permeation device Chart Data includes the data used to create the curve and
residual charts. How the Worksheets Are Set up Each worksheet contains instructions that guide the user through the steps in usingthe worksheet. The worksheets are also color-coded to simplify use. Shaded cells that are bordered in blue lines are cells whose contents you can change (i.e., enter data). In other sheets you can change the following variables:

EPA Traceability Protocol for Gaseous Calibration Standards
134
Sheet Variable Location Current Value Data Unit of Time H22 m Data Unit of Weight H24 g Report Device ID F5 test data Chart Data significance level D2 1.00E-05 Derived values are colored red. These cells contain formulas that should not be changed. The cells are protected to prevent alteration. How to Use the Worksheets Step 1: Enter the elapsed times (all in the same units) and corresponding
tube weights in the Data worksheet. The worksheet will compute the total weight loss for each observation.
Step 2: Select the significance level (alpha) to be used in producing
confidence limits for the estimated slope and intercept. Then review the results of the F-test and t-test to determine whether the intercept term is needed. If the intercept term is significant, then determine which of the early data points should be removed. Removing those data, and correcting the elapsed times, repeat Steps 1 and 2.
Step 3: Examine the corresponding Curve chart. You may need to adjust
the chart's axis scaling. The points should appear to fall virtually on top of the black line. The black line should be very close to its confidence bands (colored red and blue).
Step 4: Examine the corresponding Residual worksheet. The residuals
should appear to be random in both magnitude and direction. If they appear to follow a regular pattern, then the simple linear model is not appropriate. The device does not have a constant rate of weight loss. More time may be required to establish and measure a linear relationship. Observations taken before the linear relationship is established should be discarded and not used in the statistical analysis.
Step 5: Print the one-page report provided in the Report sheet. The report
summarizes the assay data and indicates the uncertainty of the estimate.
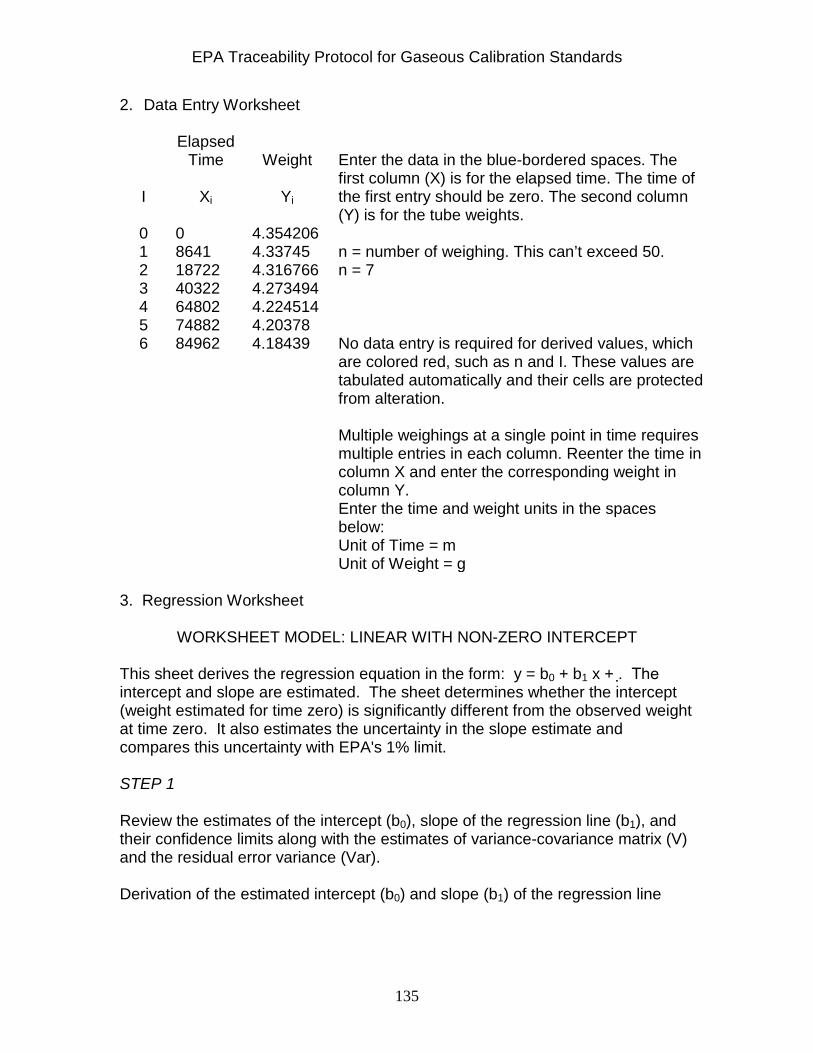
EPA Traceability Protocol for Gaseous Calibration Standards
135
2. Data Entry Worksheet
Elapsed Time
Weight
Enter the data in the blue-bordered spaces. The first column (X) is for the elapsed time. The time of the first entry should be zero. The second column (Y) is for the tube weights.
I
Xi
Yi
0 0 4.354206 1 8641 4.33745 n = number of weighing. This can’t exceed 50. 2 18722 4.316766 n = 7 3 40322 4.273494 4 64802 4.224514 5 74882 4.20378 6 84962 4.18439 No data entry is required for derived values, which
are colored red, such as n and I. These values are tabulated automatically and their cells are protected from alteration. Multiple weighings at a single point in time requires multiple entries in each column. Reenter the time in column X and enter the corresponding weight in column Y.
Enter the time and weight units in the spaces below:
Unit of Time = m Unit of Weight = g
3. Regression Worksheet
WORKSHEET MODEL: LINEAR WITH NON-ZERO INTERCEPT This sheet derives the regression equation in the form: y = b0 + b1 x + . The intercept and slope are estimated. The sheet determines whether the intercept (weight estimated for time zero) is significantly different from the observed weight at time zero. It also estimates the uncertainty in the slope estimate and compares this uncertainty with EPA's 1% limit. STEP 1 Review the estimates of the intercept (b0), slope of the regression line (b1), and their confidence limits along with the estimates of variance-covariance matrix (V) and the residual error variance (Var). Derivation of the estimated intercept (b0) and slope (b1) of the regression line

EPA Traceability Protocol for Gaseous Calibration Standards
136
X'X = 7 292331 Y'Y = 127.6972 95% Confidence Limits
292331 1.91E+10 df = 5 b0 lower limit =
4.353872
(X'X)-1 = 0.396793 -6.1E-06 t(0.95, df) =
2.570578 b0 upper limit =
4.354935
-6.1E-06 1.46E-10 det(X'X) = 4.81E+10 b0 = 4.354403 b1 lower
limit = -2E-06
X'Y = 29.8946 b1 = -2E-06 b1 lower limit =
-2E-06
1234673 Derivation of the error variance (Var) and variance-covariance matrix (V) b'X'Y = 127.6972 SS(model), 2df b'X'Y - sum(Y)2 / n = 0.027619 SS(regression) 1df (Y'Y - b'X'Y) = 5.38E-07 SS(residual) Var = (Y'Y - b'X'Y) / df = 1.08E-07 MS(residual), n-2 df V = Var * (X'X)-1 = 4.27E-08 -6.5E-13 -6.5E-13 1.57E-17 STEP 2 Examine the upper and lower limits for the intercept, b0. b0 lower limit = 4.353872 b0 upper limit = 4.354935 y0 = 4.354206 y0 is within the confidence limits for the intercept If y1 is within the confidence limits for the intercept, proceed to STEP 3. Otherwise, consider removing the first observed weight from the analysis. Re-enter the times and weights. Remember that the first time (X0) should be zero. This will require adjustment of the other elapsed times. After entering the data, return to STEP 1, above. STEP 3 Examine the upper and lower limits for the slope, b1. The limits should differ from the estimate by no more than 1% of the estimated slope. (b1 upper - b1) / |b1| = 0.51% Conclusion: Uncertainty is acceptable. (b1 lower - b1) / |b1| = -0.51% If the uncertainty is unacceptable, consider collecting additional data. Also, view the Curve and Residual plots. They may reveal a nonlinear relationship for a

EPA Traceability Protocol for Gaseous Calibration Standards
137
portion of the data. The initial measurements may not align with subsequent measurements if the device was in the process of stabilizing or equilibrating during those times. If this is the case, the initial points of the Residual chart would appear to be outliers. The residuals with the same sign (all positive or all negative) and their magnitude will likely be greater than the magnitude of subsequent residuals. If this is the case, consider removing the initial points from the computations and re-enter the remaining times and weights with the times adjusted so the first entry has time zero. If the uncertainty is acceptable, print the Report spreadsheet and include it with the certification documentation. 4. Report Worksheet
Assay Results for Permeation Device This sheet provides calibration information and assay results, including uncertainty estimates for a permeation device identified as: test data Reference: Appendix B, EPA Traceability Protocol Assay and Certification of Gaseous Calibration Standards, USEPA, 1997. Test Results Intercept (b0), slope (b1), and their confidence limits
X'X = 7 292331 Y'Y = 127.6972 95% Confidence Limits 292331 1.91E+10 df = 5 b0 lower
limit = 4.353872
(X'X)-1 = 0.396793 -6.1E-06 t(0.95, df) =
2.570578 b0 upper limit =
4.354935
-6.1E-06 1.46E-10 det(X'X) = 4.81E+10 b0 = 4.354403 b1 lower
limit = -2E-06
X'Y = 29.8946 b1 = -2E-06 b1 lower limit =
-2E-06
1234673 Error variance (Var) and variance-covariance matrix (V). b'X'Y = 127.6972 SS(model), 2df b'X'Y - sum(Y)2 / n = 0.027619 SS(regression) 1df (Y'Y - b'X'Y) = 5.38E-07 SS(residual) Var = (Y'Y - b'X'Y) / df = 1.08E-07 MS(residual), n-2 df V = Var * (X'X)-1 = 4.27E-08 -6.5451E-13 -6.5E-13 1.56725E-17
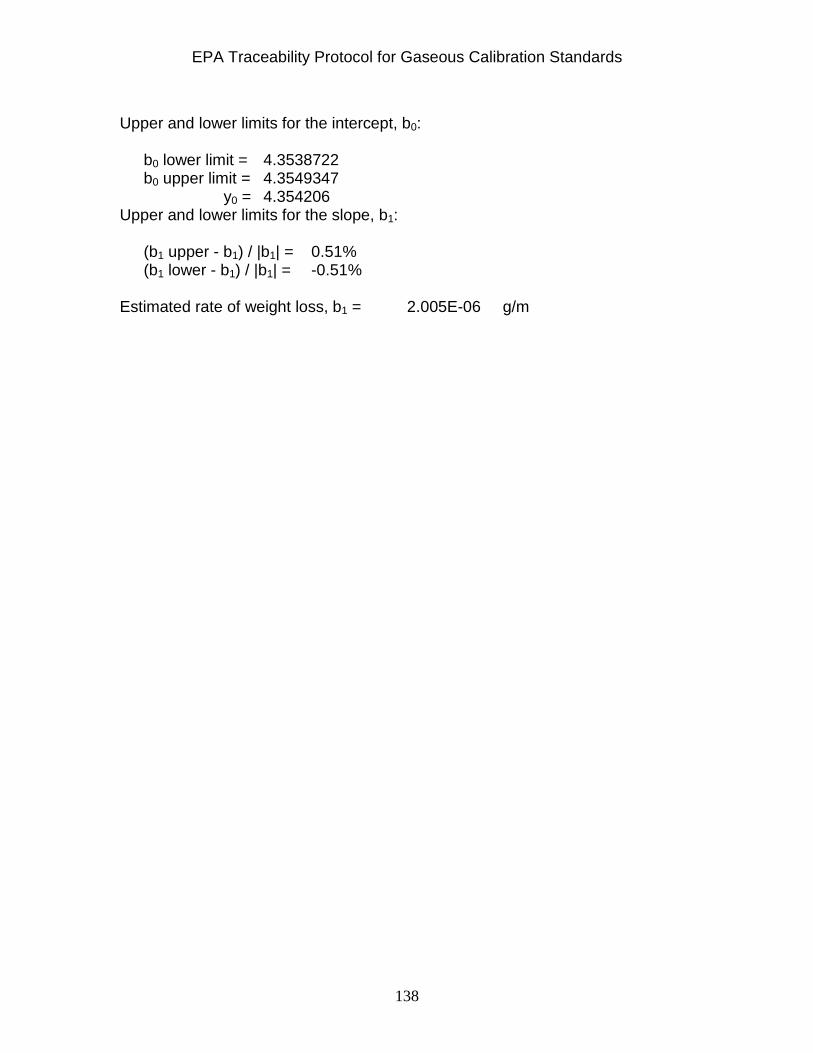
EPA Traceability Protocol for Gaseous Calibration Standards
138
Upper and lower limits for the intercept, b0: b0 lower limit = 4.3538722 b0 upper limit = 4.3549347 y0 = 4.354206 Upper and lower limits for the slope, b1: (b1 upper - b1) / |b1| = 0.51% (b1 lower - b1) / |b1| = -0.51% Estimated rate of weight loss, b1 = 2.005E-06 g/m

EPA Traceability Protocol for Gaseous Calibration Standards
139
Appendix C - Statistical Spreadsheet for Stability Determination ASSAY RESULTS In this sheet the results of two or three assays are entered. Calibration dates are entered so Assays having the same calibration uncertainty may be treated correctly. (Assays having a common calibration share the same calibration uncertainty.) Enter the results for up to three separate assays in chronological order below. ASSAY 1
500 = estimated concentration 0.10% = Expanded uncertainty (as percentage of estimated concentration)
0.5 = portion of expanded uncertainty2 due to calibration 5 = number of measurements
5/1/1997 = date of prior calibration ASSAY 2
501 = estimated concentration 0.10% = Expanded uncertainty (as percentage of estimated concentration)
0.5 = portion of expanded uncertainty2 due to calibration 3 = number of measurements
6/1/1997 = date of prior calibration ASSAY 3 (if applicable)
502 = estimated concentration 0.10% = Expanded uncertainty (as percentage of estimated concentration)
0.5 = portion of expanded uncertainty2 due to calibration 3 = number of measurements
6/8/1997 = date of prior calibration Number of different calibrations represented by the above data: N = 3 (If this value seems to be incorrect, check the dates entered for the three assays. The earliest data should be for Assay 1. Trailing spaces may cause N's formula to interpret identical dates as different.)

EPA Traceability Protocol for Gaseous Calibration Standards
140
COMPARISONS Assay 1 vs Assay 2
Two One-Sided Equivalencewith Assay 1 Variance Components
Lower Upper Lower Test Upper Test Calibration ImprecisionCalibration Assay ConfidenceConfidence Signficance Signficance Total
1 1 ---------------------- ------------------------- 0.125 0.125 0.252 2 0.644989 1.355011 TRUE TRUE 0.125501 0.125501 0.251001
"FALSE" indicates an inconsistency where the observed confidence interval of the difference is beyond the tolerance level. Assay 1 vs Assay 3
Two One-Sided Equivalencewith Assay 1 Variance Components
Lower Upper Lower Test Upper Test Calibration ImprecisionCalibration Assay ConfidenceConfidence Signficance Signficance Total
1 1 ---------------------- ------------------------- 0.125 0.125 0.253 3 1.644752 2.355248 TRUE TRUE 0.126002 0.126002 0.252004
"FALSE" indicates an inconsistency where the observed confidence interval of the difference is beyond the tolerance level. Nothing will appear here if no data have been entered for Assay 3. Assay 2 vs Assay 3
Two One-Sided Equivalencewith Assay 1 Variance Components
Lower Upper Lower Test Upper Test Calibration ImprecisionCalibration Assay ConfidenceConfidence Signficance Signficance Total
2 2 ---------------------- ------------------------- 0.125501 0.125501 0.2510013 3 0.563533 1.436467 TRUE TRUE 0.126002 0.126002 0.252004
"FALSE" indicates an inconsistency where the observed confidence interval of the difference is beyond the tolerance level. Nothing will appear here if no data have been entered for Assay 3. OVERALL ESTIMATE Note: Calibration Case = 18 (right click to see comment)
Case Cal. No.
Cal. No.
Cal. No.
4* = 1 1 --- 6* = 1 2 --- 9 = 1 1 1
12 = 1 1 2 15 = 1 2 2 18 = 1 2 3

EPA Traceability Protocol for Gaseous Calibration Standards
141
*4 and 6 are cases where there is no 3rd assay. In case 4, the two assays share a common calibration. In case 6, the two assays have different calibrations. The standard error of the estimate produced in an assay is equal to approximately ½ of the "95% uncertainty." The inverse of the square of the standard error is the (raw) weighting factor used in producing an overall estimate of the concentration. The raw weights are adjusted (Adj. Wt.) so their sum is 1.00.
Calibration
Estimate
Expanded
Uncert.
Raw Wt.
Adj. Wt.
Wt.
*Conc.
Variance of Wt. *Est.
1 500 0.100% 100000 0.333 166.667 0.02778 2 500 0.100% 100000 0.333 167.00 0.02789 3 502 0.100% 100000 0.333 167.333 0.02800
502 = overall estimate of the candidate standard's concentration 0.2892529 = expanded uncertainty (concentration units) 0.058% = expanded relative uncertainty The standard error and expanded uncertainty displayed above do not account for uncertainty in the reference standards used to calibrate the analytical instrument, or for the uncertainty due to the dilution flow rate. In the first space below, enter the expanded uncertainty (typically 2 times the standard error) of the reference standards. If different calibration standards had different uncertainties, enter the largest. Example: If NIST SRMs were used in the calibration and their certified concentrations were 100 +/- 1 ppm, 200 +/- 1 ppm, 300 +/- 2 ppm, 400 +/- 3 ppm and 500 +/- 4 ppm, then the largest 95% uncertainty is for the 100 ppm standard: 1/100 = 0.01 or 1%. (SRM uncertainties are expressed as two-sigma limits which are 95% confidence intervals.)
1.00% = Expanded uncertainty (the two-sigma uncertainty) of the reference standard
0.00% = Expanded uncertainty (the two-sigma uncertainty) of the dilution system flow rate (This only applies when the gas settings changed between the assy of the reference standard and the assay of the candidate standard are changed, otherwise it should be 0).
0.00% = Expanded uncertainty (the two-sigma uncertainty) for interference corrections when measuring multiple gases simultaneously. This must be provided by a Statistician.
1.002% =Expanded uncertainty of the candidate standard (including the contribution of the reference standard)

EPA Traceability Protocol for Gaseous Calibration Standards
142
Appendix D - Matrix Notation 1. Matrix Notation Matrix notation is used to simplify the presentation of calculations that are performed in the linear regression. A matrix is a rectangular array of numbers. Boldface capital letters represent matrices, and lower case letters with subscripts represent individual numbers in the matrices. X, below, is a 10 by 3 matrix. It has 11 rows and 3 columns. The rows are numbered 0, 1, 2,...10 and columns are numbered 0, 1, and 2. (Other texts may begin numbering with 1.)
1 1.002 1.0040 1 0.902 0.8136 1 0.802 0.6432 1 0.701 0.4914 X = 1 0.601 0.3612 1 0.501 0.2510 1 0.401 0.1608 1 0.301 0.0906 1 0.200 0.0400 1 0.100 0.0100 1 0.000 0.0000
Xi,j denotes the number that is found in the ith row and the jth column. X0,1 = 1.002. The first row and column are numbered zero. A matrix that has only one column is called a column vector, and a matrix that has only one row is called a row vector. 0.999 0.915 0.828 0.738 y = 0.644 is a column vector. 0.549 0.448 0.346 0.237 0.122 0.001 Subscripts following vector names denote the row or column of the vector. For example, y1 is the number in the second row of y, 0.915. (Remember that we begin counting rows with zero.) Matrix operations that come into play for calibration include multiplication,

EPA Traceability Protocol for Gaseous Calibration Standards
143
transposition, and inversion. The rules for these operations can be found in any introduction to matrices. We will use the following notation for these operations: X' denotes the transpose of X (the ith column of X becomes the ith row of X') For the matrices X and Y above, 1 1 1 1 . . . 1
X' = 1.002 0.902 0.802 0.701 . . . 0.000 1.0040 0.8136 0.6432 0.4914 . . . 0.0000
X'Y denotes multiplication of matrices X' and Y. X' must have the same number of columns as Y has rows. For the matrix X above,
11 5.511 3.8658 5.827 X'X = 5.511 3.8658 3.0438 and X'Y = 4.0132
3.8658 3.0438 2.5544 3.1272 det(X'X) = 1.0521 (the determinant of X'X) (X'X)-1 denotes the inverse of the product of X' and X
0.5800 -2.1962 1.7392 (X'X)-1 = -2.196 12.5026 -11.5744 1.7392 -11.5744 11.5513
2. Calibration by Linear Regression Using Matrix Notation - Example The linear regression approach is illustrated below for the simple quadratic curve. The starting point for regression analysis will be a matrix named X. This matrix will have 3 columns (one for each coefficient to be determined). The number of rows will be the same as the number of calibration measurements that are performed by the measurement system. The first column is a vector of 1s. The second column contains the certified concentrations of the calibration standards. The third column contains the squares of the values appearing in the second column. When this matrix is multiplied by the vector of coefficients [b0, b1, b2], the result is a vector of responses, so that: responsei = 1 * b0 + concentrationi * b1 + concentrationi
2 * b2 or, letting y represent response and x represent concentration, yi = b0 + b1 xi + b2 xi
2

EPA Traceability Protocol for Gaseous Calibration Standards
144
Now, we're interested in estimating the the coefficients b0, b1, and b2, and we're also interested in computing how much error is involved when we use the information to estimate the concentration in an "unknown." 3. Determining the Calibration Equation The coefficients of the calibration equation or curve are found by matrix multiplication and inversion: b = (X'X)-1 X'Y = [b0, b1, b2] Example 1 1.002 1.0040 0.999 0.9967 1 0.902 0.8136 0.915 0.9151 1 0.802 0.6432 0.828 0.8297 1 0.701 0.4914 0.738 0.7394 X =1 0.601 0.3612 y = 0.644 b'x = 0.6462 1 0.501 0.2510 0.549 0.5491 1 0.401 0.1608 0.448 0.4482 1 0.301 0.0906 0.346 0.3434 1 0.200 0.0400 0.237 0.2336 1 0.100 0.0100 0.122 0.1210 1 0.000 0.0000 0.001 0.0046 0.0046 b = 1.1837 b' = 0.0046 1.1837 -0.1932 -0.1932 The quadratic calibration curve is: response = 0.0046 + 1.1837 C + -0.1932 * C2 4. Determining the Estimation and Prediction Error One assumption that underlies the regression approach is that random error is constant across the measurement range. Sometimes it may be necessary to apply a transformation in order to achieve this characteristic, called homogeneity of variance. An estimate of this variance is obtained using matrix operations: Var = residual sum of squares / degrees of freedom = Y'Y - b'X'Y / df This estimate's "degrees of freedom" (df) is the number of calibration points less the number of coefficients estimated for the calibration equation.
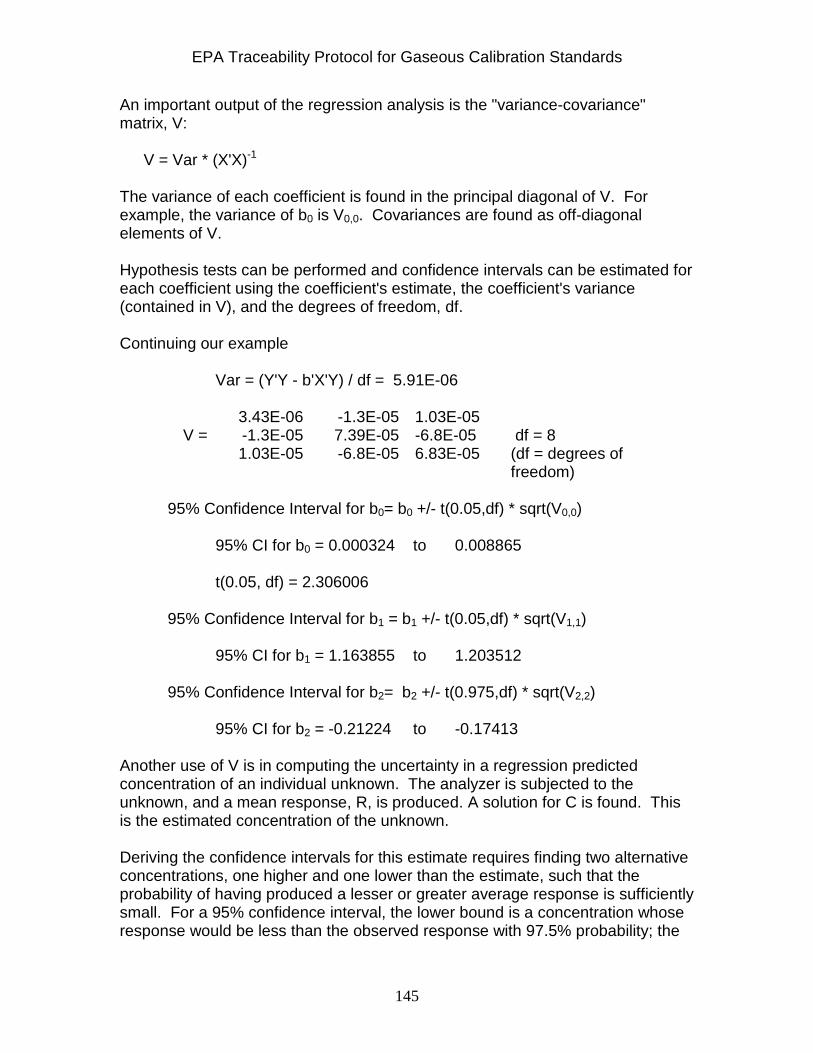
EPA Traceability Protocol for Gaseous Calibration Standards
145
An important output of the regression analysis is the "variance-covariance" matrix, V: V = Var * (X'X)-1 The variance of each coefficient is found in the principal diagonal of V. For example, the variance of b0 is V0,0. Covariances are found as off-diagonal elements of V. Hypothesis tests can be performed and confidence intervals can be estimated for each coefficient using the coefficient's estimate, the coefficient's variance (contained in V), and the degrees of freedom, df. Continuing our example Var = (Y'Y - b'X'Y) / df = 5.91E-06 3.43E-06 -1.3E-05 1.03E-05 V = -1.3E-05 7.39E-05 -6.8E-05 df = 8 1.03E-05 -6.8E-05 6.83E-05 (df = degrees of
freedom) 95% Confidence Interval for b0= b0 +/- t(0.05,df) * sqrt(V0,0) 95% CI for b0 = 0.000324 to 0.008865 t(0.05, df) = 2.306006 95% Confidence Interval for b1 = b1 +/- t(0.05,df) * sqrt(V1,1) 95% CI for b1 = 1.163855 to 1.203512 95% Confidence Interval for b2= b2 +/- t(0.975,df) * sqrt(V2,2) 95% CI for b2 = -0.21224 to -0.17413 Another use of V is in computing the uncertainty in a regression predicted concentration of an individual unknown. The analyzer is subjected to the unknown, and a mean response, R, is produced. A solution for C is found. This is the estimated concentration of the unknown. Deriving the confidence intervals for this estimate requires finding two alternative concentrations, one higher and one lower than the estimate, such that the probability of having produced a lesser or greater average response is sufficiently small. For a 95% confidence interval, the lower bound is a concentration whose response would be less than the observed response with 97.5% probability; the

EPA Traceability Protocol for Gaseous Calibration Standards
146
upper bound is a concentration whose response would be less than the observed response with 97.5% probability. Unfortunately, for quadratic curves, this derivation is not so simple. R measurements of an unknown produce an average response resp: R = 6 resp = 0.601 The estimated concentration is found by solving the following quadratic equation: 0.601 = b0 + b1 C + b2 C2 (b0 - 0.601) + b1 C + b2 C2 = 0 The potential solutions are found using the quadratic formula: C = 0.553935 and 5.573267 (only the first of these is reasonable) Now, if the concentration really had been at this value, the 95% confidence interval for the mean response of six measurements would be symmetric about the observed response:
As above, t = 2.306006 x = 1 0.553935 0.306843 = [1, resp, resp2]
xb = 0.601 (check) var(predicted mean response for x) = [var/R + x' V x]
x'V = -6.09E-07 6.97E-06 -6.7E-06 x'Vx = 1.2E-06
var/6 = 9.86E-07 var(predicted mean response for x) = 2.19E-06 95% confidence interval for predicted response = 0.597588 to 0.604412 This is the observed response -/+: 0.003412 and 0.003412 Solving for concentration, the interval is no longer perfectly symmetric: 0.550418 to 0.557456 This is the estimated concentration -/+: 0.003516 and 0.003521 As a percentage of the concentration, this is -/+: 0.006348 and 0.0063569

EPA Traceability Protocol for Gaseous Calibration Standards
147
Fortunately, even with the quadratic calibration curve, with good precision, the confidence intervals will be within a small enough region that the curve is close to linear and the interval will be very nearly symmetric. The uncertainty criterion for multipoint calibration requires the 95% confidence interval's half-width to be less than 1%. The calibrated range of the analyzer extends across all concentrations for which the criterion is satisfied. Continuing our example
Concentration
Estimated Response
95% conf. interval for response
95% conf. interval for concentration
% error for concentration
1.002 0.9967 0.9924 1.0010 0.9966 1.0074 -0.53 0.54 0.902 0.9151 0.9121 0.9181 0.8985 0.9055 -0.39 0.39 0.802 0.8297 0.8273 0.8320 0.7993 0.8047 -0.33 0.33 0.701 0.7394 0.7371 0.7417 0.6985 0.7035 -0.36 0.36 0.601 0.6462 0.6437 0.6487 0.5984 0.6036 -0.43 0.43 0.501 0.5491 0.5466 0.5517 0.4984 0.5036 -0.51 0.52 0.401 0.4482 0.4457 0.4507 0.3986 0.4034 -0.60 0.60 0.301 0.3434 0.3411 0.3457 0.2988 0.3032 -0.72 0.72 0.200 0.2336 0.2313 0.2359 0.1979 0.2021 -1.06 1.06 0.100 0.1210 0.1181 0.1240 0.0974 0.1026 -2.58 2.59 0.000 0.0046 0.0003 0.0089 -0.0036 0.0036 --- --- 0.210 0.2446 0.2423 0.2469 0.2079 0.2121 -0.9996 1.0004
The calibration curve's uncertainty is acceptable for concentrations > 0.21 ppm. 5. Stability Test using Schuirmann’s two one-sided tests (TOST) As discussed in Subsection 2.1.5.2, the stability test requires at least three initial measurements of the candidate standard plus at least three additional measurements following a period of 7 days or more. The standard's concentration must be in the well-characterized region of the analyzer per Subsection 2.1.4.2. Concentrations are estimated using the calibration curve from at least three measurements for the initial assay and at least three measurements for the second assay. Schuirmann’s two one-sided tests (TOST) will be used to test for equivalence with a acceptance criterion (i.e.,tolerance) of 1.0%. The calculation follows: Initial Assay Second Assay (after holding time) C1 C4 C2 C5 C3 ` C6

EPA Traceability Protocol for Gaseous Calibration Standards
148
n1 = number of observations in initial assay n2 = number of observations in second assay x1 = (C1 + C2 + C3) / 3 x2 = (C4 + C5 + C6) / 3 s1 = standard deviation of (C1, C2, C3) s2 = standard deviation of (C4, C5, C6) tol = acceptable level of difference between the means = 0.01 (i.e., 1.0 percent) alpha = significance level of the test = 0.05 t(1-alpha,df) = value of Student's t for which the distribution function value is 0.95 and degrees of freedom = n1+ n2 - 2 The pooled variance of the six measurements is calculated from sp
2 = [(n1-1) s12+( n2-1)]s2
2/[( n1-1)+( n2-1)] First calculate the confidence interval on the difference of means as x1- x2 +/- t(1-alpha,df)* sp*sqrt(1/ n1 + 1/ n2) Note that we are using alpha, and not the usual alpha/2, in the t-value. If this confidence limit is within the TOST acceptance region, which is calculated as x1- x2 +/-(x1+ x2)/2*(1+tol) then the null hypothesis is rejected and the two sets of results are considered equivalent. If the confidence limit is not within the TOST acceptance criterion, the stability test can be repeated after an additional 7 days or more using the second and third sets of results in the calculations, as above. If another statistical failure is found, then the candidate standard is determined to be instable and it is disqualified for further use. Example: Initial Assay Final Assay (after 7-day holding time) 0.995 ppm 0.993 ppm 0.996 ppm 0.997 ppm 0.992 ppm 0.991 ppm
n1 = 3 n2 = 3 s1 = 0.0020817 ppm x1 = 0.9943333 ppm s2 = 0.0030551 ppm x2 = 0.9936667 ppm
sp2 = 0.002614065 tol = 1.0%

EPA Traceability Protocol for Gaseous Calibration Standards
149
x1 - x2 = 0.000666667 t(1-alpha,df) = 2.131847
CI lower limit = -0.00388 CI upper limit = 0.00522
TOST lower limit = -0.00873 TOST upper limit = .0.01061
The confidence interval fits in the TOST acceptance region, so the two sets of measurements are equivalent and the candidate standard can be certified. 6. Recertification Per Subsection 2.1.11, a standard can be recertified after the certification period has elapsed, if the standard has been reassayed and the Appendix C spreadsheet indicates that the TOST acceptance criterion has been attained. To determine whether the concentration of the standard has changed since the initial certification, new measurements are made using a pollutant gas analyzer that has been calibrated according to Subsection 2.1.4.2. Original certification data are used to provide initial estimates of mean (x1) and standard deviation (s1). The recertification data are used to estimate a second mean (x2) and second standard deviation (s2). These are used in Schuirmann’s two one-sided test (TOST) to determine if the measurements are equivalent. As outlined in the previous section, for a 95% confidence level a critical value for t is based on a 90% confidence interval on the difference of the means with degrees of freedom equal to the number of initial and recertification data minus 2. A pooled estimate of the standard deviation (sp) is derived from s1 and s2. If the confidence interval is within the TOST acceptance region, then the two sets of measurements are equivalent and the standard is stable. If not, the standard cannot be recertified. Example: Original Data Recertification Data 0.995 ppm 0.989 ppm 0.996 ppm 0.990 ppm 0.992 ppm 0.994 ppm 0.999 ppm 0.999 ppm 0.993 ppm
n1 = 6 n2 = 3 s1 = 0.0029439 ppm x1 = 0.9956667 ppm s2 = 0.0026458 ppm x2 = 0.991 ppm sp = 0.002394438
ppm tol = 1%

EPA Traceability Protocol for Gaseous Calibration Standards
150
x1 - x2 = 0.00466667
t(1-alpha/2,df) = 1.894579 CI lower limit = 0.00145891 CI upper limit = 0.00787442
TOST lower limit = -0.005266 TOST upper limit = 0.014600
The confidence interval fits within the TOST acceptance region, so the standard may be recertified. The certified concentration of the standard is the grand mean of the combined data set.
Certified Concentration = mean (initial data + recertification data) = 0.994 ppm

EPA Traceability Protocol for Gaseous Calibration Standards
151
Appendix E - Statistical Spreadsheet for Procedure G3 1. ReadMe Worksheet: This worksheet is the same as the one in Appendix A 2. Zero Test Worksheet STEP 1 Enter Calibration Data Enter the calibration data in the shaded spaces below. The first column (I) simply counts the calibration points that you enter. The second column (X) is for the certified concentrations of the calibration gas standards. The third column (Y) is for the instrument responses corresponding to the calibration standards. The number of points cannot exceed 50.
i Xi Yi Color Code 1 0.0000 0.1900 2 0.0000 0.2000 red = derived value (protected) 3 0.0000 0.2100
4 1.0000 1.1400 blue = entered value (unprotected)
5 1.0000 1.1500 6 1.0000 1.1600 black = fixed text (protected) 7 2.0000 1.9900 8 2.0000 2.0000 9 2.0000 2.0100 10 3.0000 2.7400 11 3.0000 2.7500 12 3.0000 2.7600 13 4.0000 3.3900 14 4.0000 3.4000 15 4.0000 3.4100 16 5.0000 3.9400 17 5.0000 3.9500 18 5.0000 3.9600
STEP 2 Review the Parameter Estimates Review the estimates of the coefficients (b0, (b1,...) for the linear and quadratic models, their confidence, and the residual error variances (s2).
Linear Model Expanded Uncertainty Parameter Estimate Lower Upper b0 = 0.3667 0.2492 0.4841 b1 = 0.7500 0.7112 0.7888

EPA Traceability Protocol for Gaseous Calibration Standards
152
s2 = 0.0176 0.0097 0.0407 s = 0.1326 0.0987 0.2018 df = 16 t = 2.1199
Quadratic Model Expanded Uncertainty Parameter Estimate Lower Upper
b0 = 0.2000 0.2000 0.2000 b1 = 1.0000 1.0000 1.0000 b2 = -0.0500 -0.0500 -0.0500 s2 = 0.0001 0.0000 0.0002 s = 0.0089 0.0066 0.0138 df = 15 t = 2.1314 The approximate level of confidence associated with the expanded uncertainties is 95%. The corresponding intervals take the form estimate +/- t*u, where: estimate is the quantity of interest, u is its uncertainty, and t is a coverage factor. For each model, the coverage factor, t, is determined from the t-distribution with appropriate degrees of freedom (df). Note that the uncertainties are not displayed, but can easily be derived from the estimate, expanded uncertainty, and the coverage factor. Comparing the two models: F ratio = 219.69 F critical = 2.3849 (5% significance level) The quadratic model produces a significantly smaller error variance. The quadratic model appears to be the better choice. If cubic or quartic models are supported by compelling scientific theory or data, then review the following estimates for those models. Otherwise, go to Step 3.
Cubic Model Expanded Uncertainty Parameter Estimate Lower Upper
b0 = 0.2000 0.1891 0.2109 b1 = 1.0000 0.9789 1.0211 b2 = -0.0500 -0.0605 -0.0395 b3 = 0.0000 -0.0014 0.0014 s2 = 0.0001 0.0000 0.0002 s = 0.0093 0.0068 0.0146 df = 14 t = 2.1448

EPA Traceability Protocol for Gaseous Calibration Standards
153
See above notes on calculation of expanded uncertainties. Comparing quadratic and cubic models: F ratio = 0.9286 F critical = 2.5536 (5% significance level) The error variances are not significantly different at the 5% level. The quadratic model appears to be a better choice than cubic.
Quartic Model Expanded Uncertainty Parameter Estimate Lower Upper
b0 = 0.2000 0.1880 0.2120 b1 = 1.0000 0.9559 1.0441 b2 = -0.0500 -0.0921 -0.0079 b3 = 0.0000 -0.0133 0.0133 b4 = 0.0000 -0.0013 0.0013 s2 = 0.0001 0.0000 0.0002 s = 0.0096 0.0069 0.0155 df = 13 t = 2.1604
Comparing quadratic and cubic models: F ratio = 0.9286 F critical = 2.5536 (5% significance level) The error variances are not significantly different at the 5% level. The cubic model appears to be a better choice than quartic. STEP 3 Review the Charts View the charts named Curves 1 and Residuals 1. Curves 1 shows bands illustrating expanded uncertainties for the estimated regression. Compare these bands with those of the quadratic regression, Curves 2. (Note: You can change the associated approximate confidence level by changing the "p-value" in cell F4 of the worksheet named Chart Data.) Residuals 1 shows how the calibration points deviated from the calibration line. Look for a simple pattern (such as a quadratic curve) in the chart. If such a pattern appears, the quadratic model may be better. View Residual 2, the deviations from the best- fit quadratic curve. If Residual 2 effectively removes the simple pattern observed in Residual 1 and if the magnitude of the deviations has been significantly reduced (as evidenced by a reduction in the uncertainty u2), then the quadratic model is superior. An F-test can be run to determine if the two overall uncertainties of fit are significantly different.

EPA Traceability Protocol for Gaseous Calibration Standards
154
F = 219.6875 Prob. of greater F = 7.52E-15 The quadratic model produces a significantly smaller error variance. The quadratic model appears to be the better choice. If cubic or quartic models are supported by compelling scientific theory or data, then view their Curves and Residuals charts. STEP 4 Test for Zero Material on Same Day as Initial Calibration This test can only be used when using the linear or quadratic model. Enter the impurity specification for the zero air material estimation and prediction Maximum Concentration = 0.1 Maximum Response that can be measured at 95% confidence to make sure concentration is less than Maximum Concentration when Predicting Response. 0.2821 STEP 5 Test for Zero Material on Different Day from Initial Calibration This step applies to zero material tests on a different day than the initial calibration. This test can only be used when using the linear or quadratic model. Before the zero material limit is input, the measurement system is challenged with zero and span checks. Three or more discrete checks of the zero gas and three or more checks of each span gas are made. If necessary, second span should be higher concentration than the first. Enter the results below: 2 different span values need to be tested in the quadratic model
(Only Quadratic Models) Response to
Zero gas First Span
Conc. Response to Span
Second Span Conc.
Response to Span
0.2 1.000 1.150 2.000 2.000 0.21 1.000 1.160 2.000 2.010 0.22 1.000 1.170 2.000 2.020
Max. Span Calculations
n = 3 n = 3 mean = 0.210 mean = 2.010
s = 0.010 s = 0.010 Cal. Resp. = 0.200 Cal. Resp. = 2.000
s = experimental standard deviation

EPA Traceability Protocol for Gaseous Calibration Standards
155
Zero Gas Results Max. Span Gas Results
Std. Uncertainty = 0.0058 0.0058 Rrs/100 = 0.0201 0.0201 Std. Uncertainty is
OK Std. Uncertainty is
OK Relative Difference
(RD)= -0.50% 0.50% RD is OK RD is OK
RD calculations above are based on linear/quadratic model. Following successful completion of the zero and span checks, zero material limit can be predicted by the appropriate model Coefficients are not significantly different. Consider including the new data as part of original calibration (Step 1). Maximum Concentration = 0.1 Maximum Response that can be measured at 95% confidence to make sure concentration is less than Maximum Concentration when Predicting. 0.2916

EPA Traceability Protocol for Gaseous Calibration Standards
156
Appendix F - Statistical Spreadsheet for Procedure D1 1. ReadMe Worksheet INSTRUCTIONS FOR GAS DILUTION WORKBOOK The general workflow for this workbook is from right to left. The steps involved are: To be done annually: Zero Gas Annual Calibration Pollutant Annual Calibration Annual Gas Check To be done monthly: Monthly Flow Check To be done on day of use: Day of Use Organization The workbook consists of several worksheets, which are displayed as tabs at the bottom of the screen. The functions of these worksheets are described below: Read Me (this sheet) - describes the workbook, explaining how to use the
worksheets Day of Use - to be used on day of GDS use to calculate GDS settings Monthly Flow Check - to verify that GDS calibration has not shifted since
annual calibration Annual Gas Check - to be performed after annual calibration to verify that the
GDS actually produces the concentrations of diluted mixtures for both nonreactive and reactive gases that agree with theoretical concentrations
For both the Pollutant Annual Calibration and Zero Gas Annual Calibration: Calibration - allows for user input of calibration and other analytical data Curves 1 - displays the calibration data, the best-fit line, and expanded
uncertainties. Residuals 1 - displays the difference between the observed responses
and those estimated by the best-fit calibration line.

EPA Traceability Protocol for Gaseous Calibration Standards
157
Curves 2 - displays the calibration data, the best-fit quadratic curve, and expanded uncertainties.
Residuals 2 - displays the difference between the observed responses
and those estimated by the best-fit quadratic regression line.
Chart Data - includes the data used to create the Curves and Residuals charts
Pollutant and Zero Gas Annual Calibrations Background This worksheet supports linear and quadratic regression models: Linear: y = b0 + b1x+ e Quadratic: y = b0 + b1x + b2x2 + e The inputs are: x the valve setting for the corresponding gas y the measured flow rate e a random effect due to variation of influence quantities It is assumed that the valve setting standards (x) have negligible uncertainties. The output quantities are estimated parameters (bs) and related uncertainties. The workbook then helps the user perform the following functions: - determine which model (linear or quadratic) is best. Conventions The Pollutant Gas and Zero Gas Annual Calibration worksheets includes instructions that guide the user through the steps in its use. Each worksheet is also color coded to simplify use. Shaded cells that are bordered in blue text are for input of data. These cells are unprotected, but all other cells of the Calibration worksheet are protected. Derived values and statements are colored red. These cells contain formulas and are protected to prevent alteration. Spreadsheet background colors indicate the order of the polynomial supported by the calculations in the area. Light green is used for the linear model. Yellow is used for the quadratic model. Reference: EPA Traceability Protocol Assay and Certificatoin of Gaseous Calibration Standards, USEPA, 2012

EPA Traceability Protocol for Gaseous Calibration Standards
158
2. Pollutant Gas and Zero Gas Annual Calibration Worksheets STEP 1 Enter Calibration Data Enter the annual pollutant flow rate calibration data in the shaded spaced below. The first column (i) simply counts the calibration points. The second column (X) is for the pollutant flow controller settings. The third column (Y) is for the flow rate reference standard readings corresponding to these settings. The number of points cannot exceed 50.
i Xi Yi Color Code 1 78.0000 78.4529 2 70.0000 70.1984 red = derived value (protected) 3 60.0000 60.2776 blue = entered value (unprotected) 4 50.0000 50.1985 black = fixed text (protected) 5 40.0000 40.0262
STEP 2 Review the Parameter Estimates Review the estimates of the parameters (b0, b1, …) for the linear and quadratic models, their expanded uncertainties and the overall uncertainty of the fit (u2). Linear Model Expanded Uncertainty parameter estimate lower upper
b0 = -0.2914 -0.8714 0.2886 b1 = 1.0088 0.9993 1.0182 s2 = 0.0082 0.0026 0.1141 s = 0.0906 0.0513 0.3378
df = 3 t = 3.1824
Quadratic Model Expanded Uncertainty parameter estimate lower upper
b0 = -0.3069 -5.7275 5.1138 b1 = 1.0093 1.0026 1.0160 b2 = 0.0000 0.0000 0.0000 s2 = 0.0123 0.0033 0.4862 s = 0.1109 0.0574 0.6973
df = 2 t = 4.3027

EPA Traceability Protocol for Gaseous Calibration Standards
159
The approximate level of confidence associated with the expanded uncertainties is 95%. The corresponding intervals take the form estimate +/- tu, where: estimate is the quantity of interest, u is its standard uncertainty, and k is a coverage factor. For each model, the coverage factor, t, is determined from the t-distribution with appropriate degrees of freedom (df). Note that the uncertainties are not displayed, but can easily be derived from the estimate, expanded uncertainty, and the coverage factor. Comparing the two models: F ratio = 0.67 F critical = 19.1643 (5% significance level) The overall uncertainties of fit are not significantly different at the 5% level. The linear model appears to be the better choice. STEP 3 Review the Charts View the charts named Curves 1 and Residuals 1. Curves 1 shows bands illustrating expanded uncertainties for the estimated regression. Compare these bands with those of the quadratic regression, Curves 2. (Note: You can change the associated approximate confidence level by changing the "p-value" in cell F4 of the worksheet named Chart Data.) Residuals 1 shows how the calibration points deviated from the calibration line. Look for a simple pattern (such as a quadratic curve) in the chart. If such a pattern appears, the quadratic model may be better. View Residual 2, the deviations from the best- fit quadratic curve. If Residual 2 effectively removes the simple pattern observed in Residual 1 and if the magnitude of the deviations has been significantly reduced (as evidenced by a reduction in the uncertainty u2), then the quadratic model is superior. An F-test can be run to determine if the two overall uncertainties of fit are significantly different. F = 0.6667 Prob. of greater F = 0.64642 The overall uncertainties of fit are not significantly different at the 5% level. The linear model appears to be the better choice. If cubic or quartic models are supported by compelling scientific theory or data, then view their Curves and Residuals charts. 3. Annual Gas Check Worksheet This worksheet should be used for the annual nonreactive gas calibratoin check (Sec. 4.1.6.3) and the annual reactive gas calibration check (Sec. 4.1.6.4). It should only be used after filling out the Pollutant Annual Calibration worksheet and the Zero Gas Calibration Worksheet.

EPA Traceability Protocol for Gaseous Calibration Standards
160
You can only fill in the cells in: STEP 1 Concentration and Uncertainty of Reference Standard Date of annual calibrations for flow controllers 04/29/12 Fill in the certified concentration of the pollutant 50 Enter the expanded uncertainty (U) from the reference standard's certificate of analysis. This value is the coverage factor (k=2) times the combined standard uncertainty (uc). For example, absolute values are given in ppm and relative values are given in percent. Enter the value as a decimal value (e.g., 1 percent should be entered as 0.01) Expanded uncertainty of concentration of the reference standard 0.01 Is the uncertainty absolute? (yes or no) no It is necessary to answer whether or not this value is absolute or relative. STEP 2 Concentration and Uncertainty of Check Standard (Lower
Concentration)
Enter the concentration of the check standard 0.5 The check standard concentration must be at least a factor of ten less than the reference standard concentration and must fall in the well-characterized region of the calibration curve Enter the expanded uncertainty (U) from the check standard's certificate of analysis. This value is the coverage factor (k=2) time the combined standard uncertainty (uc). It is necessary to answer whether or not this is absolute or relative. For example, absolute values are given in ppm and relative values are given in percent Enter the value as a decimal value (e.g., 1 percent should be entered as 0.01) Expanded uncertainty of concentration of the check standard 0.01 Is the uncertainty absolute? (yes or no) no STEP 3 Enter Settings for Pollutant and Zero Gas Flow Controllers Select settings for the gas flow controllers that fall in the same range as were used in the annual calibrations and that produce a diluted concentration of the reference standard that is equal to the undiluted concentration of the check standard.

EPA Traceability Protocol for Gaseous Calibration Standards
161
Enter the pollutant flow controller setting 60 Enter the zero gas flow controller setting 5940 Predicted Concentration of Diluted Pollutant 0.499185 Concentration of Check Standard 0.5 Match -0.2 percent Adjust the pollutant and zero gas settings so that these two concentrations match within 1 percent. Do not proceed until the Match value is less than 1.0 percent. STEP 4 Measure Diluted Reference Standard and Undiluted Check Standard Using a previously calibrated analyzer, measure the diluted reference standard and the undiluted check standard. You must take at least 3 measurements. Diluted Reference Standard Measurements
Undiluted Check Standard Measurements
1.005 1.005 1.000 1.000 0.995 0.995 Mean of Dilution Measurements Mean of Standard Measurements 0.5 0.496 Relative Agreement between Mean Responses 0.0 percent Acceptable Relative Agreement Items shaded in light green are internal calculations Predicted pollutant flowrate Predicted zero gas flowrate 60.23422 5973.016 Pollutant valve relative uncertainty Zero gas valve relative uncertainty 0.001504 0.002996 Reference std concentration Check std concentration 50 0.5 Predicted diluted concentration Relative concentration difference 0.499185 -0.16 %

EPA Traceability Protocol for Gaseous Calibration Standards
162
Relative uncertainty of reference std Relative uncertainty of check std 0.01 0.01 Mean response for reference std Mean response for check std 1.000 1.000 Std deviation of RS responses Std deviation of CS responses 0.005 0.005 Relative combined std uncertainty for std concs, flow rates, and anal responses 0.016163 Margin of error for confidence 0.03 Lower limit for diluted conc Upper limit for diluted conc. 0.39 0.60 1 1 indicates diluted conc in range, 0 indicates it is not 4. Monthly Flow Check Worksheet This worksheet should only be used after filling out the Annual Gas Calibration Check worksheet It is only valid within one year of 04/29/12 You can only fill in the cells in: Date of Monthly Flow Check 04/30/12 STEP 1 Enter Flow Rate Uncertainties of Flow Rate Reference Standard Enter expanded uncertainties (U) for both pollutant gas and zero gas flow rate reference standards Pollutant Gas Zero Gas 0.01 0.01 STEP 2 Enter Flow Controller Settings Enter flow controller setting within range of the annual calibration for both pollutant gas and zero gas Pollutant Zero Gas 60 5940

EPA Traceability Protocol for Gaseous Calibration Standards
163
Predicted pollutant flow rate Predicted zero gas flow rate 60.23422 5973.016 STEP 3 Measure Flow Rate Enter the flow rates measured by the flow rate reference standard Pollutant Zero Gas 60 5940 Pollutant Passed Zero Gas Passed Items shaded in light green are internal calculations Predicted pollutant flow rate Predicted zero gas flow rate 60.23422 5973.016 PG flow rate RS relative uncertainty ZG flow rate RS relative uncertainty 0.005 0.005 PG flow rate relative standard ZG flow rate relative standard uncertainty from calibration uncertainty from calibration 0.001504 0.002996 PG flow rate relative ZG flow rate relative combined std uncertainty combined std uncertainty 0.005221 0.005829 Pollutant gas flow rate Zero gas flow rate acceptance criterion acceptance * 1.231344 129.3639 5. Day-of-Use Worksheet This worksheet should only be used after filling out the Monthly Flow Check worksheet It is only valid within one month of 04/30/12 You can only fill in the cells in: STEP 1 Enter Pollutant Gas Concentration and Expanded Uncertainty Enter pollutant gas concentration Pollutant Gas Concentration 50

EPA Traceability Protocol for Gaseous Calibration Standards
164
Enter the relative expanded uncertainty (U/conc) from the reference standard's certificate of analysis. This value is the coverage factor (k=2) times the combined standard uncertainty (uc). Enter the value as a decimal value (e.g., 1 percent should be entered as 0.01) Relative Expanded Uncertainty for Pollutant Gas Concentration 0.01 STEP 2 Enter Desired Flow Rates for Pollutant and Zero Gas Enter the desired flow rates for both the pollutant and zero gas to achieve your target dilution and obtain the proper flow controller settings to achieve these flow rates. Pollutant Gas Flow Rate Zero Gas Flow Rate 60 5940 Pollutant Gas Flow Controller Setting Zero Gas Flow Controller Setting 59.76781 5906.997 STEP 3 Resulting Diluted Concentration of Pollutant and Expanded Relative
Uncertainty Diluted Pollutant Gas Concentration Relative Expanded Uncertainty 0.5 0.018599 Items shaded in light green are internal calculations Relative std uncertainty of PG Relative std uncertainty of ZG flow rate reference std flow rate reference std 0.005 0.005 Pollutant flow rate setting Zero gas flow rate setting 59.76781 5906.997 Pollutant flow rate relative std Zero gas flow rate relative std uncertainty from calibration uncertainty from calibration 0.001516 0.00303 Pollutant gas flow rate relative Zero gas flow rate relative combined std uncertainty combined std uncertainty 0.005225 0.005846 Diluted pollutant gas concentration Relative combined std uncertainty for diluted concentration 0.5 0.009299


Offi ce of Research and Development (8101R)Washington, DC 20460
Offi cial BusinessPenalty for Private Use$300
PRESORTED STANDARDPOSTAGE & FEES PAID
EPAPERMIT NO. G-35


![Traceability for Sustainable Trade - UNECE · Traceability for Sustainable Trade] ECE/TRADE/429 2 . 1.2 The Purpose of the Traceability Framework . Current traceability systems are](https://static.fdocuments.in/doc/165x107/5e8a3f92a86eb50a5f7cd6db/traceability-for-sustainable-trade-unece-traceability-for-sustainable-trade-ecetrade429.jpg)


![A Survey on Usage Scenarios for Requirements Traceability ... · traceability support that suits practical needs [21]. With traceability practice, we mean the way in which traceability](https://static.fdocuments.in/doc/165x107/5ecd70c9403ddd79964b64ed/a-survey-on-usage-scenarios-for-requirements-traceability-traceability-support.jpg)