Do we have a climate for change insights about adaptation planning actions in coastal new england

1
EPA NEW ENGLAND REGIONAL
CLIMATE ADAPTATION PLAN
EPA Publication Number 100K14001H
JUNE 10, 2014
2
Disclaimer
To the extent this document mentions or discusses statutory or regulatory authority, it does so for informational purposes only. This document does not substitute for those statutes or regulations, and readers should consult the statutes or regulations to learn what they require. Neither this document, nor any part of it, is itself a rule or a regulation. Thus, it cannot change or impose legally binding requirements on EPA, States, the public, or the regulated community. Further, any expressed intention, suggestion or recommendation does not impose any legally binding requirements on EPA, States, tribes, the public, or the regulated community. Agency decision makers remain free to exercise their discretion in choosing to implement the actions described in this Plan. Such implementation is contingent upon availability of resources and is subject to change.

3
Preface
The U.S. Environmental Protection Agency (EPA) is committed to identifying and responding to the challenges that a changing climate poses to human health and the environment.
Scientific evidence demonstrates that the climate is changing at an increasingly rapid rate, outside the range to which society has adapted in the past. These changes can pose significant challenges to the EPA’s ability to fulfill its mission. The EPA must adapt to climate change if it is to continue fulfilling its statutory, regulatory and programmatic requirements. The Agency is therefore anticipating and planning for future changes in climate to ensure it continues to fulfill its mission of protecting human health and the environment even as the climate changes.
In February 2013, the EPA released its draft Climate Change Adaptation Plan to the public for review and comment. The plan relies on peer-reviewed scientific information and expert judgment to identify vulnerabilities to EPA’s mission and goals from climate change. The plan also presents 10 priority actions that EPA will take to ensure that its programs, policies, rules, and operations will remain effective under future climatic conditions. The priority placed on mainstreaming climate adaptation within EPA complements efforts to encourage and mainstream adaptation planning across the entire federal government.
Following completion of the draft Climate Change Adaptation Plan, each EPA National Environmental Program Office, all 10 Regional Offices, and several National Support Offices developed a Climate Adaptation Implementation Plan to provide more detail on how it will carry out the work called for in the agency-wide plan. Each Implementation Plan articulates how the office will integrate climate adaptation into its planning and work in a manner consistent and compatible with its goals and objectives.
Taken together, the Implementation Plans demonstrate how the EPA will attain the 10 agency-wide priorities presented in the Climate Change Adaptation Plan. A central element of all of EPA’s plans is to build and strengthen its adaptive capacity and work with its partners to build capacity in states, tribes, and local communities. EPA will empower its staff and partners by increasing their awareness of ways that climate change may affect their ability to implement effective programs, and by providing them with the necessary data, information, and tools to integrate climate adaptation into their work.
Each Program and Regional Office’s Implementation Plan contains an initial assessment of the implications of climate change for the organization’s goals and objectives. These “program vulnerability assessments” are living documents that will be updated as needed to account for new knowledge, data, and scientific evidence about the impacts of climate change on EPA’s mission. The plan then identifies specific priority actions that the office will take to begin addressing its vulnerabilities and mainstreaming climate change adaptation into its activities. Criteria for the selection of priorities are discussed. An emphasis is placed on protecting the most vulnerable people and places, on supporting the development of adaptive capacity in the tribes, and on identifying clear steps for ongoing collaboration with tribal governments.
Because EPA’s Programs and Regions and partners will be learning by experience as they mainstream climate adaptation planning into their activities, it will be essential to evaluate their efforts in order to understand how well different approaches work and how they can be improved. Each Implementation Plan therefore includes a discussion of how the organization will regularly evaluate the effectiveness of its adaptation efforts and make adjustments where necessary.
4
The set of Implementation Plans are a sign of EPA’s leadership and commitment to help build the nation’s adaptive capacity that is so vital to the goal of protecting human health and the environment. Working with its partners, the Agency will help promote a healthy and prosperous nation that is resilient to a changing climate.
Bob Perciasepe Deputy Administrator
September 2013

5

6
G
Prepared by the EPA New England Regional Adaptation Plan Workgroup
Workgroup Members:
Office of Ecosystem Protection: Dave Conroy, Chief, Air Programs Branch Mel Coté, Manager, Ocean and Coastal Protection Unit Cynthia Greene, Manager Energy and Climate Unit Lisa Grogan-McCulloch, Energy and Climate Unit Ken Moraff, Deputy Office Director Alison Rogers, Oceans and Coastal Protection Unit, ORISE Fellow1
Jessica Hing, Air Permits, Toxic, Indoor Programs Unit, Schools Marybeth Smuts, Air Permits, Toxic, Indoor Programs Unit Public Health/Indoor Air Michael Stover, Indian Program Manager Norman Willard, Energy and Climate Unit1
Steve Winnett, Water Quality Branch Shutsu Wong, Energy and Climate Unit
Office of Environmental Stewardship Roy Crystal, Assistance and Pollution Prevention Joanna Jerison, Chief Superfund Legal Unit Rob Koethe, Toxics and Pesticides Unit Thomas D’Avanzo, Director Assistance and Pollution Prevention
Office of Site Remediation and Restoration Sherry Banks, Emergency Response and Removal II Elsbeth Hearn, Emergency Response and Removal I Ginny Lombardo, Federal Facilities John Podgurski, Response & Removal II Branch
Office of Regional Counsel Tim Williamson, Office of Regional Counsel, air Mark Stein, Office of Regional Counsel, water
Office of Administration and Resource Management Alice Kaufman, Manager Facilities Unit
Office of Environmental Measurement and Evaluation Greg Hellyer, Ecosystem Assessment Unit Alan Van Arsdale, Ecosystem Assessment Unit
Office of the Regional Administrator Emily Zimmerman, Communications Amy Braz, Environmental Justice1
Kathleen Nagle, Children’s Health Kristen Conroy, Children’s Health Rosemary Monahan, Smartgrowth
1No longer employed or working at the US EPA as of June 2014.

7
Table of Contents List of Figures ........................................................................................................................................................ 9
List of Tables ......................................................................................................................................................... 9
I. REGIONAL CLIMATE CHANGE ADAPTATION (RCAP) EXECUTIVE SUMMARY......... 12
II. EXISTING AND FORECASTED CONDITIONS .................................................................... 15
III. VULNERABILITY ASSESSMENT ........................................................................................... 23
GOAL 1: Taking Action on Climate Change and Improving Air Quality ................................................................. 24 A. Overview of Potential Climate Change Impacts ............................................................................................ 24 B. Program-Specific Vulnerabilities .................................................................................................................... 24
Ozone (O3) and Nitrogen Oxides (NOx) .............................................................................................................. 24 Particulate Matter (PM) ..................................................................................................................................... 24 Indoor Air ........................................................................................................................................................... 25 Mercury .............................................................................................................................................................. 25
C. Enforcement and Compliance ....................................................................................................................... 25
GOAL 2: Protecting America’s Waters ................................................................................................................. 25 Cross-Program Water Management .................................................................................................................. 25
A. Overview of Potential Climate Change Impacts ............................................................................................ 26 B. Program-Specific Vulnerabilities .................................................................................................................... 27
Water Quality Standards .................................................................................................................................... 27 Monitoring, Assessing, and Reporting ............................................................................................................... 27 Total Maximum Daily Loads ............................................................................................................................... 28 National Pollutant Discharge Elimination System .............................................................................................. 29 Nonpoint Source Management .......................................................................................................................... 29 Wetlands ............................................................................................................................................................ 30 Ocean Dumping and Dredging ........................................................................................................................... 31 National Estuary Program .................................................................................................................................. 31 Drinking Water, Wastewater, and Stormwater Infrastructure .......................................................................... 31 Drinking Water Quality....................................................................................................................................... 32
C. Enforcement and Compliance ....................................................................................................................... 32
GOAL 3: Cleaning up Communities and Advancing Sustainable Development ..................................................... 33 A. Overview of Potential Climate Change Impacts ............................................................................................ 33 B. Program-Specific Vulnerabilities .................................................................................................................... 35
Longer-term Cleanups (e.g., Superfund Remedial, Superfund Removal, RCRA Corrective Action, TSCA) ......... 35 Emergency Response Program........................................................................................................................... 36 RCRA Hazardous Waste Management Facilities ................................................................................................ 37 Oil Program and Underground Storage Tanks ................................................................................................... 38
C. Enforcement and Compliance ....................................................................................................................... 39
GOAL 4: Ensuring the Safety of Chemicals and Preventing Pollution ................................................................... 39 A. Pesticides ....................................................................................................................................................... 39 B. Enforcement, Compliance and Pollution Prevention .................................................................................... 40
Enforcement....................................................................................................................................................... 40 Pollution Prevention .......................................................................................................................................... 40

8
Facilities and Operations ..................................................................................................................................... 40 A. Overview of Potential Climate Change Impacts ............................................................................................ 41 B. Facility-Specific Vulnerabilities ...................................................................................................................... 41
Tribal and Vulnerable Populations ...................................................................................................................... 42 A. Air................................................................................................................................................................... 45 B. Water ............................................................................................................................................................. 46 C. Waste and Pesticides ..................................................................................................................................... 47
Cross-Cutting Vulnerabilities ............................................................................................................................... 47 A. Energy ............................................................................................................................................................ 47 B. Communications ............................................................................................................................................ 48
IV. PRIORITY ACTIONS ................................................................................................................. 49
GOAL 1 ................................................................................................................................................................ 49
GOAL 2 ................................................................................................................................................................ 50
GOAL 3 ................................................................................................................................................................ 54
GOAL 4 ................................................................................................................................................................ 55
FACILITIES AND OPERATIONS .............................................................................................................................. 55
TRIBAL AND VULNERABLE POPULATIONS ............................................................................................................ 56
CROSS CUTTING ACTIONS .................................................................................................................................... 56
COMMUNICATIONS ............................................................................................................................................. 56
V. MEASUREMENT AND EVALUATION....................................................................................... 57
REFERENCES............................................................................................................................................ 1

9
List of Figures
Figure 1: Route 107 Stockbridge, VT, August 29, 2011............................................................................... 12 Figure 2: Daily Peak PM2.5 Air Quality Index ............................................................................................... 12 Figure 3: Projected New Hampshire Summers ........................................................................................... 15Figure 4: Extreme Heat in Boston ............................................................................................................... 16Figure 5: Percentage Change in Very Heavy Precipitation ......................................................................... 17Figure 6: Projected 100-Year Flood Zone in Boston ................................................................................... 19 Figure 7: New England Tribes...................................................................................................................... 44
List of Tables Table 1: Summary of State Adaptation Planning Efforts ............................................................................ 23
10
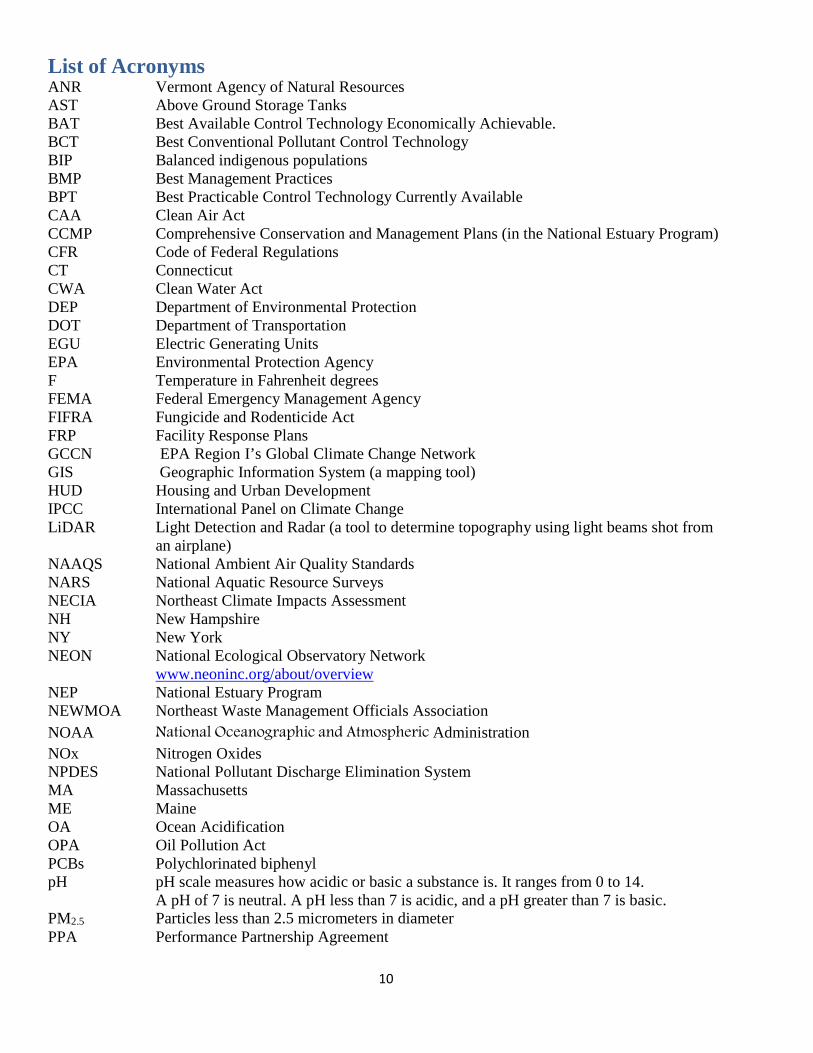
List of Acronyms ANR Vermont Agency of Natural Resources AST Above Ground Storage Tanks BAT Best Available Control Technology Economically Achievable. BCT Best Conventional Pollutant Control Technology BIP Balanced indigenous populations BMP Best Management Practices BPT Best Practicable Control Technology Currently Available CAA Clean Air Act CCMP Comprehensive Conservation and Management Plans (in the National Estuary Program) CFR Code of Federal Regulations CT Connecticut CWA Clean Water Act DEP Department of Environmental Protection DOT Department of Transportation EGU Electric Generating Units EPA Environmental Protection Agency F Temperature in Fahrenheit degrees FEMA Federal Emergency Management Agency FIFRA Fungicide and Rodenticide Act FRP Facility Response Plans GCCN EPA Region I’s Global Climate Change Network GIS Geographic Information System (a mapping tool) HUD Housing and Urban Development IPCC International Panel on Climate Change LiDAR Light Detection and Radar (a tool to determine topography using light beams shot from
an airplane) NAAQS National Ambient Air Quality Standards NARS National Aquatic Resource Surveys NECIA Northeast Climate Impacts Assessment NH New Hampshire NY New York NEON National Ecological Observatory Network
www.neoninc.org/about/overview NEP National Estuary Program NEWMOA Northeast Waste Management Officials Association NOAA National Oceanographic and Atmospheric Administration NOx Nitrogen Oxides NPDES National Pollutant Discharge Elimination System MA Massachusetts ME Maine OA Ocean Acidification OPA Oil Pollution Act PCBs Polychlorinated biphenyl pH pH scale measures how acidic or basic a substance is. It ranges from 0 to 14.
A pH of 7 is neutral. A pH less than 7 is acidic, and a pH greater than 7 is basic. PM2.5 Particles less than 2.5 micrometers in diameter PPA Performance Partnership Agreement

11
PPG Performance Partnership Grants RCRA Resource Conservation and Recovery Act RI Rhode Island SDWA Safe Drinking Water Act SO2 Sulfur dioxide SPCC Spill Prevention and Control Countermeasures SUPERFUND Superfund is the federal government's program to clean up the nation's uncontrolled
hazardous waste sites TITAN Threshold Indicator Taxa Analysis TMDL Total Maximum Daily Load TSCA Toxic Substance Control Act UNH EPSCoR University of New Hampshire Experiment Program to Stimulate Competitive Research
(EPSCoR) www.epscor.unh.edu/whats-epscor USACE United States Army Corps of Engineers USDA United States Department of Agriculture USG Unhealthy for Sensitive Groups USGS United States Geological Service USGCRP United States Global Climate Research Program is a Federal program that coordinates
and integrates global change research across 13 government agencies to ensure that it most effectively and efficiently serves the Nation and the world. USGCRP was mandated by Congress in 1990. http://www.globalchange.gov/home
UST Underground Storage Tanks VOC Volatile Organic Compounds VT Vermont WARNs Water and Wastewater Agency Response Networks

12
I. Regional Climate Change Adaptation (RCAP) Executive Summary Climate change and its associated impacts to air, water and waste systems are challenging EPA’s mission of protecting the environment and public health. One impact, increasing extreme precipitation1, has already taken a large toll on New England’s environment. In August 2011, tropical storm Irene dumped three to five inches of rain throughout Vermont over two days, with many areas receiving more than seven inches. Extensive flooding caused millions of dollars of damage to infrastructure. Wells and public water systems were submerged and contaminated with chemicals and pathogens, degrading safe drinking water supplies.2
Figure 1: Route 107 Stockbridge, VT, August 29, 20113
Two months later in 2011, an unseasonably early October snowstorm dumped one to two and a half feet of snow, felled trees and resulted in significant power outages across the New England region. As shown in Figure 2, increased usage of local generators and wood stoves in response to the loss of power led to unhealthy ambient air conditions particularly for sensitive groups.4
For over 40 years, EPA New England has been protecting the region’s environment and public health through the implementation of air, water and waste programs. EPA New England has been working on climate mitigation, greenhouse
gas reduction strategies since 2000 and has had a multi-media Global Climate Change Network that has educated EPA staff and worked on climate mitigation and adaptation since 2009.
In 2009, President Obama established an Interagency Climate Change Task Force. He called on that task force to develop recommendations for adapting to climate change with the goal of promoting a healthy and prosperous nation resilient to climate change. The Task Force’s 2010 report recommended that every Federal Agency develop a Climate Change Adaptation Plan. EPA’s national Climate Adaptation Plan was developed and released for public comment on February 8, 2013. In 2011, EPA’s Administrator Lisa Jackson asked that all EPA regional and program offices develop climate adaptation plans to detail how we will carry out the work in the agency-wide plan, taking into account the impacts on EPA’s regional mission and operations. In September 2012, EPA New England convened 30 employees knowledgeable in their media programs and asked them to assess the risks and impacts of climate change that are and will be pertinent to the region’s mission and
Figure 2: Daily Peak PM2.5 Air Quality Index5

13
responsibilities, and to develop a plan of action to address these risks and impacts within the region.
This draft regional climate adaptation plan outlines existing conditions in New England and how we will incorporate the challenges of climate change into our programs and operations. Based on global, regional and state specific scientific research and modeling projections, EPA New England staff determined the vulnerabilities for our programs and facilities and identified priority actions for both the chronic and episodic impacts of climate change.
The major chronic impacts reviewed include: • Heat – Since 1970 the average annual temperature rose 2°F and the average winter temperature
4°F.6• Extreme Precipitation – Over the past 50 plus years the Northeast has seen a 71% increase in the
amount of precipitation falling in very heavy events (defined as the heaviest 1% of all daily events).7
• Sea Level Rise - Global sea levels are projected to rise 12 to 48 inches by 2100, depending inlarge part on the extent to which the Greenland and West Antarctic Ice Sheets experience significant melting.8
The episodic impacts include: • Flooding - In August 2011, tropical storm Irene hit New England. In Vermont alone, recovering
from the widespread damage and destruction is expected to cost between $700 million and $1 billion dollars.9
• Ocean Storm Surge – In October 2012, Super Storm Sandy caused a storm surge of 9.2 ft. in NYCity10 . The coastal areas of CT and RI were also significantly affected. According to The Boston Harbor Association report, if the storm had hit Boston 5.5 hours earlier on the high tide it would have caused a 5 foot storm surge that would have flooded 6.6% of Boston.11
For this plan, regional programs were reviewed and the vulnerabilities of these programs to one or more of the above impacts were determined. For example, an increase in heat could increase the number of unhealthy ozone days.12 Priority actions to address the vulnerabilities were then drafted. Over 100 actions were identified. Each priority action was evaluated based on its ability to reduce risk, whether the action would protect a critical asset, whether it would be easy to implement (i.e., whether it would be “low-hanging fruit”), whether it would leverage other larger efforts, EPA’s unique role and capacity, the time frame to accomplish and the funding needed.
The final section of the plan lays out how these actions will be incorporated into the region’s existing programs and how we will measure our progress. For instance, the Agency works with the states and tribes on an annual basis to determine activities that EPA will fund. We will work with the states and tribes to incorporate climate adaptation into those activities. Additionally, the Region has a Global Climate Change Network (GCCN) made up of staff and managers from every office in the Region and each year the GCCN develops a strategy for activities it expects to accomplish for both climate change mitigation and adaptation. The priority actions identified in this plan will be incorporated into the GCCN strategy on an annual basis.
In order to gather stakeholder input, we have held ten webinars with the air, water and waste interstate organizations whose members come from the six New England states air, water and waste environmental agencies, New England nongovernmental organizations, the New England Environmental Business

14
Council, tribal leaders, tribal environmental managers and tribal historic preservation officers. All of their input has been incorporated into this plan.
EPA New England will continue to evaluate the science and impacts of climate change and will update the vulnerabilities and priority actions for our programs in order to reduce risk to New England’s health and environment.

15
II. Existing and Forecasted ConditionsForecasted Climate Change Impacts in New England of Concern for EPA’s Regional Mission and Operation
New England is well known for its varying seasons, rocky coastline, extensive beaches, and mix of both urban and rural settings. Over the last several decades, New England has experienced noticeable changes in its climate. New England is and will be uniquely impacted by climate change due to its population distribution, geography, seasons and weather patterns. Below is a summary of existing conditions and forecasts for New England climate change impacts. As indicated by the references, a key source of existing and forecasted information is taken from the 2009 publication by the United State Global Climate Research Program (USGCRP), Global Climate Change Impacts in the United States13 as well as from the 2014 publication Northeast Chapter of Climate Change Impacts in the United States: The Third National Climate Assessment14. . Where appropriate, we have also included information used by New England States when considering climate change impacts within their respective states.
Population Distribution in New England
Figure 3: Projected New Hampshire Summers21
New England has a population of over 14 million, with a large portion of the population located along a coast that spans approximately 6,100 miles. From 1960 to 2008, Maine and New Hampshire had the highest increase in the share of population in coastline counties.15 From 2010 to 2030, New England’s population is projected to increase by eight percent.16
Demographics
Figure taken from Global Climate Change Impactsin the United States.19
According to the Census, the population in the nation is aging and New England has a larger proportion of the elderly and baby boomers (14.4%) than the rest of the nation (13%).17 Four of New England’s six states are more densely populated than the nation’s average.18 Rhode Island and Massachusetts are the second and third most densely populated states with 91% of its population in urban areas; and Connecticut is fourth with as much as 88% of its population in urban areas.19

16
Increases in Air Temperature
Since 1970, the average annual temperature in the Northeast has risen by 2°F and the average winter temperature has increased by 4°F.20 This trend is projected to continue. As shown in Figure 3, by 2100 New Hampshire's summers could be as warm as North Carolina's summers are today.21
As shown in Figure 4, over the same period, Boston is projected to experience an increase in the number of days reaching 100°F - from an average of one day per year between 1961 and 1990 to as many as 24 days per year by 2100.22 Under a higher emissions scenario identified by the Intergovernmental Panel on Climate Change (IPCC), Hartford, CT could see as many as 30 days per year with temperatures reaching 100°F.23 These rising temperatures have potential impacts on public health, ranging from heat-related stress to infectious diseases. This is further explained in Public Health Impacts below.
General warming is expected, in New England. However, the Houlton Band of Maliseets, a federally-recognized tribe on the Meduxnekeag River in Maine, cite a reference that suggests that a narrow strip along the eastern Maine coast may not experience a general warming trend. The reference states that in the past “twice daily tidal mixing of the Gulf of Maine brought deep, cold water to the surface, and southwesterly current along the coast brought cool temperatures, often accompanied by fog.” The reference states that this effect may continue into the future for
Figure 4: Extreme Heat in Boston22
Figure taken from Global Climate Change Impacts in the United States.20
this small geographic area.24 This supposition was not included in the recently published Northeast Chapter of Climate Change Impacts in the United States: The Third National Climate Assessment.25
Seasonal Shift
Increased air temperatures have already resulted in shifts in the seasonal patterns in New England and that trend is projected to continue. When there is an extended warm period in either late winter or early spring, premature leaf-out or bloom can occur. If this is followed by a frost event, damage to plants can occur. This occurred in 2007 and in 2012 in the northeast, when apple and other fruit crops were hard hit.26
In the winter, more precipitation is falling as rain rather than snow, and as a result, there is a reduced snowpack.27 A 2011 Vermont Agency of Natural Resources group of publications noted that the timing and form of precipitation affects the quantities of water stored in surface waters and aquifers, potentially affecting the availability of water for human use.28 The publications also state that in the spring, the ice on lakes and rivers melts earlier, resulting in earlier peak river flows. The publications forecast that, combined with reduced snowpack, earlier snow melt is anticipated to lead to an increase in frequency of summer droughts.29 In addition, both the Commonwealth of Massachusetts and Vermont note that the duration, timing, and frequency of seasonal precipitation and flooding are changing, resulting in impacts on the hydrologic cycle and aquatic habitats and the organisms that depend on them, including migratory fish and aquatic insects.30, 31 In Vermont, they are concerned that summer low flows from increased drought frequency may also reduce aquatic habitats and make them more isolated, and that lower flows may lead to higher water temperatures, reducing the amounts of dissolved oxygen. Lastly, Vermont

17
notes that all of these changes have the potential to shift prevalent fish species and reduce cold-water fish populations, potentially allowing new species to gain competitive advantages.32
In a Climate Change Adaptation White Paper Series, Vermont stated that a changing climate may cause species to shift their distribution on the landscape to follow the presence of preferred or essential habitats.33 In this paper, Vermont identified the invasion of Asian long-horned beetle as well as woolly adelgid while Maine has seen Asian shore crab and Eurasian water milfoil.34 Wooly adelgid is an insect that is native to Japan that threatens Eastern Hemlock trees.35
Changes in Precipitation Patterns
Warmer temperatures increase the rate of evaporation of water into the atmosphere, in effect increasing the atmosphere's capacity to "hold" water.36 Increased evaporation may dry out some areas and increase precipitation in other areas. In fact, drought and increasing heavy precipitation are not mutually exclusive and may even happen in the same locations. While winter precipitation is projected to increase along with temperature, little change is projected for summer rainfall.37 Combined with greater evaporation from higher temperatures and earlier winter and spring snowmelt, the summer and fall drought risk for the Northeast is projected to increase.38 At the same time, in the Northeast, heavy precipitation events have increased more dramatically over the past 60 years than in the rest of the country. As shown in Figure 5, in the northeast, the amount of precipitation falling in very heavy precipitation events from 1958 to 2011 has increased by 71%.39 This increasing trend is projected to
Figure 5: Percentage Change in Very Heavy Precipitation39
The map shows percent increase in the amount of precipitation falling in very heavy events (defined as the heaviest 1% of all daily events) from 1958 to 2011
37
for each region.
Figure taken from Climate Change Impacts in the United States:The Third National Climate Assessment.37
continue into the future. The Commonwealth of Massachusetts projects that rainfall during the wettest five days of each year will increase 10% by mid-century and by 20% by 2100.40
Sea Level Rise
Since 1900, sea level in the Northeast has risen by approximately 12 inches.41 Global sea levels are projected to rise 12 to 48 inches by 2100, depending in large part on the extent to which the Greenland and West Antarctic Ice Sheets experience significant melting.42 Sea level rise along most of the coastal Northeast is expected to exceed the global average rise due to local land subsidence, with the possibility of even greater regional sea level rise if the Gulf Stream weakens as some models suggest.43 Two New England States -- New Hampshire and Massachusetts -- cite a 2008 study by Pfeffer, J. T. et al44 that includes the contribution to sea level rise from the melting of the Greenland and West Antarctic ice sheets that suggests that sea levels could rise as much as 79 inches by 2100.45 The City of Boston projects that the Boston’s sea level rise will range from 24 to 72 inches by the end of the century, depending on how quickly the ice in Greenland and Antarctica melt.46
18
In June of 2012, a USGS study stated that between 1950-1979 and 1980-2009, sea levels between Cape Hatteras and Boston rose approximately three to four times faster than the global average.47 Taking subsidence at a rate of six inches per century into account, the state of Rhode Island Coastal Resources Management Council has begun to plan for a 36 to 60 inch sea level rise by 2100 and they have codified their projection in state regulations.48 Other states, such as Massachusetts, also cite subsidence as a potential factor influencing the magnitude of local sea level rise.49
Increased Flooding and Storm Surges
In the past 50 years, there has been an increase in flooding in New England, both in coastal and inland areas threatening manmade and natural infrastructure. New England’s industrial development in the 19th
century was along its rivers where the water could be used as a source of energy. Many of these facilities still exist today and are vulnerable to river flooding. Between 1955 and 1999, floods accounted for $16.97 million in damage annually in Vermont alone.50 In 2011, tropical storm Irene dumped three to five inches of rain throughout the state over two days, with many areas receiving more than seven inches.51 The extensive flooding caused millions of dollars of damage to Vermont’s infrastructure including damage to 500 miles of road and 200 bridges. The cost of rebuilding this infrastructure is estimated to be up to 250 million.52 Wells and public water systems were submerged and contaminated with chemicals and pathogens, thereby affecting safe drinking water supplies.53 A state-wide drinking water advisory was issued to warn citizens of the possibility of harmful chemicals or bacteria in their flooded wells. Approximately 30 public water systems issued “boil water” notices, affecting approximately 16,590 people. Seventeen municipal wastewater treatment facilities also reported compromised operations54and private water supply wells were also affected. The Vermont Department of Health distributed over 3,000 free bacterial sample kits for homeowners to test their wells. Of the test kits returned to the Department for testing, 37% were positive for total coliform (of the 37, 8% were positive for E.coli). Lastly, hazardous waste spills increased by a factor of fourteen during the first week after tropical storm Irene.55 Projecting forward, Vermont anticipates the increasing probability of high- flow events could be as high as 80%.56
Coastal flooding is also an issue for New England. It is expected that the combination of a projected increase in heavy precipitation and sea level rise will lead to more frequent, damaging floods in the Northeast.57 Less winter precipitation falling as snow and more as rain will also increase the number and impact of flooding events as the frozen ground is unable to absorb the winter rain. Sea level rise, storm surges, hurricanes, erosion, and the destruction of important coastal ecosystems will likely contribute to an increase in coastal flooding events, including the frequency of current "100-year flood" levels (severe flood levels with a one-in-100 likelihood of occurring in any given year). Figure 6 shows the current Federal Emergency Management Agency 100-year flood zone (hatched darker blue) as well as the extent of the projected 100-year flood zone in 2100 (lighter blue) for the waterfront/Government Center area of Boston under a “higher-greenhouse gas emissions scenario” used by the Northeast Climate Impacts Assessment (NECIA) in a report titled Climate Change in the U.S. Northeast.58 What is now considered a once in a 100-year coastal flood in Boston is expected to occur, on average, as frequently as every two to three years by mid-century and once every other year by late-century – under either emissions scenario identified by NECIA. Cumulative damage to buildings and building contents, as well as the associated emergency costs, could potentially be as high as $94 billion between 2000 and 2100 in Boston, depending on the sea level rise scenario and which adaptive actions are taken.59

19
Figure 6: Projected 100-Year Flood Zone in Boston58
Figure taken from Confronting Climate Change in the U.S. Northeast: Science, Impacts, and Solutions.59
Increase in Fresh and Ocean Water Temperature and Acidification
In addition to changes in the level of the sea, the physical and chemical properties of the ocean are changing. As the air temperature warms, it warms the ocean. Globally, sea surface temperatures have been higher during the past three decades than at any other time since reliable observations began in 1880.60 Warmer fresh and salt waters hold less dissolved oxygen making “hypoxia”2 more likely, fostering harmful algal blooms, and changing the toxicity of some pollutants.61
The pH level of seawater has decreased significantly since 1750, and is projected to drop much more dramatically by the end of the century if carbon dioxide (CO2) concentrations continue to increase as the oceans absorb this CO2.62 According to the 2011 Massachusetts’ Climate Change Adaptation Report, pH levels are projected to decrease by 0.1- 0.3 by 2100, making the ocean more acidic.63 As EPA stated in the draft National Water Program 2012 Strategy: Response to Climate Change,64 scientific research over the last 10 years indicates serious implications of ocean acidification for ocean and coastal marine ecosystems. In its 2010 report, Ocean Acidification: A National Strategy to Meet the Challenges of a Changing Ocean, the National Research Council65 concludes that ocean chemistry is changing at an unprecedented rate due to human-made CO2 emissions. The report also states that “while the ultimate
2 Hypoxia occurs when dissolved oxygen declines to the point where aquatic species can no longer survive

20
consequences are still unknown, there is a risk of ecosystem changes that threaten coral reefs, fisheries, protected species, and other natural resources of value to society.” Of particular concern in New England is the threat that acidification has for shellfish populations, especially soft shelled clams, and research on this issue is underway in Maine and elsewhere.
Public Health Impacts
Extreme heat events can and have impacted human health. A three-day heat wave (temperatures reaching triple digits on two days) in Chicago in 1995 led to nearly 700 heat-related deaths.66 The possibility of similar heat waves are increasingly likely in New England as projections for the number of days per year over 100°F grow (see Figure 4). In September 2010, Maine experienced a heat wave in which many schools closed due to excessive heat and the fact that schools do not have air conditioning. During this heat wave, the National Weather Service issued an advisory warning that “the high heat and humidity combined with the long duration of the current heat wave would make conditions uncomfortable and potentially dangerous especially in hot buildings without air conditioning or proper ventilation.”67 Since the hottest days in the Northeast are often associated with high concentrations of ground-level ozone and other pollutants, the combination of heat stress and poor air quality can pose a health risk to vulnerable groups: young children, the elderly, and those with pre-existing health conditions including asthma.68
The combination of warmer temperatures and extreme weather events encourages the spread of infectious diseases in new areas and affects many aspects of human health.69 Changes in vector-borne diseases are already being seen in the Northeast with Spotted Fever Rickettsiosis, a tick borne infection, reported in 4 of the 6 states. Babesiosis, or animal malaria also carried by ticks may threaten the blood supply. This newly reportable disease has been growing in the northeast and is now reported in every New England state.70
Suitable habitat for the Asian Tiger Mosquito, which can transmit West Nile and other vector-borne diseases, is expected to increase in the Northeast from the current 5% to 16% in the next two decades and from 43% to 49% by the end of the century, exposing more than 30 million people to the threat of dense infestations by this species.71
Over the last 10 summers from 2004 through 2013, New England has averaged 30 days per year with unhealthy air for the current ozone standard of 75 parts per billion. In New England, high ozone levels usually occur between 1:00 and 7:00 pm on hot days from May through September.72 Hot days are particularly conducive to ground-level ozone formation, and air conditioning loads on such days are often a major contributor to electricity demand spikes. At the same time, some EGUs called “peaking units” only operate during periods of peak demand when the electric grid requires maximum generating capacity, and could be high-emitting sources of nitrogen oxide (NOx) emissions, which are a key contributor to ground-level ozone formation. Peaking units might lack NOx controls because they have low emissions on a seasonal basis, even if hourly NOx emissions are high during periods when they are in use.73 Thus, it is expected that with an increase in the number of days with high temperatures, New England will see increases in ozone on those days.
Built Environment-Housing and Indoor Air
In the United States, citizens spend over 90% of their time inside with an estimated 70% of that time spent in their homes. The US Census’s American Housing Survey in 2009 reported that nearly 6 million housing units have moderate to severe physical infrastructure problems.74 The National Center for Healthy Homes citing this Census study states that the most common problems in American housing are water leaks from the outside (11%) and inside (8%), roofing problems (6%) and damaged walls (5%). According to the Census’s American Community Survey Summary from 2007-2011, only 14% of the

21
homes in the nation were built before 1939. In New England 28% of the homes were built before 1939.75
These older homes were built prior to many of the new construction codes and may be more susceptible to structural problems. In addition, the northeast has a higher percentage of multi-family structures; 63% of family homes in the northeast are single family homes, as opposed to 83% in the United States as a whole.76 New England housing units also rely more on the use of fuel oil or kerosene. In New Hampshire, Vermont and Maine over 50% rely on these fuels for heating vs. only 7% in the entire nation.77 These fuels are delivered by fuel trucks and those deliveries could be disrupted by severe weather events. All of these factors combined indicate that New Englanders are potentially exposed to more indoor pollutants than those in other parts of the US.
Adaptation Planning Underway in New England
Because of the susceptibility of New England to climate change impacts, New England federal, regional, state agencies, and non-government organizations have already begun addressing this issue. New England states in particular have been out in front of the nation in planning for both climate mitigation and adaptation. Table 1 summarizes the adaptation efforts of the New England states, and the adaptation activities are expanded upon below:
• In 2005, the Governor’s Steering Committee on Climate Change for Connecticut produced a Climate Change Action Plan focusing on greenhouse gas emissions. In 2010, the Adaptation Subcommittee of the Governor’s Steering Committee produced a report “The Impacts of Climate Change on Connecticut Agriculture, Infrastructure, Natural Resources and Public Health,” detailing the potential impacts of climate change. In 2011, this subcommittee produced a draft report addressing adaptation strategies in light of identified impacts, “Connecticut Climate Change Preparedness Plan.” This report was finalized in July 2013. In January, 2014, the Institute for Community Resiliency and Climate Adaptation was created in Connecticut. The Institute is a collaboration between the University of Connecticut, the state Department of Energy and Environmental Protection, and the National Oceanic and Atmospheric Administration.
• In Maine, Governor LePage recently created a workgroup entitled “Environment and Energy Resources Work Group” which consists of state agencies focused on transportation, energy, fisheries and wildlife, forestry, agriculture and marine resources. The cross-agency effort is aimed at discussing mechanisms for cross agency partnerships, information sharing, efficiencies and streamlining. These efforts will provide specific and identifiable tools to assist decision- makers in preparing for climate change78.
• In 2008, Massachusetts’ Global Warming Solutions Act led to the establishment of a Climate Change Adaptation Advisory Committee that produced a report on adaptation strategies in light of predicted climate changes for the state. The report, published in 2012, provided conclusions and recommendations by the committee regarding anticipated climate change and future adaptation strategies. In addition, the report provides sector-specific impacts and adaptation strategies.
• In December 2007, Governor Lynch of New Hampshire established a Climate Change Policy Task Force, charging the group with the development of a Climate Action Plan for New Hampshire. The report was published in March 2009. The final report focused on greenhouse gas emissions reductions to address climate change but also identified anticipated future impacts of climate change on various sectors: agriculture, forestry and waste, electric generation, transportation and land use.

22
• In 2010, Rhode Island’s Climate Change Commission was established through the state’s Climate Risk Reduction Act. In November 2012, a progress report was produced; summarizing key climate risks and vulnerabilities to those risks, identifies existing climate change adaptation initiatives, and highlights the areas that have yet to be addressed. In addition, in Section 145 “Climate Change and Sea Level Rise” of Rhode Island’s Coastal Resources Management Program, Rhode Island has codified in regulation that future policies, plans, and regulations proactively plan for and adapt to climate change and sea level rise.79 In addition, the University of Rhode Island and other collaborators recently launched a website designed to inform the public about climate change and to help prepare for the changes.80
• From 2010 to 2012, Vermont’s Agency of Natural Resources (Vermont ANR) developed a series of sector-based white papers as part of an initial education effort. Sectors included: agriculture, water resources, recreation, forestry, public health, public safety, fish and wildlife, and transportation. Vermont ANR expects to have a vulnerability assessment and adaptation strategy for Vermont lakes, rivers, forests, and wetlands, including those natural communities and the organisms that inhabit them in 2013.

23
Table 1: Summary of State Adaptation Planning Efforts State Summary of Adaptation Effort Connecticut Final Adaptation Plan Complete (Climate Change Preparedness Plan, 2011:
http://www.ct.gov/deep/lib/deep/climatechange/connecticut_climate_preparedness _plan_2011.pdf. The Impacts of Climate Change on Connecticut Agriculture, Infrastructure, Natural Resources and Public Health, 2010: http://www.ct.gov/deep/lib/deep/climatechange/impactsofclimatechange.pdf.
Maine Summary of climate change adaptation work is available at http://www.maine.gov/dep/sustainability.
Massachusetts Initial Adaptation Plan Complete (Climate Change Adaptation Report, 2011: http://www.mass.gov/eea/air-water-climate-change/climate-change
New Hampshire
Initial Adaptation Planning Process Underway (Climate Action Plan, 2009: http://des.nh.gov/organization/divisions/air/tsb/tps/climate/action_plan/documents /nhcap_final.pdf)
Rhode Island Initial Adaptation Planning Process Complete (Adapting to Climate Change in the Ocean State, 2012: http://www.rilin.state.ri.us/Reports/Climate%20Change%20Commission%20Prog %20Report%20Final%2011%2015%2012%20final%202.pdf)
Vermont Initial Adaptation Planning Process Underway (Vermont Climate Change White Papers, 2010-2012: http://www.anr.state.vt.us/anr/climatechange/Adaptation.html)
In addition to state activity related to adaptation, there are adaptation planning activities occurring at the municipal level as well. For example, Boston, MA; Cambridge, MA; Portland, ME; Scarborough-Old Orchard Beach, ME; and several communities in New Hampshire and the Metropolitan Area Planning Council, a regional planning agency that serves over one hundred cities and town in Metropolitan Boston, are all engaged in adaptation planning.81 In 2011, EPA New England, in coordination with the Institute for Sustainable Communities, launched the New England Municipal Sustainability Network (NEMSN), which fosters peer to peer communication between municipal sustainability practitioners across the region on key priorities including climate change adaptation. In December of 2011 the NEMSN sponsored climate adaptation training for themselves. At the federal level, in 2010, the New England Federal Partners Climate Workgroup was formed and it includes 17 federal agencies and their staff including National Oceanographic and Atmospheric Administration (NOAA), EPA, Federal Emergency Management Agency (FEMA), United States Geological Service (USGS), United States Army Corps of Engineers (USACE) and Department of Interior (DOI) who are working and coordinating on climate change adaptation and mitigation activities.
III. Vulnerability Assessment This section contains a preliminary assessment of the vulnerabilities of key EPA New England programs to the impacts of climate change. It builds on the work presented in Part 2 of EPA’s agency-wide Plan,82
and is structured by the goals in EPA’s FY 2011-2015 Strategic Plan.83 These vulnerabilities were identified by the EPA New England Adaptation Planning Workgroup. Note that EPA New England has not conducted a quantitative vulnerability assessment, but has qualitatively evaluated the nature and magnitude of risks associated with climate change impacts. This assessment is based on best professional judgment within EPA at this time and may change in the future as our understanding of climate science evolves.

24
GOAL 1: Taking Action on Climate Change and Improving Air Quality
A. Overview of Potential Climate Change Impacts
Communities within New England face public health and environmental challenges from ambient and indoor air pollution. Climate change will increase these challenges. EPA New England partners with federal, state, tribal and local agencies to protect public health and the environment by directly implementing programs that address air quality (indoor and outdoor), toxic pollutants, climate change, energy efficiency, pollution prevention, industrial and mobile source pollution, radon, acid rain, stratospheric ozone depletion, and radiation protection. Several program areas are vulnerable to future climate conditions that may be characterized by elevated baseline temperatures, increased frequency and duration of heat waves, more extreme swings in weather conditions (drought and precipitation events), and more severe hurricanes and coastal storms. These future conditions will present challenges to EPA to achieve its core mission.
B. Program-Specific Vulnerabilities
Ozone (O3) and Nitrogen Oxides (NOx) New England has made progress in attaining the National Ambient Air Quality Standards (NAAQS) for the current ozone standard of 75 parts per billion, but problem areas remain in southern New England. 84, 85Although there are continuing NOx and volatile organic compound (VOC) emission reductions from ongoing control strategies for on-road and non-road mobile sources and fossil-fueled fired power plants, future climate conditions may make it more difficult to attain the NAAQS for ozone.
Impacts on O3 and NOx programs: • Volatile organic compound emissions from biogenic sources such as trees should increase due to
increased temperatures.86
• NOx emissions from fossil-fuel burning power plants, operating during peak electricity demand periods, may increase with increased temperatures.87
• The rate of ozone production in the atmosphere should increase with increased temperatures.88
• Additional O3 production and inter-regional transport due to prolonged heat waves, stagnation and increases in upwind emissions. 89
• The length of the ozone monitoring season may be extended into early spring and late fall.90
Particulate Matter (PM) Similarly, New England has made progress in attaining and maintaining the NAAQS for PM2.5.
Impacts on PM program: • There is the potential to see increases in certain air pollutants from power plants (e.g., sulfur
dioxide [SO2], particulate matter less than 2.5 micrometers in diameter [PM2.5], etc.) during peak electricity demand due to increased regional temperatures. These increases may contribute to local air quality problems. 91
• As seen during prolonged power outages from the October 2011 snow storm, PM2.5 violations from local increases in PM2.5 due to the use of backup electricity (e.g., generators) and heat (e.g., wood stoves, fireplaces) sources because of increased extreme weather events and resulting power outages.
• PM2.5 violations from local increases in PM2.5 may occur due to the uncontrolled burning of storm debris after intense weather events.

25
Indoor Air Impacts on indoor air program:
• Extreme weather conditions associated with climate change may lead to breakdowns in building envelopes, causing the flooding of indoor spaces. Dampness and water intrusion create conditions favorable to fungi and bacteria (including mold). This can also cause building materials to decay or corrode, which can lead to off-gassing of chemicals.92
Mercury Impacts on mercury program:
• Mercury in soils and vegetation, such as boreal peat, may be emitted with increased wildfires adding to the global atmospheric reservoir. 93Mercury deposition in New England waters and subsequent mercury contamination of fish and wildlife may continue and possibly increase with the increase in extreme precipitation events. 94, 95
• Precipitation events will incorporate a fraction of this global pool in rain and snow, thus contributing to mercury pollution in the region. Therefore, local and regional efforts to achieve water quality loading thresholds (Total Maximum Daily Loads, TMDLs) may be more difficult to achieve.
C. Enforcement and Compliance
Region 1 conducts both Clean Air Act (CAA) enforcement and compliance assistance to the regulated community on meeting EPA air quality regulations. Increasing resource demands as a result of climate change impacts could put additional strain on the use of declining resources for these Enforcement/Compliance activities.
Impacts on enforcement and compliance programs: • Increased power plant peaking demand could increase the likelihood of emergency generators
being used to meet the peak demand due to increased temperatures and higher mean summer temperatures.
• There may be an increased burden on compliance and enforcement staff to respond to an increased number of industry inquiries for regulatory interpretations and CAA applicability determinations to ensure consistent application of regulatory requirements across the country.
• Major storm or heat events could result in an increased number of requests for temporary waivers from regulatory requirements, including requirements for gasoline and diesel fuels.
GOAL 2: Protecting America’s Waters Cross-Program Water Management While considerable progress has been made since the enactment of the Clean Water Act and the Safe Drinking Water Act, America’s waters continue to be threatened by pollutants including excess nutrient loadings, stormwater runoff, invasive species and drinking-water contaminants. EPA works with states and tribes to develop nutrient limits and to restore and protect the quality of the nation’s streams, rivers, lakes, bays, oceans and aquifers. EPA also uses its authority to address urban rivers; to ensure safe drinking water; and to reduce pollution from nonpoint and industrial dischargers. 96
At EPA New England, protection of regional waters occurs through eleven programs: 1. Water Quality Standards; 2. Monitoring,
26
3. Assessing and Reporting; 4. Total Maximum Daily Loads (TMDLs); 5. National Pollutant Discharge Elimination System (NPDES); 6. Nonpoint Source Management; 7. Wetlands; 8. Dredging/Ocean Dumping; 9. National Estuary Program; 10. Drinking Water, Wastewater, and Stormwater Infrastructure; and 11. Drinking Water Quality.
A. Overview of Potential Climate Change Impacts
In March 2012, EPA published the draft 2012 National Water Program Climate Change Strategy97 which describes the following impacts to water resources.
• Increases in water pollution due to warmer air and water temperatures and changes in precipitation patterns, causing an increase in the number of waters categorized as “impaired,” with associated impacts on human health and aquatic ecosystems.
• Impacts on water infrastructure and aquatic systems due to more extreme weather events, including heavier precipitation and tropical and inland storms.
• Changes to the availability of drinking water supplies due to increased frequency, severity and duration of drought, changing patterns of precipitation and snowmelt, increased evaporation, and aquifer saltwater intrusion, affecting public water supply, agriculture, industry, and energy production uses.
• Waterbody boundary movement and displacement as rising sea levels alter ocean and estuarine shorelines and as changes in water flow, precipitation, and evaporation affect the size of wetlands and lakes.
• Changing aquatic biology due to warmer water and changing flows, resulting in deterioration of aquatic ecosystem health in some areas.
• Collective impacts on coastal areas resulting from a combination of sea level rise, increased damage from floods and storms, coastal erosion, salt water intrusion to drinking water supplies, and increasing temperature and acidification of the oceans.
• Indirect impacts due to unintended consequences of human response to climate change, such as those resulting from carbon sequestration and other greenhouse gas reduction strategies.
In New England, EPA has identified additional impacts that include: • Flooding from increasingly frequent and intense rain events as well as intense tropical storms will
tax aging infrastructure, including combined sewer systems, wastewater and drinking water facilities and adversely impact water quality.
• Dense coastal development and shoreline armoring with sea walls and other hardening structures will prevent wetland migration and lead to loss of wetlands as the sea level rises.
• Increases in the extent of storm surge and coastal flooding will cause erosion and property damage to the densely populated coasts.
• Sea level rise may increase saltwater intrusion to coastal freshwater aquifers, resulting in water resources that are unusable without desalination. Increased evaporation or reduced recharge into coastal aquifers exacerbates saltwater intrusion.

27
• Sea level rise will lead to direct and indirect losses for the region’s energy infrastructure (e.g., power plants and located along the coast, marine facilities that receive oil and gas deliveries), including equipment damage from flooding or erosion. Damaged energy facilities also may be a source of pollution.
• Aquatic ecosystem species composition and distribution will change due to sea level rise, increased water temperatures, salinity distribution and ocean circulation, changes in precipitation and fresh water runoff, and acidification. This will also result in potential for new or increased prevalence of invasive species.
B. Program-Specific Vulnerabilities
Water Quality Standards Water Quality Standards are the foundation of the Clean Water Act – they designate the goals and uses for water bodies, setting criteria to protect those uses, and establishing provisions to protect water bodies from pollutants. States, territories, and authorized tribes establish water quality standards, and EPA reviews and approves those standards.
Impacts on Water Quality Standards Program: • Salinity changes may create a need to reclassify some water bodies from fresh to salt water. • Recreation and shell fishing season onset and duration may change. • Some water quality standards may become unattainable due to changing conditions (e.g., warmer
water, drier conditions, less snowpack). • The relative contribution of snowmelt vs. groundwater flow to stream flow could change,
affecting stream temperature regimes and biological conditions. • Some designated uses and their associated criteria may need to be removed or changed
based on monitored changes (e.g., intermittent streams may be dry for longer periods of time in summer and no longer support certain aquatic life forms).
• Some standards (i.e., pollutant-specific goals) may need to change to reflect more sensitive environmental conditions.
Monitoring, Assessing, and Reporting Our nation's waters are monitored by state, federal, and local agencies, universities, dischargers, and volunteers. Water quality data are used to characterize waters, identify trends over time, identify emerging problems, determine whether pollution control programs are working, help to direct pollution control efforts to where they are most needed, and respond to emergencies such as floods and spills.
Impacts on Monitoring Program: • Current location of monitors may no longer be appropriate in order to effectively monitor and
assess changes and to provide access to the monitors (e.g. sea level rise, precipitation, temperatures, stratification).
• Current detection protocols, criteria, monitoring and analysis may not be sufficient to detect ocean acidification and/or salinity.
• Current timing of monitoring may not be sufficient in order to pick up seasonal shifts and the full range of climate vulnerability, especially for recreational and aquatic life uses.
• The current number of monitors used may not be sufficient to assess an increased number of 303(d) impairment listings due to the increased stresses.
• Stream ecosystems will be affected directly, indirectly, and through interactions with other stressors. Biological responses to these changes include altered community composition,

28
interactions, and functions. Effects will vary regionally and present biomonitoring challenges for water-quality agencies that assess the status and health of ecosystems.
• With more rapidly changing conditions, more monitoring may be required to adequately assess the condition of waterbodies.
Total Maximum Daily Loads Under section 303(d) of the Clean Water Act, states, territories, and authorized tribes are required to develop lists of impaired waters. These are waters that are too polluted or otherwise degraded to meet the water quality standards set by states, territories, or authorized tribes. The law requires that these jurisdictions establish priority rankings for waters on the lists and develop a Total Maximum Daily Load, or TMDL. A TMDL is a calculation of the maximum amount of a pollutant that a waterbody can receive and still safely meet water quality standards.
Impacts on TMDL Program: Over the past decade, EPA Region 1’s cross-program effort to address stormwater-related water quality impairments has provided valuable experience in how to develop and implement TMDLs that address multiple environmental stressors resulting from various flow regimes. For example, impervious surfaces in urban environments deliver a mix of pollutants and increased flow to rivers and streams resulting in soil erosion, stream bank scouring, deposition of sediment and nutrients increases in receiving waters. The increasing amount of impervious surfaces in urban areas causes less precipitation to infiltrate into the ground, which may cause streams to experience much lower base flows during dry conditions, along with low dissolved oxygen, increased eutrophication, and higher stream temperatures. Flashy streamflow conditions (i.e., rapid increases in streamflow and velocity in response to rainfall, followed by rapid recovery to pre-storm conditions) related to excessive stormwater runoff and corresponding droughts are anticipated to become even more frequent and/or intense in response to further climate change.
Stormwater TMDLs now being implemented effectively on a sub-watershed basis involve the use of surrogates for the mix of pollutants in stormwater (i.e., impervious cover, or flow). Innovative and flexible approaches to TMDL development like this show promise for addressing the complex challenges of climate change. For instance, under the surrogate approach, TMDL end-points are tied to aquatic life use protections in State water quality standards, which provide environmental protection based on whatever the current conditions happen to be (rather than future projections based on past conditions). The technical basis for aquatic life use-based TMDLs is derived from significant investments over the past 35 years developing state ambient biological monitoring programs in our Region. Bioassessments (using ambient assemblages of macroinvertebrates, fish, or algae that integrate the effects of multiple stressors over time), in concert with physical and chemical monitoring data, now support the water quality assessment of aquatic life use attainment for these surrogate TMDLs, and provide clear environmental indicators of stream health under whatever the existing conditions are.
Summary of anticipated water quality programmatic climate change vulnerabilities includes: • Challenges in quantitatively demonstrating how implementation of current stormwater BMPs
(occurring primarily through permitting programs), and NPS BMPs, will address future changes in climate;
• TMDLs may need to be revised in the future as monitoring shows that TMDL target attainment isn't leading to designated uses being met;
• Increased need for efforts to support local and state partners in additional local land use planning, stormwater and wastewater TMDL implementation actions needed to achieve the TMDL endpoints (water quality standards);

29
• Increased need for resources at federal, state, and local levels to address these challenges.
National Pollutant Discharge Elimination System Water pollution degrades surface waters making them unsafe for existing uses, including drinking water, fishing, swimming, and other water recreation. As authorized by the Clean Water Act, the National Pollutant Discharge Elimination System (NPDES) permit program controls water pollution by regulating point sources that discharge pollutants into waters of the United States. NPDES permits have a five year permitting cycle.
Impacts on the NPDES program: • Increased need to respond to requests for assistance from municipalities regarding stormwater
management implementation and financing methods. • Current thermal discharge limits may not sufficiently account for increasing temperatures of the
influent and receiving waters. • The assemblage of aquatic organisms residing or transiting a particular receiving water may
change due to water temperature increases. • Entrainment of different fish species and greater numbers of organisms could occur at power
plant and industrial water intakes due to changes in local communities of organisms as a result of habitat changes from increased water temperatures and increased cooling water demand.
• Increased extreme precipitation and stormwater runoff will cause an increase in erosion and sedimentation in receiving waters.
• Reduced flows in streams, especially during summer months, will likely not dilute wastewater treatment plant and other facility effluents as they do now.
• Water quality standards and BAT/BPT/BCT (Best Available Control Technology Economically Achievable / Best Practicable Control Technology Currently Available / Best Conventional Pollutant Control Technology) technology-based limitations may not account for site-specific effects of:
o changing ambient loading of metals and chemicals from acid deposition, leaching of contaminated groundwater into discharge infrastructure or movement of pollutants resulting from flooding, extreme precipitation and atmospheric exchange,
o increasing difficulty of meeting permit requirements due to growing frequency of extreme precipitation events, storm surge and sea level rise,
o changes in discharge toxicity of specific pollutants (such as ammonia), cumulative effects of pollutants and persistence of certain pollutants due to changing ambient surface water and air temperatures.
• A facility’s climate change mitigation or adaptation measures may not conform to BAT/BPT/BCT technology-based limitations.
• More compliance issues in impaired watersheds for NPDES and SDW programs.
Nonpoint Source Management Nonpoint source pollution comes from many diffuse sources and is caused by rainfall and snowmelt runoff that picks up natural and human made pollutants and deposits them in lakes, rivers, wetlands, coastal waters and ground water. State nonpoint source programs, developed under the Clean Water Act (CWA) Section 319 Program, are working to meet this challenge.
Impacts on the Nonpoint Source Management Program: • Accounting for greater quantities of runoff and pollutant effluents, with more variability, from
both urban and suburban stormwater and agricultural sources.

30
• Increasing heavy precipitation days and more concentration of runoff in intense storms is likely to be more damaging to aquatic habitats, and carry more erosion-related pollutants into water bodies.
• Extended drought conditions that may cause inadequate stream flows and further stress aquatic systems, including the vegetation that is used in riparian areas and in management practices to filter, treat, and infiltrate effluent flows (e.g. best management practice [BMP] utility may need to be reevaluated under future conditions).
• More restoration and protection challenges for watershed protection and NPS programs.
Wetlands Section 404 of the Clean Water Act requires EPA to concur with permits issued by the U.S. Army Corps of Engineers to allow dredging or filling of wetlands. Wetlands function to protect ecosystems, streams and other aquatic resources. Wetlands provide four crucial functions for helping to make the Nation more resilient in response to climate change:
• Coastal protection in the face of sea level rise and increased hurricane intensity, including the ability to reduce wave energy;
• Protecting Water Supplies in the face of increased drought conditions by providing groundwater recharge and maintaining minimum stream flows;
• Flood mitigation in the face of increased precipitation and storm frequency in the northeastern United States. The capacity of wetlands and headwater streams to reduce flood peaks, detain stormwater, and filter pollutants is critical to the protection of life, property, and water quality;
• Wetlands can serve to sequester carbon.
Impacts on wetlands program (coastal and inland wetlands): • Wetland migration due to sea level rise that inundate or submerge the wetlands. • Variability in salinity levels, caused by drought, sea level rise, and increased precipitation and
changes in the plant and animal species that inhabit the wetlands as well as potential impacts on endangered species and/or critical habitats.
• Increased sedimentation and nutrient loading, with increased precipitation potentially changing wetland characteristics and structures.
• Drying out of seasonal wetlands with increased drought, which may also potentially change wetland characteristics.
• Changes in soil dynamics may also affect wetland characteristics, such as hydrology, size, and sediment types.
• Physical damage or elimination of wetlands and dune structures that protect them due to hurricanes and other seasonal changes.
• Changes in temperature and rainfall patterns can affect the nature and distribution of inland wetlands. Decreased precipitation and increased temperatures (greater evaporation and less frequent flooding), can result in loss of vernal pools and shallow emergent wetland. These changes can affect the plant and animal species that inhabit the wetlands and may cause potential impacts on endangered species and/or critical habitats. Sea level rise may submerge/inundate wetlands, potentially changing wetland characteristics (e.g. designation from fresh to saltwater wetland).
• Sea level rise and increased storm activity will increase erosion of salt marshes. For coastal marshes, if sea levels rise at a rate that exceeds the accumulation of substrate (marsh sediments) the coastal wetlands will break down due to inundation, erosion and intrusion by salt water.

31
Ocean Dumping and Dredging The Ocean Dumping and Dredged Materials Management programs established by Congress in 1972, prohibits ocean dumping of materials that would unreasonably degrade or endanger human health or the marine environment.
Impacts on the Ocean Dumping and Dredging program: • Increase need and frequency for dredging due to increased precipitation intensity, and severe
storms that may cause erosion and sedimentation of streams, rivers, and harbors. • Earlier sedimentation due to shorter winters and earlier snowmelts. • Shifting sediments and forming of shoals in harbors that impede safe navigation and may require
emergency dredging. • Need for dredged materials to protect shorelines, beaches, dunes and marshes from sea level rise.
National Estuary Program The National Estuary Program (NEP) was established in 1987 to restore and protect the physical, chemical, and biological integrity of “estuaries of national significance” by focusing our Clean Water Act authorities in these highly productive ecosystems. There are 28 NEPs across the country, six of which are entirely or partially within EPA New England. The NEPs promote technical transfer of information, expertise, and best management practices to accelerate and embellish implementation of “core” Clean Water Act programs. Lessons learned by the NEPs are shared across the network of 28 programs nationally, as well as with other coastal watersheds facing similar water pollution and water quality impairments. This approach has proven to be a success over the past 25 years and the NEP is seen as a model for other comprehensive watershed and community-based programs.
Impacts on the NEP Program: • Biological communities are vulnerable to sea level rise, warming ocean temperatures,
acidification, and increased sedimentation and erosion caused by extreme precipitation events as well as other impacts described in other water programs above.
Drinking Water, Wastewater, and Stormwater Infrastructure The Clean Water Act and the Safe Drinking Water Act are the two primary federal laws that protect water quality and specifically drinking water quality. Both laws include provisions that authorize EPA to award annual grants to states to help capitalize their State Revolving Fund (SRF) programs, which support construction and maintenance of wastewater, stormwater, and drinking water treatment and conveyance infrastructure. The following are some of the most significant threats to water infrastructure posed by climate change.
Impacts on Drinking Water, Wastewater and Stormwater Infrastructure Programs: • Damage to infrastructure due to increases in flooding from extreme precipitation, storm surges,
loss of wetlands, and sea level rise. • Source water intake changes may be needed due to droughts and summertime extreme heat. • Coastal infrastructure may be impacted by sea level rise. • Pathogen growth may be fostered due to warmer waters and may test the reliability of drinking
water disinfection. • Additional pollutant loadings of nutrients, pesticides, and other chemicals may challenge drinking
water treatment. • Fresh water supplies for all uses, particularly drinking water, may be at risk in coastal areas with
sea level rise.

32
• Coastal aquifers may experience salt water intrusion where withdrawals are outstripping recharge and increased pressure head from higher sea levels may worsen this problem.
• Community drinking water intakes may end up in brackish waters as the salt front migrates up coastal rivers and streams.
• There may be an impairment of ability to treat wastewater or provide drinking water in the aftermath of extreme weather events due to compromised energy infrastructure.
• Decentralized septic systems may be vulnerable to damage from sea level rise, storm surge, and flooding.
Drinking Water Quality The Safe Drinking Water Act (SDWA) is the main federal law that ensures the quality of Americans' drinking water. EPA sets standards for drinking water quality and oversees the states, localities, and water suppliers who implement those standards.
Impacts on Drinking Water Quality Program: • Changes in aquifer recharge due to earlier ice breakup causing earlier peak river flows may
require changes in source and demand management. • Increased runoff and turbidity due to more precipitation falling as rain than as snow. • Source and demand management changes due to short-term droughts lasting 1-3 months and more
frequent days of extreme heat. • Threats to source water quality due to flooding, storm surges, coastal flooding, loss of wetlands,
and sea level rise. • Diminished reliability of future water supply may require water supply management and water
demand management practice changes. • Changes in the salt front of estuaries and tidal rivers due to sea level rise and fresh water flow
changes may result in increased pressure to manage freshwater reservoirs to increase flows and attempt to maintain salinity regimes, in order to protect estuarine productivity and drinking water supplies. Water quality standards in watersheds experiencing reservoir depletion may need to reflect these conditions.
• Biological expectations may need to be adjusted due to saltwater intrusion. • May become harder to meet drinking water standards due to higher flows with associated erosion
and sedimentation and lower flows and increased pollutant contamination and reduced dissolved oxygen.
• Increased contaminants in public drinking water sources and supplies due to runoff from increased rain events.
C. Enforcement and Compliance
• Extreme weather events can do significant and potentially long-term damage to drinking water facilities and sewage treatment plants, resulting in contaminated drinking water and the discharge of untreated sewage in violation of applicable requirements. Such damage will increase the burden on Enforcement/Compliance programs to respond to these violations and water quality impairments resulting from such damage.
• It may be physically more difficult to conduct compliance evaluations and inspections in the field due to harsher weather conditions and extreme weather events. The weather conditions could have an adverse effect both on the physical well-being of inspectors, as well as on equipment used

33
to monitor and test compliance. Weather conditions and the aftermath of extreme weather events may affect our ability to actually collect samples and determine compliance.
• Impacts on Enforcement/Compliance resources for enforcement of wetlands regulations could be particularly impacted by the response to storm surges in vulnerable areas (see wetlands section, above).
GOAL 3: Cleaning up Communities and Advancing Sustainable Development
Contaminated site cleanup and waste/petroleum management occur under a variety of EPA programs, most commonly Superfund (i.e., remedial, time-critical and non-time critical removals, and emergency response), Resource Conservation and Recovery Act (RCRA), Toxic Substance Control Act (TSCA) (e.g., polychlorinated biphenyls – PCBs), Clean Air Act (CAA) (e.g., asbestos), and the Oil Pollution Act (OPA). A high percentage of cleanups, including most Brownfields sites, are regulated through State programs.
A. Overview of Potential Climate Change Impacts
The potential climate change impacts described below broadly apply to each of the cleanup and management programs; however, the implications of these climate change impacts may differ by program.
For New England, the impacts that could most likely pose risks to contaminated sites (including controlled, uncontrolled, and undiscovered contamination), waste management facilities, and petroleum storage facilities are sea level rise, extreme storm events (precipitation and wind), temperature extremes, and decreasing precipitation days and increasing drought intensity. Ocean acidification and increased water temperatures may also pose additional risks to coastal petroleum storage facilities and affect the natural bio-degradation of oils released to the environment. Potential environmental conditions arising from these impacts and specific examples illustrating how they could influence contaminated sites are described below. The likelihood and severity of climate change impacts can also be expected to vary considerably from site to site depending on the location, cleanup technologies/approaches used, and many other factors.
Sea Level Rise: Sea level rise will affect coastal areas in every New England state except for Vermont. The impact on contaminated sites, waste management facilities, and petroleum storage facilities may be partially mitigated because sea level rise is expected to occur gradually over the course of decades. This may allow additional time to appropriately plan for and respond to these changing conditions (e.g., construction of berms, removal of wastes, and completion of shorter-term treatment activities).
As a result of sea level rise, contaminated sites, waste management facilities, and petroleum storage facilities located in vulnerable areas could be subject to inundation and salt water intrusion. Inundation may lead to the release and dispersal of contaminants, physical damage to remediation-related structures, degradation of coastal aquifers (thereby impacting cleanup performance goals), and other adverse impacts. Saltwater intrusion may also impair habitat restoration efforts; cause corrosion of underground

34
tanks, piping, and other equipment; and may lead to changes in soil/water chemical and biological properties, altering the toxicity, transport, and natural degradation of contaminants.
Extreme Storm Events: Existing climate studies suggest that New England has been experiencing more intense storm events. Unlike sea level rise, which predominantly affects coastal areas, extreme storm events can impact a much wider range of contaminated sites. These impacts could include:
• Flooding of surface water bodies and surrounding land areas due to heavy precipitation events (i.e., regional drainage).
• Flooding of coastal areas and rivers from storm surge due to higher intensity hurricanes. • Increased local surface runoff. • Increased infiltration of storm water into soils and elevation of water tables. • Increased wind damage and dispersion of contaminants.
Because much of the historical development of industry and commerce in New England occurred along rivers, canals, coasts, and other water bodies, these areas often have a higher density of contaminated sites, waste management facilities, and petroleum storage facilities. This increases the number of these sites and facilities potentially vulnerable to flooding. Potential consequences of this flooding include the spread of contaminants through erosion, dissolving of contaminants, physical entrainment and deposition of soils or sediments, and flotation and rupture of tanks or drums. Flooding and high winds may also result in the delay or impairment of remedial operations, and damage to remediation and waste/petroleum management structures, contaminated buildings, utilities and other related infrastructure. In addition, the increased amounts of infiltration and runoff, and higher water table levels, could impact the performance of remediation systems and require management of greater volumes of clean and contaminated ground- and surface-water. In this way, increased precipitation events and hurricanes may potentially impact sites even if they are remote from coastal areas and rivers.
In addition, prior to the enactment of environmental laws, industrial wastes were routinely discharged to rivers/streams, industrial canals, ponds and other water bodies. As a result, many contaminants may exist within the layers of sediment that accumulated over the years. Increased water flows due to extreme storm events could potentially re-suspend these sediments, or damage sediment caps, which are engineered covers intended to prevent contaminated sediments from migrating. Furthermore, river and canal flooding could also potentially cause the breaching or failure of dams — such as old mill dams which are numerous in New England — resulting in the spread of contaminated sediment previously contained by the dams. Such events could also cause flooding impacts to sites or chemical facilities downstream.
Temperature Change: The direct consequence of elevated temperatures on contaminated site cleanups is expected to be relatively limited. However, elevated temperatures could lead to increased pressurization of storage containers, volatilization of hazardous materials, and other factors which may affect design and operation of remediation systems and emergency response actions. Worker health and safety concerns during site operations may also be impacted by higher temperatures (e.g., handling of pressurized drums, heat stress to responders).
Decreasing Precipitation Days/Increasing Drought Intensity: Decreasing precipitation compounded by higher ambient temperatures may increase drought conditions that could adversely impact the function of remediation systems (e.g., vegetative layers on landfills, phytoremediation). Droughts also may increase the potential for wildfires that could further damage remediation systems, and cause contaminant releases from facilities used to manage hazardous materials and wastes, and from buildings containing asbestos and other hazardous construction materials.

35
Ocean Acidification: The acidification of sea water may adversely impact the corrosion and degradation of pipelines and construction materials (e.g. concrete pads/berms) used to convey, store, or contain petroleum products at coastal facilities.
Increased Water Temperatures: Increased water temperatures may lead to a change in native or endemic organisms available for biotic degradation of petroleum released to the environment.
B. Program-Specific Vulnerabilities
Longer-term Cleanups (e.g., Superfund Remedial, Superfund Removal, RCRA Corrective Action, TSCA) Longer-term response cleanups such as those occurring under the Superfund remedial and removal programs and the RCRA corrective action program are intended to significantly reduce the dangers associated with the threats of and actual releases of hazardous substances, pollutants and contaminants that pose an unacceptable risk to human health and the environment. Many of these cleanups are also viewed as “permanent” solutions, and thus must be “protective” of human health and the environment.
Impacts on Longer-term Cleanups: Cleanups where waste is left in place (e.g., landfills, cap-in-place remedies) or involve treatment that occurs over a long period of time (e.g., ground water pump & treat systems) could be especially vulnerable to changes in climate. For remedies that are typically of much shorter duration (e.g., soil vapor extraction, enhanced thermal treatment), the impacts of climate change are more predictable and easier to factor into the selection and design of a particular remedy. Some specific programmatic vulnerabilities are:
• Climate change introduces uncertainties into the underlying assumptions that could affect the selection and design of future remedies (e.g., precipitation records and floodplain maps used for remedy selection and design may not account for future climate change impacts) potentially leading to: o more extensive and costly remedies, such as excavation and removal of wastes, for sites that
are potentially vulnerable to sea level rise and flooding o designs that are based on conservative engineering assumptions to reflect uncertainty over
future environmental conditions (e.g., planning for increased surface water runoff or infiltration from extreme storm events)
• There could be physical damage to structures and other components of the site remedy due to extreme flooding, hurricanes, winter rain/ice storms, and increased drought conditions.
• In some cases, cleanups that were once believed to be protective may no longer meet that standard as changes in climate occur. This could result in extensive and potentially costly redesign, and potentially create an extra demand on EPA and State legal and technical resources.
• Sites that were previously not considered or were excluded from cleanup programs may now require reconsideration under site assessment programs (e.g., changes in the direction and extent of contaminated ground water; collapse of abandoned, structurally unstable buildings containing asbestos, lead paint, and other hazardous construction materials).
• The validity of past and ongoing modeling/monitoring could be affected by changing environmental conditions (e.g., changing groundwater flow, groundwater and surface water salinity and other chemical properties).
• Assumptions made for the use and value of natural resources may be affected by changes to those natural resources (e.g., degradation of an aquifer due to salt water intrusion).

36
• Time-critical removal actions, which often bridge the gap between emergency response actions and longer-term remedial actions, may involve unique challenges resulting from climate change impacts, such as:
o The preliminary assessment/site investigation (PA/SI) phase of time-critical removal actions does not currently include potential climate change impacts, and the associated risk may not be factored into cleanup prioritization.
o The remedy selection process that provides the foundation for more permanent remedies may not adequately consider climate impacts.
o Time-critical removals often involve labor intensive operations, leading to additional vulnerabilities from acute impacts of climate change (e.g. flooding and ground water level, temporary or long-term power outages, extreme heat). These impacts may lead to increased costs, decreased productivity, and increased migration of contaminants.
o The available capacities for off-site disposal, waste transport, construction equipment, and laboratory services may be overwhelmed by extreme storm events that may generate large volumes of hazardous materials and debris (including household hazardous waste). The intermixing of hazardous materials and debris complicates the separation, collection, and transport of these materials and also increases disposal costs. Temporary, on-site staging of hazardous materials and debris may also be adversely affected by flooding and other conditions that limit usable land space.
o Extreme storm events may create chaotic conditions that increase health and safety risks to personnel during time-critical removal and emergency response actions (e.g., unstable buildings/structures; release and intermingling of hazardous materials; physical hazards; contamination by biological wastes from the flooding of waste water treatment facilities, sewers).
o Flooding may lead to increased need for dewatering, water treatment and other remediation processes that can add greatly to the cost of cleaning up the site.
Emergency Response Program EPA coordinates and implements a wide range of activities to ensure that adequate and timely response measures are taken in communities affected by hazardous substances and oil releases where state and local first responder capabilities have been exceeded or where additional support is needed. EPA’s emergency response program responds to chemical, oil, biological and radiological releases and large- scale national emergencies, including homeland security incidents.
Impacts on Emergency Response Program: • Releases of hazardous materials or chemicals through high winds, flooding, and storm surge and a
need for increased frequency and intensity of emergency response for both hazardous materials and oil. Current response resources, including laboratory services, may not be adequate for responses to extreme events. Specific impacts include: o The industrial mill infrastructure along New England Rivers poses a unique threat to the
region. Many of these structures contain hazardous chemicals, oil, and contaminated soil directly adjacent to streams and rivers that may release with extreme storms and flooding events. Old, structurally unstable mill buildings containing containerized hazardous substances or hazardous material as part of the structure (e.g., asbestos, lead paint, PCBs) may collapse due to storm forces and cause releases that could warrant response actions. Potential for failure of aging mill dams will increase as frequency and intensity of storms stress the structures, leading to potential impact to chemical and oil facilities downstream.

37
o Increased number of brown/black outs could adversely impact the operation of chemical facility processes and equipment, leading to potential releases of hazardous materials (e.g., runaway reactions).
o Coastal hazardous material and oil facilities may be impacted by extreme storm events (e.g., storm surge). The United States Coast Guard (USCG) has jurisdiction over hazardous material and oil spills along the coast, but the U. S. EPA has interagency agreements in place to support the USCG during responses.
o Collection of household hazardous waste (HHW) and biological waste collection or mitigation may be included in EPA’s mission during extreme weather events. In preparation for more frequent events, additional planning may be necessary to plan for response to these wastes
• Pest type and range may change with climate changes and there may be an increase or change in type of pesticides stored and transported across the region resulting in potential increase in releases.98
• Additional planning for emergency response may be needed: o The impacts of increased blackouts/brownouts, severe storm damage, and other adverse
conditions may need to be incorporated into current national and area contingency plans. o Facility Response Plans (FRP) and Spill Prevention and Control Countermeasures (SPCC)
plans may not adequately consider climate change impacts. o Current regional debris management plans rely on historical climate assumptions and do not
address the increasing uncertainty in climatic extreme events. o Additional planning may be needed as Stafford Act declarations (federal emergency
declarations) may be more frequent with a changing climate. o Current energy infrastructure (oil, natural gas, nuclear) in New England may not include
climate change assumptions for emergency planning.
RCRA Hazardous Waste Management Facilities The Resource Conservation and Recovery Act (RCRA) regulates, among other things, the treatment, storage, and disposal of hazardous wastes. Owners/operators of these treatment, storage, and disposal (TSD) facilities must generally obtain a permit for those activities. Facilities that generate hazardous waste and store it for 90 days or less are also regulated under RCRA. In New England, the individual states are authorized to implement this program in lieu of EPA.
In order to operate as a TSD facility, the owner/operator must comply with numerous technical requirements which ensure that covered activities can be conducted in a manner that is protective of human health and the environment. These requirements apply to on-going hazardous waste management units (e.g., drum and tank storage, surface impoundments, waste piles), as well as to the closure (i.e., cleaning and decommissioning) of those units that are no longer in use. TSD facilities must also conduct cleanup of past and present releases of hazardous constituents.
Impacts on RCRA Hazardous Waste Management Facilities: The same climate change impacts that could affect contaminated site cleanups may also affect the management and operation of hazardous waste facilities. Some examples are:
• Tanks containing hazardous waste could be damaged by high winds or flying debris during hurricanes.
• Integrity of drums and drum storage areas could be compromised by flooding, allowing drums to be floated out of containment barriers, or cause intermingling of incompatible wastes, etc.
• The potential for failure of process equipment (e.g., pressure relief valves, emergency vent fans and pumps) could increase with increases in winter rain and ice storms.

38
• Over-pressurization of tanks containing volatile wastes and the emergency venting of these wastes could occur with extreme ambient temperatures.
• Buildings or other structures used for indoor storage of waste piles could be damaged or flooded in a hurricane causing the release of this material.
• Emergency evacuation routes for facility personnel and the surrounding community, as well as facility access by fire and other emergency response vehicles, could be flooded or otherwise restricted due to an extreme storm event.
While the New England states are authorized to implement the RCRA hazardous waste management program, EPA retains oversight authority to ensure compliance with the statute and regulations and there may be a need for increased coordination to respond to climate change impacts.
Some specific programmatic vulnerabilities for EPA in its oversight role are: • Uncertainties in the underlying assumptions that could affect the design, operation and
management of hazardous waste facilities, including contingency planning (e.g., RCRA TSD facilities must meet specific requirements if waste management units are located within a 100- year floodplain).
• Financial assurance estimates for closure/post-closure may not reflect changing climate change impacts on those activities.
Oil Program and Underground Storage Tanks The Oil Pollution Act (OPA) was signed into law in August 1990. The OPA improved the nation's ability to prevent and respond to oil spills by establishing provisions that expand the federal government's ability, and provide the money and resources necessary, to respond to oil spills. To reduce the likelihood of a spill, regulations issued under CWA Section 311(j) (published in the Code of Federal Regulations, 40 CFR Part 112) require facilities that store oil in specified threshold amounts to prepare spill prevention, control, and countermeasure (SPCC) plans and to adopt certain measures to keep releases from reaching navigable waters. Certain types of facilities that pose a greater risk of release must also develop plans to respond promptly to clean up any spills that do occur99. It is estimated that there are between 1,000 and 12,000 SPCC facilities per state and 200 FRP facilities in New England.
EPA created the Office of Underground Storage Tanks to carry out a Congressional mandate to develop and implement a regulatory program under RCRA for underground storage tank (UST) systems. EPA works with its state, territorial, and tribal partners to prevent and clean up releases from UST systems. The greatest potential threat from a leaking UST is contamination of groundwater, the source of drinking water for nearly half of all Americans. EPA, states, and tribes work together to protect the environment and human health from potential UST releases.100
Impacts on the Oil and Underground Storage Tank Programs: • Secondary containment and flooding of coastal facilities may be compromised by sea level rise. • Increase in precipitation and floods may have many impacts, as follows:
o Decrease the effectiveness of secondary containment. o Increase flow and pressure to underground infrastructure/structures i.e. pipelines,
wastewater treatment facilities, power plants, and paper mills. Increased flow and pressure to containment systems may result in back feed and flow of product resulting in increased discharges of oil.
o Decrease tank headspace thereby displacing buffer space available to prevent overflow/ overfill, potentially leading to increased oil spills.
o Increase weathering of underground and aboveground storage tanks (ASTs and USTs).

39
o Increase flow and changes of navigable water depth, thereby increasing difficulty in preparing and implementing planning distance, booming strategies, and cleanup strategies.
• Failure of infrastructure (e.g. pipelines, and secondary containment) and damage or displacement of tanks due to increased intensity of hurricanes and resulting winds and storm surges. Damage to storage tanks would increase the likelihood of spills to navigable waters, coastlines and oceans.
• Increased degradation and weathering of pipelines and infrastructure due to ocean acidification could result in oil spills.
• Higher ambient temperatures that decrease the viscosity of heavy oil and the lowering of water tables due to drought conditions may potentially increase the mobilization of oil spills.
• Change in native or endemic organism availability for biotic degradation of oil due to increase in water temperatures.
C. Enforcement and Compliance
• There may be an increased demand for compliance monitoring support during emergency/disaster situations (e.g., hurricanes, tornadoes, floods, drought, wildfires), and it may be difficult to deploy compliance experts in a timely manner to the areas where assistance is needed. Infrastructure failures may also result in regulatory violations which could require a state or federal enforcement response.
GOAL 4: Ensuring the Safety of Chemicals and Preventing Pollution
A. Pesticides
EPA receives its authority to regulate pesticide products under the Federal Insecticide, Fungicide, and Rodenticide Act (FIFRA) registers or licenses pesticide products for sale, distribution, and use in the United States. As part of pesticide product registration EPA approves, or more properly “accepts” pesticide label language. In addition, states, usually through a program housed in the State Department of Agriculture, registers pesticide products available for use in individual states. Anyone planning to import pesticides into the U.S. must notify EPA.
EPA's Pesticides program covers: • Providing oversight to state and tribal pesticide programs responsible for certifying and training
pesticide applicators and enforcing pesticide use. • Implementing the federal certification plan for Pesticide Applicators using Restricted Use
Pesticides in Indian Country. • Evaluating Potential New Pesticides and Uses. • Providing for Special Local Needs and Emergency Situations. • Reviewing Safety of Older Pesticides. • Registering and inspecting Pesticide Producing Establishments. • Enforcing Pesticide Requirements. • Risk assessment. • Pesticide Field Programs.

40
Impacts on Pesticides Program: • New pest problems will occur in New England, many of which will be from exotic invasive
species. • Potential changes in program focus to include more emphasis on structural and public health pests
due to weather related impacts on housing and vector pest habitats (i.e., more standing water) • Changes in pests and pest pressures due to increases in temperatures and variations in rainfall
patterns. • Increase in fungal and microbial organisms in agricultural and non-agricultural settings due to
extreme rainfall. • Changes in chemical and non-chemical agricultural practices due to extreme storms and farmers’
inability to work in their fields (e.g. increases in the likelihood of run-off and off-target movement of chemical products; limits on the potential use of certain non-chemical methods such as cultivation because it may not be possible to bring heavy farm equipment onto wet fields and saturated soils).
• Increased use of aerial applications resulting in increased risk of pesticide drift due to extreme storm events.
• Increase in dry condition pests due to drought (e.g. mites that feed on a variety of field, vegetable and fruit crops).
Changes in pesticide choices and quantities may require changes to the pesticide applicator certification and training programs. Changes in chemical selection could result in new and increased chemical exposures, especially for indoor applications. Types of new pest problems could include:
• Indoor and outdoor molds and microorganisms which are controlled by disinfectant pesticide products;
• Public health pests such as mosquitoes and ticks; • Forest pests, • Aquatic pests including weeds; and • Various agricultural pests including weeds, insects and plant diseases.
B. Enforcement, Compliance and Pollution Prevention
Enforcement As with other regulatory programs, climate impacts noted above could cause an increased strain on Enforcement/Compliance resources because of an increased need to respond to changes in pesticide choices and application methods.
Pollution Prevention The long term response to climate change may create demands on EPA and state pollution prevention programs due to the need to provide additional assistance to the regulated community. As an example, there may be increased demand for assistance regarding mitigation methods for reducing GHG emissions. Green Chemistry resources will be in greater demand as businesses and the public seek more sustainable substitutes for materials used for manufacturing and other industrial and commercial activities.
Facilities and Operations
Climate change poses a range of risks to EPA New England’s facilities and operations. The following sections detail the general risks and then delve into the risks specific to each facility. Note that each

41
facility does not operate in isolation; the climate impacts experienced by each facility will be greatly influenced by the larger systems (utilities, transportation, communities) of which it is a part.
A. Overview of Potential Climate Change Impacts101
From the facilities and operations perspective, the vulnerabilities associated with climate change encompass issues of energy security, water quality and supply, severe weather and flooding damage, personnel safety, physical security, and communications interruptions. Facilities and operations support the broader agency mission of protecting air, water, and human health through the provision of functional, appropriate, and safe working spaces for personnel. Beyond the infrastructure and utilities that serve EPA rented or owned facilities and the operations that support the function of those facilities, broader impacts of climate change on transportation and communication systems are also vulnerabilities that can hamper EPA New England’s efforts to meet agency goals. While telework policies are in place to address these vulnerabilities, the magnitude of these impacts may extend to those alternate work locations, causing significant disruption to employee work and ultimately hampering fulfillment of the EPA New England mission.
However, while operations may be vulnerable in the areas described above, EPA New England has developed a Continuity of Operations Plan (COOP) to maintain emergency functions should any particular facility or location be compromised. This plan provides guidance for continued uninterrupted operations and the performance of essential functions during emergency situations. The COOP includes provisions for physical relocation from current facilities and resource planning for up to 30 days.
B. Facility-Specific Vulnerabilities The Boston McCormack office building located in Boston, MA is approximately 0.5 miles from the Boston waterfront and sits at an elevation of approximately 12.3 feet (2.76 meters) above mean sea level.102 The building is a massive granite structure, serviced by underground utilities for water, natural gas and steam heating. All building mechanical systems are on the 17th floor roof. Most notable about this facility is its position as a part of a larger urban community. While impacts can be explored with the view that the building sits in isolation from the rest of the city, more likely, the experience of impacts will be moderated and influenced by its proximity to other buildings and infrastructure of significance.
The impacts and risks associated with higher water levels from sea level rise, storm surge or flooding include: building damage, inaccessibility of the building to employees, and damage to the larger utility systems that support the operation of the McCormack building. In addition, mobile equipment (e.g. vehicles, emergency response resources, etc.) stored in the building’s basement may be vulnerable to flooding. However, the structural soundness of the building will limit the impacts of extreme weather on the building itself, and the location of mechanical systems on the 17th floor will limit the damage to critical building equipment. In addition, the McCormack building is equipped with a natural gas fueled backup generator.
The Boston office utilizes a parking garage for Government Owned Vehicles. The vehicles are on the ninth floor of the parking structure and are not susceptible to flooding concerns because of the high elevation. However, access to this facility may be hampered by local flooding, affecting the usability of those vehicles.
42
The Chelmsford Lab is built high on a hill approximately 40 miles from Boston Harbor, at an elevation of 156.2 feet (47.61 meters) above mean sea level103 obviating any risks of sea level rise or direct flooding. However, surrounding roads may be flooded during extreme storms.
The power grid near the Chelmsford Lab is particularly susceptible to several hour power interruptions due to rain and wind. Due to the existing weaknesses of the power grid, the Lab is equipped to manage short interruptions. At this facility, oil fueled backup generators have been sufficient for up to 44 hours of backup power and can be extended by additional fuel deliveries.
EPA’s Emergency Response Warehouse is located approximately 30 miles from Boston Harbor at the intersection of Routes 128 and I-93 in an industrial park. At an elevation of 73.3 feet (22.36 meters) above mean sea level,104 the likelihood of sea level rise impacts is very low. Impacts to the larger transportation systems may affect accessibility, but similar to the McCormack building, those impacts are a part of the larger context and beyond EPA’s control and jurisdiction. The susceptibility of this facility and its access roads to flooding due to nearby rivers and water bodies is currently unknown. Impacts to this warehouse may affect the access to and availability of emergency response resources that are stored at this location.
Tribal and Vulnerable Populations
The impacts of climate change may disproportionately impact tribal communities and vulnerable populations, including children.
T r i b a l C o m m u n i t i e s EPA values its unique government-to-government relationship with Indian tribes in planning and decision making. This trust responsibility has been established over time and is further expressed in the 1984 EPA Policy for the Administration of Environmental Programs on Indian Reservations and the 2011 Policy on Consultation and Coordination with Indian Tribes. These policies recognize and support the sovereign decision-making authority of tribal governments.
Supporting the development of adaptive capacity among tribes is a priority for the EPA. Tribes are particularly vulnerable to the impacts of climate change due to the integral nature of the environment within their traditional lifeways and culture. There is a strong need to develop adaptation strategies that promote sustainability and reduce the impact of climate change on Indian tribes.
EPA engaged tribes through a formal consultation process in the development of the Agency’s Climate Change Adaptation Plan. Tribes identified some of the most pressing issues as erosion, temperature change, drought and various changes in access to and quality of water. Tribes recommended a number of tools and strategies to address these issues, including improving access to data and information; supporting baseline research to better track the effects of climate change; developing community-level education and awareness materials; and providing financial and technical support. At the same time, tribes challenged EPA to coordinate climate change activities among federal agencies so that resources are better leveraged and administrative burdens are reduced.
This Implementation Plan identifies specific steps that will be taken to partner with tribal governments on an ongoing basis to increase their adaptive capacity and address their adaptation-related priorities. These collaborative efforts will benefit from the expertise provide by our tribal partners and the Traditional Ecological Knowledge (TEK) they possess. TEK is a valuable body of knowledge in assessing the

43
current and future impacts of climate change and has been used by tribes for millennia as a valuable tool to adapt to changing surroundings. Consistent with the principles in the 1984 Indian Policy, TEK is viewed as a complementary resource that can inform planning and decision-making.
Networks and partnerships already in place will be used to assist tribes with climate change issues, including the National Tribal Operations Committee, Regional Tribal Operations Committees, the EPA- Tribal Science Council, the Institute for Tribal Environmental Professionals and the Indian General Assistance Program (IGAP). Additionally, efforts will be made to coordinate with other Regional and Program Offices in EPA, since climate change has many impacts that transcend media and regional boundaries. Transparency and information sharing will be a focus, in order to leverage activities already taking place within EPA Offices and tribal governments.
There are 10 federally recognized tribes (see Figure 7 105) in New England and climate change may have the potential to disproportionately impact tribal communities compared to non-tribal communities.
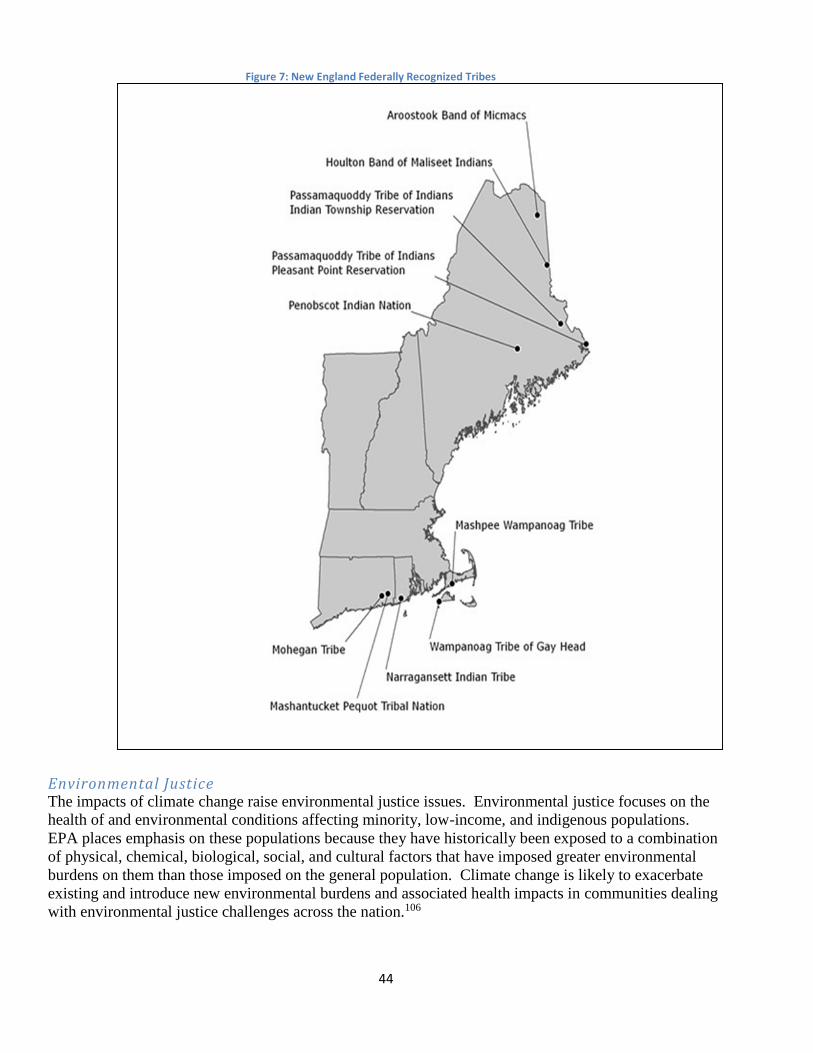
44
Figure 7: New England Federally Recognized Tribes
E n v i r o n m e n t a l J u s t i c e The impacts of climate change raise environmental justice issues. Environmental justice focuses on the health of and environmental conditions affecting minority, low-income, and indigenous populations. EPA places emphasis on these populations because they have historically been exposed to a combination of physical, chemical, biological, social, and cultural factors that have imposed greater environmental burdens on them than those imposed on the general population. Climate change is likely to exacerbate existing and introduce new environmental burdens and associated health impacts in communities dealing with environmental justice challenges across the nation.106

45
C h i l d r e n The impacts of climate change can have unique effects on the health of children. Children are different from adults in how they interact with their environment and how their health may be affected.
Below is a list of potential impacts on tribal populations, environmental justice communities, and children, broadly organized by EPA programs.
A. Air Impacts on tribal programs (raised by tribal leaders and tribal environmental departments at various meetings with the Agency):
• Potentially higher health risk of methyl mercury contamination due to higher fish and shellfish consumption by tribal members compared to the average consumer.107
• Potentially higher risk of exposure to increase in mercury and cadmium as well as other pollutants as it concentrates in moose liver, turtle, and fiddlehead ferns consumed by the Maine tribal populations. 108, 109
• Potentially higher mercury exposure from tribal members’ reliance on wood stoves for home heating, and increased air transport and deposition of mercury or other contaminants that bioaccumulate on wood bark. 110
• Higher incidence of asthma as indoor air exposure to mold and second-hand smoke exposure increases with more time spent indoors due to more extreme weather events.
• Impacts to sustenance practices due to warmer ambient temperatures and extended warmer seasons as predator tick populations impact moose and deer hunting111, invasive plant species impact agronomic practices such as fiddlehead harvesting and blueberry farming, and invasive insects such as the emerald ash borer impact native practices involving black ash species (e.g. basket-making for harvesting).112
• Moose populations may decline due to warmer mean temperatures in winter.113
• Forestry operations and changes of species from hardwoods such as oak and maple to more spruce and fir populations with temperature increase.
Impacts on vulnerable populations: • Combination of heat stress and high concentrations of tropospheric ozone could pose a health risk
to young children, the elderly, and those with pre-existing health conditions, including asthma.114Increase in health risks from worsening indoor environmental conditions due to increases in mold and other indoor air pollutants as a result of increased flooding or leaks from storm events.115
• Increase risk to low-income households from extreme heat events due to lack of air conditioning or failure to use air-conditioning to cut down on associated energy costs.116
Impacts on children: • Increased frequencies of elevated levels of ozone may lead to a number of adverse health effects
in children, such as shortness of breath, chest pain when inhaling deeply, wheezing and coughing, temporary decreases in lung function, and lower respiratory tract infections.117, 118
• Increased levels of particle pollution during extreme weather events could cause increased exposure to children. Childhood exposure to particulate matter has been associated with respiratory symptoms, decreased lung function, development of chronic bronchitis, and worsening

46
of asthma. Children’s exposure to particle pollution can result in increased hospital admissions, emergency room visits, absences from school and restricted activity days.
• If radon is present in schools, higher incidence of exposure to radon with more time spent indoors due to more extreme weather events.
B. Water Impacts on tribal programs:
• Coastal infrastructure may be impacted by sea level rise including the Passamaquoddy Pleasant Point wastewater treatment facility that is located near sea level with an ocean outfall discharge.
• Ocean acidification may have a particularly acute impact on the coastal tribal members, including Passamaquoddy, Mashpee Wampanoag and the Wampanoag Tribe of Gay Head (Aquinnah) who depend on shellfish harvesting for sustenance practices, employment and economic development.
• Lobster shell wasting disease that may be linked to climate change has also been raised as a concern.119
• Damage to wildlife and fish habitat, potentially altering spawning habitat by increasing siltation due to sea level rise.
• Cold water fish species such as trout and salmon may be more susceptible to poisons, parasites and disease, and stunted fish growth, as well as increased juvenile mortality resulting from lower oxygen levels due to warmer waters.
• Fishery habitat including nesting sites and increased fish mortality due to flooding of tribal rivers as a result of increased snowfall and rapid snowmelt. Tribal communities depend on sustenance fishing.
Impacts on vulnerable populations: • Increase in severity and frequency of extreme storms can result in catastrophic effects for coastal
environmental justice communities with limited resources to prepare and respond to natural disasters.
• Increase risk of exposure to hazardous substances as flooding from more intense and frequent storms and sea-level rise may lead to contaminant releases from Corrective Action sites, Superfund sites, Brownfield sites and landfills which often are located in close proximity to environmental justice communities.
• Impacts to water infrastructure may put vulnerable and economically deprived communities at risk, both for access to clean and safe water as well as for their ability to respond to emergencies during extreme events.
Impacts on children: • Extreme weather also can result in the breakdown of sanitation and sewer systems, increasing the
likelihood of water-borne illness. Children are especially susceptible to such illness due to their developing immune systems.
• School drinking water supplies may be compromised. New England schools are responsible for providing safe drinking water to their students, staff and visitors. Many school systems do not have access to a nearby public water supplier and provide drinking water by operating their own onsite well water system.
• Increases in the extent of storm surge and coastal flooding will cause erosion and property damage to schools along the densely populated coasts.

47
C. Waste and Pesticides No tribal impacts were identified that would be different from the impacts of the surrounding community for these programs.
Impacts on vulnerable populations: • Potential changes in pesticide exposures may exacerbate existing burdens placed on children,
agricultural workers and other groups who may be disproportionally affected.
Impacts on Children: • Schools may experience a higher incidence of exposure to chemicals and pesticides increases with
more time spent indoors due to more extreme weather events.
Cross-Cutting Vulnerabilities
A. Energy Managing electricity and natural gas facilities to meet environmental goals and reliability standards will be challenged by long term temperature increases and increased extreme weather events.
Temperature increases will increase energy demand, particularly on peak summer days. As demand increases, additions and adjustments to the electric generating system need to be made. Many of the typical responses to these increases may increase air pollution emissions.
Additionally, since thermal power plants operate at lower capacities in the summer versus the winter, the higher ambient temperatures get, the less efficient the power plants are over a greater portion of the year, resulting in the consumption of more fuel, thus more emissions, to produce an equivalent amount of usable energy. In addition, higher cooling water temperatures during summer months also mean that the power plant will operate at less than its peak capacity. As a result, as long-term temperatures increase, the overall efficiency of most power plants will decrease, resulting in higher emissions per megawatt- hour produced over a larger portion of the year. This situation will not be unique to New England, and New England will also be adversely impacted by additional pollution moving into the region as a result of similar situations in upwind states and control areas.
The increased frequency of extreme weather events will impact the integrity of the energy system and can lead to the disruption of electrical service. During the cold weather season, residents without power are forced to utilize alternative methods of heating such as wood stoves or fireplaces. The resulting increase in wood burning can contribute to elevated ambient fine particle (PM2.5) pollution concentrations. This phenomenon was observed in the several days of “unhealthy for sensitive groups” (USG) PM2.5
concentration measured in the Springfield, MA area following the October 29, 2011 snowstorm.120
Power losses usually result in the increased usage of local generators which produce much more pollution per unit of usable energy than a typical power plant. In addition, since both drinking and waste water require substantial amounts of energy, long term disruptions in energy infrastructure can result in negative public health outcomes related to an inability to provide clean water or treat wastewater. Restoration of such capabilities within acceptable environmental parameters should be a priority for emergency response restoration efforts as well.
48
Sea level rise will also lead to direct and indirect losses for the region’s energy infrastructure (e.g., power plants located along the coast, marine facilities that receive oil and gas deliveries), including equipment damage from flooding or erosion.
A i r I s s u e s / I m p a c t s : • Increased atmospheric concentrations of criteria pollutants due to increased electric demand
resulting from heat waves and generally higher temperatures. New England will be impacted from inter-regional transport of pollutants caused by similar situations in upwind states.121
• Increased levels of criteria pollutants may result from decreased capacities of electric generating units to operate due increased temperatures of cooling water. Long term temperature increases may require a proportionally higher number of electric generating units (EGUs) to provide equivalent amounts of power.
W a t e r I s s u e s / I m p a c t s • Decreased power output from power plants resulting from increases in the waterbody
temperatures that supply cooling water to the plant. • The Region may be requested to allow enforcement forbearance to allow the discharge of heated
water into water bodies that exceed the temperature limits in violation of the power plant’s NPDES permit, in order to permit electrical generation.
• Impairment or inability to treat wastewater or provide drinking water in the aftermath of extreme weather events.
B. Communications Effective communication to stakeholders is critical to meeting EPA’s mission. The following are impacts on communications at EPA New England.
• As communities are impacted by severe storms, impaired waters, contaminated flood waters, and other impacts of climate change, current communication mechanisms regarding the environment and public health during these periods may not be sufficient to ensure that communities receive the appropriate guidance on how to react to these events and protect public health.
• Current mechanisms of communications with states, cities and towns, and guidance regarding how to best handle climate change impacts and vulnerabilities may not be sufficient.
• Current mechanisms regarding how EPA communicates information may not be sufficiently easy to access and understandable to the audience in need, both during emergency events and when conducting communication on climate change impacts.

49
IV. Priority Actions The EPA New England climate change programmatic vulnerability assessment points to the specific program and operations that may be impacted by the projected climate changes. Based on these vulnerabilities, EPA New England identified priority actions it could take to ensure that we can continue to accomplish our mission and operate at our multiple locations. These priorities represent EPA New England’s commitment to address the known programmatic vulnerabilities, and to continue to identify other vulnerabilities that may occur over time due to climate change.
The workgroup developed a set of criteria to take into consideration when evaluating the priority actions. The following qualitative criteria were considered. .
• Timeframe when risk would occur? • Magnitude of impact of risk on environment or health? • Magnitude of impact on EPA program? • Does the action reduce the risk? • Does the action protect a critical resource/investment? • Does the action address “low-hanging fruit” that would be easy to accomplish? • Would the action leverage a larger effort outside of EPA? • Does EPA have a unique role or capacity to address this issue? • What is the timeframe of the problem that this action would be addressing?
Could the action be accomplished within current budgets or would additional funds be necessary? Taking these criteria into account, priority actions were determined for each strategic goal. The following section summarizes the priority actions for each goal.
GOAL 1 O z o n e a n d N O x
1. Work with other EPA Regions and HQ air program managers to develop a strategy, in context to other programmatic priorities, on how to incorporate climate adaptation into air quality programs (e.g., SIPs, permits).
2. Develop new VOC and NOx control strategies with the States to offset the effects from higher peak (and prolonged) temperatures as necessary.
PM 3. Devote more Regional staff time to providing the public with “Burn Wise” information, and work
with the states and tribes to inform the public about unhealthy air quality. 4. Work with the States to analyze further control strategies for wood combustion to avoid PM2.5
violations.
I n d o o r A i r 5. Prepare information and recommendations regarding mold and other indoor air quality issues for
distribution to the public due to increase in extreme events and flooding, and residents spending more time indoors.
6. Enhance messaging on the dangers from backup electricity sources (e.g. generators) and heat sources (e.g., wood stoves, fireplaces) that might be used more frequently due to power outages.
7. Devote more Regional staff time as needed to answer indoor air calls from the public.

50
E n f o r c e m e n t 8. Enhance Regional compliance assistance efforts to insure emergency generators are properly
used, and are in compliance with applicable state and federal requirements. 9. Enhance Regional compliance monitoring efforts to insure that air pollution sources are properly
controlled and in compliance with applicable state and federal requirements.
T r i b a l P r o g r a m s 10. Work with New England tribes to monitor and assess local mercury deposition trends and advise
them on potential additional health precautions to take, if and when trends indicate increases in atmospheric deposition and corresponding increasing mercury levels in fish and turtle.
GOAL 2 W a t e r Q u a l i t y S t a n d a r d s
1. As circumstances arise, revise water quality criteria to reflect climate change impacts. 2. As conditions change, modify water body classifications (salt v. fresh water) or Integrated Report
designations (e.g., causes of impairment) to reflect climate change impacts.
M o n i t o r i n g , A s s e s s m e n t , a n d L i s t i n g
3. Increase monitoring to adequately assess the effects of rapidly changing conditions. 4. Continue to support EPA’s National Aquatic Resource Surveys (NARS), which provide ongoing
assessment of the ecological condition of statistically representative samples of wadeable streams, large rivers, wetlands and coastal resources.
5. Implement collaborative year-round monitoring of high-quality (reference) wadeable streams, with other water resources to follow as feasible, for temperature, flow, physical habitat, biological resources, and other water quality parameters such as nutrients, as proposed in the state, tribal and federal Northeast (New England and NY) stream climate change monitoring network.
6. Work with HQs to develop and implement a national monitoring program for ocean acidification (OA), which is caused by the dissolution and reaction of carbon dioxide (CO2) into ocean water.
7. Modify freshwater, estuarine, and marine sampling protocols and locations based on effects of climate change, including sea level rise, considering the need for a long term monitoring record.
T o t a l M a x i m u m D a i l y L o a d ( T M D L ) Over the past decade, EPA Region 1’s cross-program effort to address stormwater-related water quality impairments has provided valuable experience in how to develop and implement TMDLs that address multiple environmental stressors resulting from various flow regimes. For example, impervious surfaces in urban environments deliver a mix of pollutants and increased flow to rivers and streams resulting in soil erosion, stream bank scouring, deposition of sediment and nutrients increases in receiving waters. The increasing amount of impervious surfaces in urban areas causes less precipitation to infiltrate into the ground, which may cause streams to experience much lower base flows during dry conditions, along with low dissolved oxygen, increased eutrophication, and higher stream temperatures. Flashy streamflow conditions (i.e., rapid increases in streamflow and velocity in response to rainfall, followed by rapid recovery to pre-storm conditions) related to excessive stormwater runoff and corresponding droughts are anticipated to become even more frequent and/or intense in response to further climate change.
51
Stormwater TMDLs now being implemented effectively on a sub-watershed basis involve the use of surrogates for the mix of pollutants in stormwater (i.e., impervious cover, or flow). Innovative and flexible approaches to TMDL development like this show promise for addressing the complex challenges of climate change. For instance, under the surrogate approach, TMDL end-points are tied to aquatic life use protections in State water quality standards, which provide environmental protection based on whatever the current conditions happen to be (rather than future projections based on past conditions). The technical basis for aquatic life use-based TMDLs is derived from significant investments over the past 35 years developing state ambient biological monitoring programs in our Region. Bioassessments (using ambient assemblages of macroinvertebrates, fish, or algae that integrate the effects of multiple stressors over time), in concert with physical and chemical monitoring data, now support the water quality assessment of aquatic life use attainment for these surrogate TMDLs, and provide clear environmental indicators of stream health under whatever the existing conditions are.
8. Promote use of hydrological information to the extent available and adequate that takes climate change effects into consideration during development of TMDLs, their implementation plans, NPS plans, and NPDES permits.
9. Support increased monitoring to assess the effectiveness of attained TMDL targets in the face of changing conditions.
10. Promote close collaboration among TMDL, NPDES, and NPS program staff during stormwater TMDL development and public outreach, in order to help MS4s and other stakeholders understand the need for more detailed local watershed planning for stream restoration actions and the use of structural and non-structural BMPs as part of post-TMDL implementation. To address new information and evolving circumstances, focus climate change adaptation on the selection and design of more effective TMDL implementation. For example: • Promote selection of BMP types that perform well under varying climate conditions, such as
certain low impact development practices. • Promote consideration of projected precipitation changes during the design of stormwater
BMPs and other practices built to accommodate or treat specific storm sizes or runoff volumes, especially when these investments are anticipated to have life expectancies of 30 years of more.
• Support BMP studies to evaluate how resilient BMPs are to climate change, and whether additional capacity is warranted to address future concerns, such as flooding or groundwater recharge.
C r o s s - P r o g r a m W a t e r M a n a g e m e n t In line with EPA’s agency-wide climate change priorities and strategic measures, Region 1 priority actions will continue to focus on cross-program stormwater management, and will continue interagency collaboration and development of decision-making tools capable of promoting environmentally sound and cost-effective management actions. For example:
11. 2010 RARE-funded project, Assessing Effectiveness of Green Infrastructure Stormwater BMPs at the Small Watershed Scale (WQ Branch & ORD/Narragansett).
12. 2011 ORD Green Infrastructure-funded project, Development of an Integrated Watershed Management Optimization Decision Support Tool, which accounts for water supply, wastewater, stormwater, in-stream conditions, groundwater, and land use to achieve optimal actions to achieve water quantity-related management goals at least cost (collaboration among WQ and SDW programs).
13. Major regional meetings in 2012 and 2013 were co-sponsored with USFWS and USGS on temperature data and monitoring which has prompted NE CSC research projects on climate

52
change impact on headwater systems (areas of aquatic refugia), and development of a multi- agency regional stream temperature framework and database for New England (ME, NH, CT, RI, and MA) and the Great Lakes States (MN, WI, IL, MI, IN, OH, PA, NY).
14. , Develop Optimizing Stormwater/Nutrient Management – Region 1 Opti-Tool, a user-friendly (spreadsheet) tool allowing optimization of structural and non-structural BMPs, and account for BMP pollutant removal, stormwater flow control performance, and estimated cost (collaboration among TMDL and NPDES programs).
15. Estimate how stormwater controls would work cumulatively to address future changes to precipitation patterns in order to determine whether or not modification of the levels of control is warranted.
N a t i o n a l P o l l u t a n t D is c h a r g e E l i m i n a t i o n S y s t e m ( N P D E S ) P e r m i t s 16. Review water treatment requirements as reduced water flows in streams, especially during
summer months, will not dilute treatment plant effluents as they do now, so more treatment may be needed to maintain current water quality standards.
17. Stormwater permits will need to account for increased extreme precipitation and erosion and sedimentation.
18. Promote the “Soak up the Rain” program. 19. Permits with temperature limits (e.g., electric generating units) will need to account for increased
water temperatures in receiving waters and potential changes to local assemblages of aquatic organisms.
N o n - P o i n t S o u r c e ( N P S ) 20. Promote appropriately sized best management practices (BMPs). 21. Promote demand management ways to preserve base stream flow levels. 22. Find additional sources of funding for NPS abatement. 23. Promote appropriately sized transportation infrastructure. 24. Identify and use drought resistant species to aid in infiltration in BMPs.
W e t l a n d s ( c o a s t a l a n d i n l a n d ) 25. Increase use of invasive species control plans and their implementation in coastal wetlands. 26. Increase protection for vernal pools. 27. Promote beneficial uses of dredged material such as for beach nourishment, and marsh restoration
as well as the potential use of thin layer dredged material disposal in eroding coastal wetlands. 28. Review and comment on Corps permit applications for coastal engineering structures to evaluate
potential adverse impact on coastal wetlands, considering sea level rise and marsh migration potential.
29. Recommend consideration of “living shorelines” where appropriate to restore eroding wetlands and protect shorelines as an alternative to hard engineering structures.
30. Prioritize restoration work for tidal wetlands that have room to migrate. 31. Work with HQs and other regions to determine how to take into account seasonal variabilities in
precipitation for “Waters of US” determinations.
D r e d g i n g / O c e a n D u m p i n g 32. Promote beneficial uses of dredged material such as for beach nourishment, and marsh restoration
as well as the potential use of thin layer dredged material disposal in eroding coastal wetlands. 33. Establish emergency dredging protocols to prepare for increased erosion and sedimentation
associated with more extreme precipitation.

53
34. Promote Regional Sediment Management approaches to better understand sediment dynamics and potentially reduce the need for, or frequency of, dredging.
35. Modify dredging windows to better align with changes in seasonality (earlier fish migration and spawning).
N a t i o n a l E s t u a r y P r o g r a m ( N E P ) 36. Through the Climate Ready Estuaries program, assist state and local partners conduct
vulnerability assessments, prepare adaptation plans, and develop tools to facilitate these activities, like the Connecticut Adaptation Resources Toolkit.
37. Promote the New England Environmental Finance Center’s use of the Coastal Adaptation to Sea Level Rise Tool (COAST) to raise awareness among coastal cities and towns about the economic impact of sea level rise and storm surge on coastal property and infrastructure.
38. Develop guidance for different coastal habitat types (dunes, dams, etc.) restoration activities to account for sea level rise.
39. Revise and update Comprehensive Conservation and Management Plans (CCMPs) to address vulnerabilities to climate change and include adaptation measures.
40. Prioritize wetlands that have room to migrate for restoration. 41. Promote implementation of more effective erosion and sediment controls to adapt to increasing
heavy precipitation events and storm intensity. 42. Support efforts to better characterize impacts of ocean and coastal acidification in cooperation
with the Northeast Coastal Acidification Network (NECAN).
D r i n k i n g W a t e r , W a s t e w a t e r , S t o r m w a t e r I n f r a s t r u c t u r e 43. Educate and encourage use of Water and Wastewater Agency Response Networks (WARNs) to
promote specialized water sector mutual aid and recovery in events of infrastructure damage or other emergencies.
44. Through the Climate Ready Water Utilities program, educate facility operators on using localized climate projections to help identify specific vulnerabilities, including Geographic Information Systems (GIS) and Light Detection and Ranging (LiDAR) mapping of flood zones. Facilities should then update and train staff on revised Emergency Response Plans as needed.
45. Promote the WaterSense program to help utilities implement water efficiency/conservation measures to reduce or delay the need for system expansion and reduce energy use.
46. Encourage utilities to compile an inventory of utility assets to help determine the location, importance and condition of each asset, which will lead to an improved response in emergency situations. Provide assistance to municipalities and others on use of asset management methods.
47. Promote green infrastructure projects, such as low impact development (LID), to help manage wet weather and improve water quality, reduce hydraulic loads on combined sewers, and reduce the risk of flooding. Increase public understanding of the need to implement and finance stormwater management systems.
48. Develop outreach and tools for flood proofing infrastructure. 49. Promote opportunities such as periodic larger-scale system evaluations, planned upgrades, or new
construction to incorporate climate-change considerations into facility design. Educate utilities on tools to seek federal funding (FedFUNDS tool) and other opportunities to address needed improvements.
50. To help ensure that climate change impacts on septic systems are addressed in a proactive manner, assess which areas in New England may be vulnerable to damage to decentralized septic systems due to sea level rise, storm surge, and flooding, starting with Cape Cod. Based on the results of the mapping assessment, determine appropriate actions, including promoting improved

54
decentralized sewage system management in accordance with EPA's Voluntary Guidelines.
Q u a l i t y a n d A v a i l a b i l i t y o f S a f e D r i n k i n g W a t e r 51. Promote source water protection and watershed management activities to protect water supplies
from increased threats to water quality and to increase recharge to aquifers. Use natural flood control vegetation for protection.
52. Encourage source redundancy and flexibility for seasonal adjustments to meet demand, water quantity and availability.
53. Provide new information, as available, on specific threats to water quality and sources, such as: cyanobacteria, drinking water bacterial requirements and water sector general vulnerabilities.
54. Promote erosion and sediment controls. 55. Promote monitoring of weather conditions and trends, use modeling and mapping to better
prepare and adapt for expected changes, including in emergency response plans.
GOAL 3 L o n g e r - t e r m C l e a n u p s ( e . g . , S u p e r f u n d R e m e d i a l , S u p e r f u n d T i m e - C r i t i c a l R e m o v a l , R C R A C o r r e c t i v e A c t i o n , T S C A ) a n d R C R A H a z a r d o u s W a s t e M a n a g e m e n t F a c i l i t i e s
1. Include consideration of potential climate change impacts in EPA New England management reviews of Superfund National Priority List (NPL) sites.
2. In conjunction with the New England Waste Management Officials’ Association (NEWMOA) and member state agencies, initiate an interagency dialog to plan and coordinate efforts to consider climate change impacts at contaminated site cleanups and RCRA hazardous waste management facilities.
3. Identify and assess the potential vulnerability of NPL sites within delineated GIS-mapped zones (i.e., sea level rise, flooding due to storm surge, and flooding due to higher precipitation events) based on a consideration of site-specific factors (e.g., local topography, proximity to rivers/canals, design and duration of cleanup remedies, potential risk to the cleanup).
4. Based on the findings from the evaluation of potentially vulnerable NPL sites, develop an action plan to evaluate the vulnerability of other contaminated sites (e.g., Brownfields, Superfund Time- Critical Removal, RCRA corrective action) and RCRA Hazardous Waste Management Facilities.
5. Develop and conduct training on considering climate change impacts in site cleanups for EPA and state project managers.
6. Work with HQs to revise technical guidance (e.g., relating to 5-year reviews, management reviews, remedial investigation/feasibility studies, remedial design, sediment management) to address consideration of climate change impacts.
7. Coordinate with HQs and FEMA and other federal agencies to update, as necessary, reference maps and data (e.g., 100- year flood plain, precipitation from 100-year storm events) to aid in the evaluation, design and implementation of cleanup response actions.
E m e r g e n c y R e s p o n s e 8. Continue coordination among program offices to plan for potential coordination during
emergency response actions. 9. Utilize the GIS-based EPA FlexViewer platform to prepare for and respond to climate change
impacts in New England. 10. Provide training to responders in preparation and response of climate change impacts with option
for state agencies to participate in the training (e.g. potential for increased pesticide responses, extreme storm events, Stafford Act declarations, incident command structure, etc.).

55
11. Conduct an assessment of current regional resources and response framework to determine if resource levels and existing plans would be sufficient to adequately respond to an extreme event, such as a hurricane or large storm.
12. Incorporate climate change impact planning into regional contingency plans (e.g. debris management plans, area contingency plans, etc.).
13. Assess interagency agreements with the Coast Guard to determine how coastal impacts from climate change will be addressed.
14. Coordinate with OEME to assess whether current regional laboratory capabilities will be sufficient during responses to extreme events and whether the infrastructure can sustain potentially increasing demands over time.
O i l P r o g r a m ( e . g . , S p i l l P r e v e n t i o n , C o n t r o l , a n d C o u n t e r m e a s u r e ( S P C C ) / F a c i l i t y R e s p o n s e P l a n s ( F R P ) F a c i l i t i e s )
15. Develop, conduct, and/or maintain training on climate change impacts for EPA, USCG and state counterparts.
16. Enhance GIS-based mapping tools to incorporate climate change impacts and identify vulnerable zones to aid in planning.
17. Conduct management reviews of SPCC/FRP New England Facilities within potential impact zones to aid in setting inspection targets.
18. Develop technical guidance to aid in climate change impact planning. 19. Continue monitoring efforts to determine if SPCC and FRP regulated facilities are impacted by
climate change. 20. Coordinate with OEME to identify specific research needs.
GOAL 4 E n s u r i n g S a f e t y o f C h e m i c a l s :
1. Increase EPA support for pesticide enforcement and applicator education – direct and through states and tribes.
2. Strengthen and develop new relationships with federal (or other) agencies for new pesticide related problems (e.g., USDA, CDC, HUD, DOD, etc.).
3. Change regional oversight to meet new priority areas. Provide pollution prevention assistance to states, businesses, and others that promote sustainable practices. Implement regional Green Chemistry strategy to promote development of more sustainable manufacturing methods and materials.
FACILITIES AND OPERATIONS 1. Develop/codify storm event pre-deployment strategies for government owned vehicles (currently
informally included in the COOP). Develop/codify storm event pre-deployment strategies for vehicles and equipment stored in the garage and ground floor of the McCormack building.
2. Develop extended contingency/telework plans for employees (management/human resources). 3. Ensure Continuity of Operations Plan can also address situations that extend beyond 30 days. 4. Conduct further research to assess the risks of flooding associated with nearby water bodies,
rivers, lakes and ocean. 5. Work toward developing a deeper understanding of how flooding occurs through storm surge in
urban areas, given that the impacts of sea level rise and storm surge are not well understood, particularly for the McCormack building.

56
TRIBAL AND VULNERABLE POPULATIONS 1. Work with EPA programs to target climate adaptation efforts in the most vulnerable communities,
including tribes. 2. Educate vulnerable populations about climate adaptation. Provide assistance to tribes (if
requested) in developing their individual tribal adaptation plans or a comprehensive regional tribal adaptation plan if pursued by the tribes.
3. Expand use of existing communication tools and develop a comprehensive contact list of organizations representing vulnerable populations as a resource for preparedness and response to extreme events.
4. Utilize GIS-based mapping tools to identify coastal vulnerable populations that could be potentially subject to an increased sea level rise, flooding due to storm surge, and flooding due to higher precipitation events.
CROSS CUTTING ACTIONS 1. Utilize GIS-based mapping tools to delineate New England zones that could be potentially subject
to an increased sea level rise, flooding due to storm surge, and flooding due to higher precipitation events.
2. Leverage21st century 'big data' science initiatives relevant to New England climate change such as NEON, UNH EPSCoR and other novel environmental monitoring technologies.
3. Incorporate climate change adaptation into performance partnership agreements (PPA)/performance partnership grants (PPG) state program requirements.
4. Develop and implement adaptation plans with state and local partners to address risks to habitats, infrastructure, and human populations; estuarine and coastal area plans will be initiated first.
5. Deliver technical assistance programs to communities on smart growth topics such as how to achieve compact, walkable, transit-oriented development.
6. Work with the Partnership for Sustainable Communities (HUD, DOT, EPA, FEMA, and USDA Rural Development) to help communities become more disaster resilient, and ensure that our programs don’t support non-resilient development in vulnerable locations. Beginning in June 2014, disseminate final report from post-Irene Smart Growth Implementation Assistance project, which includes a checklist for communities interested in improving their flood resilience.
7. Develop and implement adaptation training for all staff.
COMMUNICATIONS 1. EPA R1 Drinking Water program will work with states and tribes to improve effectiveness when
providing requested assistance to states and tribes in emergency events by doing training to our Regional Water Team volunteers on doing phone call damage assessments on an event-specific basis.
2. EPA R1 Drinking Water program will work with State programs to improve data collection and sharing by revising our damage assessment forms as needed per each State’s preference.
3. Increase education to states, tribes, cities, and municipalities on common climate change impacts and guidance for the impacted.
4. Evaluate how EPA can ensure that we are easily accessible and responsive to tribes and states during and after large storms or other emergency events.
5. Streamline how EPA communicates information so that it is easy to access and understandable to the audience in need. These efforts should be coordinated with federal, tribal, and state partners.

57
V. Measurement and Evaluation This section describes how EPA New England will incorporate priority actions into its programs and how these actions will be measured.
A. Measure: Integrate climate adaptation priority actions into the GCCN strategy annually and into other planning documents as needed.
Evaluation: Include consideration of climate impacts into at least 3 processes (e.g., permitting, grant solicitation, enforcement integrated strategies, Invasive Species Control Plans) in the GCCN FY 14 plan. Annually thereafter, review the vulnerabilities and priority actions to update according to the current science and actions taken by others to determine what to address in the annual GCCN Strategy.
B. Measure: Work with states and tribes to integrate climate adaptation into State-EPA and Tribal-EPA planning mechanisms (e.g. PPA/PPGs, begin preliminary discussion in FY 14). Work with grantees and local communities to integrate climate adaptation into planning mechanisms.
Evaluation: All NE states and at least some of the tribes will incorporate adaptation into at least one program action and planning mechanism. Grantees and local communities incorporate adaptation into their planning.
C. Measure: EPA New England will work with EPA national Program offices on national program climate adaptation guidance (e.g., oil program, streamlining of FIFRA registration process, dredging)
Evaluation: Participation in workgroups as invited.
D. Measure: Improve preparedness for extreme events, including incorporating climate change impacts (e.g., flooding, storm surge) into planning documents (e.g. Emergency Planning documents) and outreach (e.g., guidance use of back-up power and alternative heating sources).
Evaluation: EPA will develop response protocols and tools for public outreach; Dialogue with Region 2 to learn from Super Storm Sandy experience.
E. Measure: Collaborate with other federal agencies, academics and NGOs in New England regarding climate change impacts (e.g. coordinating with NEFP, NROC, etc.)
Evaluation: Identify and act on collaboration opportunities to increase scientific understanding and to increase resiliency.
F. Measure: Train EPA employees and states and tribes where appropriate on how to consider impacts of climate change in their EPA duties and obligations.
Evaluation: 90% participation in climate adaptation training.
G. Measure: Conduct outreach on climate change impacts to affected stakeholders (E.g., Soak Up The Rain, outreach to vulnerable population, Burn Wise)
Evaluation: Development of outreach tools and outreach campaigns or events.

58
References 1 Melillo, Jerry M., Terese (T.C.) Richmond, and Gary W. Yohe, Eds., 2014: Climate Change Impacts in the United States: The Third National Climate Assessment. U.S. Global Change Research Program, 841 pp. doi:10.7930/J0Z31WJ2. 2 Vermont Agency of Natural Resources, January 4, 2012: “Lessons from Irene: Building resilience as we rebuild.” Accessed November 6, 2012: http://www.anr.state.vt.us/anr/climatechange/Pubs/Irene_Facts.pdf. 3 Photo source: Vermont Agency of Transportation (VTrans). 4 National Weather Service Forecast Office, October 29, 2011. http://www.nws.noaa.gov/climate/index.php?wfo=box. AIRNow. October 29, 2011. www.airnow.gov 5 Image source: AIRNow, October 31, 2012. www.airnow.gov 6 National Climatic Data Center, 2011: “Mean Number of Days with Maximum Temperature 90 Degrees F or Higher (Data through 2002)”. 7 Melillo, Jerry M., Terese (T.C.) Richmond, and Gary W. Yohe, Eds., 2014: Climate Change Impacts in the United States: The Third National Climate Assessment. U.S. Global Change Research Program, 841 pp. doi:10.7930/J0Z31WJ2. 8 Melillo, Jerry M., Terese (T.C.) Richmond, and Gary W. Yohe, Eds., 2014: Climate Change Impacts in the United States: The Third National Climate Assessment. U.S. Global Change Research Program, 841 pp. doi:10.7930/J0Z31WJ2. 9 State of Vermont. “Update on Vermont’s Recovery from Tropical Storm Irene.” http://www.vtstrong.vermont.gov/Portals/0/Documents/IreneRecoveryreportspw.pdf. 10 Douglas, E., P. Kirshen, V Li., C.Watson, J. Wormser, 2013: “Preparing for the Rising Tide.” 11 Douglas, E., P. Kirshen, V Li., C.Watson, J. Wormser, 2013: “Preparing for the Rising Tide.” 12 Denman, K.L., et al., 2007: Couplings Between Changes in the Climate System and Biogeochemistry. In: Climate Change 2007: The Physical Science Basis. Contribution of Working Group I to the Fourth Assessment Report of the Intergovernmental Panel on Climate Change [Solomon, S., D. Qin, M. Manning, Z. Chen, M. Marquis, K.B. Averyt, M. Tignor and H.L. Miller (eds.)]. Cambridge University Press, Cambridge, United Kingdom and New York, NY, USA. 13 Karl, Thomas R., Jerry M. Melillo, and Thomas C. Peterson, eds., 2009: “Global Climate Change Impacts in the United States” New York, NY: Cambridge University Press. http://downloads.globalchange.gov/usimpacts/pdfs/climate-impacts- report.pdf. 14 Melillo, Jerry M., Terese (T.C.) Richmond, and Gary W. Yohe, Eds., 2014: Climate Change Impacts in the United States: The Third National Climate Assessment. U.S. Global Change Research Program, 841 pp. doi:10.7930/J0Z31WJ2. 15. Wilson, Steven G and Thomas R. Fischetti, May 2010: “Coastline Population Trends in the United States: 1960 to 2008.” US Census Bureau. 16 U.S. Census Bureau, “Population Division, Interim State Population Projections, 2005.” Internet Release Date: April 21, 2005. 17 U.S. Census Bureau, 2012: “Statistical Abstract of the United States”. 18 U.S. Census Bureau, 2012: “Statistical Abstract of the United States”. 19 U.S. Census Bureau, 2012: “Statistical Abstract of the United States”. 20 Karl, Thomas R., Jerry M. Melillo, and Thomas C. Peterson, eds., 2009: “Global Climate Change Impacts in the United States” New York, NY: Cambridge University Press. http://downloads.globalchange.gov/usimpacts/pdfs/climate-impacts- report.pdf. 21Karl, Thomas R., Jerry M. Melillo, and Thomas C. Peterson, eds., 2009: “Global Climate Change Impacts in the United States” New York, NY: Cambridge University Press. http://downloads.globalchange.gov/usimpacts/pdfs/climate-impacts- report.pdf. 22 Karl, Thomas R., Jerry M. Melillo, and Thomas C. Peterson, eds., 2009: “Global Climate Change Impacts in the United States” New York, NY: Cambridge University Press. http://downloads.globalchange.gov/usimpacts/pdfs/climate-impacts- report.pdf. 23 Karl, Thomas R., Jerry M. Melillo, and Thomas C. Peterson, eds., 2009: “Global Climate Change Impacts in the United States” New York, NY: Cambridge University Press. http://downloads.globalchange.gov/usimpacts/pdfs/climate-impacts- report.pdf. 24 University of Maine, February 2009: “Maine’s Climate Future: An Initial Assessment”. 25 Melillo, Jerry M., Terese (T.C.) Richmond, and Gary W. Yohe, Eds., 2014: Climate Change Impacts in the United States: The Third National Climate Assessment. U.S. Global Change Research Program, 841 pp. doi:10.7930/J0Z31WJ2.
59
26 Melillo, Jerry M., Terese (T.C.) Richmond, and Gary W. Yohe, Eds., 2014: Climate Change Impacts in the United States: The Third National Climate Assessment. U.S. Global Change Research Program, 841 pp. doi:10.7930/J0Z31WJ2. 27 Melillo, Jerry M., Terese (T.C.) Richmond, and Gary W. Yohe, Eds., 2014: Climate Change Impacts in the United States: The Third National Climate Assessment. U.S. Global Change Research Program, 841 pp. doi:10.7930/J0Z31WJ2. 28 Pealer and Dunnington. “Climate Change and Vermont’s Waters.” Vermont Climate Change Adaptation White Paper Series, 2011. http://www.anr.state.vt.us/anr/climatechange/Pubs/AdaptationWP_ClimateChangeandWaterReources.pdf. 29 Betts, A. K., 2011: “Climate Change in Vermont”. (Prepared for the State of Vermont.) http://www.anr.state.vt.us/anr/climatechange/Pubs/VTCCAdaptClimateChangeVTBetts.pdf 30 Commonwealth of Massachusetts Executive Office of Energy and Environmental Affairs and the Adaptation Advisory Committee, September 2011: “Massachusetts Climate Change Adaptation Report”. http://www.mass.gov/eea/docs/eea/energy/cca/eea-climate-adaptation-report.pdf 31 Pealer and Dunnington, 2011: “Climate Change and Vermont’s Waters.” Vermont Climate Change Adaptation White Paper Series. http://www.anr.state.vt.us/anr/climatechange/Pubs/AdaptationWP_ClimateChangeandWaterReources.pdf. 32 “Climate Change and Vermont’s Waters.” Vermont Climate Change Adaptation White Paper Series. 33 Austin, John, March 2012: “Fish and Wildlife Conservation and Climate Change Adaptation in Vermont.” Vermont Climate Change Adaptation White Paper Series. 34 University of Maine, February 2009: Maine’s Climate Future: An Initial Assessment. http://climatechange.umaine.edu/files/Maines_Climate_Future.pdf 35 Orwig, David A, David R. Foster and David L. Mausel. “Landscape patterns of hemlock decline in New England due to the introduced hemlock woolly adelgid.” Journal of Biogeography, 29, 1475-1487. 36 Karl, Thomas R., Jerry M. Melillo, and Thomas C. Peterson, eds., 2009: “Global Climate Change Impacts in the United States” New York, NY: Cambridge University Press. http://downloads.globalchange.gov/usimpacts/pdfs/climate-impacts- report.pdf. 37 Frumhoff, P.C., J.J. McCarthy, J.M. Melillo, S.C. Moser, and D.J. Wuebbles, 2006: “Climate Change in the U.S. Northeast: A Report of the Northeast Climate Impacts Assessment.” Union of Concerned Scientists. 38 Melillo, Jerry M., Terese (T.C.) Richmond, and Gary W. Yohe, Eds., 2014: Climate Change Impacts in the United States: The Third National Climate Assessment. U.S. Global Change Research Program, 841 pp. doi:10.7930/J0Z31WJ2. 39 Melillo, Jerry M., Terese (T.C.) Richmond, and Gary W. Yohe, Eds., 2014: Climate Change Impacts in the United States: The Third National Climate Assessment. U.S. Global Change Research Program, 841 pp. doi:10.7930/J0Z31WJ2. 40 Commonwealth of Massachusetts Executive Office of Energy and Environmental Affairs and the Adaptation Advisory Committee, September 2011: “Massachusetts Climate Change Adaptation Report”. http://www.mass.gov/eea/docs/eea/energy/cca/eea-climate-adaptation-report.pdf 41 Melillo, Jerry M., Terese (T.C.) Richmond, and Gary W. Yohe, Eds., 2014: Climate Change Impacts in the United States: The Third National Climate Assessment. U.S. Global Change Research Program, 841 pp. doi:10.7930/J0Z31WJ2 42 Melillo, Jerry M., Terese (T.C.) Richmond, and Gary W. Yohe, Eds., 2014: Climate Change Impacts in the United States: The Third National Climate Assessment. U.S. Global Change Research Program, 841 pp. doi:10.7930/J0Z31WJ2 43 Melillo, Jerry M., Terese (T.C.) Richmond, and Gary W. Yohe, Eds., 2014: Climate Change Impacts in the United States: The Third National Climate Assessment. U.S. Global Change Research Program, 841 pp. doi:10.7930/J0Z31WJ2 44 Pfeffer, J. T. et al.” Kinematic Constraints on Glacier Contributions to 21st-Century Sea-Level Rise.” Science, 321 (5894) pp. 1340-1343, 2008. http://www.sciencemag.org/cgi/content/abstract/321/5894/1340. 45 New Hampshire Department of Environmental Services, March 2009: “New Hampshire Climate Action Plan: A Plan for New Hampshire's Energy, Environmental and Economic Development Future”. http://des.nh.gov/organization/divisions/air/tsb/tps/climate/action_plan/documents/nhcap_final.pdf 46 City of Boston. “Sea Level in Boston Harbor.” http://www.cityofboston.gov/climate/sealevelriseboston.asp 47 Sallenger, A. H. Jr, Doran, K. S. & Howd, P. A, June 2012. “Hotspot of accelerated sea-level rise on the Atlantic coast of North America.” Nature Climate Change. http://dx.doi.org/10.1038/NCLIMATE1597. 48 Rhode Island Coastal Resources Management Council Regulations, March 2008. “Section 145: Climate Change and Sea Level Rise.” Coastal Resources Management Council Program. 49 Commonwealth of Massachusetts Executive Office of Energy and Environmental Affairs and the Adaptation Advisory Committee, September 2011: “Massachusetts Climate Change Adaptation Report”. 50 Dupigny-Giroux, L.-A., 2002: Climate variability and socioeconomic consequences of Vermont’s natural hazards: a historical perspective. Vermont History. 51 Vermont Agency of Natural Resources, January 4, 2012: “Lessons from Irene: Building resilience as we rebuild.” Accessed November 6, 2012: http://www.anr.state.vt.us/anr/climatechange/Pubs/Irene_Facts.pdf.

60
52 Vermont Agency of Natural Resources, January 4, 2012: “Lessons from Irene: Building resilience as we rebuild.” Accessed November 6, 2012: http://www.anr.state.vt.us/anr/climatechange/Pubs/Irene_Facts.pdf. 53 Vermont Agency of Natural Resources, January 4, 2012: “Lessons from Irene: Building resilience as we rebuild.” Accessed November 6, 2012: http://www.anr.state.vt.us/anr/climatechange/Pubs/Irene_Facts.pdf. 54 Vermont Agency of Natural Resources, January 4, 2012: “Lessons from Irene: Building resilience as we rebuild.” Accessed November 6, 2012: http://www.anr.state.vt.us/anr/climatechange/Pubs/Irene_Facts.pdf. 55 Vermont Agency of Natural Resources, January 4, 2012: “Lessons from Irene: Building resilience as we rebuild.” Accessed November 6, 2012: http://www.anr.state.vt.us/anr/climatechange/Pubs/Irene_Facts.pdf. 56 Dolan, K., May 2011: “Climate Change and Public Safety.” Vermont Agency of Natural Resources Climate Change White Papers. 57 Karl, Thomas R., Jerry M. Melillo, and Thomas C. Peterson, eds., 2009: “Global Climate Change Impacts in the United States” New York, NY: Cambridge University Press. http://downloads.globalchange.gov/usimpacts/pdfs/climate-impacts- report.pdf. 58 Frumhoff, P.C., J.J. McCarthy, J.M. Melillo, S.C. Moser, and D.J. Wuebbles, 2007: “Confronting Climate Change in the U.S. Northeast: Science, Impacts, and Solutions.” Synthesis report of the Northeast Climate Impacts Assessment (NECIA). Cambridge, MA: Union of Concerned Scientists (UCS). 59 Melillo, Jerry M., Terese (T.C.) Richmond, and Gary W. Yohe, Eds., 2014: Climate Change Impacts in the United States: The Third National Climate Assessment. U.S. Global Change Research Program, 841 pp. doi:10.7930/J0Z31WJ2. 60 Environmental Protection Agency, November 2012: “Climate Change Indicators in the United States, 2012.” 2nd Edition. 61 US EPA, December 2012, “National Water Program 2012 Strategy: Response to Climate Change”. 62 Karl, Thomas R., Jerry M. Melillo, and Thomas C. Peterson, eds., 2009: “Global Climate Change Impacts in the United States” New York, NY: Cambridge University Press. http://downloads.globalchange.gov/usimpacts/pdfs/climate-impacts- report.pdf. 63 Commonwealth of Massachusetts Executive Office of Energy and Environmental Affairs and the Adaptation Advisory Committee, September 2011: “Massachusetts Climate Change Adaptation Report”. http://www.mass.gov/eea/docs/eea/energy/cca/eea-climate-adaptation-report.pdf 64 US EPA, “National Water Program 2012 Strategy: Response to Climate Change”, December 2012. 65 “Ocean Acidification: A National Strategy to Meet the Challenges of a Changing Ocean.” National Academies Press, 2010. Available at: http://www.nap.edu/catalog.php?record_id=12904. 66 Cooney, Catherine M. “Preparing a People: Climate Change and Public Health.” Environmental Health Perspectives. April 2011. 67 Curtis, Abigail. “Midcoast schools close early due to heat, air quality.” Bangor Daily News, September 1, 2010. 68 Melillo, Jerry M., Terese (T.C.) Richmond, and Gary W. Yohe, Eds., 2014: Climate Change Impacts in the United States: The Third National Climate Assessment. U.S. Global Change Research Program, 841 pp. doi:10.7930/J0Z31WJ2 69 Githeko, A. et al, 2001: Climate change and vector-borne diseases: a regional analysis. Environ. Health Perspect. 109(suppl 2): 223-233. 70 Adams,D. et al, 2013: Summary of Notifiable Diseases- United States,2011. Morbidity and mortality weekly Report 60(53): 1-117. 71 Melillo, Jerry M., Terese (T.C.) Richmond, and Gary W. Yohe, Eds., 2014: Climate Change Impacts in the United States: The Third National Climate Assessment. U.S. Global Change Research Program, 841 pp. 72 U.S. Environmental Protection Agency. “Ground-level Ozone (Smog) Information.” http://www.epa.gov/region1/airquality/. 73 U.S. Environmental Protection Agency. “Clean Energy Options for Addressing High Electric Demand Days.” September 2008, EPA 430-R-08-014. http://www.epa.gov/statelocalclimate/documents/pdf/hedd_clean_energy_options.pdf 74 U.S. Census Bureau, 2009: “American Housing Survey”. 75 U.S. Census Bureau, “American Community Survey”, 2007-2011. 76 U.S. Census Bureau, “American Community Survey”, 2007-2011. 77 U.S. Census Bureau, “American Community Survey”, 2007-2011. 78 http://www.maine.gov/dep/sustainability/climate/index.html. 79 Rhode Island Coastal Resources Management Council Regulations, March 2008: “Section 145: Climate Change and Sea Level Rise.” Coastal Resources Management Council Program. 80 http://www.riclimatechange.org 81City of Cambridge, November 17, 2010: “City to Prioritize Preparations for Climate Change Impacts by participating in New National Adaptation Program.”
61
http://www.cambridgema.gov/citynewsandpublications/news/2010/11/cityofcambridgetoprioritizepreparationsforclimatec hange.aspx. Metropolitan Area Planning Council, June 2012: “Long Range Planning for Sea Level Rise.” http://www.mapc.org/sealevelrise. City of Boston, April 2011: “A Climate of Progress: City of Boston Climate Action Plan Update 2011.” http://www.cityofboston.gov/images_documents/A%20Climate%20of%20Progress%20-%20CAP%20Update%202011_tcm3- 25020.pdf 82 U.S. Environmental Protection Agency, 2013: “Draft Climate Change Adaptation Plan.” 83 U.S. Environmental Protection Agency, September 2010: “FY2011-2015 EPA Strategic Plan: Achieving Our Vision”. 84 U.S Environmental Protection Agency. “Historical Exceedance Days in New England” http://www.epa.gov/region1/airquality/standard.html 85 U.S Environmental Protection Agency. “8-Hour Ozone Nonattaiment Areas in New England” http://www.epa.gov/region1/airquality/nattainm.html. 86 U.S. Environmental Protection Agency. “Assessment of the Impacts of Global Change on Regional U.S. Air Quality: A synthesis of climate change impacts on ground level ozone.” April 2009, EPA/600/R-07/094F 87 U.S. Environmental Protection Agency. “Clean Energy Options for Addressing High Electric Demand Days.” September 2008, EPA 430-R-08-014 88 Denman, K.L., et al., 2007: Couplings Between Changes in the Climate System and Biogeochemistry. In: Climate Change 2007: The Physical Science Basis. Contribution of Working Group I to the Fourth Assessment Report of the Intergovernmental Panel on Climate Change [Solomon, S., D. Qin, M. Manning, Z. Chen, M. Marquis, K.B. Averyt, M. Tignor and H.L. Miller (eds.)]. Cambridge University Press, Cambridge, United Kingdom and New York, NY, USA. 89 Jacob, Daniel J., and Darrell A. Winner, 2009: Effect of climate change on air quality. Atmospheric Environment 43(1): 51- 63. 90 U.S. Environmental Protection Agency. “Assessment of the Impacts of Global Change on Regional U.S. Air Quality: A synthesis of climate change impacts on ground level ozone.” April 2009, EPA/600/R-07/094F 91 U.S. Environmental Protection Agency. “Clean Energy Options for Addressing High Electric Demand Days.” September 2008, EPA 430-R-08-014 92 Institute of Medicine, Climate Change, the Indoor Environment, and Health (Washington, DC: The National Academies Press, 2011). 93 Jacob, Daniel J., and Darrell A. Winner, 2009: Effect of climate change on air quality. Atmospheric Environment 43(1): 51- 63. 94 U.S. Environmental Protection Agency. “Mercury Study Report to Congress. Volume III: Fate and Transport of Mercury in the Environment”. December 1997, EPA-452/R-97-005. 95 Ecotoxicology, 14, 37-52. Keeler, G., et al. 2005. Long-term atmospheric mercury deposition at Underhill, Vermont. Ecotoxicology, 14, 71-83. 96 Adapted from U.S. Environmental Protection Agency, September 2010: “FY2011-2015 EPA Strategic Plan: Achieving Our Vision”. 97 US EPA, December 2012: “National Water Program 2012 Strategy: Response to Climate Change”. 98 Commonwealth of Massachusetts Executive Office of Energy and Environmental Affairs and the Adaptation Advisory Committee, September 2011, “Massachusetts Climate Change Adaptation Report”. http://www.mass.gov/eea/docs/eea/energy/cca/eea-climate-adaptation-report.pdf Jacobson, G.L., I.J. Fernandez, P.A. Mayewski, and C.V. Schmitt (editors), 2009: “Maine’s Climate Future: An Initial Assessment.” Orono, ME: University of Maine. Available at http://www.climatechange.umaine.edu/mainesclimatefuture/. Karlsson, Lee, May 2011: “Vermont Climate Change Health Effects Adaptation.” Vermont Agency of Natural Resrouces Climate Change Adaptation White Paper Series. http://www.anr.state.vt.us/anr/climatechange/Pubs/VTCCAdaptHealthEffects%20.pdf. 99 U.S. Environmental Protection Agency, March 2012: “Oil Storage Facility Spill Prevention and Planning.” Waste Site Cleanup and Resuse in New England.. http://www.epa.gov/region1/superfund/er/oilstor.html. 100 U.S. Environmental Protection Agency, November 2011: “Semiannual Report of UST Performance Measures: End of Fiscal Year 2011 (October 2010-Septevember 30, 2011)”. http://www.epa.gov/oust/cat/ca_11_34.pdf 101 This information is mostly derived from US Environmental Protection Agency Office of Administration and Resources Management’s Draft “High-Level Assessment of EPA’s Vulnerabilities to Climate Change”. 102 Vertical accuracy of 0.49 feet (0.15 meters). Elevation based on MassGIS – LiDAR Terrain Data, accessible at: http://www.mass.gov/anf/research-and-tech/it-serv-and-support/application-serv/office-of-geographic-information- massgis/datalayers/lidar.html.

62
103 Vertical accuracy of 0.49 feet (0.15 meters). Elevation based on MassGIS – LiDAR Terrain Data, accessible at: http://www.mass.gov/anf/research-and-tech/it-serv-and-support/application-serv/office-of-geographic-information- massgis/datalayers/lidar.html. 104 Vertical accuracy of 0.49 feet (0.15 meters). Elevation based on MassGIS – LiDAR Terrain Data, accessible at: http://www.mass.gov/anf/research-and-tech/it-serv-and-support/application-serv/office-of-geographic-information- massgis/datalayers/lidar.html. 105 Map developed by EPA New England’s GIS Center. Tribal seals from individual tribes’ websites. 106 Karl, Thomas R., Jerry M. Melillo, and Thomas C. Peterson, eds., 2009: “Global Climate Change Impacts in the United States” New York, NY: Cambridge University Press. http://downloads.globalchange.gov/usimpacts/pdfs/climate-impacts- report.pdf. 107 http://www.atsdr.cdc.gov/HAC/pha/PenobscotRiver/PenobscotRiverPHAPC01072014_508.pdf p.6. 108 http://maliseetnationconservation.ca/wp-content/uploads/2014/02/Fiddleheads-Contaminants-Study-revised.pdf. 109 http://maliseetnationconservation.ca/wp-content/uploads/2013/10/Moose-Contaminants-Study.pdf. 110 http://www.sciencedirect.com/science/article/pii/S1352231096002312. 111 http://www.nwf.org/~/media/PDFs/Global-Warming/Reports/NowheretoRun-BigGameWildlife- LowResFinal_110613.ashx. 112http://www.pressherald.com/news/Wabanaki_basket_makers livelihood invasive_beetle_interwoven_.html?searchte rm=emerald+ash+borer 113 Melillo, Jerry M., Terese (T.C.) Richmond, and Gary W. Yohe, Eds., 2014: Climate Change Impacts in the United States: The Third National Climate Assessment. U.S. Global Change Research Program, 841 pp. doi:10.7930/J0Z31WJ2. 114 Melillo, Jerry M., Terese (T.C.) Richmond, and Gary W. Yohe, Eds., 2014: Climate Change Impacts in the United States: The Third National Climate Assessment. U.S. Global Change Research Program, 841 pp. doi:10.7930/J0Z31WJ2. 115 Institute of Medicine, The National Academies Press; June 2011: Climate Change, the Indoor Environment and Health. Washington, DC.pp.134,146-147. 116 The National Academies Press, June 2011: Climate Change, the Indoor Environment and Health. Washington, DC: Institute of Medicine, p. 192. 117 Denman, K.L., et al., 2007: Couplings Between Changes in the Climate System and Biogeochemistry. In: Climate Change 2007: The Physical Science Basis. Contribution of Working Group I to the Fourth Assessment Report of the Intergovernmental Panel on Climate Change [Solomon, S., D. Qin, M. Manning, Z. Chen, M. Marquis, K.B. Averyt, M. Tignor and H.L. Miller (eds.)]. Cambridge University Press, Cambridge, United Kingdom and New York, NY, USA. 118 US Environmental Protection Agency, February 2009: Ozone and Your Health. EPA-456/F-09-001.
119 Wall, Dennis, 2008: “Tribal Climate Change Profile: Passamaquoddy Tribe at Pleasant Point.” Institute for Tribal Environmental Professional, Northern Arizona University. 120 National Weather Service Forecast Office, October 29, 2011. http://www.nws.noaa.gov/climate/index.php?wfo=box. AIRNow. October 29, 2011. www.airnow.gov 121 U.S. Environmental Protection Agency. “Clean Energy Options for Addressing High Electric Demand Days.” September 2008, EPA 430-R-08-014.