EOSDIS FY2011 Annual Metrics Report Prepared By: Hyo Duck Chang Adnet, Inc. Brian Krupp Adnet, Inc....
36
EOSDIS FY2011 Annual Metrics Report Prepared By: Hyo Duck Chang Adnet, Inc. Brian Krupp Adnet, Inc. Lalit Wanchoo Adnet, Inc. February 2012
-
Upload
kristopher-richardson -
Category
Documents
-
view
218 -
download
2
Transcript of EOSDIS FY2011 Annual Metrics Report Prepared By: Hyo Duck Chang Adnet, Inc. Brian Krupp Adnet, Inc....

EOSDIS FY2011
Annual Metrics Report
Prepared By:
Hyo Duck Chang Adnet, Inc.
Brian Krupp Adnet, Inc.
Lalit Wanchoo Adnet, Inc.
February 2012
2
Preface
February 2012 FY2011 Annual Report
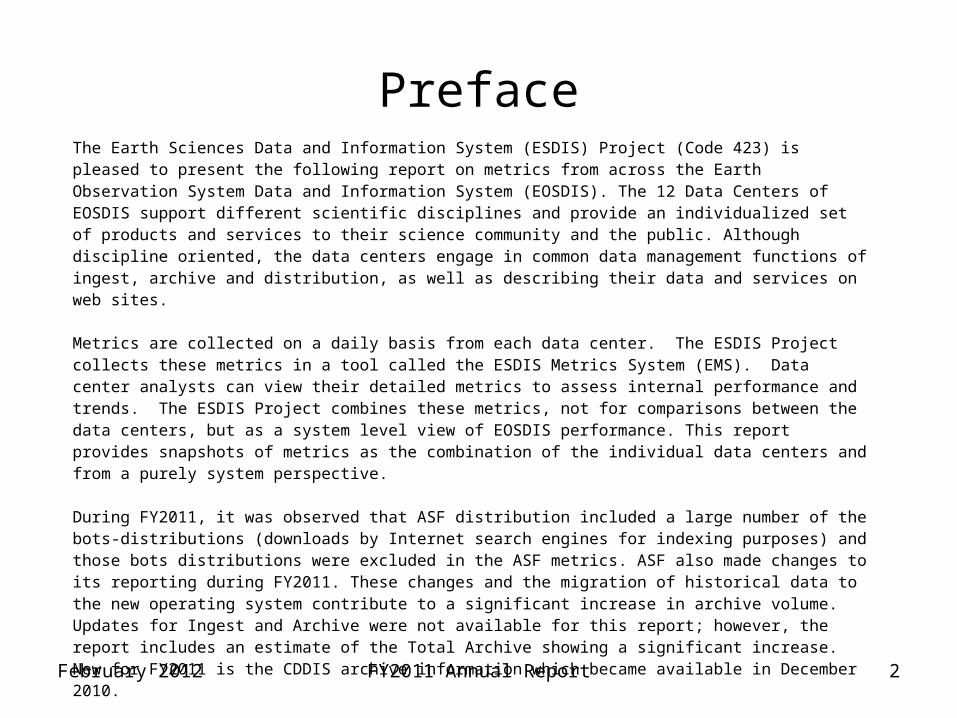
The Earth Sciences Data and Information System (ESDIS) Project (Code 423) is pleased to present the following report on metrics from across the Earth Observation System Data and Information System (EOSDIS). The 12 Data Centers of EOSDIS support different scientific disciplines and provide an individualized set of products and services to their science community and the public. Although discipline oriented, the data centers engage in common data management functions of ingest, archive and distribution, as well as describing their data and services on web sites.
Metrics are collected on a daily basis from each data center. The ESDIS Project collects these metrics in a tool called the ESDIS Metrics System (EMS). Data center analysts can view their detailed metrics to assess internal performance and trends. The ESDIS Project combines these metrics, not for comparisons between the data centers, but as a system level view of EOSDIS performance. This report provides snapshots of metrics as the combination of the individual data centers and from a purely system perspective.
During FY2011, it was observed that ASF distribution included a large number of the bots-distributions (downloads by Internet search engines for indexing purposes) and those bots distributions were excluded in the ASF metrics. ASF also made changes to its reporting during FY2011. These changes and the migration of historical data to the new operating system contribute to a significant increase in archive volume. Updates for Ingest and Archive were not available for this report; however, the report includes an estimate of the Total Archive showing a significant increase. New for FY2011 is the CDDIS archive information which became available in December 2010.
In keeping with previous years, and in order to support trend comparisons, the metrics data are presented on a fiscal year basis, not by calendar year.
If you have any questions or comments please contact Jeanne Behnke at (301) 614-5326 or [email protected] or Kevin Murphy at (301) 614-5580 or [email protected].

3
Introduction• This report presents statistics on data metrics and web activities at the EOSDIS data centers
during Fiscal Year 2011 (October 1, 2010 through September 30, 2011) from the Earth Science Data and Information System (ESDIS) Metrics System (EMS).
• EMS supports the ESDIS project management by collecting and organizing various metrics from the Earth Observing System (EOS) Data and Information System (DIS) Data Centers and other Data Providers. The EMS collects and presents data on the usage of products and services delivered via the Internet or managed in EOSDIS archives.
• EMS consists of a Data Metrics component and a Web Metrics component. The Data Metrics component provides statistics on data ingest, archive and distribution plus data users profile information collected from Data Providers. The Web Metrics component provides statistics on web site visits, views and visitors with a variety of related parameters.
• This report contains tables and graphs of FY2011 statistics and comparisons to previous years. Values for previous fiscal years are produced from EMS unless noted otherwise. Summary tables, text, graphs, and more detailed statistics tables are also included. As for FY2010, this year's report has separate metrics for the Near-Real Time (NRT) and CALIPSO products. It is important to note that metrics for the NRT and CALIPSO products are not used in the distribution trend analyses presented in this report. It is also important to note that all bots-related distributions (downloads by Internet search engines for indexing purposes) are excluded in the ASF metrics.
• Definitions for terms used in this report can be found in the Definitions worksheet.
February 2012 FY2011 Annual Report

Summary
4
Unique Data Sets: Total number of unique data sets distributed in the fiscal year.
Distinct Users of EOSDIS Data and Services: Total unique users across EOSDIS Data Users and Web Visitors, per data center and summed
Web Site Visits: Sum of web visits for data centers where a visit represents a user session not broken by more than 30 minutes and a duration of at least one minute
Average Archive Growth: Sum across reporting data centers of the data volume added to the individual archives divided by the days in the year
Total Archive Volume: Sum across reporting data centers of the data volumes in the archive as of end of the fiscal year
End User Distribution Products: Total number of products distributed from all reporting data centers
End User Average Distribution Volume: Sum across reporting data centers of the data volume distributed for the fiscal year divided by the days in the year
February 2012 FY2011 Annual Report
Unique Data Sets > 5,000Distinct Users of EOSDIS Data and Services
> 1.2 M
Web Site Visits > 1.3 MAverage Archive Growth 1.7 TB/dayTotal Archive Volume 5.8 PBEnd User Distribution Products > 501 MEnd User Average Distribution Volume
13 TB/day
EOSDIS Metrics (Oct. 1, 2010 to Sept. 30, 2011)

5
Data Metrics
•Ingest•Archive•Total Archive•Data Users
−Distinct Users−Repeat Users−Top 20 Countries−Foreign
Distribution
•Distribution−By Data Center−Volume by Domain−Products by Domain−Near Real-time
Products−CALIPSO Products−Top 20 Countries−Top 10 Products−Unique Product Count
February 2012 FY2011 Annual Report
6
Ingest
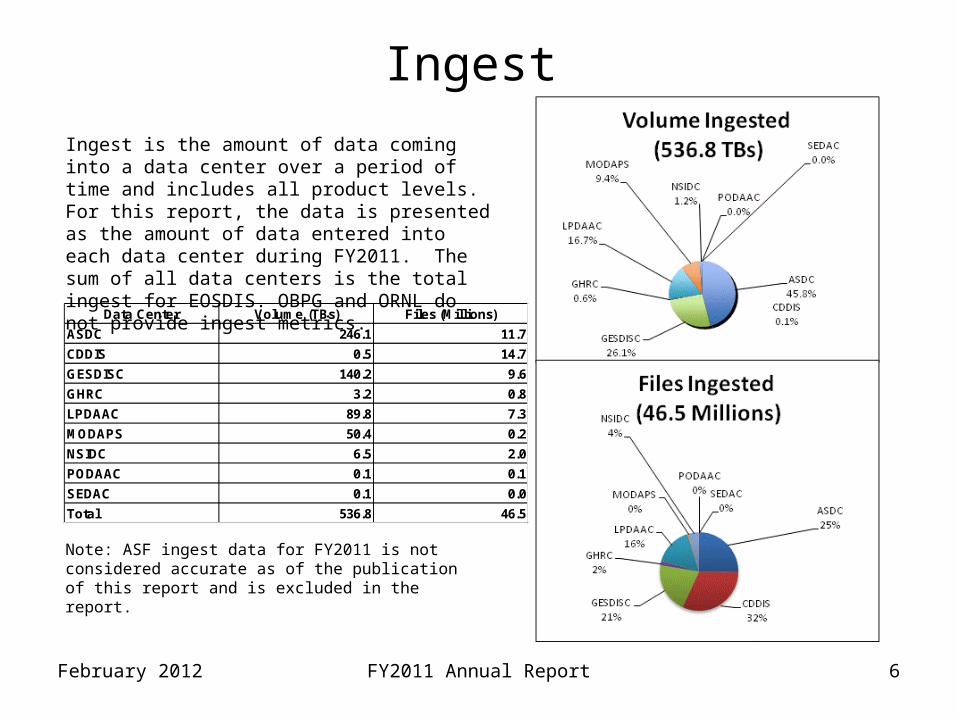
Ingest is the amount of data coming into a data center over a period of time and includes all product levels. For this report, the data is presented as the amount of data entered into each data center during FY2011. The sum of all data centers is the total ingest for EOSDIS. OBPG and ORNL do not provide ingest metrics.
February 2012 FY2011 Annual Report
Note: ASF ingest data for FY2011 is not considered accurate as of the publication of this report and is excluded in the report.
Data Center Volume (TBs) Files (Millions)
ASDC 246.1 11.7
CDDIS 0.5 14.7
GESDISC 140.2 9.6
GHRC 3.2 0.8
LPDAAC 89.8 7.3
MODAPS 50.4 0.2
NSIDC 6.5 2.0
PODAAC 0.1 0.1
SEDAC 0.1 0.0
Total 536.8 46.5
7
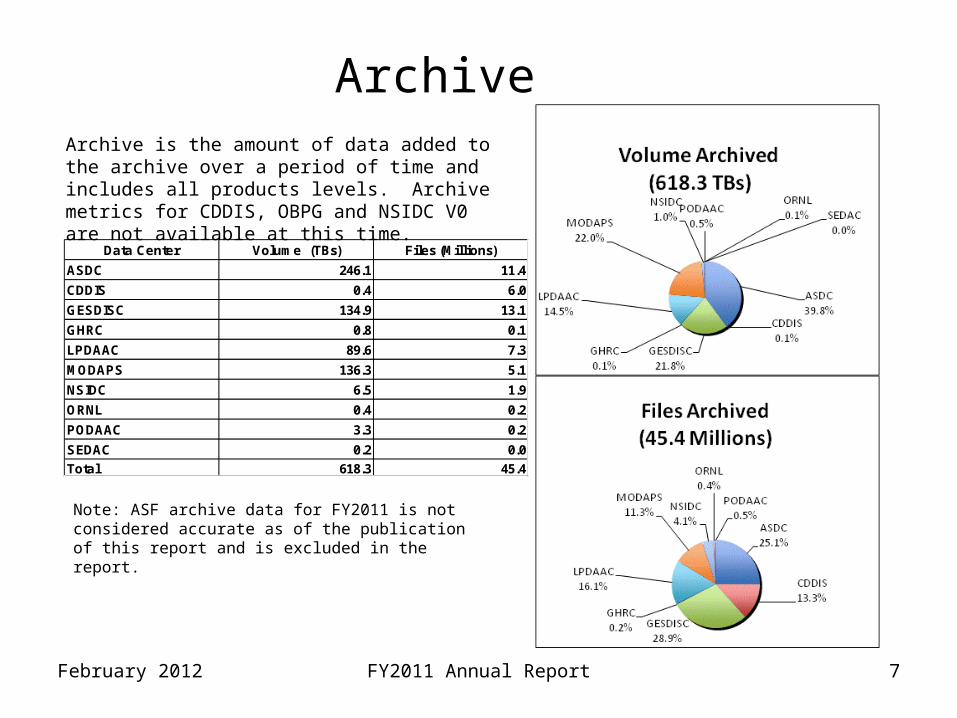
ArchiveArchive is the amount of data added to the archive over a period of time and includes all products levels. Archive metrics for CDDIS, OBPG and NSIDC V0 are not available at this time.
February 2012 FY2011 Annual Report
Note: ASF archive data for FY2011 is not considered accurate as of the publication of this report and is excluded in the report.
Data Center Volume (TBs) Files (Millions)
ASDC 246.1 11.4
CDDIS 0.4 6.0
GESDISC 134.9 13.1
GHRC 0.8 0.1
LPDAAC 89.6 7.3
MODAPS 136.3 5.1
NSIDC 6.5 1.9
ORNL 0.4 0.2
PODAAC 3.3 0.2
SEDAC 0.2 0.0
Total 618.3 45.4

8
Total Archive SizeThe Total Archive Size describes the EOSDIS archive at the end of FY2011. This includes all data (including ancillary) but not data marked for deletion.
February 2012 FY2011 Annual Report
* Archive values were provided by ASDC
** In FY2011, ASF changed the method of managing their archive. Data for this report is based on a February 21, 2012 e-mail from ASF staff.
*** CDDIS archive size was derived from the archive values (6.22 TB, 78,635,159 files) as of 3/6/2012 given by CDDIS
Data Center Volume (TBs) Files (Millions)
ASDC * 1,780.1 84.1
ASF ** 1,801.6 8.6
CDDIS *** 6.0 73.4
GESDISC 422.2 46.4
GHRC 6.4 0.4
LPDAAC 899.0 49.8
MODAPS 882.1 29.7
NSIDC 64.4 18.0
ORNL 0.0 0.1
PODAAC 36.2 2.6
SEDAC 2.9 0.0Total 5,900.9 313.1

9
Distribution By Data CenterDistribution presents the amount of data successfully distributed to Public Users.
February 2012 FY2011 Annual Report
* OBPG data taken from the Ocean Color Website
Distribution by Data Center
ASF CDDIS GESDISC GHRC ASDC LPDAAC MODAPS NSIDC ORNL PO.DAAC SEDAC OBPG* Total
Products (Millions)
0.37 112.33 133.84 0.72 5.04 63.97 98.77 20.18 3.19 38.27 4.16 20.54 501.38
Total Volume (TBs)
103.11 35.76 1,042.45 5.94 195.51 1,178.55 1,578.39 185.14 7.16 111.83 2.88 282.98 4,729.70
10
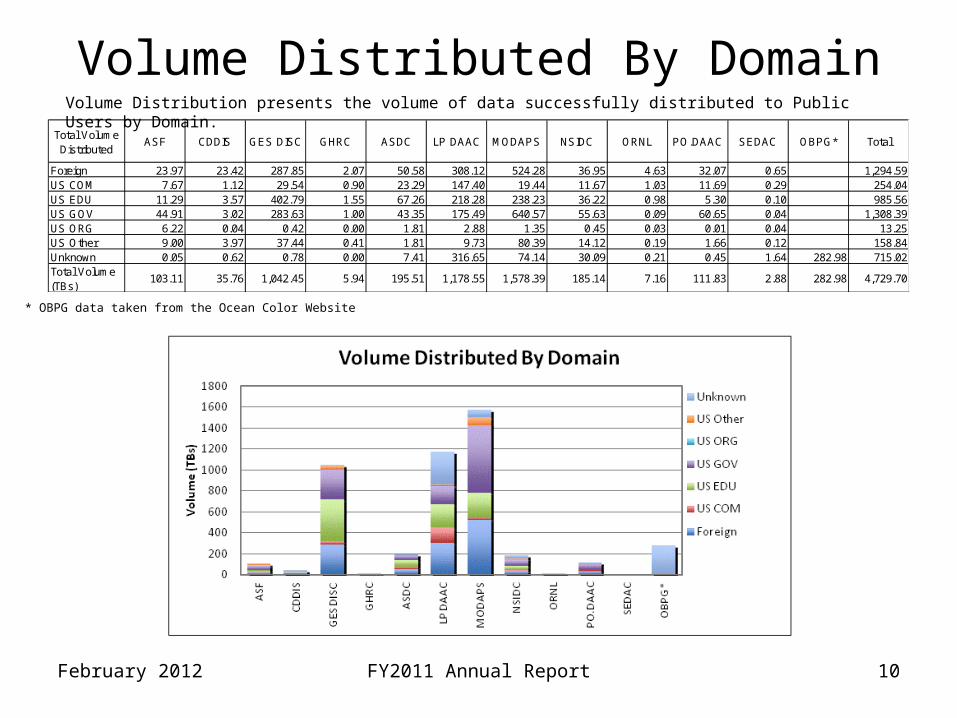
Volume Distributed By DomainVolume Distribution presents the volume of data successfully distributed to Public Users by Domain.
February 2012 FY2011 Annual Report
* OBPG data taken from the Ocean Color Website
Total Volume Distributed
ASF CDDIS GES DISC GHRC ASDC LP DAAC MODAPS NSIDC ORNL PO.DAAC SEDAC OBPG* Total
Foreign 23.97 23.42 287.85 2.07 50.58 308.12 524.28 36.95 4.63 32.07 0.65 1,294.59US COM 7.67 1.12 29.54 0.90 23.29 147.40 19.44 11.67 1.03 11.69 0.29 254.04US EDU 11.29 3.57 402.79 1.55 67.26 218.28 238.23 36.22 0.98 5.30 0.10 985.56US GOV 44.91 3.02 283.63 1.00 43.35 175.49 640.57 55.63 0.09 60.65 0.04 1,308.39US ORG 6.22 0.04 0.42 0.00 1.81 2.88 1.35 0.45 0.03 0.01 0.04 13.25US Other 9.00 3.97 37.44 0.41 1.81 9.73 80.39 14.12 0.19 1.66 0.12 158.84Unknown 0.05 0.62 0.78 0.00 7.41 316.65 74.14 30.09 0.21 0.45 1.64 282.98 715.02Total Volume (TBs)
103.11 35.76 1,042.45 5.94 195.51 1,178.55 1,578.39 185.14 7.16 111.83 2.88 282.98 4,729.70

11
Product Distribution By DomainProduct Distribution presents the number of products successfully distributed to Public Users by Domain.
February 2012 FY2011 Annual Report
* OBPG data taken from the Ocean Color Website
Total Products Distributed
ASF CDDIS GES DISC GHRC ASDC LP DAAC MODAPS NSIDC ORNL PO.DAAC SEDAC OBPG* Total
Foreign 0.06 70.05 43.14 0.13 1.52 16.69 29.61 8.29 2.11 15.65 2.24 189.50US COM 0.03 5.30 5.53 0.27 1.39 8.10 2.86 2.05 0.25 7.43 0.96 34.18US EDU 0.07 14.21 56.51 0.19 1.36 10.47 9.80 3.36 0.74 1.72 0.33 98.76US GOV 0.16 11.72 23.00 0.09 0.46 5.07 49.98 3.66 0.01 12.79 0.07 107.01US ORG 0.01 0.20 0.11 0.00 0.02 0.10 0.07 0.06 0.00 0.00 0.10 0.66US Other 0.04 9.63 5.31 0.04 0.02 0.28 4.62 1.03 0.08 0.29 0.35 21.69Unknown 0.00 1.23 0.24 0.00 0.28 23.25 1.82 1.74 0.00 0.39 0.09 20.54 49.58
Total Products (Millions)
0.37 112.33 133.84 0.72 5.04 63.97 98.77 20.18 3.19 38.27 4.16 20.54 501.38
FY2011 Annual Report 12February 2012
Distribution of NRT Products
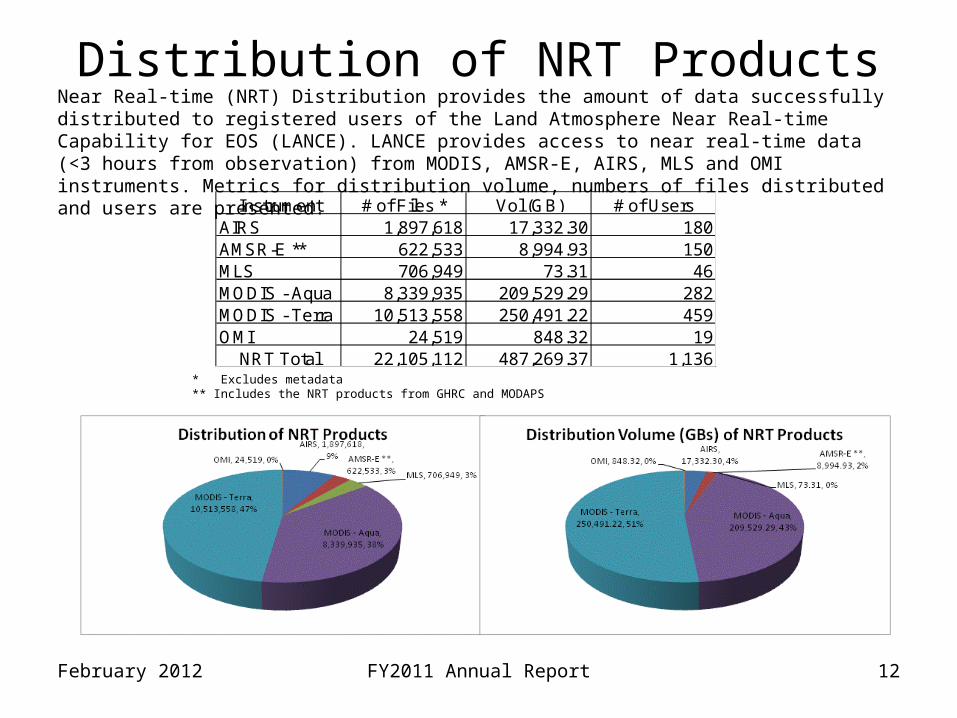
* Excludes metadata** Includes the NRT products from GHRC and MODAPS
Near Real-time (NRT) Distribution provides the amount of data successfully distributed to registered users of the Land Atmosphere Near Real-time Capability for EOS (LANCE). LANCE provides access to near real-time data (<3 hours from observation) from MODIS, AMSR-E, AIRS, MLS and OMI instruments. Metrics for distribution volume, numbers of files distributed and users are presented.
Instrument # of Files * Vol (GB) # of UsersAIRS 1,897,618 17,332.30 180AMSR-E ** 622,533 8,994.93 150MLS 706,949 73.31 46MODIS - Aqua 8,339,935 209,529.29 282MODIS - Terra 10,513,558 250,491.22 459OMI 24,519 848.32 19
NRT Total 22,105,112 487,269.37 1,136

FY2011 Annual Report 13February 2012
* Excludes metadata
Although not an EOSDIS supported mission, the Cloud-Aerosol Lidar and Infrared Pathfinder Satellite Observations (CALIPSO) is an Earth science mission with data available through the Atmospheric Sciences Data Center (ASDC) at NASA Langley Research Center. The tables below provide distribution statistics particular to CALIPSO. These statistics are not included in the EOSDIS totals.
Distribution of CALIPSO Products
Mission Instrument # of Files * Vol (GB) # of UsersCALIPSO CALIOP 5,257,467 428,704.44 712CALIPSO Imaging Infrared Radiometer 97,464 1,410.41 49CALIPSO Wide Field Camera 20,742 1,197.66 34
5,375,673 431,312.51 795Total for CALIPSO

14
Data Distribution - Top 20 Countries
February 2012 FY2011 Annual Report
* Some products are inherently larger than other files in size and therefore may skew the results.** When counting # of files, metadata files are not included.
Ranking CountryVolume (GBs)
1 United States 2,785,372.122 Japan 250,755.553 China 230,745.144 France 179,275.075 Germany 113,162.796 Belgium 100,567.637 United Kingdom 66,391.898 Canada 61,891.739 Korea, Republic of 43,545.4710 Italy 32,962.4311 Australia 29,854.4712 Denmark 19,095.3713 Spain 17,684.4614 Russian Federation 17,614.2115 Switzerland 15,412.7916 Brazil 13,821.4717 Sweden 13,577.7918 India 12,726.0119 Netherlands 12,503.9020 Taiwan 9,706.44
Top 20 Countries by Volume Distributed*Ranking Country Products
1 United States 262,304,2052 China 36,596,7173 Japan 20,729,5254 United Kingdom 17,921,4775 France 17,699,1726 Germany 13,830,8137 Russian Federation 9,376,3788 Belgium 7,286,2179 Korea, Republic of 6,724,33410 Canada 5,468,39111 Australia 5,165,03012 Denmark 4,187,83813 Taiwan 4,018,86814 Brazil 3,641,00515 Czech Republic 3,411,23816 Italy 3,134,90317 India 2,898,93118 Spain 2,803,10619 Finland 2,717,57620 Portugal 1,824,900
Top 20 Countries by Products Distributed**

FY2011 Annual Report 15February 2012
Tables below show the number of unique data products distributed to public users during FY2011. In counting unique products, metadata were excluded. Also excluded are the NRT and CALIPSO products.
Distribution of Unique Data Products
* OBPG is not included since no product information is available.
DAAC ASF CDDIS GES DISC GHRC ASDC LP DAAC MODAPS NSIDC ORNL PO DAAC SEDAC Total# of Products * 35 188 1,625 179 598 244 510 329 956 198 184 5,046
16
Data Distribution - Top 10 Products
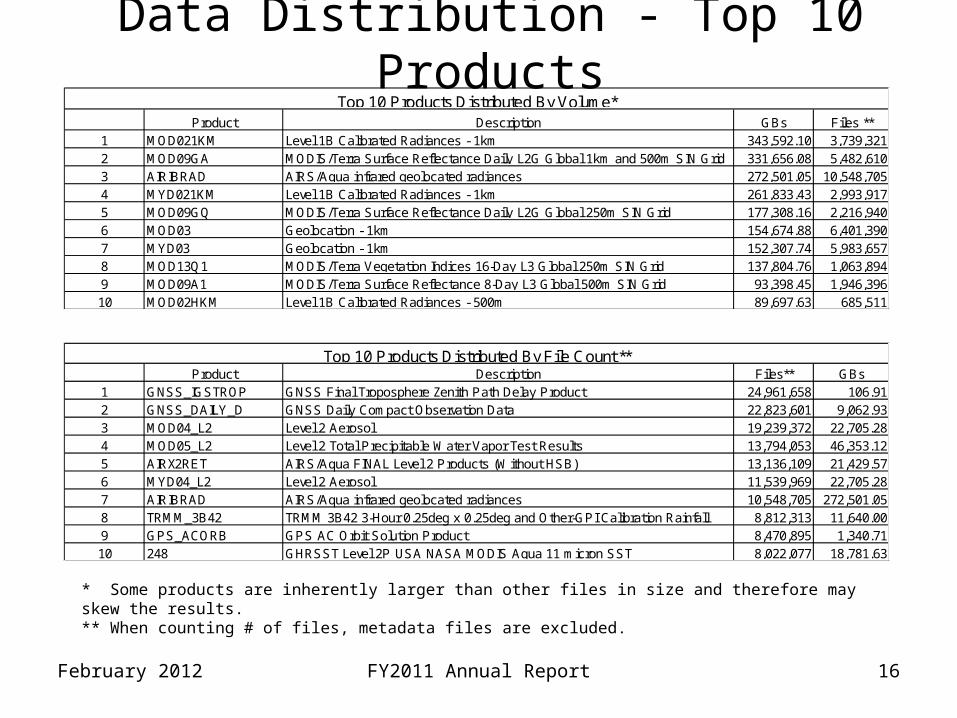
* Some products are inherently larger than other files in size and therefore may skew the results.** When counting # of files, metadata files are excluded.
February 2012 FY2011 Annual Report
Product Description GBs Files **1 MOD021KM Level 1B Calibrated Radiances - 1km 343,592.10 3,739,3212 MOD09GA MODIS/Terra Surface Reflectance Daily L2G Global 1km and 500m SIN Grid 331,656.08 5,482,6103 AIRIBRAD AIRS/Aqua infrared geolocated radiances 272,501.05 10,548,7054 MYD021KM Level 1B Calibrated Radiances - 1km 261,833.43 2,993,9175 MOD09GQ MODIS/Terra Surface Reflectance Daily L2G Global 250m SIN Grid 177,308.16 2,216,9406 MOD03 Geolocation - 1km 154,674.88 6,401,3907 MYD03 Geolocation - 1km 152,307.74 5,983,6578 MOD13Q1 MODIS/Terra Vegetation Indices 16-Day L3 Global 250m SIN Grid 137,804.76 1,063,8949 MOD09A1 MODIS/Terra Surface Reflectance 8-Day L3 Global 500m SIN Grid 93,398.45 1,946,39610 MOD02HKM Level 1B Calibrated Radiances - 500m 89,697.63 685,511
Top 10 Products Distributed By Volume*
Product Description Files** GBs1 GNSS_IGSTROP GNSS Final Troposphere Zenith Path Delay Product 24,961,658 106.912 GNSS_DAILY_D GNSS Daily Compact Observation Data 22,823,601 9,062.933 MOD04_L2 Level 2 Aerosol 19,239,372 22,705.284 MOD05_L2 Level 2 Total Precipitable Water Vapor Test Results 13,794,053 46,353.125 AIRX2RET AIRS/Aqua FINAL Level 2 Products (Without HSB) 13,136,109 21,429.576 MYD04_L2 Level 2 Aerosol 11,539,969 22,705.287 AIRIBRAD AIRS/Aqua infrared geolocated radiances 10,548,705 272,501.058 TRMM_3B42 TRMM 3B42 3-Hour 0.25deg x 0.25deg and Other-GPI Calibration Rainfall 8,812,313 11,640.009 GPS_ACORB GPS AC Orbit Solution Product 8,470,895 1,340.7110 248 GHRSST Level 2P USA NASA MODIS Aqua 11 micron SST 8,022,077 18,781.63
Top 10 Products Distributed By File Count **
17
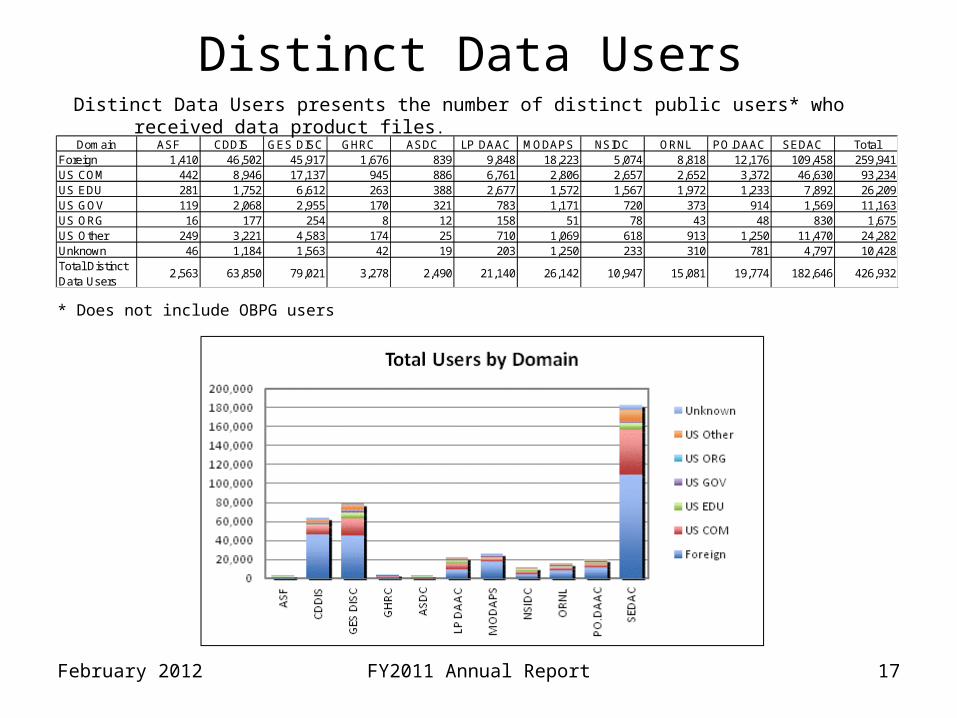
Distinct Data UsersDistinct Data Users presents the number of distinct public users* who received data product files .
* Does not include OBPG users
February 2012 FY2011 Annual Report
Domain ASF CDDIS GES DISC GHRC ASDC LP DAAC MODAPS NSIDC ORNL PO.DAAC SEDAC TotalForeign 1,410 46,502 45,917 1,676 839 9,848 18,223 5,074 8,818 12,176 109,458 259,941US COM 442 8,946 17,137 945 886 6,761 2,806 2,657 2,652 3,372 46,630 93,234US EDU 281 1,752 6,612 263 388 2,677 1,572 1,567 1,972 1,233 7,892 26,209US GOV 119 2,068 2,955 170 321 783 1,171 720 373 914 1,569 11,163US ORG 16 177 254 8 12 158 51 78 43 48 830 1,675US Other 249 3,221 4,583 174 25 710 1,069 618 913 1,250 11,470 24,282Unknown 46 1,184 1,563 42 19 203 1,250 233 310 781 4,797 10,428Total Distinct Data Users
2,563 63,850 79,021 3,278 2,490 21,140 26,142 10,947 15,081 19,774 182,646 426,932

18
Repeat Data UsersRepeat users are distinct Public users* who received data on more than one day in the fiscal year .
* Does not include OBPG users
February 2012 FY2011 Annual Report
Domain ASF CDDIS GES DISC GHRC ASDC LP DAAC MODAPS NSIDC ORNL PO.DAAC SEDAC TotalForeign 282 7,255 5,854 146 191 2,270 3,267 784 740 1,346 5,243 27,378US COM 41 2,711 2,567 242 366 1,651 1,049 373 343 787 1,650 11,780US EDU 84 399 1,335 34 119 699 398 321 152 142 376 4,059US GOV 41 790 822 31 122 260 376 192 44 186 268 3,132US ORG 6 54 39 0 3 39 14 25 3 3 114 300US Other 49 971 658 19 10 171 219 61 66 107 1,026 3,357Unknown 1 136 149 5 7 60 104 52 11 63 326 914Total Repeat Data Users
504 12,316 11,424 477 818 5,150 5,427 1,808 1,359 2,634 9,003 50,920
19
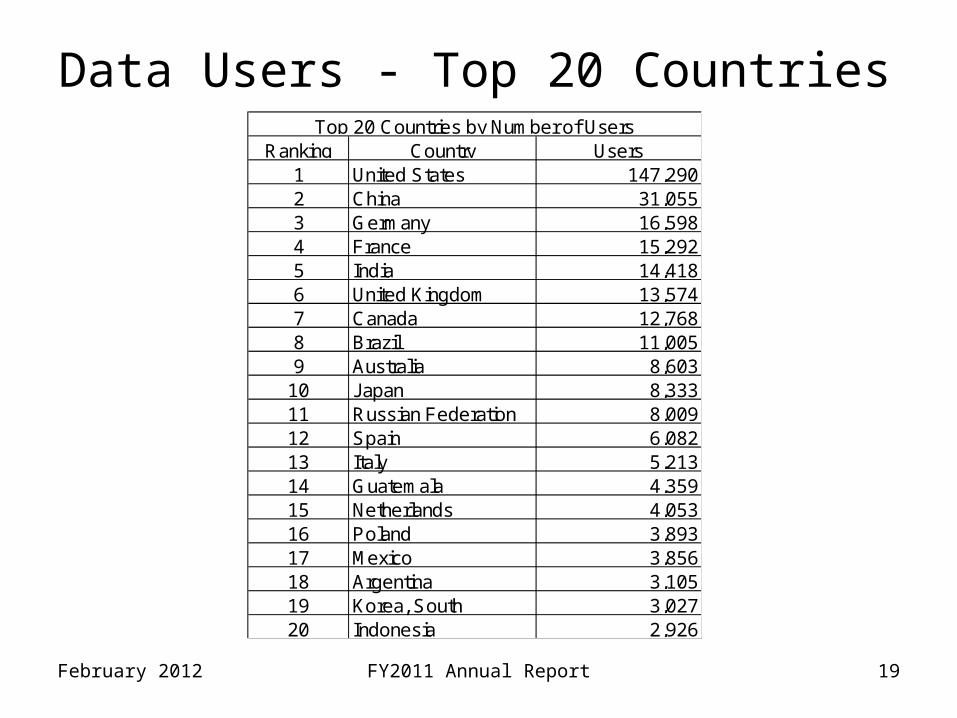
Data Users - Top 20 Countries
February 2012 FY2011 Annual Report
Ranking Country Users1 United States 147,2902 China 31,0553 Germany 16,5984 France 15,2925 India 14,4186 United Kingdom 13,5747 Canada 12,7688 Brazil 11,0059 Australia 8,603
10 Japan 8,33311 Russian Federation 8,00912 Spain 6,08213 Italy 5,21314 Guatemala 4,35915 Netherlands 4,05316 Poland 3,89317 Mexico 3,85618 Argentina 3,10519 Korea, South 3,02720 Indonesia 2,926
Top 20 Countries by Number of Users

FY2011 Annual Report 20February 2012
Foreign Distribution
* EU includes 27 European Union member countries.** China includes only People’s Republic of China and does not include Taiwan or Hong Kong.
Foreign Country # of Users # of Products (1000s) Vol (TBs)EU * 84,295 80,296 559.42Canada 12,768 5,468 60.44China ** 31,055 36,597 225.34Japan 8,333 20,730 244.88Other 124,888 75,447 636.56
Distribution metrics for foreign public users are compared. Statistics are based on country information provided by 11 EOSDIS data centers.
21
Web Metrics
•Visitors and Visits
•Repeat Visitors
•Top 20 Domains
•Top 20 Countries
February 2012 FY2011 Annual Report
22
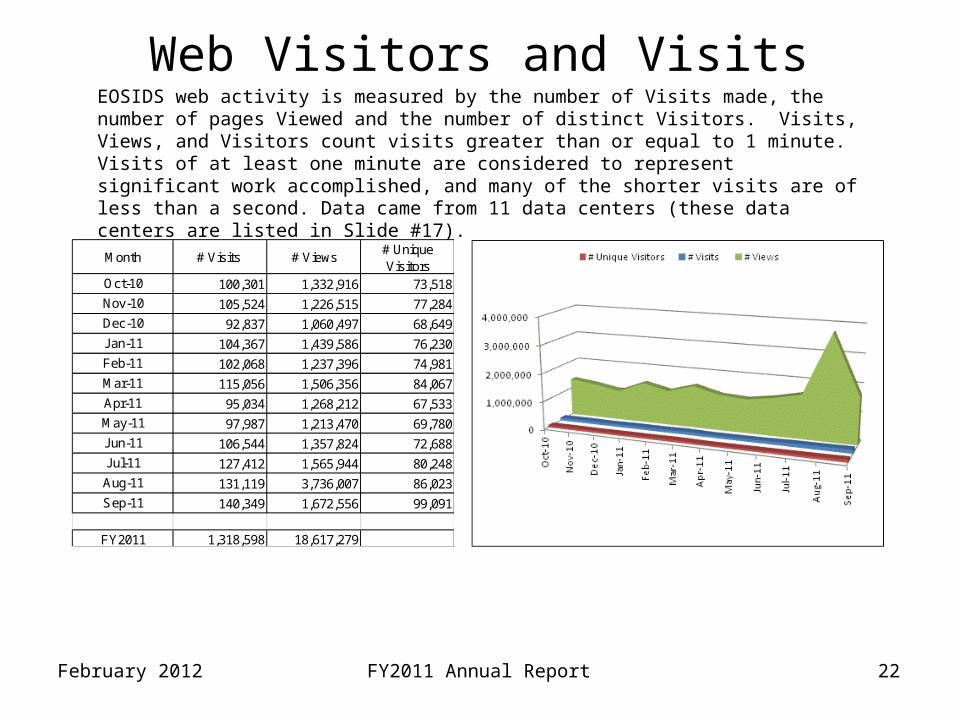
Web Visitors and VisitsEOSIDS web activity is measured by the number of Visits made, the number of pages Viewed and the number of distinct Visitors. Visits, Views, and Visitors count visits greater than or equal to 1 minute. Visits of at least one minute are considered to represent significant work accomplished, and many of the shorter visits are of less than a second. Data came from 11 data centers (these data centers are listed in Slide #17).
February 2012 FY2011 Annual Report
Month # Visits # Views# Unique Visitors
Oct-10 100,301 1,332,916 73,518
Nov-10 105,524 1,226,515 77,284
Dec-10 92,837 1,060,497 68,649
J an-11 104,367 1,439,586 76,230
Feb-11 102,068 1,237,396 74,981
Mar-11 115,056 1,506,356 84,067
Apr-11 95,034 1,268,212 67,533
May-11 97,987 1,213,470 69,780
J un-11 106,544 1,357,824 72,688
J ul-11 127,412 1,565,944 80,248
Aug-11 131,119 3,736,007 86,023
Sep-11 140,349 1,672,556 99,091
FY2011 1,318,598 18,617,279
23
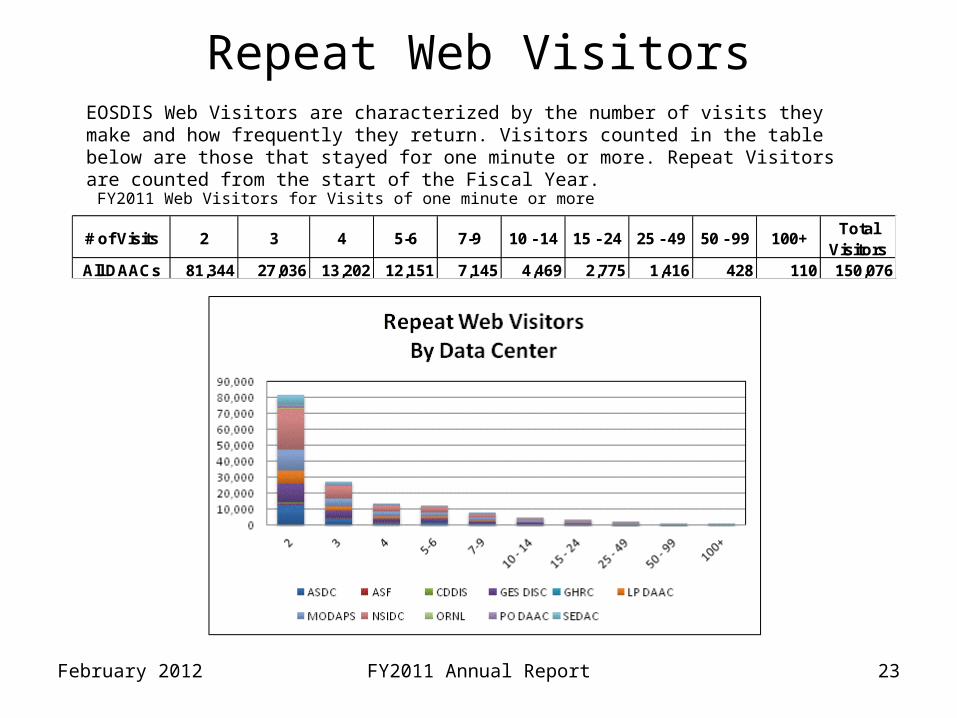
Repeat Web VisitorsEOSDIS Web Visitors are characterized by the number of visits they make and how frequently they return. Visitors counted in the table below are those that stayed for one minute or more. Repeat Visitors are counted from the start of the Fiscal Year.
FY2011 Web Visitors for Visits of one minute or more
February 2012 FY2011 Annual Report
# of Visits 2 3 4 5-6 7-9 10 - 14 15 - 24 25 - 49 50 - 99 100+Total
VisitorsAll DAACs 81,344 27,036 13,202 12,151 7,145 4,469 2,775 1,416 428 110 150,076

24
Top 20 Domains By # of Web VisitorsThe FY2011 Top 20 Domains for visits >= 1 minute is sorted by the # of Visitors. Data came from 11 data center s (these data centers are listed in Slide #17). All statistics are based on domains resolved by NetInsight, using host information.
February 2012 FY2011 Annual Report
Ranking Domain VisitorsPercent Visitors
VisitsPercent
VisitsViews
Percent Views
1 Unresolved 233,363 7.10% 388,840 6.70% 5,467,502 22.30%2 Network (.net) 194,492 5.90% 265,157 4.60% 2,524,447 10.30%3 Commercial (.com) 88,597 2.70% 127,288 2.20% 1,381,945 5.60%4 United States Educational 41,865 1.30% 85,447 1.50% 2,428,571 9.90%5 United States Government 14,170 0.40% 52,367 0.90% 1,768,690 7.20%6 Australia 17,148 0.50% 24,961 0.40% 246,252 1.00%7 Canada 14,525 0.40% 23,564 0.40% 252,792 1.00%8 Germany 12,674 0.40% 21,346 0.40% 282,440 1.20%9 United Kingdom 11,781 0.40% 20,966 0.40% 264,451 1.10%10 Japan 9,817 0.30% 20,454 0.40% 270,359 1.10%11 India 11,092 0.30% 18,712 0.30% 299,357 1.20%12 Italy 11,732 0.40% 17,432 0.30% 203,529 0.80%13 Argentina 9,644 0.30% 16,690 0.30% 220,485 0.90%14 France 8,528 0.30% 15,032 0.30% 215,659 0.90%15 Netherlands 6,849 0.20% 15,028 0.30% 158,504 0.60%16 Brazil 8,615 0.30% 13,098 0.20% 236,287 1.00%17 Russia 6,376 0.20% 12,121 0.20% 176,388 0.70%18 Organization (.org) 6,062 0.20% 10,890 0.20% 141,736 0.60%19 Mexico 7,002 0.20% 9,345 0.20% 123,695 0.50%20 United States (.us) 5,405 0.20% 9,050 0.20% 97,948 0.40%

25
Top 20 Countries By # Web VisitsThe FY2011 Top 20 Countries for visits >= 1 minute is sorted by the # of Visits. Data came from 11 data center s (these data centers are listed in Slide #17). All statistics are based on country information resolved by NetInsight.
February 2012 FY2011 Annual Report
Ranking Country VisitorsPercent Visitors
VisitsPercent
VisitsViews
Percent Views
1 United States 52,810 1.60% 87,115 1.50% 1,235,080 5.00%
2 China 37,291 1.10% 77,507 1.30% 1,125,414 4.60%
3 India 20,180 0.60% 33,555 0.60% 607,435 2.50%
4 Great Britain 10,467 0.30% 14,555 0.30% 115,051 0.50%
5 Canada 8,432 0.30% 13,030 0.20% 127,330 0.50%
6 Korea, Republic of 5,831 0.20% 10,534 0.20% 186,005 0.80%
7 Australia 5,020 0.20% 7,697 0.10% 67,102 0.30%
8 Russia 3,949 0.10% 7,274 0.10% 88,873 0.40%
9 Iran 4,286 0.10% 7,161 0.10% 110,869 0.50%
10 Italy 4,428 0.10% 6,864 0.10% 94,515 0.40%
11 Germany 3,305 0.10% 5,710 0.10% 76,015 0.30%
12 Philippines 4,913 0.10% 5,694 0.10% 32,275 0.10%
13 J apan 2,180 0.10% 5,538 0.10% 102,435 0.40%
14 Spain 3,481 0.10% 5,428 0.10% 95,569 0.40%
15 Indonesia 3,548 0.10% 5,112 0.10% 92,944 0.40%
16 Brazil 2,839 0.10% 4,538 0.10% 63,761 0.30%
17 Malayasia 2,320 0.10% 4,518 0.10% 62,849 0.30%
18 France 1,920 0.10% 3,586 0.10% 42,515 0.20%
19 Chile 1,769 0.10% 3,185 0.10% 59,449 0.20%
20 Thailand 1,946 0.10% 3,076 0.10% 40,102 0.20%

26
Total Users and Trends
•Total Users
•Data Volume Distribution Trend
•Data Product Distribution Trend
•Top 10 Products Trend FY2010-FY2011
•Known U.S. - Foreign Product Distribution
Trend
•Web Trends (Visits and Visitors)February 2012 FY2011 Annual Report
FY2011 Annual Report 27February 2012
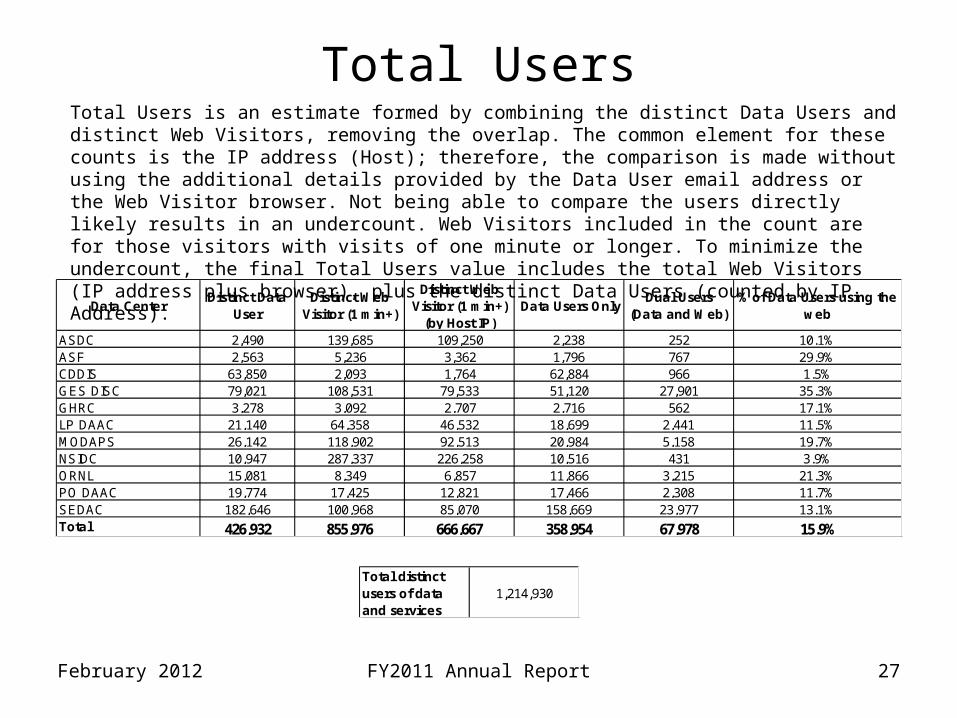
Total UsersTotal Users is an estimate formed by combining the distinct Data Users and distinct Web Visitors, removing the overlap. The common element for these counts is the IP address (Host); therefore, the comparison is made without using the additional details provided by the Data User email address or the Web Visitor browser. Not being able to compare the users directly likely results in an undercount. Web Visitors included in the count are for those visitors with visits of one minute or longer. To minimize the undercount, the final Total Users value includes the total Web Visitors (IP address plus browser), plus the distinct Data Users (counted by IP Address).
Data CenterDistinct Data
UserDistinct Web
Visitor (1 min+)
Distinct WebVisitor (1 min+)
(by Host IP) Data Users Only
Dual Users(Data and Web)
% of Data Users using the web
ASDC 2,490 139,685 109,250 2,238 252 10.1%ASF 2,563 5,236 3,362 1,796 767 29.9%CDDIS 63,850 2,093 1,764 62,884 966 1.5%GES DISC 79,021 108,531 79,533 51,120 27,901 35.3%GHRC 3,278 3,092 2,707 2,716 562 17.1%LP DAAC 21,140 64,358 46,532 18,699 2,441 11.5%MODAPS 26,142 118,902 92,513 20,984 5,158 19.7%NSIDC 10,947 287,337 226,258 10,516 431 3.9%ORNL 15,081 8,349 6,857 11,866 3,215 21.3%PO DAAC 19,774 17,425 12,821 17,466 2,308 11.7%SEDAC 182,646 100,968 85,070 158,669 23,977 13.1%Total 426,932 855,976 666,667 358,954 67,978 15.9%
Total distinct users of data and services
1,214,930

28
Data Volume Distribution TrendThe Volume Distribution Trend presents distributed volume counts from EMS by data center. OBPG distribution metrics from the Ocean Color web site are included beginning in FY2004. CDDIS data became available in FY2009.
February 2012 FY2011 Annual Report
Fiscal Year ASF CDDIS GESDISC GHRC ASDC LP DAAC MODAPS NSIDC ORNL PO.DAAC SEDAC OBPG TotalFY00 0.01 20.99 0.63 6.32 8.69 0.00 0.24 0.01 1.85 0.08 38.82FY01 0.14 45.37 1.00 30.38 25.71 0.00 0.40 0.02 2.73 0.12 105.87FY02 0.05 82.97 1.25 62.53 171.32 0.00 1.36 0.47 4.92 0.17 325.03FY03 1.36 185.02 6.49 107.90 110.43 0.00 4.20 1.21 28.08 0.22 444.90FY04 2.35 278.13 7.70 147.01 209.82 0.00 15.91 1.23 37.49 0.16 2.90 702.68FY05 2.31 361.22 7.56 127.37 224.27 0.00 27.11 1.90 31.37 0.17 8.69 791.97FY06 1.88 493.29 9.10 204.70 329.00 18.48 55.69 0.95 36.55 0.16 23.71 1,173.50FY07 2.16 192.65 8.01 225.24 431.40 564.21 69.54 1.17 14.06 0.08 36.01 1,544.53FY08 16.50 302.80 12.08 167.14 448.12 813.94 81.32 0.74 62.17 0.06 59.61 1,964.48FY09 41.98 9.20 487.32 8.63 187.92 538.94 866.75 120.00 2.86 91.35 0.32 73.96 2,429.21FY10 2.66 17.43 698.68 12.41 232.71 952.71 1,287.38 140.17 4.99 104.92 1.43 173.85 3,629.34FY11 103.11 35.76 1,042.45 5.94 195.51 1,178.55 1,578.39 185.14 7.16 111.83 2.88 282.98 4,729.70
Total Volume (TBs)
174.51 62.39 4,190.88 80.79 1,694.72 4,628.95 5,129.16 701.06 22.71 527.32 5.84 661.69 17,880.03

29
Data Product Distribution TrendThe Product Distribution Trend presents distributed product counts from EMS by data center. OBPG distribution metrics from the Ocean Color web site are included beginning in FY2004. CDDIS data became available in FY2009.
February 2012 FY2011 Annual Report
Fiscal Year ASF CDDIS GESDISC GHRC ASDC LP DAAC MODAPS NSIDC ORNL PO.DAAC SEDAC OBPG TotalFY00 0.00 2.34 0.97 0.22 0.62 0.00 0.13 0.01 1.05 0.19 5.52FY01 0.00 2.64 1.03 0.97 1.24 0.00 0.25 0.03 2.08 0.26 8.49FY02 0.00 5.28 1.42 3.68 4.63 0.00 0.40 0.09 3.55 0.26 19.31FY03 0.03 10.92 4.68 4.15 3.72 0.00 0.86 0.11 10.45 0.30 35.21FY04 0.06 15.67 3.40 6.77 8.90 0.00 0.96 0.42 10.30 0.25 0.29 47.03FY05 0.06 26.55 3.58 5.70 15.08 0.00 1.80 0.49 12.83 0.26 1.71 68.06FY06 0.04 41.41 4.05 7.78 11.93 1.67 4.69 0.36 13.48 0.32 4.91 90.64FY07 0.05 30.98 9.29 7.32 24.32 33.36 8.13 1.22 5.71 0.11 7.04 127.54FY08 0.30 38.75 10.18 3.57 16.76 47.74 10.73 0.40 16.49 0.07 10.67 155.66FY09 0.47 37.06 54.50 5.68 5.11 38.83 47.21 17.25 7.70 31.72 0.49 8.66 254.66FY10 0.10 52.60 84.22 0.66 4.41 51.95 79.76 22.90 49.88 50.33 3.57 12.43 412.80FY11 0.37 112.33 133.84 0.72 5.04 63.97 98.77 20.18 3.19 38.27 4.16 20.54 501.38
Total Products (Millions)
1.48 201.99 447.09 45.66 54.72 241.94 308.49 88.27 63.90 196.29 10.24 66.24 1,726.30

30
Top 10 Products Trend by VolumeFY2010 – FY2011
*Some products are inherently larger than other files in size and therefore may skew the results.
February 2012 FY2011 Annual Report
Ranking Product Description GBs Files1 MOD09GA MODIS/Terra Surface Reflectance Daily L2G Global 1km and 500m SIN Grid 226,826.39 2,850,7832 MOD021KM MODIS/Terra Level 1B Calibrated Radiances - 1km 210,100.01 2,378,4533 MOD03 MODIS/Terra Geolocation - 1km 158,329.60 6,432,1784 MYD021KM MODIS/Aqua Level 1B Calibrated Radiances - 1km 156,542.44 1,707,6725 AIRIBRAD AIRS/Aqua infrared geolocated radiances 141,685.42 9,320,8906 MYD09GA MODIS/Aqua Surface Reflectance Daily L2G Global 1km and 500m SIN Grid 126,802.22 1,629,7567 MYD03 MODIS/Aqua Geolocation - 1km 122,261.48 4,865,7548 MOD13Q1 MODIS/Terra Vegetation Indices 16-Day L3 Global 250m SIN Grid 114,249.90 816,7269 MOD09GQ MODIS/Terra Surface Reflectance Daily L2G Global 250m SIN Grid 100,876.07 1,252,62510 MOD02HKM MODIS/Terra Level 1B Calibrated Radiances - 500m 86,922.21 675,024
Ranking Product Description GBs Files1 MOD021KM Level 1B Calibrated Radiances - 1km 343,592.10 3,739,3212 MOD09GA MODIS/Terra Surface Reflectance Daily L2G Global 1km and 500m SIN Grid 331,656.08 5,482,6103 AIRIBRAD AIRS/Aqua infrared geolocated radiances 272,501.05 10,548,7054 MYD021KM Level 1B Calibrated Radiances - 1km 261,833.43 2,993,9175 MOD09GQ MODIS/Terra Surface Reflectance Daily L2G Global 250m SIN Grid 177,308.16 2,216,9406 MOD03 Geolocation - 1km 154,674.88 6,401,3907 MYD03 Geolocation - 1km 152,307.74 5,983,6578 MOD13Q1 MODIS/Terra Vegetation Indices 16-Day L3 Global 250m SIN Grid 137,804.76 1,063,8949 MOD09A1 MODIS/Terra Surface Reflectance 8-Day L3 Global 500m SIN Grid 93,398.45 1,946,39610 MOD02HKM Level 1B Calibrated Radiances - 500m 89,697.63 685,511
FY2010 Top 10 Products Distributed By Volume*
FY2011 Top 10 Products Distributed By Volume*

31
Top 10 Products Trend by # of FilesFY2010 – FY2011
** When counting # of files, metadata files are not included.
February 2012 FY2011 Annual Report
Ranking Product Description Files** GBs1 MOD13Q1 MODIS/Terra Vegetation Indices 16-Day L3 Global 250m ISIN Grid 47,126,600 2,782.472 GNSS_DAILY_D GNSS Daily Compact Observation Data 15,365,035 5,158.293 MOD04_L2 MODIS/Terra Level 2 Aerosol 12,207,462 14,338.234 248 GHRSST Level 2P USA NASA MODIS Aqua 11 micron SST 12,004,610 15,691.495 MYD04_L2 MODIS/Aqua Level 2 Aerosol 9,906,940 11,740.506 250 GHRSST Level 2P USA NASA MODIS Terra 11 micron SST 9,506,179 9,297.757 AIRIBRAD AIRS/Aqua infrared geolocated radiances 9,320,890 141,685.428 TRMM_3B42 TRMM 3B42 3-Hour 0.25deg x 0.25deg and Other-GPI Calibration Rainfall 7,170,225 8,949.839 GNSS_DAILY_O GNSS Daily Observation Data 6,810,203 4,584.4010 MOD03 MODIS/Terra Geolocation - 1km 6,432,178 158,329.60
Ranking Product Description Files** GBs1 GNSS_IGSTROP GNSS Final Troposphere Zenith Path Delay Product 24,961,658 106.912 GNSS_DAILY_D GNSS Daily Compact Observation Data 22,823,601 9,062.933 MOD04_L2 Level 2 Aerosol 19,239,372 22,705.284 MOD05_L2 Level 2 Total Precipitable Water Vapor Test Results 13,794,053 46,353.125 AIRX2RET AIRS/Aqua FINAL Level 2 Products (Without HSB) 13,136,109 21,111.946 MYD04_L2 Level 2 Aerosol 11,539,969 13,665.437 AIRIBRAD AIRS/Aqua infrared geolocated radiances 10,548,705 272,356.188 TRMM_3B42 TRMM 3B42 3-Hour 0.25deg x 0.25deg and Other-GPI Calibration Rainfall 8,812,313 11,632.249 GPS_ACORB GPS AC Orbit Solution Product 8,470,895 1,340.7110 248 GHRSST Level 2P USA NASA MODIS Aqua 11 micron SST 8,022,077 18,781.63
FY2011 Top 10 Products Distributed By #Files
FY2010 Top 10 Products Distributed By #Files

32
Known U.S. – ForeignProduct Distribution Trend
Note: Metrics do not include product distribution where the destination country could not be determined. Also excluded are the ocean products from OBPG for which country information is not available.
February 2012 FY2011 Annual Report
Product Trend FY2007 FY2008 FY2009 FY2010 FY2011Foreign 35,960,845 56,769,710 120,843,195 152,842,193 189,496,476U.S. 65,563,006 69,857,119 113,052,619 242,093,094 262,304,205
33
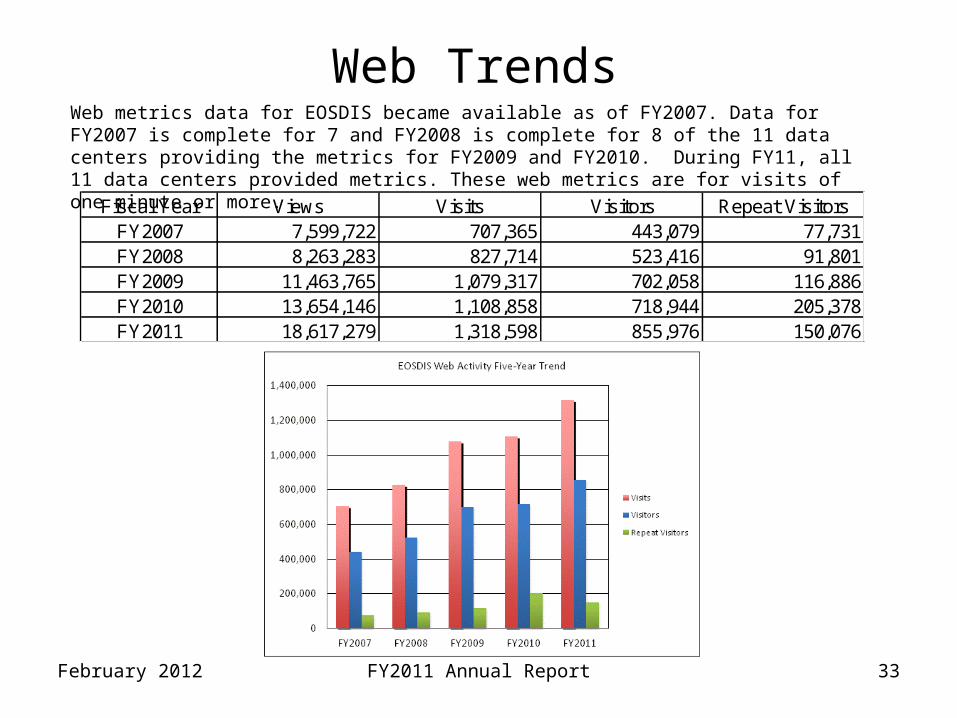
Web TrendsWeb metrics data for EOSDIS became available as of FY2007. Data for FY2007 is complete for 7 and FY2008 is complete for 8 of the 11 data centers providing the metrics for FY2009 and FY2010. During FY11, all 11 data centers provided metrics. These web metrics are for visits of one minute or more.
February 2012 FY2011 Annual Report
Fiscal Year Views Visits Visitors Repeat VisitorsFY2007 7,599,722 707,365 443,079 77,731FY2008 8,263,283 827,714 523,416 91,801FY2009 11,463,765 1,079,317 702,058 116,886FY2010 13,654,146 1,108,858 718,944 205,378FY2011 18,617,279 1,318,598 855,976 150,076

34
Definitions (1 of 3)
February 2012 FY2011 Annual Report
EMS Term Definition
Data Provider
EOSDIS element serving as a source of metrics information for describing the ingest, archive and distribution of EOSDIS science data; web activity metrics are also collected. For the EOSDIS annual reporting, metrics from individual data providers at a single site are combined (e.g., NSIDC = NSIDCECS + NSIDCV0).
Data Metrics
Metrics describing the ingest, archive and distribution of EOSDIS science data at EOSDIS Data Centers. This EOSDIS Annual Report presents data metrics from EOSDIS Data Centers. Most metrics can be found in the EMS HTMLDB interface (http://ops1.ems.eosdis.nasa.gov: 8000/pls/apex/f?p=111). Metrics from other sources are noted in the report where applicable.
Web MetricsMetrics describing the web activity at EOSDIS Data Center web sites and EOSDIS related web sites. This EOSDIS Annual Report presents web metrics by EOSDIS Data Centers. These metrics can be found in the EMS NetInsight interface (https://ems.eos.nasa.gov/NetInsight/index.html).
DomainDesignates the type of business or organization accessing EOSDIS. The domain is determined from the IP address and country.
EMS Data File Term
Definition
IngestIngest is the amount of data coming into a data center over a period of time and includes all product levels.
Archive Archive is the amount of data added to the archive over a period of time and includes all products levels.
Total Archive SizeThe Total Archive Size describes the EOSDIS archive at the end of the fiscal year. This includes all data (including ancillary) but not data marked for deletion.
Data User Any individual requesting data as defined by an IP address plus email, within the time period.
Distinct UsersThe number of distinct (i.e., counted once) users receiving science data or metadata during the report period.
GranuleThe smallest unit of data inventoried and distributed to users; typically, a granule is a single data file, though some granules may include multiple files.
Product
EMS counts individual files as distinct products. This is roughly equivalent to counting EOS granules, although in the case of some EOS instrument data, a granule may contain more than one file. If so, the files are counted as individual products. In counting unique products, A product having two different version numbers was considered two unique data products.
Number of Products Delivered
The number of files successfully delivered to Public users. This count excludes METADATA file types. If the file type does not distinguish a file as a metadata or a science file, i.e., it is encoded as n/a, then the default process is to count the file as a science data product.
Volume of Products Delivered
The volume of data (in GBs) successfully delivered to Public users. This includes all file types, including METADATA.
35
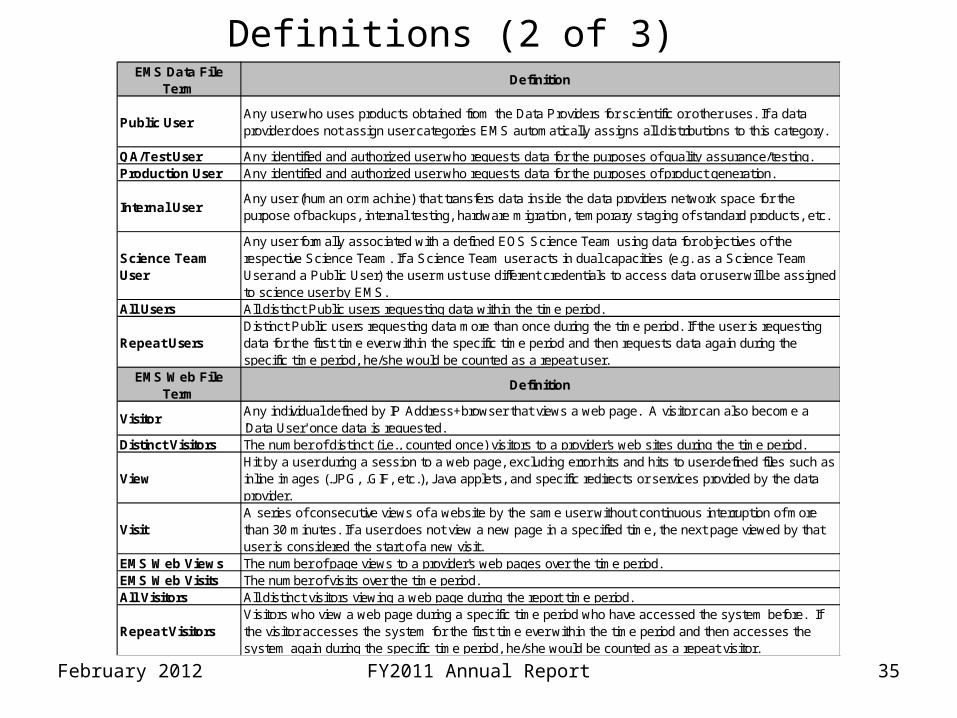
Definitions (2 of 3)
February 2012 FY2011 Annual Report
EMS Data File Term
Definition
Public UserAny user who uses products obtained from the Data Providers for scientific or other uses. If a data provider does not assign user categories EMS automatically assigns all distributions to this category.
QA/Test User Any identified and authorized user who requests data for the purposes of quality assurance/testing.Production User Any identified and authorized user who requests data for the purposes of product generation.
Internal UserAny user (human or machine) that transfers data inside the data providers network space for the purpose of backups, internal testing, hardware migration, temporary staging of standard products, etc.
Science Team User
Any user formally associated with a defined EOS Science Team using data for objectives of the respective Science Team. If a Science Team user acts in dual capacities (e.g. as a Science Team User and a Public User) the user must use different credentials to access data or user will be assigned to science user by EMS.
All Users All distinct Public users requesting data within the time period.
Repeat UsersDistinct Public users requesting data more than once during the time period. If the user is requesting data for the first time ever within the specific time period and then requests data again during the specific time period, he/she would be counted as a repeat user.
EMS Web File Term
Definition
VisitorAny individual defined by IP Address+browser that views a web page. A visitor can also become a 'Data User' once data is requested.
Distinct Visitors The number of distinct (i.e., counted once) visitors to a provider's web sites during the time period.
ViewHit by a user during a session to a web page, excluding error hits and hits to user-defined files such as inline images (.JPG, .GIF, etc.), Java applets, and specific redirects or services provided by the data provider.
VisitA series of consecutive views of a website by the same user without continuous interruption of more than 30 minutes. If a user does not view a new page in a specified time, the next page viewed by that user is considered the start of a new visit.
EMS Web Views The number of page views to a provider's web pages over the time period. EMS Web Visits The number of visits over the time period.All Visitors All distinct visitors viewing a web page during the report time period.
Repeat VisitorsVisitors who view a web page during a specific time period who have accessed the system before. If the visitor accesses the system for the first time ever within the time period and then accesses the system again during the specific time period, he/she would be counted as a repeat visitor.

FY2011 Annual Report 36February 2012
Definitions (3 of 3)Report Term Definition
Stage 1 Metrics data directly from the EMS tools, presented by “data provider” as available.
Stage 2 Metrics data grouped by “data center”, augmented with external data, includes all twelve data centers.
Stage 3 Metrics data presented by the major contributing data centers, often accompanied by a graphic.