EOSDIS FY2013 Annual Metrics Report Prepared By: Hyo Duck Chang, Adnet, Inc. Brian Krupp, Adnet,...
39
EOSDIS FY2013 Annual Metrics Report Prepared By: Hyo Duck Chang, Adnet, Inc. Brian Krupp, Adnet, Inc. Lalit Wanchoo, Adnet, Inc. Young-In Won, Wyle, Inc February 2014
-
Upload
anna-white -
Category
Documents
-
view
222 -
download
0
Transcript of EOSDIS FY2013 Annual Metrics Report Prepared By: Hyo Duck Chang, Adnet, Inc. Brian Krupp, Adnet,...

EOSDIS FY2013
Annual Metrics Report
Prepared By:
Hyo Duck Chang, Adnet, Inc.
Brian Krupp, Adnet, Inc.
Lalit Wanchoo, Adnet, Inc.
Young-In Won, Wyle, Inc
February 2014

Preface
2February 2014 FY2013 Annual Report
The Earth Sciences Data and Information System (ESDIS) Project (Code 423) prepared the following report on metrics from across the Earth Observation System Data and Information System (EOSDIS). The 12 Distributed Active Archive Centers (DAACs) of EOSDIS support different scientific disciplines and provide an individualized set of products and services to their science community and the public. Although discipline oriented, the DAACs engage in common data management functions of ingest, archive and distribution, as well as describing their data and services on web sites.
Metrics are collected on a daily basis from each DAAC. The ESDIS Project collects these metrics in a tool called the ESDIS Metrics System (EMS). DAAC analysts can view their detailed metrics to assess internal performance and trends. The ESDIS Project combines these metrics, not for comparisons between the DAACs, but as a system level view of EOSDIS performance. This report provides snapshots of metrics as the combination of the individual DAACs and as a system.
In keeping with previous years, and in order to support trend comparisons, the metrics data are presented on a fiscal year basis, not by calendar year. These reports are posted online with metrics as far back as 1996. Each report includes some historical trend information.
If you have any questions or comments, please contact Jeanne Behnke at (301) 614-5326 or [email protected] or Kevin Murphy at (301) 614-5580 or [email protected].

Introduction
February 2014 FY2013 Annual Report 3
• This report presents statistics on data metrics and web activities at the EOSDIS DAACs during Fiscal Year 2013 (October 1, 2012 through September 30, 2013) from the Earth Science Data and Information System (ESDIS) Metrics System (EMS).
• EMS supports the ESDIS project management by collecting and organizing various metrics from the Earth Observing System (EOS) Data and Information System (DIS) DAACs and other sources. The EMS collects and presents data on the usage of products and services delivered via the Internet or managed in EOSDIS archives.
• EMS consists of a Data Metrics component and a Web Metrics component. The Data Metrics component provides statistics on data ingest, archive and distribution plus data users profile information. The Web Metrics component provides statistics on web site visits, views and visitors with a variety of related parameters.
• This report contains tables and graphs of FY2013 statistics and comparisons to previous years. Values for previous fiscal years are produced from EMS unless noted otherwise. Summary tables, text, graphs, and more detailed statistics tables are also included. As before, metrics for the Near Real-Time (NRT) products are presented in a separate worksheet and a separate summary table for NRT products, called LANCE_Summary, is included. Note that NRT metrics are not used in the distribution trend analyses presented in this report. All bots-related distributions (downloads by Internet search engines for indexing purposes) are excluded in the ASF metrics. A new worksheet called "Total Archive Trend" showing various input sources used to derive total archive volumes for previous years is added to this year's report.
• Definitions for terms used in this report can be found in the Definitions worksheet.

EOSDIS Summary
4
Unique Data Sets: Total number of unique data sets distributed in the fiscal year.
Distinct Users of EOSDIS Data and Services: Total unique users across EOSDIS Data Users and Web Visitors, per DAAC and summed (does not include LANCE Web Visitors)
Web Site Visits: Sum of web visits for DAACs and LANCE data providers where a visit represents a user session not broken by more than 30 minutes and a duration of at least one minute
Average Archive Growth: Sum across reporting DAACs of the data volume added to the individual archives divided by the days in the year
Total Archive Volume: Sum across reporting DAACs of the data volumes in the archive as of end of the fiscal year
End User Distribution Products: Total number of products distributed from all reporting DAACs and LANCE data providers
End User Average Distribution Volume: Sum across reporting DAACs and LANCE data providers of the data volume distributed for the fiscal year divided by the days in the year
February 2014 FY2013 Annual Report
Unique Data Sets 6,861
Distinct Users of EOSDIS Data and Services 1.7 M
Web Site Visits 2.5 M
Average Archive Growth 8.5 TB/day
Total Archive Volume 9.8 PB
End User Distribution Products 839 M
End User Average Distribution Volume 22 TB/day
EOSDIS FY2013 Metrics(Oct. 1, 2012 to Sept. 30, 2013)

FY2013 Annual Report 5February 2014
Land Atmosphere Near Real-time Capability for EOS (LANCE) Summary
Unique Data Sets: Total number of unique data sets distributed in the fiscal year
Distinct Registered LANCE Users: Total number of unique LANCE users who registered and retrieved NRT products from all LANCE data providers, excluding the unregistered users who downloaded imagery products from the MODIS Rapid Response System
Web Site Visits: Sum of web visits for LANCE data providers where a visit represents a user session not broken by more than 30 minutes and a duration of at least one minute
Average Production Growth: Sum of the NRT data volume generated by all LANCE providers divided by the days in the year, including the NRT and NRT2 processing streams
Total Production Volume: Two weeks worth of production volume of the NRT/NRT2 data products, calculated by multiplying Average Production Growth by 14 (days) assuming the deletion of the NRT/NRT2 products two weeks after production
End User Distribution Products: Total number of products distributed from all reporting LANCE data providers
End User Average Distribution Volume: Sum across reporting LANCE data providers of the data volume distributed for the fiscal year divided by the days in the year
Unique Data Sets 215
Distinct Registered LANCE Users 775
Web Site Visits 555 K
Average Production Growth 2.2 TB/day
Total Production Volume 0.8 PB
End User Distribution Products 90 MEnd User Average Distribution Volume 2.3 TB/day
LANCE FY2013 Metrics (Oct. 1, 2012 to Sept. 30, 2013)

Data Metrics
6
•Ingest•Archive•Total Archive•Data Users
−Distinct Users−Repeat Users−Top 20 Countries−Foreign
Distribution
•Distribution−By Data Center−Volume by Domain−Products by Domain−Top 20 Countries−Top 10 Products−Unique Product Count
February 2014 FY2013 Annual Report
• Near Real-time Products−Production−Distribution

DAAC Volume (TBs) Files (Millions)ASDC 635.7 21.9ASF 2,185.0 0.2CDDIS 0.8 9.9GESDISC 152.8 6.6GHRC 2.2 2.4LPDAAC 131.5 7.1MODAPS 50.3 0.3NSIDC 46.4 7.1PODAAC 13.3 1.1SEDAC 0.0 0.0Total 3,218.0 56.5
Ingest
Ingest is the amount of data coming into a DAAC over a period of time and includes all product levels. For this report, the data is presented as the amount of data entered into each DAAC during FY2013. The sum of all DAACs is the total ingest for EOSDIS. OBPG and ORNL are unable to provide ingest metrics at this time.
7February 2014 FY2013 Annual Report

DAAC Volume (TBs) Files (Millions)
ASDC 635.9 22.0
ASF 1,529.5 12.6
CDDIS 0.8 7.6
GESDISC 321.3 17.0
GHRC 2.5 0.8
LPDAAC 131.5 7.1
MODAPS 405.2 24.6
NSIDC 46.4 7.1
ORNL 1.3 0.5
PODAAC 13.3 1.1
SEDAC 0.0 0.0
Total 3,087.8 100.3
ArchiveThis table shows the amount of data added to the archive during FY2013 and includes all products levels. Archive metrics for OBPG and NSIDC V0 are not available at this time.
8February 2014 FY2013 Annual Report

DAAC Volume (TBs) Files (Millions)
ASDC * 2,806.6 113.9
ASF 3,597.1 20.7
CDDIS ** 8.0 110.0
GESDISC 668.6 66.9
GHRC 9.5 1.3
LPDAAC 1,066.3 62.1
MODAPS 1,543.9 91.2
NSIDC 108.3 27.1
ORNL *** 143.2 29.8
PODAAC 44.5 3.4
SEDAC 3.3 0.0Total 9,999.3 526.3
Total Archive SizeThe Total Archive Size describes the EOSDIS archive at the end of FY2013. This includes all data (including ancillary) but not data marked for deletion.
9February 2014 FY2013 Annual Report
* ASDC archive size is based on the archive values for LaRC ANGe and LaRC ECS provided by John Kusterer of ASDC
** CDDIS archive size was derived from the archive values as of 10/23/2013 provided by CDDIS
*** Archive values were provided by B. McMurry of ORNL on 11/04/2013

Distribution by DAAC
ASDC ASF CDDIS GESDISC GHRC LPDAAC MODAPS NSIDC OBPG ORNL PO.DAAC SEDAC Total
Products (Millions)
10.21 0.67 120.93 209.91 4.43 111.74 135.29 38.22 18.29 5.76 89.25 4.69 749.40
Total Volume (TBs)
624.54 81.96 48.77 1,942.48 6.95 1,456.17 2,080.39 180.23 500.98 16.33 232.36 2.57 7,173.73
Distribution By DAACDistribution presents the amount of data successfully distributed to Public Users.
10February 2014 FY2013 Annual Report

Total Volume Distributed
ASDC ASF CDDIS GESDISC GHRC LP DAAC MODAPS NSIDC OBPG ORNL PO.DAAC SEDAC Total
Foreign 225.51 23.00 36.50 588.62 3.86 704.40 805.88 84.76 249.90 12.01 100.96 1.30 2,836.70US COM 147.61 15.17 1.66 60.76 1.01 225.09 77.82 21.56 9.46 1.02 24.24 0.39 585.79US EDU 148.15 13.63 2.67 420.45 1.31 245.83 470.66 23.21 127.50 2.14 31.89 0.21 1,487.64US GOV 96.63 8.50 5.54 764.82 0.53 73.49 583.62 31.56 48.06 0.15 68.22 0.02 1,681.14US ORG 0.13 14.43 0.13 0.28 0.00 2.33 0.07 0.18 4.69 0.04 0.03 0.01 22.33US Other 3.41 6.54 0.45 90.97 0.20 188.75 114.66 11.89 22.06 0.66 3.23 0.52 443.34Unknown 3.09 0.68 1.81 16.60 0.04 16.28 27.69 7.06 39.32 0.31 3.79 0.12 116.79Total Volume (TBs)
624.54 81.96 48.77 1,942.48 6.95 1,456.17 2,080.39 180.23 500.98 16.33 232.36 2.57 7,173.73
Volume Distributed By DomainVolume Distribution presents the volume of data successfully distributed to Public Users by Domain.
11February 2014 FY2013 Annual Report

Total Products Distributed
ASDC ASF CDDIS GESDISC GHRC LP DAAC MODAPS NSIDC OBPG ORNL PO.DAAC SEDAC Total
Foreign 4.22 0.22 84.81 100.13 0.35 54.22 51.86 25.51 10.46 4.33 22.54 1.71 360.37US COM 1.61 0.07 10.64 9.43 0.47 28.54 4.52 3.49 0.37 0.21 12.13 1.24 72.70US EDU 2.44 0.12 5.08 45.23 1.14 15.78 33.16 3.27 2.53 1.08 27.95 0.20 137.98US GOV 1.54 0.05 16.69 33.75 2.44 4.30 34.18 2.47 1.60 0.02 23.71 0.04 120.79US ORG 0.00 0.08 0.56 0.03 0.00 0.07 0.00 0.05 0.03 0.00 0.00 0.02 0.85US Other 0.22 0.06 0.71 15.45 0.02 7.70 10.08 1.62 0.99 0.07 1.81 1.19 39.92Unknown 0.18 0.07 2.43 5.89 0.01 1.14 1.49 1.81 2.32 0.06 1.10 0.28 16.78
Total Products (Millions)
10.21 0.67 120.93 209.91 4.43 111.74 135.29 38.22 18.29 5.76 89.25 4.69 749.40
Product Distribution By DomainProduct Distribution presents the number of products successfully distributed to Public Users by Domain.
12February 2014 FY2013 Annual Report

Ranking Country Products1 United States 372,244,5902 China 89,822,4483 Canada 45,189,2314 Japan 40,891,8005 United Kingdom 23,787,6366 France 20,174,4237 Germany 18,082,7388 Korea, Republic Of 10,302,0629 Brazil 9,834,242
10 India 8,499,63311 Spain 7,343,43912 Russian Federation 7,155,13213 Netherlands 6,571,06314 Switzerland 5,854,69115 Portugal 5,270,12316 Australia 4,840,69717 Italy 4,475,98418 Taiwan 4,431,87219 Indonesia 4,304,11120 Belgium 4,014,408
Ranking Country Volume (GBs)1 United States 4,321,5342 China 632,6153 Japan 447,7474 Canada 260,8245 France 260,7566 Germany 241,2897 United Kingdom 153,0938 Belgium 105,6549 Korea, Republic Of 100,143
10 India 72,07611 Russian Federation 67,71012 Italy 61,81913 Australia 58,22214 Austria 45,73315 Brazil 40,40616 Netherlands 36,70417 Spain 31,37218 Thailand 25,28919 Denmark 19,34720 Taiwan 15,905
Data Distribution - Top 20 Countries
13February 2014 FY2013 Annual Report
* Some products are inherently larger than other files in size and therefore may skew the results.** When counting # of products, metadata files are excluded.

FY2013 Annual Report 14
ASDC ASF CDDIS GESDISC GHRC LP DAAC MODAPS NSIDC OBPG ORNL PO DAAC SEDAC Total756 155 214 2,052 245 241 587 383 77 1,130 689 117 6,646
February 2014
Tables below show the number of unique data products distributed to public users during FY2013. In counting unique products, metadata were excluded. NRT products are not included.
Distribution of Unique Data Products

15
Product Description Files** GBs
1 GNSS_DAILY_D GNSS Daily Compact Observation Data 28,919,111 12,842.11
2 TRMM_3B42 TRMM 3B42 3-Hour 0.25deg x 0.25deg and Other-GPI Calibration Rainfall 25,323,244 53,091.72
3 NLDAS_FORA0125_H NLDAS Primary Forcing Data L4 Hourly 0.125 x 0.125 degree V002 20,555,802 27,881.16
4 MAT1NXSLV MERRA 2D IAU Diagnostic, Single Level Meteorology, Time Average 1-hourly (2/3x1/2L1) 19,053,338 142,137.39
5 PODAAC-OSCAR-03D01 OSCAR third degree resolution ocean surface currents 16,873,392 951.32
6 AIRX2RET AIRS/Aqua FINAL Level 2 Products (Without HSB) 16,458,995 31,694.88
7 MOD04_L2 Terra MODIS Level 2 Aerosol 15,387,273 17,264.45
8 PODAAC-GHMDA-2PJ01 GHRSST Level 2P Global Skin Sea Surface Temperature from the Moderate Resolution Imaging Spectroradiometer (MODIS) on the NASA Aqua satellite
12,222,989 29,765.81
9 GNSS_DAILY_N GNSS Daily GPS Broadcast Ephemeris Data 12,050,596 431.67
10 MYD04_L2 Aqua MODIS Level 2 Aerosol 11,394,147 13,304.16
Top 10 Products Distributed By File Count **
Product Description GBs Files **
1 MYD021KM Level 1B Calibrated Radiances - 1km 398,907.23 4,098,343
2 AIRIBRAD AIRS/Aqua infrared geolocated radiances 368,325.09 7,868,201
3 MOD021KM Level 1B Calibrated Radiances - 1km 339,845.22 3,328,557
4 MOD13Q1 MODIS/Terra Vegetation Indices 16-Day L3 Global 250m SIN Grid 211,364.13 1,658,684
5 MOD09GA MODIS/Terra Surface Reflectance Daily L2G Global 1km and 500m SIN Grid 201,163.13 7,024,927
6 MYD03 Geolocation - 1km 184,498.36 7,262,297
7 MOD09A1 MODIS/Terra Surface Reflectance 8-Day L3 Global 500m SIN Grid 166,373.19 5,197,945
8 CAL_LID_L1-VALSTAGE1-V3 CALIPSO Lidar Level 1B profile data (CAL_LID_L1-ValStage1-V3) 152,024.55 341,894
9 MYDL1A MODIS-AQUA L1A data 143,318.43 1,562,875
10 MAT1NXSLV MERRA 2D IAU Diagnostic, Single Level Meteorology, Time Average 1-hourly (2/3x1/2L1) 142,137.39 19,053,338
Top 10 Products Distributed By Volume*
Data Distribution - Top 10 Products
* Some products are inherently larger than other files in size and therefore may skew the results.** When counting # of files, metadata files are excluded.
February 2014 FY2013 Annual Report

16
Distinct Data Users By Domain
ASDC ASF CDDIS GES DISC GHRC LP DAAC MODAPS NSIDC OBPG ORNL PO.DAAC SEDAC Total
Foreign 1,361 9,202 74,274 69,974 2,172 45,164 29,587 11,587 27,468 22,821 15,837 184,513 493,960US COM 495 587 7,572 18,520 421 12,227 1,841 3,621 1,060 4,944 4,478 84,523 140,289US EDU 450 519 1,784 7,340 341 4,305 1,899 2,043 1,129 3,176 2,415 9,980 35,381US GOV 421 126 1,252 2,641 185 6,420 973 642 176 484 1,901 857 16,078US ORG 9 41 148 233 4 149 19 55 41 58 41 983 1,781US Other 67 520 4,666 7,097 225 4,341 1,034 1,268 902 2,453 1,492 21,305 45,370Unknown 29 364 3,541 5,550 116 2,142 2,212 1,041 762 1,827 1,345 20,227 39,156Total Distinct Data Users
2,832 11,359 93,237 111,355 3,464 74,748 37,565 20,257 31,538 35,763 27,509 322,388 772,015
Distinct Data UsersDistinct Data Users presents the number of distinct public users who received data product files .
February 2014 FY2013 Annual Report

17
Repeat Data Users By Domain
ASDC ASF CDDIS GES DISC GHRC LP DAAC MODAPS NSIDC OBPG ORNL PO.DAAC SEDAC Total
Foreign 566 495 19,049 17,143 490 11,825 9,977 2,908 4,960 3,848 3,535 17,117 91,913US COM 209 68 3,159 2,978 84 4,456 879 885 320 1,054 1,404 7,054 22,550US EDU 193 136 612 2,465 109 1,259 694 549 425 527 716 1,198 8,883US GOV 197 33 607 1,186 55 2,489 446 260 104 128 573 350 6,428US ORG 4 16 99 67 0 52 7 21 27 8 13 277 591US Other 27 83 2,180 1,711 43 1,198 333 258 295 411 303 5,193 12,035Unknown 7 32 1,240 1,065 19 491 575 264 168 374 348 2,637 7,220Total Repeat Data Users
1,203 863 26,946 26,615 800 21,770 12,911 5,145 6,299 6,350 6,892 33,826 149,620
Repeat Data UsersRepeat users are distinct Public users who received data on more than one day in the fiscal year .
February 2014 FY2013 Annual Report

18
Ranking Country Users1 United States 226,6022 China 95,6353 United Kingdom 28,1704 India 23,9985 Germany 23,1666 Canada 22,2207 Brazil 17,5948 France 17,4979 Australia 15,291
10 Russian Federation 14,41911 Japan 10,03512 Italy 8,89913 Spain 8,36114 Indonesia 8,21215 Iran, Islamic Republic Of 8,02716 Mexico 7,14817 Poland 6,25218 Netherlands 6,08919 Colombia 5,53720 Guatemala 5,352
Data Users - Top 20 Countries
February 2014 FY2013 Annual Report

FY2013 Annual Report 19
Foreign Country # of Users # of Products (1000s) Vol (TBs)EU * 130,861 102,979 996.18Canada 22,220 45,189 254.71China ** 95,635 89,822 617.79Japan 10,035 40,892 437.25Other Foreign Countries 207,986 81,490 530.76Unknown *** 37,552 16,783 116.79
February 2014
Foreign Distribution
* EU includes 27 European Union member countries.** China includes only People’s Republic of China and does not include Taiwan or Hong Kong.*** This represents the data users whose countries are unknown
Distribution metrics for foreign public users are compared. Statistics are based on country information provided by the 12 EOSDIS DAACs.

FY2013 Annual Report
LANCE Provider Instrument Volume (TB) Files (Millions)GESDISC NRT/NRT2 AIRS / AMSU-A 18.95 1.69GESDISC NRT/NRT2 MLS 0.49 0.79MODAPS NRT/NRT2 MODIS - Aqua 388.70 6.01MODAPS NRT/NRT2 MODIS - Terra 400.92 5.86OMI NRT/NRT2 OMI 7.41 0.10
Total 816.47 14.44
February 2014 20
Production of Near Real-Time ProductsNear Real-Time (NRT) production represents the amount of data generated by the Land Atmosphere Near Real-time Capability for EOS (LANCE) data providers, including the two identical processing systems, NRT and NRT2.
Volume and file count include the data products deleted from archive

FY2013 Annual Report 21
Instrument # of Products # of Files * Vol (GB)# of
RegisteredUsers ****
# of Unregistered
Users ***AIRS/AMSU-A 19 2,171,425 28,279.27 64 31AMSR-E ** 1 2 0.16 2 0MLS 17 1,106,939 447.01 36 0MODIS - Aqua 88 34,782,217 383,903.20 410 514,632MODIS - Terra 83 51,582,830 461,306.20 407 623,100OMI 7 105,292 3,259.20 21 0
NRT Total 215 89,748,705 877,195.04 940 1,137,763
February 2014
Distribution of Near Real-Time Products
* Excludes metadata** Includes the NRT products from MODAPS*** Represents the number of unique IP hosts/e-mail addresses used to retrieve NRT products, excluding registered users**** Represents the number of the registered users who retrieved data for each instrument. It must be noted that sum of theses users may be greater than the total number of unique registered users since one user could retrieve data for multiple instruments
Near Real-time (NRT) Distribution provides the amount of data successfully distributed to registered users of the Land Atmosphere Near Real-time Capability for EOS (LANCE). LANCE provides access to near real-time data (<3 hours from observation) from MODIS, AMSR-E, AIRS, MLS and OMI instruments. Metrics for distribution volume, numbers of files distributed and users are presented.

22
Web Metrics
•Visitors and Visits
•Repeat Visitors
•Top 20 Domains
•Top 20 Countries
•LANCE Web Metrics
February 2014 FY2013 Annual Report

23
Web Visitors and VisitsEOSDIS web activity is measured by number of Visits made, the number of pages Viewed and the number of distinct Visitors. Visits of at least one minute are considered to represent significant work accomplished, and many of the shorter visits are of less than a second. Eleven of the twelve EOSDIS DAACs report web metrics at this time; all except OBPG. Note that the sum of monthly visitors could be greater than the number of unique visitor for a given year since one user could be counted more than once if he/she visited the same website in different months.
February 2014 FY2013 Annual Report
Month # Visits # Views# Unique Visitors
Oct-12 155,269 2,180,927 108,240
Nov-12 146,333 2,067,847 102,868
Dec-12 142,301 1,789,784 99,780
J an-13 175,643 2,286,986 121,537
Feb-13 157,054 2,241,338 108,342
Mar-13 186,929 2,492,811 124,486
Apr-13 188,548 2,395,851 125,891
May-13 169,621 2,476,173 111,115
J un-13 151,519 1,841,919 96,441
J ul-13 163,187 2,074,423 99,540
Aug-13 147,278 1,845,963 94,807
Sep-13 146,116 1,626,277 103,626
FY2013 1,929,798 25,320,299 1,183,040

24
# of Visits 2 3 4 5-6 7-9 10 - 14 15 - 24 25 - 49 50 - 99 100+Total
VisitorsAll DAACs 121,061 41,293 19,959 18,170 11,175 7,254 4,531 2,506 763 256 226,968
Repeat Web VisitorsEOSDIS Web Visitors are characterized by the number of visits they make and how frequently they return. Visitors counted in the table below are those that stayed for one minute or more. Repeat Visitors are counted from the start of the Fiscal Year. Metrics data is collected per data center and summed for an EOSDIS total.
FY2013 Web Visitors for Visits of one minute or more
February 2014 FY2013 Annual Report

25
Ranking Domain VisitorsPercent Visitors
VisitsPercent
VisitsViews
Percent Views
1 Unresolved 327,099 29.1% 560,289 29.0% 8,056,807 31.8%2 Network (.net) 244,785 21.8% 374,120 19.4% 3,754,851 14.8%3 Commercial (.com) 109,068 9.7% 179,386 9.3% 1,694,127 6.7%4 United States Educational 46,144 4.1% 91,869 4.8% 1,525,592 6.0%5 Russian Federation 23,600 2.1% 42,890 2.2% 476,129 1.9%6 Italy 22,570 2.0% 31,911 1.7% 363,706 1.4%7 Japan 21,521 1.9% 50,469 2.6% 581,227 2.3%8 Germany 21,467 1.9% 33,782 1.8% 491,369 1.9%9 Australia 19,674 1.8% 30,112 1.6% 266,324 1.1%10 Canada 18,081 1.6% 35,016 1.8% 426,170 1.7%11 Other 14,623 1.3% 20,084 1.0% 280,653 1.1%12 France 13,466 1.2% 23,127 1.2% 306,374 1.2%13 United States Government 13,450 1.2% 60,680 3.1% 1,307,470 5.2%14 Mexico 13,287 1.2% 19,191 1.0% 285,909 1.1%15 United Kingdom 13,201 1.2% 24,515 1.3% 358,476 1.4%16 India 12,868 1.1% 23,983 1.2% 582,901 2.3%17 Argentina 11,499 1.0% 18,452 1.0% 238,726 0.9%18 Brazil 11,245 1.0% 16,549 0.9% 244,869 1.0%19 Finland 10,593 0.9% 21,208 1.1% 334,125 1.3%20 Netherlands 9,620 0.9% 21,785 1.1% 338,265 1.3%
Top 20 Domains By # of Web VisitorsThe FY2013 Top 20 Domains for visits >= 1 minute is sorted by the # of Visitors. Data came from 11 DAACs (all DAACs on Slide # 10 except OBPG provide web metrics). All statistics are based on domains resolved by NetInsight, using host information. Domain information was obtained using a NASA DNS translation program.
February 2014 FY2013 Annual Report

26
Ranking Country VisitorsPercent Visitors
VisitsPercent
VisitsViews
Percent Views
1 China 51,347 4.6% 106,379 5.5% 1,802,841 7.1%
2 United States 61,133 5.4% 99,067 5.1% 1,341,752 5.3%
3 India 26,565 2.4% 45,108 2.3% 1,032,335 4.1%
4 Russian Federation 14,194 1.3% 30,300 1.6% 303,880 1.2%
5 Iran 10,484 0.9% 15,542 0.8% 269,847 1.1%
6 Korea, Republic of 7,196 0.6% 14,996 0.8% 263,538 1.0%
7 Indonesia 5,299 0.5% 7,691 0.4% 169,771 0.7%
8 Canada 9,893 0.9% 17,194 0.9% 166,924 0.7%
9 Italy 8,816 0.8% 12,808 0.7% 156,586 0.6%
10 Germany 4,757 0.4% 9,145 0.5% 151,906 0.6%
11 Great Britain 11,530 1.0% 17,885 0.9% 143,843 0.6%
12 Spain 6,092 0.5% 10,669 0.6% 140,566 0.6%
13 Brazil 3,428 0.3% 7,084 0.4% 111,315 0.4%
14 Australia 7,568 0.7% 12,362 0.6% 107,299 0.4%
15 Malaysia 3,728 0.3% 6,197 0.3% 90,622 0.4%
16 Peru 3,530 0.3% 6,333 0.3% 81,647 0.3%
17 Saudi Arabia 5,349 0.5% 6,706 0.3% 68,733 0.3%
18 Chile 2,425 0.2% 4,330 0.2% 66,393 0.3%
19 France 2,713 0.2% 4,530 0.2% 41,558 0.2%
20 Philippines 3,522 0.3% 4,042 0.2% 35,268 0.1%
Top 20 Countries By # Web VisitsThe FY2013 Top 20 Countries for visits >= 1 minute is sorted by the # of Visits. Data came from 11 DAACs (all DAACs on Slide # 10 except OBPG provide web metrics). Country information is based on the NetInsight geographical data from Quova, the Neustar IP Intelligence and IP Geolocation Service.
February 2014 FY2013 Annual Report

FY2013 Annual Report
Month # Visits # Views# Unique Visitors
Oct-12 34,329 410,466 21,350
Nov-12 30,371 421,869 19,063
Dec-12 41,774 458,322 26,660
J an-13 57,880 613,512 37,224
Feb-13 45,363 482,698 27,572
Mar-13 59,186 553,389 34,553
Apr-13 65,012 616,053 37,541
May-13 52,552 534,322 30,278
J un-13 45,918 471,203 25,547
J ul-13 47,002 457,237 24,125
Aug-13 43,956 423,218 25,392
Sep-13 31,963 349,630 19,333
FY2013 555,306 5,791,919 298,036
February 2014
LANCE Web MetricsLANCE web activity is measured by number of visits made, the number of pages viewed and the number of distinct visitors for the LANCE website. The number of hosts counts the distinct IP addresses of the visitors. Repeat visitors is a count of those visitors who made at least two visits since the start of web activity measurements or in the fiscal year.
Web metrics are presented for visits of one minute or greater. Visits of at least one minute are considered to represent significant work accomplished, and many of the shorter visits are of less than a second. The sum of monthly visitors could be greater than the number of unique visitors for a given year since one user could be counted more than once in the monthly visitor count if he/she visited the LANCE websites in different months.
27

28
Total Users and Trends
•Total Users
•Total Archive Trend
•Data Volume Distribution Trend
•Data Product Distribution Trend
•Top 10 Products Trend FY2012 - FY2013
•Known U.S. - Foreign Product Distribution
Trend
•Web Trends (Visits and Visitors)February 2014 FY2013 Annual Report
Total distinct users of data and services
1,691,729
DAACDistinct Data
UserDistinct Web
Visitor (1 min+)
Distinct WebVisitor (1 min+)
(by Host IP) Data Users Only
Dual Users(Data and Web)
% of Data Users using the web
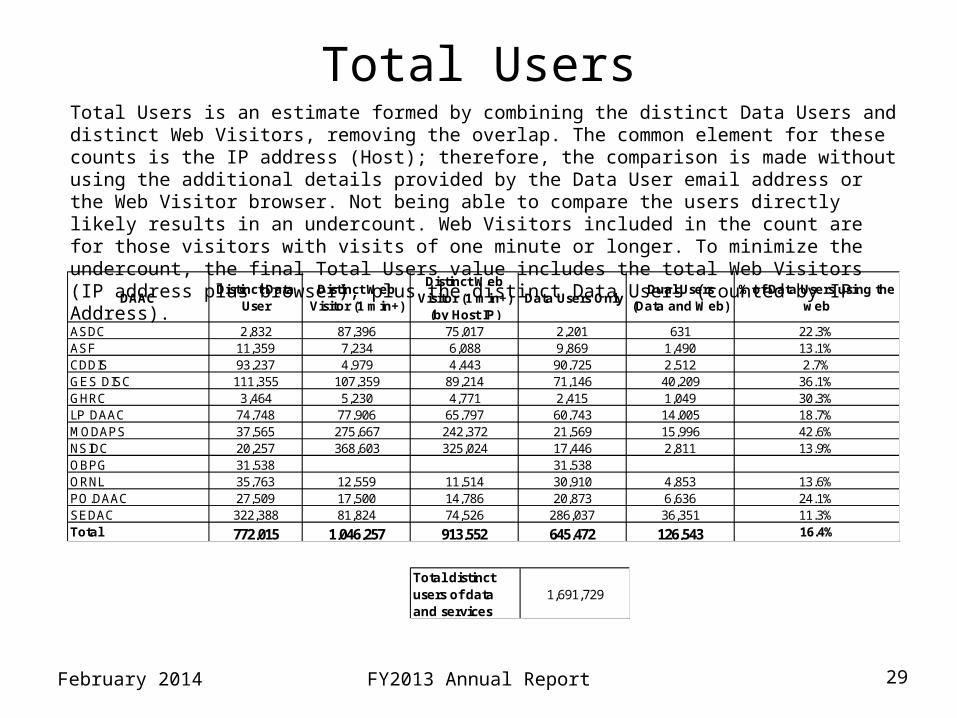
ASDC 2,832 87,396 75,017 2,201 631 22.3%ASF 11,359 7,234 6,088 9,869 1,490 13.1%CDDIS 93,237 4,979 4,443 90,725 2,512 2.7%GES DISC 111,355 107,359 89,214 71,146 40,209 36.1%GHRC 3,464 5,230 4,771 2,415 1,049 30.3%LP DAAC 74,748 77,906 65,797 60,743 14,005 18.7%MODAPS 37,565 275,667 242,372 21,569 15,996 42.6%NSIDC 20,257 368,603 325,024 17,446 2,811 13.9%OBPG 31,538 31,538ORNL 35,763 12,559 11,514 30,910 4,853 13.6%PO.DAAC 27,509 17,500 14,786 20,873 6,636 24.1%SEDAC 322,388 81,824 74,526 286,037 36,351 11.3%Total 772,015 1,046,257 913,552 645,472 126,543 16.4%
February 2014 FY2013 Annual Report 29
Total UsersTotal Users is an estimate formed by combining the distinct Data Users and distinct Web Visitors, removing the overlap. The common element for these counts is the IP address (Host); therefore, the comparison is made without using the additional details provided by the Data User email address or the Web Visitor browser. Not being able to compare the users directly likely results in an undercount. Web Visitors included in the count are for those visitors with visits of one minute or longer. To minimize the undercount, the final Total Users value includes the total Web Visitors (IP address plus browser), plus the distinct Data Users (counted by IP Address).

30
Total Archive TrendThe total archive trend is based on data and reports produced during individual fiscal years, rather than from EMS. EMS does not contain sufficient information to recreate the archive size for previous years due to episodic deletions from the archive and not all archive information is supplied to EMS by the DAACs. Since products are deleted at the DAACs and not always reported to EMS, It may not able to completely reproduce what was in the archive in previous years.
The trend data were compiled in FY2013 with the expectation it will be updated yearly with data captured in that year's EOSDIS Annual Report in the Total Archive Size worksheet. The sources of data for earlier years , which are not presented here, are available from the Excel version of this report.
February 2014 FY2013 Annual Report
FY Total Volume (PBs)FY00 0.51FY01 0.99FY02 1.92FY03 3.55FY04 3.94FY05 4.06FY06 4.62FY07 4.91FY08 4.29FY09 4.20FY10 4.50FY11 5.76FY12 7.40FY13 9.76

31
Volume Distributed
(TBs)ASDC ASF CDDIS GESDISC GHRC LP DAAC MODAPS NSIDC OBPG ORNL PO.DAAC SEDAC Total
FY00 6.32 0.01 0.00 20.99 0.63 8.69 0.00 0.24 0.00 0.01 1.85 0.08 38.82FY01 30.38 0.14 0.00 45.37 1.00 25.71 0.00 0.40 0.00 0.02 2.73 0.12 105.87FY02 62.53 0.05 0.00 82.97 1.25 171.32 0.00 1.36 0.00 0.47 4.92 0.17 325.03FY03 107.90 1.36 0.00 185.02 6.49 110.43 0.00 4.20 0.00 1.21 28.08 0.22 444.90FY04 147.01 2.35 0.00 278.13 7.70 209.82 0.00 15.91 2.90 1.23 37.49 0.16 702.68FY05 127.37 2.31 0.00 361.22 7.56 224.27 0.00 27.11 8.69 1.90 31.37 0.17 791.97FY06 204.70 1.88 0.00 493.29 9.10 329.00 18.48 55.69 23.71 0.95 36.55 0.16 1,173.50FY07 225.24 2.16 0.00 192.65 8.01 431.40 564.21 69.54 36.01 1.17 14.06 0.08 1,544.53FY08 167.14 16.50 0.00 302.80 12.08 448.12 813.94 81.32 59.61 0.74 62.17 0.06 1,964.48FY09 187.92 41.98 9.20 487.32 8.63 538.94 866.75 120.00 73.96 2.86 91.35 0.32 2,429.21FY10 232.71 2.66 17.43 698.68 12.41 952.71 1,287.38 140.17 173.85 4.99 104.92 1.43 3,629.34FY11 195.51 103.11 35.76 1,042.45 5.94 1,178.55 1,578.39 185.14 282.98 7.16 111.83 2.88 4,729.70FY12 643.93 188.18 37.52 1,327.66 7.28 1,200.87 1,289.79 168.34 370.49 10.16 161.62 1.47 5,407.31FY13 624.54 81.96 48.77 1,942.48 6.95 1,456.17 2,080.39 180.23 500.98 16.33 232.36 2.57 7,173.73
Total Volume (TBs)
2,963.19 444.65 148.68 7,461.03 95.02 7,285.98 8,499.34 1,049.63 1,533.16 49.20 921.30 9.89 30,461.07
Data Volume Distribution TrendThe Volume Distribution Trend presents distributed volume counts from EMS by DAAC. OBPG distribution metrics from the Ocean Color web site are included beginning in FY2004. CDDIS data became available in FY2009.
February 2014 FY2013 Annual Report

32
Data Product Distribution TrendThe Product Distribution Trend presents distributed product counts from EMS by DAAC. OBPG distribution metrics from the Ocean Color web site are included beginning in FY2004. CDDIS data became available in FY2009.
February 2014 FY2013 Annual Report
Products Distributed (Millions)
ASDC ASF CDDIS GESDISC GHRC LPDAAC MODAPS NSIDC OBPG ORNL PO.DAAC SEDACTotal
Products
FY00 0.22 0.00 0.00 2.34 0.97 0.62 0.00 0.13 0.00 0.01 1.05 0.19 5.52FY01 0.97 0.00 0.00 2.64 1.03 1.24 0.00 0.25 0.00 0.03 2.08 0.26 8.49FY02 3.68 0.00 0.00 5.28 1.42 4.63 0.00 0.40 0.00 0.09 3.55 0.26 19.31FY03 4.15 0.03 0.00 10.92 4.68 3.72 0.00 0.86 0.00 0.11 10.45 0.30 35.21FY04 6.77 0.06 0.00 15.67 3.40 8.90 0.00 0.96 0.29 0.42 10.30 0.25 47.03FY05 5.70 0.06 0.00 26.55 3.58 15.08 0.00 1.80 1.71 0.49 12.83 0.26 68.06FY06 7.78 0.04 0.00 41.41 4.05 11.93 1.67 4.69 4.91 0.36 13.48 0.32 90.64FY07 7.32 0.05 0.00 30.98 9.29 24.32 33.36 8.13 7.04 1.22 5.71 0.11 127.54FY08 3.57 0.30 0.00 38.75 10.18 16.76 47.74 10.73 10.67 0.40 16.49 0.07 155.66FY09 5.11 0.47 37.06 54.50 5.68 38.83 47.21 17.25 8.66 7.70 31.72 0.49 254.66FY10 4.41 0.10 52.60 84.22 0.66 51.95 79.76 22.90 12.43 49.88 50.33 3.57 412.80FY11 5.04 0.37 112.33 133.84 0.72 63.97 98.77 20.18 20.54 3.19 38.27 4.16 501.38FY12 10.63 0.85 120.03 168.68 0.79 70.59 95.25 24.34 16.77 6.71 54.07 1.60 570.28FY13 10.21 0.67 120.93 209.91 4.43 111.74 135.29 38.22 18.29 5.76 89.25 4.69 749.40
Total Products (Millions)
75.56 3.00 442.95 825.68 50.88 424.27 539.02 150.83 101.30 76.36 339.60 16.52 3,045.99

33
Ranking Product Description GBs Files1 MYD021KM Level 1B Calibrated Radiances - 1km 238,001.11 2,840,4872 MOD09GA MODIS/Terra Surface Reflectance Daily L2G Global 1km and 500m SIN Grid 215,509.78 3,239,7133 CAL_LID_L1-VALSTAGE1-V3CALIPSO Lidar Level 1B profile data (CAL_LID_L1-ValStage1-V3) 199,404.97 446,3464 AIRIBRAD AIRS/Aqua infrared geolocated radiances 188,918.54 5,252,5255 MOD021KM Level 1B Calibrated Radiances - 1km 187,906.68 3,030,7346 MOD13Q1 MODIS/Terra Vegetation Indices 16-Day L3 Global 250m SIN Grid 162,792.37 1,410,6637 MOD09A1 MODIS/Terra Surface Reflectance 8-Day L3 Global 500m SIN Grid 156,108.68 3,199,4398 MYD03 Geolocation - 1km 119,162.63 5,325,7859 MAT1NXSLV
MERRA 2D IAU Diagnostic, Single Level Meteorology, Time Average 1-hourly (2/3x1/2L1) 95,156.49 11,973,896
10 MOD09GQ MODIS/Terra Surface Reflectance Daily L2G Global 250m SIN Grid 94,676.79 1,332,332
Ranking Product Description GBs Files1 MYD021KM Level 1B Calibrated Radiances - 1km 398,907.23 4,098,3432 AIRIBRAD AIRS/Aqua infrared geolocated radiances 368,325.09 7,868,2013 MOD021KM Level 1B Calibrated Radiances - 1km 339,845.22 3,328,5574 MOD13Q1 MODIS/Terra Vegetation Indices 16-Day L3 Global 250m SIN Grid 211,364.13 1,658,6845 MOD09GA MODIS/Terra Surface Reflectance Daily L2G Global 1km and 500m SIN Grid 201,163.13 7,024,9276 MYD03 Geolocation - 1km 184,498.36 7,262,2977 MOD09A1 MODIS/Terra Surface Reflectance 8-Day L3 Global 500m SIN Grid 166,373.19 5,197,9458
CAL_LID_L1-VALSTAGE1-V3 CALIPSO Lidar Level 1B profile data (CAL_LID_L1-ValStage1-V3) 152,024.55 341,894
9 MYDL1A MODIS-AQUA L1A data 143,318.43 1,562,87510 MAT1NXSLV
MERRA 2D IAU Diagnostic, Single Level Meteorology, Time Average 1-hourly (2/3x1/2L1) 142,137.39 19,053,338
FY2012 Top 10 Products Distributed By Volume*
FY2013 Top 10 Products Distributed By Volume*
Top 10 Products Trend by VolumeFY2012 – FY2013
*Some products are inherently larger than other files in size and therefore may skew the results.
February 2014 FY2013 Annual Report

34
Ranking Product Description Files** GBs1 GNSS_DAILY_D GNSS Daily Compact Observation Data 29,844,606 11,780.852 GNSS_IGSTROP GNSS Final Troposphere Zenith Path Delay Product 17,669,010 65.003 TRMM_3B42 TRMM 3B42 3-Hour 0.25deg x 0.25deg and Other-GPI Calibration Rainfall 17,276,942 27,756.794 MOD04_L2 Level 2 Aerosol 16,172,906 18,844.105 MYD04_L2 Level 2 Aerosol 13,195,856 15,827.186 MAI3CPASM MERRA 3D IAU State, Meteorology Instantaneous 3-hourly (p-coord, 1.25x1.25L42) 13,095,069 89,816.267 AIRX2RET AIRS/Aqua FINAL Level 2 Products (Without HSB) 12,975,075 17,416.088 NLDAS_FORA0125_HNLDAS Primary Forcing Data L4 Hourly 0.125 x 0.125 degree V002 12,242,371 18,612.659 MAT1NXSLV MERRA 2D IAU Diagnostic, Single Level Meteorology, Time Average 1-hourly (2/3x1/2L1)11,973,896 95,156.4910 GPS_IGUORB GPS Ultra-Rapid Combined Orbit Solution Product 11,513,184 4,025.55
Ranking Product Description Files** GBs1 GNSS_DAILY_D GNSS Daily Compact Observation Data 28,919,111 12,842.112 TRMM_3B42 TRMM 3B42 3-Hour 0.25deg x 0.25deg and Other-GPI Calibration Rainfall 25,323,244 53,091.723 NLDAS_FORA0125_HNLDAS Primary Forcing Data L4 Hourly 0.125 x 0.125 degree V002 20,555,802 27,881.164 MAT1NXSLV MERRA 2D IAU Diagnostic, Single Level Meteorology, Time Average 1-hourly (2/3x1/2L1)19,053,338 142,137.395 PODAAC-OSCAR-03D01OSCAR third degree resolution ocean surface currents 16,873,392 951.326 AIRX2RET AIRS/Aqua FINAL Level 2 Products (Without HSB) 16,458,995 31,694.887 MOD04_L2 Level 2 Aerosol 15,387,273 17,264.458 PODAAC-GHMDA-2PJ01GHRSST Level 2P Global Skin Sea Surface Temperature from the Moderate Resolution Imaging Spectroradiometer (MODIS) on the NASA Aqua satellite12,222,989 29,765.819 GNSS_DAILY_N GNSS Daily GPS Broadcast Ephemeris Data 12,050,596 431.6710 MYD04_L2 Level 2 Aerosol 11,394,147 13,304.16
FY2013 Top 10 Products Distributed By #Files
FY2012 Top 10 Products Distributed By #Files
Top 10 Products Trend by # of FilesFY2012 – FY2013
** When counting # of files, metadata files are not included.
February 2014 FY2013 Annual Report

35
Product Trend FY2007 FY2008 FY2009 FY2010 FY2011 FY2012 FY2013Foreign 35,960,845 56,769,710 120,843,195 152,842,193 189,496,476 259,717,671 360,372,707U.S. 65,563,006 69,857,119 113,052,619 242,093,094 262,304,205 272,259,607 372,244,590
Known U.S. – ForeignProduct Distribution Trend
Note: Metrics do not include product distribution where the destination country could not be determined.
February 2014 FY2013 Annual Report

36
Web TrendsWeb metrics data for EOSDIS became available as of FY2007. Data for FY2007 is complete for 7 DAACs and FY2008 is complete for 8 DAACs. Since FY2009, 11 DAACs provided web metrics. These metrics are for visits of one minute or more. Repeat visitors are counted as 2 or more visits since web activity measurements began for that DAAC.
February 2014 FY2013 Annual Report
Fiscal Year Views Visits Visitors Repeat VisitorsFY2007 7,599,722 707,365 443,079 77,731FY2008 8,263,283 827,714 523,416 91,801FY2009 11,463,765 1,079,317 702,058 116,886FY2010 13,654,146 1,108,858 718,944 205,378FY2011 18,617,279 1,318,598 855,976 150,076FY2012 23,721,135 1,973,920 1,248,743 339,566FY2013 25,320,299 1,929,798 1,183,040 226,968
37
Definitions (1 of 3)
February 2014 FY2013 Annual Report
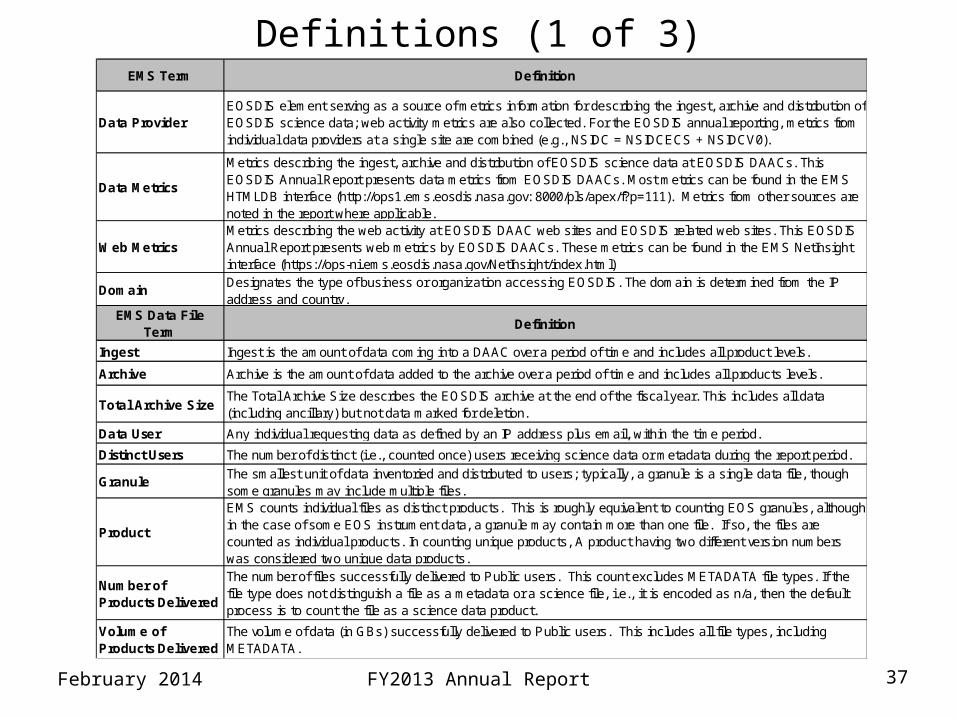
EMS Term Definition
Data ProviderEOSDIS element serving as a source of metrics information for describing the ingest, archive and distribution of EOSDIS science data; web activity metrics are also collected. For the EOSDIS annual reporting, metrics from individual data providers at a single site are combined (e.g., NSIDC = NSIDCECS + NSIDCV0).
Data Metrics
Metrics describing the ingest, archive and distribution of EOSDIS science data at EOSDIS DAACs. This EOSDIS Annual Report presents data metrics from EOSDIS DAACs. Most metrics can be found in the EMS HTMLDB interface (http://ops1.ems.eosdis.nasa.gov: 8000/pls/apex/f?p=111). Metrics from other sources are noted in the report where applicable.
Web MetricsMetrics describing the web activity at EOSDIS DAAC web sites and EOSDIS related web sites. This EOSDIS Annual Report presents web metrics by EOSDIS DAACs. These metrics can be found in the EMS NetInsight interface (https://ops-ni.ems.eosdis.nasa.gov/NetInsight/index.html)
DomainDesignates the type of business or organization accessing EOSDIS. The domain is determined from the IP address and country.
EMS Data File Term
Definition
Ingest Ingest is the amount of data coming into a DAAC over a period of time and includes all product levels.
Archive Archive is the amount of data added to the archive over a period of time and includes all products levels.
Total Archive SizeThe Total Archive Size describes the EOSDIS archive at the end of the fiscal year. This includes all data (including ancillary) but not data marked for deletion.
Data User Any individual requesting data as defined by an IP address plus email, within the time period.
Distinct Users The number of distinct (i.e., counted once) users receiving science data or metadata during the report period.
GranuleThe smallest unit of data inventoried and distributed to users; typically, a granule is a single data file, though some granules may include multiple files.
Product
EMS counts individual files as distinct products. This is roughly equivalent to counting EOS granules, although in the case of some EOS instrument data, a granule may contain more than one file. If so, the files are counted as individual products. In counting unique products, A product having two different version numbers was considered two unique data products.
Number of Products Delivered
The number of files successfully delivered to Public users. This count excludes METADATA file types. If the file type does not distinguish a file as a metadata or a science file, i.e., it is encoded as n/a, then the default process is to count the file as a science data product.
Volume of Products Delivered
The volume of data (in GBs) successfully delivered to Public users. This includes all file types, including METADATA.
38
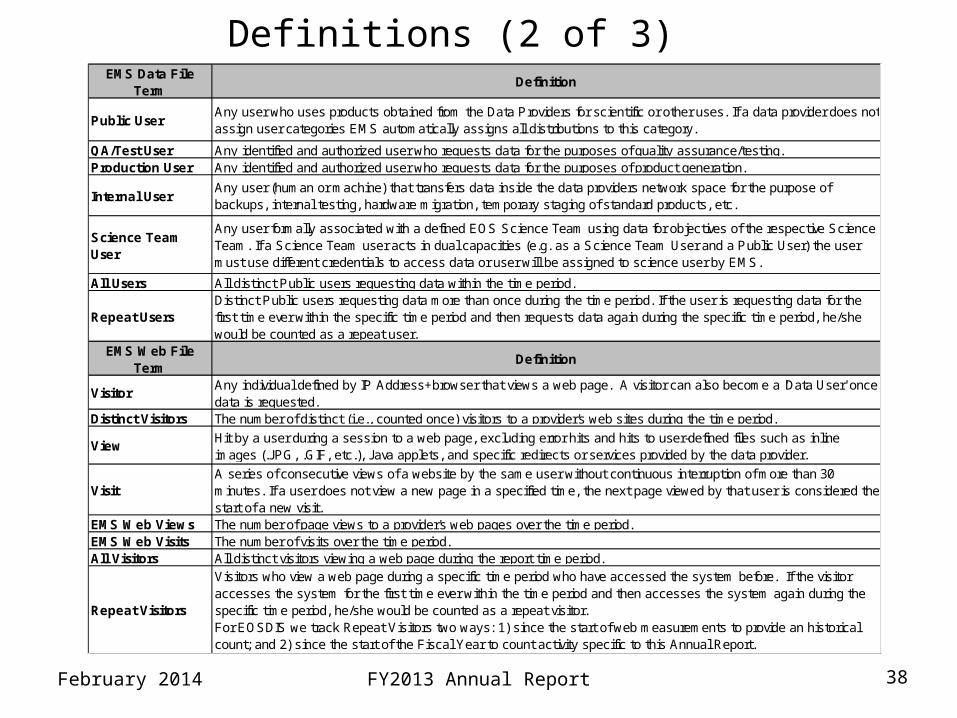
Definitions (2 of 3)
February 2014 FY2013 Annual Report
EMS Data File Term
Definition
Public UserAny user who uses products obtained from the Data Providers for scientific or other uses. If a data provider does not assign user categories EMS automatically assigns all distributions to this category.
QA/Test User Any identified and authorized user who requests data for the purposes of quality assurance/testing.Production User Any identified and authorized user who requests data for the purposes of product generation.
Internal UserAny user (human or machine) that transfers data inside the data providers network space for the purpose of backups, internal testing, hardware migration, temporary staging of standard products, etc.
Science Team User
Any user formally associated with a defined EOS Science Team using data for objectives of the respective Science Team. If a Science Team user acts in dual capacities (e.g. as a Science Team User and a Public User) the user must use different credentials to access data or user will be assigned to science user by EMS.
All Users All distinct Public users requesting data within the time period.
Repeat UsersDistinct Public users requesting data more than once during the time period. If the user is requesting data for the first time ever within the specific time period and then requests data again during the specific time period, he/she would be counted as a repeat user.
EMS Web File Term
Definition
VisitorAny individual defined by IP Address+browser that views a web page. A visitor can also become a 'Data User' once data is requested.
Distinct Visitors The number of distinct (i.e., counted once) visitors to a provider's web sites during the time period.
ViewHit by a user during a session to a web page, excluding error hits and hits to user-defined files such as inline images (.JPG, .GIF, etc.), Java applets, and specific redirects or services provided by the data provider.
VisitA series of consecutive views of a website by the same user without continuous interruption of more than 30 minutes. If a user does not view a new page in a specified time, the next page viewed by that user is considered the start of a new visit.
EMS Web Views The number of page views to a provider's web pages over the time period. EMS Web Visits The number of visits over the time period.All Visitors All distinct visitors viewing a web page during the report time period.
Repeat Visitors
Visitors who view a web page during a specific time period who have accessed the system before. If the visitor accesses the system for the first time ever within the time period and then accesses the system again during the specific time period, he/she would be counted as a repeat visitor.For EOSDIS we track Repeat Visitors two ways: 1) since the start of web measurements to provide an historical count; and 2) since the start of the Fiscal Year to count activity specific to this Annual Report.

February 2014 FY2013 Annual Report 39
Definitions (3 of 3)Report Term Definition
Stage 1 Metrics data directly from the EMS tools, presented by “data provider” as available.
Stage 2
Metrics data grouped by “DAAC”, augmented with external data, includes all twelve DAACs. Grouping is done for the 3 DAACs that have multiple data providers: ASDC DAAC (LARC ANGE, LARC ECS, LARC ORDERS), LP DAAC (LP DAAC, LPDAAC DEM, LPDAAC MRTWEB LPDAAC LTA) and NSIDC DAAC (NSIDC, NSIDC SRCHLT, NSIDC V0).
Stage 3 Metrics data presented by the major contributing DAACs, often accompanied by a graphic.