Environmentally Benign Oil Simulants to Mimic the … · Environmentally Benign Oil Simulants to...
21
Environmentally Benign Oil Simulants to Mimic the Behavior of Oil Droplets in the Ocean FINAL REPORT By Anthony T. Zimmer, PhD, PE U.S. EPA/National Risk Management Research Laboratory/Land Remediation and Pollution Control Division Cincinnati, OH 45268 Robyn N. Conmy, PhD U.S. EPA/National Risk Management Research Laboratory/Land Remediation and Pollution Control Division Cincinnati, OH 45268 Sanjeewa K. Rodrigo, PhD Pegasus Contractor Cincinnati, OH 45268 Interagency Agreement/Grant/Contract Number- IA E13PG0056/0000-0004 Land Remediation and Pollution Control Division National Risk Management Research Laboratory Cincinnati, Ohio, 45268
Transcript of Environmentally Benign Oil Simulants to Mimic the … · Environmentally Benign Oil Simulants to...

Environmentally Benign Oil Simulants to Mimic the
Behavior of Oil Droplets in the Ocean
FINAL REPORT
By
Anthony T. Zimmer, PhD, PE
U.S. EPA/National Risk Management Research
Laboratory/Land Remediation and Pollution Control Division
Cincinnati, OH 45268
Robyn N. Conmy, PhD
U.S. EPA/National Risk Management Research
Laboratory/Land Remediation and Pollution Control Division
Cincinnati, OH 45268
Sanjeewa K. Rodrigo, PhD
Pegasus Contractor
Cincinnati, OH 45268
Interagency Agreement/Grant/Contract Number-
IA E13PG0056/0000-0004
Land Remediation and Pollution Control Division
National Risk Management Research Laboratory
Cincinnati, Ohio, 45268

2
Table of Contents
1 Introduction 3
2 Materials and Methods 8
2.1 Materials 8
2.2 Coaxial electrospray experimental setup 8
2.3 General method of fabrication of core-shell particles by coaxial electrospray 9
2.3.1 Droplet formation 9
2.3.2 Development of the synthesis process 9
2.3.3 Modification of the dual capillary instrumentation 10
3 Core-shell Synthesis with Dual Capillary Electrospray 11
3.1 An effort to electrospray 0.006 v/v fluorescein sodium salt solution 11
3.2 Core shell synthesis with rhodamine B (core) and α-D(+)-Glucose pentaacetate (shell) 11
3.3 Core shell synthesis with rhodamine B (core) and α-D(+)-Glucose pentaacetate (shell) 12
3.4 Core shell synthesis with rhodamine B + polycaprolactone (core) and α-D(+)-Glucose pentaacetate (shell)
13
3.5 Core shell synthesis with fluorescein (core) and PLGA (Shell) using the modified setup 14
3.6 Core shell synthesis with fluorescein + PLGA (core) and α-D(+)-Glucose pentaacetate (shell)
15
3.7 Core shell synthesis with fluorescein + PCL (core) and α-D(+)-Glucose pentaacetate (shell) 17
4 Summary and Conclusions 18
5 Potential Future Research 20
6 References 20
3
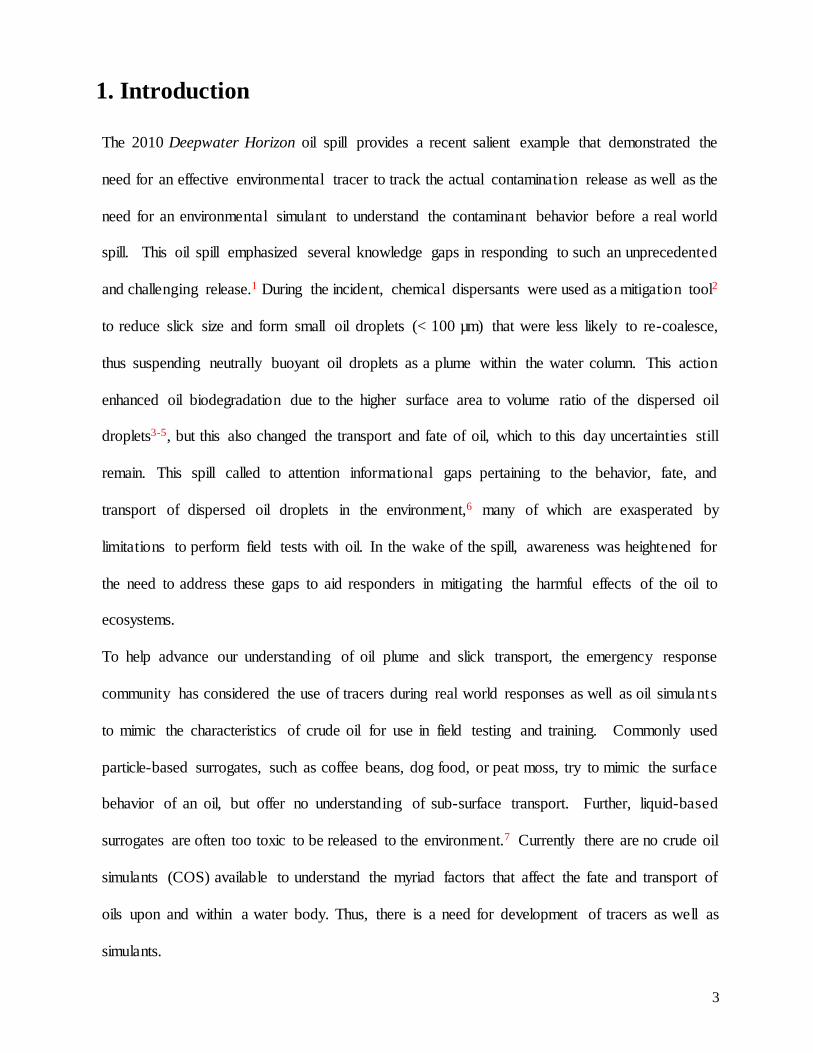
1. Introduction
The 2010 Deepwater Horizon oil spill provides a recent salient example that demonstrated the
need for an effective environmental tracer to track the actual contamination release as well as the
need for an environmental simulant to understand the contaminant behavior before a real world
spill. This oil spill emphasized several knowledge gaps in responding to such an unprecedented
and challenging release.1 During the incident, chemical dispersants were used as a mitigation tool2
to reduce slick size and form small oil droplets (< 100 µm) that were less likely to re-coalesce,
thus suspending neutrally buoyant oil droplets as a plume within the water column. This action
enhanced oil biodegradation due to the higher surface area to volume ratio of the dispersed oil
droplets3-5, but this also changed the transport and fate of oil, which to this day uncertainties still
remain. This spill called to attention informational gaps pertaining to the behavior, fate, and
transport of dispersed oil droplets in the environment,6 many of which are exasperated by
limitations to perform field tests with oil. In the wake of the spill, awareness was heightened for
the need to address these gaps to aid responders in mitigating the harmful effects of the oil to
ecosystems.
To help advance our understanding of oil plume and slick transport, the emergency response
community has considered the use of tracers during real world responses as well as oil simulants
to mimic the characteristics of crude oil for use in field testing and training. Commonly used
particle-based surrogates, such as coffee beans, dog food, or peat moss, try to mimic the surface
behavior of an oil, but offer no understanding of sub-surface transport. Further, liquid-based
surrogates are often too toxic to be released to the environment.7 Currently there are no crude oil
simulants (COS) available to understand the myriad factors that affect the fate and transport of
oils upon and within a water body. Thus, there is a need for development of tracers as well as
simulants.
4
Engineered particles have been used in a variety of air-related studies to model and visua lize
transport phenomena.8-10 The transfer of this technology to aquatic environments would provide
a new tool for oil spill researchers both for use as a tracer in a real world response as well as
tracking the behavior of oil droplets without the need to release petroleum, vegetable or animal
oils into the environment for research purposes. The key is producing a tracer/simulant that is:
(1) readily detected in both concentrated and dilute conditions, (2) environmentally degradable to
minimize long-term fate in the environment, and (3) mimicking, as closely as possible, the
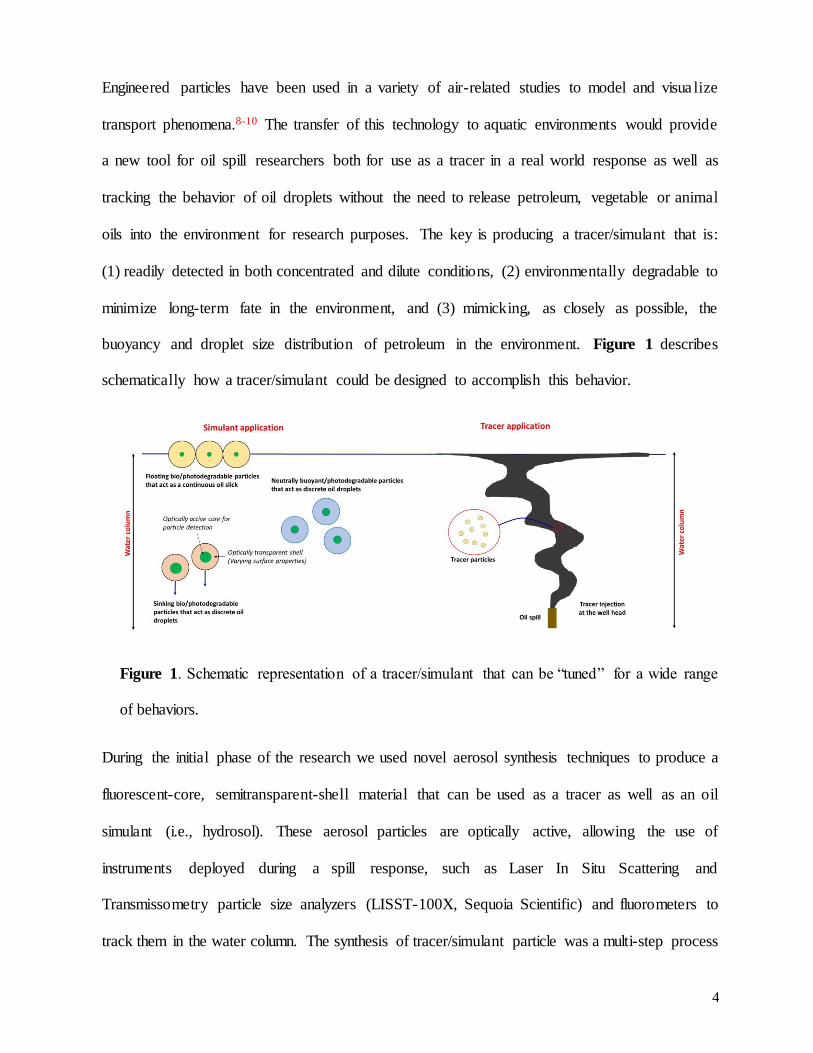
buoyancy and droplet size distribution of petroleum in the environment. Figure 1 describes
schematically how a tracer/simulant could be designed to accomplish this behavior.
Figure 1. Schematic representation of a tracer/simulant that can be “tuned” for a wide range
of behaviors.
During the initial phase of the research we used novel aerosol synthesis techniques to produce a
fluorescent-core, semitransparent-shell material that can be used as a tracer as well as an oil
simulant (i.e., hydrosol). These aerosol particles are optically active, allowing the use of
instruments deployed during a spill response, such as Laser In Situ Scattering and
Transmissometry particle size analyzers (LISST-100X, Sequoia Scientific) and fluorometers to
track them in the water column. The synthesis of tracer/simulant particle was a multi-step process
5
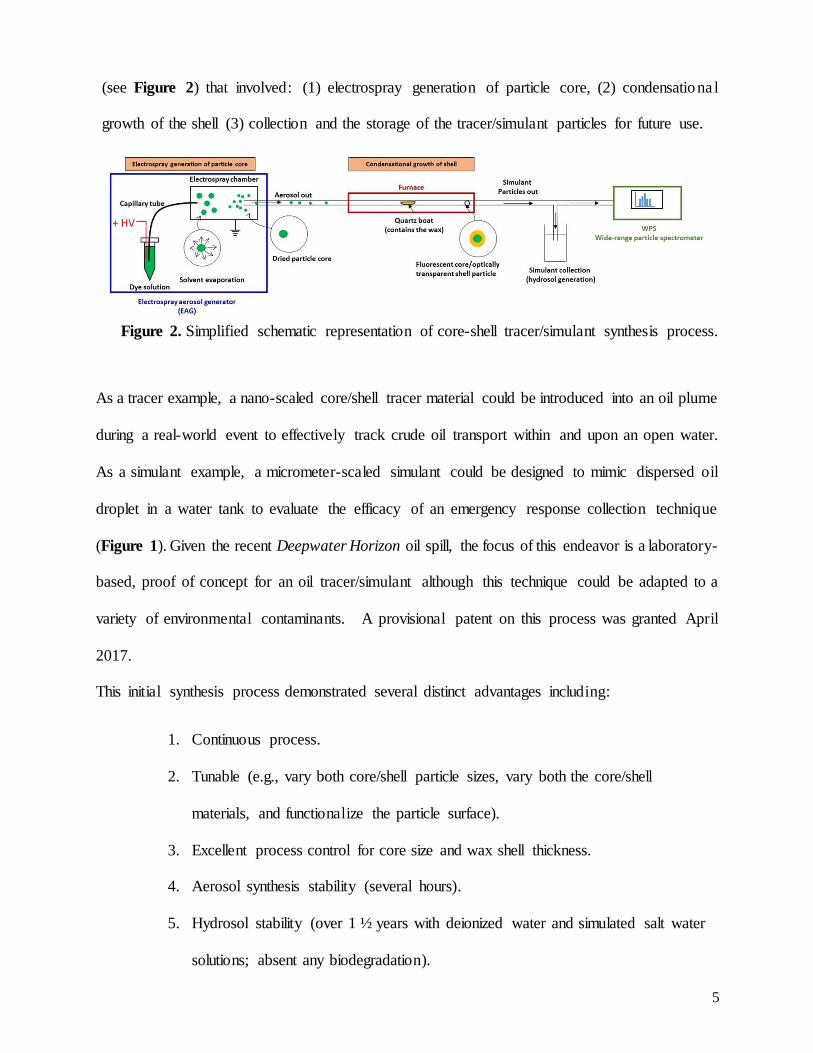
(see Figure 2) that involved: (1) electrospray generation of particle core, (2) condensationa l
growth of the shell (3) collection and the storage of the tracer/simulant particles for future use.
Figure 2. Simplified schematic representation of core-shell tracer/simulant synthesis process.
As a tracer example, a nano-scaled core/shell tracer material could be introduced into an oil plume
during a real-world event to effectively track crude oil transport within and upon an open water.
As a simulant example, a micrometer-scaled simulant could be designed to mimic dispersed oil
droplet in a water tank to evaluate the efficacy of an emergency response collection technique
(Figure 1). Given the recent Deepwater Horizon oil spill, the focus of this endeavor is a laboratory-
based, proof of concept for an oil tracer/simulant although this technique could be adapted to a
variety of environmental contaminants. A provisional patent on this process was granted April
2017.
This initial synthesis process demonstrated several distinct advantages including:
1. Continuous process.
2. Tunable (e.g., vary both core/shell particle sizes, vary both the core/shell
materials, and functionalize the particle surface).
3. Excellent process control for core size and wax shell thickness.
4. Aerosol synthesis stability (several hours).
5. Hydrosol stability (over 1 ½ years with deionized water and simulated salt water
solutions; absent any biodegradation).

6
6. Use of water as a solvent in the synthesis process (i.e., environmentally benign).
There were several process limitations including:
1. Small particle size (20-40 nm).
2. Small production volume (0.001 mg/hour/nozzle).
3. Low particle collection efficiencies (1% collection).
Funding extension was received to improve/scale the aerosol synthesis process. An improved
synthesis beyond the initial method would focus upon increasing the particle size and reducing the
process steps to a single step. More efficient method to increase the size would be to use a larger
capillary for electrospraying. In order to make the whole process a single step, the core and the
shell should be formed at the same time from a double-layered Taylor cone11. In an effort to
improve the synthesis process and to create larger oil simulant particles, here we report the dual
capillary system. The dual capillary system grants an alternative oil simulant synthesis technique
with following advantages:
1. Single-step synthesis process.
2. Possible to produce particles over a large size range (nm to µm).
3. High particle collection efficiencies possible due to electrostatic principles.
7
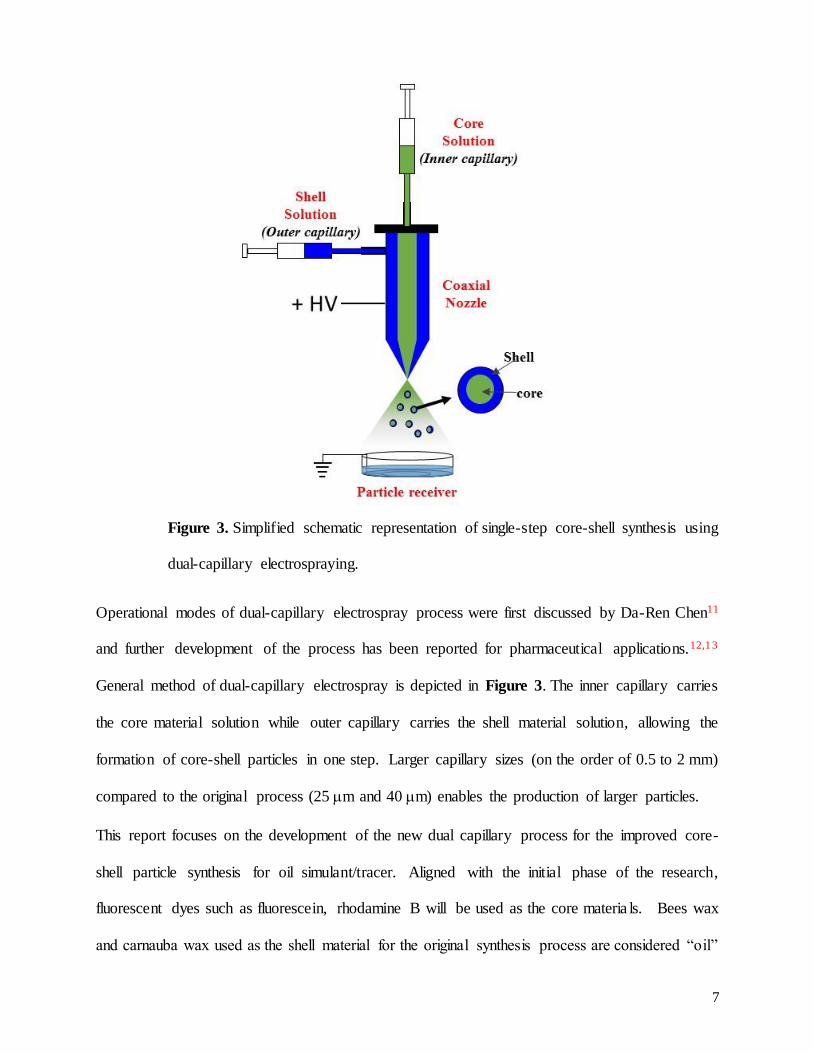
Figure 3. Simplified schematic representation of single-step core-shell synthesis using
dual-capillary electrospraying.
Operational modes of dual-capillary electrospray process were first discussed by Da-Ren Chen11
and further development of the process has been reported for pharmaceutical applications.12,1 3
General method of dual-capillary electrospray is depicted in Figure 3. The inner capillary carries
the core material solution while outer capillary carries the shell material solution, allowing the
formation of core-shell particles in one step. Larger capillary sizes (on the order of 0.5 to 2 mm)
compared to the original process (25 m and 40 m) enables the production of larger particles.
This report focuses on the development of the new dual capillary process for the improved core-
shell particle synthesis for oil simulant/tracer. Aligned with the initial phase of the research,
fluorescent dyes such as fluorescein, rhodamine B will be used as the core materia ls. Bees wax
and carnauba wax used as the shell material for the original synthesis process are considered “oil”

8
and require waiver of permit for open water use. Alternatively, FDA approved biocompatib le
materials, which are often used for drug delivery in humans, such as modified sugars; α-D(+)-
Glucose pentaacetate, polymers; polycaprolactone, Poly(D, L-lactide-co-glycolide) will be
reported as alternate shell materials.
2. Materials and Methods
2.1 Materials
Acid terminated Poly (D, L-lactide-co-glycolide)-50:50, MW 35000 (PLGA)was obtained from
polysciences, Inc. polycaprolactone-Mn 45000 (PCL), rhodamine B (RB), fluorescein sodium salt
(FSS), fluorescein, Polyvinyl alcohol-MW 9000-10000 (PVA), α-D(+)-Glucose pentaacetate,
were purchased from Sigma-Aldrich. Ethyl acetate, acetonitrile, chloroform and acetone were
purchased from Fisher scientific. All materials were used as received. Transition electron
microscopic imaging was done using Jeol, JEM 2100 and FEI, CM 20 Transition Electron
Microscope (TEM). Scanning electron microscopic imaging was done using FEI, Scios Scanning
Electron Microscope (SEM).
2.2 Coaxial electrospray experimental setup
Electrospray synthesis of core-shell particles was achieved using the experimental setup given in
Figure 4. The experimental setup consists of a droplet generation unit, a droplet collection unit
and a process-monitoring unit. The droplet generation unit is made up of several components,
coaxial needle (Linari Engineering, Italy, COAX_2DISP, inner capillary OD/ID 0.83/0.51 mm,
outer capillary OD/ID 1.83/1.37 mm), two programmable syringe pumps (Chemyx, Fusion 100,
model 7100), high voltage DC power supply (Spellman, 205B-10R), Pt-cured silicone tubing
(Harvard apparatus, OD/ID 1.2/0.64 mm). The droplet collection unit can usually be a piece of
conductive metal like Al foil or a beaker containing conductive fluids (e.g., 100 mL of 0.1 % PVA
water solution). Process monitoring unit consists of a macro lens (Navitar, 18-108 mm, F2.5),

9
image sensor (Moticam 10+, 10 megapixels) and a computer. The positive terminal from the high
voltage power supply unit is connected to the nozzle while the ground terminal is connected to Al
foil or conductive PVA solution container.
Applied voltage/current can be directly read on the high voltage supply unit and the flow rates of
the solutions are set using the syringe pumps. The distance from the nozzle tip to the receiver, d,
will be measured manually using a ruler. Taylor cone visualization (i.e., videos or static pictures)
will be captured using the camera unit and computer.
2.3 General method of fabrication of core-shell particles by coaxial electrospray
2.3.1 Droplet formation
An elevated electric field is generated between the dual capillary nozzle and the particle receiver
by applying positive voltage to the nozzle and grounding the particle receiver. When sample
solutions injected in to the nozzle (Figure 4), under this elevated electric field, a double-layered
Taylor cone can be formed at the tip of the coaxial needle. The liquid sprayed from the apex of the
cone breaks into core-shell droplets, which will become partially dried particles upon solvent
evaporation.13
2.3.2 Development of the Synthesis process
Figure 4. Simplified schematic representation of the dual capillary core shell process.

10
Initially the setup shown in Figure 4 was used for the synthesis of core-shell structures. Due to the
limited voltage supply (10 kV max), the distance from the nozzle tip to the collector, d, is restricted
to about 5 cm. This restriction hindered the drying efficiency of aerosol particles.
2.3.3 Modification of the dual capillary instrumentation
In order to improve drying of particles, dual capillary process was modified as depicted in the
Figure 5. A “doughnut” shape ground electrode, located 5 cm away from the nozzle tip, allows
the aerosol particles to move through the center opening providing them more time to dry and
reach the particle collector. As shown in Figure 5 this modification effectively increased the
distance from the nozzle tip to the collector from 5 cm to 25 cm. As will be discussed, the
modification allowed additional drying time, however, it also caused loss of particle charging. The
loss of particle charge facilitated particle agglomeration within the spray plume. Synthesis example
“3.5” given in section 3 exemplifies the results of this modification.
Figure 5. Schematic representation of modified dual capillary electrospray system.
11
The following section provides the results and discussion of the dual-capillary experimenta l
apparatus. Several factors were investigated including changes to the core-shell materials, core-
shell solvents and grounding of the electrospray process.
3. Core-shell Synthesis with Dual Capillary Electrospray
3.1 An effort to electrospray 0.006 v/v fluorescein sodium salt (FSS) solution
First, a standard buffer (SB) solution was prepared by adding ammonium acetate (0.77g) and
ammonium hydroxide solution (1M, 0.75 mL) to ultrapure water (500 mL). FSS (0.006 v/v)
solution was made by dissolving 0.152 g of FSS in 20 mL of SB. The solution was electrosprayed
according to the method given above. The distance from the nozzle tip to the collector, d, was kept
at 5 cm (Figure 4). Unstable electrospraying was observed only at 10 kV and at flow rate of 4
mL/hr. Further optimization of the process was not possible as available voltage was limited to 10
kV. This solution requires much higher voltage to properly electrospray as FSS solution in SB is
highly conductive (6.6 ms/cm) and has high surface tension. To overcome these issues, organic
solvents were used for subsequent experiments as they are more volatile (i.e., allowing the
electrospray droplets to fully dry before collection).
3.2 Core shell synthesis with rhodamine B (core) and α-D(+)-Glucose pentaacetate (shell)
Core solution (1 wt%) was made by dissolving 0.156 g of Rhodamine B (RB) in 20 mL of
acetonitrile. Shell solution (1 wt%) was made by dissolving 0.156 g of α-D(+)-Glucose
pentaacetate in 20 mL of acetonitrile. The distance from the nozzle tip to the collector, d, was kept
at 5 cm (Figure 4). The solutions were electrosprayed at 7 kV in cone-jet mode at feeding rates of
4 mL/h and 6 mL/h for core solution and shell solution respectively. Electrosprayed aerosol
particles were collected directly onto TEM grids kept on the grounded Al foil and analyzed using
TEM.

12
Results and Discussion
Core shell particles with diameter ranging from 150 nm to 300 nm were observed. This represents
roughly an order of magnitude particle size increase from the original synthesis process. Core shell
structure was clearly visible as seen in Figure 6. Core-shell particles appeared to have a porous
morphology that may have resulted from solvent evaporation leaving void spaces in the core shell
structure.
Figure 6. TEM image of a core-shell particle.
3.3 Core shell synthesis with rhodamine B (core) and polycaprolactone (shell)
Core solution (1 wt%) was made by dissolving 0.156 g of Rhodamine B (RB) in 20 mL of
acetonitrile. Shell solution (0.5 wt%) was made by dissolving 0.137 g of polycaprolactone (PCL)
in 20 mL of chloroform. The distance from the nozzle tip to the collector, d, was kept at 5 cm
(Figure 4). The solutions were electrosprayed at 7 kV in cone-jet mode at feeding rates of 4 mL/h
and 10 mL/h for core solution and shell solution respectively. Electrosprayed aerosol particles
were collected directly onto TEM grids kept on the grounded Al foil collector and the grids were
analyzed using TEM.
13
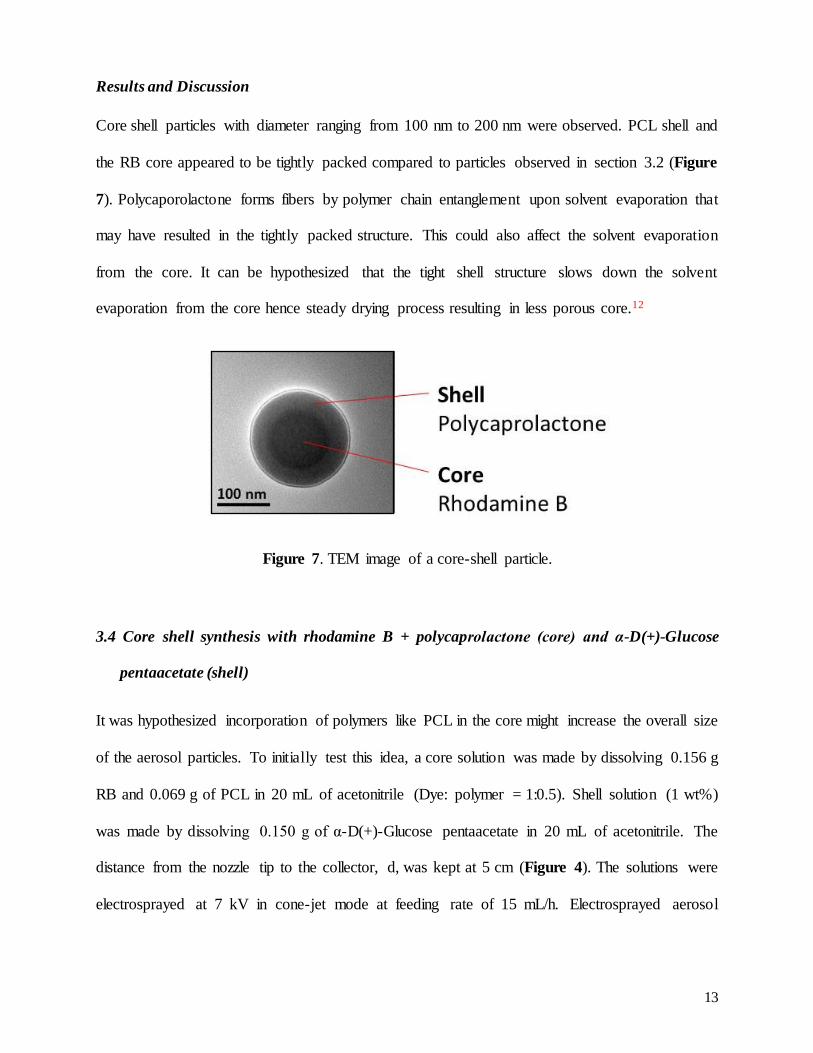
Results and Discussion
Core shell particles with diameter ranging from 100 nm to 200 nm were observed. PCL shell and
the RB core appeared to be tightly packed compared to particles observed in section 3.2 (Figure
7). Polycaporolactone forms fibers by polymer chain entanglement upon solvent evaporation that
may have resulted in the tightly packed structure. This could also affect the solvent evaporation
from the core. It can be hypothesized that the tight shell structure slows down the solvent
evaporation from the core hence steady drying process resulting in less porous core.12
Figure 7. TEM image of a core-shell particle.
3.4 Core shell synthesis with rhodamine B + polycaprolactone (core) and α-D(+)-Glucose
pentaacetate (shell)
It was hypothesized incorporation of polymers like PCL in the core might increase the overall size
of the aerosol particles. To initially test this idea, a core solution was made by dissolving 0.156 g
RB and 0.069 g of PCL in 20 mL of acetonitrile (Dye: polymer = 1:0.5). Shell solution (1 wt%)
was made by dissolving 0.150 g of α-D(+)-Glucose pentaacetate in 20 mL of acetonitrile. The
distance from the nozzle tip to the collector, d, was kept at 5 cm (Figure 4). The solutions were
electrosprayed at 7 kV in cone-jet mode at feeding rate of 15 mL/h. Electrosprayed aerosol
14
particles were collected directly onto TEM grids kept on the grounded Al foil collector and
analyzed using TEM.
Results and Discussion
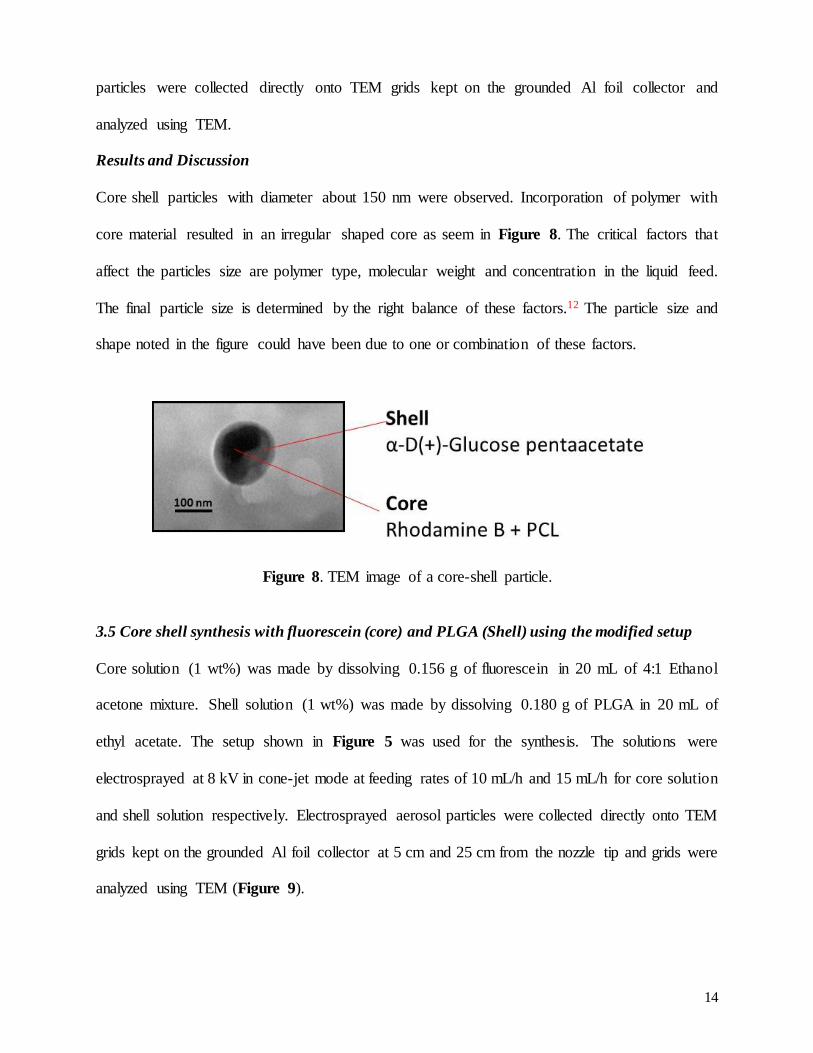
Core shell particles with diameter about 150 nm were observed. Incorporation of polymer with
core material resulted in an irregular shaped core as seem in Figure 8. The critical factors that
affect the particles size are polymer type, molecular weight and concentration in the liquid feed.
The final particle size is determined by the right balance of these factors.12 The particle size and
shape noted in the figure could have been due to one or combination of these factors.
Figure 8. TEM image of a core-shell particle.
3.5 Core shell synthesis with fluorescein (core) and PLGA (Shell) using the modified setup
Core solution (1 wt%) was made by dissolving 0.156 g of fluorescein in 20 mL of 4:1 Ethanol
acetone mixture. Shell solution (1 wt%) was made by dissolving 0.180 g of PLGA in 20 mL of
ethyl acetate. The setup shown in Figure 5 was used for the synthesis. The solutions were
electrosprayed at 8 kV in cone-jet mode at feeding rates of 10 mL/h and 15 mL/h for core solution
and shell solution respectively. Electrosprayed aerosol particles were collected directly onto TEM
grids kept on the grounded Al foil collector at 5 cm and 25 cm from the nozzle tip and grids were
analyzed using TEM (Figure 9).
15
Results and Discussion
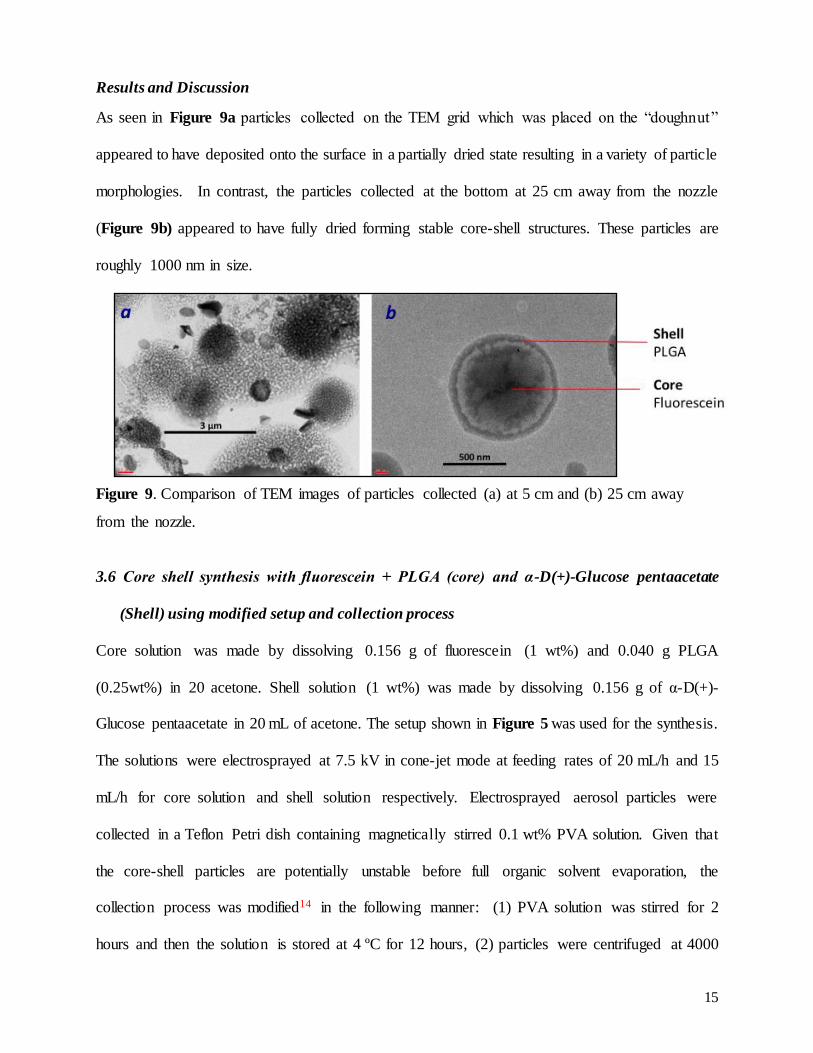
As seen in Figure 9a particles collected on the TEM grid which was placed on the “doughnut”
appeared to have deposited onto the surface in a partially dried state resulting in a variety of particle
morphologies. In contrast, the particles collected at the bottom at 25 cm away from the nozzle
(Figure 9b) appeared to have fully dried forming stable core-shell structures. These particles are
roughly 1000 nm in size.
Figure 9. Comparison of TEM images of particles collected (a) at 5 cm and (b) 25 cm away
from the nozzle.
3.6 Core shell synthesis with fluorescein + PLGA (core) and α-D(+)-Glucose pentaacetate
(Shell) using modified setup and collection process
Core solution was made by dissolving 0.156 g of fluorescein (1 wt%) and 0.040 g PLGA
(0.25wt%) in 20 acetone. Shell solution (1 wt%) was made by dissolving 0.156 g of α-D(+)-
Glucose pentaacetate in 20 mL of acetone. The setup shown in Figure 5 was used for the synthesis.
The solutions were electrosprayed at 7.5 kV in cone-jet mode at feeding rates of 20 mL/h and 15
mL/h for core solution and shell solution respectively. Electrosprayed aerosol particles were
collected in a Teflon Petri dish containing magnetically stirred 0.1 wt% PVA solution. Given that
the core-shell particles are potentially unstable before full organic solvent evaporation, the
collection process was modified14 in the following manner: (1) PVA solution was stirred for 2
hours and then the solution is stored at 4 ºC for 12 hours, (2) particles were centrifuged at 4000
16
rpm for 5 minutes, (3), the supernatant was discarded and the sediment is washed with ultra-pure
water, and (4) the particles were placed into a -30 ºC freezer and lyophilized to produce dried
particles. Dried particles are stored in a light resistant container at 4 ºC. Figure 10 depicts the steps
involved in the optimized collection process.14
Figure 10. Optimized particle collection process.
Results and Discussion
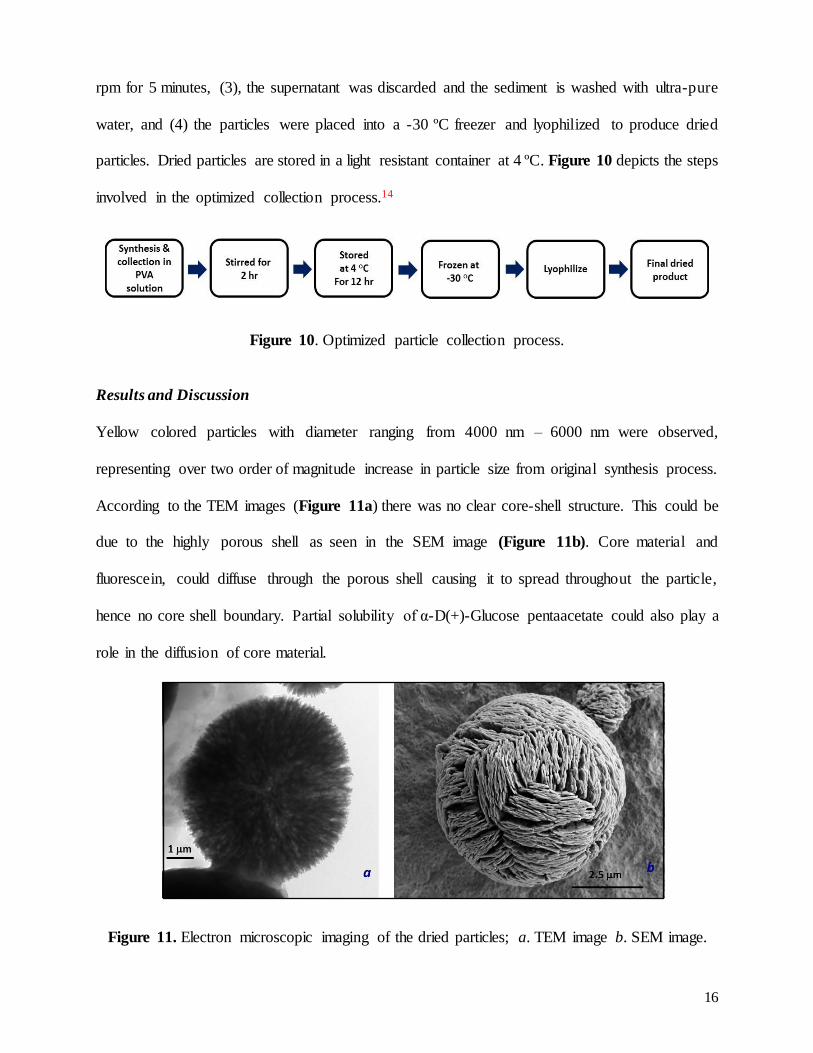
Yellow colored particles with diameter ranging from 4000 nm – 6000 nm were observed,
representing over two order of magnitude increase in particle size from original synthesis process.
According to the TEM images (Figure 11a) there was no clear core-shell structure. This could be
due to the highly porous shell as seen in the SEM image (Figure 11b). Core material and
fluorescein, could diffuse through the porous shell causing it to spread throughout the particle,
hence no core shell boundary. Partial solubility of α-D(+)-Glucose pentaacetate could also play a
role in the diffusion of core material.
Figure 11. Electron microscopic imaging of the dried particles; a. TEM image b. SEM image.

17
3.7 Core shell synthesis with fluorescein + PCL (core) and α-D(+)-Glucose pentaacetate
(Shell)
Core solution was made by dissolving 0.156 g of fluorescein (1 wt%) and 0.040 g PCL (0.2 wt%)
in 20 mL acetone. Shell solution (1 wt%) was made by dissolving 0.156 g of α-D(+)-Glucose
pentaacetate in 20 mL of acetone. The setup shown in Figure 5 was used for the synthesis. The
solutions were electrosprayed at 8.0 kV in cone-jet mode at feeding rate of 20 mL/h.
Electrosprayed aerosol particles were collected in a Teflon Petri dish containing magnetica l ly
stirred 0.1 wt% PVA solution. Particle collection was completed according to the procedure
outlined in Figure 10.
Figure 12. Electron microscopic imaging of the dried particles; a. TEM image b. SEM image.
Results and Discussion
Yellow colored particles with diameter ranging from 2000 nm – 4000 nm were observed. As with
section 3.6 no core-shell boundary was seen (Figure 12a). Nevertheless, fluorescein dye seems to
be embedded in these spheres. During the sample collection in PVA solution an orange colored
material, which seemed to be made of PCL, accumulated at the center of the Petri dish. This could
be due to the PCL fiber formation before solvent evaporation. Electron microscopic analysis of
the particles revealed that the material (dye + polymer) from the core has come out during the
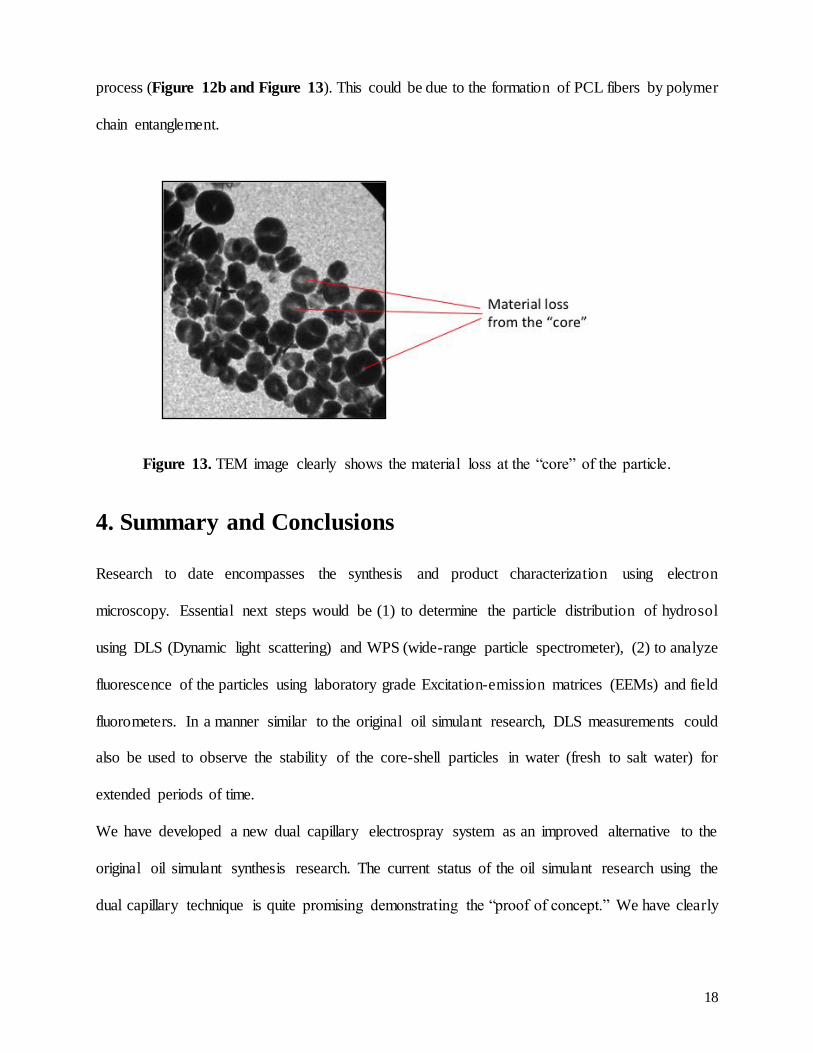
18
process (Figure 12b and Figure 13). This could be due to the formation of PCL fibers by polymer
chain entanglement.
Figure 13. TEM image clearly shows the material loss at the “core” of the particle.
4. Summary and Conclusions
Research to date encompasses the synthesis and product characterization using electron
microscopy. Essential next steps would be (1) to determine the particle distribution of hydrosol
using DLS (Dynamic light scattering) and WPS (wide-range particle spectrometer), (2) to analyze
fluorescence of the particles using laboratory grade Excitation-emission matrices (EEMs) and field
fluorometers. In a manner similar to the original oil simulant research, DLS measurements could
also be used to observe the stability of the core-shell particles in water (fresh to salt water) for
extended periods of time.
We have developed a new dual capillary electrospray system as an improved alternative to the
original oil simulant synthesis research. The current status of the oil simulant research using the
dual capillary technique is quite promising demonstrating the “proof of concept.” We have clearly
19
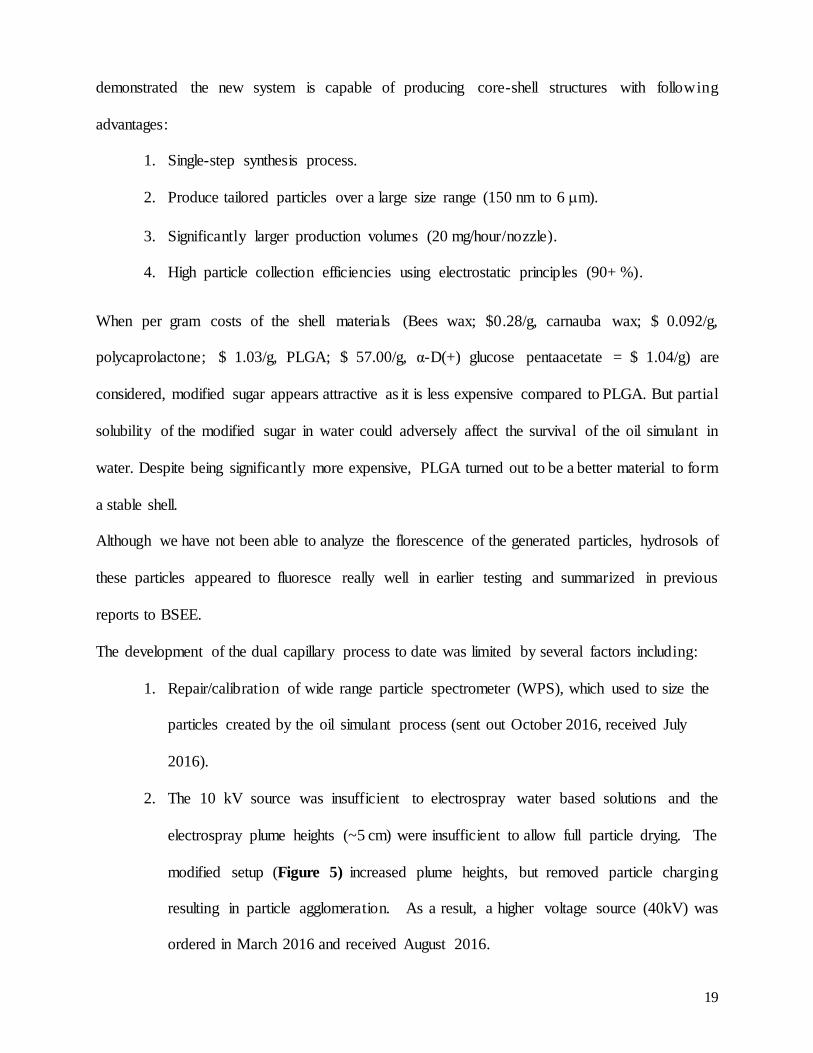
demonstrated the new system is capable of producing core-shell structures with following
advantages:
1. Single-step synthesis process.
2. Produce tailored particles over a large size range (150 nm to 6 m).
3. Significantly larger production volumes (20 mg/hour/nozzle).
4. High particle collection efficiencies using electrostatic principles (90+ %).
When per gram costs of the shell materials (Bees wax; $0.28/g, carnauba wax; $ 0.092/g,
polycaprolactone; $ 1.03/g, PLGA; $ 57.00/g, α-D(+) glucose pentaacetate = $ 1.04/g) are
considered, modified sugar appears attractive as it is less expensive compared to PLGA. But partial
solubility of the modified sugar in water could adversely affect the survival of the oil simulant in
water. Despite being significantly more expensive, PLGA turned out to be a better material to form
a stable shell.
Although we have not been able to analyze the florescence of the generated particles, hydrosols of
these particles appeared to fluoresce really well in earlier testing and summarized in previous
reports to BSEE.
The development of the dual capillary process to date was limited by several factors including:
1. Repair/calibration of wide range particle spectrometer (WPS), which used to size the
particles created by the oil simulant process (sent out October 2016, received July
2016).
2. The 10 kV source was insufficient to electrospray water based solutions and the
electrospray plume heights (~5 cm) were insufficient to allow full particle drying. The
modified setup (Figure 5) increased plume heights, but removed particle charging
resulting in particle agglomeration. As a result, a higher voltage source (40kV) was
ordered in March 2016 and received August 2016.
20
5. Potential Future Research
Although research on the COS has concluded, several factors still need investigation for future
research and development including:
1. Determine the operational parameters of the new process (e.g., optimize material
properties of the fluorescent core/semi-transparent shell oil simulant).
2. Determine the time-dependent stability of the oil simulant in water using DLS
measurements (e.g., fresh to salt water conditions).
3. Determine the fluorescent properties of the oil simulant and associated detection limits
at varying water concentrations.
4. Conduct tank studies on theses COS particles to test their behavior in water.
5. Determine fate/effects/toxicity of these COS particles before use in open water.
6. References
1. Deepwater Horizon Oil Spill: The Fate of the Oil, Congressional research service: Washington,
DC, 2010; https://www.fas.org/sgp/crs/misc/R41531.pdf.
2. Deepwater Horizon: Oil budget calculator, Oil budget calculator science and engineering team: The federal integracy solutions group, 2010;
http://www.restorethegulf.gov/sites/default/files/documents/pdf/OilBudgetCalc_Full_HQ-Print_111110.pdf
3. Venosa, A. D.; Zhu. X. Biodegradation of crude oil contaminating marine shorelines and
freshwater wetlands. Spill Sci. Technol. Bull. 2003, 8, 163–178.
4. Oil Spill Dispersants: Efficacy and Effects, National Research Council of the National Academies, The National Academies Press: Washington, DC, 2005;
https://www.nap.edu/read/11283/chapter/1#ii
5. Prince, R. C. Oil spill dispersants: Boon or bane ? Environ. Sci. Technol. 2015, 49 , 6376-6384.
6. The future of dispersant use in oil spill response coastal response initiative, Coastal response
research center, Research planning incorporated, National oceanic and atmospheric administration, 2012; http://crrc.unh.edu/sites/crrc.unh.edu/files/media/docs/Workshops/dispersant_future_11/Dispe
rsant_Initiative_FINALREPORT.pdf.
21
7. Oil spill simulation materials review, Report presented to the Prince William Sound regional citizens’ advisory council, Anchorage, Alaska, Science Applications International Corporation (SAIC Canada), 2008; http://www.pwsrcac.org/wp-
content/uploads/filebase/programs/oil_spill_response_operations/oil_spill_simulation_materials_review.pdf
8. Wang, C. A.; Groves, S. H.; Palmateer, S. C. Flow visualization studies for optimization of OMVPE reactor design. Journal of Crystal Growth, 1986, 77 (1–3), 136-143.
9. Adrian, R. J. Particle-imaging techniques for experimental fluid-mechanics. Annual Review of
Fluid Mechanics. 1991, 23, 261-304.
10. Chen, R.C.; Fan, L. S. Particle image velocimetry for characterizing the flow structure in three-dimensional gas-liquid-solid fluidized beds. Chemical Engineering Science, 1992, 47(13–14),
3615-3622.
11. Mei, F.; Chen, Da-Ren. Operational modes of dual-capillary electrospraying and the formation of the
stable compound cone-jet modes, Aerosol and Air Quality Research, 2008, 8, 218-232.
12. Nguyen, D. N.; Clasen, C.; Mooter, G. V. D. Pharmaceutical application of electrospraying,
Journal of Pharmaceutical Sciences, 2016, 105, 2601-2620
13. Ciach, T. Applications of electro-hydro-dynamic-atomization in drug delivery, J. Drug. Del.
Sci. Tech., 2007, 17, 367-375.
14. Yuah, S.; Lei, F.; Liu, Z.; Tong, Q.; Si, T.; Xu, R. X. Coaxial electrospray of curcumin- loaded
microparticles for sustained drug release. PLoS ONE, 2015, 10, doi: 10.1371/journal. pone.0132609