Environmental Sciences Laboratory - Department of …. Department of Energy Vertical Distribution of...
65
Environmental Sciences Laboratory Environmental Sciences Laboratory Prepared for U.S. Department of Energy Grand Junction, Colorado Work Performed Under DOE Contract No. DE–AC01–02GJ79491 for the U.S. Department of Energy Approved for public release; distribution is unlimited. Vertical Distribution of Contamination in Ground Water at the Tuba City, Arizona, Site August 2005 DOE LM/GJ857 2005 ESL – – – – – RPT 2005 04
Transcript of Environmental Sciences Laboratory - Department of …. Department of Energy Vertical Distribution of...
Environmental Sciences LaboratoryEnvironmental Sciences Laboratory
Prepared forU.S. Department of EnergyGrand Junction, Colorado
Work Performed Under DOE Contract No. DE–AC01–02GJ79491 for the U.S. Department of EnergyApproved for public release; distribution is unlimited.
Vertical Distribution ofContamination in Ground Waterat the Tuba City, Arizona, Site
August 2005
DOE LM/GJ857 2005ESL– –
– – –RPT 2005 04

DOE-LM/GJ857−2005 ESL–RPT–2005–04
Vertical Distribution of Contamination in Ground Water at the Tuba City, Arizona, Site
August 2005
Work Performed by S.M. Stoller Corporation under DOE Contract No. DE–AC01–02GJ79491 for the U.S. Department of Energy Office of Legacy Management, Grand Junction, Colorado

U.S. Department of Energy Vertical Distribution of Contamination in Ground Water at the Tuba City, Arizona, Site August 2005 Doc. No. S0169800 Page iii
Contents 1.0 Introduction ............................................................................................................................1 2.0 Background Information ........................................................................................................3
2.1 Aquifer Discretization ..................................................................................................3 2.2 Ground Water Extraction..............................................................................................4 2.3 Ground Water Contamination.......................................................................................4
2.3.1 Contaminant Mass Balance at Extraction Wells................................................7 2.3.2 Extraction Well Rebound Effect ......................................................................10
2.4 Ground Water Capture Zone ......................................................................................10 3.0 Aquifer Isolation Tests .........................................................................................................11
3.1 March 2004 Packer Tests............................................................................................11 3.1.1 Well 1101.........................................................................................................12 3.1.2 Well 1107.........................................................................................................13
3.2 June 2004 Packer Tests...............................................................................................14 3.2.1 Well 1101.........................................................................................................15 3.2.2 Well 1106.........................................................................................................15
3.3 Discussion of Packer Test Results..............................................................................17 4.0 Technology Review..............................................................................................................17
4.1 Aquifer Isolation.........................................................................................................17 4.2 Downhole Logging .....................................................................................................17 4.3 Multilevel Sampling ...................................................................................................19
5.0 Summary and Conclusions...................................................................................................19 6.0 Recommendations ................................................................................................................21 7.0 References ............................................................................................................................21
Tables Table 1. Contaminant Data for Shallow Wells and Nearby Extraction Wells................................ 8 Table 2. Packer Test Information.................................................................................................. 11
Figures Figure 1. Site Location Map ........................................................................................................... 1 Figure 2. Site Features Map ............................................................................................................ 2 Figure 3. Uranium Concentrations in Ground Water, Horizons A and B, February 2005 ............. 5 Figure 4. Uranium Concentrations in Ground Water, Horizons C and D, February 2005 ............. 6 Figure 5. Nitrate Concentrations in Ground Water at Well Group 936/251/1113/1114 ................ 9 Figure 6. Sulfate Concentrations in Ground Water at Well Group 936/251/1113/1114 ................ 9 Figure 7. Uranium Concentrations in Ground Water at Well Group 936/251/1113/11145 ......... 10 Figure 8. Well 1101 Packer Test Results for March 2004............................................................ 13 Figure 9. Well 1107 Packer Test Results for March 2004............................................................ 14 Figure 10. Well 1101 Packer Test Results for June 2004............................................................. 15 Figure 11. Well 1106 Packer Test Results for June 2004............................................................. 16 Figure 12. Hypothetical Stagnant Flow Zone Beneath Packer ..................................................... 18

Vertical Distribution of Contamination in Ground Water at the Tuba City, Arizona, Site U.S. Department of Energy Doc. No. S0169800 August 2005 Page iv
Figure 13. Cross-Section Schematic of Well Bore ....................................................................... 18 Figure 14. Conceptual Test Design............................................................................................... 20
Appendixes Appendix A⎯Additional Figures Appendix B⎯Packer Test Field Data

U.S. Department of Energy Vertical Distribution of Contamination in Ground Water at the Tuba City, Arizona, Site August 2005 Doc. No. S0169800 Page 1
1.0 Introduction
This report evaluates the vertical distribution of contamination in ground water at the Tuba City Disposal Site, near Tuba City, Arizona (Figure 1). An improved understanding of contaminant distribution with depth may lead to more accurately evaluating the progress of ground water remediation at the site and more efficient contaminant recovery. At present, 25 wells shown in Figure 2 operate to extract ground water for on-site treatment by mechanical distillation. The ground water extraction system meets design expectations of contaminant recovery. However, although capture of some uncontaminated water is probably unavoidable, the vertical influence of the extraction wells may be excessive. It is the goal of this report to determine if sufficient evidence of excessive capture at depth merits additional studies. Minimizing such capture, possibly by modifying (shortening) the extraction wells, may reduce long-term costs of remediation.
Figure 1. Site Location Map

Vertical Distribution of Contamination in Ground Water at the Tuba City, Arizona, Site U.S. Department of Energy Doc. No. S0169800 August 2005 Page 2
Figure 2. Site Features Map

U.S. Department of Energy Vertical Distribution of Contamination in Ground Water at the Tuba City, Arizona, Site August 2005 Doc. No. S0169800 Page 3
2.0 Background Information
The Tuba City site lies on the middle of three alluvial terraces associated with ancestral flow in Moenkopi Wash, located about 1.25 miles southeast of the site. The regionally extensive Navajo Sandstone, a massively cross-bedded, fine to very fine friable sandstone and siltstone, underlies coarse, semi-indurated, remnant alluvium at most terrace locations. Loose dune sand and silt is prevalent to depths of up to 20 feet (ft), although bedrock slopes and cliffs dominate the terrace escarpments. Regional bedrock dip is about one degree to the northeast. Within about 200 ft below ground, the eolian dune deposits of the “classic” Navajo Sandstone become interbedded with fine-grained alluvium more typical of the underlying Kayenta Formation. This “inter-tonguing interval” is 400 to 450 ft thick. Locally, the Kayenta Formation consists of 100 ft or more of slope-forming, flat-lying red silt and fine sand. From the ambient water table, at about 50 ft below ground at the site, the saturated zone extends through the inter-tonguing interval to the upper contact of the non-water bearing Kayenta Formation. Moenkopi Wash occupies the axis of a broad bedrock valley. Ground water flow beneath the site is southeast to the wash. Aquifer thickness is reduced by about 40 percent (250 ft) over this distance. At the wash, regional discharge occurs from a laterally extensive (miles) spring zone that outcrops near the exposed base of the inter-tonguing interval. Some local discharge of ground water from higher in the formation likely occurs to sustain scattered populations of desert phreatophytes, such as in the “greasewood area” designated in Figure 2, where ground water is only about 20 ft below land surface. Figure A-1 in Appendix A depicts a conceptual model of the site hydrogeology. 2.1 Aquifer Discretization Site hydrostratigraphy is discretized into 50-ft intervals, or “horizons,” each with a letter designation. The top of the middle terrace, nominally 5,050 feet in elevation, marks the top of the uppermost horizon (Horizon A). Horizons A, B, C, and possibly D span the interval of "classic" Navajo Sandstone beneath the site, whereas the depths of Horizons E through J include the regions of the inter-tonguing interval. Horizons K, L, and M include the lower inter-tonguing interval and possibly the upper Kayenta Formation. These stratigraphic relationships to aquifer horizon are shown in Figure A−1. The uppermost horizon on the lower terrace progresses from Horizon C to D north to south with the downslope of surface topography. The steep terrain at Moenkopi Wash intersects Horizons E through G. Ground water remediation at the site focuses primarily on the upper 250 ft of the bedrock aquifer (Horizons A through E). Color-coding in Figure 2 identifies the horizon in which the mid-point of each well screen is located for extraction wells (round symbols) and monitoring wells (square symbols). Figure A−2 of Appendix A is a cross-section schematic of the placement depth of well screens in relation to aquifer horizon for all project wells.
Vertical Distribution of Contamination in Ground Water at the Tuba City, Arizona, Site U.S. Department of Energy Doc. No. S0169800 August 2005 Page 4
2.2 Ground Water Extraction In Figure 2, the extraction wells of interest are those labeled 1101 to 1125. They are constructed of 6-inch diameter Schedule 40 PVC casing and 6-inch, vee-wrap stainless steel screen (0.017-inch slot). A filter pack of 20-40 graded silica sand completes the 2-in annulus to 30 or 40 ft above the screen slots. Screen lengths are 150-ft and extend from the bottom half of Horizon B to the mid-depth of Horizon E, except at wells 1116, 1117, and 1118, where 100-ft screens extend nearly to the base of Horizon D. Extraction wells 1126−1133, (Figure 2) installed in 2004, are of similar specification but consist of 4-inch diameter casing and screen and are much shallower, with 30 to 40-ft screens located in Horizon B. These wells will become operational in Summer 2005. Current production of the 25 extraction wells is 80 to 100 gpm sustained over periods of months. Individual production ranges from 0.5 to 6 gpm. The 25-well average is 4 gpm. Concentrations of nitrate (as NO3), sulfate, and uranium, the primary site contaminants, remain relatively steady in the bulk extract at about 400, 900, and 0.25 milligrams per liter (mg/L), respectively, during steady pumping. Remediation goals are 44 mg/L nitrate as NO3, 250 mg/L sulfate, and 0.044 mg/L uranium. 2.3 Ground Water Contamination Figure 3 and Figure 4 show the extent of uranium contamination in ground water in aquifer Horizons A and B, and Horizons C and D (extraction wells included), respectively, in February 2005. The distribution of nitrate and sulfate contamination has similar trends to that of uranium. Until the installation of wells 272 - 276 in 2004, there was no discrete-depth monitoring capability of Horizons C and D within the main region of the contaminant plume as defined by the more extensive network of shallower monitoring wells. Uranium concentrations shown in Figure 4 for the extraction wells are from samples collected while the wells are pumping and so are composites of the entire intake interval and do not necessarily indicate that contamination in the aquifer extends to the full depth of the well. Samples collected from the extraction wells before full-scale extraction and treatment started in mid-2002 are also unsuitable for assessing the depth of contamination because of similar sampling conditions. Discrete-depth sampling beneath contaminated regions of Horizons A and B indicates that the contamination extends into Horizon D at wells 273 and 275 but does not at wells 272, 274, and 276. Contamination at well 273 is limited to relatively low levels of nitrate (185 mg/L) and uranium (0.06 mg/L), whereas elevated concentrations of nitrate (1,056 mg/L), sulfate (2,100 mg/L), and uranium (0.44 mg/L) are present at well 275. At the paired monitor wells along the escarpment separating the middle and lower terraces (well pairs 263/264, 265/266, and 909/932), contamination is limited to the shallow well (A or B Horizon) and does not extend into Horizon C or D at each location. At the remaining location of a monitor well pair completed in the interval of the extraction wells, contaminant concentrations also decrease sharply with depth, in this case between Horizon B (wells 908 and 935) and Horizon C (well 912, not sampled in February 2005).
U.S. Department of Energy Vertical Distribution of Contamination in Ground Water at the Tuba City, Arizona, Site August 2005 Doc. No. S0169800 Page 5
Figure 3. Uranium Concentrations in Ground Water, Horizons A and B, February 2005
Vertical Distribution of Contamination in Ground Water at the Tuba City, Arizona, Site U.S. Department of Energy Doc. No. S0169800 August 2005 Page 6
Figure 4. Uranium Concentrations in Ground Water, Horizons C and D, February 2005

U.S. Department of Energy Vertical Distribution of Contamination in Ground Water at the Tuba City, Arizona, Site August 2005 Doc. No. S0169800 Page 7
Ground water is not contaminated at the sole Horizon E well (well 251) that is screened beneath significant shallow contamination. The brief period of contamination at that well that occurred several months after its installation (April 2000) presumably resulted from a failed annular seal and downward leakage of shallower contaminated ground water (DOE 2005). In response to ground water extraction, the vertical flow gradient has reversed from downward to upward and contamination is no longer present at well 251. 2.3.1 Contaminant Mass Balance at Extraction Wells
The tendency for contaminants to be concentrated in the shallowest horizons at the site, specifically Horizons A and B, can also be examined using approximate assessments of contaminant mass balance in extraction wells. As discussed in Section 2.2 and shown in Figure A−2, the screened intervals of most extraction wells begin in the bottom half of Horizon B and terminate either near the mid-point or the bottom of Horizon E. Thus, if it can be shown that contaminant concentrations in the water pumped from extraction wells in a specific area are considerably lower than comparable contaminant levels in nearby wells screened solely in Horizon B, the likelihood is strong that contaminant concentrations are less in the deeper horizons. A simple approach to this type of assessment assumes that the rate of inflow to the extraction well is uniform over its entire screened thickness, and that water mixing in the well can be represented by
( )
ext
deepdeepBBext Q
CHCHqC
+= (1)
where Cext = contaminant concentration in the extracted water (mass/volume), q = rate of inflow to the extraction well per unit depth (length2/time), HB = screened vertical interval in Horizon B (length), Hdeep = screened vertical interval below Horizon B (length), CB = measured contaminant concentration in Horizon B (mass/volume), Cdeep = average contaminant concentration over Hdeep (mass/volume), and Qext = qHB + qHdeep = extraction well pumping rate (volume/time). Table 1, which presents representative concentrations for observation wells screened in distinct horizons and in nearby extraction wells, provides some data to which this simple mass balance logic can be applied. The data in this table for the 936/1113/1114 well combination were drawn from time series plots of contaminant concentrations at these wells (Figure 5, Figure 6, and Figure 7). Applying Equation (1) to the listed representative concentrations for nitrate, sulfate, and uranium in these wells suggests that the average contaminant concentrations in the deeper horizons (Cdeep) of extraction wells 1113 and 1114 are, at the most, a small fraction of the concentrations occurring in Horizon B. The same finding also holds true for the 934/1116/1117/1118 and 942/11104 well combinations. At the locations of two other well combinations (935/1114/1115 and 940/1110/1111), this same conclusion is derived if it can be assumed that concentrations measured in wells screened in Horizon A are representative of local Horizon B concentrations.
Vertical Distribution of Contamination in Ground Water at the Tuba City, Arizona, Site U.S. Department of Energy Doc. No. S0169800 August 2005 Page 8
Table 1. Contaminant Data for Shallow Wells and Nearby Extraction Wells
Representative Concentration (mg/L) Well (Horizon) Nitrate (as NO3) Sulfate Uranium
934 (B) 1116 1117 1118
2,400 <50 200 600
2,200 100 600
1,400
0.32 0.007 0.03 0.059
935 (A) 912 (C) 1114 1115
650 375 180 250
2,700 600 280 350
0.11 0.03 0.03 0.05
936 (B) 1113 1114
2,300 50-100
180
3,000 <50 250
0.5 <0.005
0.03 940 (A) 272 (D) 1110 1111
1,700 15
250 400
9,000 12
350 850
0.43 0.002 0.06 0.14
941 (A) 273 (D) 1105 1106 1107 1108
600 207
200-300 140 200 700
800 245
1000 400 250
1,750
0.08 0.07
0.5-1.5 0.6
0.04 0.25
942 (B) 274 (C) 1104
1,200 19
800
2,800 39
1,250
0.25 0.003 0.12
The one remaining well combination in Table 1 (941/11105/1106/1107/1108) provides evidence that the trend of decreasing contaminant concentrations with depth is not universal within the extraction well field. For example, the representative concentrations of nitrate, sulfate, and uranium in water extracted from well 1108 exceed each of their comparable concentrations in Horizon A (measured in well 941). Also, the concentration of sulfate in water extracted from well 1105 is greater than the comparable Horizon A concentration, and the uranium concentrations in extraction wells 1105, 1106, and 1108 are greater than the nearby Horizon A concentration. These examples suggest that the vertical migration of contaminants can vary spatially at the Tuba City site, and that features such as preferential flow paths distributed randomly throughout the site’s three-dimensional flow field might help to carry contaminants deeper in some areas than is observed in many others.

U.S. Department of Energy Vertical Distribution of Contamination in Ground Water at the Tuba City, Arizona, Site August 2005 Doc. No. S0169800 Page 9
0
500
1000
1500
2000
2500
3000
3500
4000
4500
Feb-0
0
Aug-0
0
Feb-0
1
Aug-0
1
Feb-0
2
Aug-0
2
Feb-0
3
Aug-0
3
Feb-0
4
Aug-0
4
Feb-0
5
Date
Nit
rate
as
NO
3 (m
g/L
)
Loc 0936 B
Loc 1113
Loc 1114
Loc 0251 E
Figure 5. Nitrate Concentrations in Ground Water at Well Group 936/251/1113/1114
0
1000
2000
3000
4000
5000
6000
Feb-0
0
Aug-0
0
Feb-0
1
Aug-0
1
Feb-0
2
Aug-0
2
Feb-0
3
Aug-0
3
Feb-0
4
Aug-0
4
Feb-0
5
Date
Su
lfat
e (m
g/L
)
Loc 0936 B
Loc 1113
Loc 1114
Loc 0251 E
Figure 6. Sulfate Concentrations in Ground Water at Well Group 936/251/1113/1114

Vertical Distribution of Contamination in Ground Water at the Tuba City, Arizona, Site U.S. Department of Energy Doc. No. S0169800 August 2005 Page 10
0
0.1
0.2
0.3
0.4
0.5
0.6
0.7
Feb-0
0
Aug-0
0
Feb-0
1
Aug-0
1
Feb-0
2
Aug-0
2
Feb-0
3
Aug-0
3
Feb-0
4
Aug-0
4
Feb-0
5
Date
Ura
niu
m (
mg
/L)
Loc 0936 B
Loc 1113
Loc 1114
Loc 0251 E
Figure 7. Uranium Concentrations in Ground Water at Well Group 936/251/1113/11145 2.3.2 Extraction Well Rebound Effect
During periods of non-pumping (hours to days) contaminant concentrations at many extraction wells are observed to increase significantly above those during “steady state” pumping, often approaching concentrations in nearby shallow monitor wells (DOE 2004). Once pumping resumes, this rebound effect is short-lived, generally less than one day. Concentration rebounding at the site may be due in part to water table recovery during the rest period within shallow, more-highly contaminated parts of the aquifer. During subsequent pumping, concentrations in an extraction well would then decrease as the shallow zone is again presumably dewatered and ground water capture expands into less contaminated deeper regions of the aquifer. 2.4 Ground Water Capture Zone The existing ground water extraction system (i.e., before installation of the newest extraction wells in 2004) captures the bulk of the contaminant plume in lateral extent and probably the full vertical extent, as determined by analysis of water level drawdowns, flow direction analysis, and contaminant distribution (DOE 2005). The contaminated region of the aquifer not currently captured is south of the existing extraction system and extends to the escarpment separating the middle and lower terraces. New extraction wells 1125 through 1133 target Horizons A and B in this area. Existing evidence suggests that the existing capture zone likely extends beyond the limits of contamination to the east and west of the well field comprised of wells 1101 through 1125. Similarly, it appears that the vertical extent of the vast bulk of contamination does not extend below Horizon D. Significant water level drawdowns produced by the extraction system to several hundred feet or more beneath the base of the extraction wells in Horizon E likely indicate capture well below the depth of contamination.

U.S. Department of Energy Vertical Distribution of Contamination in Ground Water at the Tuba City, Arizona, Site August 2005 Doc. No. S0169800 Page 11
3.0 Aquifer Isolation Tests
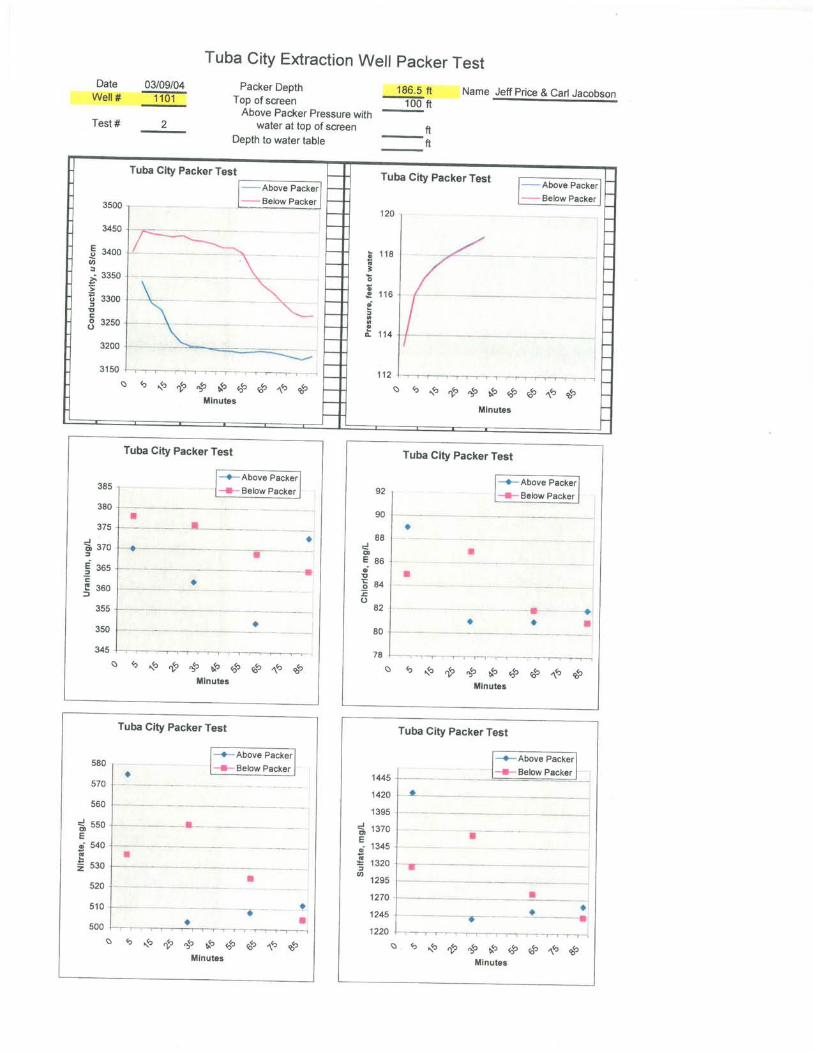
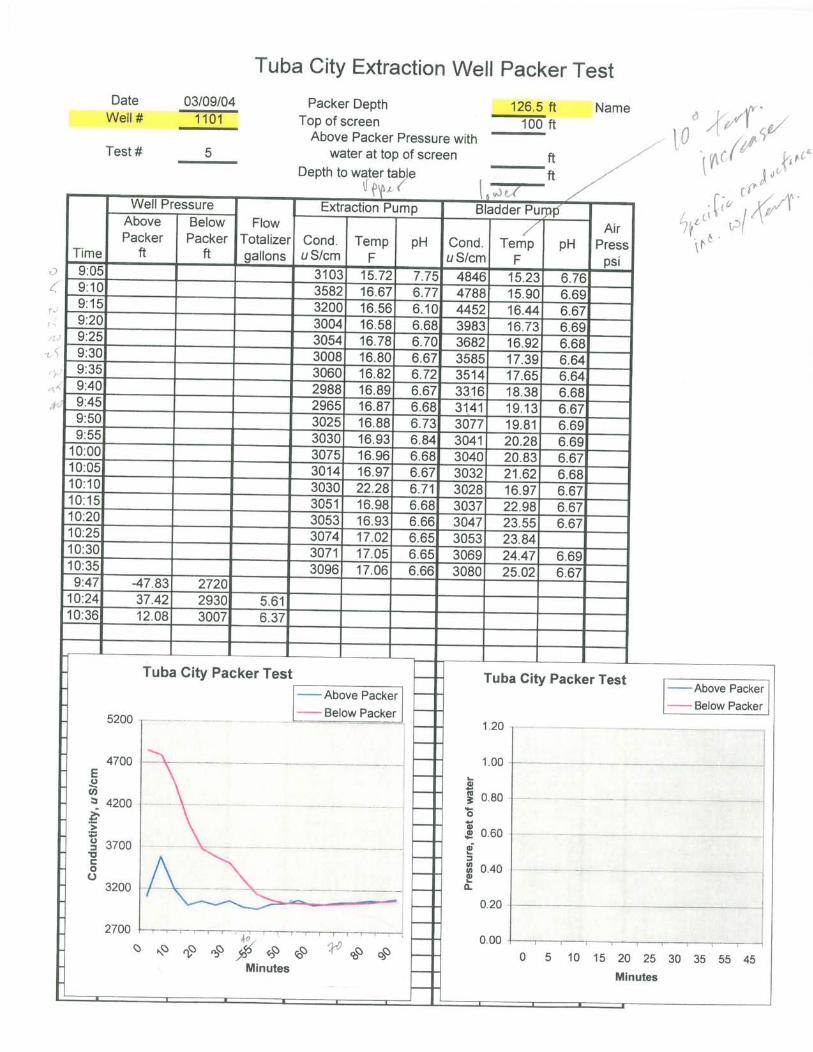
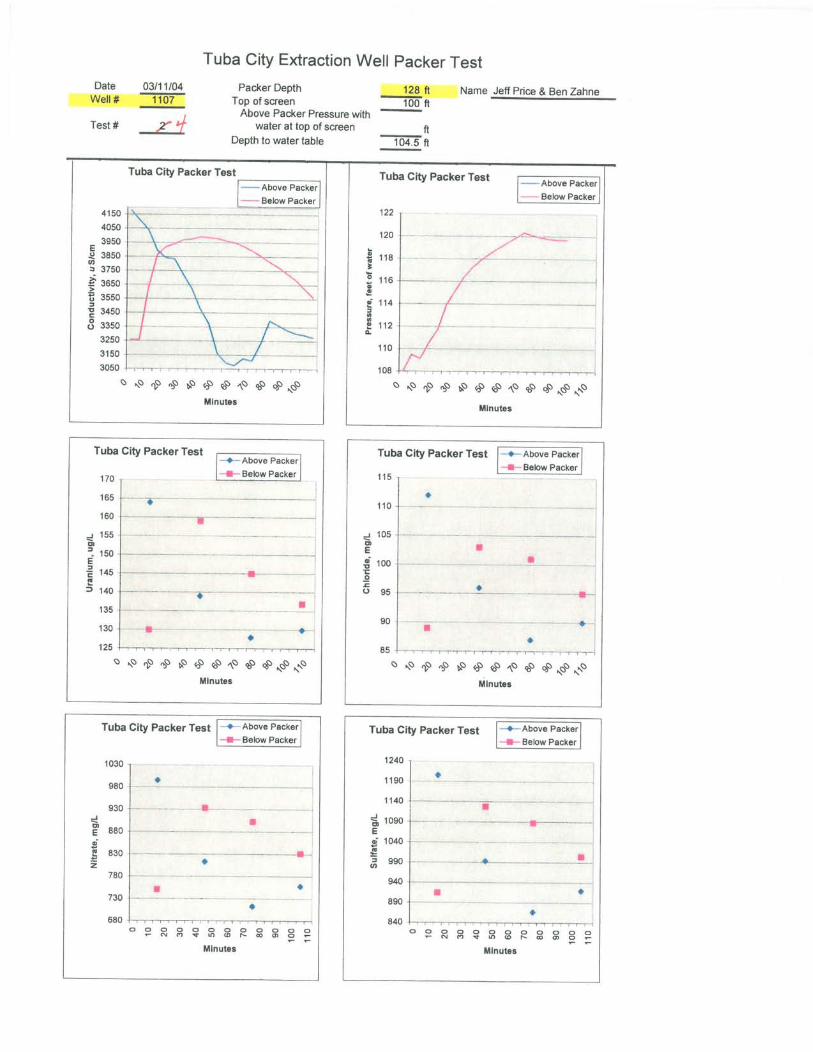
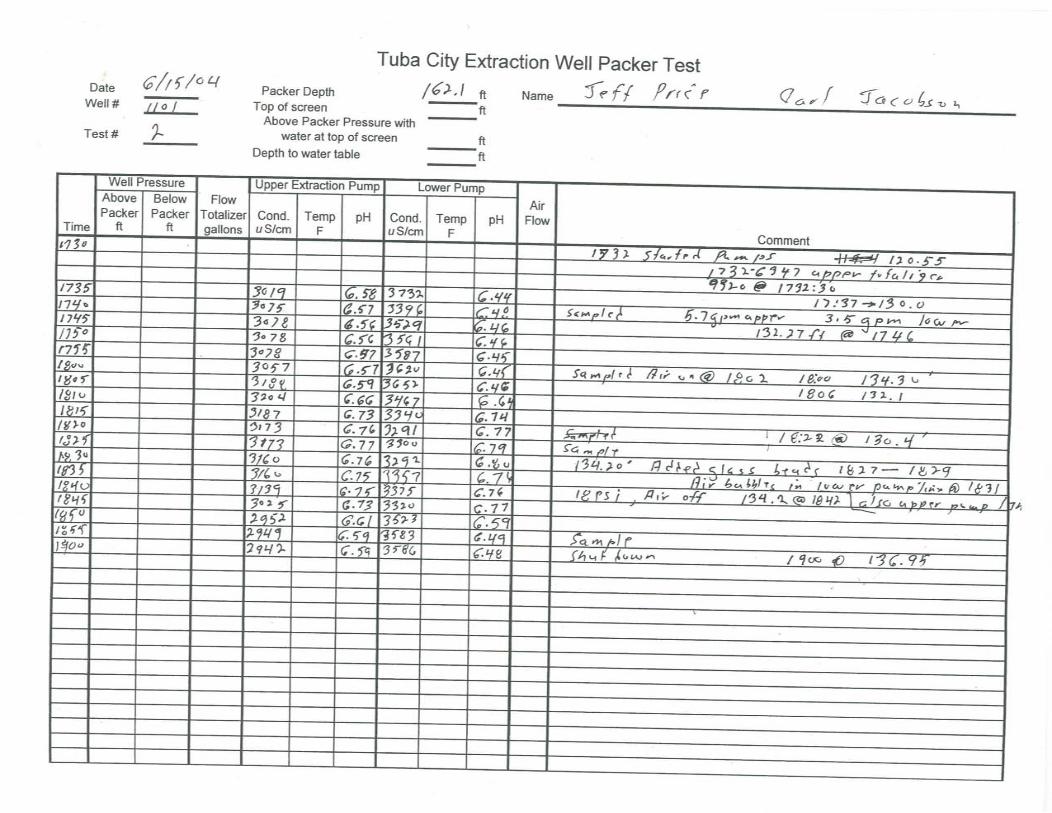
Packer isolation tests were conducted at wells 1101 and 1107 during March 9 to 11, 2004, and again from June 15 to 17, 2004 at wells 1101 and 1106, in an attempt to profile vertical contaminant distribution in the aquifer. Table 2 lists relevant information of the conditions of each test; field data for the tests are contained in Appendix B.
Table 2. Packer Test Information
Well Date Test Packer Depth
(ft)
Duration (min)
Pumping rate (gpm)
Bore Volumes Removed
Maximum Drawdown
(ft)a
Water Level
Horizon 1 216 63 0.55 0.1 7.5
2 186 90 5.8 1.7 9
3 90 5.4 1.6 9.5 3/9/04
4 156
60 4.6 0.9 9
1101
3/10/04 5 126 90 5.7 1.7 9
1 218 30 1.8 0.2 29
2 188 100 1.9 0.7 27
3 158 90 1.5 0.5 24 1107 3/11/04
4 128 105 1.2 0.4 18
1 194 130 upper: 3.8 & 5.5 lower: 4 4.2 20
1101 6/15/04 2 162 90 upper: 5.7
lower: 3.5 3 21
1 191 90 upper: 2.5 & 1.8 lower: 2.5, 2.2, 1.7
1.3 40
2 191 80 upper: 1.3, 0.8 lower: 1.2, 0.7 0.6 17
3 161 60 upper: 0.7 lower: 0.7 0.3 1-2
1106 6/17/04
4 131 90 upper: 0.7 lower: 0.7 0.5 1-2
aDrawdown produced by packer test, excludes prior residual drawdown. 3.1 March 2004 Packer Tests The 10-ft tool assembly for the March 2004 tests consisted of a single 3-ft inflatable packer, the dedicated well pump for ground water extraction above the packer, a bladder pump with intake below the packer, and pressure transducers above and below the packer. After inserting this tool string to near the base of the well and inflating the packer, ground water extraction began while the bladder pump operated at a much lower rate for sample collection. The discharge of both pumps was monitored continuously for pH, electrical conductivity, and temperature, and samples were collected periodically for on-site analysis of chloride, nitrate, sulfate, and uranium. Following a brief period of field parameter stability and sample collection, pumping was discontinued, the packer deflated, and the assembly raised 30 ft. This process was repeated several times per well to the top of the screen. Test rationale assumed that by maintaining upward flow from below the packer, a pronounced increase in contaminant concentrations at the lower pump would identify the base of contamination in the adjacent formation.

Vertical Distribution of Contamination in Ground Water at the Tuba City, Arizona, Site U.S. Department of Energy Doc. No. S0169800 August 2005 Page 12
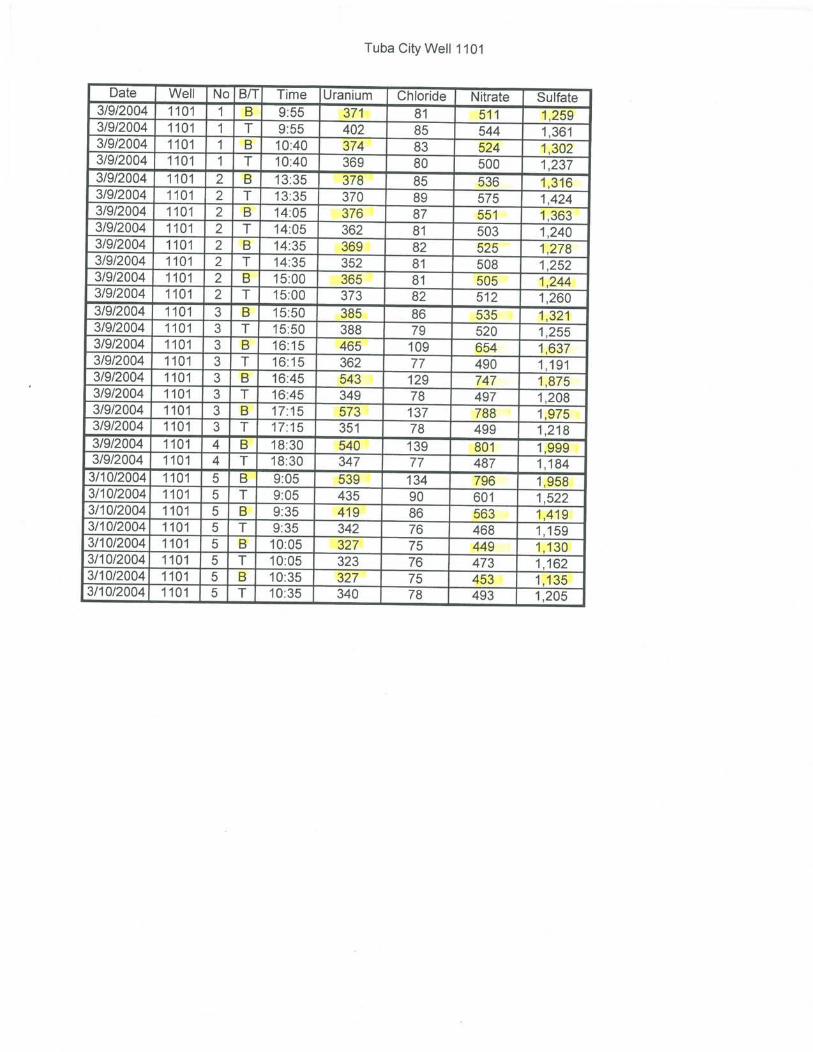
3.1.1 Well 1101
Five tests at four depth intervals were conducted at well 1101 (Table 2). Test 1 was completed in 1 hour at a flow rate of about 0.5 gpm. About one-tenth of the calculated bore volume (300 gallons, casing plus filter pack) was extracted during Test 1. The duration of each remaining test except Test 4 (1 hour) was 1.5 hours at flows ranging from 4.5 to 5.5 gpm, resulting in the extraction of about 1 to 1.7 bore volumes per test. Test 4 was a continuation of Test 3 but with air injected below the packer in attempt to bridge the filter pack. The tests at well 1101 produced about 10 ft of drawdown. This drawdown, when combined with the 40 ft of residual drawdown before the tests started, placed the water level in well 1101 at about the top of Horizon C. Figure 8 shows the measured concentrations of nitrate, sulfate, and uranium above and below the packer throughout the tests. Test order is from deepest (Test 1, top of packer at 215 ft) to shallowest (Test 5, packer at 125 ft), left to right in the figure. In Test 1, respective analyte (nitrate, sulfate, uranium) concentrations are initially greater above the packer then below despite the perturbations of first pulling the extraction pump from the well and then inserting the tool string to depth. By the end of Test 1 higher concentrations were measured below the packer. Given the short separation distance of pump intakes (10 ft), this initial test may indicate a heterogeneous water composition within the well at the start of the test. Due to limited purging, Test 1 samples likely represent pre-test compositions within the borehole rather than water quality in the adjacent formation. Higher initial concentrations above the packer may again indicate a non-uniform water composition in the well at the start of Test 2. At its conclusion, concentrations above and below the packer are nearly identical and similar to those at the end of Test 1. Initial concentrations above and below the packer for Test 3 are only slightly greater than those at the end of Test 2. During Tests 3 and 4, gradually decreasing concentrations above the packer accompany increasing concentrations below. By the design criteria of these tests, this signifies the base of contamination at about 155 ft (base of Horizon C) at well 1101. This result cannot be confirmed or disputed by the conflicting evidence at nearest monitoring wells: contaminant levels at well 275 (upper Horizon D) far exceed remediation goals, but are consistent with background levels at well 276 (lower Horizon C). Air injection (Test 4) had no noticeable effect. Test 5 did not maintain the high contaminant concentrations detected in Test 4. Instead, concentrations above and below the packer stabilized at similar values. This occurred because the test interval was at the top of the water column and so essentially all flow in the well bore and casing was upward, resulting in the same composite water at both the upper and lower pumps by the end of the test. This final composition is common to that occurring at the end of Tests 1 and 2 in the upper and lower pumps, and to those measured at the upper pump during each test. This is because during each test, the interval above the packer was open to the entire the well bore with minimal flow restriction or isolation by the packer. Test 5 best exemplifies this condition: the 0.6-foot interval above the packer was not drawn down or dewatered during sustained pumping of about 5.5 gpm, equaling the full production capacity of the well.
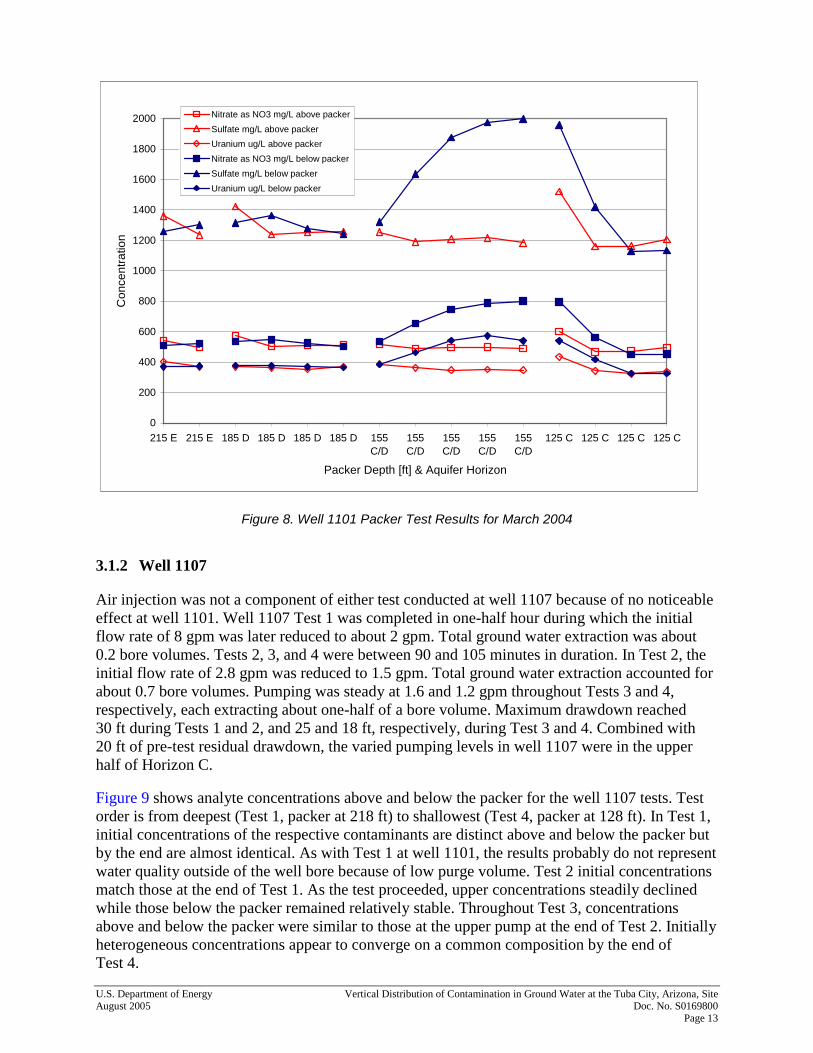
U.S. Department of Energy Vertical Distribution of Contamination in Ground Water at the Tuba City, Arizona, Site August 2005 Doc. No. S0169800 Page 13
0
200
400
600
800
1000
1200
1400
1600
1800
2000
215 E 215 E 185 D 185 D 185 D 185 D 155C/D
155C/D
155C/D
155C/D
155C/D
125 C 125 C 125 C 125 C
Packer Depth [ft] & Aquifer Horizon
Con
cent
ratio
nNitrate as NO3 mg/L above packer
Sulfate mg/L above packer
Uranium ug/L above packer
Nitrate as NO3 mg/L below packer
Sulfate mg/L below packer
Uranium ug/L below packer
Figure 8. Well 1101 Packer Test Results for March 2004 3.1.2 Well 1107
Air injection was not a component of either test conducted at well 1107 because of no noticeable effect at well 1101. Well 1107 Test 1 was completed in one-half hour during which the initial flow rate of 8 gpm was later reduced to about 2 gpm. Total ground water extraction was about 0.2 bore volumes. Tests 2, 3, and 4 were between 90 and 105 minutes in duration. In Test 2, the initial flow rate of 2.8 gpm was reduced to 1.5 gpm. Total ground water extraction accounted for about 0.7 bore volumes. Pumping was steady at 1.6 and 1.2 gpm throughout Tests 3 and 4, respectively, each extracting about one-half of a bore volume. Maximum drawdown reached 30 ft during Tests 1 and 2, and 25 and 18 ft, respectively, during Test 3 and 4. Combined with 20 ft of pre-test residual drawdown, the varied pumping levels in well 1107 were in the upper half of Horizon C. Figure 9 shows analyte concentrations above and below the packer for the well 1107 tests. Test order is from deepest (Test 1, packer at 218 ft) to shallowest (Test 4, packer at 128 ft). In Test 1, initial concentrations of the respective contaminants are distinct above and below the packer but by the end are almost identical. As with Test 1 at well 1101, the results probably do not represent water quality outside of the well bore because of low purge volume. Test 2 initial concentrations match those at the end of Test 1. As the test proceeded, upper concentrations steadily declined while those below the packer remained relatively stable. Throughout Test 3, concentrations above and below the packer were similar to those at the upper pump at the end of Test 2. Initially heterogeneous concentrations appear to converge on a common composition by the end of Test 4.

Vertical Distribution of Contamination in Ground Water at the Tuba City, Arizona, Site U.S. Department of Energy Doc. No. S0169800 August 2005 Page 14
0
200
400
600
800
1000
1200
1400
1600
1800
2000
218 E 218 E 188 D 188 D 188 D 188 D 158C/D
158C/D
158C/D
158C/D
128 C 128 C 128 C 128 C
Packer Depth [ft] & Aquifer Horizon
Con
cent
ratio
n
Uranium ug/L below packer
Nitrate as NO3 mg/L below packer
Sulfate mg/L below packer
Uranium ug/L above packer
Nitrate as NO3 mg/L above packer
Sulfate mg/L above packer
Figure 9. Well 1107 Packer Test Results for March 2004 Under the given test conditions (excluding Test 1), the middle test interval (Test 3, lower portion of Horizon C) apparently is less contaminated than those above and below, with no recognizable “base” of contamination. Discrete depth samples at adjacent monitor well 273, which is screened in Horizon D between 153 and 173 ft, identify only limited contamination at this location (185 mg/L nitrate as N, <250 mg/L sulfate, and 0.06 mg/L uranium). These concentrations are much lower than any observed in the well 1107 tests and attest to significant contamination in an overlying horizon. Such a contrast or transition of concentration in vertical profile is not recognized in the packer test results. 3.2 June 2004 Packer Tests Packer tests were conducted again at well 1101 and at well 1106 on June 15 and 17, 2004, respectively, using a similar apparatus at that used in March 2004. However, condition of the June tests was to extract water from above and below the packer at approximately equal rates with submersible pumps to prevent possible flow stagnation in the sampling interval below the packer as may have resulted in the previous tests. Injection of buoyant glass spheres (11 to 17 micron diameter) below the packer during several tests attempted to seal the filter pack in the test interval.

U.S. Department of Energy Vertical Distribution of Contamination in Ground Water at the Tuba City, Arizona, Site August 2005 Doc. No. S0169800 Page 15
3.2.1 Well 1101
Test 1 was conducted for 2 hours at a packer depth of 194 ft. The pumping rate above the packer varied between 3.8 and 5.5 gpm, while the lower pump maintained a rate of 4 gpm. Several bore volumes in total were extracted by the conclusion of the test, at which time concentrations above and below the packer were identical and unchanged from the initial condition (Figure 10).
0
200
400
600
800
1000
1200
1400
1600
1800
2000
194 D 194 D 194 D 194 D 162 C/D 162 C/D 162 C/D 162 C/D
Packer Depth [ft] & Aquifer Horizon
Con
cent
ratio
n
Nitrate as NO3 mg/L above packer
Sulfate mg/L above packer
Uranium ug/L above packer
Nitrate as NO3 mg/L below packer
Sulfate mg/L below packer
Uranium ug/L below packer
Figure 10. Well 1101 Packer Test Results for June 2004 With the packer raised 28 ft, Test 2 was conducted for 1.5 hours at pumping rates of 5.7 and 3.5 gpm, respectively, for the upper and lower pumps. Fifteen to 20 ft of drawdown resulted and about three bore volumes were extracted. Stable, distinct concentrations were maintained above and below the packer throughout this test. Based on this distinction, the interval above the packer at 162 ft apparently is less contaminated than below, a result vaguely consistent with Test 3, conducted at approximately the same depth, at well 1101 in March 2004. An additional result of the tests conducted at well 1101 in June 2004 was the occurrence of air and glass spheres in the discharge from the upper pump after their injection below the packer. 3.2.2 Well 1106
Four tests at 3 depth intervals were conducted at well 1106 in June 2004. The top of the packer was at 191 ft for Tests 1 and 2, 162 ft for Test 3, and 131 ft for Test 4. The duration of Test 1 was 1.5 hrs. Pumping from above and below the packer was reduced from 2.5 gpm initially to

Vertical Distribution of Contamination in Ground Water at the Tuba City, Arizona, Site U.S. Department of Energy Doc. No. S0169800 August 2005 Page 16
1.7 gpm later in the test, totaling 1.3 bore volumes of water extracted, and producing 60 ft drawdown, equivalent to a pumping level in the upper part of Horizon D. In Test 2, the upper and lower pump discharge was initially 1.2 gpm each, and later reduced to 0.7 gpm, reducing the drawdown in the extraction well by about 45 ft compared to Test 1. The volume of water extracted equaled about 0.6 bore volumes. Figure 11 illustrates slightly increasing concentrations during Tests 1 and 2 conducted at 191 ft.
0
200
400
600
800
1000
1200
1400
1600
1800
2000
191 D 191 D 191 D 191 D 191 D 131 C 131 C 131 C 131 C
Packer depth [ft] & Aquifer Horizon
Con
cent
ratio
n
Nitrate as NO3 mg/L above packer
Sulfate mg/L above packer
Uranium ug/L above packer
Nitrate as NO3 mg/L below packer
Sulfate mg/L below packer
Uranium ug/L below packer
Figure 11. Well 1106 Packer Test Results for June 2004 In Tests 3 and 4, pumping rates were steady at 0.7 gpm above and below the packer, resulting in drawdown of only 1 to 2 ft. Each test extracted about one-half of a bore volume. Samples were not collected during Test 3. By the end of Test 4, concentrations had declined slightly to be only marginally greater than Test 1 starting values (Figure 11). Very similar and stable concentrations above and below the packer throughout each test conducted at well 1106 may indicate similar and homogeneous water composition in the intervals tested or thorough mixing in the region of the pump intakes of dissimilar waters. Air and glass spheres were also observed in the discharge from the upper pump after their injection below the packer during the tests conducted at this well.

U.S. Department of Energy Vertical Distribution of Contamination in Ground Water at the Tuba City, Arizona, Site August 2005 Doc. No. S0169800 Page 17
3.3 Discussion of Packer Test Results Results of the March and June 2004 packer tests are ambiguous in resolving the vertical distribution of contamination within the screened intervals of the test wells. Interpretation of test results is problematic for four reasons: (1) incomplete purging of the test interval (below the packer), particularly for several of the tests conducted at the deepest interval; (2) excessive drawdown, resulting in shallow ground water entering a well at an artificially low position relative to ambient or low-stress conditions; (3) non-steady pumping during and between tests at a given well that could result in transient contaminant input from different inflow zones; and (4) the water produced during a given test may simply originate from above the packer, whereas the sample below the packer is drawn from a zone of stagnant water (Figure 12) of unknown origin. This last reason questions the assumption of upward flow past the packer. Preferred flow past the packer could be a cause of stagnation in the lower zone. The air and glass spheres observed in the upper pump discharge attest to such a flow conduit, likely occurring as an annulus between packer and inner vertical rods of the well screen (Figure 13).
4.0 Technology Review
Several broad approaches are available to characterize contaminant profiles utilizing existing long-screened wells. These are (1) aquifer isolation methods, (2) geophysical and hydrophysical logging, and (3) discrete depth, multilevel sampling (Taylor 1990). These technologies are briefly reviewed for their potential application to the Tuba City site for future work in characterizing the vertical distribution of contamination. 4.1 Aquifer Isolation Inflatable packers are routinely used to isolate specific depth intervals for various testing purposes. Without innovation, packers are best suited for open-hole conditions in stable formations and have limited value in isolating sections of screened wells because the gravel pack remains unaffected (Sukop 2000). Packers may be used singly or paired to straddle a specific interval. Use of a temporary sealant, such as guar gel, to isolate portions of an aquifer has potential application to the Tuba City site. The sealant could be injected into the filter pack from the interval of a straddle packer. Presumably, the guar would also seal the annulus between packer and vee-wrap screen but the final disposition of the sealant would not be certain. Later injection of a specific enzyme decomposes the guar seal. 4.2 Downhole Logging Radiometric logging to characterize uranium distribution was previously evaluated for the site and determined to be infeasible because dissolved uranium concentrations in the ground water are too low.

Vertical Distribution of Contamination in Ground Water at the Tuba City, Arizona, Site U.S. Department of Energy Doc. No. S0169800 August 2005 Page 18
Figure 12. Hypothetical Stagnant Flow Zone Beneath Packer
Figure 13. Cross-Section Schematic of Well Bore

U.S. Department of Energy Vertical Distribution of Contamination in Ground Water at the Tuba City, Arizona, Site August 2005 Doc. No. S0169800 Page 19
Hydrophysical logging is a feasible technology that involves replacing the initial water in the well bore with distilled water and then recording electrical conductivity profiles over time as formation water enters the well and displaces the control water. Tests are conducted either under ambient or low stress conditions to identify inflow zones. Contamination is identified by the conductivity signature or by accompanying multilevel sampling. Hydrophysical logging was successfully employed previously at the site but for a different purpose. The logging of vertical flow within the well under ambient or low flow conditions using heat pulse or electromagnetic induction is feasible. Impeller flow logging is feasible only at high flow rates. If conducted under pumping conditions, ground water extraction is steady and stationary from either top or bottom of the water column. The resulting flow log, in combination with accompanying discrete depth sampling, determines the position and quantity of inflow zones. By mass balance analysis, the composition of water from each inflow zone can be estimated. 4.3 Multilevel Sampling Low flow purging and sampling at different depths under ambient flow conditions is not feasible because there is no assurance that the sample originates from formation adjacent to the sample collection intake. Additionally, strong vertical hydraulic gradients exist at the site over distances equivalent to the lengths of the extraction well screens; thus solute transport and mixing within the well bore is possible, which obscures the contaminant profile (Church 1996). This condition also limits passive, diffusion-type sampling methods. Multilevel sampling under mildly stressed, low-flow conditions is feasible if steady pumping is from the top of the water column and well bore purging is sufficient to remove the initial volume of water present in the well bore.
5.0 Summary and Conclusions
• Conditions under which the March and June 2004 packer tests were conducted lead to an ambiguous interpretation of the results.
• Evidence independent of the packer tests suggests that ground water contamination does not extend below the depth of the extraction wells.
• Contamination of Horizon D is much less extensive than in Horizons A and B.
• The extraction system captures the base of contamination.
• Vertical capture of uncontaminated ground water may be excessive at many extraction wells depending on the proportion of inflow from the various horizons, which is unknown.

Vertical Distribution of Contamination in Ground Water at the Tuba City, Arizona, Site U.S. Department of Energy Doc. No. S0169800 August 2005 Page 20
Figure 14. Conceptual Test Design

U.S. Department of Energy Vertical Distribution of Contamination in Ground Water at the Tuba City, Arizona, Site August 2005 Doc. No. S0169800 Page 21
6.0 Recommendations
• Modifying the extraction wells based on the findings of this report is not recommended.
• Additional field tests to determine vertical flow and contamination profiles may justify extraction well modification on a well-by-well basis. Initial testing would occur at wells on the periphery of the extraction field that exhibit low concentrations of contaminants.
• Additional tests based on multilevel sampling and flow logging under low-flow pumping conditions are recommended. After full water level recovery in the extraction well, small-diameter bladder pumps placed at various depths (e.g., lower, middle, and upper portions of Horizon D) would monitor water quality as pumping occurred from the top or bottom of the water column. Raising the sample ports while maintaining the same flow would facilitate investigation of the upper portions of the screen interval. Flow logging of the entire depth interval would be performed either before or after sample collection. Figure 14 illustrates the conceptual test design.
7.0 References
U.S. Department of Energy (DOE) 2004. Analysis of Contaminant Rebound in Ground Water on Extraction Wells at the Tuba City, Arizona, Site, Environmental Sciences Laboratory, DOE−LM/GJ625−2004, ESL−RPT−2004−04, prepared for the U.S. Department of Energy Office of Legacy Management, Grand Junction, Colorado, April. ⎯⎯⎯, 2005. Annual Performance Evaluation of Ground Water Remediation from March 2004 Through March 2005 at the Tuba City, Arizona, Disposal Site, DOE−LM/GJ881−2005, prepared for the U.S. Department of Energy Office of Legacy Management, Grand Junction, Colorado, June. Church, P.E. and G.E. Granato, 1996. “Bias in Ground-Water Data Caused by Well-Bore Flow in Long-Screen Wells,” Ground Water, vol. 34, No. 2, March-April. Sukop, M.C., 2000. “Estimation of Vertical Concentration Profiles from Existing Wells,” Ground Water, vol. 38, No. 6, November-December, pp. 836-841. Taylor, K., J. Hess, A. Mazzella, and J. Hayworth, 1990. “Comparisons of Three Methods to Determine the Vertical Stratification of Pore Fluids,” Ground Water Monitoring and Remediation, vol. 10, No. 1, Winter.
Vertical Distribution of Contamination in Ground Water at the Tuba City, Arizona, Site U.S. Department of Energy Doc. No. S0169800 August 2005 Page 22
End of current text

Appendix A
Additional Figures

U.S. Department of Energy Vertical Distribution of Contamination in Ground Water at the Tuba City, Arizona, Site August 2005 Doc. No. S0169800 Page A−3
Figure A−1.

Vertical Distribution of Contamination in Ground Water at the Tuba City, Arizona, Site U.S. Department of Energy Doc. No. S0169800 August 2005 Page A−4
Figure A−2.

Appendix B
Packer Test Field Data
Well 1101⎯March 2004 Well 1107⎯March 2004
Wells 1101 and 1106⎯June 2004

Well 1101⎯March 2004