Environmental Quality and Aquaculture Systems Quality and Aquaculture Systems ... 32 p. 65. History...
56
NOAA Technical Report NMFS 69 Environmental Quality and Aquaculture Systems Proceedings of the Thirteenth U.S.-Japan Meeting on Aquaculture, Mie, Japan, October 24-25, 1984 Carl J. Sindermann (editor) u.s. Department of Commerce October 1988
-
Upload
nguyendieu -
Category
Documents
-
view
215 -
download
1
Transcript of Environmental Quality and Aquaculture Systems Quality and Aquaculture Systems ... 32 p. 65. History...
NOAA Technical Report NMFS 69
Environmental Qualityand Aquaculture Systems
Proceedings of the ThirteenthU.S.-Japan Meeting on Aquaculture,Mie, Japan,October 24-25, 1984
Carl J. Sindermann (editor)
u.s. Department of Commerce
October 1988

NOAA TECHNICAL REPORT NMFS
The major responsibilities of the National Marine Fisheries Service (NMFS) are to monitor and assess the abundance and geographic distribution of fishery resources, tounderstand and predict fluctuations in the quantity and distribution of these resources, and to establish levels for their optimum use. NMFS IS also charged with the developmentand implementation of policies for managing national fishing grounds, development and enforcement of domestic fisheries regulations, surveillance of foreign fishing off UnitedStates coastal waters, and the development and enforcement of international fishery agreements and policies. NMFS also assists the fishmg industry through marketing serviceand economic analysis programs, and mortgage insurance and vessel construction subsidies. It collects, analyzes, and publishes statistics L'n various phases of the industry.
The NOAA Technical Report NMFS series was established in 1983 to replace two subcategories of the Technical Reports series; "Special Scientific Report-Fisheries" and"Cireular." The series contains the following types of reports; Scientific investigations that document long-term continuing programs of NMFS; intensive scientific reports onstudies of restricted scope; papers on applied fishery problems; technical reports of general interest intended to aid conservation and management; reports that review in considerable detail and at a high technical level certain broad areas of research; and technical papers originating in economics studies and from management investigations. Sincethis is a formal series, all submitted papers receive peer review and those accepted receive professional editing before publication.
Copies of NOAA Technical Reports NMFS are available free in limited numbers to governmental agencies, both Federal and State. They are also available in exchange forother scientific and technical publications in the marine sciences. Individual copies may be obtained from; U.S. Department of Commerce, National Technical Information Service,5285 Port Royal Road, Springfield, VA 22161. Although the contents have not been copyrighted and may be reprinted entirely, reference to source is appreciated.
34. Additions to a revision of the shark genus Careharhinus; Synonymy of Aprionodon and Hypoprion, and description ofa new species of Careharhinus (Carcharhinidae),by J. A. F. Garrick. November 1985,26 p.
35. Synoptic review of the literature on the Southern oyster drill Thais haemastomafloridona, by Philip A. Butler. November 1985, 9 p.
36. An egg production method for estimating spawning biomass of pelagic fish;Application to the northern anchovy, Engraulis mordax, by Reuben Lasker (editor).December 1985, 99 p.
37. A histopathologic evaluation of gross lesions excised from commercially important North Atlantic marine fishes, by Robert A. Murchelano, Linda DespresPatanjo, and John Ziskowski. March 1986, 14 p.
38. Fishery atlas of the northwestern Hawaiian Islands, by Richard N. Uchida andJames H. Uchiyama (editors). September 1986, 142 p.
39. Survey of fish protective facilities at water withdrawal sites on the Snake andColumbia Rivers, by George A. Swan, Tommy G. Withrow, and Donn L. Park. April
1986, 34 p.
40. Potential impact of ocean thermal energy conversion (OTEC) on fisheries, byEdward P. Myers, Donald E. Hoss, Walter M. Matsumoto, David S. Peters, MichaelP. Seki, Richard N. Uchida, John D. Ditmars, and Robert A. Paddock. June 1986,33 p.
41. A stationary visual census technique for quantitatively assessing community structure of coral reef fishes, by James A. Bohnsack and Scott P. Bannerol. July 1986, 15 p.
42. Effects of temperature on the biology of the northern shrimp, Pandalus borealis,in the Gulf of Maine, by Spencer Apollonio, David K. Stevenson, and Earl E. Dunton,Jr. September 1986, 22 p.
43. Environment and resources of seamounts in the North Pacific, by Richard N.Uchida, Sigeiti Hayasi, and George W. BoehJert (editors). September 1986, 105 p.
44. Synopsis of biological data on the porgies, Calamus aretifrons and C. proridens(Pisces; Sparidae), by George H. Darcy. September 1986, 19 p.
45. Meristic variation in Sebastes (Scorpaenidae), with an analysis of characterassociation and bilateral pattern and their significance in species separation, by Lochai Chen. September 1986, 17 p.
46. Distribution and relative abundance of pelagic nonsalmonid nekton off Oregonand Washington 1979-84, by Richard D. Brodeur and William G. Pearcy. De~ember1986, 85 p.
47. Reproduction, maturation, and seed production of cultured species; Proceedingsof the twelfth U.S.-Japan meeting on aquaculture, Baton Rouge, Louisiana, October25-29, 1983, by Carl J. Sindermann (editor). February 1987, 73 p.
48. Widow rockfish; Proceedings of a workshop, Tiburon, California, December11-12,1980, by William H. Lenarz and Donald R. Gunderson (editors). January 1987,57 p.
49. Reproduction, movements, and population dynamics of the southern kingfish,Mentieirrhus amerieanus, in the northwestern Gulf of Mexico, by Stephen M. Harding
and Mark E. Chittenden, Jr. March 1987, 21 p.
50. Preparation of acetate peels of valves from the ocean quahog, Aretiea islandica,for age determinations, by John W. Ropes. March 1987, 5 p.
51. Status, biology, and ecology of fur seals; Proceedings of an internationalworkshop, Cambridge, England, 23-27 April 1984, by John P. Croxall and RogerL. Gentry (editors). June 1987, 212 p.
52. Limited access alternatives for the Pacific groundfish fishery, by Daniel D,Huppert (editor). May 1987, 45 p.
53. Ecology of east Florida sea turtles; Proceedings of the Cape Canaveral, Florida,sea turtle workshop, Miami, Florida, February 26-27, 1985, by Wayne N. Witzell(convener and editor). May 1987, 80 p.
54. Proximate and fatty acid composition of 40 southeastern U.S. finfish species,by Janet A. Gooch, Malcolm B. Hale, Thomas Brown, Jr., James C. Bonnet, CherylG. Brand, and Lloyd W. Reiger. June 1987,23 p.
55. Proximate composition, energy, fatty acid, sodium, and cholesterol content offinfish, shellfish, and their products, by judith Krzynowek and Jenny Murphy. July1987, 53 p.
56. Some aspects of the ecology of the leatherback turtle Dermoehelys eoriaeea atLaguna Jolova, Costa Rica, by Harold F. Hirth and Larry H. Ogren. July 1987, 14 p,
57. Food habits and dietary variability of pelagic nekton off Oregon and Washington,1979-1984, by Richard D. Brodeur, Harriet V. Lorz, and William G. Pearcy. July1987,32 p.
58. Stock assessment of the Gulf menhaden, Brevoortia potronus, fishery, by DouglasS. Vaughan. September 1987, 18 p.
59. Atlantic menhaden, Brevoortia tyrannus, purse seine fishery, 1972-84, with abrief discussion of age and size composition of the landings, by Joseph W. Smith,William R. Nicholson, Douglas S. Vaughan, Donnie L. Dudley, and Ethel A. Hall.September 1987, 23 p.
60. Gulf menhaden, Brevoortia patronus, purse seine fishery, 1974-85, with a briefdiscussion of age and size composition of the landings, by Joseph W. Smith, EldonJ. Levi, Douglas S. Vaughan, and Ethen A. Hall. December 1987, 8 p.
61. Manual for starch gel electrophoresis; A method for the detection of genetic varia·tion, by Paul B. Aebersold, Gary A. Winans, David J. Teel, George B. Milner, andFred M. Utter. December 1987, 19 p.
62. Fishery publication index, 1980-85; Technical memoradum index, 1972-85, byCynthia S. Martin, Shelley E. Arenas, Jacki A, Guffey, and Joni M. Packard.December 1987, 149 p.
63. Stock assessment of the Atlantic menhaden, Brevoortia tyrannus, fishery, byDouglas S. Vaughan and Joseph W. Smith. January 1988, 18 p.
64. mustrated key to penaeoid shrimps of commerce in the Americas, by Isabel PerezFarfante. April 1988, 32 p.
65. History of whaling in and near North Carolina, by Randall R. Reeves and EdwardMitchell. March 1988, 28 p.
66. Atlas and zoogeography of common fishes in the Bering Sea and northeasternPacific, by M. James Allen and Gary B. Smith. April 1988, 151 p.

NOAA Technical Report NMFS 69
Environmental Qualityand Aquaculture Systems
Proceedings of the ThirteenthU.S.-Japan Meeting on Aquaculture,Mie, Japan,October 24-25, 1984
Carl J. Sindermann (editor)
Panel Chairmen:Conrad Mahnken, United StatesKaoru Tatara, Japan
Under the U.S.-Japan Cooperative Programin Natural Resources (UJNR)
October 1988
U.S. DEPARTMENT OF COMMERCEc. William Verity, Jr., Secretary
National Oceanic and Atmospheric AdministrationWilliam E. Evans, Under Secretary for Oceans and Atmosphere
National Marine Fisheries ServiceJames Brennan, Assistant Administrator for Fisheries
PREFACE _
The United States and Japanese counterpart panels on aquaculture were formed in 1969 under the United StatesJapan Cooperative Program in Natural Resources (UJNR). The panels currently include specialists drawn from thefederal departments most concerned with aquaculture. Charged with exploring and developing bilateral cooperation, the panels have focused their efforts on exchanging information related to aquaculture which could be of benefitto both countries.
The UJNR was begun during the Third Cabinet-Level Meeting of the Joint United States-Japan Committee onTrade and Economic Affairs in January 1964. In addition to aquaculture, current subjects in the program includedesalination of seawater, toxic microorganisms, air poUution, energy, forage crops, national park management, mycoplasmosis, wind and seismic effects, protein resources, forestry, and several joint panels and committees in marineresources research, development, and utilization.
Accomplishments include: Increased communication and cooperation among tecbnical specialists; exchanges ofinformation, data, and research findings; annual meetings of the panels, a· policy-coordinative body; administrativestaff meetings; exchanges of equipment, materials, and samples; several major technical conferences; and beneficialeffects on international relations.
Conrad Mahnken - United StatesKaoru Tatara - Japan
The National Marine Fisheries Service (NMFS) does not approve, recommend or endorse any proprietary product or proprietary material mentionedin this publication. No reference shall be made to NMFS, or to this publication furnished by NMFS, in any advenising or sales promotion which wouldindicate or imply that N~FS approves, recommends or endorses any proprietary product or proprietary material mentioned herein, or which has asits purpose an intent to cause directly or indirectly the advertised product tobe used or purchased because of this NMFS publication.
11

Contents
Chiba, KenjiRelationship between fish culture methods and pondwater quality in freshwater fish culture 1
Fukusho, Kunihiko, and Chikara KitajimaEnvironmental management of larval rearing of marine fishes-A short history of researchto prevent lordosis in red sea bream, Pagrus major 9
Funakoshi, Shoji, Tohru Suzuki, and Koji WadaSalinity tolerances of marine bivalves 15
Furukawa, Astushi, Hiroshi Fukatani, and Shuji TsuchidaTemperature preference of immature horse mackerel, Trachurus japonicus, in a verticaltemperature gradient 19
Nakanishi, TakashiEffects of environment on seedlings of king crab, Paralithodes camtschaticus 25
Noma, ToshifumiSome methods of water-flow control for mariculture 37
Ohwada, Kouichi, and Haruhiko UemotoEnvironmental conditions in pearl oyster culture grounds in Japan 45
iii

Relationship between fishculture methods andpondwater quality infreshwater fish culture
KENJI CHIBAFisheries Laboratory Faculty of AgricultureUniversity of Tokyo Bentenjima, HamanaShizuoka, 431-02 Japan
Freshwater fish, such as common carp, eel, rainbow trout and ayu,are cultured using various methods. Based on the manner of oxygen supply and waste substance removal, these methods can bedivided into three groups: stagnant-water culture, running-waterculture, and recirculation-system culture.
The stocking density in ponds is variable depending upon theculture method. Each culture method has its own oxygen-supplycapacity, and this capacity limits the total amount of fish to bestocked in each unit. Generally, the running-water culture methodallows an extremely high stocking density, whereas stocking density is lowest in the stagnant-water culture method. On the otherhand, the necessary water volume for each kilogram of fish weightgain is extremely high in running-water culture, and is lowest inthe recirculation-system culture. In other words, the efficiency ofwater utilization is best in the recirculation-system culture and lowestin the running-water culture.
As each fish-culture method has its own means of oxygen supplyand waste removal, the pattern of water-quality fluctuation is quitesimple to understand in running-water ponds but is complicated instagnant-water ponds. Eel culture in greenhouse ponds is a methodrecently developed in Japan. Although it had originally been developed from stagnant-water culture methods, the techniques employedfor oxygen supply and waste removal in this method are differentfrom those of the stagnant-water culture method. Atmosphericoxygen is dissolved mechanically by water wheels, and waste substances are removed by discharging water frequently. Water-qualityfluctuations in greenhouse ponds follow a less complicated dynamicsequence than in stagnant-water ponds. In this method, in whicheels are stocked at high density, extraordinarily high concentrationsof NH4-N, N02-N, P04-P and organic substances are alwaysobserved in pondwater. Under such water-quality conditions, eelsstill grow very rapidly.
Generally, in each culture method about 20 % of the nitrogensupplied with feeds is converted to fish body substance, and therest is transferred to soluble and particulate substances released intothe pondwater and sediments. When fish are stocked at a high density, a large amount of feed is offered daily. Accordingly, thosesubstances accumulate to a high level in the ponds. Especially inponds without water exchange or with a small inflow rate, thesesubstances will accumulate continuously to remarkable levels. Eelculture in greenhouse ponds is a typical example of such situations.The fact that under such water-quality conditions eels still can beproduced on a commercial scale gives several hints about waterquality management strategies in fish-culture ponds, but these arestill insufficient for proper adjustment of operational strategies.
An urgent need exists, therefore, to clarify the growth-limitingfactors under sufficient dissolved-oxygen conditions. Further, it isalso necessary to improve techniques for treating discharged pondwaters and sediments which are highly loaded with inorganic andorganic substances, in order to prevent the pollution of rivers, lakes,and the sea, to which aquaculture units release their wastewater.
It seems reasonable to determine the relationship between the fishculture methods employed and the pondwater quality achieved, foridentification of problems concerned with the effective utilizationof water resources in fish production. In this paper, water-qualityfluctuations observed under various culture methods and the resulting growth-limiting factors are examined.
Fish-culture method andstocking density _
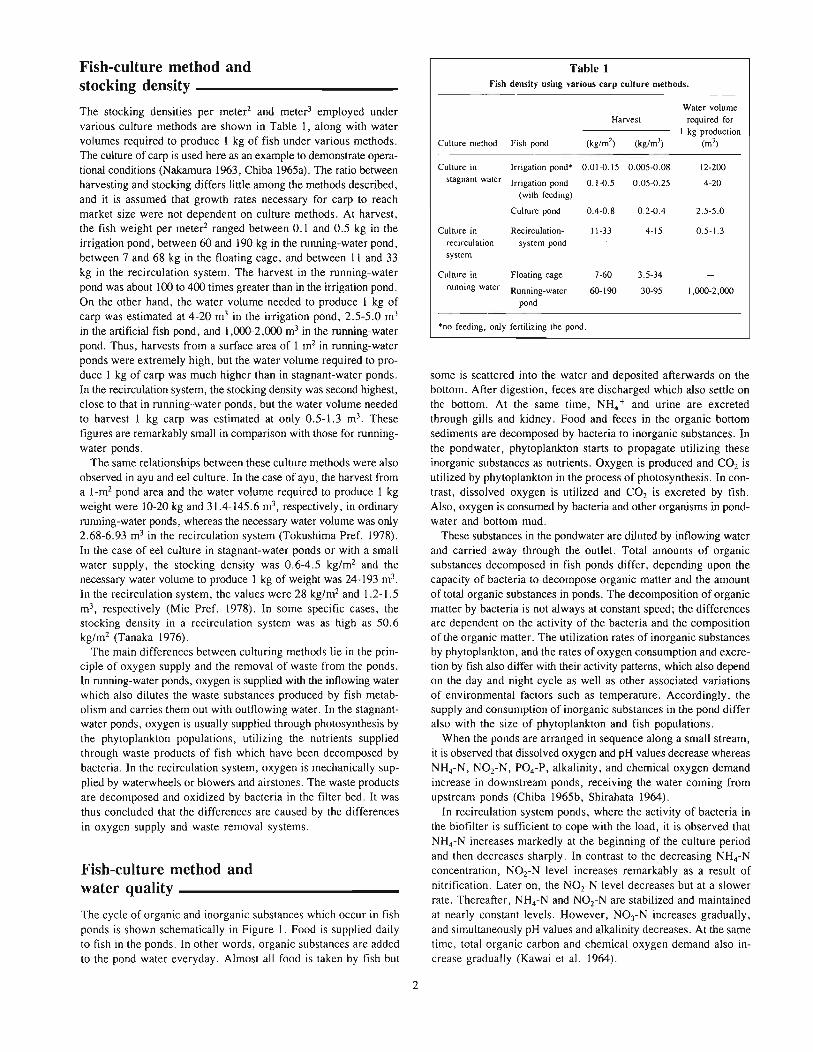
The stocking densities per meter2 and meter3 employed undervarious culture methods are shown in Table 1, along with watervolumes required to produce 1 kg of fish under various methods.The culture of carp is used here as an example to demonstrate operational conditions (Nakamura 1963, Chiba 1965a). The ratio betweenharvesting and stocking differs little among the methods described,and it is assumed that growth rates necessary for carp to reachmarket size were not dependent on culture methods. At harvest,the fish weight per meter2 ranged between 0.1 and 0.5 kg in theirrigation pond, between 60 and 190 kg in the running-water pond,between 7 and 68 kg in the floating cage, and between 11 and 33kg in the recirculation system. The harvest in the running-waterpond was about 100 to 400 times greater than in the irrigation pond.On the other hand, the water volume needed to produce 1 kg ofcarp was estimated at 4-20 m3 in the irrigation pond, 2.5-5.0 m3
in the artificial fish pond, and 1,000-2,000 m3 in the running-waterpond. Thus, harvests from a surface area of 1 m2 in running-waterponds were extremely high, but the water volume required to produce 1 kg of carp was much higher than in stagnant-water ponds.In the recirculation system, the stocking density was second highest,close to that in running-water ponds, but the water volume neededto harvest 1 kg carp was estimated at only 0.5-1.3 m3. Thesefigures are remarkably small in comparison with those for runningwater ponds.
The same relationships between these culture methods were alsoobserved in ayu and eel culture. In the case of ayu, the harvest froma I-m2 pond area and the water volume required to produce 1 kgweight were 10-20 kg and 31.4-145.6 m3, respectively, in ordinaryrunning-water ponds, whereas the necessary water volume was only2.68-6.93 m3 in the recirculation system (Tokushima Pref. 1978).In the case of eel culture in stagnant-water ponds or with a smallwater supply, the stocking density was 0.6-4.5 kg/m2 and thenecessary water volume to produce 1 kg of weight was 24-193 m3.
In the recirculation system, the values were 28 kg/m2 and 1.2-1.5m3, respectively (Mie Pref. 1978). In some specific cases, thestocking density in a recirculation system was as high as 50.6kg/m2 (Tanaka 1976).
The main differences between culturing methods lie in the principle of oxygen supply and the removal of waste from the ponds.In running-water ponds, oxygen is supplied with the inflowing waterwhich also dilutes the waste substances produced by fish metabolism and carries them out with outflowing water. In the stagnantwater ponds, oxygen is usually supplied through photosynthesis bythe phytoplankton populations, utilizing the nutrients suppliedthrough waste products of fish which have been decomposed bybacteria. In the recirculation system, oxygen is mechanically supplied by waterwheels or blowers and airstones. The waste productsare decomposed and oxidized by bacteria in the filter bed. It wasthus concluded that the differences are caused by the differencesin oxygen supply and waste removal systems.
Fish-culture method andwater quality _
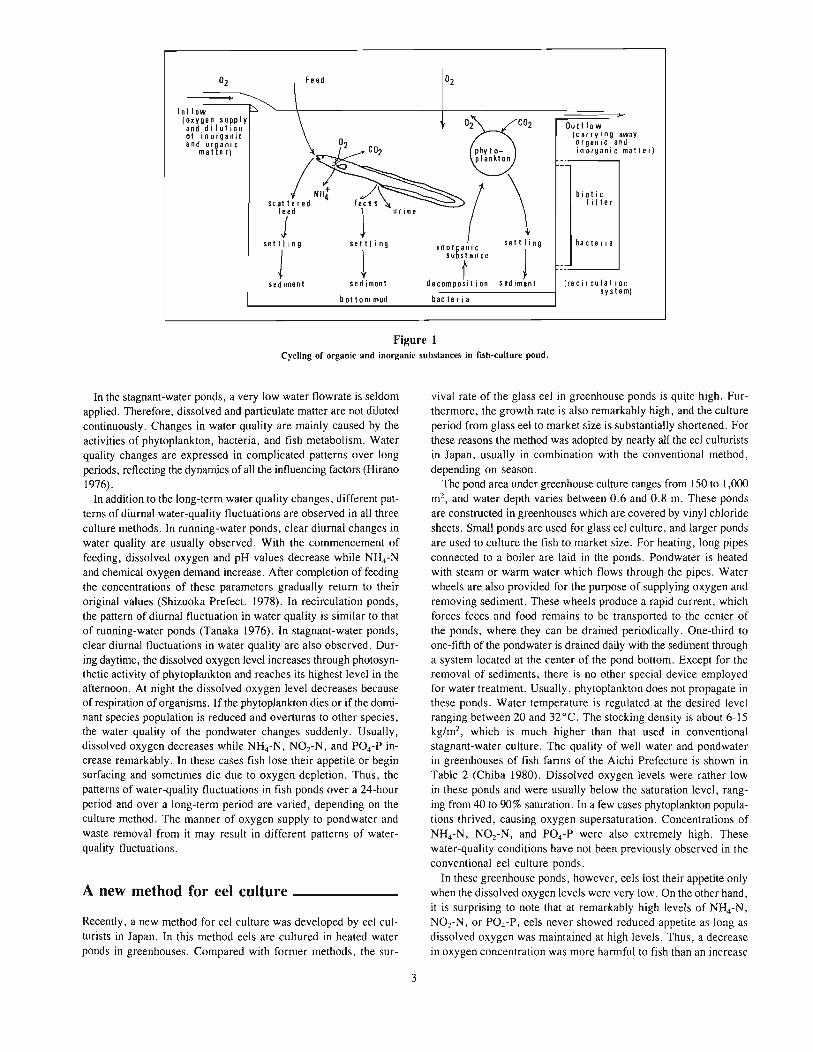
The cycle of organic and inorganic substances which occur in fishponds is shown schematically in Figure 1. Food is supplied dailyto fish in the ponds. In other words, organic substances are addedto the pond water everyday. Almost all food is taken by fish but
2
Table 1Fish density using various carp culture methods.
Water volumeHarvest required for
1 kg productionCulture method Fish pond (kg/m2
) (kg/m 3) (mJ)
Culture in Irrigation pond* 0.01-0.15 0.005-0.08 12-200stagnant water Irrigation pond 0.1-0.5 0.05-0.25 4-20
(with feeding)
Culture pond 0.4-0.8 0.2-0.4 2.5-5.0
Culture in Recirculation- 11-33 4-15 0.5-1.3recirculation system pondsystem
Culture in Floating cage 7-60 3.5-34running water Running-water 60-190 30-95 1,000-2,000
pond
*no feeding, only fertilizing the pond.
some is scattered into the water and deposited afterwards on thebottom. After digestion, feces are discharged which also settle onthe bottom. At the same time, NH4 + and urine are excretedthrough gills and kidney. Food and feces in the organic bottomsediments are decomposed by bacteria to inorganic substances. Inthe pondwater , phytoplankton starts to propagate utilizing theseinorganic substances as nutrients. Oxygen is produced and CO2 isutilized by phytoplankton in the process of photosynthesis. In contrast, dissolved oxygen is utilized and CO2 is excreted by fish.Also, oxygen is consumed by bacteria and other organisms in pondwater and bottom mud.
These substances in the pondwater are diluted by inflowing waterand carried away through the outlet. Total amounts of organicsubstances decomposed in fish ponds differ, depending upon thecapacity of bacteria to decompose organic matter and the amountof total organic substances in ponds. The decomposition of organicmatter by bacteria is not always at constant speed; the differencesare dependent on the activity of the bacteria and the compositionof the organic matter. The utilization rates of inorganic substancesby phytoplankton, and the rates of oxygen consumption and excretion by fish also differ with their activity patterns, which also dependon the day and night cycle as well as other associated variationsof environmental factors such as temperature. Accordingly, thesupply and consumption of inorganic substances in the pond differalso with the size of phytoplankton and fish populations.
When the ponds are arranged in sequence along a small stream,it is observed that dissolved oxygen and pH values decrease whereasNH4-N, N02-N, P04-P, alkalinity, and chemical oxygen demandincrease in downstream ponds, receiving the water coming fromupstream ponds (Chiba 1965b, Shirahata 1964).
In recirculation system ponds, where the activity of bacteria inthe biofilter is sufficient to cope with the load, it is observed thatNH4-N increases markedly at the beginning of the culture periodand then decreases sharply. In contrast to the decreasing NH4-Nconcentration, N02-N level increases remarkably as a result ofnitrification. Later on, the N02-N level decreases but at a slowerrate. Thereafter, NH4-N and N02-N are stabilized and maintainedat nearly constant levels. However, NOrN increases gradually,and simultaneously pH values and alkalinity decreases. At the sametime, total organic carbon and chemical oxygen demand also increase gradually (Kawai et al. 1964).
Inf Iow(oxygen supplyand dilutionof inorganicand org ani c
malle r)
Fe ed
(,,:scattered
feed
Jset t lin g
1sediment
bottom mud
. ( ,\..,norGanlc j
sUbtance
decomposit i on sed iment
bacteria
-----Outf low(carry ing awayorganic andinorganic matter)
bi at i cf i Iter
ba c te ria
----_.......(recirculat ion
system)
Figure 1Cycling of organic and inorganic substances in fish-culture pond.
In the stagnant-water ponds, a very low water flow rate is seldomapplied. Therefore, dissolved and particulate matter are not dilutedcontinuously. Changes in water quality are mainly caused by theactivities of phytoplankton, bacteria, and fish metabolism. Waterquality changes are expressed in complicated patterns over longperiods, reflecting the dynamics of all the influencing factors (Hirano1976).
In addition to the long-term water quality changes, different patterns of diurnal water-quality fluctuations are observed in all threeculture methods. In running-water ponds, clear diurnal changes inwater quality are usually observed. With the commencement offeeding, dissolved oxygen and pH values decrease while NH4-Nand chemical oxygen demand increase. After completion of feedingthe concentrations of these parameters gradually return to theiroriginal values (Shizuoka Prefect. 1978). In recirculation ponds,the pattern of diurnal fluctuation in water quality is similar to thatof running-water ponds (Tanaka 1976). In stagnant-water ponds,clear diurnal fluctuations in water quality are also observed. During daytime, the dissolved oxygen level increases through photosynthetic activity of phytoplankton and reaches its highest level in theafternoon. At night the dissolved oxygen level decreases becauseof respiration of organisms. If the phytoplankton dies or if the dominant species population is reduced and overturns to other species,the water quality of the pondwater changes suddenly. Usually,dissolved oxygen decreases while NH4-N, NOz-N, and P04-P increase remarkably. In these cases fish lose their appetite or beginsurfacing and sometimes die due to oxygen depletion. Thus, thepatterns of water-quality fluctuations in fish ponds over a 24-hourperiod and over a long-term period are varied, depending on theculture method. The manner of oxygen supply to pondwater andwaste removal from it may result in different patterns of waterquality fluctuations.
A new method for eel culture _
Recently, a new method for eel culture was developed by eel culturists in Japan. In this method eels are cultured in heated waterponds in greenhouses. Compared with former methods, the sur-
3
vival rate of the glass eel in greenhouse ponds is quite high. Furthermore, the growth rate is also remarkably high, and the cultureperiod from glass eel to market size is substantially shortened. Forthese reasons the method was adopted by nearly all the eel culturistsin Japan, usually in combination with the conventional method,depending on season.
The pond area under greenhouse culture ranges from 150 to 1,000mZ, and water depth varies between 0.6 and 0.8 m. These pondsare constructed in greenhouses which are covered by vinyl chloridesheets. Small ponds are used for glass eel culture, and larger pondsare used to culture the fish to market size. For heating, long pipesconnected to a boiler are laid in the ponds. Pondwater is heatedwith steam or warm water which flows through the pipes. Waterwheels are also provided for the purpose of supplying oxygen andremoving sediment. These wheels produce a rapid current, whichforces feces and food remains to be transported to the center ofthe ponds, where they can be drained periodically. One-third toone-fifth of the pondwater is drained daily with the sediment througha system located at the center of the pond bottom. Except for theremoval of sediments, there is no other special device employedfor water treatment. Usually, phytoplankton does not propagate inthese ponds. Water temperature is regulated at the desired levelranging between 20 and 32°C. The stocking density is about 6-15kg/mZ, which is much higher than that used in conventionalstagnant-water culture. The quality of well water and pondwaterin greenhouses of fish farms of the Aichi Prefecture is shown inTable 2 (Chiba 1980). Dissolved oxygen levels were rather lowin these ponds and were usually below the saturation level, ranging from 40 to 90% saturation. In a few cases phytoplankton populations thrived, causing oxygen supersaturation. Concentrations ofNH4-N, NOz-N, and P04-P were also extremely high. Thesewater-quality conditions have not been previously observed in theconventional eel culture ponds.
In these greenhouse ponds, however, eels lost their appetite onlywhen the dissolved oxygen levels were very low. On the other hand,it is surprising to note that at remarkably high levels of NH4-N,NOz-N, or P04-P, eels never showed reduced appetite as long asdissolved oxygen was maintained at high levels. Thus, a decreasein oxygen concentration was more harmful to fish than an increase

Table 2Water quality of wellwater and pondwater (greenhouse) of fish farms at Aichi Prefecture.
Wellwater source Pondwater source
Item Max. Min. Mean Max. Min. Mean
Water temperature (0C) 21.8 17.1 19.40 27.5 20.0 25.49pH 7.4 6.3 7.01 7.07 7.1 7.37DO (%) 61.4 18.8 39.43 156.7 26.1 72.04NH.-N ppm 2.750 ND 1.4450 26.400 0.080 6.3050
NOrN ppm 0.080 ND 0.0141 6.000 0.020 1.2400N03-N ppm 8.40 0.94 4.701 24.00 5.60 11.26PO.-P ppm 0.132 ND 0.0811 2.575 0.150 0.8767COD ppm 0.54 0 0.066 7.48 1.34 6.300COD ppm' 3.92 0.65 2.101
Alkalinity (mg/L) 3.750 0.682 1.6716 3.364 0.682 1.3689Ca ppm 630 61 ~68.1 452 199 183.9Mg ppm 210 43 139.9 222 18 106.5Fe ppm 6.56 0.04 1.556 0.40 0.10 0.203So ppm 314 19 163.9 274 18 106.9CI ppm 3082 228 1678.0 2340 190 1093.0Na ppm 970 65 444.4K ppm 22.0 6.5 14.90
COD = chemical oxygen demand.DO = dissolved oxygen.'Sample was filtered by 0.1-1' filter.
of NH4-N, N02-N, and P04-P. It is important to maintain a highoxygen concentration at all times while using this culture method.Examples of production conditions and results of eel culture inheated greenhouse water ponds are shown in Table 3 (Chiba 1980).Fish grown to table size are usually harvested intermittently, andyoung fish are restocked or transferred between ponds several timesduring the culture period. Therefore, it is very difficult to correctly evaluate the production results of fish culture. In gener11, thefeed conversion efficiency can serve as a reasonable indicator ofsystem performance under practical culture conditions. Feed conversion efficiency is calculated as follows: weight gain multipliedby 100 and divided by amount of food given. In general, the average feed conversion efficiency in conventional stagnant-water cultureis estimated to be about 60-70 %. As the figures obtained in ,greenhouse ponds surveyed ranged between 58.7 and 71.4 %. results inthese ponds were not different from those in conventional stagnantwater ponds. Therefore, it seems reasonable to assume that the extremely high concentrations of several water quality factors in greenhouse ponds might not have appreciably influenced feeding orgrowth of eels.
However, for further development of this culture method, it isnecessary to clarify the effect of the most important water qualityfactors. not only on fish appetite and growth but also on the physiological condition of the fish. Also, effective removal of sedimentseems to be an important technique in pond management using thisculture method. Therefore, the effect of sediment removal on waterquality. fish growth, and appetite should be studied in detail.
Growth-limiting factors _
There are many reports on the effects of organic and inorganicsubstances on aquatic animals; however, most are from the standpoint of pollution problems. Only a few studies have tried to clarifythe effects of various water-quality parameters on fish appetite andgrowth. Dissolved oxygen. waste products (Kawamoto 1957),
4
Table 3Examples of results of eel culture in heated-water pond (greenhouse).
Fish pond
0- I' 0-2 KA F
Pond area (m2) 297 396 496 264Water temperature (0C) 21 24 26 24Culturing period 1977-78 10/28 10127 10118 11/2
(calendar month) 316 6/23 1110 6/21Amount of fish stocked (kg) 670 1,570 2,000 2,625
(initial)Amount of fish (kg) 454 2,100 0 0
restockedTotal amount of fish (kg) 1,124 3,670 2,000 2,625
stockedInitial stocking density (kg/m2
) 2.26 3.96 4.33 9.94Harvest of marketable (kg) 0 5,942 2,985 2,547
sized fishesFish left in ponds" (kg) 1,300 1,860 828 2,970Dead fishes (kg) 43 110Weight increase (kg) 219 4,242 1.813 2.829Amount of feeding (kg) 627 7,222 2,540 4,700Feed efficiency'" (%) 35.0 58.7 71.4 61.5
'Seedling culture of eel."Fishes too small to be harvested.
"'Feed efficiency was estimated from 35 to 71.4 %, no different from those ofordina.-y cultured method.
NH4-N, N02-N, and N03-N have been reported as limiting factors for fish growth. Their effective concentration ranges are shownin Table 4.
Growth rate, feeding rate, and feed conversion efficiency in manyfish species decreases with a decrease of dissolved oxygen. Theseeffects were found to occur in common carp when the oxygen concentration decreases to values less than 3 mL/L (20-23°C. or 50%of air saturation) (Chiba 1965c), for coho salmon at less than 4 ppm
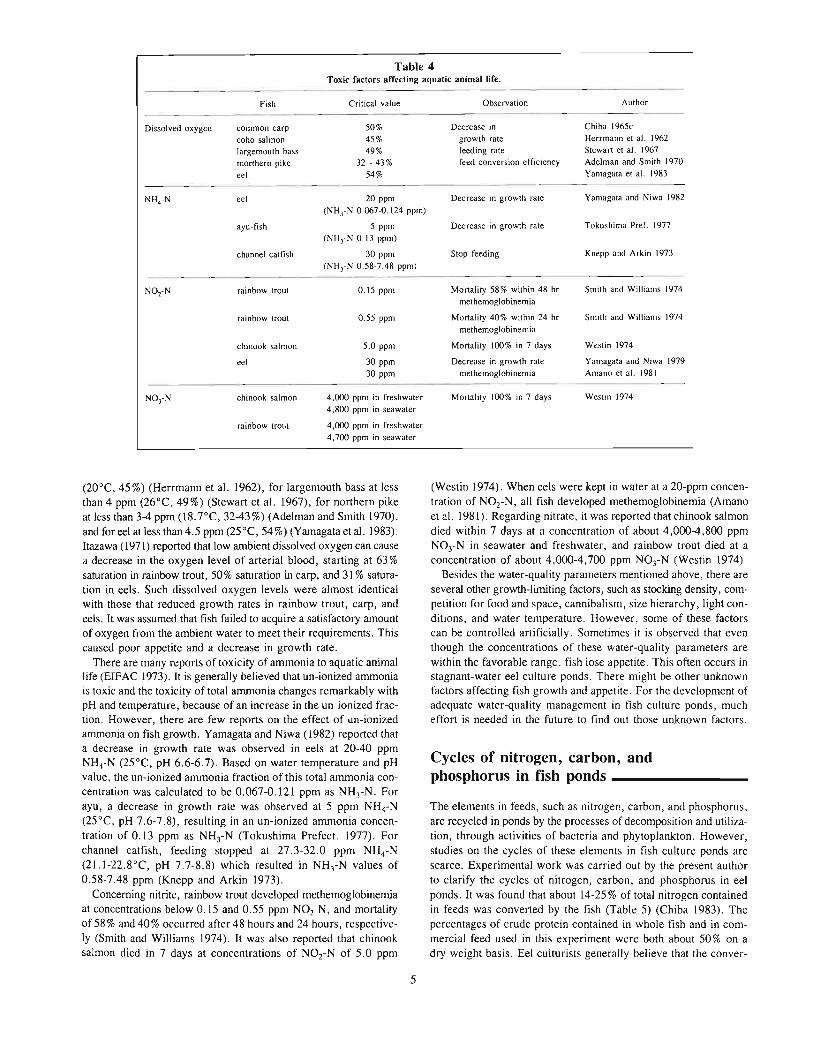
Table 4Toxic factors affecting aquatic animal life.
Fish Critical value Observation Author
Dissolved oxygen common carp 50% Decrease in Chiba 1965c
coho salmon 45% growth rate Herrmann et al. 1962
largemouth bass 49% feeding rate Stewart et al. 1967
morthero pike 32 - 43% feed conversion efficiency Adelman and Smith 1970
eel 54% Yamagata et al. 1983
NH.-N eel 20 ppm Decrease in growth rate Yamagata and Niwa 1982
(NH3-N 0.067-0.124 ppm)
ayu-fish 5 ppm Decrease in growth rate Tokushima Pref. 1977
(NH3-N 0.13 ppm)
channel catfish 30 ppm Stop feeding Knepp and Arkin 1973
(NH3-N 0.58-7.48 ppm)
NOz-N rainbow trout 0.15 ppm Mortality 58% within 48 hr Smith and Williams 1974
methemoglobinemia
rainbow trout 0.55 ppm Mortality 40% within 24 hr Smith and Williams 1974
methemoglobinemia
chinook salmon 5.0 ppm Mortality 100% in 7 days Westin 1974
eel 30 ppm Decrease in growth rate Yamagata and Niwa 1979
30 ppm methemoglobinemia Amano et al. 1981
N03-N chinook salmon 4,000 ppm in freshwater Mortality 100% in 7 days Westin 1974
4,800 ppm in seawater
rainbow trotit 4,000 ppm in freshwater4,700 ppm in seawater
(20°C, 45%) (Herrmann et al. 1962), for largemouth bass at lessthan 4 ppm (26°C, 49%) (Stewart et al. 1967), for northern pikeat less than 3-4 ppm (18.7°C, 32-43%) (Adelman and Smith 1970).and for eel at less than 4.5 ppm (25°C, 54%) (Yamagata et al. 1983).Itazawa (1971) reported that low ambient dissolved oxygen can causea decrease in the oxygen level of arterial blood, starting at 63 %saturation in rainbow trout, 50% saturation in carp, and 31 % saturation in eels. Such dissolved oxygen levels were almost identicalwith those that reduced growth rates in rainbow trout, carp, andeels. It was assumed that fish failed to acquire a satisfactory amountof oxygen from the ambient water to meet their requirements. Thiscaused poor appetite and a decrease in growth rate.
There are many reports of toxicity of ammonia to aquatic animallife (EIFAC 1973). It is generally believed that un-ionized ammoniais toxic and the toxicity of total ammonia changes remarkably withpH and temperature, because of an increase in the un-ionized fraction. However, there are few reports on the effect of lin-ionizedammonia on fish growth. Yamagata and Niwa (1982) rep0l1ed thata decrease in growth rate was observed in eels at 20-40 ppmNH4-N (25°C, pH 6.6-6.7). Based on water temperature and pHvalue, the un-ionized ammonia fraction of this total ammonia concentration was calculated to be 0.067-0.121 ppm as NH3-N. Forayu, a decrease in growth rate was observed at 5 ppm NH4-N(25°C, pH 7.6-7.8), resulting in an un-ionized ammonia concentration of 0.13 ppm as NH3-N (Tokushima Prefect. 1977). Forchannel catfish, feeding stopped at 27.3-32.0 ppm NH4,N(21.l-22.8°C, pH 7.7-8.8) which resulted in NH3-N values of0.58-7.48 ppm (Knepp and Arkin 1973).
Concerning nitrite, rainbow trout developed methemoglobinemiaat concentrations below 0.15 and 0.55 ppm NOz-N, and mortalityof 58% and 40% occurred after 48 hours and 24 hours, respectively (Smith and Williams 1974). It was also reported that chinooksalmon died in 7 days at concentrations of NOz-N of 5.0 ppm
5
(Westin 1974). When eels were kept in water at a 20-ppm concentration of NOz-N, all fish developed methemoglobinemia (Amanoet al. 1981). Regarding nitrate, it was reported that chinook salmondied within 7 days at a concentration of about 4,000-4,800 ppmNOrN in seawater and freshwater, and rainbow trout died at aconcentration of about 4.000-4,700 ppm N03-N (Westin 1974).
Besides the water-quality parameters mentioned above, there areseveral other growth-limiting factors, such as stocking density, competition for food and space, cannibalism, size hierarchy, light conditIOns, and water temperature. However, some of these factorscan be controlled artificially. Sometimes it is observed that eventhough the concentrations of these water-quality parameters arewithin the favorable range. fish lose appetite. This often occurs instagnant-water eel culture ponds. There might be other unknownfactors affecting fish growth and appetite. For the development ofadequate water-quality management in fish culture ponds, mucheffort is needed in the future to find out those unknown factors.
Cycles of nitrogen, carbon, andphosphorus in fish ponds _
The elements in feeds, such as nitrogen, carbon, and phosphorus,are recycled in ponds by the processes of decomposition and utilization, through activities of bacteria and phytoplankton. However,studies on the cycles of these elements in fish culture ponds arescarce. Experimental work was carried out by the present authorto clarify the cycles of nitrogen, carbon, and phosphorus in eelponds. It was found that about 14-25 % of total nitrogen containedin feeds was converted by the fish (Table 5) (Chiba 1983). Thepercentages of crude protein contained in whole fish and in commercial feed used in this experiment were both about 50% on adry weight basis. Eel culturists generally believe that the conver-
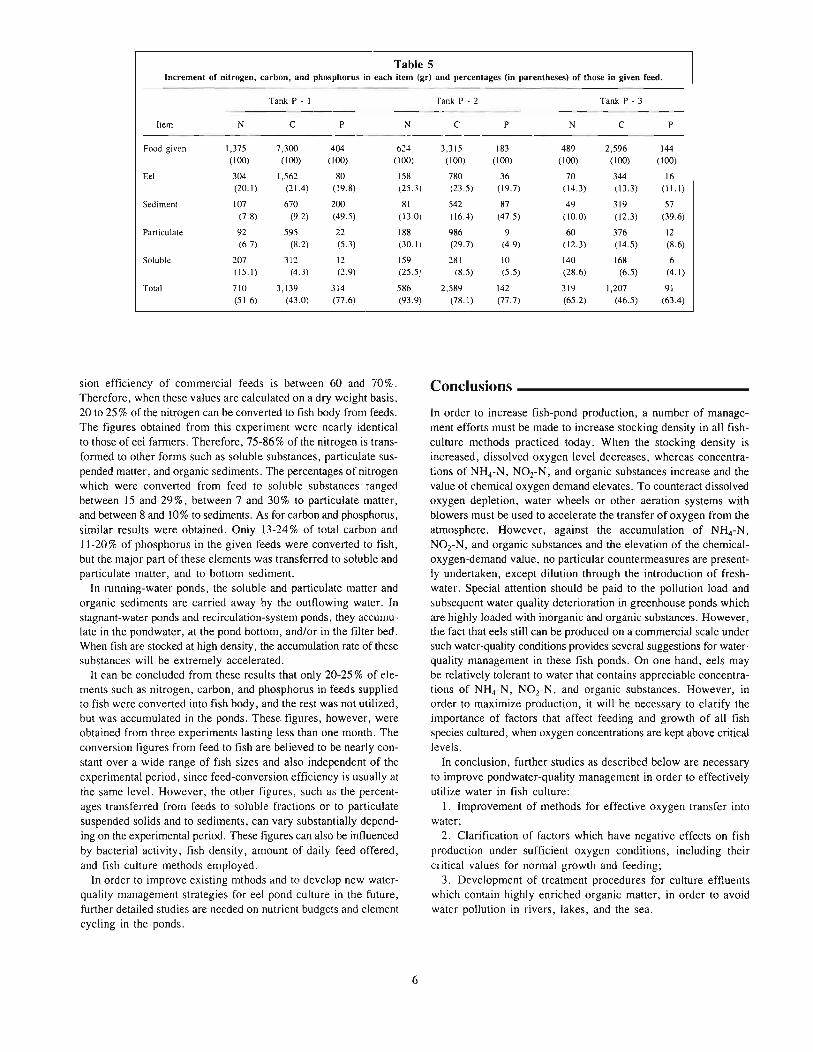
Table 5Increment of nitrogen, carbon, and phosphorus in each item (gr) and percentages (in parentheses) of those in given feed.
Tank P - I Tank P - 2 Tank P - 3----------
Item N C P N C P N C P----
Food given 1,375 7,300 404 6~4 3,315 183 489 2,596 144(100) (100) (I00) (IOOI (100) (100) (100) (100) (100)
Eel 304 1,562 80 158 780 36 70 344 16(20.1) (21.4) (19.8) (25.3) (23.5) (19.7) (14.3) (13.3) (11.1)
Sediment 107 670 200 81 542 87 49 319 57(7.8) (9.2) (49.5) (13.0) (16.4) (47.5) (10.0) (12.3) (39.6)
Particulate 92 595 22 188 986 9 60 376 12(6.7) (8.2) (5.3) (30.1) (29.7) (4.9) (12.3) (14.5) (8.6)
Soluble 207 312 12 159 ~81 10 140 168 6(15.1) (4.3) (2.9) (25.5.' e8.5) (5.5) (28.6) (6.5) (4.1)
Total 710 3,139 314 586 2,589 142 319 1,207 91(51.6) (43.0) (77.6) (93.9) (78.1) (77.7) (65.2) (46.5) (63.4)
sion efficiency of commercial feeds is between 60 and 70 %.Therefore, when these values are calculated on a dry weight basis,20 to 25% of the nitrogen can be converted to fish body from feeds.The figures obtained from this experiment were nearly identicalto those of eel farmers. Therefore, 75-86% of the nitrogen is transformed to other forms such as soluble substances, particulate suspended matter, and organic sediments. The percentages of nitrogenwhich were converted from feed to soluble substances rangedbetween 15 and 29 %, between 7 and 30 % to particulate matter,and between 8 and 10% to sediments. As for carbon and phosphorus,similar results were obtained. Only 13-24% of total carbon and11-20% of phosphorus in the given feeds were converted to fish,but the major part of these elements was transferred to soluble andparticulate matter, and to bottom sediment.
In running-water ponds, the soluble and particulate matter andorganic sediments are carried away by the outflowing water. Instagnant-water ponds and recirculation-system ponds, they accumulate in the pondwater, at the pond bottom, and/or in the filter bed.When fish are stocked at high density, the accumulation rate of thesesubstances will be extremely accelerated.
It can be concluded from these results that only 20-25 % of elements such as nitrogen, carbon, and phosphorus in feeds suppliedto fish were converted into fish body, and the rest was not utilized,but was accumulated in the ponds. These figures, however, wereobtained from three experiments lasting less than one month. Theconversion figures from feed to fish are believed to be nearly constant over a wide range of fish sizes and also independent of theexperimental period, since feed-conversion efficiency is usually atthe same level. However, the other figures, such as the percentages transferred from feeds to soluble fractions or to particulatesuspended solids and to sediments, can vary substantially depending on the experimental period. These figures can also be influencedby bacterial activity, fish density, amount of daily feed offered,and fish culture methods employed.
In order to improve existing mthods and to develop new waterquality management strategies for eel pond culture in the future,further detailed studies are needed on nutrient budgets and elementcycling in the ponds.
6
Conclusions _
In order to increase fish-pond production, a number of management efforts must be made to increase stocking density in all fishculture methods practiced today. When the stocking density isincreased, dissolved oxygen level decreases, whereas concentrations of NH4-N, NOz-N, and organic substances increase and thevalue of chemical oxygen demand elevates. To counteract dissolvedoxygen depletion. water wheels or other aeration systems withblowers must be used to accelerate the transfer of oxygen from theatmosphere. However, against the accumulation of NH4-N,NOrN, and organic substances and the elevation of the chemicaloxygen-demand value, no particular countermeasures are presently undertaken, except dilution through the introduction of freshwater. Special attention should be paid to the pollution load andsubsequent water quality deterioration in greenhouse ponds whichare highly loaded with inorganic and organic substances. However,the fact that eels still can be produced on a commercial scale undersuch water-quality conditions provides several suggestions for waterquality management in these fish ponds. On one hand, eels maybe relatively tolerant to water that contains appreciable concentrations of NH4-N, NOz-N. and organic substances. However, inorder to maximize production, it will be necessary to clarify theimportance of factors that affect feeding and growth of all fishspecies cultured, when oxygen concentrations are kept above criticallevels.
In conclusion, further studies as described below are necessaryto improve pondwater-quality management in order to effectivelyutilize water in fish culture:
1. Improvement of methods for effective oxygen transfer intowater;
2. Clarification of factors which have negative effects on fishproduction under sufficient oxygen conditions, including theircritical values for normal growth and feeding;
3. Development of treatment procedures for culture effluentswhich contain highly enriched organic matter, in order to avoidwater pollution in rivers, lakes, and the sea.
Citations _
Adelman, L.R.• and L.L. Smith.1970. Effect of oxygen on growth and food conversion efficiency of northern
pike. Prog. Fish Cull. 32:93-96.Amano, H., T. Miyazaki, M. Ichikawa, M. Niwa, and S.S. Kubota.
1981. Occurrence of nitrite-induced methemoglobinemia in cultured eels. Bull.Jpn. Soc. Sci. Fish. 47:823.
Chiba, K.1965a. Freshwater fish culture from the viewpoint of stocking density.
Aquiculture (Sendai) 4:43-47 (in Jpn.). See Suisan Zoshoku (Fish. CUlL).1965b. Studies on the carp culture in running water pond - I. Fish production
and its environmental condition in a certain fish farm in Gumma Prefecture.Bull. Freshwater Fish. Res. Lab. (Tokyo) 15: 13-33.
1965c. A study on the influence of oxygen concentration on the growth ofjuvenilecommon carp. Bull. Freshwater Fish. Res. Lab. (Tokyo) 15:35-47.
1980. Water quality as an environmental factor and growth of fi;h - V. Water
quality and eel production in the heated culture pond in greenhouse. Aquiculture(Sendai) 28:39-45 (in Jpn.). See Suisan Zoshoku (Fish. Cult.).
1983. Cycle of nitrogen, carbon and phosphorus in stagnant water eel pond.In Proceedings, 12th annual meeting of eel culture research conference, p.141-148 (in Jpn.).
EIFAC (Eur. Inland Fish. Advis. Comna.)1973. Water quality criteria for EurJpean freshwater fish. Report on ammonia
and inland fisheries. Water Res. 7:1011-1022.
Herrmann, R.B., C.E. Warren, and P. DoudorotT.1962. Influence of oxygen conc~nlration on the growth of coho salmon. Trans.
Am. Fish. Soc. 91: 155-167.Hirano, R.
1967. Environmental condition in freshwater fish culture pond - I. Dohyaku
Kenkyu 4, p. 12-16 (in Jpn.).
lIazawa, Y.1971. An estimation of the minimum level of dissolved oxygen in the water re
quired for normal life of fish. Bull. Jpn. Soc. Sci. Fish. 37:237-276.Kawai, A., Y. Yoshida, and M. Kimata.
1964. Biochemical studies on the bacteria in aquarium with circulating system- I. Changes of the qualities of breeding water and baeterial population of theaquarium during fish cultivation. Bull. Jpn. Soc. Sci. Fish. 30:55-62.
Kawamoto, N.
1957. On the productivity of intensive carp culture pond. Suisangakushusei:717-720. Tokyo Daigaku Shuppankai, Tokyo (in Jpn.).
Knepp, G.L., and G.F. Arkin.
1973. Ammonia toxicity levels and nitrate tolerance of channel catfish. Prog.Fish. Cull. 35:221-224.
Mie Prefectural Inland Fisheries Experiment Slation.
1978. Survey of present eel culture situation. Report of effective water utilization for aquaculture, p. 1-26 (in Jpn.).
Nakamura, N.
1963. General problem of carp. Proceedings, Zenkoku kosho kasen yoshokukenkyu kai, No. 36, p. 25-41 (in Jpn.).
Shirabala, S.
1964. Problems of water quality in food trout production. Bull. Fac. Fish.Nagasaki Vniv. 17:68-82.
Shizuoka Prefectural Fisheries Experiment Station, Hamanako Branch.
1978. Diurnal changes of water quality in "ayu-fish" culture pond. Proceedings, Ayu yogyo yosui kodo riyo kenkuykai, No.2, p. 23-27 (in Jpn.).
Smith, C.G., and W.G. Williams.
1974. Experimental nitrate toxicity in rainbow trout and chinook salmon. Trans.Am. Fish. Soc. 103:389-390.
Siewart, N.E., D.L. Shumway, and P. Doudoroff.
1967. Influence of oxygen concentration on the growth of juvenile largemouthbass. 1. Fish. Res. Board Can. 24:475-495.
Tanaka, S.
1976. Studies on the recirculation system for fish culture - VI. Culture experi
ment with European eel. Saitamaken Suisan Shikenjo Kenkyu Hokoku, no. 35,p. 62-64 (in Jpn.).
Tokushima Prefectural Fisheries Experiment Station, Naruto Branch.
1977. Effect of ammonium-nitrogen on the growth of ayu-fish. Proceedings,
Ayu yogyo yousui kodoriyo kenkyukai, no. I, p. 26-28 (in Jpn.).1978. Present situation of "ayu-fish" culture. Proceedings, Ayu yogyo yousui
kodoriyo kenkyukai, no. 3, p. 32-35 (in Jpn.).
7
Westin, D.T.
1974. Nitrate and nitrite toxicity to salmonid fishes. Prog. Fish Cull. 36:86-89.Yamagata, Y., and M. Niwa.
1979. The toxicity of nitrite to eel. Aquiculture (Sendai) 27:5-11 (in Jpn.). SeeSuisan Zoshoku (Fish. Cull.).
1982. Acute and chronic toxicity of ammonia to eel Anguilla japonica. Bull.Jpn. Soc. Sci. Fish. 48:171-176.
Yamagata, Y., S. Oonaka, M. Harada, and M. Niwa.1983. Influence of concentration of dissolved oxygen on the growth of Japanese
eel Anguilla japonica. Bull. Jpn. Soc. Sci. Fish. 49: 1335-1339.

Environmental managementof larval rearing of marinefishes-A short historyof research to preventlordosis in red sea bream,Pagrus major
KUNIHIKO FUKUSHONational Research Institute of AquacultureFisheries AgencyNansei, Mie, 516-01 Japan
CIDKARA KITAJIMA1
Laboratory of AquacultureNagasaki Prefectural Institute of FisheriesNomozaki, Nagasaki, 851-05 Japan
'Current address: Fisheries Research Laboratory, Kyushu University, Tsuyazaki,Munakata-gun, Fukuoka, 811-33 Japan.
9
The technology for mass larval rearing of marine fishes has developed remarkably over the last 15 years. For example, 6.3 x 10⁶
juvenile red sea bream, Pagrus major, and porgy, Acanthopagrusschlegeli, 12.1-16.0 mm TL, were produced in a hatchery withina three-month period (Fushimi 1984). There have been severalreasons for the rapid and successful development of these techniques.One of the most important is the introduction of the rotiferBrachionus plicatilis as a food organism, and the development ofits culture (Fushimi 1984). Establishment of natural spawning intanks is another important factor. A female red sea bream of 1-1.5kg spawns 2-3.5 X 10⁶ eggs during a period of 1.5 months (Kitajima 1978, 1983). Furthermore, special attention to improvingenvironmental management for larval rearing and mass culture ofthe rotifer promoted development of fry production techniques.Thus, it has become possible to rear fry in large-scale 100-ton tanks,with a harvest of 106 juveniles of 10 mm TL, and mass culturerotifers in 40-ton tanks, with a harvest of 152.4 x 10⁸ rotifers, or45 kg for 18 days (Fukusho 1979). This paper deals with the importance of environmental management in larval rearing of marinefishes, illustrating the serious problem of lordosis in red sea breamand the history of research aimed at its solution as an example ofsuccessful environmental management.
Lordosis, a vertebral abnormality frequently observed (30-50%)in hatchery-reared red sea bream and other species such as theporgy, A. schlegeli, and silver bream, Sparus sarba, is the mostserious of several kinds of deformities, i.e., scoliosis, incompletedevelopment of opercle bones, and pug head (Sumita 1977, Kitajima 1978, Takashima 1978, Fujita 1979, Fujita and Kitajima 1978).Lordosis, causing a V-shaped vertebral column, is known to be induced in fish and uninflated swim bladders (Kitajima et al. 1977,Papema 1978, Takashima et al. 1980, Iseda 1982). Externalcharacteristics of lordosis will gradually appear in adults duringgrowth, although it is actually induced in the early larval stages.Subsequently, the abnormal features of lordosis reduce the commercial value of red sea bream, despite the long-term farming effortsof the aquaculturists.
In a search for the cause of lordosis, three fields of study wereexplored: I) genetics, 2) nutrition, and 3) environmental improvement.
Genetic problems _
For the investigation of genetic factors, eggs were sent from onehatchery to a second hatchery where lordosis had rarely been observed, and newly-hatched larvae from the same spawning werereared at the two hatcheries (Fujita and Kitajima 1978, Kitajima1978). Deformed individuals never appeared at the second hatchery, while lordosis was found at the first hatchery at a rate of14.1-35.4% (Fujita and Kitajima 1978). The percentage oflordosisvaried among experimental tanks with eggs from the same parentfish. Lordosis has occurred in almost all hatcheries in Japan, witha few exceptions. Thus, a genetic cause of lordosis might be ruledout, although there are data to suggest that the deformity may becaused by prehatching factors, such as physiological condition ofthe eggs and brood stock (Taniguchi et al. 1984).
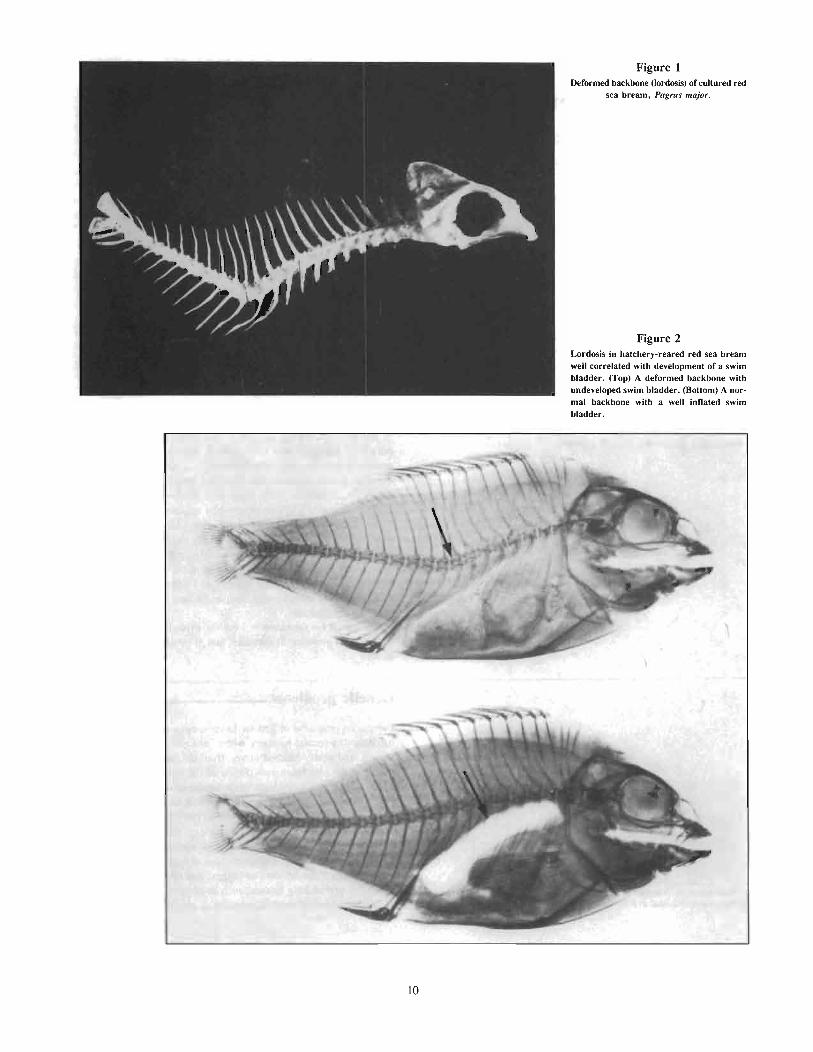
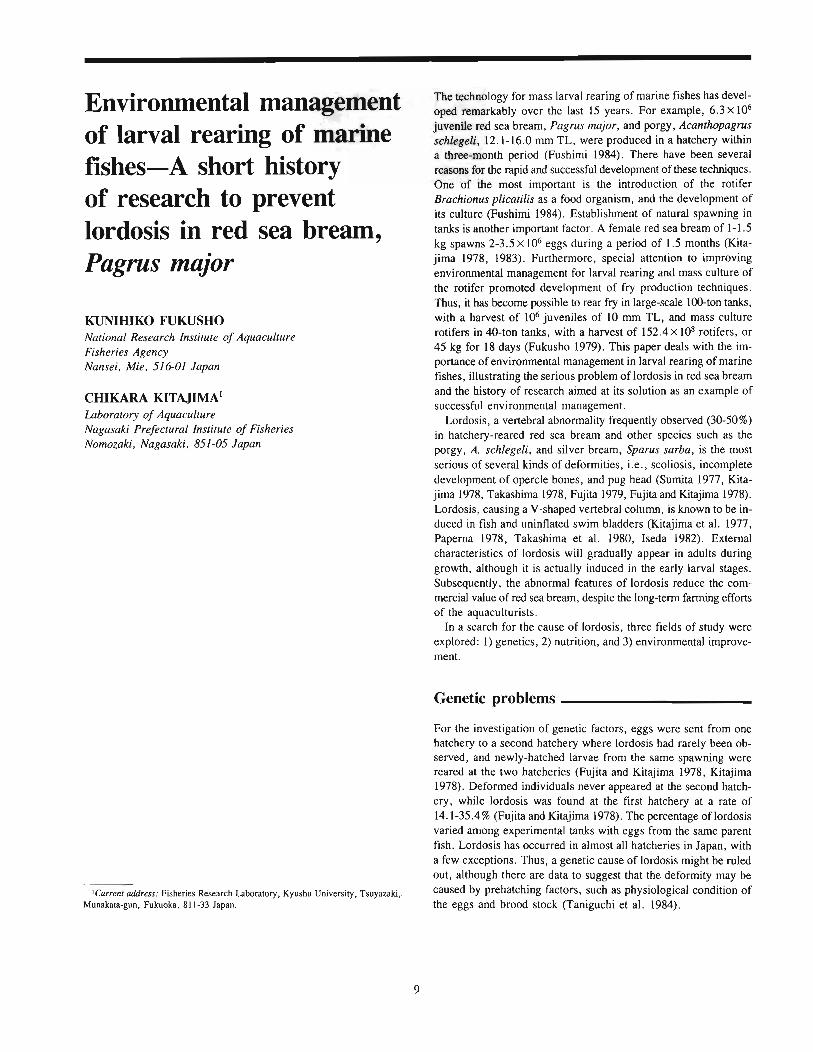
Figure 1Deformed backbone (lordosis) of cultured red
sea bream, Pagrus major.
Figure 2Lordosis in hatchery-reared red sea breamwell correlated with development of a swimbladder. (Top) A deformed backbone withundeveloped swim bladder. (Bottom) A normal backbone with a well inflated swimbladder.
10
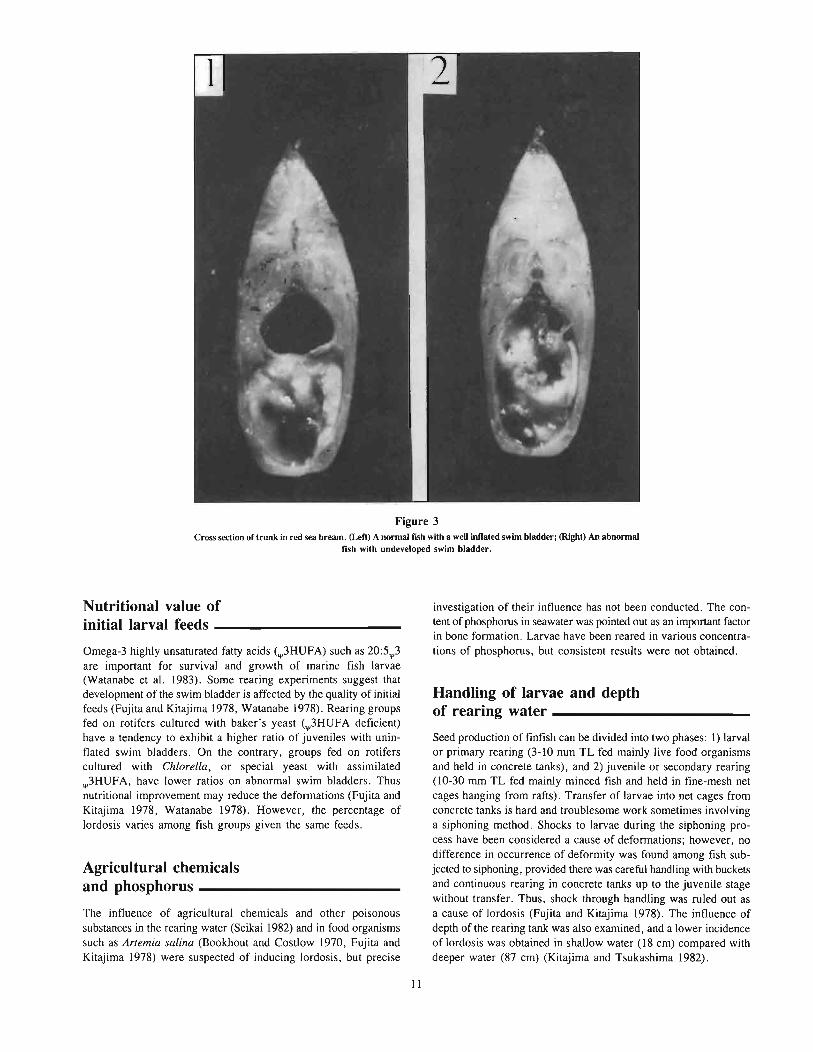
Figure 3Cross section of trunk in red sea bream. (Left) A nonnal fISh with a weU inflated swim bladder; (Right) An abnonnal
fish with undeveloped swim bladder.
Nutritional value ofinitial larval feeds _
Omega-3 highly unsaturated fatty acids (III3HUFA) such as 20:51113are important for survival and growth of marine fish larvae(Watanabe et al. 1983). Some rearing experiments suggest thatdevelopment of the swim bladder is affected by the quality of initialfeeds (Fujita and Kitajima 1978, Watanabe 1978). Rearing groupsfed on rotifers cultured with baker's yeast (III3HUFA deficient)have a tendency to exhibit a higher ratio of juveniles with uninflated swim bladders. On the contrary, groups fed on rotiferscultured with Chlorella, or special yeast with assimilated1113HUFA, have lower ratios on abnormal swim bladders. Thusnutritional improvement may reduce the deformations (Fujita andKitajima 1978, Watanabe 1978). However, the percentage oflordosis varies among fish groups given the same feeds.
Agricultural chemicalsand phosphorus ___
The influence of agricultural chemicals and other poisonoussubstances in the rearing water (Seikai 1982) and in food organismssuch as Anemia salina (Bookhout and Costlow 1970, Fujita andKitajima 1978) were suspected of inducing lordosis, but precise
11
investigation of their influence has not been conducted. The content of phosphorus in seawater was pointed out as an important factorin bone formation. Larvae have been reared in various concentrations of phosphorus, but consistent results were not obtained.
Handling of larvae and depthof rearing water _
Seed production of finfish can be divided into two phases: I) larvalor primary rearing (3-10 mrn TL fed mainly live food organismsand held in concrete tanks), and 2) juvenile or secondary rearing(10-30 mrn TL fed mainly minced fish and held in fine-mesh netcages hanging from rafts). Transfer of larvae into net cages fromconcrete tanks is hard and troublesome work sometimes involvinga siphoning method. Shocks to larvae during the siphoning process have been considered a cause of deformations; however, nodifference in occurrence of deformity was found among fish subjected to siphoning, provided there was careful handling with bucketsand continuous rearing in concrete tanks up to the juvenile stagewithout transfer. Thus, shock through handling was ruled out asa cause of lordosis (Fujita and Kitajima 1978). The influence ofdepth of the rearing tank was also examined, and a lower incidenceoflordosis was obtained in shallow water (18 cm) compared withdeeper water (87 cm) (Kitajima and Tsukashima 1982).
Relationship between aerationand deformation _
Optimal amounts of aeration for larval rearing were examined inI-ton circular tanks. Lordosis was rarely found in fish groups rearedat an aeration rate of 50-100 mLlminute, while a high percentageof deformity appeared in non-aerated tanks and with aeration greaterthan 500 mL/minute (lseda et al. 1982). Moderate and uniform watercurrents led to lower percentages of lordosis and higher survivalrates, even without aeration; while survival rates and perc(:ntagesof fishes with inflated swim bladders were low in tanks withoutaeration and current. Thus, it was found that moderate current,suitable aeration, and weak sprinkling of water on the surface ofrearing water during the stage of mouth opening (4-6 days afterhatching) were effective methods of reducing the incidence oflordosis (lseda 1982).
Demonstration ofair gulping theory _
Rhythmical movements toward the surface by larvae at the mouthopening stage were observed by Yamashita (1963, 1982) and thesignificance of this behavior was evaluated in view of r.ormalorganogenesis. Also, the swim bladder was found to be inflatedfor short periods at the size of 3.5 rum TL, 5-6 days after hatchingat a temperature of 18-22°C (Kitajima et al. 1981). According tothese facts, it was considered that the abnormally developed swimbladder of larvae was due to a failure to gulp air at the surface during this early stage.
Rearing experiments were conducted to examine this hypothesis(Kitajima et al. 1981). One tank was sealed with a layer of liquidparaffin and the other left open as a control. Over 90% of the larvae had normal swim bladders at about 7 days after initial feeding(4.2 rum TL) in the control tank, whereas none were inflated inthe sealed tank. Thus, it has been shown that gulping air at the surface is essential for initial swim bladder inflation (Kitajima et al.1981). This hypothesis was proved by histological observations during the development of the swim bladder (physostomous to physoclistous stages) (Takashima et al. 1980). The importance of airgulping during the physostomous stage was also demonstrated inother species (Doroshev and Cornacchia 1979, Doroshev et al.1981).
Larval rearing procedures forprevention of lordosis _
Lordosis is rarely found in hatchery-reared red sea bream at present,since environmental conditions in larval rearing tanks have beenwell managed, with the application of information and techniquesobtained through previous research, i.e., to (I) supply a moderatecurrent and aeration (50-100 mLlrnin' ton), (2) clean the surfaceso that air will penetrate into the rearing water, (3) supply waterwith a sprinkler on the surface of rearing water, (4) introduce newlyhatched larvae at fairly low stocking densities (1-2 x 10⁴ individuals/m3), (5) select individuals with well developed swim bladders by the method of specific gravity (Nagaike and Sasaki 1981)or phototaxis (Iseda 1982), and (6) feed the larvae with rotifers ofgood nutritional value.
12
Acknowledgments _
We wish to express our sincere thanks to Warren D. Nagata andRyo Suzuki for their critical reading of this manuscript.
Citations _
Bookhout, C.G., and J.D. Costlow, Jr.1970. Nutritional effect of Artemia salina from different locations on larval
development of crabs. Helgol. Wiss. Meeresunters 20:435-442.Doroshev, S.I., and J.W. Cornaccbia.
1979. Initial swimbladder inflation in the larvae of Tilapia mossambica andMorone saxalilis. Aquaculture 16:57-66.
Dorosbev, S.I., J.W. Cornacchia, and K. Hogan.1982. Initial swim bladder inflation in the larvae of physoclistous fishes and its
importance for larval culture. Rapp. P.-V. Reun. Cons. Int. Explor. Mer178:495-500.
Fujita, S.1979. Culture of red sea bream, Pagrus major, and its food. In Styczynska
Jurewict, E., T. Backiel, E. Jaspers, and G. Persoone. (eds.), Cultivation ofFish and Its Live Food. Spec. pub\. 4, p. 183-197. Eur. Maricult. Soc., Belgium.
Fujita, S., and C. Kitajima.1978. Occurrence of the lordotic deformity in larvae and juveniles of red sea
bream. Kaiyou-Kagaku (Mar. Sci. Monthly) 107:721-727 (in Jpn.).Fukusbo, K.
1979. Studies on fry production of Japanese striped knifejaw Oplegnalhusfascialus, with special reference to feeding ecology and mass culture of foodorganisms. Spec. rep. 6, Nagasaki Prefect. Inst. Fish., 173 p. (in Jpn., Engl.summ.).
Fusbimi, T.1984. The present status of seedlings technology for red sea bream and black
sea bream, and mechanization for their mass production. In Inoue, H., (ed.),The Present Status of Development and Researches in Technology of Fisheries,p. 68-79. Guzyutu Joho-Center, Osaka, Japan (in Jpn.).
Iseda, A.1982. Prevention of lordosis in the juvenile of red sea bream, Pagrus major
reared in ponds - III. Relationship between the initial conditions of rearing environment and gas content. Bull. Kumamoto Prefect. Inst. Fish. 2:25-45 (inJpn.).
Iseda, H., M. Ishihara, S. Sumita, M. Owaki, and S. Tabata.1982. Prevention of lordosis in the juvenile of red sea bream, Pagrus major
reared in ponds - 11. Relationship between the initial rearing-conditions andthe lordotic deformity. Bull. Kumamoto Prefect. Inst. Fish. 1:9-17 (in Jpn.).
Kitajima, C.1978. Aquisition of fertilized eggs and mass-culture of juveniles of red sea bream,
Pagrus major. Spec. rep. 5. Nagasaki Prefect. Inst. Fish., 92 p. (in Jpn., Eng\.summ.).
1983. The present status of marine fish seed producing technique in Japan. InFuentes, H.R., J.G. GastilIoa, and L.H. Disalbo (eds.), International Symposium on Advanccs and Perspectives of Aquaculture in Chile, p. 375-390.Universidad del Norte, Coquimbo, Chile.
Kitajima, C., H. Iwamoto, and S. Fujita.1977. Relationship between curvature of vertebral column and hatchery-reared
undeveloped swimbladder in red sea bream, Pagrus major. Bull. NagasakiPrefect. Inst. Fish. 8: 137-140 (in Jpn.).
Kitajima, C., Y. Tsukashima, S. Fujita, T. Watanabe, and Y. Yone.1981. Relationship between uninflated swim bladders and lordosis deformity
in hatchery-reared red sea bream Pagrus major. Bull. Jpn. Soc. Sci. Fish.47:1289-1294 (in Jpn., Engl. summ.).
Kitajima, C., and Y. Tsukashima.1982. Effects of depth of the rearing tank on the incidence of swim bladder in
flation of larval red sea bream, Pagrus major. Bull. Nagasaki Prefect. Inst.Fish. 8:137-140 (in Jpn.).
Nagaike, N., and Y. Sasaki.1981. The mass production and breeding in hatchery reared red sea bream,
Pagrus major (Temminck and Schlegel) - I. Mass selection of fish with abnormal airbladder. Aquiculture (Sendai) 28: 196-201 (in Jpn.). See Suisan Zoshoku(Fish. Cult.).
Paperna, I.1978. Swimbladder and skeletal deformation in hatchery bred Sparus surata.
J. Fish. BioI. 12: 109-114.
Seikai, T.1982. Acute toxicity of organophosphorous insecticides on the developmental
stage of eggs, larvae and juveniles of Japanese striped knifejaw, Oplegnathusfascia/us. Bull. lpn. Soc. Sci. Fish. 48:599-603 (in lpn., Eng!. summ.).
Sumita, S.1977. Deformations found in hatchery-reared red sea bream. Spec. rep. 46, Fish.
Exp. Stn., Kumamoto Prefect., p. 33-42 (in lpn., Eng!. summ.).Takashima, F.
1978. Vertebral malformation in hatchery-reared red sea bream, Chrysophrysmajor. Bul!. lpn. Soc. Sci. Fish. 44:435-443 (in lpn., Eng!. summ.).
Takashima, F., Y. Arai, and M. Nomura.1980. Abnormal development of the swimbladder in hatchery-reared red sea
bream, Chrysophrys major. l. Tokyo Univ. Fish. 67:67-73 (in lpn., Eng!.summ.).
Taniguchi, N., K. Azuma, and S. Umeda.1984. Difference due to parents in incidence of vertebral malformation in arti
ficially bred red sea bream. Bull. lpn. Soc. Sci. Fish. 50:787-792.Yamashita, K.
1963. Fundamental studies on the culture of red sea bream, Pagrus major - 1.Ethological observation of larvae in tanks. Aquiculture (Sendai) 11: 189-209(in lpn.). See Suisan Zoshoku (Fish. Cult.).
1982. Differentiation of the swimbladder structure in larvae of the red seabreamPagrus major. lpn. l. lchthyo!. 29: 193-202 (in lpn., Eng!. summ.).
Watanabe, T.1978. Nutritional value of food organisms in view of lipids. In Aquaculture and
Lipid in Feeds, p. 93-111. lpn. Soc. Sci. Fish., Koseisha-Koseikaku, Tokyo(in lpn.).
Watanabe, T., C. Kitajima, and S. Fujita.1983. Nutritional value of live organisms used in Japan for mass propagations
of fish: A review. Aquaculture 34: 115-143.
13

Salinity tolerances ofmarine bivalves
SHOJI FUNAKOSHITOHRU SUZUKIKOJI WADANational Research Institute of AquacultureFisheries AgencyNansei, Mie, 516-01 Japan
15
In Japan, many kinds of bivalves have been used in a variety ofrecipes. These bivalves are supplied from fishing and aquaculture.The latter is divided into two methods: hanging and sowing. In thehanging method, bivalves are hung from a raft or line, and put intoan environment which is different from that of their natural habitat.Thus, the species suitable for the hanging culture method must havean ability to tolerate the change of environment. In the sowingmethod, the environmental conditions of the culture grounds arealso very important for the growth and survival of the plantedbivalves. Accordingly, knowledge of the physiological and ecological characteristics of bivalves, and their limits of tolerance forenvironmental conditions, must be accumulated in more detail forfurther development of management techniques and culture methods.Previously, the relationship between habitat and osmoregulatoryability of bivalves, with special reference to free amino acids foundin body fluids, was reported at the UJNR meeting in 1981 (Wada1984). The present paper deals with shell-closing behavior of severalspecies of bivalves and their ability to tolerate salinity changes.
Materials and methods _
Experiments were carried out with II species of bivalves (commercial size) shown in Table I. After collection, the bivalves werekept in basket nets at Ago bay, Mie Prefecture, for at least I weekbefore use. The samples of each species were divided into twogroups. One group was used for examining the behavioral responseof closing the shell valves tightly after salinity changes. In the second group, a plug was inserted between shell valves to allow theexternal medium to enter the mantle cavity freely; this group wasused for determination of salinity tolerance limits. The bivalves ofeach group were transferred into five containers filled with 25,50,100 (full-strength), 150, and 200% seawater, and maintained for2 days. All the media were changed every day. Lower salinity mediawere prepared by diluting seawater with wellwater, and high salinitymedia by adding instant ocean salts to seawater. The experimentswere conducted at water temperatures of 22-24°C with the exception of 14°C for Patinopecten yessoensis, which lives in cold seas.
Determination of osmotic pressure
Mantle cavity fluid, hemolymph, and the seawater medium weresampled at 2-4,24, and 48 hrs of exposure to each medium. Theirosmotic pressures were measured with a freezing-point depressionosmometer (Advanced Instruments, Inc., Model 3CII).
Determination of survival
Three to five individuals of the plugged group in each medium wereremoved from the container to the basket net, and suspended froma raft at 2-4, 24, and 48 hrs of exposure. After one week, theirsurvival was determined.
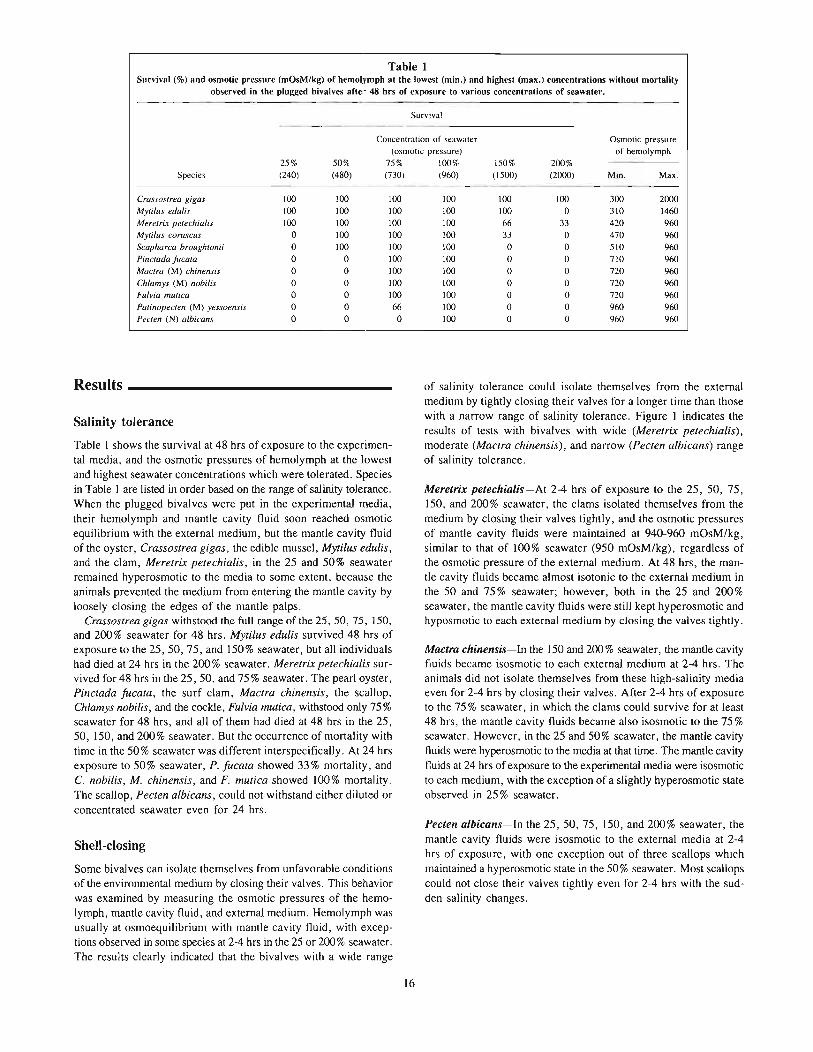
Table 1Survival (%) and osmotic pressure (mOsM/kg) of hemolymph at the lowest (min.) and highest (max.) concentrations without mortality
observed in the plugged bivalves aftel: 48 hrs of exposure to various concentrations of seawater.
Survival
Concentration of seawater Osmotic pressure(osmotic pressure) of hemolymph
25% 50% 75% 100% 150% 200%Species (240) (480) (730) 1960) (1500) (2000) Min. Max.
Crassostrea gigas 100 100 100 100 100 100 300 2000Mytilus edulis 100 100 100 100 100 0 310 1460Meretrix petechialis 100 100 100 100 66 33 420 960Mytilus coruscus 0 100 100 100 33 0 470 960Scapha rca broughtonii 0 100 100 100 0 0 510 960Pinctada fucata 0 0 100 100 0 0 710 960Mactra (M) chinensis 0 0 100 100 0 0 720 960Chlamys (M) nobilis 0 0 100 100 0 0 720 960Fulvia mutica 0 0 100 100 0 0 no 960Patinopecten (M) yessoensis 0 0 66 100 0 0 960 960Pecten (N) albicans 0 0 0 100 0 0 960 960
Results _
Salinity tolerance
Table I shows the survival at 48 hrs of exposure to the experimental media, and the osmotic pressures of hemolymph at the lowestand highest seawater concentrations which were tolerated. Speciesin Table I are listed in order based on the range of salinity tolerance.When the plugged bivalves were put in the experimental media,their hemolymph and mantle cavity fluid soon reached osmoticequilibrium with the external medium, but the mantle cavity fluidof the oyster, Crassostrea gigas, the edible mussel, Mytilus edulis,and the clam, Meretrix petechialis, in the 25 and 50% seawaterremained hyperosmotic to the media to some extent, because theanimals prevented the medium from entering the mantle cavity byloosely closing the edges of the mantle palps.
Crassostrea gigas withstood the full range of the 25,50,75, 150,and 200% seawater for 48 hrs. Mytilus edulis survived 48 hrs ofexposure to the 25,50,75, and 150% seawater, but all individualshad died at 24 hrs in the 200% seawater. Meretrix petechialis survived for 48 hrs in the 25, 50, and 75 % seawater. The pearl oyster,Pinctada fucata, the surf clam, Mactra chinensis, the scallop.Chlamys nobilis, and the cockle, Fulvia mutica, withstood only 75%seawater for 48 hrs, and all of them had died at 48 hrs in the 25,50, 150, and 200% seawater. But the occurrence of mortality withtime in the 50% seawater was different interspecifically. At 24 hrsexposure to 50% seawater, P. fucata showed 33% mortality, andC. nobilis, M. chinensis, and F. mutica showed 100% mortality.The scallop, Pecten albicans, could not withstand either diluted orconcentrated seawater even for 24 hrs.
Shell-closing
Some bivalves can isolate themselves from unfavorable conditionsof the environmental medium by closing their valves. This behaviorwas examined by measuring the osmotic pressures of the hemolymph, mantle cavity fluid, and external medium. Hemolymph wasusually at osmoequilibrium with mantle cavity fluid, with exceptions observed in some species at 2-4 hrs in the 25 or 200% seawater.The results clearly indicated that the bivalves with a wide range
16
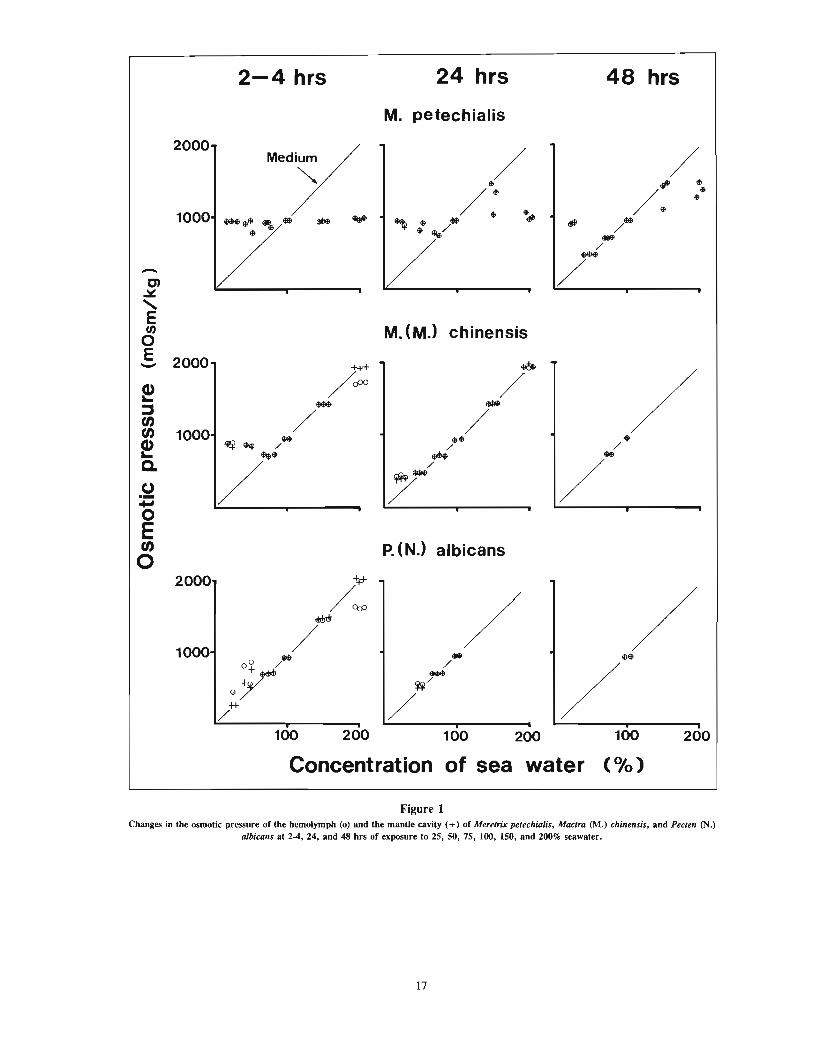
of salinity tolerance could isolate themselves from the externalmedium by tightly closing their valves for a longer time than thosewith a narrow range of salinity tolerance. Figure 1 indicates theresults of tests with bivalves with wide (Meretrix petechialis),moderate (Mactra chinensis), and narrow (Pecten albicans) rangeof salinity tolerance.
Meretrix petechialis-At 2-4 hrs of exposure to the 25, 50, 75,150, and 200% seawater, the clams isolated themselves from themedium by closing their valves tightly, and the osmotic pressuresof mantle cavity fluids were maintained at 940-960 mOsM/kg,similar to that of 100% seawater (950 mOsM/kg), regardless ofthe osmotic pressure of the external medium. At 48 hrs, the mantle cavity fluids became almost isotonic to the external medium inthe 50 and 75% seawater; however, both in the 25 and 200%seawater, the mantle cavity fluids were still kept hyperosmotic andhyposmotic to each external medium by closing the valves tightly.
Mac/rOo chinensis-In the 150 and 200% seawater, the mantle cavityfluids became isosmotic to each external medium at 2-4 hrs. Theanimals did not isolate themselves from these high-salinity mediaeven for 2-4 hrs by closing their valves. After 2-4 hrs of exposureto the 75 % seawater, in which the clams could survive for at least48 hrs, the mantle cavity fluids became also isosmotic to the 75%seawater. However, in the 25 and 50% seawater, the mantle cavityfluids were hyperosmotic to the media at that time. The mantle cavityfluids at 24 hrs of exposure to the experimental media were isosmoticto each medium, with the exception of a slightly hyperosmotic stateobserved in 25 % seawater.
Pecten albicans-In the 25, 50, 75, 150, and 200% seawater, themantle cavity fluids were isosmotic to the external media at 2-4hrs of exposure, with one exception out of three scallops whichmaintained a hyperosmotic state in the 50% seawater. Most scallopscould not close their valves tightly even for 2-4 hrs with the sudden salinity changes.
2-4 hrs 24 hrs 48 hrs
200
/
/100200100
../
<illl$
~/
/
~
/-/
/
M. petechialis
M. (MJ chinensis
P. (N.) albicans
200100
MedY10007" ......
1000
2000
-C)~
"Eoo.§. 2000
2000
!~enen!Q.
CJ.-..oEeno
Concentration of sea water (0/0)
Figure 1Changes in the osmotic pressure of the hemolymph (0) and the mantle cavity (+) of Meretrix petechialis, Mactra (M.) chinensis, and Pecten (N.)
albicans at 2-4, 24, and 48 hrs of exposure to 25, 50, 75, 100, ISO, and 200% seawater.
17
Discussion _
Marine bivalves are osmoconfonners. Their hemolymph is in osmoequilibrium with the external medium. They can adapt to environmental salinity changes by regulating the concentrations of ions andintracellular free amino acids (Robertson 1964, Somero and Bowlus1983). The range of salinity tolerance, however, is different amongspecies and affected mainly by the size of the free amino-acid poolavailable for intracellular volume regulation (Gainey and Greenberg1977).
When salinity changes occur in the environmental medium,besides the adjustment by metabolic regulation mentioned above,bivalves can also close their valves tightly, retreat into burrows,or escape from unfavorable salinity by swimming, depending ontheir capabilities for movement.
The habitats of the bivalves used in this experiment are as follows.Crassostrea gigas is common in the intertidal zone and attachesto rocks. Mytilus edulis and Meretrix petechialis live from theintertidal zone to the upper part of the infralittoral zone where thesalinity is changeable. The former is an attached surface-dwellerand the latter a sandybottom burrower. Mytilus coruscus and Pinctada fucata live in the upper part of the infralittoral zone and aresurface dwellers. Chlamys nobilis is found in the upper part of theinfralittoral zone and lives freely or attaches only weakly to thebottom surface by byssus threads. Mactra chinensis, Scapharcabroughtonii, and Fulvia mutica are bottom burrowers in the upperto middle part of the infralittoral zone. Patinopecten yessoensis andPecten albicans live freely on the bottom surface in the middle tolower part of the infralittoral zone.
Crassostrea gigas, M. petechialis, and M. edulis live in the intertidal zone or shallow water with changeable salinity. They can withstand a wide range of salinity, and were found to be able to closethe shell valves tightly for a long time. On the contrary, P. yessoensis and P. albicans were found to withstand diluted or concentrated seawater media poorly, due to lack of ability to close theirvalves tightly and continuously for a long time. Consequently, thefollowing conclusions were reached. Bivalves living in the intertidal zone and shallow water with changeable salinity can wait forrecovery of salinity by closing their valves tightly after sudden salinity change of ambient water, and can also adapt themselves to awide range of salinity by metabolic regulation. The bivalves, whichlive in the lower part of the infralittoral zone and can also swimwith well developed adductor muscle and mantle palps, have poormetabolic abilities for osmoregulation, but they can escape fromunfavorable salinity conditions by swimming.
In a long evolutionary history, in which bivalves have dispersedinto various habitats, they have adaptively acquired the metabolicfunction and behavior suitable for these habitats. The knowledgeof physiological and ecological characteristics will provide valuableinformation for the development of culture techniques. For example, the abovementioned knowledge of behavior in the presence ofsalinity changes could be useful in the search for suitable culturegrounds and in the management of culture by the hanging method.The knowledge about shell-closing ability has been used in brinetreatment (Waki and Yamaguchi 1964) to extenninate the mudworm, Polydora, which penetrates the shells of pearl oysters. Anoutline of the treatment is as follows: The pearl oyster is first dippedinto freshwater for 15 minutes to make shell valves close tightly,and then in 22 % brine for 20 minutes. By this treatment Pol)dorais killed without any mortality of the pearl oyster.
18
Citations _
Gainey, J.F., Jr., and M.J. Greenberg.
1977. Physiological basis of the species abundance-salinity relationship inmolluscs: A speculation. Mar. BioI. 40:41-49.
Robertson, J.D.
1964. Osmotic and ionic regulation. In Physiology of Mollusca, Vol. I, p.283-308. Acad. Press, NY.
Somero, G.N., and R.D. Bowlus.1983. Osmolytes and metabolic end products of molluscs: The design of com
patible solute system. In The Mollusca, Vol. 2, p. 77-100. Acad. Press, NY.Wada, K.
1984. Osmoregulation in marine bivalves. In Sindermann, C. J. (ed.), Proc.9th/10th U.S.-Japan Meetings on Aquaculture, p. 89-92. NOAA Tech. Rep.NMFS 16 (Nat!. Oceanic Atmos. Adm., Natl. Mar. Fish. Serv.), Seattle, WA98115.
Waki, S., and K. Yamaguchi.
1964. Extermination of mud worm, penetrating into the shell of the pearl oyster,by brine treatment. Kaiho 64: 15-25. Natl. Fed. Pearl Cull. Co-op. Assoc. (inJpn.).
Temperature preference ofimmature horse mackerel,Trachurus japonicus, ina vertical temperaturegradient
ASTUSHI FURUKAWA1
HIROSHI FUKATAKISHUJI TSUCHIDAMarine Ecology Research InstituteCentral LaboratoryIwawada, Onjuku Isumigun,Chiba, 299-51 Japan
lPresent address: Yokohama-shi, Isogo-ku, Mori, 1-5-21-1036 Japan.
19
In the past, there was concern in Japan that heavy mortality of fishesinhabiting coastal waters might occur when large-scale fossil fueland nuclear power plants were constructed in order to meet the increasing demand for electric power, and huge amounts of thermaleffluent would be released into coastal areas. However, mortalityof fish caused by the thermal effluent has been found to be negligible in recent years. Therefore, research into thermal effects onfishes has concentrated on behavioral studies.
One of the fish behavioral programs related to thermal effluentfrom power plants is a study of the temperatures preferred andavoided by various fish species. The Marine Ecology ResearchInstitute is presently conducting studies of this kind using commercially important fishes which inhabit the coastal waters of Japan.The research is conducted under laboratory conditions, with thefinancial support of the Japanese Government.
In the study reported here, behavior of horse mackerel, Trachurusjaponicus, an important coastal fish, was examined in a verticaltemperature-gradient aquarium.
Materials and methods _
Immature horse mackerel, Trachurus japonicus (Temminck etSchlegel), used in this study were of culture origin. Fish culturedin fish farms in Shizuoka Prefecture were brought to the laboratory in October 1983. Fish were kept in 0.5 m3 indoor stock tankswith a continuous flow of sand-filtered seawater and fed a moistdiet prepared with commercial sea bream feed supplemented byraw fish. Rearing temperature of the fish was not controlled. Holding mortality was negligible.
Prior to the experiment, the fish were randomly divided into threegroups. Each group was transferred from indoor stock tanks toacclimation tanks (3 m3) located in a rearing room and acclimatedto one of three temperatures (20, 25, and 28°C). Fish were acclimated to these temperature levels at a rate of 1°C per day andheld at the final temperature level for at least one week. Duringthis period, the fish were fed twice a day.
The vertical ternp~rature gradient device used in this study hasal ready been reported at the annual meeting of the Japanese Societyof Scientific Fisheries by Fukataki and Tsuchida (1986). This devicecan be divided into three parts: experimental aquarium, temperaturecontrol system, and monitoring and recording system. The experimental aquarium (Fig. I) (183 cm deep, 172 cm long, and 74cm wide) was situated in a lightproof room. A plexiglass panel wasplaced in front of it through which the fish were observed by amonitoring video camera. Horizontal lines were drawn on the backpanel to delineate observational zones of equal width (15 cm). Thesewere numbered from I to II in order of decreasing depth. Totalseawater volume in the aquarium was approximately 1,485 liters.Light was supplied by three pairs of 40-watt fluorescent lampssuspended over the center of the aquarium.
The temperature-controlled water entered the experimental aquarium through eleven water inflow pipes arranged at intervals of IScm vertically on the left side of the aquarium, and flowed out througheleven water outflow pipes on the right side of the aquarium.
The desired thermal gradient in the aquarium was determinedby the temperature-control computer system (Fig. 2). Vertical watertemperature profiles were measured with a series of eleven platinum
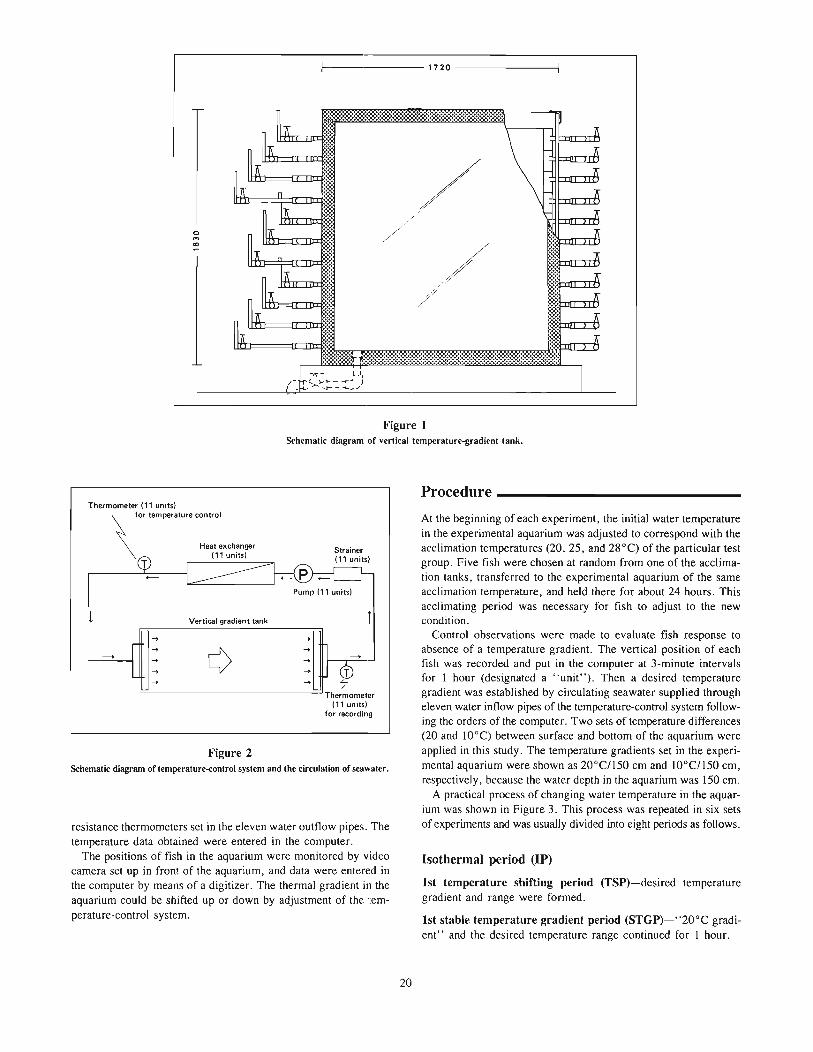
1---------- 1720 ----------l
a.....,
-".- H!.. },.-t-_ ......... "" }................ - ""'-_/
Figure 1Schematic diagram of vertical temperature-gradient tank.
Pump (11 units)
=---------------=::JThermometer(11 unitsl
for recording
1st stable temperature gradient period (STGP)-"20°C gradient" and the desired temperature range continued for I hour.
1st temperature shifting period (TSP)-desired temperaturegradient and range were formed.
Isothermal period (IP)
Procedure _
At the beginning of each experiment, the initial water temperaturein the experimental aquarium was adjusted to correspond with theacclimation temperatures (20, 25, and 28°C) of the particular testgroup. Five fish were chosen at random from one of the acclimation tanks, transferred to the experimental aquarium of the sameacclimation temperature, and held there for about 24 hours. Thisacclimating period was necessary for fish to adjust to the newcondition.
Control observations were made to evaluate fish response toabsence of a temperature gradient. The vertical position of eachfish was recorded and put in the computer at 3-minute intervalsfor I hour (designated a "unit"). Then a desired temperaturegradient was established by circulating seawater supplied througheleven water inflow pipes of the temperature-control system following the orders of the computer. Two sets of temperature differences(20 and lO°C) between surface and bottom of the aquarium wereapplied in this study. The temperature gradients set in the experimental aquarium were shown as 20°C1150 cm and WOC/150 cm,respectively, because the water depth in the aquarium was 150 cm.
A practical process of changing water temperature in the aquarium was shown in Figure 3. This process was repeated in six setsof experiments and was usually divided into eight periods as follows.
Vertical gradient tank
Thermometer (11 units)
\
for temperature control
Heat exchanger(11 urnts)
,.---------::::--l
resistance thermometers set in the eleven water outflow pipes. Thetemperature data obtained were entered in the computer.
The positions of fish in the aquarium were monitored by videocamera set up in front of the aquarium, and data were entered inthe computer by means of a digitizer. The thermal gradient in theaquarium could be shifted up or down by adjustment of the ':emperature-control system.
Figure 2Schematic diagram of temperature~ontrolsystem and the circulation of seawater.
20
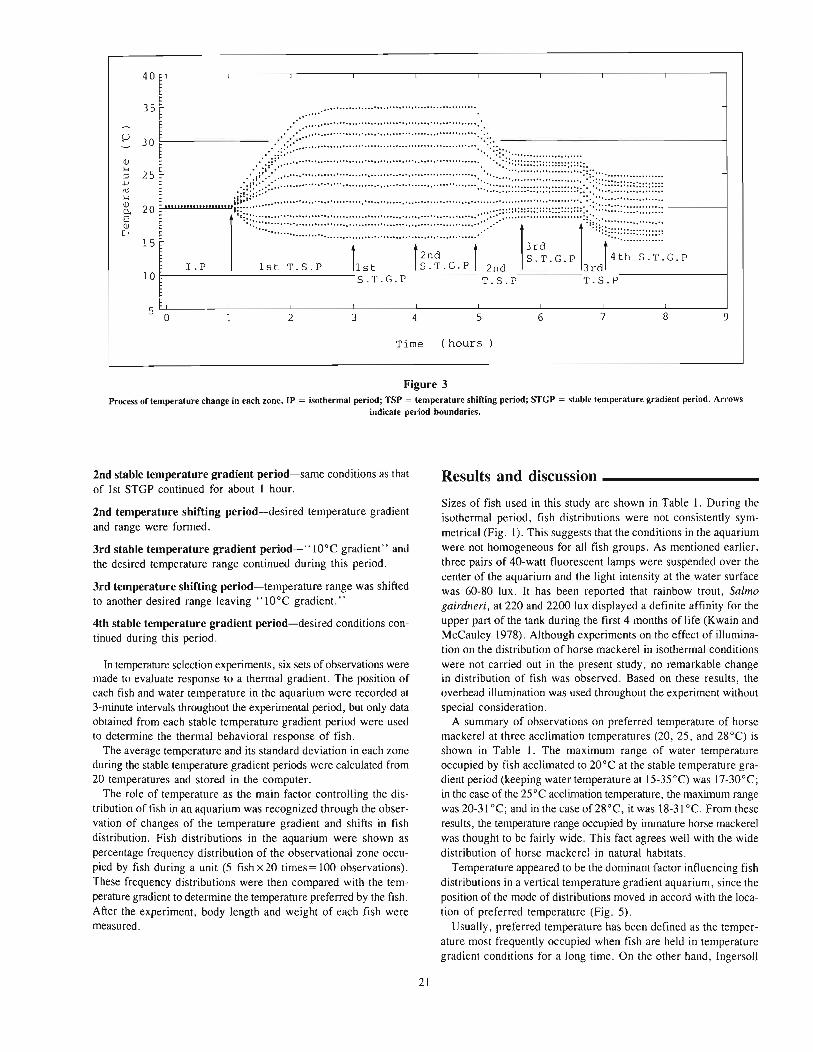
......................................................... .
E-------- :..::..:.> ::.::'::-..-.-------------------i.......................................................................................................
. '.'. " " ..............................................................................................................::::::::::::::::::::::::::::::::::::::::::::::::::------t
.. ,..'
................1 s t T. S . P ········f~·~···········fi~~·:·~·~·~··f 2nd ~~~ . G . P 3rJ ~.~~...~.:~.: G . P
E------------- S . T . G . P T.S.P T.S.P
2 3 4 5 6 7 8 9
Time ( hours
Figure 3Process of temperature change in each zone. IP = isothermal period; TSP = temperature shifting period; STCP = stable temperature gradient period. Arrows
indicate period boundaries.
2nd stable temperature gradient period-same conditions as thatof 1st STGP continued for about I hour.
2nd temperature shifting period-desired temperature gradientand range were formed.
3rd stable temperature gradient period-"lOoC gradient" andthe desired temperature range continued during this period.
3rd temperature shifting period-temperature range was shiftedto another desired range leaving" WOC gradient."
4th stable temperature gradient period-desired conditions continued during this period.
In temperature selection experiments, six sets of observations weremade to evaluate response to a thermal gradient. The position ofeach fish and water temperature in the aquarium were recorded at3-minute intervals throughout the experimental period, but only dataobtained from each stable temperature gradient period were usedto determine the thermal behavioral response of fish.
The average temperature and its standard deviation in each zoneduring the stable temperature gradient periods were calculated from20 temperatures and stored in the computer.
The role of temperature as the main factor controlling the distribution of fish in an aquarium was recognized through the observation of changes of the temperature gradient and shifts in fishdistribution. Fish distributions in the aquarium were shown aspercentage frequency distribution of the observational zone occupied by fish during a unit (5 fishx20 times = 100 observations).These frequency distributions were then compared with the temperature gradient to determine the temperature preferred by the fish.After the experiment, body length and weight of each fish weremeasured.
21
Results and discussion _
Sizes of fish used in this study are shown in Table I. During theisothermal period, fish distributions were not consistently symmetrical (Fig. 1). This suggests that the conditions in the aquariumwere not homogeneous for all fish groups. As mentioned earlier,three pairs of 40-watt fluorescent lamps were suspended over thecenter of the aquarium and the light intensity at the water surfacewas 60-80 lux. It has been reported that rainbow trout, Salmogairdneri, at 220 and 2200 lux displayed a definite affinity for theupper part of the tank during the first 4 months of life (Kwain andMcCauley 1978). Although experiments on the effect of illumination on the distribution of horse mackerel in isothermal conditionswere not carried out in the present study, no remarkable changein distribution of fish was observed. Based on these results, theoverhead illumination was used throughout the experiment withoutspecial consideration.
A summary of observations on preferred temperature of horsemackerel at three acclimation temperatures (20, 25. and 28°C) isshown in Table I. The maximum range of water temperatureoccupied by fish acclimated to 20°C at the stable temperature gradient period (keeping watertemperature at 15-35°C) was 17-30°C;in the case of the 25°C acclimation temperature, the maximum rangewas 20-31 °C; and in the case of28°C, it was 18-31 °c. From theseresults, the temperature range occupied by immature horse mackerelwas thought to be fairly wide. This fact agrees well with the widedistribution of horse mackerel in natural habitats.
Temperature appeared to be the dominant factor influencing fishdistributions in a vertical temperature gradient aquarium, since theposition of the mode of distributions moved in accord with the location of preferred temperature (Fig. 5).
Usually, preferred temperature has been defined as the temperature most frequently occupied when fish are held in temperaturegradient conditions for a long time. On the other hand, Ingersoll
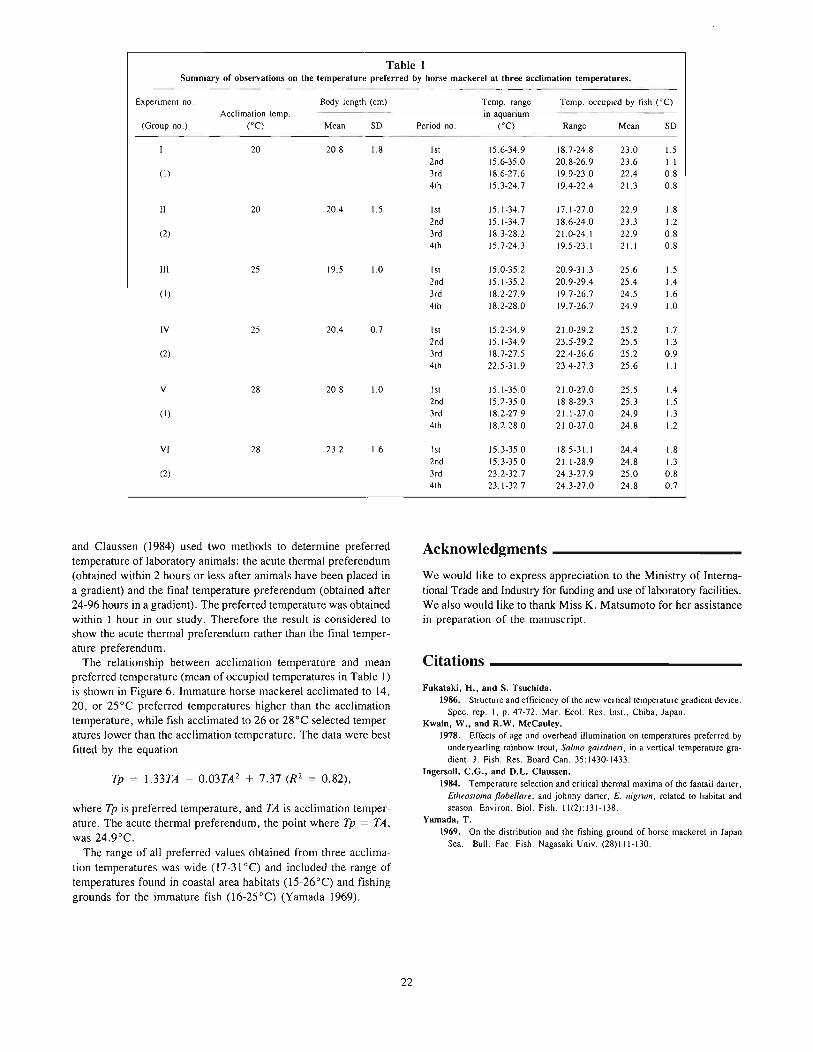
Table 1Summary of observations on the temperature preferred by horse mackerel at three acclimation temperatures.
Experiment no. Body length (em) Temp. range Temp. occupied by fish (0C)Acclimation temp. in aquarium
(Group no.) (0C) Mean SD Period no. (OC) Range Mean SD
20 20.8 1.8 1st 15.6-34.9 18.7-24.8 23.0 1.52nd 15.6-35.0 20.8-26.9 23.6 1.1
(I) 3rd 18.6-27.6 19.9-23.0 22.4 0.84th 15.3-24.7 19.4-22.4 21.3 0.8
II 20 20.4 1.5 1st 15.1-34.7 17.1-27.0 22.9 1.82nd 15.1-34.7 18.6-24.0 23.3 1.2
(2) 3rd 18.3-28.2 21.0-24.1 22.9 0.84th 15.7-24.3 19.5-23.1 21.1 0.8
111 25 19.5 1.0 1st 15.0-35.2 20.9-31.3 25.6 1.52nd 15.1-35.2 20.9-29.4 25.4 1.4
(I) 3rd 18.2-27.9 19.7-26.7 24.5 1.64th 18.2-28.0 19.7-26.7 24.9 1.0
IV 25 20.4 0.7 1st 15.2-34.9 21.0-29.2 25.2 1.72nd 15.1-34.9 23.5-29.2 25.5 1.3
(2) 3rd 18.7-27.5 22.4-26.6 25.2 0.94th 22.5-31.9 23.4-27.3 25.6 1.1
V 28 20.8 1.0 1st 15.1-35.0 21.0-27.0 25.5 1.42nd 15.2-35.0 18.8-29.3 25.3 1.5
(I) 3rd 18.2-27.9 21.1-27.0 24.9 1.34th 18.2-28.0 21.0-27.0 24.8 1.2
VI 28 23.2 1.6 1st 15.3-35.0 18.5-31.1 24.4 1.82nd 15.3-35.0 21.1-28.9 24.8 1.3
(2) 3rd 23.2-32.7 24.3-27.9 25.0 0.84th 23.1-32.7 24.3-27.0 24.8 0.7
and Claussen (1984) used two methods to determine preferredtemperature of laboratory animals: the acute thermal preferendum(obtained within 2 hours or less after animals have been placed ina gradient) and the final temperature preferendum (obtained after24-96 hours in a gradient). The preferred temperature was obtainedwithin l hour in our study. Therefore the result is considered toshow the acute thermal preferendum rather than the final temperature preferendum.
The relationship between acclimation temperature and meanpreferred temperature (mean of occupied temperatures in Table I)is shown in Figure 6. Immature horse mackerel acclimated to l4,20, or 25°C preferred temperatures higher than the acclimationtemperature, while fish acclimated to 26 or 28°C selected temperatures lower than the acclimation temperature. The data were bestfitted by the equation
Tp = 1.33TA - 0.03TA 2 + 7.37 (R2 = 0.82),
where Tp is preferred temperature, and TA is acclimation temperature. The acute thermal preferendum, the point where Tp = TA,was 24.9°C.
The range of all preferred values obtained from three acclimation temperatures was wide (17-31 0c) and included the range oftemperatures found in coastal area habitats (l5-26°C) and fishinggrounds for the immature fish (I6-25°C) (Yamada 1969).
22
Acknowledgments _
We would like to express appreciation to the Ministry of International Trade and Industry for funding and use of laboratory facilities.We also would like to thank Miss K. Matsumoto for her assistancein preparation of the manuscript.
Citations _
Fukataki, n., and S. Tsuchida.1986. Structure and efficiency of the new vertical temperature gradient device.
Spec. rep. I, p. 47-72. Mar. Eco!. Res. Inst., Chiba, Japan.Kwain, W., and R.W. McCauley.
1978. Effects of age and overhead illumination on temperatures preferred byunderyearling rainbow trout, Salmo gairdneri, in a vertical temperature gradient. J. Fish. Res. Board Can. 35:1430-1433.
Ingersoll, C,G., and D.L. Claussen.1984. Temperature selection and critical thermal maxima of the fantail darter,
Etheosroma flabellare, and johnny darter, E. nigrum, related to habitat andseason. Environ. Bio!. Fish. II (2): 131-138.
Yamada, T.1969. On the distribution and the fishing ground of horse mackerel in Japan
Sea. Bull. Fac. Fish. Nagasaki Univ. (28)111-130.
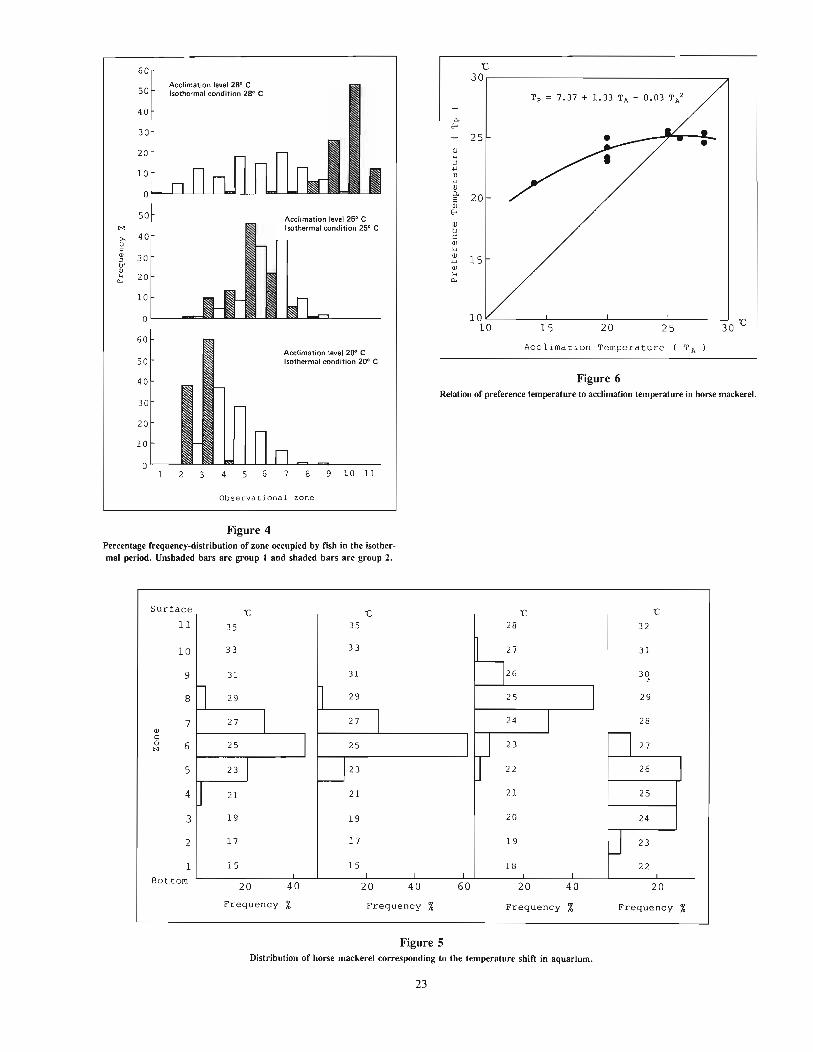
Acclimation Temperature T A )
10 "'---- .l.- --l..- --l..- --l
10 15 20 25 30'C
<lJ'-<:l.w'lJ'-<<lJ
~ 20<lJ~
<lJUc:<lJ'-<
~ 15<lJ'-<0..
25
'C30,--------------------"
Figure 6Relation of preference temperature to acclimation temperature in horse mackerel.
Acclimation level 25° CIsothermal condition 25° C
Acclimation level 28° CIsothermal condition 28° C
60
50
40
30
20
10
0
50"..
>, 400cQ) 30~
0'Q)... 20"-
10
0
60
50
40
30
20
10
0
Figure 4Percentage frequency-distribution of zone occupied by fish in the isothermal period. Unshaded bars are group I and shaded bars are group 2.
35 35 28 32
33 33 h" 31
31 31 26 30>
l 29 ~ 29 25 I 29
27 I 27 I 24 I 28
25 I 25 Ir 23 n 27
23 I ~23 22 26 IJ 21 21 21 25
19 19 20 24
17 17 19 U 23
15 15 18 22
Surface
11
10
9
8
7<lJC0 6N
5
4
3
2
1Bottom
'C
20 40
'C
20 40 60
'C
20 40
'C
20
Frequency % Frequency % Frequency % Frequency %
Figure 5Distribution of horse mackerel corresponding to the temperature shift in aquarium.
23

Effects of environmenton seedlings of the king crab,Paralithodes camtschaticus
TAKASHI NAKANISHIJapan Sea Regional Fisheries Research Laboratory5939-22, 1 Suido-cho,Niigata, 951 Japan
ABSTRACT
In order to determine optimum environmental conditions for the mass-cultivationof eggs, the effects of temperature, hypoxia, and salinity on the survival rate,growth, and respiration of king crab larvae and postlarvae were studied. Optimum temperature from fertilization to the zoea egg stage is 3-8°C, and 3°Cfrom this stage to batching. The optimum temperature for mass-cultivation oflarvae and postlarvae is 8°C. The optimum condition of oxygen saturation is morethan 80%, and of salinity is 26.8-40.2.
25
The king crab (Paralithodes camtschaticus) , Hanasaki crab (Paralithodes brevipes) , horsehair crab (Erimacrus isenbeckii), and snowcrab (Chionoecetes opilio) are the main species of coldwater crabsfor which mass-cultivation of larvae and postlarvae is being studiedin Japan. The king crab is one of the most important fisheries inJapan, and studies of techniques of cultivating larvae and propagation have been conducted since 1940 (Kaai 1940, Sato 1958, Kurata1959, Nakanishi 1976, Omi 1980, Nakanishi and Naryu 1981). Thesnow crab is also one of the most important fisheries in Japan, andthere have been several reports on the fisheries and resources (Ogata1974, Kon 1980). However, studies on rearing of larvae and propagation of snow crab and other coldwater crabs have been conductedmainly since 1970. Such mass-cultivation is being conducted atMarine Cultivation Centers under prefectural management and withthe cooperation of the Japan Sea Farming Association. At present,the numbers of seedlings of king crab and Hanasaki crab exceed200,000, and there are about 1,000 seedlings of snow crab.
When larvae and postlarvae are cultured, it is important to knowthe effects of the environment. One of the most important environmental variables affecting marine organisms, especially those livingin the cold sea, is temperature. In culturing the larvae of coldwatercrabs, it is necessary to maintain the ambient seawater at a lowtemperature (8°C or lower). But in order to culture these larvaefor a rapid growth rate and at low cost, it would appear advantageous to culture them in warm water. However, there is little information about temperature effects on the success of masscultivation of crab larvae and postlarvae. Thus, this report mainlyconcerns the effects of water temperature.
Life history _
Eggs adhere to abdominal pleopods of king crabs where they arebrooded for about 300 days until they hatch. There are fourplanktonic zoeal stages. After approximately 30 days at 8°C, zoeaemolt to glaucothoe that are able to swim but whose morphologyis crab-like. The glaucothoe stage molts to become a young, bottomdwelling crab that cannot swim. In this discussion, the egg stageis abbreviated as "E" (e.g., the egg stage at 100 days after spawning is shown as E-l00), the zoeal stage as "Z," the glaucothoestage as "G," and the young crab stage as "C."
The change in size from egg stage (the embryo) to the youngcrab stage is indicated by wet weight (Fig. I-A). It increased exponentially with time (days). The regression line was bent at C-3,and the gradient of the weight declined. The king crab molts morefrequently, but the growth rate is slower than that of the snow crab.At Z-4, G, and C-l, there were large morphological and ecologicalchanges, but the dry weight, wet weight, and carapace length atZ-4, G, and C-I were nearly the same (Nakanishi et al. 1974); inother words, there may be no growth during these stages.
Oxygen consumption also increased exponentially with time, andthe regression line was bent at C-3 (Fig. I-B). The oxygen consumption at E-300, Z-I, Z-2, G, C-I, and C-2 was under the regression line.

'11.'11.ImgJ
1000
O2 com.( JlP/hr. indo )1000
100 100
10
·C2
G.C,"i4·Z3·Z2
·e~J~
10
0.1 0.1
O.QI·egg2
0.0 I • egg I
A B
0.00 I '--_'--_'--_'--_'--_'--_-'--_-'--_-'------J
o 100 200 300 400 500 600 700 800 900
( days)
100 200 300 400 500 600 700 800 900
(days)
0.00 I L-_..L-_..L-_...I...-_..L-_..L-_--'--_..L-_..L-_-'
o
Figure 1(A) Relationship between wet weight (WW, mg) and the term (days) at 3°C at egg stage and at SoC at larval stage, and (B) relationship between
oxygen consumption {jALih per individual) and the term (days) at SoC.
Egg stage _
The effect of water temperature on the survival and developmentrate at E was studied by cultivating egg-bearing females at approximately 3°C and 8°C in fiberglass flow-through (I L/min.) tankswith a sand filter. Frozen squid, shrimp, and sardines were supplied for food. The experiment started with four crabs at 3°C andwith three crabs at 8°C.
Egg clutch volumes at 8°C decreased rapidly from E-40 and wereunder 10% at E-70, while egg clutch volumes at 3°C decreasedgradually, and were 10-80% when the larvae hatched (Fig. 2-A).The yolk volume at 8°C decreased rapidly from E-120, while thatat 3°C decreased slowly from E-150 (Fig. 2-B). The egg-bearingfemales mated in the laboratory were cultured at 3°C, and the developmental stage of their eggs (Fig. 2-c-d) was regarded as a standard egg development in order to compare with the developmentalstages of the eggs between 8°C and 3°C. The developmental stagesof eggs at 3°C were the same as the standard. But those at 8°Cwere faster than the standard, and there were many fluctuationsin the morphological development. The egg development of E-170at 8°C was the same as that ofE-270, i.e., E-3oo at 3°C (Fig. 2-C).
the survival rate at 5 weeks was 100% at -1.8,3, and 8°C, 20-70%at 13°C, and 20-30% at 18°C. At E-I66, the survival rate at 5 weekswas 100% at -1.8,3,8, and 13°C, and 90% at 18°C. At E-258,the survival rate decreased with increasing water temperature. Fiftypercent of the eggs died 4 weeks later at 8°C, 3 weeks later at 13°C,and 2 weeks later at 18°C.
Egg development
Comparisons of egg development between experimental and standard groups are discussed in the same way as reported previouslyfor long-term cultivation of egg-bearing females (Fig. 4). Growthrate increased with the increase in water temperature, but at E-23the growth rate at 13°C was higher than that at 18°C. The sizeof embryos cultured at higher temperatures at E-23 , E-57, and E-166was smaller than embryos cultured at 3°C. At E-258, there wasno morphological change even when the water temperature increased, and many larvae hatched out with the increase in watertemperature. However, the survival rate at the larval stage was notsatisfactory .
Survival rate
In order to know the effects of water temperature on developmentand survival rate at the egg stage, eggs removed from the females'pleopods at E-23, E-57, E-166, and E-258 were cultured at -1.8,3,8,13, and 18°C (Fig. 3). Culturing was done in a bacteria-freepetri dish with 30 mL seawater for 5 weeks. At E-23 and E-57.
Hatching rate
The effect of water temperature on the hatching rate of eggs wasstudied. Eggs were removed from females' pleopods at 4 and 18days before the larvae would have hatched normally at 3°C. Theseeggs were cultured at -1.8, 3, 8, 13, and 18°C in bacteria-freepetri dishes with 30 mL seawater for 6 days, and the hatching rateof eggs at each water-temperature condition was observed daily.
26

a
a
300
12 I8 23
b
a
10 II17 21
150
925
W. T. 8 t
......... _------------' ...'. b
o4 5 6 7 8
21 18 15 20 21
d
300
12 I 2 318 23 2013
10 /I
1721
150
8 921 25
W. T. 3 't
56718 15 20
ratio(%)
100
oL-.....J..-J'----'-_.1...--l.__.1.!.L.'_.1...-....1-_-'----'---'-.........
100
.........------, a'.. b
O~--'---'---'----'---'-----JL..J---'----L-..L----'--'-'---'
100
OL-__'__.....:L.___L_ __'___'__U---'-___L_ __'____'_.....u---'
(days) 0month 4
day 21
A 50
C 50
B 50
W.T.<'C)
1 8
~13
!lO
8 0
3
-1.8A
~~100
B
Figure 2(A) Egg clutch volumes (100% at the start ofexperiment), (B) ratio of volumes of yolk (byobservation of fresh samples), and (C) relationship between egg development at each experimental condition and the standard (c-d) at
water temperatures (WT) of 3° and 8°C.
,.13
•3
100
~
-1 .•
2 3 4 5
c2 3 4
100
D
5 (weeks)
Figure 3Effect of water temperature on survival rate ofeggs. Days post-spawning: (A) 23 days, (B) 57
days, (C) 166 days, and (D) 258 days.
27
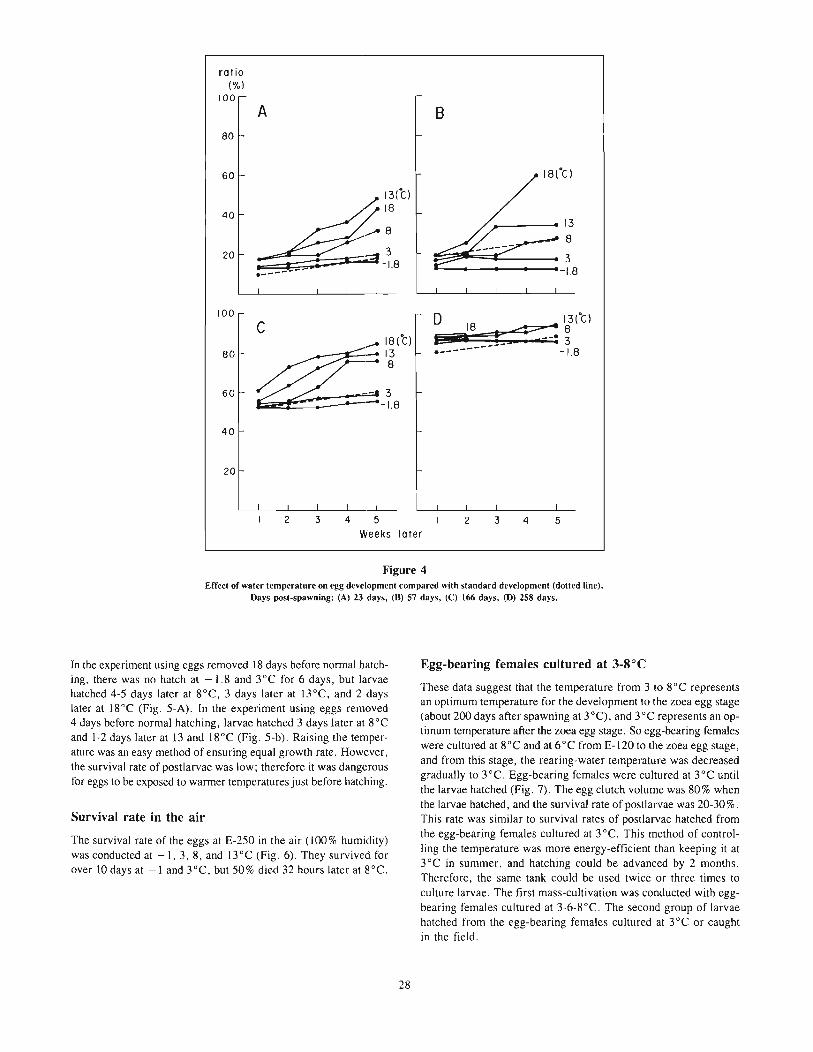
ratio("!oj
100
~A B
80
60 18("C)
13(Cl
4018
13
8
20 --:-~ 3• d;-1.8 3-1.8
-----l-
100 0C 18 ::::::;:; ~3 ("C )
---181C) C !__ __e 3
80 13 .-------- -1.8- 8
60 3--1.8
40
20
543232L--L_-L_---L_---L_---l....
4 5Weeks later
Figure 4Effect of water temperature on egg development compared with standard development (dotted line).
Days post-spawning: (A) 23 day" (B) 57 days, (e) 166 days, (D) 258 days.
In the experiment using eggs removed 18 days before normal hatching, there was no hatch at -1.8 and 3°e for 6 days, but larvaehatched 4-5 days later at 8°e, 3 days later at l3oe, and 2 dayslater at 18°e (Fig. 5-A). In the experiment using eggs removed4 days before normal hatching, larvae hatched 3 days later at 8°eand 1-2 days later at 13 and 18°e (Fig. 5-b). Raising the temperature was an easy method of ensuring equal growth rate. However,the survival rate of postlarvae was low; therefore it was dangerousfor eggs to be exposed to warmer temperatures just before hatching.
Survival rate in the air
The survival rate of the eggs at E-250 in the air (100% humidity)was conducted at -1,3,8, and l3 0 e (Fig. 6). They survived forover 10 days at -I and 3°e, but 50% died 32 hours later at 8°e.
Egg-bearing females cultured at 3-8°C
These data suggest that the temperature from 3 to 8°e representsan optimum temperature for the development to the zoea egg stage(about 200 days after spawning at 3°C), and 3°e represents an optimum temperature after the zoea egg stage. So egg-bearing femaleswere cultured at 8°e and at 6°e from E-120 to the zoea egg stage,and from this stage, the rearing-water temperature was decreasedgradually to 3°e. Egg-bearing females were cultured at 3°e untilthe larvae hatched (Fig. 7). The egg clutch volume was 80% whenthe larvae hatched, and the survival rate of postlarvae was 20-30%.This rate was similar to survival rates of postlarvae hatched fromthe egg-bearing females cultured at 3°e. This method of controlling the temperature was more energy-efficient than keeping it at3°e in summer, and hatching could be advanced by 2 months.Therefore, the same tank could be used twice or three times toculture larvae. The first mass-cultivation was conducted with eggbearing females cultured at 3-6-8°C. The second group of larvaehatched from the egg-bearing females cultured at 3°e or caughtin the field.
28

w.r.t"c )18
1 3
8
3
-1.8
A
2 3 4 5 6
18
'I (I (13
~8
~3 90705030
-1.8 10 Figure 5
BEffect of water temperature on the hatchingrate of eggs, 13 to 19 March. (A) Normal
2 3 4 5 6 (days) hatching at 31 March and 13-19 March; (B)normal hatching at 17 March.
"--",,------. L_.•• ••
ratio(%)
100 -
50
W.T. (C)10""
IIIIIIII,,,
\\\\
" ,'."'" ,
" '.24 ,...
16 I-
40
32 -
TLM
( hrsl
81-
I
-I
I I
3 8
W.T. (tl
I
13
o L--....L1_.L...-....L...--1_....L...-_...........1 ---l.---JL----'-----'-.--J'
(days) 0 150 300
month 4 5 6 7 8 9 10 II 12 I
day 21 18 15 20 21 25 1721 18 23
Figure 6Effect of exposure to air (100% humidity) on the survival rate
of eggs at 250 days after spawning.
Figure 7Egg development reared at 8-6-3°C; (a) egg clutch volumes, (b) volumes of yolk,
compared with (c) standard development.
29
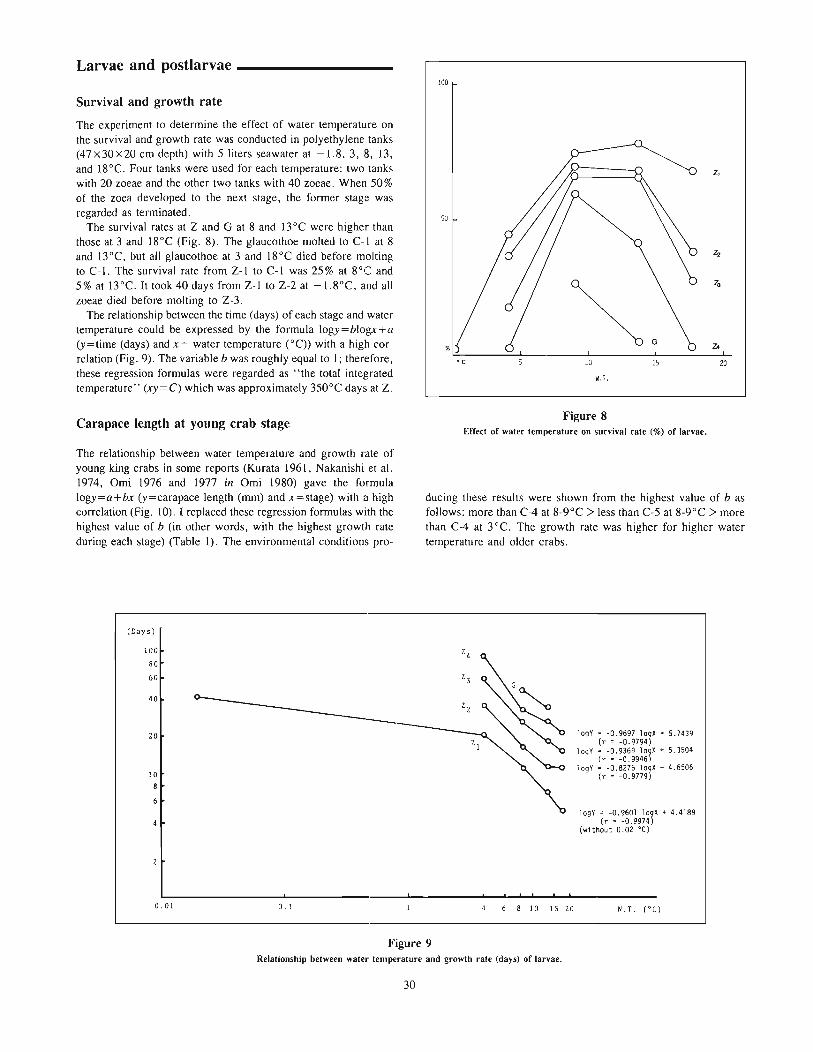
Larvae and postlarvae _100
Survival and growth rate
The experiment to determine the effect of water temperature onthe survival and growth rate was conducted in polyethylene tanks(47x30x20 cm depth) with 5 liters seawater at -1.8,3, 8, 13,and 18°C. Four tanks were used for each temperature: two tankswith 20 zoeae and the other two tanks with 40 zoeae. When 50%of the zoea developed to the next stage, the former stage wasregarded as terminated.
The survival rates at Z and G at 8 and 13°C were higher thanthose at 3 and 18°C (Fig. 8). The glaucothoe molted to C-l at 8and l3°C, but all glaucothoe at 3 and 18°C died before moltingto C-1. The survival rate from Z-I to C-l was 25 % at 8°(: and5% at l3°C. It took 40 days from Z-I to Z-2 at -1.8°C, and allzoeae died before molting to Z-3.
The relationship between the time (days) of each stage and watertemperature could be expressed by the formula logy=blogx+a(y=time (days) and x= water temperature (0C» with a high correlation (Fig. 9). The variable b was roughly equal to 1; therefore,these regression formulas were regarded as "the total integratedtemperature" (xy= C) which was approximately 350°C days at Z.
Carapace length at young crab stage
~ G
• c 10 15
W.T.
Figure 8Effect of water temperature on survival rate (%) of larvae.
z,
Z2
20
The relationship between water temperature and growth rate ofyoung king crabs in some reports (Kurata 1961, Nakanishi et al.1974, Omi 1976 and 1977 in Omi 1980) gave the formulalogy=a+bx (y=carapace length (mm) and x=stage) with a highcorrelation (Fig. 10). I replaced these regression formulas with thehighest value of b (in other words, with the highest growth rateduring each stage) (Table I). The environmental conditions pro-
(Days)
100
80
60
40
20
108
ducing these results were shown from the highest value of b asfollows: more than C-4 at 8-9°C >less than C-5 at 8-9°C > morethan C-4 at 3°C. The growth rate was higher for higher watertemperature and older crabs.
logY = -0.9697 logX + 5.7439(r = -0.9794)
logY = -0.9369 logX + 5.3504(r = -0.9946)
logY = -0.8275 loqX + 4.6506(r = -0.9779)
logY = -0.9601 l09X + 4.4189(r = -0.9974)
(without 0.02 'C)
0.01 0.1 6 8 10 15 20 W. T. ('C)
Figure 9Relationship between water temperature and growth rate (days) of larvae.
30

2
Oxygen consumption
Oxygen consumption at E-20, E-loo, E-200, and E-3oo, Z, G, andC-I was measured at 3,8, and 13°C (Fig. II). The specimens wereplaced in syringes held in a temperature-controlled water bath. Twowater samples (about 0.2 mL each) were taken from the syringeat zero time, and two more samples from 30 minutes to 4 hourslater depending on the temperature and the developmental stage.Oxygen concentration was calculated from oxygen pressure measured by an oxygen meter (Instrumentation Laboratory Co.). Fivesyringes were used, each containing 20-100 eggs or a single larva.
C. L.(mm)
10 l-X
@ 091- •8 l-
X @Cl
7 l- • (!) 0
<!J< Cl61- 0
Cl
51- @~C A0
(!) A41- i C 0
C 0 AX• 0 A3 I- 9 A
~ A
~ &2 I-
~A
I-
II-
0.1 L..-_L-1---,-_,,---1---,-_,,---1_,,---1---,-1_-,--1_-,--1_-,--1_-,-1
3 4 5 6 7 8 9 10 II
Stage
Figure 10Relationship between stage and carapace length (CL mm) of young king crab.• (water temp. 8 DC); 0 (water temp. 3°C); O· x (Omi 1980); 6· D (Kurata
1961).
From E-20, E-loo, and E-2oo, oxygen consumption (VOz) increased, but VOz at E-2oo and E-3oo was the same. Oxygenconsumption at 13°C was the highest, the lowest was at 3°C, andthe intermediate at 8°C. Oxygen consumption at Z-l was about tentimes that at E, and from Z-l to C-I at 3°C was almost the same.Oxygen consumption at Z-3 peaked at 8°C and then decreased fromthis stage.
Food consumption
Experiments to determine the effect of water temperature on thenumber of brine shrimp nauplii eaten was conducted at -1.8, 3,8, 13, and 18°C from Z-I to C-l (Fig. 12). Larvae were put intoa petri dish with 100 brine shrimp nauplii in 30 mL of seawater,and the number eaten was counted under a stereoscopic microscope24 hours later. The number eaten at Z gradually increased withthe developmental stage and the increase in water temperature, butits increase at Z-4 stopped at 8°C. The number eaten decreasedsharply at G and C-I. Perhaps brine shrimp are not a good preyfor postlarvae, since in other experiments with five kinds of foodat G, no food could be found in their stomachs. Perhaps the G doesnot feed.
Movement and activity at young crab stage
When seedlings are released into the field, they are exposed to conditions of rapidly changing temperature. Therefore, the effect ofwater temperature on the movement at C was studied in an experimental tank (180 x40 x40 cm depth) that had six partition wallsinside the tank to make a wide water-temperature gradient. Warm(16.5°C) and cold (3°C) seawater was put into each corner ofthistank (Fig. 13-B). Young crabs at C-4 or C-5 cultured at 3,8, and13°C were released into the tank at 3,8, and 13°C, respectively.The movements of these crabs were observed for 15 minutes at intervals of 30 seconds. In each experimental condition, five crabswere used.
The young crabs that were cultured at 3°C and released at 13°Cmoved the longest distance 15 minutes after their release (Table2A). Crabs cultured at 3°C and released at 8°C moved an intermediate distance. The difference between distances moved at 3 and8°C was large. Young crabs cultured at 13°C and released at 3°Ccould not move, and seemed paralyzed. Those released at 8 or 13°Cmoved actively. They had no tendency to move to the same watertemperature where they had been cultured, but they distributedthemselves throughout locations of various temperatures (Table 2B).
Table 1Relationship between stage and carapace length of each experiment [log (CL=a+b(STAGEllj. Asterisks indicate p=O.OS.
No. Experiment Stage (DC) 2 4 5 6 7 8 9 10 b
1 >=C5 8.0 0 * * * * * * * * 0.12362 Omi 1980 >=C5 9.2 0 * 0 * * * * * * 0.10543 Omi 1980 C8-12 9.2 * * 0 * * * * * * 0.09914 Nakanishi et al. 1974 CI-3 11.4 * * 0 * * * * * * 0.09505 Omi 1980 =<C4 9.2 * * * * * * * * * 0.08796 =<C4 8.0 * * * * * 0 0 * * 0.07827 Kurata 1961 * * * * * 0 0 * * 0.07788 CS-IO 3.0 * * * * * 0 0 * * 0.07339 Omi 1980 <C8 9.0 * * * * * * * * * 0.0570
10 Kurata 1961 13-17 * * * * * * * * * 0.0523
31
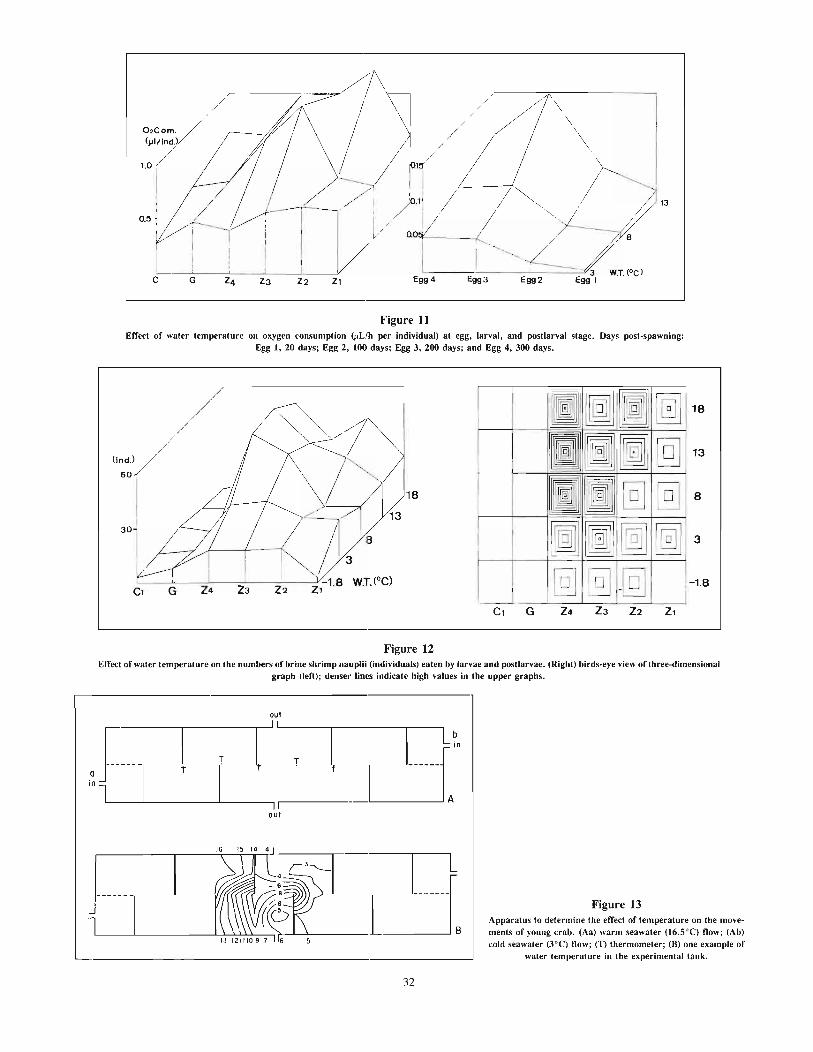
02com./(.,I/ind)
//1.0,
I,I
0.5 ~
Figure 11Effect of water temperature on oxygen consumption CJ;Llh per individual) at egg, larval, and posUarval stage. Days post-spawning:
Egg I, 20 days; Egg 2, 100 days; Egg 3, 200 days; and Egg 4, 300 days.
I 11I ~
I I]B @JI I I @] @]I
I 11B~ ~rol @] -@J
~L~
18
13
8
3
-1.8
G Z4 Z3 Z2
Figure 12Effect of water temperature on the numbers of brine shrimp nauplii (individuals) eaten by larvae and posUarvae. (Right) birds-eye view of three-dimensional
graph (left); denser lines indicate high values in the upper graphs.
our
Figure 13Apparatus to determine the effect of temperature on the movements of young crab. (Aa) warm seawater (16.5°C) flow; (Ab)cold seawater (3°C) flow; (T) thermometer; (B) one example of
water temperature in the experimental tank.
32
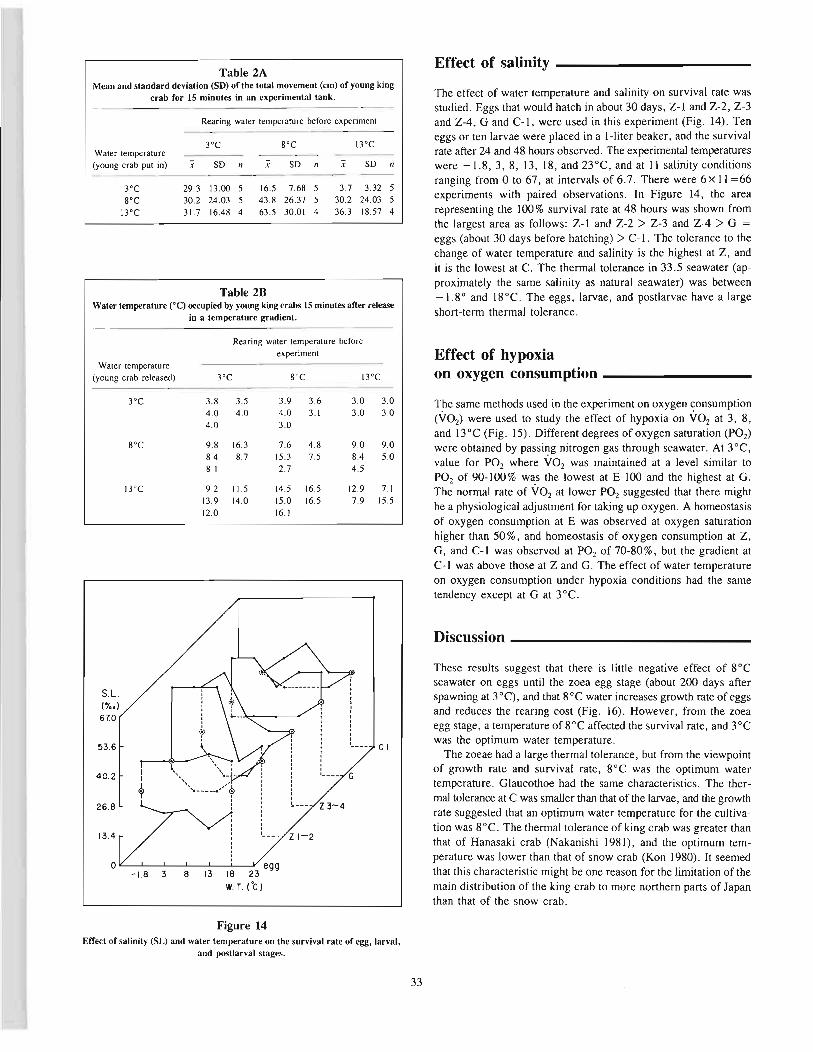
Table 2AMean and standard deviation (SD) of the total movement (em) of young king
crab for 15 minutes in an experimental tank.
Rearing water temperature before experiment
3°C 8°C 13°CWater temperature
(young erab put in) x SO n x SO n x SO n
3°C 29.3 13.00 5 16.5 7.68 5 3.7 3.32 58°C 30.2 24.03 5 43.8 26.37 5 30.2 24.03 5
l3°C 31.7 16.48 4 63.5 30.01 4 36.3 18.57 4
Table 2BWater temperature (OC) occupied by young king crabs 15 minutes after release
in a temperature gradient.
Effect of salinity -----------
The effect of water temperature and salinity on survival rate wasstudied. Eggs that would hatch in about 30 days, Z-I and Z-2, Z~3and Z-4, G and C-I, were used in this experiment (Fig. 14). Teneggs or ten larvae were placed in a I-liter beaker, and the survivalrate after 24 and 48 hours observed. The experimental temperatureswere -1.8,3,8,13,18, and 23°C, and at II salinity conditionsranging from 0 to 67, at intervals of 6.7. There were 6 x 11 =66experiments with paired observations. In Figure 14, the arearepresenting the 100% survival rate at 48 hours was shown fromthe largest area as follows: Z-I and Z-2 > Z-3 and Z-4 > G =eggs (about 30 days before hatching) > C~ I. The tolerance to thechange of water temperature and salinity is the highest at Z, andit is the lowest at C. The thermal tolerance in 33.5 seawater (ap~
proximately the same salinity as natural seawater) was between-1.8° and 18°C. The eggs, larvae, and postlarvae have a largeshort-term thermal tolerance.
Rearing water temperature before
experimentWater temperature
(young crab released) 3°C 8°C l3°C
3°C 3.8 3.5 3.9 3.6 3.0 3.04.0 4.0 4.0 3.1 3.0 3.04.0 3.0
8°C 9.8 16.3 7.6 4.8 9.0 9.08.4 8.7 15.3 7.5 8.4 5.08.1 2.7 4.5
13°C 9.2 11.5 14.5 16.5 12.9 7.113.9 14.0 15.0 16.5 7.9 15.512.0 16.1
o"---1-'-.8-...1.3--'8--13'---18'----2.Y
3e99
W. T. I'C)
Discussion _
Effect of hypoxiaon oxygen consumption _
T~e same methods used in the experiment on oxygen ~onsumption
(VOz) were used to study the effect of hypoxia on VOz at 3, 8,and 13°C (Fig. 15). Different degrees of oxygen saturation (Paz)were obtained by passing nitrogen gas through seawater. At 3°C,value for paz where VOz was maintained at a level similar topaz of 90-100% wa.s the lowest at E~ 100 and the highest at G.The normal rate of VOz at lower paz suggested that there mightbe a physiological adjustment for taking up oxygen. A homeostasisof oxygen consumption at E was observed at oxygen saturationhigher than 50 %, and homeostasis of oxygen consumption at Z,G, and C~ I was observed at paz of 70-80 %, but the gradient atC-I was above those at Z and G. The effect of water temperatureon oxygen consumption under hypoxia conditions had the sametendency except at G at 3°C.
These results suggest that there is little negative effect of 8°Cseawater on eggs until the zoea egg stage (about 200 days afterspawning at 3°C), and that 8°C water increases growth rate of eggsand reduces the rearing cost (Fig. 16). However, from the zoeaegg stage, a temperature of 8°C affected the survival rate, and 3°Cwas the optimum water temperature.
The zoeae had a large thermal tolerance, but from the viewpointof growth rate and survival rate, 8°C was the optimum watertemperature. Glaucothoe had the same characteristics. The thcr~
mal tolerance at C was smaller than that of the larvae, and the growthrate suggested that an optimum water temperature for the cultiva~
tion was 8°C. The thermal tolerance of king crab was greater thanthat of Hanasaki crab (Nakanishi 1981), and the optimum temperature was lower than that of snow crab (Kon 1980). It seemedthat this characteristic might be one reason for the limitation of themain distribution of the king crab to more northern parts of Japanthan that of the snow crab.
CI
G
,I",
"'-.-----/-t.........~--
S.l.(~.. )
670
53.6
40.2 II
+26.8
13.4
Figure 14Effect of salinity (SL) and water temperature on the survival rate of egg, larval,
and postlarval stages.
33
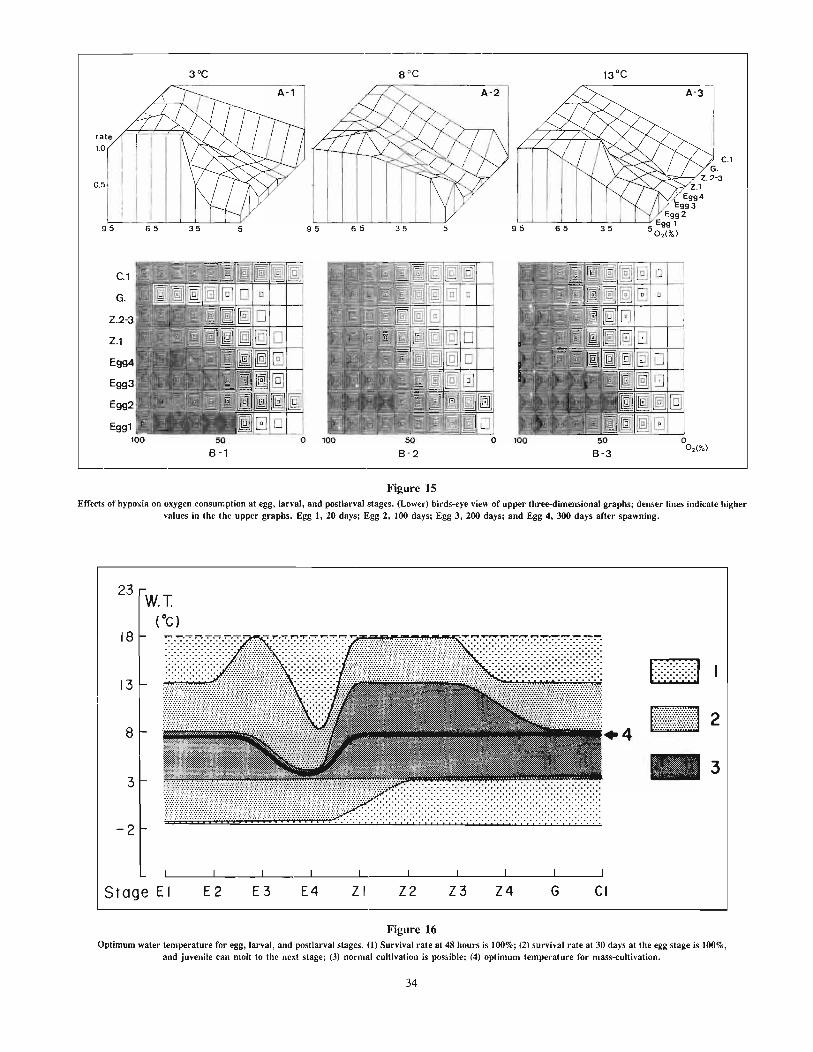
rate -F:::;t::::;:t:::::;:r=J~
1.0 I
I I05i I
_IJ~-----,-------:,95 65
C.1
G.
Z.2-3
Z.1
Egg4
Egg3
Egg2
95
100
65 35
50
B-2o
C.lG.
,,---~--r Z. 2-3Z.l
Egg4993
Egg29'::5--'--.L-6=-'::5--L-.L-=,-::-L--'-~5Egg 1
O2 (%)
o°2(%)
Figure 15Effects of hypoxia on oxygen consumption at egg, larval, and postlarval stages. (Lower) birds-eye view of upper three-dimensional graphs; denser lines indicate higher
values in the the upper graphs. Egg I, 20 days; Egg 2, 100 days; Egg 3, 200 days; and Egg 4, 300 days after spawning.
23
18
13
8
3
-2
Stage EI E2 E3 E4 ZI Z2 Z3 Z4 G CI
~~
Figure 16Optimum water temperature for egg, larval, and postlarval stages. (1) Survival rate at 48 hours is 100%; (2) survival rate at 30 days at the egg stage is 100%,
and juvenile can molt to the next stage; (3) normal cultivation is possible; (4) optimum temperature for mass-cultivation.
34
Acknowledgment _
I wish to express my thanks to Mrs. Naganuma for preparing thefigures.
Citations
Kaai, T.1940. The culture of young crab of the king crab. Hokkusui-shi Junpo 469:3-4
(in Jpn.).
Kon, T.1980. Studies on the life history of the zuwai crab, (Chionoecetes opilio) (0.
Fabricius). Spec. Pub!. Sado Mar. Bio!. Stn. Niigata Univ. 2: 1-64 (in Jpn.,Eng!. summ.).
Kurata, H.1959. Studies on the larva and post-larva of Paralithodes camtschatica. I. Rear
ing of the larvae with special reference to the food of the zoea. Bull. HokkaidoReg. Fish. Res. Lab. 20:76-83 (in Jpn., Eng!. summ.).
1961. Studies on the larva and post-larva of Paralithodes camtschatica. 4.Growth of the post-larva. J. Hokkaido Fish. Exp. Stn. 18:1-9 (in Jpn., Eng!.summ.).
Nakanishi, T.1976. Rearing larvae and post-larvae of the king crab (Paralithodes camtscha
tical. Proc. FAO Tech. Conf. on Aquaculture, Kyoto, Japan.1981. The effect of temperature on growth, survival and oxygen consumption
of larvae and post-larvae of Paralithodes brevipes (Decapoda;Anomura). Bull.Jpn. Sea Reg. Fish. Res. Lab. 32:49-56.
Nakanishi, T., Y. Kuwatani, and H. Kahata.1974. The relationship between carapace length and body weight of the larva
and post-larva of Paralithodes camtschatica. Bull. Hokkaido Reg. Fish. Res.Lab. 40:32-37 (in Jpn., Eng!. summ.).
Nakanishi, T., and M. Naryu.1981. Some aspects of large-scale rearing of larvae and post-larvae of the king
crab (Paralithades camtschatica). Bull. Jpn. Sea Reg. Fish. Res. Lab. 32:39-47.Ogata, T.
1974. The studies on the resources ofZuwai crab (Chionoecetes opilio) in JapanSea. Nippon-Suisansigenhogo-Kyokai Tech. Rep. 26, 66 p. (in Jpn.).
Omi, H.1980. Report on the experiment of aquaculture of king crab, 1975-1979.
Tarabagani-zousyokugi jyutu-kaihatushiken-houkoku, 64 p. (in. Jpn.).Sato, S.
1958. Studies on larval development and fishery biology of king crab,Paralithodes camtschatica (Tilesius). Bull. Hokkaido Reg. Fish. Res. Lab.17: 1-102 (in Jpn., Eng!. summ.).
35

Some methods of water-flowcontrol for mariculture
TOSHIFUMI NOMAAquacultural Engineering DivisionNational Research Institute of Fisheries EngineeringEbidai. Hasaki-machiIbaraki Mz. 314-04 Japan
It was more than 20 years ago that we heard "toru gyogyo karatsukuru gyogyo e" (from the hunting to the cultured fishing). Atthat time, Japan was eager to increase maricultured products suchas sea algae (Porphyra tenera), oyster, pearl oyster, and yellowtail.Thus, techniques that would increase such production, related toenvironmental control, have been expected to be developed. Anexample is increasing seawater exchange to improve the waterquality of a farming area in a bay.
Fisheries engineering must concern itself, in the short- or longterm, with the life cycle of marine organisms, from "womb totomb." It must also be interested in favorable conditions for marinelife and dispersion processes of larvae. Engineering problems canbe divided as follows: responses of the animals to the physiochemical environment, dispersion control, imprdvement of water quality,improvement and construction of habitats, and aquacultural facilities.
This paper reviews some of the methods that can control theaquatic environment as it is related to aquaculture.
Water quality control _
To rear a marine organism, the existence of seawater is inevitable;however, its mere existence is not sufficient for the life of theorganism. Seawater must have a motion that results in an exchangeof the seawater for food or nutritious salts, a supply of dissolvedoxygen, or removal of animal wastes. Energy such as tidal force,sea current, wave, or in some cases, motor power, is needed toprovide proper motion of the seawater.
Improvement of tidal inlets
In Japan, to avoid damage from storm surges, mariculture is performed in a bay well closed by topography. This can result in thedeterioration of water quality because of deficiency in seawater interchange. If there is a tidal motion, a less opened basin causes a waterlevel difference or phase difference of tidal level between the outersea and the inner basin, due to the flow resistance of bottom andside friction of the inlet.
Interchange flow rate q between two waters is expressed by
q = ± CA y2g!:J.h
C = [1.4 + 0.02 lID413j-1/2
(I)
(2)
37
where A = cross-sectional area of flow, I!.h = water level difference, I,D = length and depth of the inlet, and g = gravitationalacceleration. Coefficient of discharge, C, depends on length andshape of the inlet. Changes in the tidal inlet may result in improvement of C. This depends on reducing the length and revising thewater depth, D, of the inlet.
Interchange flow, Qmax, can be obtained graphically with tidalranges of outer sea and inner basin, ~, (, surface area of innerbasin, S, tidal period, T, and river flow rate, q, (Nakamura andHagino 1977).

QmaxACg I TQr/Ss
~ 1 0.0I--"
--........... --- 0.1'"00.5 "'"0 ~ ::::::~I- I'-
'"0
G: O 1\ 1 1
0.05 0Q.1 0.5 1.0 \ 5 10 50-~ :----.. "\. \ \ (ASCY gr III0.5~ \ 0.5r-....~ 1\ I
"...........
i'-. ~ ~ \1.0 I Tq r/Ss1.0
~--........... -i'\t- 1 0.0r-- -
"" \ "I'-. ~ 1\ ---- 0.11.5 --" 1\ \ ""1\
.~ 0.5'\ 1\ 1\ \ "1\ 2.5 1.0
...02.0 -1'\ "\. 1\
...0 f\ 1\ OuterlTidal~~ \ 1\ \~.O
sea inles Inner basin River
2.5\ t Q~x S -qr-
\12.5T~3.0
10.0 ~0.0-5,.0C discharge1
j
outer sea tidal inlet inner sea
~ tidal range Qmax : maximum flow rate ~': tidal range
T : tidal period A: cross-sectional S : surface areaarea of the flow
C : coefficient ofdisctarge
Figure 1Maximum interchange now rate.
Interchange by internal tide
where h = layer thickness, P = water density, and suffix 1 and2 represent the quantities of upper and lower layer, respectively.
A nondimensional density difference, E, has an order of less thanom, so
x=o
xx=a
I
range at t he bay mout h
internal tidal range
u l tidal flow velocity withoutinternal tide
AtsL ~~====3=====:::tT , '"~ -P I TL
Ul 1 ..,j - - - - hA L _~-::':'----,- s +1
-lRr--t --.- ~ Uf (_.(3)
(5)
(4)
P2 - PIE=---
P 2
In stratified liquid, there can be an internal wave. When an internalwave has a period comparable to a tidal period, it is called an internal tide. The propagating velocity of a long wave of an internaltide is so small that a resonance happens in a bay that has a lengthofless than 10 Ian. Propagating velocity of an internal tide, C, andsurface tide, Cs' are expressed by
(6)
that causes the resonance in bays with short lengths (Nakamura andHagino 1980). The resonance results in increased wave amplitude,so there can be a large amplitude of internal tide. A large amplitude
Figure 2Symbols and synoptic presentation of nows due to internal tide.
38
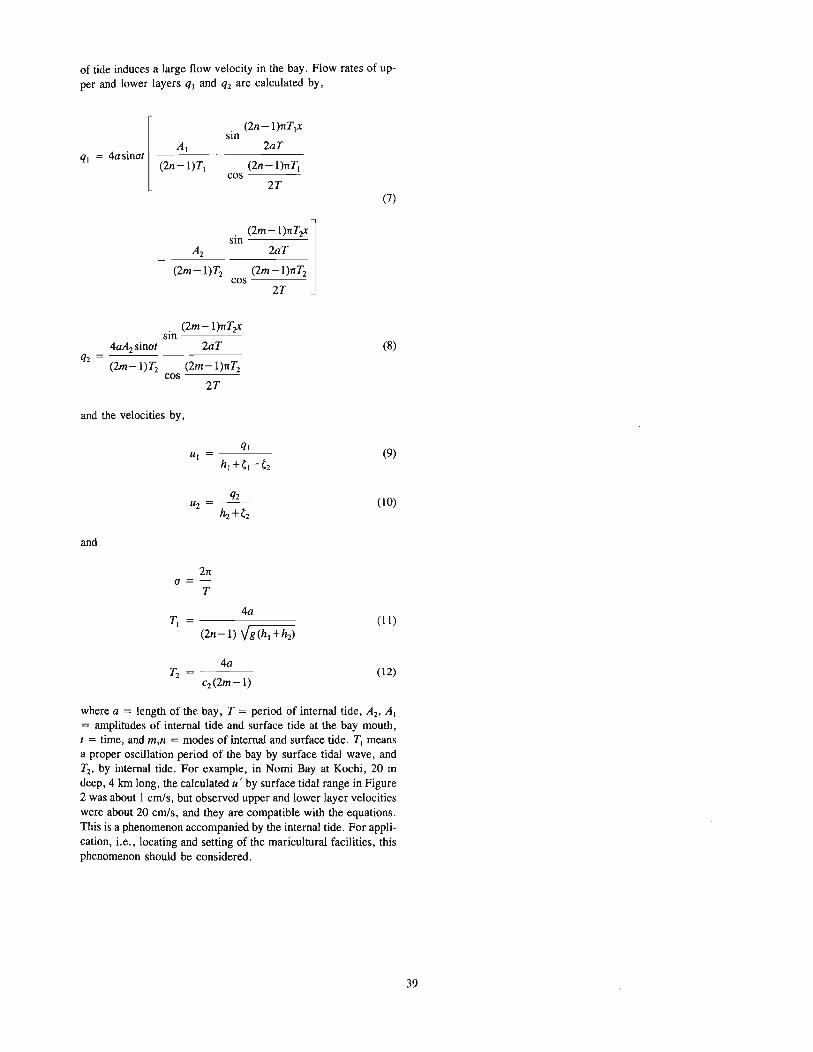
of tide induces a large flow velocity in the bay. Flow rates of upper and lower layers ql and q2 are calculated by,
ql = 4asinat(2n-I)TI
. (2n-I)nTlxsm
2aT
(2n-l)nTIcos
2T(7)
. (2m-I)nT~1smA2 2aT
(2m-I)T2 (2m-I)nT2cos
2T
. (2m-I)nT~sm
4aA2sinat 2aT
q2 = (2m-I)T2 (2m-I)nT2cos
2T
and the velocities by,
and
2na =-
T
4a
4aT2 = ---
c2(2m-I)
(8)
(9)
(10)
(11)
(12)
where a = length of the bay, T = period of internal tide, A2 , Al= amplitudes of internal tide and surface tide at the bay mouth,t = time, and m,n = modes of internal and surface tide. T1 meansa proper oscillation period of the bay by surface tidal wave, andT2, by internal tide. For example, in Norni Bay at Kochi, 20 mdeep, 4 Ian long, the calculated u' by surface tidal range in Figure2 was about 1 cm/s, but observed upper and lower layer velocitieswere about 20 crn/s, and they are compatible with the equations.This is a phenomenon accompanied by the internal tide. For application, Le., locating and setting of the maricultural facilities, thisphenomenon should be considered.
39
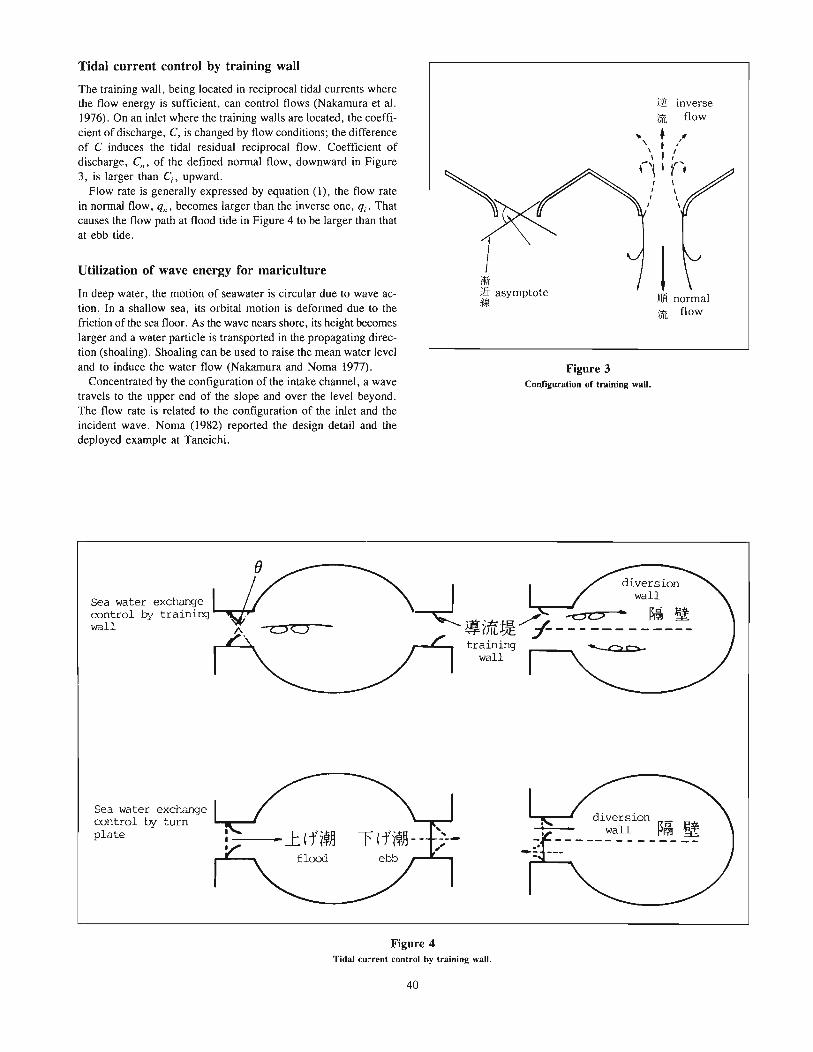
Figure 3Configuration of training wall.
Tidal current control by training wall
The training wall, being located in reciprocal tidal currents wherethe flow energy is sufficient, can control flows (Nakamura et al.1976). On an inlet where the training walls are located, the coefficient of discharge, C, is changed by flow conditions; the differenceof C induces the tidal residual reciprocal flow. Coefficient ofdischarge, Cn , of the defined normal flow, downward in Figure3, is larger than Ci , upward.
Flow rate is generally expressed by equation (1), the flow ratein normal flow, qn, becomes larger than the inverse one, qi' Thatcauses the flow path at flood tide in Figure 4 to be larger than thatat ebb tide.
Utilization of wave energy for mariculture
In deep water, the motion of seawater is circular due to wave action. In a shallow sea, its orbital motion is deformed due to thefriction of the sea floor. As the wave nears shore, its height becomeslarger and a water particle is transported in the propagating direction (shoaling). Shoaling can be used to raise the mean water leveland to induce the water flow (Nakamura and Noma 1977).
Concentrated by the configuration of the intake channel, a wavetravels to the upper end of the slope and over the level beyond.The flow rate is related to the configuration of the inlet and theincident wave. Noma (1982) reported the design detail and thedeployed example at Taneichi.
Sea water exchangeexmtrol by training L......+,.6wall .-.-,..,..........--
ifJiili asymptote*Jl!
ill! inverselliE flow
" + ,I'" I I\ I I
(\\ I ('I \, \
I \I \
III~ normalVIE flow
Sea water exchangecontrol by turnplate
Figure 4Tidal current control by training wall.
40
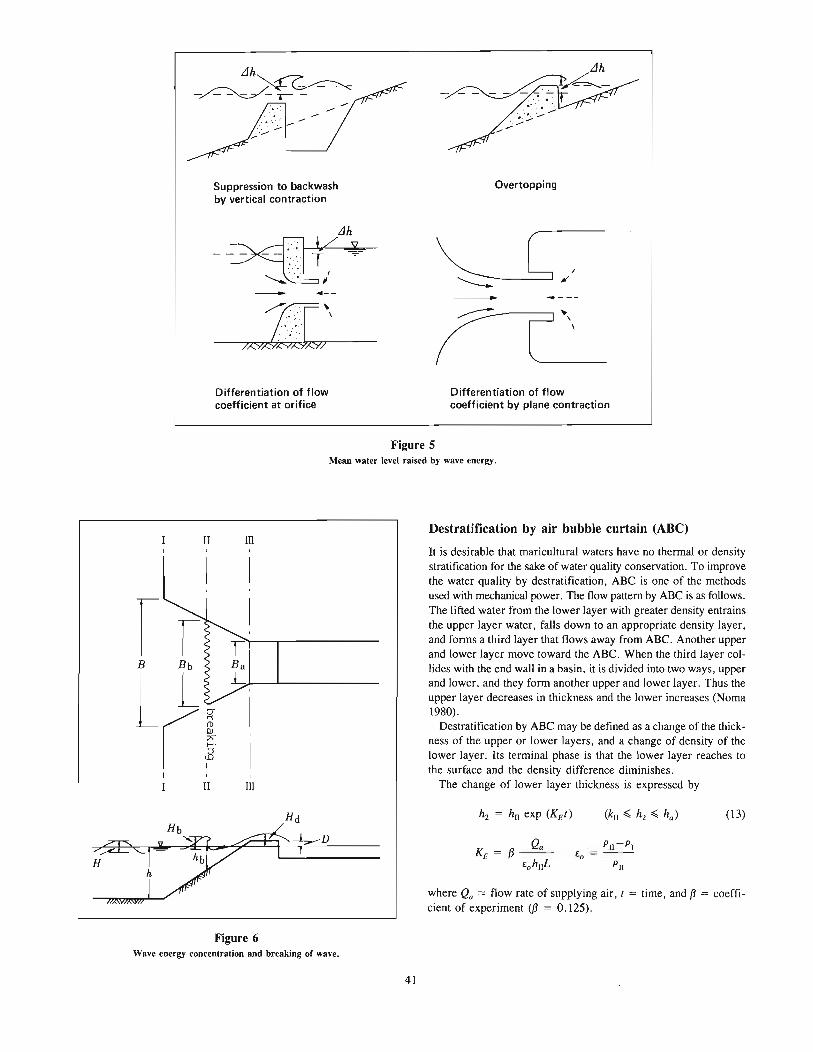
Suppression to backwashby vertical contraction
Overtopping
__~__ :':'. T ,1\...... I
~., II
/fT\
~n?----
~ [/---.. ~---( r\
Differentiation of flowcoefficient at orifice
Differentiation of flowcoefficient by plane contraction
Figure 5Mean water level raised by wave energy.
Destratification by air bubble curtain (ABC)II III
II III
It is desirable that maricultural waters have no thermal or densitystratification for the sake of water quality conservation. To improvethe water quality by destratification, ABC is one of the methodsused with mechanical power. The flow pattern by ABC is as follows.The lifted water from the lower layer with greater density entrainsthe upper layer water, falls down to an appropriate density layer,and forms a third layer that flows away from ABC. Another upperand lower layer move toward the ABC. When the third layer collides with the end wall in a basin, it is divided into two ways, upperand lower, and they form another upper and lower layer. Thus theupper layer decreases in thickness and the lower increases (Noma1980).
Destratification by ABC may be defined as a change of the thickness of the upper or lower layers, and a change of density of thelower layer. Its terminal phase is that the lower layer reaches tothe surface and the density difference diminishes.
The change of lower layer thickness is expressed by
where Qa = flow rate of supplying air, t = time, and {3 = coefficient of experiment ({3 = 0.125).
(13)
Figure 6Wave energy concentration and breaking of wave.
41
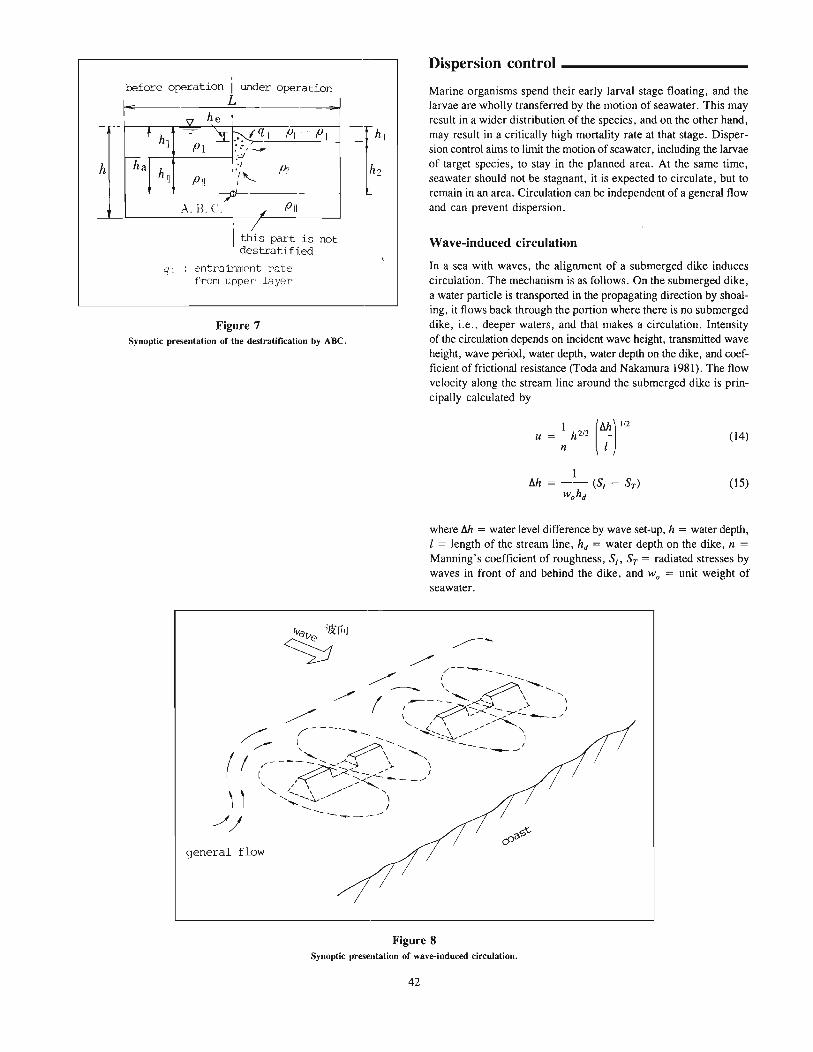
Dispersion control _
Wave-induced circulation
In a sea with waves, the alignment of a submerged dike inducescirculation. The mechanism is as follows. On the submerged dike,a water particle is transported in the propagating direction by shoaling, it flows back through the portion where there is no submergeddike, i.e., deeper waters, and that makes a circulation. Intensityof the circulation depends on incident wave height, transmitted waveheight, wave period, water depth, water depth on the dike, and coefficient of frictional resistance (Toda and Nakamura 1981). The flowvelocity along the stream line around the submerged dike is principally calculated by
Marine organisms spend their early larval stage floating, and thelarvae are wholly transferred by the motion of seawater. This mayresult in a wider distribution of the species, and on the other hand,may result in a critically high mortality rate at that stage. Dispersion control aims to limit the motion of seawater, including the larvaeof target species, to stay in the planned area. At the same time,seawater should not be stagnant, it is expected to circulate, but toremain in an area. Circulation can be independent of a general flowand can prevent dispersion.
h
I this part is notdestratified
ql entrainment rate~rom upper layer
Figure 7Synoptic presentation of the destratification by ABC.
before operation I under operationL
'V e-~
~{q,l PI = PIhI
- :YPI •• , --r
h a.'"'----------
h ./P?hU "/ "'-PII I
,-PIIA. H.C. J
/
1 (Mil) 1/2u=-h2/3
n(14)
(15)
where MI = water level difference by wave set-up, h = water depth,I = length of the stream line, hd = water depth on the dike, n =Manning's coefficient of roughness, Sf' ST = radiated stresses bywaves in front of and behind the dike, and W o = unit weight ofseawater.
general flow
Figure 8Synoptic presentation of wave-induced circulation.
42
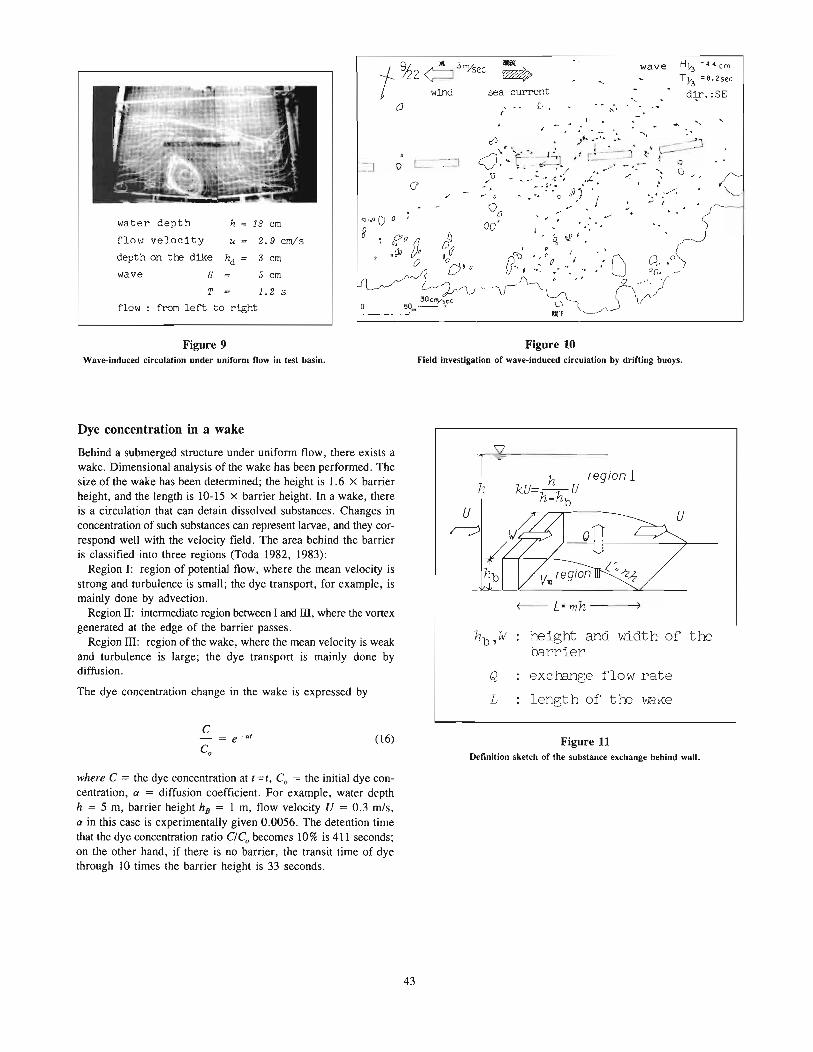
water depth h = 18 cm
flow velocity U = 2.9 cm/s
depth on the dike hd = :3 cm
wave H 5 cm
flow
T 1.2 s
from left to right
t %2 63nysec -
wind sea current
o / D
(J
"',0 () a
8
wave H~ =44 em
T Y3 =8.2see
dir. :SE
'-
..
Figure 9Wave-induced circulation under uniform flow in test basin.
Figure 10Field investigation of wave-induced circulation by drifting buoys.
Dye concentration in a wake
Behind a submerged structure under uniform flow, there exists awake. Dimensional analysis of the wake has been performed. Thesize of the wake has been determined; the height is I.6 X barrierheight, and the length is 10-15 x barrier height. In a wake, thereis a circulation that can detain dissolved substances. Changes inconcentration of such substances can represent larvae, and they correspond well with the velocity field. The area behind the barrieris classified into three regions (Toda 1982, 1983):
Region I: region of potential flow, where the mean velocity isstrong and turbulence is small; the dye transport, for example, ismainly done by advection.
Region II: intermediate region between I and ill, where the vortexgenerated at the edge of the barrier passes.
Region ill: region of the wake, where the mean velocity is weakand turbulence is large; the dye transport is mainly done bydiffusion.
The dye concentration change in the wake is expressed byQ
L
h region IkU=-U
h-hbu
t-- L'mh--~
height and 1/Jidth of thebarrier
exchange flow rate
length of tre VTcl.ke
C e -at (16) Figure 11Definition sketch of the substance exchange behind wall.
where C = the dye concentration at t=t, Co = the initial dye concentration, a = diffusion coefficient. For example, water depthh = 5 m, barrier height hB = 1 m, flow velocity U = 0.3 mis,a in this case is experimentally given 0.0056. The detention timethat the dye concentration ratio CICobecomes 10% is 411 seconds;on the other hand, if there is no barrier, the transit time of dyethrough 10 times the barrier height is 33 seconds.
43
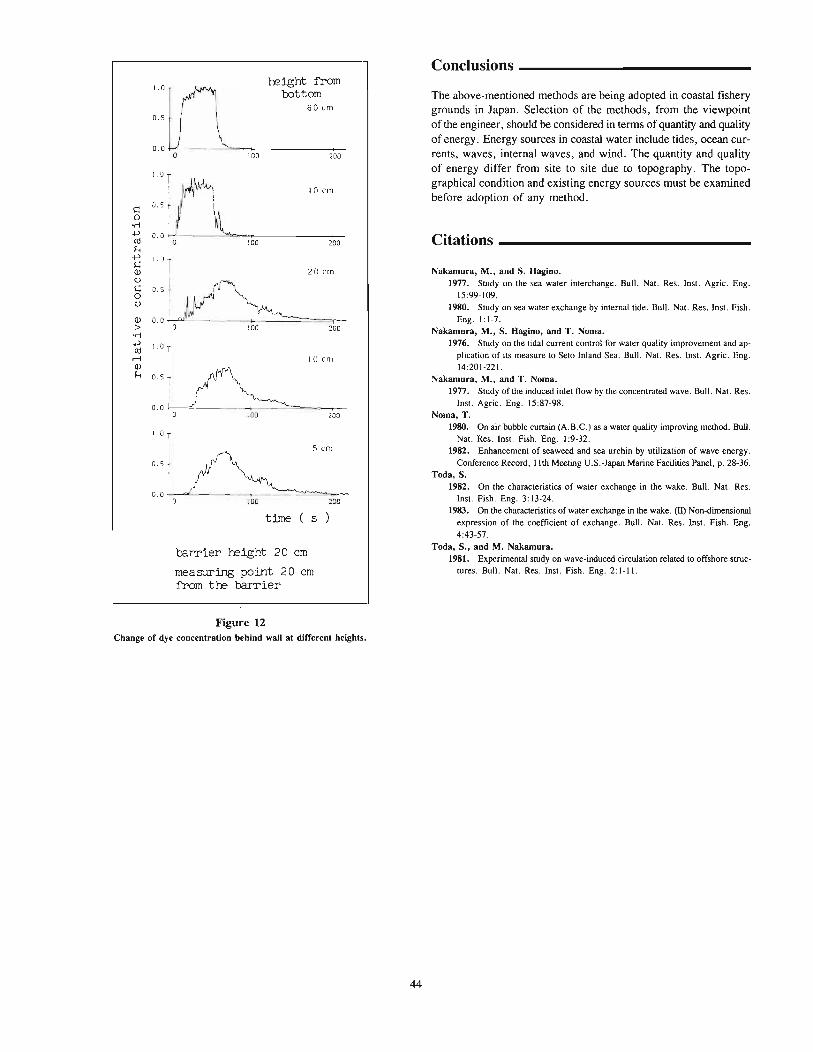
time ( s
baTTier height 20 em
measur:lng point 20 emfrom the barrier
::J ,A 'm
oJL~~o 100 200
Nakamura, M., and S. Hagino.1977. Study on the sea water interchange. Bull. Nat. Res. Inst. Agric. Eng.
15:99-109.1980. Study on sea water exchange by internal tide. Bull. Nat. Res. Inst. Fish.
Eng. 1:\-7.Nakamura, M., S. Hagino, and T. Noma.
1976. Study on the tidal current control for water quality improvement and application of its measure to Seto Inland Sea. Bull. Nat. Res. Inst. Agric. Eng.14:201-221.
Nakamura, M., and T. Noma.1977. Study of the induced inlet flow by the concentrated wave. Bull. Nat. Res.
Inst. Agric. Eng. \5:87-98.Noma, T.
1980. On air bubble curtain (A.B.C.) as a water quality improving method. Bull.Nat. Res. Inst. Fish. Eng. 1:9-32.
1982. Enhancement of seaweed and sea urchin by utilization of wave energy.Conference Record, 11th Meeting U.S.-Japan Marine Facilities Panel, p. 28-36.
Toda, S.1982. On the characteristics of water exchange in the wake. Bull. Nat. Res.
Inst. Fish. Eng. 3: 13-24.1983. On the characteristics of water exchange in the wake. (IT) Non-<limensional
expression of the coefficient of exchange. Bull. Nat. Res. Inst. Fish. Eng.4:43-57.
Toda, S., and M. Nakamura.1981. Experimental study on wave-induced circulation related to offshore struc
tures. Bull. Nat. Res. Inst. Fish. Eng. 2: I-II.
Citations _
Conclusions _
The above-mentioned methods are being adopted in coastal fisherygrounds in Japan. Selection of the methods, from the viewpointof the engineer, should be considered in terms of quantity and qualityof energy. Energy sources in coastal water include tides, ocean currents, waves, internal waves, and wind. The quantity and qualityof energy differ from site to site due to topography. The topographical condition and existing energy sources must be examinedbefore adoption of any method.
200
·jO em
height frombottom
60 ~m
100
1.:1
I 20rm
"'I yfi\, __OO~ -~-_~.....,_.--.__.. c...::=_==p=o ! 00 '200
l.°r."' ~0.0 --=--...,------__..-
o :00 200
JrtD.D ll----=~......._----_+_,-
o :00 200
OJ:>
oM.pr:! /~ >om
0.0 +-I-='----~--+-----'==~......o
s::o
oM.pco~.ps::OJCJs::ot>
Figure 12Change of dye concentration behind wall at different heights.
44
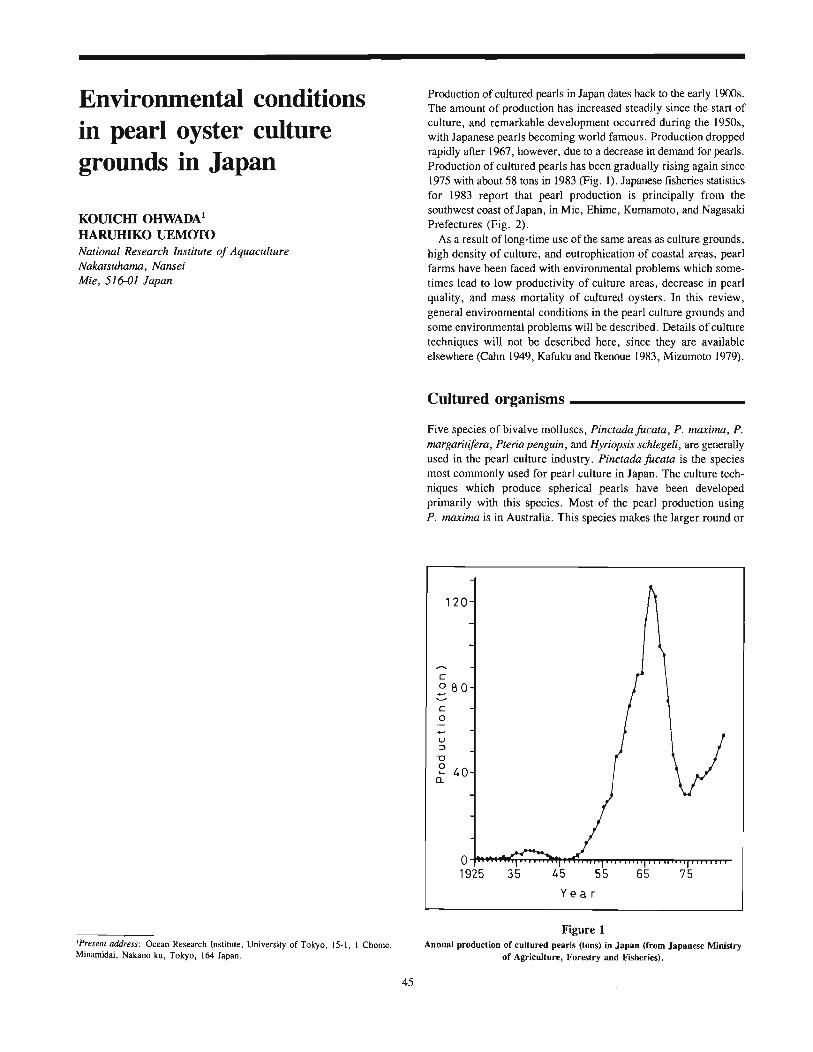
Environmental conditionsin pearl oyster culturegrounds in Japan
KOVICHIOHWADA I
HARUHIKO UEMOfONational Research Institute of AquacultureNakatsuhama, NanseiMie, 516-01 Japan
Production of cultured pearls in Japan dates back to the early 1900s.The amount of production has increased steadily since the start ofculture, and remarkable development occurred during the 1950s,with Japanese pearls becoming world famous. Production droppedrapidly after 1967, however, due to a decrease in demand for pearls.Production of cultured pearls has been gradualIy rising again since1975 with about 58 tons in 1983 (Fig. I). Japanese fisheries statisticsfor 1983 report that pearl production is principally from thesouthwest coast of Japan, in Mie, Ehime, Kumamoto, and NagasakiPrefectures (Fig. 2).
As a result oflong-time use of the same areas as culture grounds,high density of culture, and eutrophication of coastal areas, pearlfarms have been faced with environmental problems which sometimes lead to low productivity of culture areas, decrease in pearlquality, and mass mortality of cultured oysters. In this review,general environmental conditions in the pearl culture grounds andsome environmental problems wilI be described. Details of culturetechniques will not be described here, since they are availableelsewhere (Cahn 1949, Kafuku and Ikenoue 1983, Mizumoto 1979).
Cultured organisms _
Five species of bivalve molIuscs, Pinctada Jucata, P. maxima, P.margaritifera, Pteria penguin, and Hyriopsis schlegeli, are generallyused in the pearl culture industry. Pinctada Jucata is the speciesmost commonly used for pearl culture in Japan. The culture techniques which produce spherical pearls have been developedprimarily with this species. Most of the pearl production usingP. maxima is in Australia. This species makes the larger round or
7565554535o~~~m..~,""",m,.I'TT'T'l'TTT'l'TTTT'T'TT1""""'I'TT'I"'rTT'l'"1'T""
1925
120
YfJar
'Present address: Ocean Research Institule, University of Tokyo, 15-1, I Chome,Minamidai, Nakano-leu, Tokyo, 164 Japan.
45
Figure 1Annual produclion of cultured pearls (Ions) in Japan (from Japanese Ministry
of Agriculture, Forestry and Fisheries).
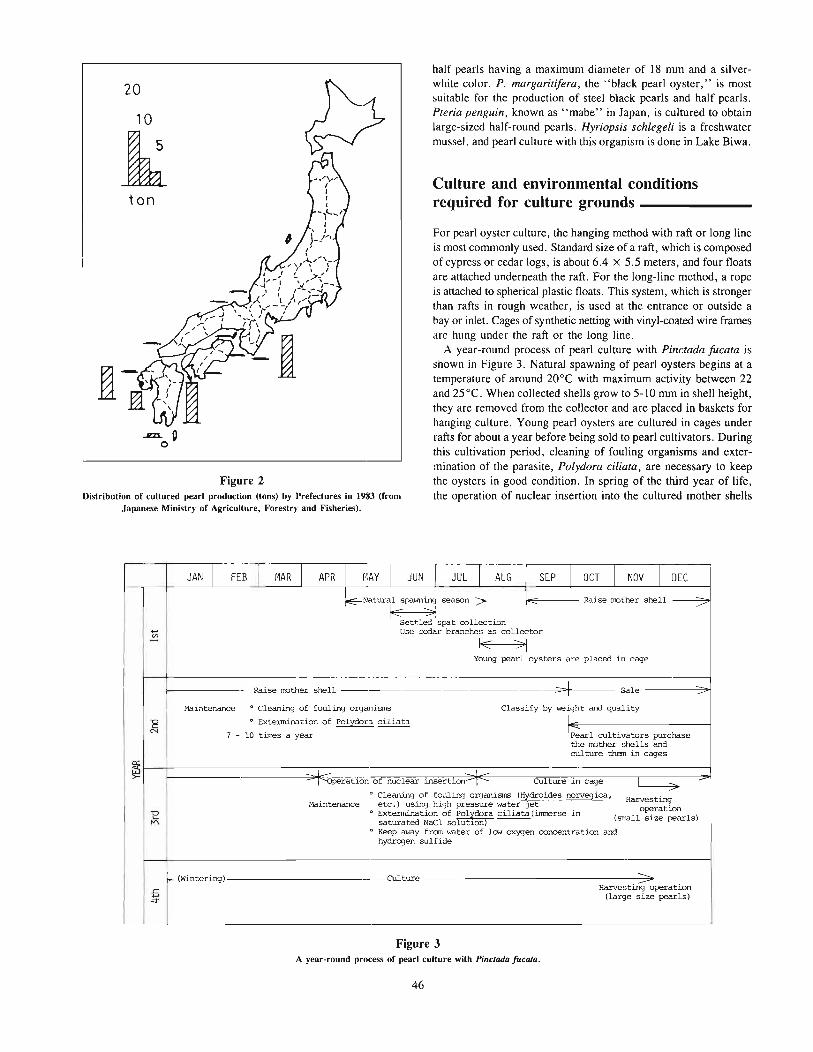
20
10
~ton
..£ZL 0o
Figure 2Distribution of cultured pearl production (tons) by Pref~ctures in 1983 (from
Japanese Ministry of Agriculture, Forestry and Fisheries).
half pearls having a maximum diameter of 18 mm and a silverwhite color. P. margaritifera, the' 'black pearl oyster," is mostsuitable for the production of steel black pearls and half pearls.Pteria penguin, known as "mabe" in Japan, is cultured to obtainlarge-sized half-round pearls. Hyriopsis schlegeli is a freshwatermussel, and pearl culture with this organism is done in Lake Biwa.
Culture and environmental conditionsrequired for culture grounds _
For pearl oyster culture, the hanging method with raft or long lineis most commonly used. Standard size of a raft, which is composedof cypress or cedar logs, is about 6.4 X 5.5 meters, and four floatsare attached underneath the raft. For the long-line method, a ropeis attached to spherical plastic floats. This system, which is strongerthan rafts in rough weather, is used at the entrance or outside abay or inlet. Cages of synthetic netting with vinyl-eoated wire framesare hung under the raft or the long line.
A year-round process of pearl culture with Pinctada fucata isshown in Figure 3. Natural spawning of pearl oysters begins at atemperature of around 20°C with maximum activity between 22and 25°C. When collected shells grow to 5-10 mm in shell height,they are removed from the collector and are placed in baskets forhanging culture. Young pearl oysters are cultured in cages underrafts for about a year before being sold to pearl cultivators. Duringthis cultivation period, cleaning of fouling organisms and extermination of the parasite, Polydora ciliata, are necessary to keepthe oysters in good condition. In spring of the third year of life,the operation of nuclear insertion into the cultured mother shells
JAN I FEB I r~AR I APR f!JAY I JUN I JUL I AUG SEP [ OCT I NOV I DEC
~Natural spawning season---:;:" Raise ITDther shell ------7Ie >:
Settlec. spat collection+-' Use ~edar branches as collector~ 1< >1
Young pearl oysters are placed in cage
I~Raise ITDther shell Sale ~
Maiiltenance o Cleaning of fouling organisms Classify by "",ight and quality
"E o Extermination of Polydor~ ciliata IN
7 - 10 tirres a year IPearl cultivators purchasethe ITDther shells andculture them in cages
~ "::3'~at~on at nuclear msert10n 1- CuIture in cage - --o Cleaning of fouling organisms (Hydroides oorvegica,Harvesting
Maintenance etc.) using high pressure water jet operationE o Extermination of Poll{dora ciliata (inmerse in (small size pearls)
'" saturated NaCl solutwn)o Keep away fran water of low oxy:jen concentration and
hydrogen sulfide
I--lWintering) Culture >L
Harvesting operation+-' (large size pearls).=r
Figure 3A year-round process of pearl culture with Pine/ada fUCa/a.
46
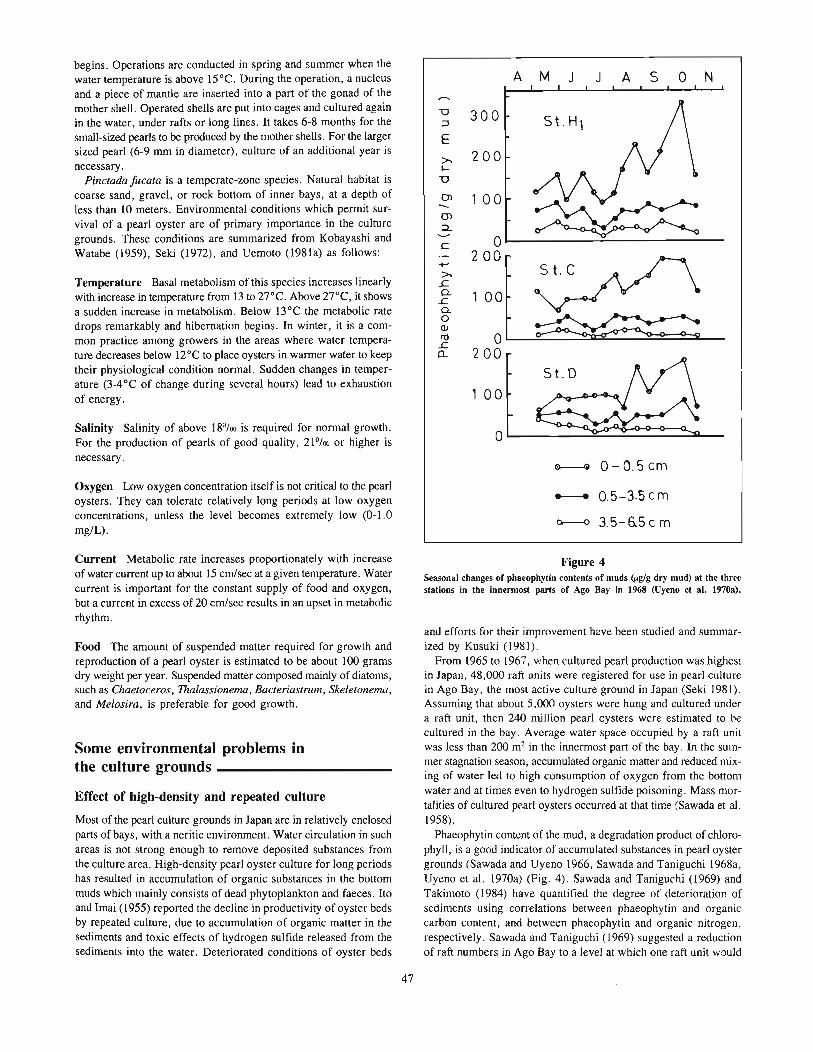
e---G 0 - 0.5 em
A M J J A S 0 N
u 300:J St. HlE
>. 200L.
U
01 1 00(Jl
:J..
C 0200
T"
>..J::.0. 1 00.J::.0.0QJ
ru 0.J::.0.... 200
, 00
Salinity Salinity of above 18°/00 is required for normal growth.For the production of pearls of good quality, 21°/00 or higher isnecessary.
Temperature Basal metabolism of this species increases linearlywith increase in temperature from 13 to 27°C. Above 2rC, it showsa sudden increase in metabolism. Below l3°C the metabolic ratedrops remarkably and hibernation begins. In winter, it is a common practice among growers in the areas where water temperature decreases below l2°C to place oysters in warmer water to keeptheir physiological condition normal. Sudden changes in temperature (3-4°C of change during several hours) lead to exhaustionof energy.
begins. Operations are conducted in spring and summer when thewater temperature is above 15°C. During the operation, a nucleusand a piece of mantle are inserted into a part of the gonad of themother shell. Operated shells are put into cages and cultured againin the water, under rafts or long lines. It takes 6-8 months for thesmall-sized pearls to be produced by the mother shells. For the largersized pearl (6-9 mm in diameter), culture of an additional year isnecessary.
Pinctada fucata is a temperate-zone species. Natural habitat iscoarse sand, gravel, or rock bottom of inner bays, at a depth ofless than 10 meters. Environmental conditions which permit survival of a pearl oyster are of primary importance in the culturegrounds. These conditions are summarized from Kobayashi andWatabe (1959), Seki (1972), and Uemoto (1981a) as follows:
Oxygen Low oxygen concentration itself is not critical to the pearloysters. They can tolerate relatively long periods at low oxygenconcentrations, unless the level becomes extremely low (0-1.0mg/L).
--- 0.5-3.5em
()..--() 3.5-&5 em
Current Metabolic rate increases proportionately with increaseof water current up to about 15 cm/sec at a given temperature. Watercurrent is important for the constant supply of food and oxygen,but a current in excess of 20 cm/sec results in an upset in metabolicrhythm.
Food The amount of suspended matter required for growth andreproduction of a pearl oyster is estimated to be about 100 gramsdry weight per year. Suspended matter composed mainly of diatoms,such as Chaetoceros, Thalassionema, Bacteriastrum, Skeletonema,and Melosira, is preferable for good growth.
Some environmental problems inthe culture grounds _
Effect of high-density and repeated culture
Most of the pearl culture grounds in Japan are in relatively enclosedparts of bays, with a neritic environment. Water circulation in suchareas is not strong enough to remove deposited substances fromthe culture area. High-density pearl oyster culture for long periodshas resulted in accumulation of organic substances in the bottommuds which mainly consists of dead phytoplankton and faeces. Itoand Imai (1955) reported the decline in productivity of oyster bedsby repeated culture, due to accumulation of organic matter in thesediments and toxic effects of hydrogen sulfide released from thesediments into the water. Deteriorated conditions of oyster beds
Figure 4Seasonal changes of phaeophytin contents of muds (J.g/g dry mud) at the threestations in the innermost parts of Ago Bay in 1968 (Uyeno et al. 1970a).
and efforts for their improvement have been studied and summarized by Kusuki (1981).
From 1965 to 1967, when cultured pearl production was highestin Japan, 48,000 raft units were registered for use in pearl culturein Ago Bay, the most active culture ground in Japan (Seki 1981).Assuming that about 5,000 oysters were hung and cultured undera raft unit, then 240 million pearl oysters were estimated to i:'>ecultured in the bay. Average water space occupied by a raft unitwas less than 200 m2 in the innermost part of the bay. In the summer stagnation season, accumulated organic matter and reduced mixing of water led to high consumption of oxygen from the bottomwater and at times even to hydrogen sulfide poisoning. Mass mortalities of cultured pearl oysters occurred at that time (Sawada et al.1958).
Phaeophytin content of the mud, a degradation product of cWorophyll, is a good indicator of accumulated substances in pearl oystergrounds (Sawada and Uyeno 1966, Sawada and Taniguchi 1968a,Uyeno et a!. 1970a) (Fig. 4). Sawada and Taniguchi (1969) andTakimoto (1984) have quantified the degree of deterioration ofsediments using correlations between phaeophytin and organiccarbon content, and between phaeophytin and organic nitrogen,respectively. Sawada and Taniguchi (1969) suggested a reductionof raft numbers in Ago Bay to a level at which one raft unit would
47
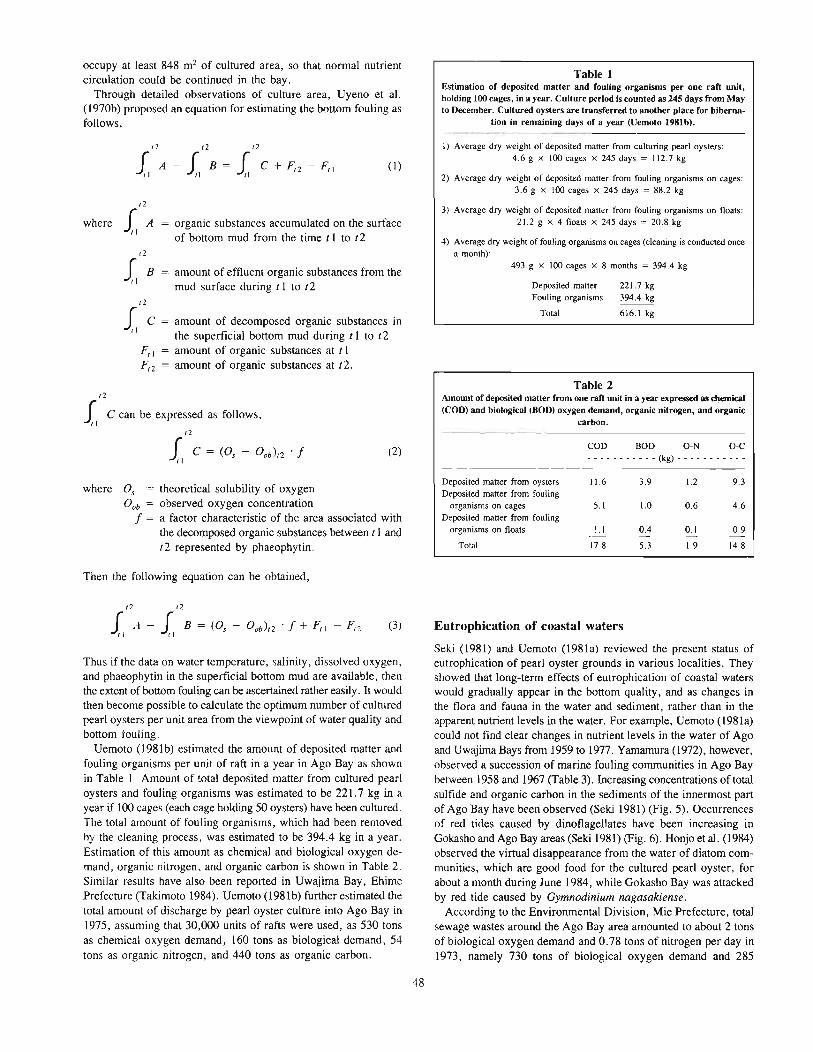
occupy at least 848 m2 of cultured area, so that normal nutrientcirculation could be continued in the bay.
Through detailed observations of culture area, Uyeno et al.(1970b) proposed an equation for estimating the bottom fouling asfollows,
Table 1Estimation of deposited matter and fouling organisms per one raft unit,holding 100 cages, in a year. Culture period is counted as 245 days from Mayto December. Cultured oysters are transferred to another place for hiberna-
tion in remaining days of a year (Uemoto 1981b).
12 12
J B = J C + FI2 - FtlII II
(I)
1) Average dry weight of deposited matter from culturing pearl oysters:4.6 g X 100 cages X 245 days = 112.7 kg
2) Average dry weight of deposited matter from fouling organisms on cages:3.6 g X 100 cages X 245 days = 88.2 kg
where organic substances accumulated on the surfaceof bottom mud from the time t 1 to t2
3) Average dry weight of deposited matter from fouling organisms on floats:21.2 g X 4 floats X 245 days = 20.8 kg
4) Average dry weight of fouling organisms on cages (cleaning is conducted oncea month):
493 g X 100 cages X 8 months = 394.4 kg= amount of effluent organic substances from the
mud surface during t I to t2
amount of decomposed organic substances inthe superficial bottom mud during t I to t2
= amount of organic substances at t I= amount of organic substances at t2.
Deposited matterFouling organisms
Total
221.7 kg394.4 kg
616.1 kg
12
f C can be expressed as follows,II
12
f C = (Os - 0ob)12 . fII
(2)
Table 2Amount of deposited matter from one raft unit in a year expressed as cl!emical(COD) and biological (BOD) oxygen demand, organic nitrogen, and organic
carbon.
COD BOD O-N O-C- - - - - - - - - - - (kg) . - - - - - - - - - -
where Os= theoretical solubility of oxygen00b observed oxygen concentration
f = a factor characteristic of the area associated withthe decomposed organic substances between t 1 andt2 represented by phaeophytin.
Then the following equation can be obtained,
Deposited matter from oysters 11.6 3.9 1.2 9.3Deposited matter from fouling
organisms on cages 5.1 1.0 0.6 4.6Deposited matter from fouling
organisms on floats l.l 0.4 0.1 0.9.- -Total 17.8 5.3 1.9 14.8
Thus if the data on water temperature, salinity, dissolved oxygen,and phaeophytin in the superficial bottom mud are available, thenthe extent of bottom fouling can be ascertained rather easily. It wouldthen become possible to calculate the optimum number of culturedpearl oysters per unit area from the viewpoint of water quality andbottom fouling.
Uemoto (1981 b) estimated the amount of deposited matter andfouling organisms per unit of raft in a year in Ago Bay as shownin Table 1 Amount of ~otal deposited matter from cultured pearloysters and fouling organisms was estimated to be 221.7 kg in ayear if 100 cages (each cage holding 50 oysters) have been cultured.The total amount of fouling organisms, which had been removedhy the cleaning process, was estimated to be 394.4 kg in a year.Estimation of this amount as chemical and biological oxygen demand, organic nitrogen, and organic carbon is shown in Table 2.Similar results have also been reported in Uwajima Bay, EhimePrefecture (Takimoto 1984). Uemoto (1981b) further estimated thetotal amount of discharge by pearl oyster culture into Ago Bay in1975, assuming that 30,000 units of rafts were used, as 530 tonsas chemical oxygen demand, 160 tons as biological demand, 54tons as organic nitrogen, and 440 tons as organic carbon.
12
fA"
12
f B = (Os - 0ob)12 . f + Ftl - F'2II(3)
48
Eutrophication of coastal waters
Seki (1981) and Uemoto (l981a) reviewed the present status ofeutrophication of pearl oyster grounds in various localities. Theyshowed that long-term effects of eutrophication of coastal waterswould gradually appear in the bottom quality, and as changes inthe flora and fauna in the water and sediment, rather than in theapparent nutrient levels in the water. For example, Uemoto (l98Ia)could not find clear changes in nutrient levels in the water of Agoand Uwajima Bays from 1959 to 1977. Yamamura (1972), however,observed a succession of marine fouling communities in Ago Baybetween 1958 and 1967 (Table 3). Increasing concentrations of totalsulfide and organic carbon in the sediments of the innermost partof Ago Bay have been observed (Seki 1981) (Fig. 5). Occurrencesof red tides caused by dinoflagellates have been increasing inGokasho and Ago Bay areas (Seki 1981) (Fig. 6). Honjo et al. (1984)observed the virtual disappearance from the water of diatom communities, which are good food for the cultured pearl oyster, forabout a month during June 1984, while Gokasho Bay was attackedby red tide caused by Gymnodinium nagasakiense.
According to the Environmental Division, Mie Prefecture, totalsewage wastes around the Ago Bay area amounted to about 2 tonsof biological oxygen demand and 0.78 tons of nitrogen per day in1973, namely 730 tons of biological oxygen demand and 285
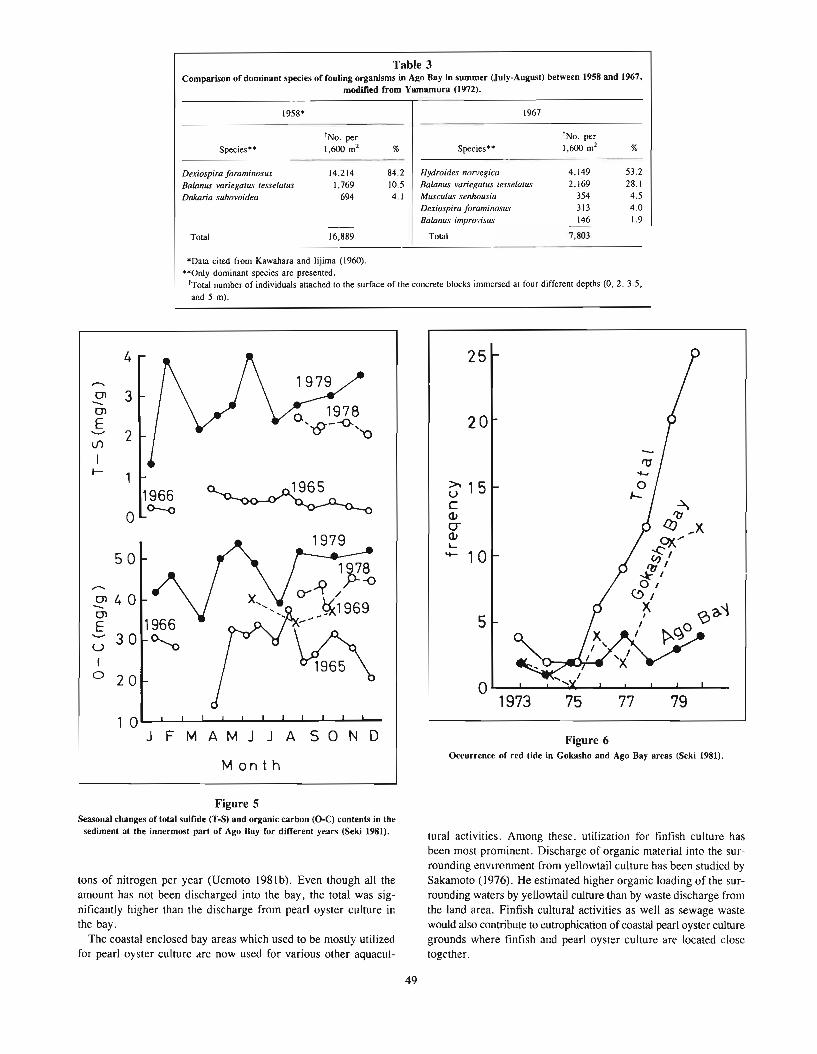
Table 3Comparison of dominant species of fouling organisms in Ago Bay in summer (July-August) between 1958 and 1967,
modified from Yamamura (1972).
1958* 1967
INo. per INo. perSpecies*' 1,600 m2 % Species" 1,600 m2 %
Dexiospira foraminosus 14,214 84.2 Hydroides norvegica 4,149 53.2Balanus variegatus tesselatus 1,769 10.5 Balanus variegatus tesselatus 2,169 28.1Dakaria subovoidea 694 4.1 Musculus senhousia 354 4.5
Dexiospira foraminosus 313 4.0Balanus improvisus 146 1.9
--Total 16,889 Total 7,803
'Data cited from Kawahara and lijima (1960)."Only dominant species are presented.
ITotal number of individuals attached to the surface of the concrete blocks immersed at four different depths (0, 2, 3.5,and 5 m).
79
~
OJ'?! ...X9)(.....;;;,
~,'o I
0/XI,,
77751973
25
5
20
>. 15ucOJCTOJ'-
- 10
4
..-...(Jl 3--(Jl
E........ 2IJ)
I~
1966
0 0-.0
50
(Jl 40--(Jl
E 1966
u 30 ~I
0 20
J FMAMJ J A SOND
M on t h
Figure 6Occurrence of red tide in Gokasho and Ago Bay areas (Seki 198\).
Figure 5Seasonal changes of total sulfide (ToS) and organic carbon (O-C) contents in the
sediment at the innermost part of Ago Bay for different years (Seki 1981).
tons of nitrogen per year (Demoto 1981 b). Even though all theamount has not been discharged into the bay, the total was significantly higher than the discharge from pearl oyster culture inthe bay.
The coastal enclosed bay areas which used to be mostly utilizedfor pearl oyster culture are now used for various other aquacul-
tural activIties. Among these, utilization for finfish culture hasbeen most prominent. Discharge of organic material into the surrounding environment from yellowtail culture has been studied bySakamoto (1976). He estimated higher organic loading of the surrounding waters by yellowtail culture than by waste discharge fromthe land area. Finfish cultural activities as well as sewage wastewould also contribute to eutrophication of coastal pearl oyster culturegrounds where finfish and pearl oyster culture arc:' located closetogether.
49

Approach to improve deterioratedbottom quality _
Improvement of deteriorated environmental conditions ca-Jsed byred tides has been studied by the Fisheries Agency (Fisheries Agency1983). Several attempts have also been made to improve deterioratedbottom conditions in the enclosed areas of pearl oyster grounds,such as cultivation (Sawada and Taniguchi 1967, Uyeno 1964) andexplosive ploughing of the sediment (Sawada et al. 1968), underwater blasting of obstacles (Sawada and Taniguchi 1968b), bottomaeration (Mie Prefect. Fish. Exp. Stn. 1966), and sprinkling ferricoxide on the bottom sediment (Seki and Shibahara 1967). A recentapproach of liming the bottom sediment seems to be successful forpreventing hydrogen sulfide formation in the deteriorated bottomareas (Nishimura and Seki 1983). The amount of lime required isestimated to be 100-200 grams/m2 .
Citations _
Cahn, A.R.1949. Pearl culture in Japan. Nat. Resour. Sect. 122, GHQ, 91 p.
Fisheries Agency.1983. Manual of the projects on developing techniques for protection from
damage by red tides in mariculture grounds, 51 p. (in Jpn.)_Honjo, T., K. Ohwada, N. Tanaka, S. Toda, A. Asakawa, and H. Uemoto.
1984. On the red tide causing major damage to cultured fishes and shellfishesin Gokasho Bay_ Natl. Res_ Inst. Aquacult. news 8:5-9 (in Jpn.).
lto, S., and T. lmai.1955. Ecology of oyster bed. L On the decline of productivity due to repeated
cultures. Tohoku J. Agric. Res. 5:251-268.Kafuku, T., and H. lkenoue (eds.).
1983. Modern methods of aquaculture in Japan. Developments in aqJacultureand fisheries science, vol. II. Elsevier Sci. Publ. Co., 216 p.
Kawamura, T .• and H. Iijima.1960. On the constitution of marine fouling communities at various depths in
Ago Bay. Rep. Fac. Fish. Mie Univ. 3:582-594.Kobayashi, S., and T. Watabe.
1959. Studies on Pearls. Gihodo Publisher, 280 p. (in Jpn.).Kusuki, Y.
1981. Fundamental studies on the deterioration of oyster growing grounds. Bull.Hiroshima Fish. Exp. Stn. 11:1-93 (in Jpn.).
Mie Prefectural Fisheries Experimental Station.1966. Effect of aeration of bottom sediment on the improvement of pearl culture
grounds. Annu. Proj. Rep., Mie Prefect. Fish. Exp. Stn. for 1964, p. 144-148(in Jpn.).
Mizumoto, S.1979. Pearl farming in .Japan. In Pillay, TV. R., and W. A. Dill, (eds.) Ad
vances in Aquaculture, p. 381-385. Fishing News Books, Ltd.Nishimura, A., and M. Seki.
1983. Effects of lime on the improvement of mariculture grounds. Bull. Jpn.Soc. Sci. Fish. 49:353-358 (in Jpn.).
Sakamoto, 1.1976. Assessment of the load caused by pisciculture to the environment. Rep.
Environ. Sci. Mie Univ. I: 181-203 (in Jpn.).Sawada, Y., M. Tange, and M. Seki.
1958. The oceanographical studies on the pearl culture ground. L On theoceanographical observation of unusual death of pearl oyster at Tategami-urain Ago Bay in July 1958. Bull. Nall. Pearl Res. Lab. 4:347-355 (in Jpn.).
Sawada, Y., and M. Taniguchi.1967. The oceanographical studies on the pearl culture ground. IV. On the
seasonal changes of bottom conditions and the improvement method of bottommud in the superannuated pearl farm. Bull. Nall. Pearl Res. Lab. 12:1~79·1408
(in Jpn.).1968a. The oceanographical studies on the pearl culture ground. V. On the
seasonal changes of organic matter and phaeophytin c"ntents in bott~m mudof the superar;nuated pearl culture ground. Bnll. Natl. Pearl Rts. Lab.13:1689-1702 (in Jpn.).
50
1968b. Studies on the underwater blasting of reef in the pearl culture ground(11). IV. On the changes of environment of the pearl culture ground by the underwater blasting. Bull. Nall. Pearl Res. Lab. 13:1703-1711 (in Jpn.).
1969. The oceanographical studies on the pearl culture ground. VI. On the relation berween the raft density in pearl culture ground and the contaminated degreeof bottom mud. Bull. Nall. Pearl Res. Lab. 14: 1719-1734 (in Jpn.).
Sawada, Y., M. Taniguchi, Y. Wakazono, T. Ogawa, and M. Nakano.1968. Studies on the explosion ploughing of the bottom mud in the super
annuated pearl culture ground. Bull. Natl. Pearl Res. Lab. 13: 1241-1247 (inJpn.).
Sawada, Y., and F. Uyeno.1966. Studies on the acetone extracts from marine mud and faeces of pearl oyster
(Pincrtuln manensl). L On the absorption spectra of acetone extracts. Bull. Nall.Pearl Res. Lab. 11:1298-1307 (in Jpn.).
Seki, M.1972. Studies on environmental factors for the growth of pearl oyster, Pinc
rtuln fucara, and the quality of its pearl under the culture condition. Bull. MiePrefect. Fish. Exp. Stn. 1:32-149 (in Jpn.).
1981. Present status of eutrophication in pearl culture grounds and their improvement. Bull. Jpn. Soc. Sci. Fish. Oceanogr. 38:38-41 (in Jpn.).
Seki, M., and N. Shibahara.1967. Effects of sprinkling ferric oxide on the bottom sediments for the improve
ment of pearl culture ground. Annu. Proj. Rep. Mie Prefect. Fish. Exp. Stn.for 1965, p. 221-228 (in Jpn.).
Takimoto, S.1984. Studies on the organic loading into culture farm by pearl oyster culture.
Aquiculture (Sendai) 32:77-82 (in Jpn.). See Suisan Zoshoku (Fish. Cult.).Vemoto, H.
1981a. Long term changes of nutrient levels and succession of pearl oyster culturegrounds. Bull. Jpn. Soc. Sci. Fish. Oceanogr. 38:28-37 (in Jpn.).
1981b. On the depositing matter in the pearl culture grounds. In The processof settling and sedimentation in bay and coastal region, p. 126-138. Jpn. Fish.Resour. Conserv. Assoc. (in Jpn.).
Uyeno, F.1964. Relationships between production of foods and oceanographical condi
tion of sea water in pearl farms. II. On the seasonal changes of sea water constituents and bottom condition, and the effect of bottom cultivation. J. Fac.Fish. Prefect. Univ. Mie 6: 145-169 (in Jpn.).
Uyeno, F., S. Funahashi, and A. Tsuda.1970a. Preliminary studies on the relation between faeces of pearl oyster
(Pincrtuln manensi) and bottom conditions in an estuarine pearl oyster area.J. Fac. Fish. Prefect. Univ. Mie 8:113-137 (in Jpn.).
Uyeno, F., K. Kawaguchi, N. Terada, and T. Okada.I970b. Decomposition, effluent and deposition of phytoplankton in an estuarine
pearl oyster area. J. Fac. Fish. Prefect. Univ. Mie 7:7-41 (in Jpn.).Yanlamura, Y.
1972. Ecological studies of marine fouling communities in pearl culture ground.n. Seasonal changes in the constitution of marine fouling communities at variousdepths in Ago Bay. Bull. Natl. Pearl Res. Lab. 16:2038-2051 (in Jpn.).