ENVIRONMENTAL IMPACT ASSESSMENT EIA / EMP Report of...
379
EIA / EMP Report of Goendamal Graphite Ore Mines of Shri Natwar Lal Agrawal, Balangir, District, Odisha. Vet By : SHRI ENVIRONMENTAL TECHNOLOGY INSTITUTE ,NEW DELHI i GOENDAMAL GRAPHITE ORE MINES Over an area of 63.771 Ha. Vill: Goendamal, P.S.: Turekela, P.O.: Mahulpati Dist.: Bolangir, Odisha LESSEE: SRI NATWARLAL AGRAWAL ENVIRONMENTAL IMPACT ASSESSMENT AND ENVIRONMENT MANAGEMENT PLAN EIA CONSULTANT SHRI ENVIRONMENTAL TECHNOLOGY INSTITUTE Registered Off. : WZ – 679 A Nangal Raya, Padam Basti, New Delhi - 46
Transcript of ENVIRONMENTAL IMPACT ASSESSMENT EIA / EMP Report of...
EIA / EMP Report of Goendamal Graphite Ore Mines of Shri Natwar Lal Agrawal, Balangir,District, Odisha.
Vet By : SHRI ENVIRONMENTAL TECHNOLOGY INSTITUTE ,NEW DELHI
i
GOENDAMAL GRAPHITE ORE MINESOver an area of 63.771 Ha.
Vill: Goendamal, P.S.: Turekela, P.O.: MahulpatiDist.: Bolangir, Odisha
LESSEE: SRI NATWARLAL AGRAWAL
ENVIRONMENTAL IMPACT ASSESSMENTAND ENVIRONMENT MANAGEMENT PLAN
EIA CONSULTANT
SHRI ENVIRONMENTAL TECHNOLOGY INSTITUTERegistered Off. : WZ – 679 A
Nangal Raya, Padam Basti, New Delhi - 46
EIA / EMP Report of Goendamal Graphite Ore Mines of Shri Natwar Lal Agrawal, Balangir,District, Odisha.
Vet By : SHRI ENVIRONMENTAL TECHNOLOGY INSTITUTE ,NEW DELHI
ii
EIA CONSULTANT:
SHRI ENVIRONMENTAL TECHNOLOGY INSTITUTERegistered Off. : WZ – 679 A
Nangal Raya, Padam Basti, New Delhi - 46
GOENDAMAL GRAPHITE MINESOver an area of 63.771 Ha.
Vill: Goendamal, P.S.: Turekela, P.O.: MahulpatiDist.: Bolangir, Odisha
LESSEE: SRI NATWARLAL AGRAWAL1.
LESSEE: SRI NATWARLAL AGRAWAL
Agenda no. (2.2) HELD ON 08.07.2014
REVISED ENVIRONMENTAL IMPACT ASSESSMENT ANDENVIRONMENT
MANAGEMENT PLAN AS PER THE MINUTES OF THE 21ST RE-CONSTITUTED EAC .
EIA / EMP Report of Goendamal Graphite Ore Mines of Shri Natwar Lal Agrawal, Balangir,District, Odisha.
Vet By : SHRI ENVIRONMENTAL TECHNOLOGY INSTITUTE ,NEW DELHI
iii
EIA / EMP Report of Goendamal Graphite Ore Mines of Shri Natwar Lal Agrawal, Balangir,District, Odisha.
Vet By : SHRI ENVIRONMENTAL TECHNOLOGY INSTITUTE ,NEW DELHI
iv
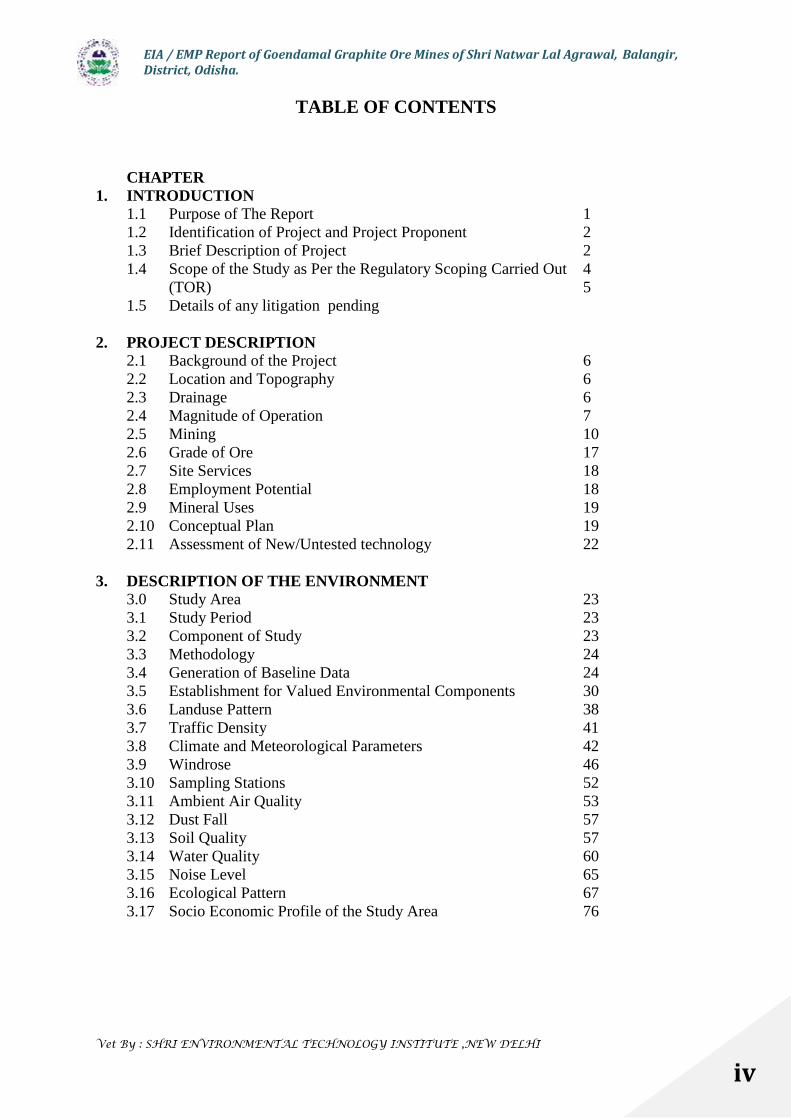
TABLE OF CONTENTS
CHAPTER1. INTRODUCTION
1.1 Purpose of The Report 11.2 Identification of Project and Project Proponent 21.3 Brief Description of Project 21.4
1.5
Scope of the Study as Per the Regulatory Scoping Carried Out(TOR)Details of any litigation pending
45
2. PROJECT DESCRIPTION2.1 Background of the Project 62.2 Location and Topography 62.3 Drainage 62.4 Magnitude of Operation 72.5 Mining 102.6 Grade of Ore 172.7 Site Services 182.8 Employment Potential 182.9 Mineral Uses 192.10 Conceptual Plan 192.11 Assessment of New/Untested technology 22
3. DESCRIPTION OF THE ENVIRONMENT3.0 Study Area 233.1 Study Period 233.2 Component of Study 233.3 Methodology 243.4 Generation of Baseline Data 243.5 Establishment for Valued Environmental Components 303.6 Landuse Pattern 383.7 Traffic Density 413.8 Climate and Meteorological Parameters 423.9 Windrose 463.10 Sampling Stations 523.11 Ambient Air Quality 533.12 Dust Fall 573.13 Soil Quality 573.14 Water Quality 603.15 Noise Level 653.16 Ecological Pattern 673.17 Socio Economic Profile of the Study Area 76
EIA / EMP Report of Goendamal Graphite Ore Mines of Shri Natwar Lal Agrawal, Balangir,District, Odisha.
Vet By : SHRI ENVIRONMENTAL TECHNOLOGY INSTITUTE ,NEW DELHI
v
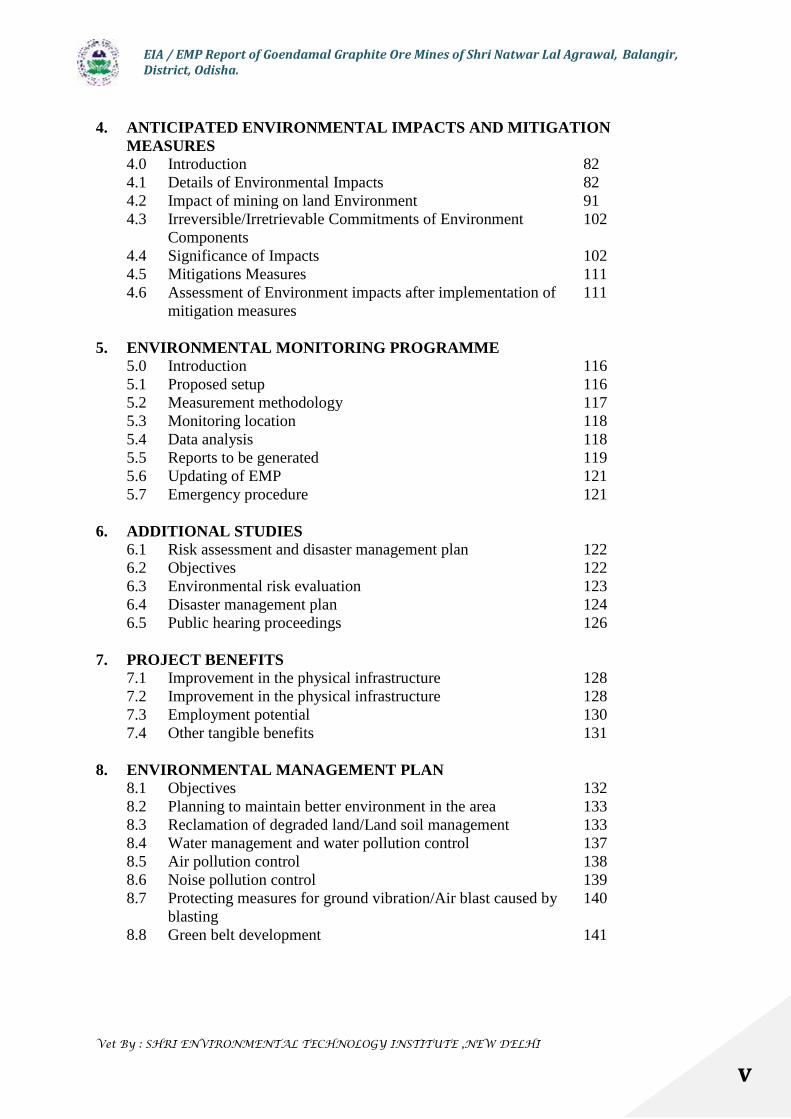
4. ANTICIPATED ENVIRONMENTAL IMPACTS AND MITIGATIONMEASURES4.0 Introduction 824.1 Details of Environmental Impacts 824.2 Impact of mining on land Environment 914.3 Irreversible/Irretrievable Commitments of Environment
Components102
4.4 Significance of Impacts 1024.5 Mitigations Measures 1114.6 Assessment of Environment impacts after implementation of
mitigation measures111
5. ENVIRONMENTAL MONITORING PROGRAMME5.0 Introduction 1165.1 Proposed setup 1165.2 Measurement methodology 1175.3 Monitoring location 1185.4 Data analysis 1185.5 Reports to be generated 1195.6 Updating of EMP 1215.7 Emergency procedure 121
6. ADDITIONAL STUDIES6.1 Risk assessment and disaster management plan 1226.2 Objectives 1226.3 Environmental risk evaluation 1236.4 Disaster management plan 1246.5 Public hearing proceedings 126
7. PROJECT BENEFITS7.1 Improvement in the physical infrastructure 1287.2 Improvement in the physical infrastructure 1287.3 Employment potential 1307.4 Other tangible benefits 131
8. ENVIRONMENTAL MANAGEMENT PLAN8.1 Objectives 1328.2 Planning to maintain better environment in the area 1338.3 Reclamation of degraded land/Land soil management 1338.4 Water management and water pollution control 1378.5 Air pollution control 1388.6 Noise pollution control 1398.7 Protecting measures for ground vibration/Air blast caused by
blasting140
8.8 Green belt development 141

EIA / EMP Report of Goendamal Graphite Ore Mines of Shri Natwar Lal Agrawal, Balangir,District, Odisha.
Vet By : SHRI ENVIRONMENTAL TECHNOLOGY INSTITUTE ,NEW DELHI
vi
8.9 Socio economic activities 1448.10 Occupational health and safety 1458.11 EMP implementation and monitoring 1478.12 Organization manpower and training 1498.13 Cost of environmental control measures 151
9. SUMMARY AND CONCLUSION9.1 Project details 1529.2 Project Profile 1539.3 Baseline environment status 1549.4 Anticipated environmental impacts and mitigation measures 1579.5 Environmental management plan 1599.6 Socio economic activities 161
10. DISCLOSURE OF CONSULTANT ENGAGED 162
EIA / EMP Report of Goendamal Graphite Ore Mines of Shri Natwar Lal Agrawal, Balangir,District, Odisha.
Vet By : SHRI ENVIRONMENTAL TECHNOLOGY INSTITUTE ,NEW DELHI
vii
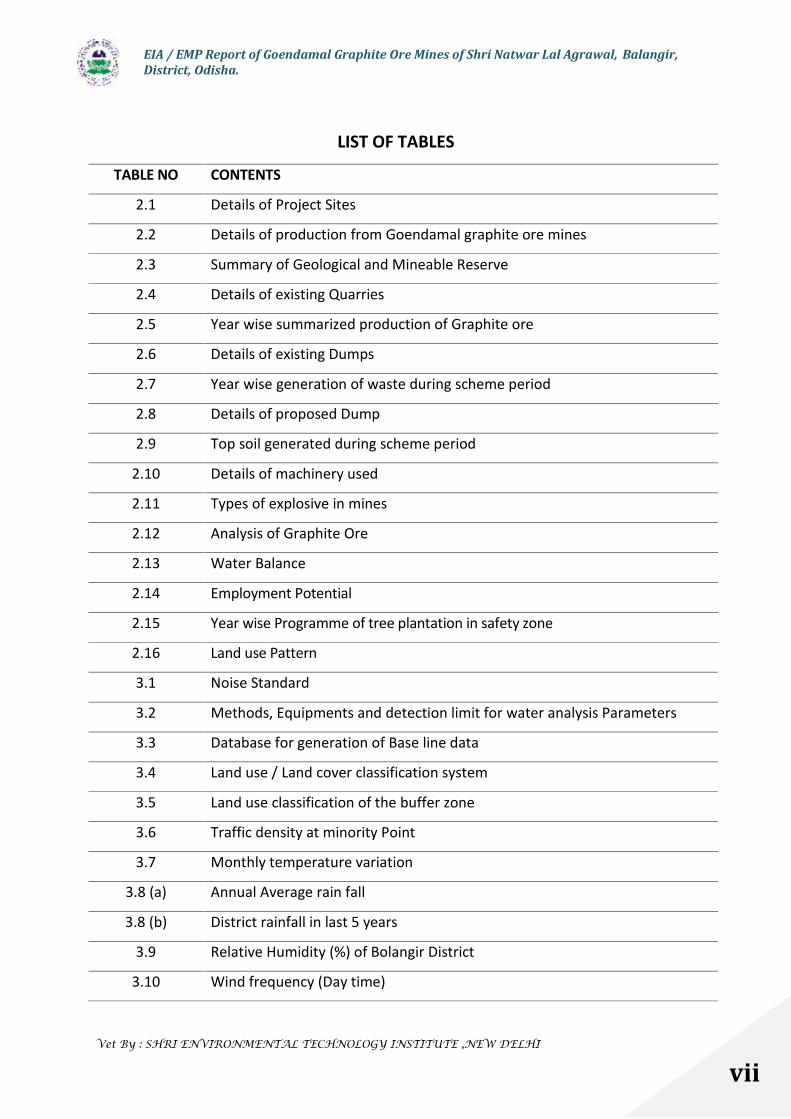
LIST OF TABLES
TABLE NO CONTENTS
2.1 Details of Project Sites
2.2 Details of production from Goendamal graphite ore mines
2.3 Summary of Geological and Mineable Reserve
2.4 Details of existing Quarries
2.5 Year wise summarized production of Graphite ore
2.6 Details of existing Dumps
2.7 Year wise generation of waste during scheme period
2.8 Details of proposed Dump
2.9 Top soil generated during scheme period
2.10 Details of machinery used
2.11 Types of explosive in mines
2.12 Analysis of Graphite Ore
2.13 Water Balance
2.14 Employment Potential
2.15 Year wise Programme of tree plantation in safety zone
2.16 Land use Pattern
3.1 Noise Standard
3.2 Methods, Equipments and detection limit for water analysis Parameters
3.3 Database for generation of Base line data
3.4 Land use / Land cover classification system
3.5 Land use classification of the buffer zone
3.6 Traffic density at minority Point
3.7 Monthly temperature variation
3.8 (a) Annual Average rain fall
3.8 (b) District rainfall in last 5 years
3.9 Relative Humidity (%) of Bolangir District
3.10 Wind frequency (Day time)

EIA / EMP Report of Goendamal Graphite Ore Mines of Shri Natwar Lal Agrawal, Balangir,District, Odisha.
Vet By : SHRI ENVIRONMENTAL TECHNOLOGY INSTITUTE ,NEW DELHI
viii
3.11 Wind frequency (Night time)
3.12 Wind frequency (24hrs)
3.13 Sampling stations
3.14 (a) Summarized AAQ Monitaring Results
3.14 (b) Chemical Composition of RSPM & NRPM Monitoring Result
3.15 National Ambient Air quality Standard
3.16 Dust fall in the study Area
3.17 Soil Analysis Results
3.18 Fertility status of Soil in the study area
3.18(A) Soil Analysis during April 2014
3.19 Location for water sample collection
3.20 Surface water Analysis Result
3.21 Ground water Analysis Results
3.21(a) Surface and Ground water analysis during April 2014
3.22 Noise level Monitoring Data of the study region
3.23 Reserve forest within 10km radius
3.24 Checklist of Ecological Field Study
3.25 Demographic patterns of the study area
3.26 Population and occupational Pattern
3.27 Occupational pattern of the study area
3.28 Educational pattern of the Project Area
3.29 Irrigation Facilities
4.1 Overview of Environmental Impacts Due to Different Phases of Mining
4.2 Pedimental concentration in OB leachate
4.3 Sources of Air Pollution
4.4 Predicted Maximum Ground Level Concentration Values of PM10
4.5 Noise Generated By Machinery Used in Mining
4.6 Health Hazards By Different Noise Levels
4.7 Determination of EII For Category “A” Parameters
4.8 Determination of EII for Category “B” Parameters
EIA / EMP Report of Goendamal Graphite Ore Mines of Shri Natwar Lal Agrawal, Balangir,District, Odisha.
Vet By : SHRI ENVIRONMENTAL TECHNOLOGY INSTITUTE ,NEW DELHI
ix
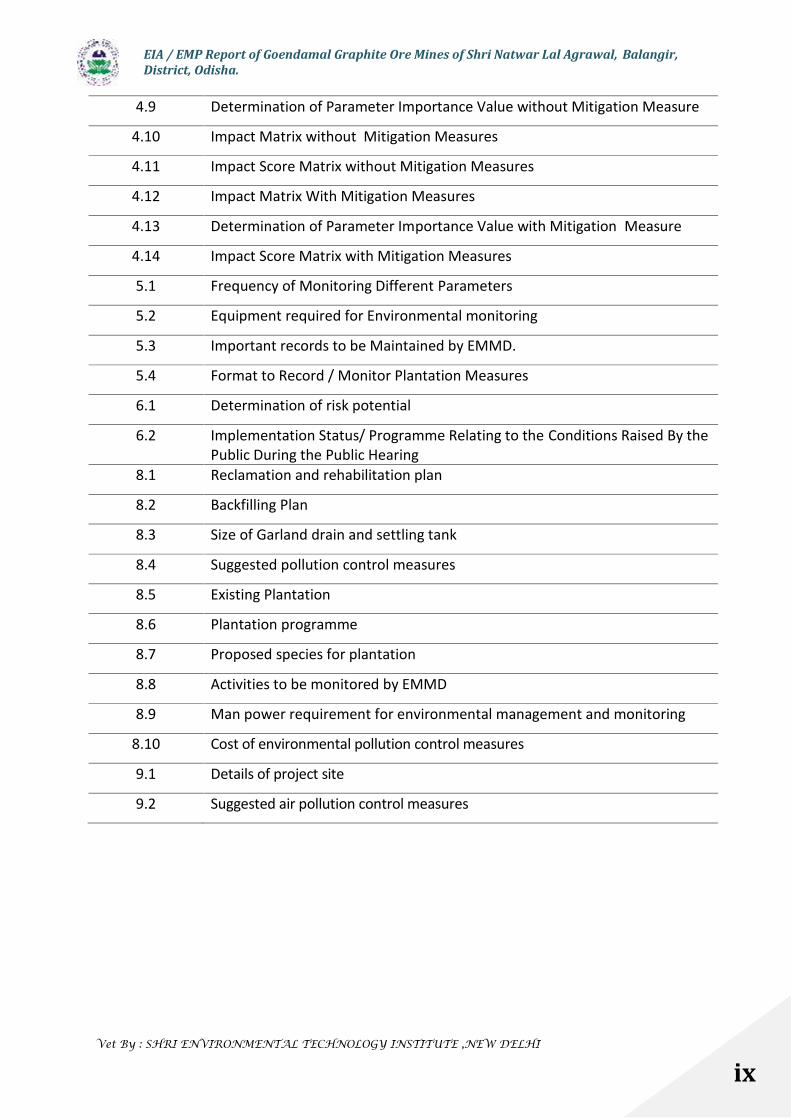
4.9 Determination of Parameter Importance Value without Mitigation Measure
4.10 Impact Matrix without Mitigation Measures
4.11 Impact Score Matrix without Mitigation Measures
4.12 Impact Matrix With Mitigation Measures
4.13 Determination of Parameter Importance Value with Mitigation Measure
4.14 Impact Score Matrix with Mitigation Measures
5.1 Frequency of Monitoring Different Parameters
5.2 Equipment required for Environmental monitoring
5.3 Important records to be Maintained by EMMD.
5.4 Format to Record / Monitor Plantation Measures
6.1 Determination of risk potential
6.2 Implementation Status/ Programme Relating to the Conditions Raised By thePublic During the Public Hearing
8.1 Reclamation and rehabilitation plan
8.2 Backfilling Plan
8.3 Size of Garland drain and settling tank
8.4 Suggested pollution control measures
8.5 Existing Plantation
8.6 Plantation programme
8.7 Proposed species for plantation
8.8 Activities to be monitored by EMMD
8.9 Man power requirement for environmental management and monitoring
8.10 Cost of environmental pollution control measures
9.1 Details of project site
9.2 Suggested air pollution control measures
EIA / EMP Report of Goendamal Graphite Ore Mines of Shri Natwar Lal Agrawal, Balangir,District, Odisha.
Vet By : SHRI ENVIRONMENTAL TECHNOLOGY INSTITUTE ,NEW DELHI
x
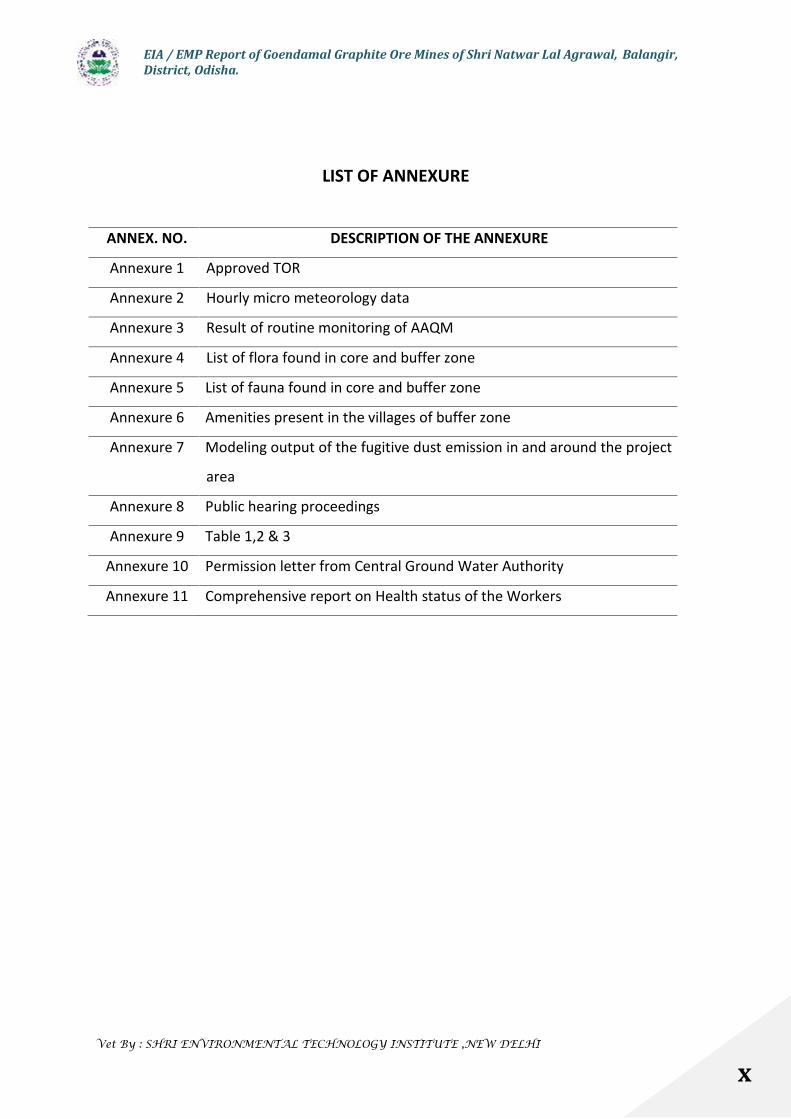
LIST OF ANNEXURE
ANNEX. NO. DESCRIPTION OF THE ANNEXURE
Annexure 1 Approved TOR
Annexure 2 Hourly micro meteorology data
Annexure 3 Result of routine monitoring of AAQM
Annexure 4 List of flora found in core and buffer zone
Annexure 5 List of fauna found in core and buffer zone
Annexure 6 Amenities present in the villages of buffer zone
Annexure 7 Modeling output of the fugitive dust emission in and around the project
area
Annexure 8 Public hearing proceedings
Annexure 9 Table 1,2 & 3
Annexure 10 Permission letter from Central Ground Water Authority
Annexure 11 Comprehensive report on Health status of the Workers
EIA / EMP Report of Goendamal Graphite Ore Mines of Shri Natwar Lal Agrawal, Balangir,District, Odisha.
Vet By : SHRI ENVIRONMENTAL TECHNOLOGY INSTITUTE ,NEW DELHI
xi
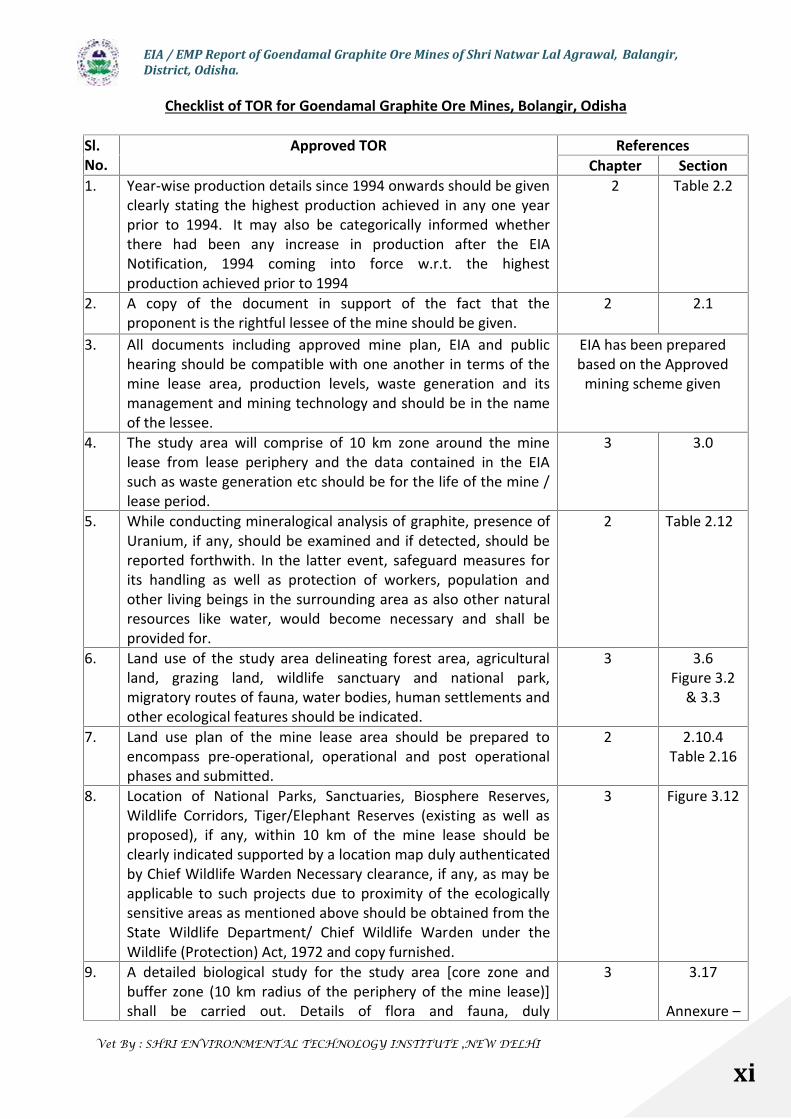
Checklist of TOR for Goendamal Graphite Ore Mines, Bolangir, Odisha
Sl.No.
Approved TOR ReferencesChapter Section
1. Year-wise production details since 1994 onwards should be givenclearly stating the highest production achieved in any one yearprior to 1994. It may also be categorically informed whetherthere had been any increase in production after the EIANotification, 1994 coming into force w.r.t. the highestproduction achieved prior to 1994
2 Table 2.2
2. A copy of the document in support of the fact that theproponent is the rightful lessee of the mine should be given.
2 2.1
3. All documents including approved mine plan, EIA and publichearing should be compatible with one another in terms of themine lease area, production levels, waste generation and itsmanagement and mining technology and should be in the nameof the lessee.
EIA has been preparedbased on the Approved
mining scheme given
4. The study area will comprise of 10 km zone around the minelease from lease periphery and the data contained in the EIAsuch as waste generation etc should be for the life of the mine /lease period.
3 3.0
5. While conducting mineralogical analysis of graphite, presence ofUranium, if any, should be examined and if detected, should bereported forthwith. In the latter event, safeguard measures forits handling as well as protection of workers, population andother living beings in the surrounding area as also other naturalresources like water, would become necessary and shall beprovided for.
2 Table 2.12
6. Land use of the study area delineating forest area, agriculturalland, grazing land, wildlife sanctuary and national park,migratory routes of fauna, water bodies, human settlements andother ecological features should be indicated.
3 3.6Figure 3.2
& 3.3
7. Land use plan of the mine lease area should be prepared toencompass pre-operational, operational and post operationalphases and submitted.
2 2.10.4Table 2.16
8. Location of National Parks, Sanctuaries, Biosphere Reserves,Wildlife Corridors, Tiger/Elephant Reserves (existing as well asproposed), if any, within 10 km of the mine lease should beclearly indicated supported by a location map duly authenticatedby Chief Wildlife Warden Necessary clearance, if any, as may beapplicable to such projects due to proximity of the ecologicallysensitive areas as mentioned above should be obtained from theState Wildlife Department/ Chief Wildlife Warden under theWildlife (Protection) Act, 1972 and copy furnished.
3 Figure 3.12
9. A detailed biological study for the study area [core zone andbuffer zone (10 km radius of the periphery of the mine lease)]shall be carried out. Details of flora and fauna, duly
3 3.17
Annexure –
EIA / EMP Report of Goendamal Graphite Ore Mines of Shri Natwar Lal Agrawal, Balangir,District, Odisha.
Vet By : SHRI ENVIRONMENTAL TECHNOLOGY INSTITUTE ,NEW DELHI
xii
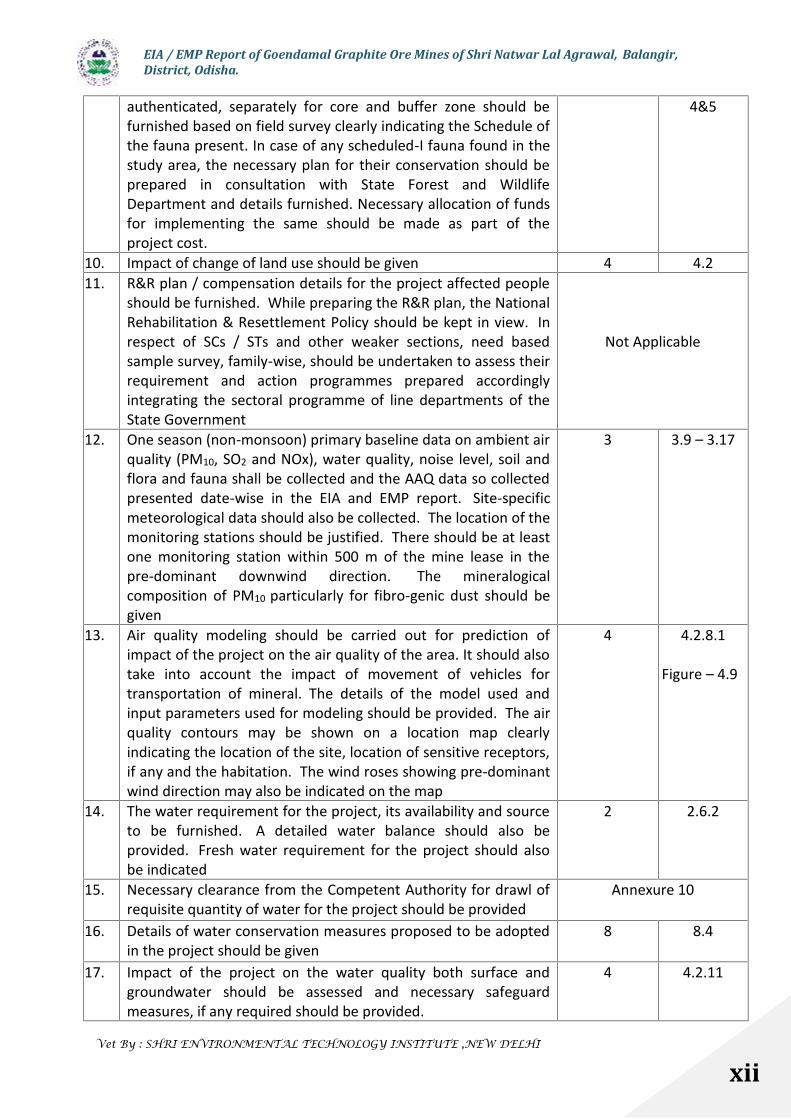
authenticated, separately for core and buffer zone should befurnished based on field survey clearly indicating the Schedule ofthe fauna present. In case of any scheduled-I fauna found in thestudy area, the necessary plan for their conservation should beprepared in consultation with State Forest and WildlifeDepartment and details furnished. Necessary allocation of fundsfor implementing the same should be made as part of theproject cost.
4&5
10. Impact of change of land use should be given 4 4.211. R&R plan / compensation details for the project affected people
should be furnished. While preparing the R&R plan, the NationalRehabilitation & Resettlement Policy should be kept in view. Inrespect of SCs / STs and other weaker sections, need basedsample survey, family-wise, should be undertaken to assess theirrequirement and action programmes prepared accordinglyintegrating the sectoral programme of line departments of theState Government
Not Applicable
12. One season (non-monsoon) primary baseline data on ambient airquality (PM10, SO2 and NOx), water quality, noise level, soil andflora and fauna shall be collected and the AAQ data so collectedpresented date-wise in the EIA and EMP report. Site-specificmeteorological data should also be collected. The location of themonitoring stations should be justified. There should be at leastone monitoring station within 500 m of the mine lease in thepre-dominant downwind direction. The mineralogicalcomposition of PM10 particularly for fibro-genic dust should begiven
3 3.9 – 3.17
13. Air quality modeling should be carried out for prediction ofimpact of the project on the air quality of the area. It should alsotake into account the impact of movement of vehicles fortransportation of mineral. The details of the model used andinput parameters used for modeling should be provided. The airquality contours may be shown on a location map clearlyindicating the location of the site, location of sensitive receptors,if any and the habitation. The wind roses showing pre-dominantwind direction may also be indicated on the map
4 4.2.8.1
Figure – 4.9
14. The water requirement for the project, its availability and sourceto be furnished. A detailed water balance should also beprovided. Fresh water requirement for the project should alsobe indicated
2 2.6.2
15. Necessary clearance from the Competent Authority for drawl ofrequisite quantity of water for the project should be provided
Annexure 10
16. Details of water conservation measures proposed to be adoptedin the project should be given
8 8.4
17. Impact of the project on the water quality both surface andgroundwater should be assessed and necessary safeguardmeasures, if any required should be provided.
4 4.2.11
EIA / EMP Report of Goendamal Graphite Ore Mines of Shri Natwar Lal Agrawal, Balangir,District, Odisha.
Vet By : SHRI ENVIRONMENTAL TECHNOLOGY INSTITUTE ,NEW DELHI
xiii
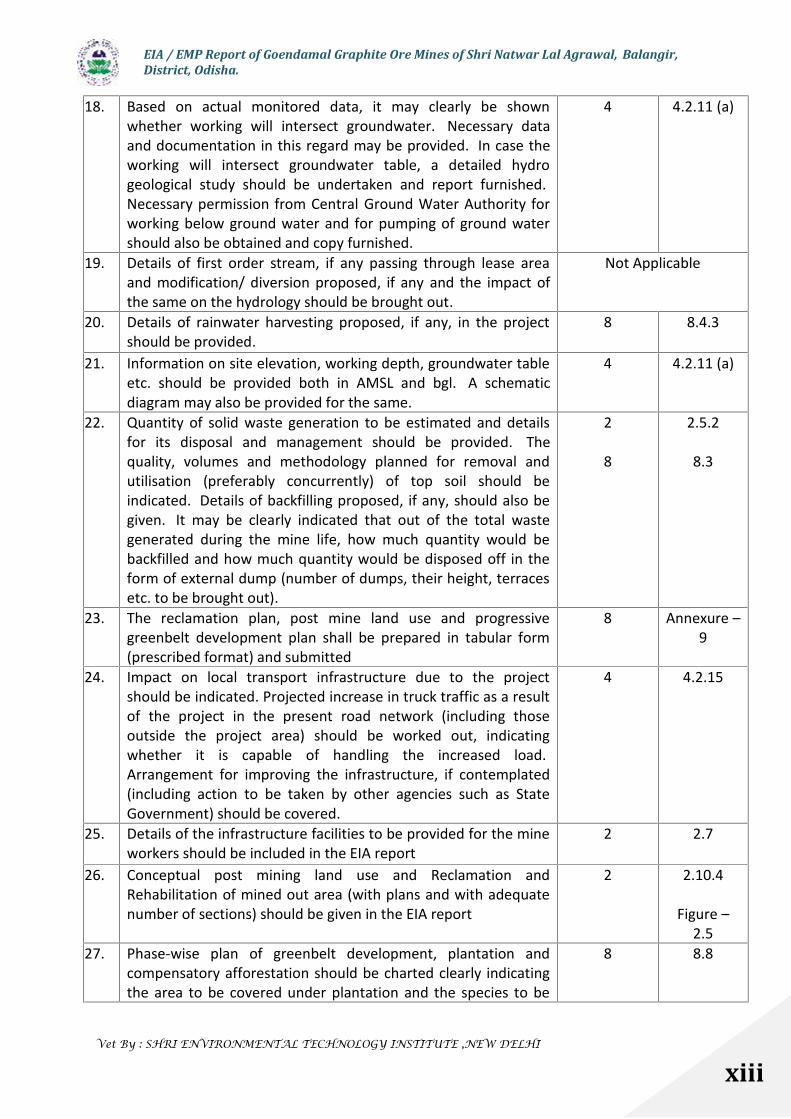
18. Based on actual monitored data, it may clearly be shownwhether working will intersect groundwater. Necessary dataand documentation in this regard may be provided. In case theworking will intersect groundwater table, a detailed hydrogeological study should be undertaken and report furnished.Necessary permission from Central Ground Water Authority forworking below ground water and for pumping of ground watershould also be obtained and copy furnished.
4 4.2.11 (a)
19. Details of first order stream, if any passing through lease areaand modification/ diversion proposed, if any and the impact ofthe same on the hydrology should be brought out.
Not Applicable
20. Details of rainwater harvesting proposed, if any, in the projectshould be provided.
8 8.4.3
21. Information on site elevation, working depth, groundwater tableetc. should be provided both in AMSL and bgl. A schematicdiagram may also be provided for the same.
4 4.2.11 (a)
22. Quantity of solid waste generation to be estimated and detailsfor its disposal and management should be provided. Thequality, volumes and methodology planned for removal andutilisation (preferably concurrently) of top soil should beindicated. Details of backfilling proposed, if any, should also begiven. It may be clearly indicated that out of the total wastegenerated during the mine life, how much quantity would bebackfilled and how much quantity would be disposed off in theform of external dump (number of dumps, their height, terracesetc. to be brought out).
2
8
2.5.2
8.3
23. The reclamation plan, post mine land use and progressivegreenbelt development plan shall be prepared in tabular form(prescribed format) and submitted
8 Annexure –9
24. Impact on local transport infrastructure due to the projectshould be indicated. Projected increase in truck traffic as a resultof the project in the present road network (including thoseoutside the project area) should be worked out, indicatingwhether it is capable of handling the increased load.Arrangement for improving the infrastructure, if contemplated(including action to be taken by other agencies such as StateGovernment) should be covered.
4 4.2.15
25. Details of the infrastructure facilities to be provided for the mineworkers should be included in the EIA report
2 2.7
26. Conceptual post mining land use and Reclamation andRehabilitation of mined out area (with plans and with adequatenumber of sections) should be given in the EIA report
2 2.10.4
Figure –2.5
27. Phase-wise plan of greenbelt development, plantation andcompensatory afforestation should be charted clearly indicatingthe area to be covered under plantation and the species to be
8 8.8
EIA / EMP Report of Goendamal Graphite Ore Mines of Shri Natwar Lal Agrawal, Balangir,District, Odisha.
Vet By : SHRI ENVIRONMENTAL TECHNOLOGY INSTITUTE ,NEW DELHI
xiv
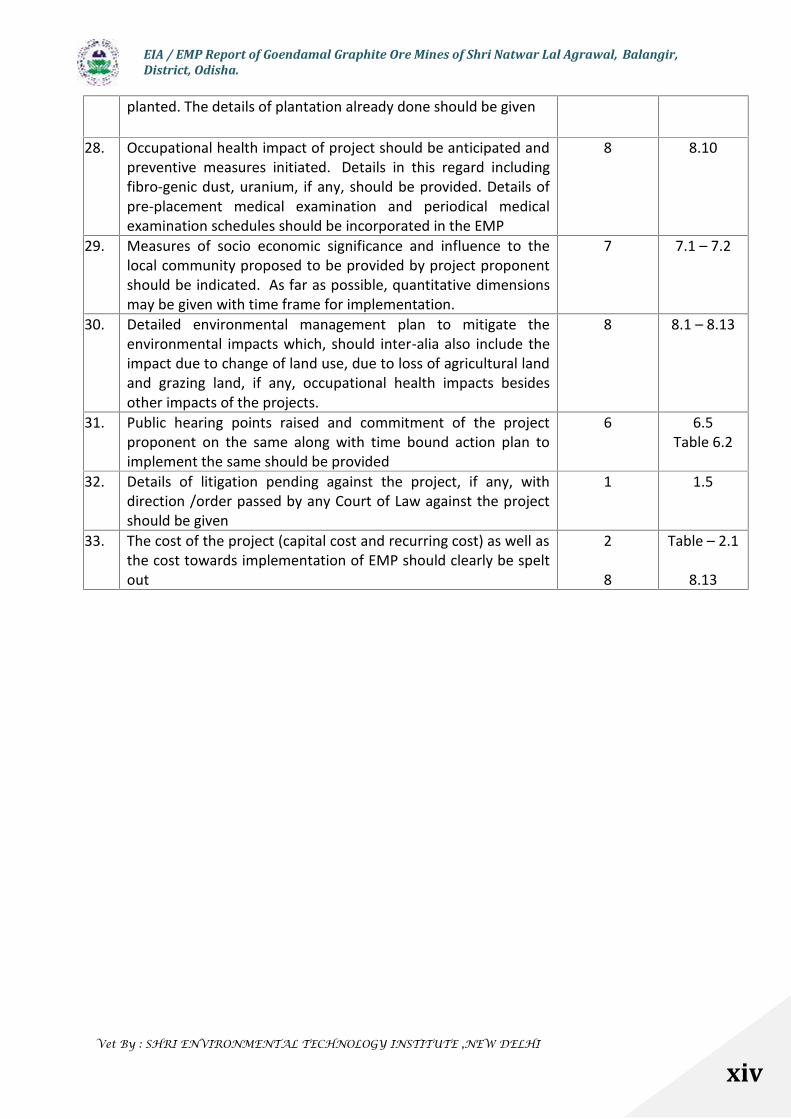
planted. The details of plantation already done should be given
28. Occupational health impact of project should be anticipated andpreventive measures initiated. Details in this regard includingfibro-genic dust, uranium, if any, should be provided. Details ofpre-placement medical examination and periodical medicalexamination schedules should be incorporated in the EMP
8 8.10
29. Measures of socio economic significance and influence to thelocal community proposed to be provided by project proponentshould be indicated. As far as possible, quantitative dimensionsmay be given with time frame for implementation.
7 7.1 – 7.2
30. Detailed environmental management plan to mitigate theenvironmental impacts which, should inter-alia also include theimpact due to change of land use, due to loss of agricultural landand grazing land, if any, occupational health impacts besidesother impacts of the projects.
8 8.1 – 8.13
31. Public hearing points raised and commitment of the projectproponent on the same along with time bound action plan toimplement the same should be provided
6 6.5Table 6.2
32. Details of litigation pending against the project, if any, withdirection /order passed by any Court of Law against the projectshould be given
1 1.5
33. The cost of the project (capital cost and recurring cost) as well asthe cost towards implementation of EMP should clearly be speltout
2
8
Table – 2.1
8.13
EIA / EMP Report of Goendamal Graphite Ore Mines of Shri Natwar Lal Agrawal, Balangir,District, Odisha.
Vet By : SHRI ENVIRONMENTAL TECHNOLOGY INSTITUTE ,NEW DELHI
1
Nature has gifted Odisha with vast and extensive mineral resources. Mining of
minerals and extraction of metals were in practice in ancient Odisha. After independence,
rapid growths of mining activities in the state mining activities have depleted resources of
many deposits, new findings have also added to it. Graphite mining is an important activity
in Odisha. However, the enhanced mining activity is adversely affecting the environment.
For the past few decades, areas in and around the mining activities are getting affected by
the progressively increasing pollution load. Mining having adverse impact on natural
resources like land, forest, water, flora and fauna. Side by side, there is generation of solid,
liquid and gaseous refuge polluting air, water, soil and scenic natural beauty. The water
table is being lowered resulting in more dryness, dusty atmosphere, decreasing rainfall with
consequent less growth of vegetation. Now - a - days the growing concern towards the man
& environment has enforced the environmental ethics into the corporate levels. Through
the Environmental Impact Assessment exercise, the anticipated adverse impacts are being
identified and Environmental Management Plan has been formulated to mitigate the
impacts and sustain economic growth in harmony with nature.
1.1 Purpose of the Report
The Environment Impact Assessment and Environmental Management Plan of
Goendamal Graphite deposit address all the environment related issues and is prepared in
accordance with the requirements Ministry of Environment and Forest, Govt. of India, EIA
notification (2006) and subsequent ammendments.
The EIA/EMP report is based on the data generated from March 2011 to May 2011.
The baseline data for one month (April 2014) has been generated by M/s Cleenviron Pvt.
Ltd., Odisha forrevalidation of the EIA report.
The study evaluates the prevailing baseline environmental conditions. The adverse
impacts are identified and possible mitigation plan has been drawn in order to protect the
ecological system.
CHAPTER 1
INTRODUCTION
EIA / EMP Report of Goendamal Graphite Ore Mines of Shri Natwar Lal Agrawal, Balangir,District, Odisha.
Vet By : SHRI ENVIRONMENTAL TECHNOLOGY INSTITUTE ,NEW DELHI
2
The objectives of the study are as below:
- Establish the present baseline scenario through primary field monitoring and
secondary data for different environment descriptors such as air, water,
climate, noise, traffic, fauna, socio-economy.
- Identify the activities of mining that have bearing on the environment
- Assess the impact of proposed project activity of Graphite ore mining.
- Suggest preventive mitigation measures
- Draw an environmental management plan including monitoring programme.
- Prepare disaster management plan.
1.2 Identification of Project and Project Proponent
1.2.1 Project:
Name of the project : M/s Goendamal Graphite mines
Location : Vill:Goendamal,P.S.: Turekela,
Dist.: Bolangir, Odisha.
Area : 63.771 Ha
Objective of the project : Extraction of Graphite
Production : Enhancement in production from 3500 MT/ annum to
15,000 MT/ annum of crude graphite ore.
Screening Category : A
1.2.2 Proponent: Shri Natwarlal Agrawal.
Contact Address : At.: Balibandha, P.O.: Sambalpur, Dist.: Sambalpur, Odisha.
1.3 Brief Description of Project
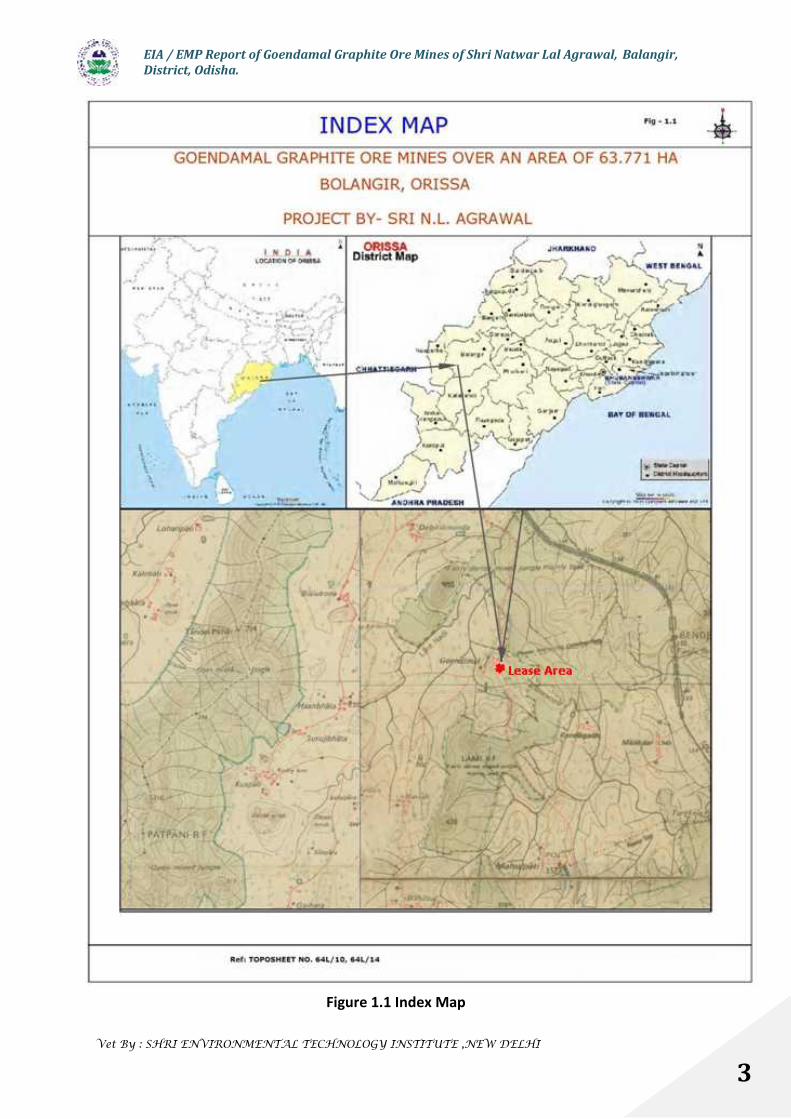
GoendamalGraphite mines ore mines covers an area of63.771 Ha and is situated in
the village Goendamal,P.S.: Turekela, Dist.: Bolangir, Odisha. The index map showing the
lease location is given in figure 1.1. The Graphite mines over an area 63.771 Ha was granted
on 18.03.1998 in favor of Shri Natwarlal Agrawal for a period of 30 years and was executed
on 11.05.1998. Validity of the lease is upto 10.05.2028. Actual achievement from 2003-2004
to 2009-2010 has been reviewed in the scheme; the mine was closed since October 2009 till
date due to non availability of Environmental clearance. The proposal of the current scheme
for 2013-14 to 2017-2018 has been presented.
EIA / EMP Report of Goendamal Graphite Ore Mines of Shri Natwar Lal Agrawal, Balangir,District, Odisha.
Vet By : SHRI ENVIRONMENTAL TECHNOLOGY INSTITUTE ,NEW DELHI
3
Figure 1.1 Index Map

EIA / EMP Report of Goendamal Graphite Ore Mines of Shri Natwar Lal Agrawal, Balangir,District, Odisha.
Vet By : SHRI ENVIRONMENTAL TECHNOLOGY INSTITUTE ,NEW DELHI
4
The present proposal is for enhancement in production of crude graphite from 3500
MT/ annum to 15,000 MT/ annum.
1.3.1 Importance of the Project to Country and Region
Graphite is an important strategic mineral of our country and presently about 2000
tones of finished graphite is being imported every year. It is one of the most important
industrial mineral having multifarious uses because of unique physical and chemical
characters such as high melting point, extreme chemical inertness, good electrical
conductivity, low specific gravity and easy translation. The production of graphite ore in
our country is insufficient to cater the demand of different industries. The beneficiated
graphite ore produce fromGoendamal Graphite Ore mines will cater the raw material
for different industries like refractories, Pencil industries. of the locality.
The proposed project with judicious and satisfactory mining methodologies will bring in
a better standard of living by improving the existing infrastructural facilities, job
opportunities and also the health status of the surrounding areas.
In a larger perspective, it will improve our country’s growth in production of graphite
ore.
1.4 Scope ofthe Study as Per the Regulatory Scoping Carried Out (Terms of Reference
– TOR)
The approved TOR has been attached as Annexure 1. EIA study was carried out in
the core zone (ML area) & buffer zone (10 km around the ML area) & the aspects covered in
the study are as follows:
1.4.1 Study of project attributes including all the operations and functions that are likely to
affect the environment.
1.4.2 Baseline Environmental Survey which includes monitoring of the following
attributes:
Ambient Air Quality
Meteorology

EIA / EMP Report of Goendamal Graphite Ore Mines of Shri Natwar Lal Agrawal, Balangir,District, Odisha.
Vet By : SHRI ENVIRONMENTAL TECHNOLOGY INSTITUTE ,NEW DELHI
5
Noise level
Water Quality (Surface and Ground)
As surface water will be drawn, hydrological study and effect on river
flow
Soil quality
Remote Sensing Study (satellite data Collection) for forest cover
Flora & Fauna
Socio-economic Survey
1.4.3 Impact prediction and Impact assessment
1.4.4 Suggest methods and measures contemplated for minimizing environmental
damage.
1.4.5 Risk and Disaster Management Studies.
1.5 Details of Any Litigation Pending
A violation case under environmental protection act is pending in court of Subdivisional
Judicial Magistrate Titlagar, vide case no. 2 (c)C case no. 8-2013.
EIA / EMP Report of Goendamal Graphite Ore Mines of Shri Natwar Lal Agrawal, Balangir,District, Odisha.
Vet By : SHRI ENVIRONMENTAL TECHNOLOGY INSTITUTE ,NEW DELHI
6
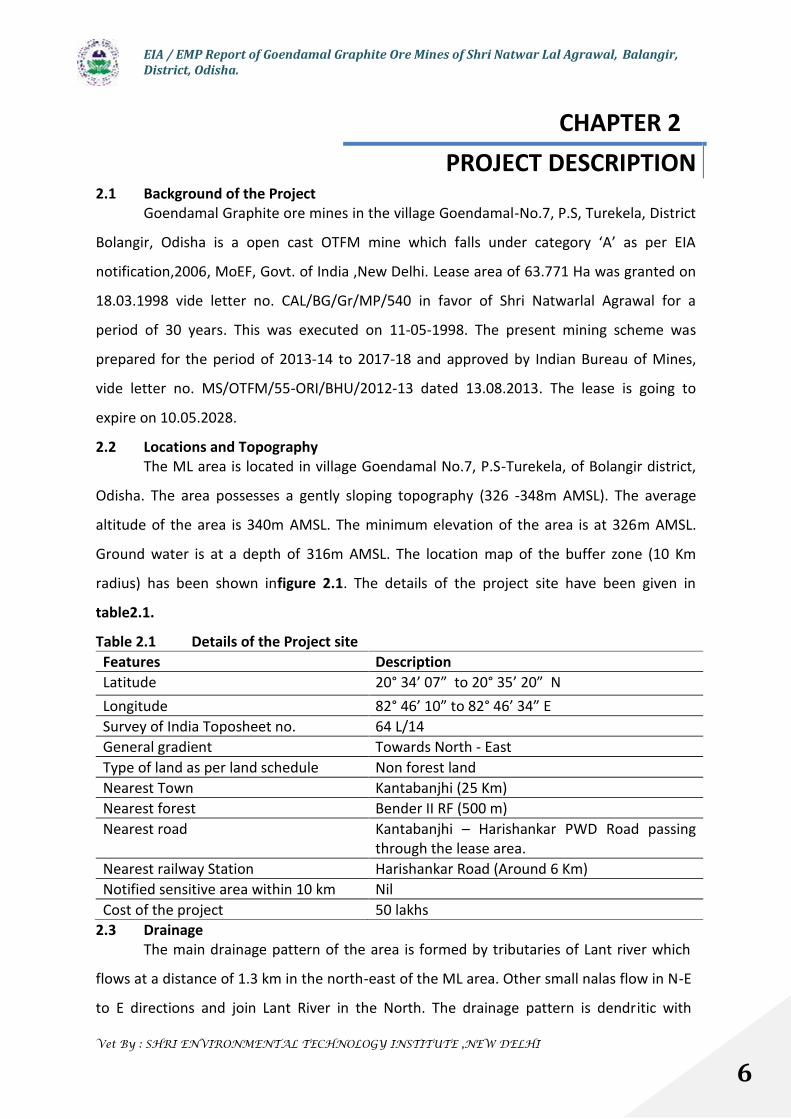
2.1 Background of the ProjectGoendamal Graphite ore mines in the village Goendamal-No.7, P.S, Turekela, District
Bolangir, Odisha is a open cast OTFM mine which falls under category ‘A’ as per EIA
notification,2006, MoEF, Govt. of India ,New Delhi. Lease area of 63.771 Ha was granted on
18.03.1998 vide letter no. CAL/BG/Gr/MP/540 in favor of Shri Natwarlal Agrawal for a
period of 30 years. This was executed on 11-05-1998. The present mining scheme was
prepared for the period of 2013-14 to 2017-18 and approved by Indian Bureau of Mines,
vide letter no. MS/OTFM/55-ORI/BHU/2012-13 dated 13.08.2013. The lease is going to
expire on 10.05.2028.
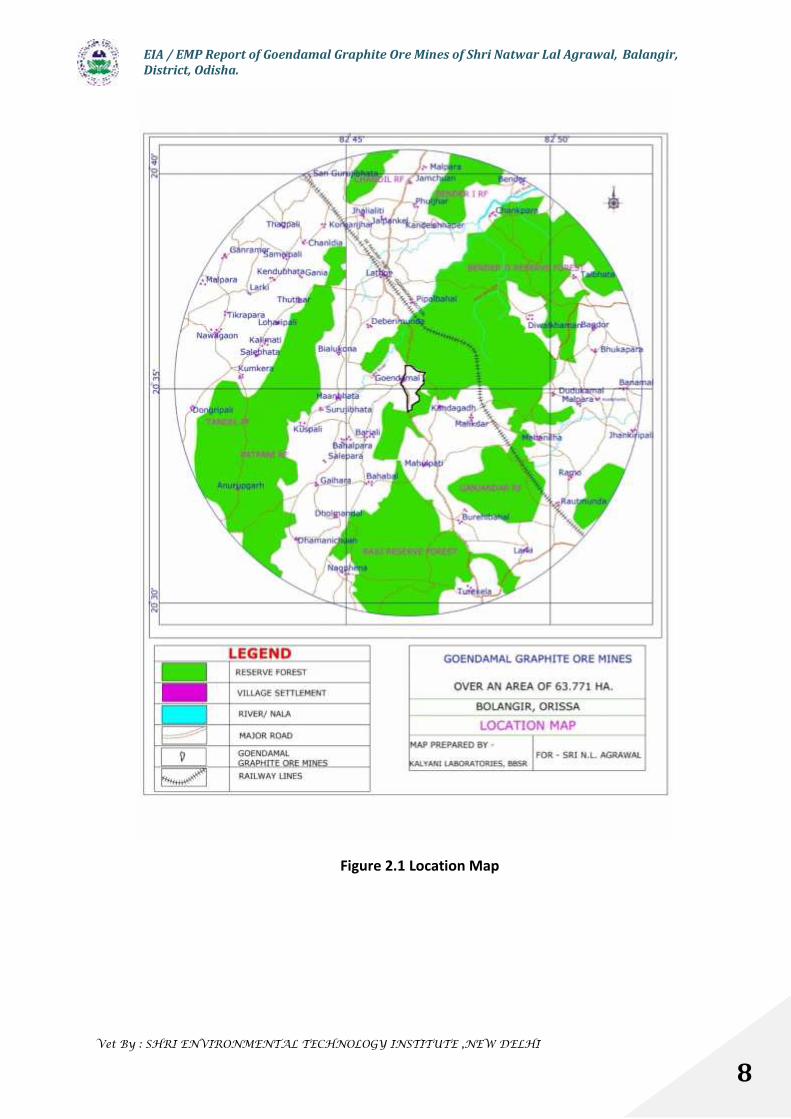
2.2 Locations and TopographyThe ML area is located in village Goendamal No.7, P.S-Turekela, of Bolangir district,
Odisha. The area possesses a gently sloping topography (326 -348m AMSL). The average
altitude of the area is 340m AMSL. The minimum elevation of the area is at 326m AMSL.
Ground water is at a depth of 316m AMSL. The location map of the buffer zone (10 Km
radius) has been shown infigure 2.1. The details of the project site have been given in
table2.1.
Table 2.1 Details of the Project siteFeatures DescriptionLatitude 20° 34’ 07” to 20° 35’ 20” NLongitude 82° 46’ 10” to 82° 46’ 34” ESurvey of India Toposheet no. 64 L/14General gradient Towards North - EastType of land as per land schedule Non forest landNearest Town Kantabanjhi (25 Km)Nearest forest Bender II RF (500 m)Nearest road Kantabanjhi – Harishankar PWD Road passing
through the lease area.Nearest railway Station Harishankar Road (Around 6 Km)Notified sensitive area within 10 km NilCost of the project 50 lakhs
2.3 DrainageThe main drainage pattern of the area is formed by tributaries of Lant river which
flows at a distance of 1.3 km in the north-east of the ML area. Other small nalas flow in N-E
to E directions and join Lant River in the North. The drainage pattern is dendritic with
CHAPTER 2PROJECT DESCRIPTION
EIA / EMP Report of Goendamal Graphite Ore Mines of Shri Natwar Lal Agrawal, Balangir,District, Odisha.
Vet By : SHRI ENVIRONMENTAL TECHNOLOGY INSTITUTE ,NEW DELHI
7
coarse density in the surrounding area. At some places the drainage system is sub-parallel.
There is no seasonal or perennial nala in the lease area.
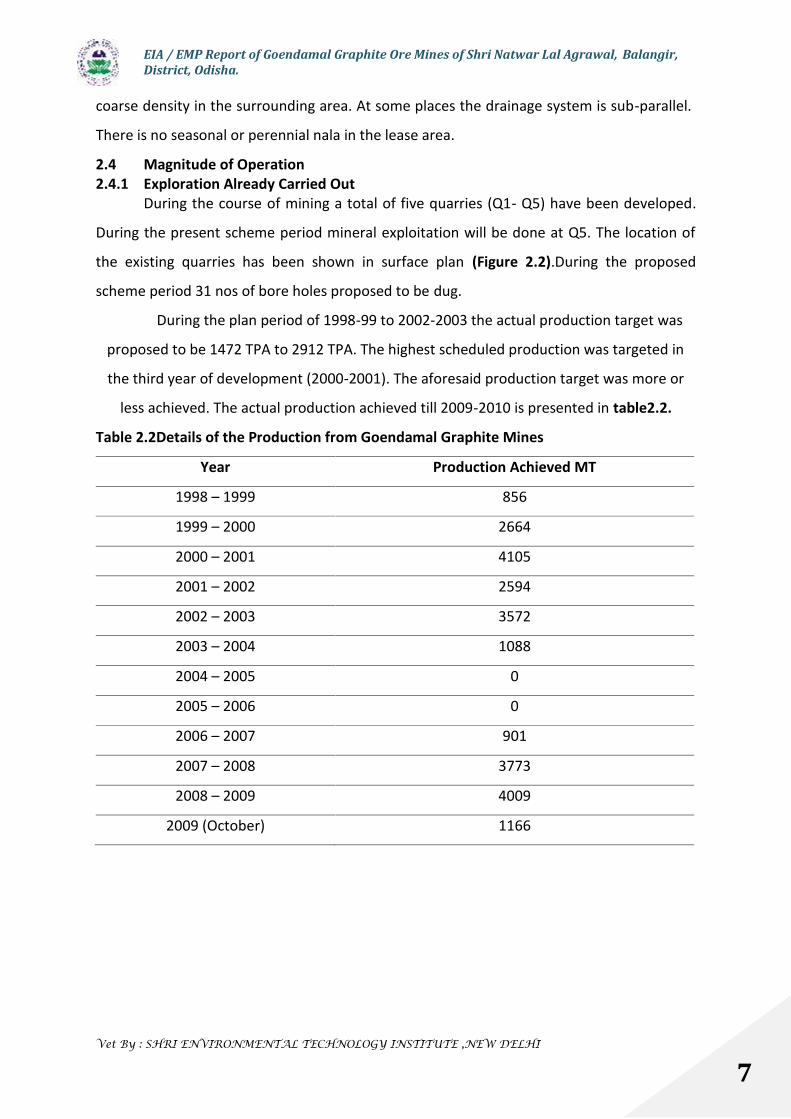
2.4 Magnitude of Operation2.4.1 Exploration Already Carried Out
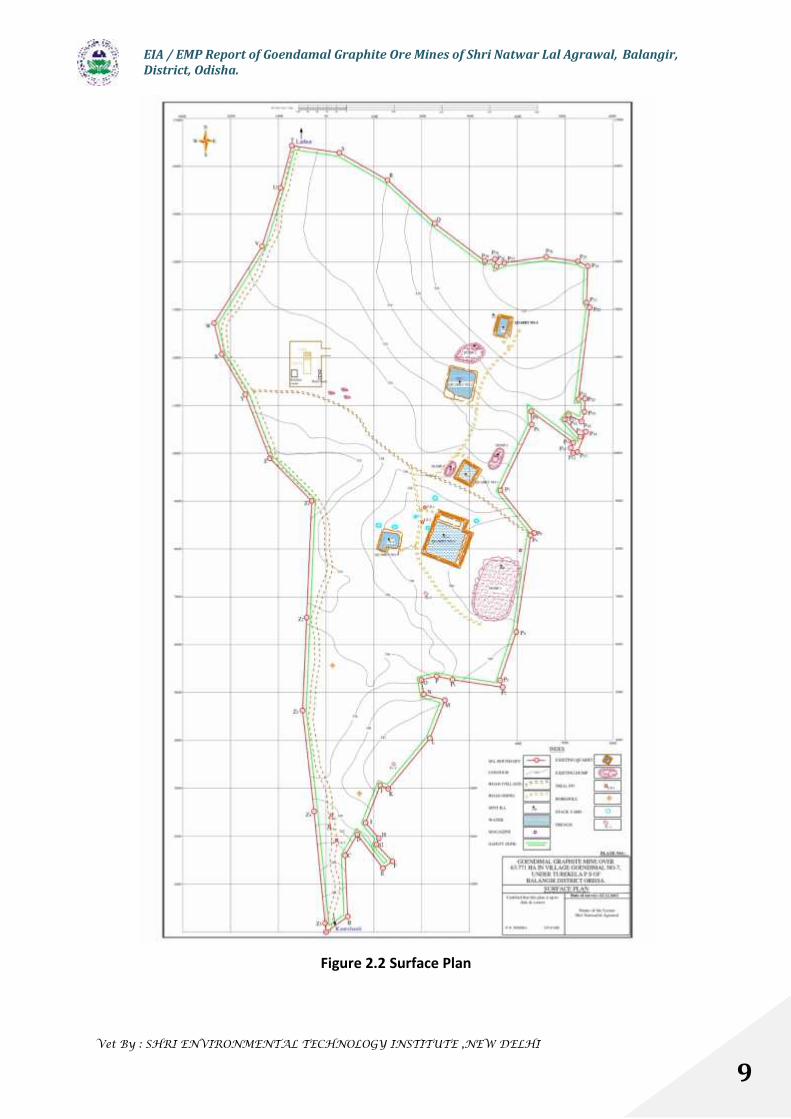
During the course of mining a total of five quarries (Q1- Q5) have been developed.
During the present scheme period mineral exploitation will be done at Q5. The location of
the existing quarries has been shown in surface plan (Figure 2.2).During the proposed
scheme period 31 nos of bore holes proposed to be dug.
During the plan period of 1998-99 to 2002-2003 the actual production target was
proposed to be 1472 TPA to 2912 TPA. The highest scheduled production was targeted in
the third year of development (2000-2001). The aforesaid production target was more or
less achieved. The actual production achieved till 2009-2010 is presented in table2.2.
Table 2.2Details of the Production from Goendamal Graphite Mines
Year Production Achieved MT
1998 – 1999 856
1999 – 2000 2664
2000 – 2001 4105
2001 – 2002 2594
2002 – 2003 3572
2003 – 2004 1088
2004 – 2005 0
2005 – 2006 0
2006 – 2007 901
2007 – 2008 3773
2008 – 2009 4009
2009 (October) 1166
EIA / EMP Report of Goendamal Graphite Ore Mines of Shri Natwar Lal Agrawal, Balangir,District, Odisha.
Vet By : SHRI ENVIRONMENTAL TECHNOLOGY INSTITUTE ,NEW DELHI
8
Figure 2.1 Location Map
EIA / EMP Report of Goendamal Graphite Ore Mines of Shri Natwar Lal Agrawal, Balangir,District, Odisha.
Vet By : SHRI ENVIRONMENTAL TECHNOLOGY INSTITUTE ,NEW DELHI
9
Figure 2.2 Surface Plan
EIA / EMP Report of Goendamal Graphite Ore Mines of Shri Natwar Lal Agrawal, Balangir,District, Odisha.
Vet By : SHRI ENVIRONMENTAL TECHNOLOGY INSTITUTE ,NEW DELHI
10
2.4.2 Reserves
Reserve of graphite has been re-estimated by cross sectional area method. 15 no.s of
geological cross sectional area i.e. A-A’,B-B’,C-C’,D-D’,E-E’,F-F’,G-G’,H-H’,I-I’,K-K’,L-L’,M-
M’,N-N’ and O-O’ have been drawn for the reserve as shown in Geological plan. The basis
and parameters considered for calculation of reserve for graphite is as follows:
GR = A x L x RF x TF
Where,
GR = Geological reserve in MT
A = Area of cross section (Sq.m)
L = Length of influence (m)
RF = Recovery Factor (%)
TF = Tonnage Factor (MT/Cum)
Mineable reserve has been estimated taking into account mining block due to slope
factor in the same manner as the geological reserve duly providing allowance for the
Graphite that will get blocked under 7.5sq m wide safety zone and under the ultimate pit
slope of the mine. However, the reserve under said blockage is around 15% of the geological
reserve. The updated geological and mineable reserve up to 01.04.2011 is 1699621MT and
1122374 MT respectively. Since 1998 to till 2009-10 total 24728 T of crude graphite has
been exploited from the mine. Based on exposed vein on the quarries and depth confirmed
in the previous bore holes the additional reserve has been estimated in the approved
estimation modification of scheme of mining.
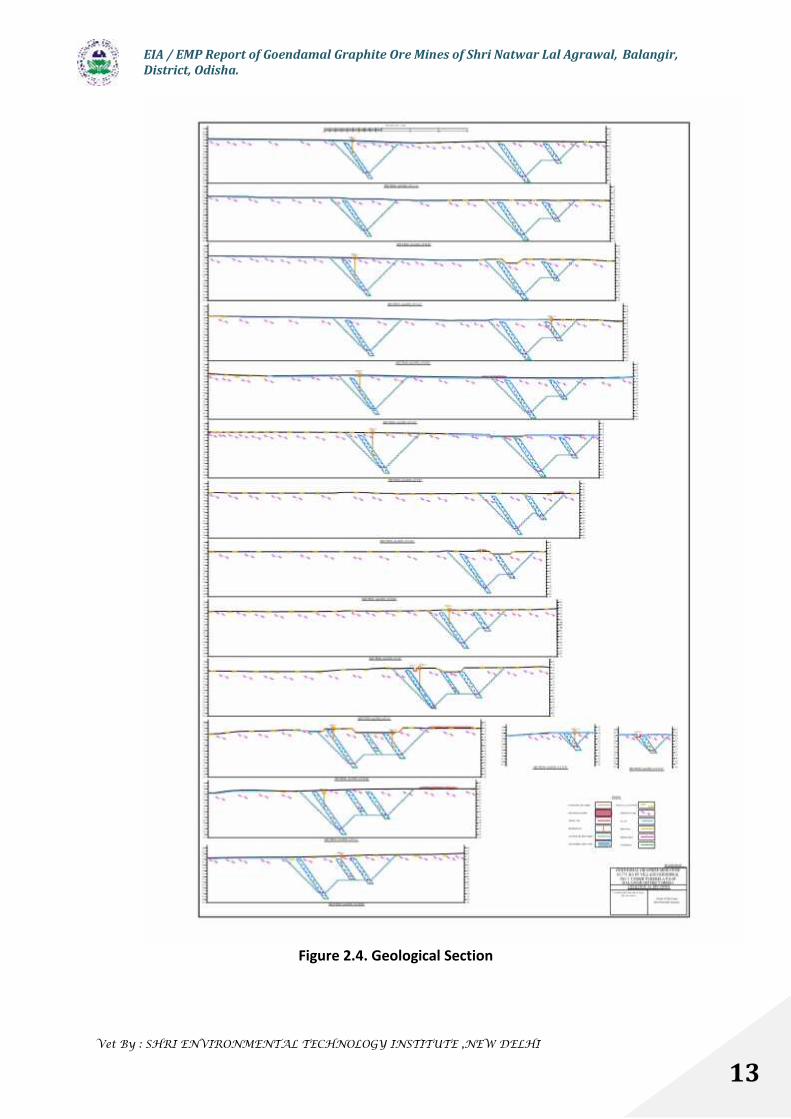
The map showing the geological plan and section has been given as figure 2.3and
figure 2.4. The summary of geological and mineable reserve has been given in table 2.3.
Table 2.3 Summary of Geological and Mineable Reserve
Reserve Category Geological Reserve (MT) Mineable Reserve (MT)Proved 935590 906277Probable 508664 216097Possible 255367 --
Total 1699621 11223742.5 Mining
Mining activities have been discontinued since October 2009 due to lack of
environment clearance. The existing dimensions of the quarries have been given in the table
2.4 below:
EIA / EMP Report of Goendamal Graphite Ore Mines of Shri Natwar Lal Agrawal, Balangir,District, Odisha.
Vet By : SHRI ENVIRONMENTAL TECHNOLOGY INSTITUTE ,NEW DELHI
11
Table 2.4. Details of the Existing Quarry
Quarry No Area (m2) Depth (m)Quarry – 1 2010.8 16.8Quarry – 2 4187.5 13.7Quarry – 3 2147.9 7.6Quarry – 4 1599.5 10.6Quarry – 5 8852.8 16.7
Based on surface geological data excavation will be confined to the existing quarry-5. Due to
labor problem in the locality semi mechanization method of mining is required to achieve
the production target. It is proposed to continue mining operation in the mine by “A” OTFM
method. The height and width of the benches are maintained at 3 and 4 m respectively.
Slopes of the benches are nearly vertical with overall quarry slope at 45º. In the ensuing
scheme period the existing quarry will be developed further to depth and towards south for
raising ore.Manual sorting will be carried out by using equipments like crowbar, pickaxe,
spade, chisel, hand shovel. wherever necessary small capacity poclain (0.9 cum) will be used
for loading and transportation will be done by tippers. The total annual production for the
scheme period is proposed as 15000 MTPA. The excavation planning is confined to the
existing quarry Q-5. Average working days during the year are about 220 days. Average daily
production is about 68 tonnes.

EIA / EMP Report of Goendamal Graphite Ore Mines of Shri Natwar Lal Agrawal, Balangir,District, Odisha.
Vet By : SHRI ENVIRONMENTAL TECHNOLOGY INSTITUTE ,NEW DELHI
12
Figure 2.3. Geological Plan
EIA / EMP Report of Goendamal Graphite Ore Mines of Shri Natwar Lal Agrawal, Balangir,District, Odisha.
Vet By : SHRI ENVIRONMENTAL TECHNOLOGY INSTITUTE ,NEW DELHI
13
Figure 2.4. Geological Section
EIA / EMP Report of Goendamal Graphite Ore Mines of Shri Natwar Lal Agrawal, Balangir,District, Odisha.
Vet By : SHRI ENVIRONMENTAL TECHNOLOGY INSTITUTE ,NEW DELHI
14
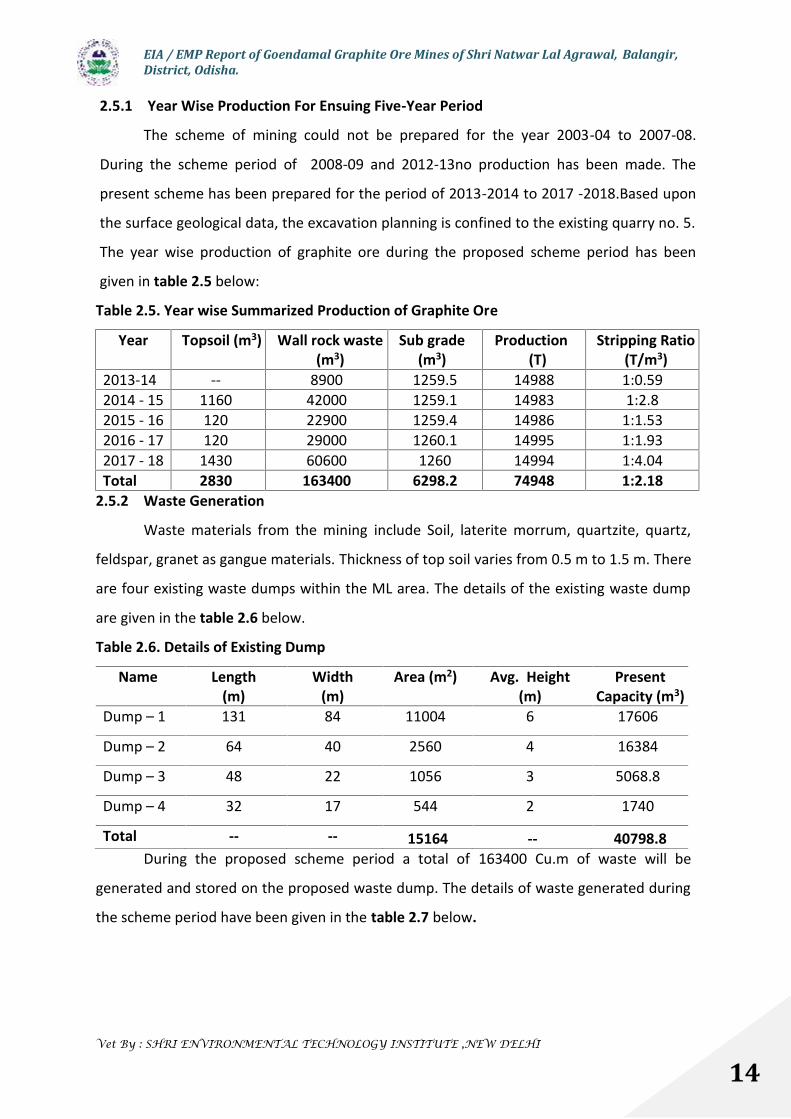
2.5.1 Year Wise Production For Ensuing Five-Year Period
The scheme of mining could not be prepared for the year 2003-04 to 2007-08.
During the scheme period of 2008-09 and 2012-13no production has been made. The
present scheme has been prepared for the period of 2013-2014 to 2017 -2018.Based upon
the surface geological data, the excavation planning is confined to the existing quarry no. 5.
The year wise production of graphite ore during the proposed scheme period has been
given in table 2.5 below:
Table 2.5. Year wise Summarized Production of Graphite Ore
Year Topsoil (m3) Wall rock waste(m3)
Sub grade(m3)
Production(T)
Stripping Ratio(T/m3)
2013-14 -- 8900 1259.5 14988 1:0.592014 - 15 1160 42000 1259.1 14983 1:2.82015 - 16 120 22900 1259.4 14986 1:1.532016 - 17 120 29000 1260.1 14995 1:1.932017 - 18 1430 60600 1260 14994 1:4.04Total 2830 163400 6298.2 74948 1:2.18
2.5.2 Waste Generation
Waste materials from the mining include Soil, laterite morrum, quartzite, quartz,
feldspar, granet as gangue materials. Thickness of top soil varies from 0.5 m to 1.5 m. There
are four existing waste dumps within the ML area. The details of the existing waste dump
are given in the table 2.6 below.
Table 2.6. Details of Existing Dump
Name Length(m)
Width(m)
Area (m2) Avg. Height(m)
PresentCapacity (m3)
Dump – 1 131 84 11004 6 17606
Dump – 2 64 40 2560 4 16384
Dump – 3 48 22 1056 3 5068.8
Dump – 4 32 17 544 2 1740
Total -- -- 15164 -- 40798.8During the proposed scheme period a total of 163400 Cu.m of waste will be
generated and stored on the proposed waste dump. The details of waste generated during
the scheme period have been given in the table 2.7 below.
EIA / EMP Report of Goendamal Graphite Ore Mines of Shri Natwar Lal Agrawal, Balangir,District, Odisha.
Vet By : SHRI ENVIRONMENTAL TECHNOLOGY INSTITUTE ,NEW DELHI
15
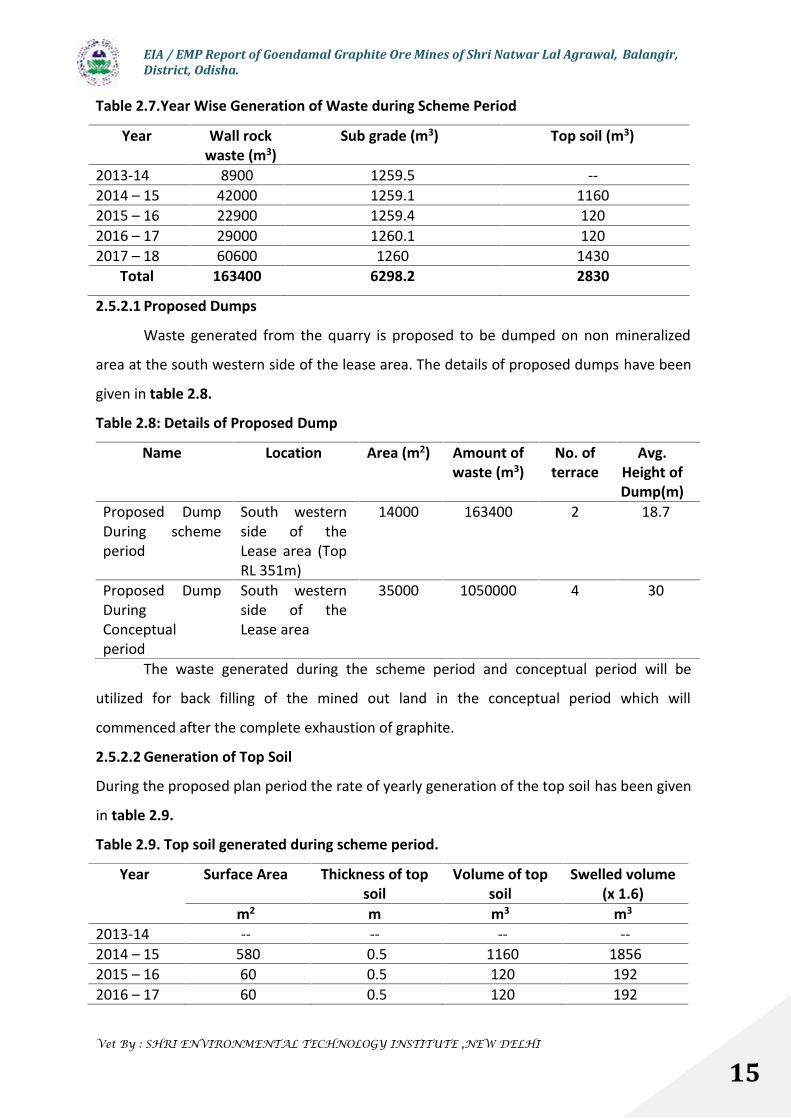
Table 2.7.Year Wise Generation of Waste during Scheme Period
Year Wall rockwaste (m3)
Sub grade (m3) Top soil (m3)
2013-14 8900 1259.5 --2014 – 15 42000 1259.1 11602015 – 16 22900 1259.4 1202016 – 17 29000 1260.1 1202017 – 18 60600 1260 1430
Total 163400 6298.2 2830
2.5.2.1 Proposed Dumps
Waste generated from the quarry is proposed to be dumped on non mineralized
area at the south western side of the lease area. The details of proposed dumps have been
given in table 2.8.
Table 2.8: Details of Proposed Dump
Name Location Area (m2) Amount ofwaste (m3)
No. ofterrace
Avg.Height ofDump(m)
Proposed DumpDuring schemeperiod
South westernside of theLease area (TopRL 351m)
14000 163400 2 18.7
Proposed DumpDuringConceptualperiod
South westernside of theLease area
35000 1050000 4 30
The waste generated during the scheme period and conceptual period will be
utilized for back filling of the mined out land in the conceptual period which will
commenced after the complete exhaustion of graphite.
2.5.2.2 Generation of Top Soil
During the proposed plan period the rate of yearly generation of the top soil has been given
in table 2.9.
Table 2.9. Top soil generated during scheme period.
Year Surface Area Thickness of topsoil
Volume of topsoil
Swelled volume(x 1.6)
m2 m m3 m3
2013-14 -- -- -- --2014 – 15 580 0.5 1160 18562015 – 16 60 0.5 120 1922016 – 17 60 0.5 120 192
EIA / EMP Report of Goendamal Graphite Ore Mines of Shri Natwar Lal Agrawal, Balangir,District, Odisha.
Vet By : SHRI ENVIRONMENTAL TECHNOLOGY INSTITUTE ,NEW DELHI
16
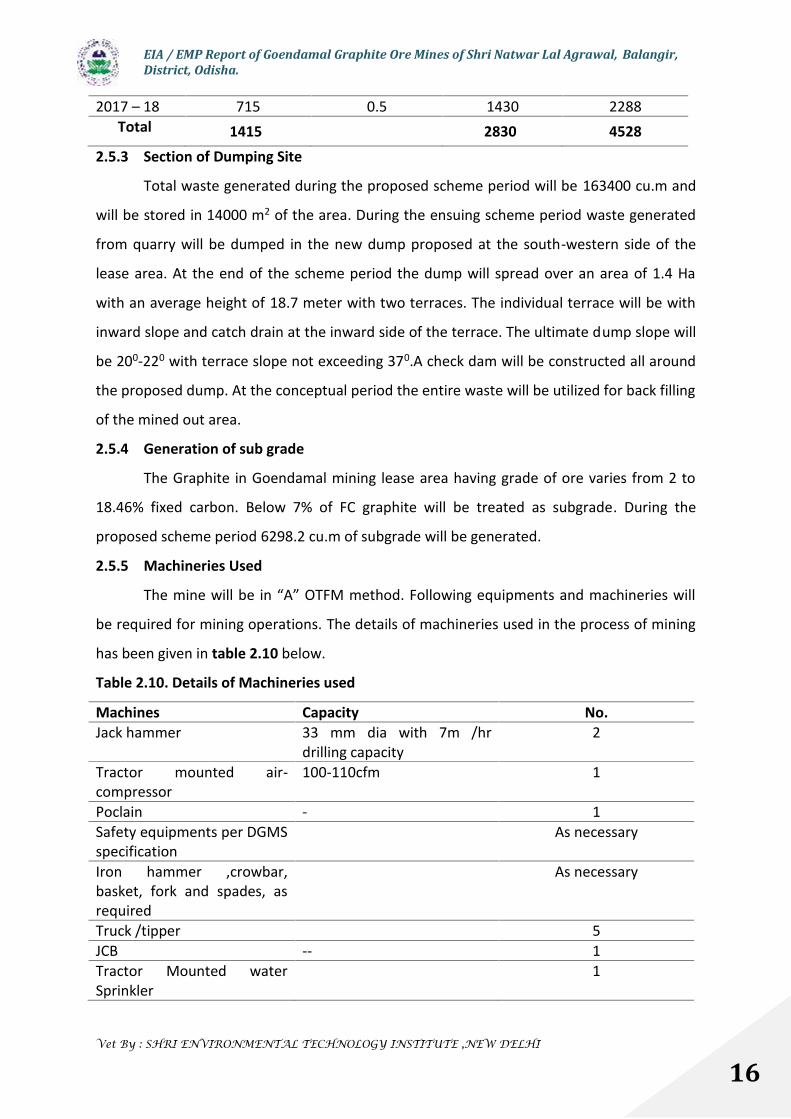
2017 – 18 715 0.5 1430 2288Total 1415 2830 4528
2.5.3 Section of Dumping Site
Total waste generated during the proposed scheme period will be 163400 cu.m and
will be stored in 14000 m2 of the area. During the ensuing scheme period waste generated
from quarry will be dumped in the new dump proposed at the south-western side of the
lease area. At the end of the scheme period the dump will spread over an area of 1.4 Ha
with an average height of 18.7 meter with two terraces. The individual terrace will be with
inward slope and catch drain at the inward side of the terrace. The ultimate dump slope will
be 200-220 with terrace slope not exceeding 370.A check dam will be constructed all around
the proposed dump. At the conceptual period the entire waste will be utilized for back filling
of the mined out area.
2.5.4 Generation of sub grade
The Graphite in Goendamal mining lease area having grade of ore varies from 2 to
18.46% fixed carbon. Below 7% of FC graphite will be treated as subgrade. During the
proposed scheme period 6298.2 cu.m of subgrade will be generated.
2.5.5 Machineries Used
The mine will be in “A” OTFM method. Following equipments and machineries will
be required for mining operations. The details of machineries used in the process of mining
has been given in table 2.10 below.
Table 2.10. Details of Machineries used
Machines Capacity No.Jack hammer 33 mm dia with 7m /hr
drilling capacity2
Tractor mounted air-compressor
100-110cfm 1
Poclain - 1Safety equipments per DGMSspecification
As necessary
Iron hammer ,crowbar,basket, fork and spades, asrequired
As necessary
Truck /tipper 5JCB -- 1Tractor Mounted waterSprinkler
1
EIA / EMP Report of Goendamal Graphite Ore Mines of Shri Natwar Lal Agrawal, Balangir,District, Odisha.
Vet By : SHRI ENVIRONMENTAL TECHNOLOGY INSTITUTE ,NEW DELHI
17
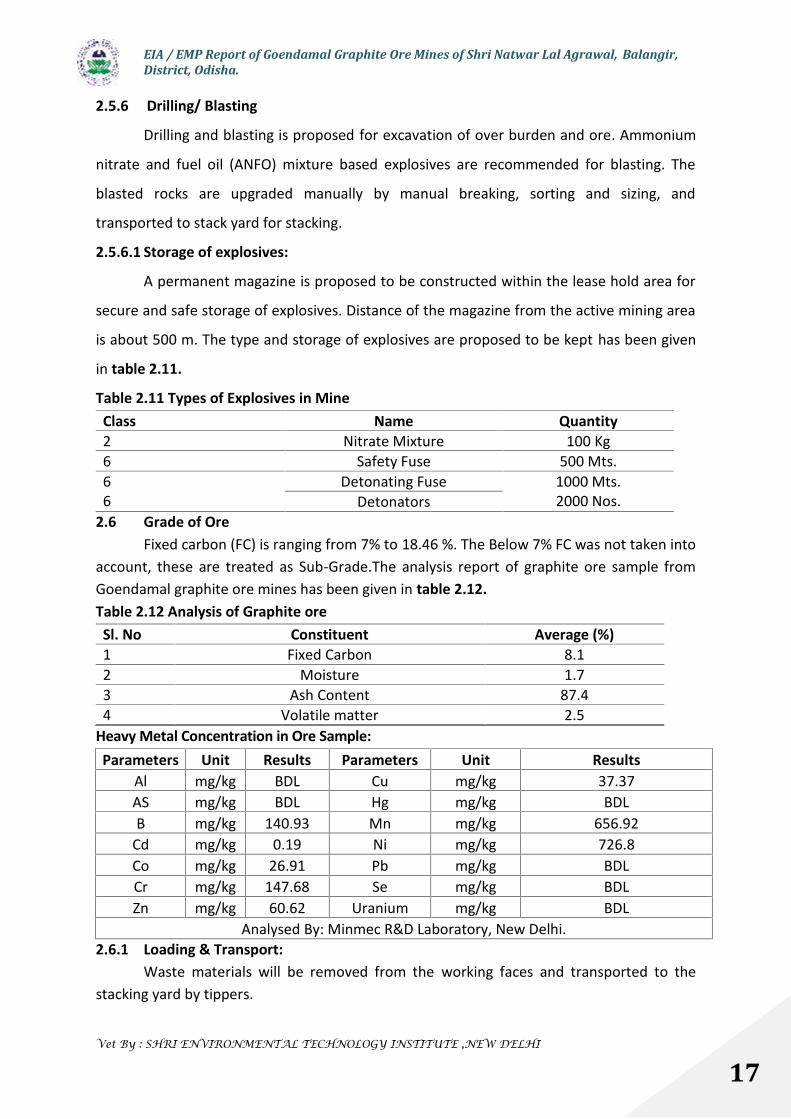
2.5.6 Drilling/ Blasting
Drilling and blasting is proposed for excavation of over burden and ore. Ammonium
nitrate and fuel oil (ANFO) mixture based explosives are recommended for blasting. The
blasted rocks are upgraded manually by manual breaking, sorting and sizing, and
transported to stack yard for stacking.
2.5.6.1 Storage of explosives:
A permanent magazine is proposed to be constructed within the lease hold area for
secure and safe storage of explosives. Distance of the magazine from the active mining area
is about 500 m. The type and storage of explosives are proposed to be kept has been given
in table 2.11.
Table 2.11 Types of Explosives in MineClass Name Quantity2 Nitrate Mixture 100 Kg6 Safety Fuse 500 Mts.66
Detonating Fuse 1000 Mts.2000 Nos.Detonators
2.6 Grade of OreFixed carbon (FC) is ranging from 7% to 18.46 %. The Below 7% FC was not taken into
account, these are treated as Sub-Grade.The analysis report of graphite ore sample fromGoendamal graphite ore mines has been given in table 2.12.Table 2.12 Analysis of Graphite oreSl. No Constituent Average (%)1 Fixed Carbon 8.12 Moisture 1.73 Ash Content 87.44 Volatile matter 2.5
Heavy Metal Concentration in Ore Sample:Parameters Unit Results Parameters Unit Results
Al mg/kg BDL Cu mg/kg 37.37AS mg/kg BDL Hg mg/kg BDLB mg/kg 140.93 Mn mg/kg 656.92
Cd mg/kg 0.19 Ni mg/kg 726.8Co mg/kg 26.91 Pb mg/kg BDLCr mg/kg 147.68 Se mg/kg BDLZn mg/kg 60.62 Uranium mg/kg BDL
Analysed By: Minmec R&D Laboratory, New Delhi.2.6.1 Loading & Transport:
Waste materials will be removed from the working faces and transported to thestacking yard by tippers.

EIA / EMP Report of Goendamal Graphite Ore Mines of Shri Natwar Lal Agrawal, Balangir,District, Odisha.
Vet By : SHRI ENVIRONMENTAL TECHNOLOGY INSTITUTE ,NEW DELHI
18
2.6.2 Water RequirementWater is required for drinking for the labours engaged in mining operation. Water is also
required for drinking and domestic use for the permanent mining staff in the colony &
office. Water is also required for dust suppression, green belt development. Water required
for drinking use will be met from ground water source through one no. of borewell and
mining pit water will be used for green belt development and dust suppression. The break-
up of the water requirement is shown in Table 2.13.
Table 2.13 Water Balance Table
Clearance from Ground water board received vide letter no. 21-4(483/SER/CGWA/2012-550
dated 10th April 2013
2.7 Site ServicesAll the site services such as office, first aid center, canteen, crèche, toilets are well
constructed within the ML area.
2.8 Employment Potential
Following are the list of personnel employed for smooth operation of the mine.
Table 2.14 Employment Potential
Sl. No Designation Qualification Nos.Management & Supervisory Personnel01 2nd class Mining Manager Diploma/ Degree in Mining
engineering1
Ground Waterthrough oneBorewell
Drinking &Domestic
De-Wateringfrom MiningPit QuarryNo.5
DustSuppression &Others
Green BeltDevelopment
Either to be storedfor use during nondewatering period orwill be used foragriculture
10
54
20
10
24
Note: All figures are in m3/day

EIA / EMP Report of Goendamal Graphite Ore Mines of Shri Natwar Lal Agrawal, Balangir,District, Odisha.
Vet By : SHRI ENVIRONMENTAL TECHNOLOGY INSTITUTE ,NEW DELHI
19
02 Mining Engineer in – charge Degree in mining engineering 103 Mining Mate Matriculation or above 104 Clerk Graduate or above 205 Mines Foreman Foreman certificate holder 106 Jack Hammer Operator -- 307 Compressor Operator -- 108 Blaster -- 2Sub total --Labors skilled -- 5Labors semi skilled -- 10Labors unskilled -- 75Miscellaneous -- 3Total 93
2.9 Mineral UsesThe graphite is generally used in crucibles, refractories, metallurgy, brake linking,
brushes, lubricants, electrodes, foundry, batteries, paints and pencils. Graphite also used in
manufacturing of mechanical seals such as stream joints, oil pipe line industries, air craft
fuel pump, vacuum pumps and compressors. Major amount of world’s graphite is used in
manufacturingof crucibles, reports and other refractory articles.
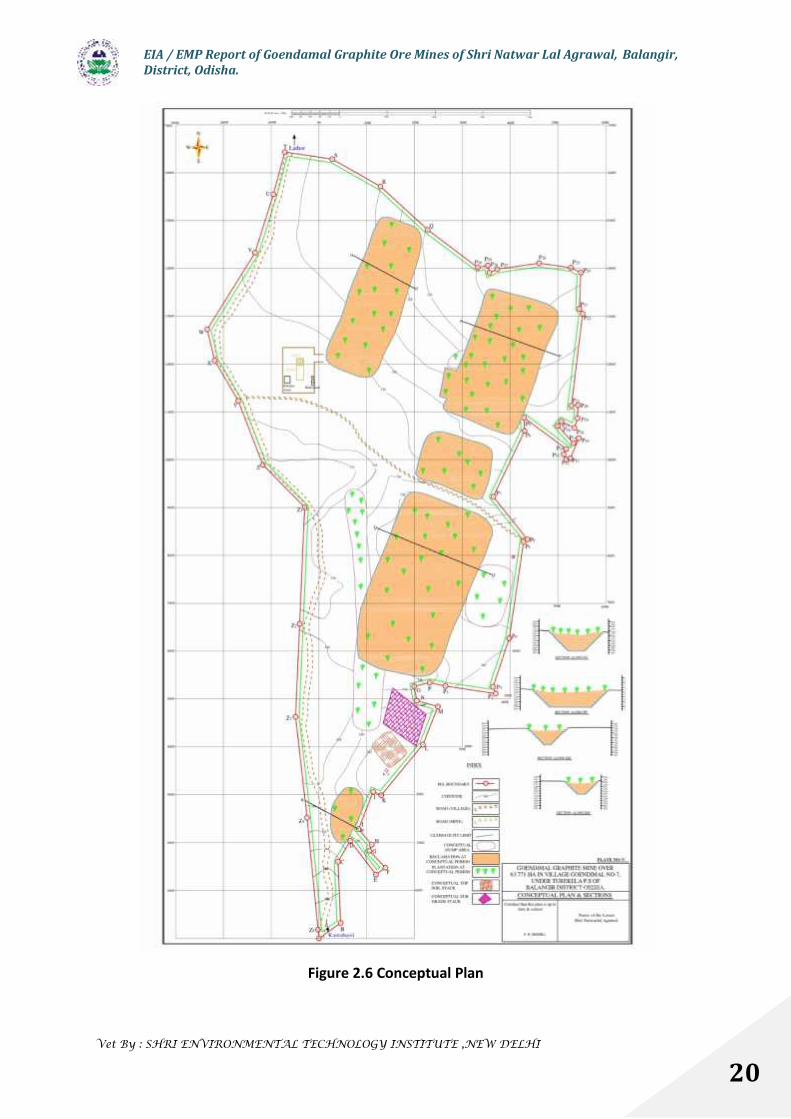
2.10 Conceptual PlanThe mineable reserve of Graphite is 1122374.47 MT. Keeping in view of production
target of 15000 MT per annum the life of mine has been estimated as 75 years. The
conceptual planning has been made for the total life of the mines. The position of the
working benches at the end of the life of mine along with the position of the dump, green
belt development, reclamation of the quarry has been shown in the rehabilitation and
reclamation plan(figure 2.6).
2.10.1 The Ultimate Extent and Size of the PitThere will be five pits at the end of the life of the mine. During the conceptual period all
mineralised area will be exploited and the excavated area comes to be 174935 m2. The
Ultimate pit bottom RL will be 305 m. The ultimate pit slopes will be kept at 37 o with the
horizontal by maintaining the average height of the benches within 3m and width at 4 mts.
2.10.2 Ultimate Capacity of the Dump:The waste generated from the quarry is proposed to be dumped on a non-
mineralized area at the south-western side of the lease area. The ultimate capacity of the
proposed dump will be 10, 50,000 m3 (200m x 175m x 30m) over 3.5 Ha area. There will be
three terraces each of 8 m height. There will be no dumping in the conceptual period as the
waste generated during scheme period will be utilized for backfilling of the mined out land.
EIA / EMP Report of Goendamal Graphite Ore Mines of Shri Natwar Lal Agrawal, Balangir,District, Odisha.
Vet By : SHRI ENVIRONMENTAL TECHNOLOGY INSTITUTE ,NEW DELHI
20
Figure 2.6 Conceptual Plan

EIA / EMP Report of Goendamal Graphite Ore Mines of Shri Natwar Lal Agrawal, Balangir,District, Odisha.
Vet By : SHRI ENVIRONMENTAL TECHNOLOGY INSTITUTE ,NEW DELHI
21
2.10.3 Land Degradation and /Reclamation/Afforestation
The reclamation of the lands by backfilling of the quarry voids can be taken up after
complete exhaustion of the ore from the quarry. Quarry 2 and 3 over an area of 0.633 Ha will
be backfilled with 73678 m3 of wasteafter complete exhaustion of quarry. Top soil cover will be
spread over the backfilled area to make it stable and fertile. Plantations will be developed over
the backfilled area to attain the pre mining land use. Quarry 1 & 4 over an area of 11.854 Ha
will be used as water reservoir for rain water harvesting after the exhaution. During conceptual
period 5.003 Ha of mined out area will be backfilled and plantation will be done over the
backfilled area.The afforestation of the area will be under taken in the conceptual period
covering the 7.5m safety zone and reclaimed quarry area. The year wise plantation details
during the scheme period has been given in table 2.15.
Table 2.15. Year Wise Program of Tree Plantation in Safety Zone
Year Area in m2 No. of Saplings Distance between Saplings(m x m)
2013-14 1275 165 2.5x2.52014 - 15 1275 165 2.5x2.52015 - 16 1275 165 2.5x2.52016 - 17 1275 165 2.5x2.52017 - 18 1275 165 2.5x2.5
Total 6375 8252.10.4 Land use Plan
During the life of the mine, 17.49 hectares will be utilised for excavation. The details of
land use plan of the ML area have been given in the table 2.16below:
Table 2.16.Land Use pattern
Type of land use At present in Ha At the end of theScheme period in Ha
Total area at theConceptual Period in Ha
Area underexcavation
1.9 3.33 17.49
Area underdump
1.51 2.91 3.5
Mineral Storage 0.08 0.08 1.53Sub-Grade stock Nil 0.042 0.59Top-Soil Nil 0.2 0.2Infrastructure(Office, canteen,rest shed, creche& Toilets)
0.1 0.1 0.1
Roads 0.39 0.39 0.39

EIA / EMP Report of Goendamal Graphite Ore Mines of Shri Natwar Lal Agrawal, Balangir,District, Odisha.
Vet By : SHRI ENVIRONMENTAL TECHNOLOGY INSTITUTE ,NEW DELHI
22
Green belts 1.0 1.64 5.0Magazene 0.002 0.002 0.002Sub Total 4.982 8.684 28.802Un used area 58.789 55.087 34.969Total 63.771 63.771 63.7712.10.5 Description of Mitigation Measures
All possible mitigation measures to prevent any untoward incident during the
process of mining, transportation and dumping will be taken care off. The details of the
proposed actions are described in the Chapter VIII of this report.
2.11 Assessment of New/Untested Technology
The manual open cast method is being practiced in this region for the last 60years.
Due to labor problem, semi-mechanized process will be adopted in the present scheme
period of mining.
EIA / EMP Report of Goendamal Graphite Ore Mines of Shri Natwar Lal Agrawal, Balangir,District, Odisha.
Vet By : SHRI ENVIRONMENTAL TECHNOLOGY INSTITUTE ,NEW DELHI
23
3.0 Study Area
For the description of baseline environmental scenario, the mine lease area of
63.771 ha at Vill. Goendamal has been considered as the core zone. The buffer area has
been fixed at 10 km radius from the extremities of the proposed mine lease. The study area
covers a spatial extent of 314.15 sq km around the mine lease.
The existing environmental setting is considered to assess and define the present
baseline environment, which are described with respect to climate, hydro-geological
aspects, atmospheric conditions, water quality, soil quality and ecology. It would help in
assessing the cumulative environmental impacts due to the project.
3.1 Study Period
Different environmental parameters like air, water, soil and other ecological factors
required to evaluate the prevailing scenario in the core and buffer zone of the project area,
have been generated/collected and compiled for one season starting from March to May
2011 (pre-monsoon). For comparision with the recent environmental settings a recent
data for the period of 1 month (April 2014) has been generated by M/s Cleenviron Pvt.
Ltd. (NABL Certificate No. T-2082).
3.2 Components of Study
Terrestrial environment was surveyed to evaluate the following components in the
study area:
1. Land Environment Land
Topography
Geology
Soil
2. Water Environment Ground water
Surface Water
3. Biological Environment Terrestrial Flora and Fauna
4. Air Environment Metrological Data
CHAPTER 3
DESCRIPTION OF THE ENVIRONMENT
EIA / EMP Report of Goendamal Graphite Ore Mines of Shri Natwar Lal Agrawal, Balangir,District, Odisha.
Vet By : SHRI ENVIRONMENTAL TECHNOLOGY INSTITUTE ,NEW DELHI
24
(Wind speed and direction, Rainfall, Relative humidity,
Temperature, Humidity, Cyclonic Storms &
Depressions)
Ambient Air Quality (AAQ)
5. Noise Environment
6. Solid Waste
7. Socio-economic and Occupational Health Environment
3.3 Methodology
Standard methodologies have been followed in developing the base line report. The
methodology adopted for the study is outlined below:
Conducting reconnaissance surveys for understanding the study area; and
Selecting sampling locations for conducting various environment baseline
studies.
The sampling locations have been selected on the basis of the following:
Predominant wind directions recorded by the Indian Meteorological
Department (IMD), Bhubaneswar;
Existing topography;
Drainage pattern and location of existing surface water bodies like lakes/ponds,
rivers and streams;
Locations of villages / towns / sensitive areas; and
Areas, which represent baseline conditions
The field observations have been used to:
Assess the positive and negative impacts due to the proposed project;
Suggest appropriate mitigation measures for remediating the adverse
environmental impacts, if any; and
Suggesting post-project monitoring requirements and suitable mechanism for
it.
3.4. Generation of Baseline Data
3.4.1 Air Quality
Samples collected for ambient air monitoring from eight sampling location and were
analyzed to determine the concentration of PM10, SO2 and NOx as per the procedures laid
EIA / EMP Report of Goendamal Graphite Ore Mines of Shri Natwar Lal Agrawal, Balangir,District, Odisha.
Vet By : SHRI ENVIRONMENTAL TECHNOLOGY INSTITUTE ,NEW DELHI
25
down by the Indian Standards, IS Code No. 5182. The details of the methods followed,
Instruments used in Air Quality monitoring and the standards of Ambient Air Quality is being
discussed in subsequent paragraphs.
3.4.2 Dust Fall Measurement
Dust fall kits are placed at six different fixed stations both in the core zone and the
buffer zone to note the concentration of dust collected during the period of one month in
the season. This has been collected as per IS Code No. 5182 part-I.
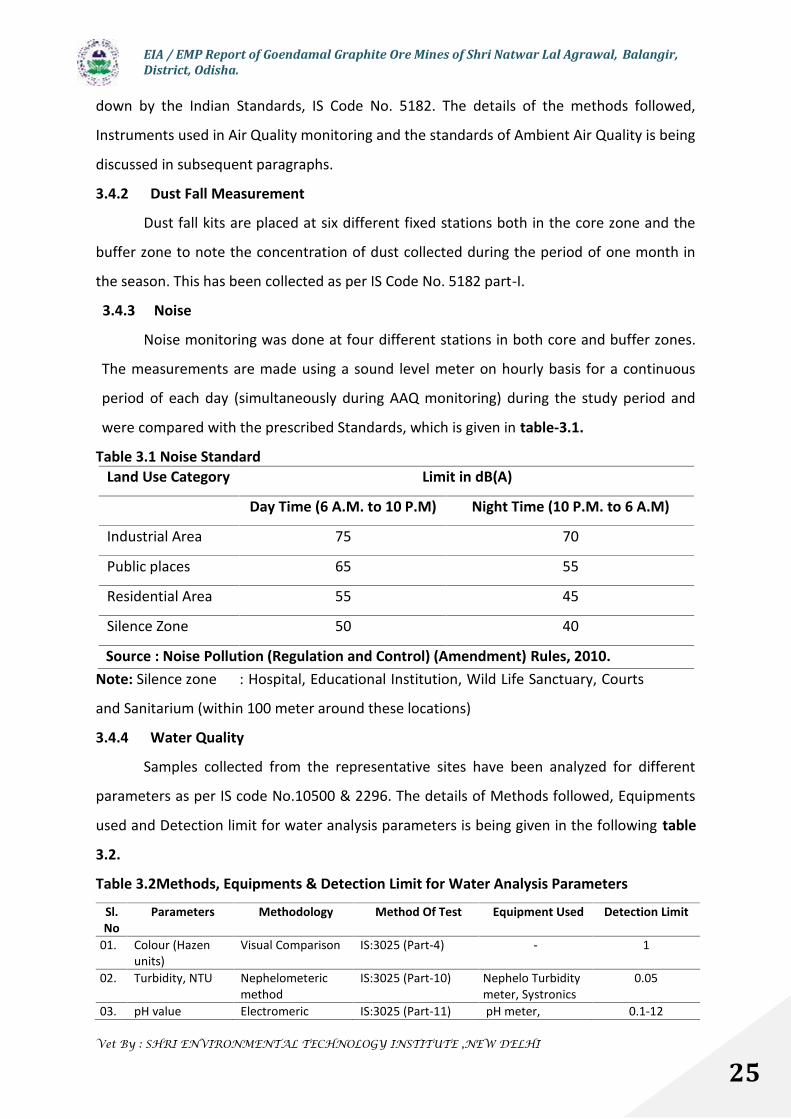
3.4.3 Noise
Noise monitoring was done at four different stations in both core and buffer zones.
The measurements are made using a sound level meter on hourly basis for a continuous
period of each day (simultaneously during AAQ monitoring) during the study period and
were compared with the prescribed Standards, which is given in table-3.1.
Table 3.1 Noise StandardLand Use Category Limit in dB(A)
Day Time (6 A.M. to 10 P.M) Night Time (10 P.M. to 6 A.M)
Industrial Area 75 70
Public places 65 55
Residential Area 55 45
Silence Zone 50 40
Source : Noise Pollution (Regulation and Control) (Amendment) Rules, 2010.Note: Silence zone : Hospital, Educational Institution, Wild Life Sanctuary, Courts
and Sanitarium (within 100 meter around these locations)
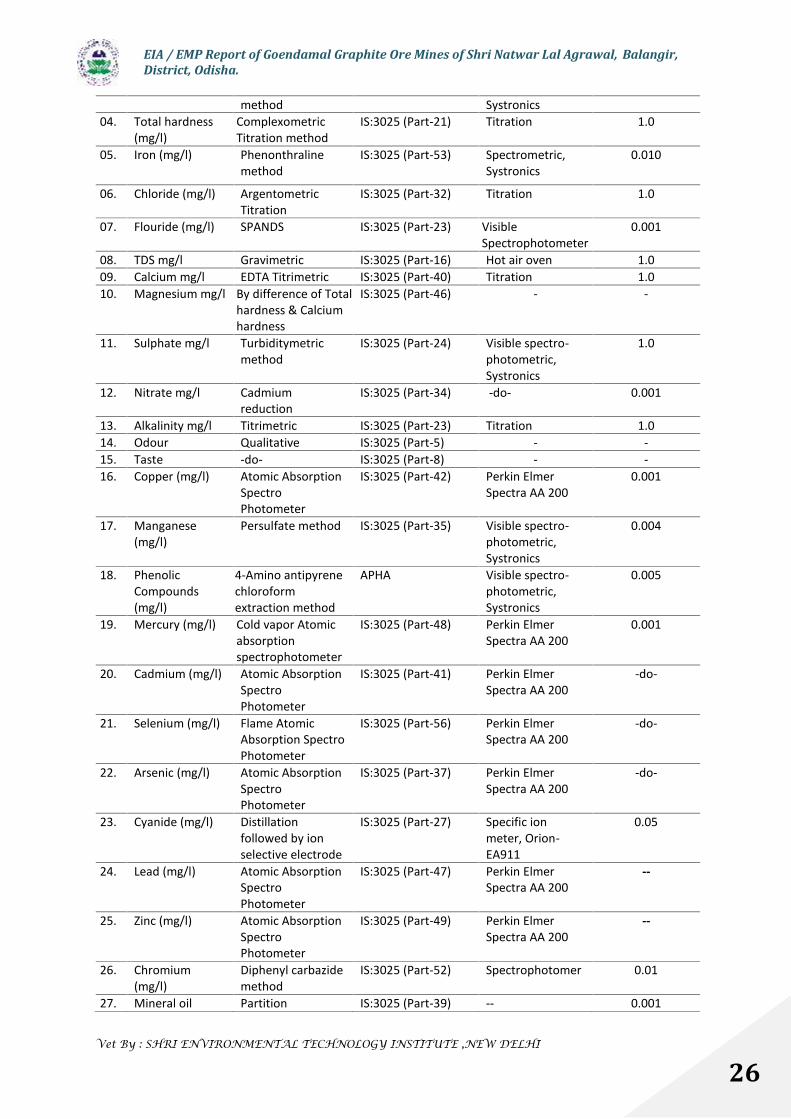
3.4.4 Water Quality
Samples collected from the representative sites have been analyzed for different
parameters as per IS code No.10500 & 2296. The details of Methods followed, Equipments
used and Detection limit for water analysis parameters is being given in the following table
3.2.
Table 3.2Methods, Equipments & Detection Limit for Water Analysis Parameters
Sl.No
Parameters Methodology Method Of Test Equipment Used Detection Limit
01. Colour (Hazenunits)
Visual Comparison IS:3025 (Part-4) - 1
02. Turbidity, NTU Nephelometericmethod
IS:3025 (Part-10) Nephelo Turbiditymeter, Systronics
0.05
03. pH value Electromeric IS:3025 (Part-11) pH meter, 0.1-12
EIA / EMP Report of Goendamal Graphite Ore Mines of Shri Natwar Lal Agrawal, Balangir,District, Odisha.
Vet By : SHRI ENVIRONMENTAL TECHNOLOGY INSTITUTE ,NEW DELHI
26
method Systronics04. Total hardness
(mg/l)ComplexometricTitration method
IS:3025 (Part-21) Titration 1.0
05. Iron (mg/l) Phenonthralinemethod
IS:3025 (Part-53) Spectrometric,Systronics
0.010
06. Chloride (mg/l) ArgentometricTitration
IS:3025 (Part-32) Titration 1.0
07. Flouride (mg/l) SPANDS IS:3025 (Part-23) VisibleSpectrophotometer
0.001
08. TDS mg/l Gravimetric IS:3025 (Part-16) Hot air oven 1.009. Calcium mg/l EDTA Titrimetric IS:3025 (Part-40) Titration 1.010. Magnesium mg/l By difference of Total
hardness & Calciumhardness
IS:3025 (Part-46) - -
11. Sulphate mg/l Turbiditymetricmethod
IS:3025 (Part-24) Visible spectro-photometric,Systronics
1.0
12. Nitrate mg/l Cadmiumreduction
IS:3025 (Part-34) -do- 0.001
13. Alkalinity mg/l Titrimetric IS:3025 (Part-23) Titration 1.014. Odour Qualitative IS:3025 (Part-5) - -15. Taste -do- IS:3025 (Part-8) - -16. Copper (mg/l) Atomic Absorption
SpectroPhotometer
IS:3025 (Part-42) Perkin ElmerSpectra AA 200
0.001
17. Manganese(mg/l)
Persulfate method IS:3025 (Part-35) Visible spectro-photometric,Systronics
0.004
18. PhenolicCompounds(mg/l)
4-Amino antipyrenechloroformextraction method
APHA Visible spectro-photometric,Systronics
0.005
19. Mercury (mg/l) Cold vapor Atomicabsorptionspectrophotometer
IS:3025 (Part-48) Perkin ElmerSpectra AA 200
0.001
20. Cadmium (mg/l) Atomic AbsorptionSpectroPhotometer
IS:3025 (Part-41) Perkin ElmerSpectra AA 200
-do-
21. Selenium (mg/l) Flame AtomicAbsorption SpectroPhotometer
IS:3025 (Part-56) Perkin ElmerSpectra AA 200
-do-
22. Arsenic (mg/l) Atomic AbsorptionSpectroPhotometer
IS:3025 (Part-37) Perkin ElmerSpectra AA 200
-do-
23. Cyanide (mg/l) Distillationfollowed by ionselective electrode
IS:3025 (Part-27) Specific ionmeter, Orion-EA911
0.05
24. Lead (mg/l) Atomic AbsorptionSpectroPhotometer
IS:3025 (Part-47) Perkin ElmerSpectra AA 200
--
25. Zinc (mg/l) Atomic AbsorptionSpectroPhotometer
IS:3025 (Part-49) Perkin ElmerSpectra AA 200
--
26. Chromium(mg/l)
Diphenyl carbazidemethod
IS:3025 (Part-52) Spectrophotomer 0.01
27. Mineral oil Partition IS:3025 (Part-39) -- 0.001
EIA / EMP Report of Goendamal Graphite Ore Mines of Shri Natwar Lal Agrawal, Balangir,District, Odisha.
Vet By : SHRI ENVIRONMENTAL TECHNOLOGY INSTITUTE ,NEW DELHI
27
(mg/l) Gravimetric28. Aluminium
(mg/l)Erochrome cyanine IS:3025 (Part-55) Spectro
Photometer0.006
29. Boron (mg/l) CurcurminAPHA
SpectroPhotometer
0.002
30. ElectricalConductivityµs/cm
Electrometric APHA Conductivitymeter Systronics
10
31. Dissolved oxygen(mg/l)
Azide modification IS:3025 (Part-38) Titration 0.1
32. BOD (mg/l) Dilution method IS:3025 (Part-44) -- 0.133. Free Ammonia
(mg/l)By calculation APHA -- --
35. Coliformorganism (MPN/100 ml)
MPN method IS:5401 (Part-2) -- <2
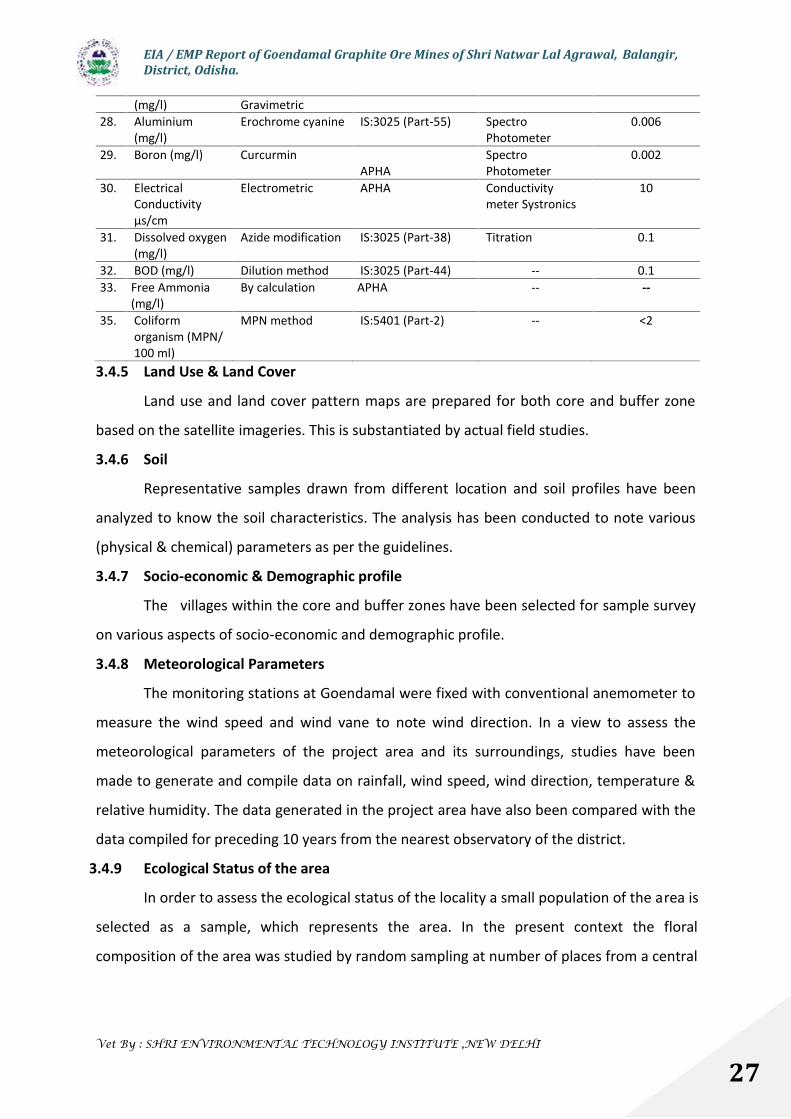
3.4.5 Land Use & Land Cover
Land use and land cover pattern maps are prepared for both core and buffer zone
based on the satellite imageries. This is substantiated by actual field studies.
3.4.6 Soil
Representative samples drawn from different location and soil profiles have been
analyzed to know the soil characteristics. The analysis has been conducted to note various
(physical & chemical) parameters as per the guidelines.
3.4.7 Socio-economic & Demographic profile
The villages within the core and buffer zones have been selected for sample survey
on various aspects of socio-economic and demographic profile.
3.4.8 Meteorological Parameters
The monitoring stations at Goendamal were fixed with conventional anemometer to
measure the wind speed and wind vane to note wind direction. In a view to assess the
meteorological parameters of the project area and its surroundings, studies have been
made to generate and compile data on rainfall, wind speed, wind direction, temperature &
relative humidity. The data generated in the project area have also been compared with the
data compiled for preceding 10 years from the nearest observatory of the district.
3.4.9 Ecological Status of the area
In order to assess the ecological status of the locality a small population of the area is
selected as a sample, which represents the area. In the present context the floral
composition of the area was studied by random sampling at number of places from a central
EIA / EMP Report of Goendamal Graphite Ore Mines of Shri Natwar Lal Agrawal, Balangir,District, Odisha.
Vet By : SHRI ENVIRONMENTAL TECHNOLOGY INSTITUTE ,NEW DELHI
28
point taking quadrate as the unit of sampling. The fauna list was collected from the forest
department and local people.
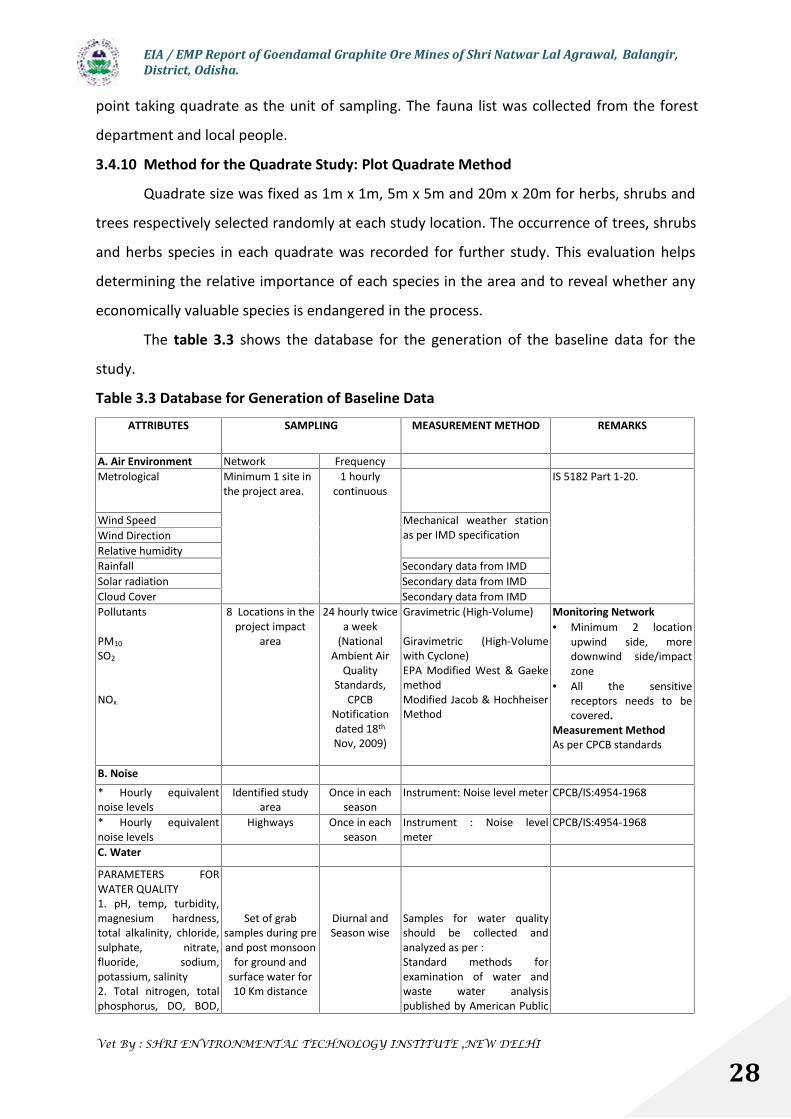
3.4.10 Method for the Quadrate Study: Plot Quadrate Method
Quadrate size was fixed as 1m x 1m, 5m x 5m and 20m x 20m for herbs, shrubs and
trees respectively selected randomly at each study location. The occurrence of trees, shrubs
and herbs species in each quadrate was recorded for further study. This evaluation helps
determining the relative importance of each species in the area and to reveal whether any
economically valuable species is endangered in the process.
The table 3.3 shows the database for the generation of the baseline data for the
study.
Table 3.3 Database for Generation of Baseline Data
ATTRIBUTES SAMPLING MEASUREMENT METHOD REMARKS
A. Air Environment Network FrequencyMetrological Minimum 1 site in
the project area.1 hourly
continuousIS 5182 Part 1-20.
Wind Speed Mechanical weather stationas per IMD specificationWind Direction
Relative humidityRainfall Secondary data from IMDSolar radiation Secondary data from IMDCloud Cover Secondary data from IMDPollutants
PM10
SO2
NOx
8 Locations in theproject impact
area
24 hourly twicea week
(NationalAmbient Air
QualityStandards,
CPCBNotificationdated 18th
Nov, 2009)
Gravimetric (High-Volume)
Giravimetric (High-Volumewith Cyclone)EPA Modified West & GaekemethodModified Jacob & HochheiserMethod
Monitoring Network Minimum 2 location
upwind side, moredownwind side/impactzone
All the sensitivereceptors needs to becovered.
Measurement MethodAs per CPCB standards
B. Noise
* Hourly equivalentnoise levels
Identified studyarea
Once in eachseason
Instrument: Noise level meter CPCB/IS:4954-1968
* Hourly equivalentnoise levels
Highways Once in eachseason
Instrument : Noise levelmeter
CPCB/IS:4954-1968
C. Water
PARAMETERS FORWATER QUALITY1. pH, temp, turbidity,magnesium hardness,total alkalinity, chloride,sulphate, nitrate,fluoride, sodium,potassium, salinity2. Total nitrogen, totalphosphorus, DO, BOD,
Set of grabsamples during preand post monsoon
for ground andsurface water for10 Km distance
Diurnal andSeason wise
Samples for water qualityshould be collected andanalyzed as per :Standard methods forexamination of water andwaste water analysispublished by American Public

EIA / EMP Report of Goendamal Graphite Ore Mines of Shri Natwar Lal Agrawal, Balangir,District, Odisha.
Vet By : SHRI ENVIRONMENTAL TECHNOLOGY INSTITUTE ,NEW DELHI
29
COD, Phenol3. Heavy Metals4. Total coliforms, faecalcoliforms
Health Association.
For River Bodies Total Carbon pH Dissolved Oxygen Biological OxygenDemand Free NH4
Boron Electrical Conductivity
Standardmethodology for
collection ofsurface water (BIS
standards).At least one grab
sample perlocation per
season.
Yield of watersources to be
measuredduring critical
season.
Samples for water qualityanalyzed as per :Standard methods forexamination of water andwastewater analysispublished by American PublicHealth Association
Data also collected fromcentral water commission,state & central groundwater board.
D.Land EnvironmentSoil Particle sizedistribution Texture pH Electrical conductivity Permeability Water holdingcapacity Porosity Land use/Landscape Location code Total project area Topography Drainage (Natural) Cultivated, forest,plantations, waterbodies, roads andsettlements.
One surfacesample from each
village.
Season wise Collected and analyzed as persolid analysis reference book.Baruah, T.C. and Barthakur,H.P. ( 1997). A text Book ofSoil Analysis. Vikas publishingHouse Pvt. Ltd. Jangpura,New Delhi.pp. 155-160.
Topo sheetsRemote SensingData/satellite data.
E. BiologicalEnvironment Rare and endangeredspecies. Terrestrial Vegetation– species list, economicimportance, forestproduce, medicinalvalue.
*Consideringprobable impact.Sampling pointsand number of
samples decidedon personal
judgment within10/25 km radius
from the proposedsite.
Season wise Standard techniques,APHA followed for samplingand measurement.
Seasonal sampling foraquatic biota.One season for terrestrialbiota, in addition tovegetation studies duringmonsoon season.Preliminary assessment.Microscopic analysis ofplankton and studies ofmacro fauna, aquaticvegetation
Fauna Avifauna Rare and endangeredspecies FishesSanctuaries/ Nationalpark Biosphere reserveMigratory routes
For forest studiesdirection of wind
should beconsidered whileselecting forests.
Secondary data to becollected from Govt. offices,NGOs published literature.
Socio-economicDemographic structureInfrastructure resourcebase.Economic resource base.Health status: Morbiditypattern.Cultural and aestheticattributes, Education.
Socio-economicsurvey is based on
proportionatestratified and
random samplingmethod.
Once duringthe studyperiod.
Primary data collectionthrough questionnaire
Secondary data from censusrecords. Statistical handbooks, topo-sheets, healthrecords and relevant officialrecords available with Govt.agencies.

EIA / EMP Report of Goendamal Graphite Ore Mines of Shri Natwar Lal Agrawal, Balangir,District, Odisha.
Vet By : SHRI ENVIRONMENTAL TECHNOLOGY INSTITUTE ,NEW DELHI
30
3.5 Establishment of Baseline for Valued Environmental Components
3.5.1 Topography
The ML area is located in village Goendamal, P.S-Turekela, of Bolangir district,
Odisha. The area shows gently sloping topography forming a dissected pediment landscape.
The average altitude of the area is 340m above MSL. The area is covered in the Toposheets
No. 64 L/14. This area lies between latitudes of 20° 35’ 00” N and longitude of 82° 46’ 40”E.
3.5.2 Connectivity
The lease area is connected by well developed metalled PWD road from Kantabanjhi
in the east and Lathore in the North. The road passes through the ML area. The G.P road
from Gaoendamal to Kandagada also passes through the lease area. The nearest railway
station is at Harishankar Road at a distance of abour 6 Km from the ML area. Nearest town
is at Kantabanjhi which is well connected to the ML area.
3.5.3.1 Regional Geology
Graphite in these parts of the state is known as “Surmamati” which the local people
use as paint for their houses and earthenware. Graphite deposits occur in association with
Eastern ghat rock types of precambrian age. The area under reference is southern part of
“Sargipalli Graphite Belt” in Sambalpur and Bolangir districts. The area is mostly soil covered
with sporadic outcrops of quartz-garnet-silimanites+graphite schist and gneisses,
granitiferous quartziteand calcium silicate/granuliteof khondalite suit, their migmatised
equivalent and granite-gneiss with pegmatite and quartz veins. Occasional boulders of
pyroxene of charnokite suit of rocks are also at places. The tentative lithography of the
region is given below:
Recent: Alluvium/soil
Laterite
Pegmatite/Quartz veins
Migmatites (Garnetiferous granite gneiss)
Eastern Ghat Group Charnockite: pyroxene granuliteKhondalite:Quartz-garnet
Sillimanite graphite
Gneisses/schist
Garnetiferous Quartzite
Cal-silicate/granulite
EIA / EMP Report of Goendamal Graphite Ore Mines of Shri Natwar Lal Agrawal, Balangir,District, Odisha.
Vet By : SHRI ENVIRONMENTAL TECHNOLOGY INSTITUTE ,NEW DELHI
31
The general trend of foliation/schistocity in the area is NNE-SSE with gentle (15-40)
easterly dip.
Graphite is flaky and crystalline and occurs as disseminations within quartz-garnet-
biotite-sillimanite-schist/gneiss and constitutes about 1-2% of the rock. The commercial
deposits are confined to graphite schist within khondalite Migmatite. These occur as
enechelon bands or lenses conformable to foliation of the rocks. All the payable Deposits
are emplaced by pegmatite/quartz veins. The presence of such veins enriches the quantity
and quality of the deposits. Normally, these veins intruding into the graphite schist have
concentrated graphite along its margin where good growth of flakes takes places. Graphite
mineralization is also influenced by folding by forming rich concentration at the crustal part
of the fold.
3.5.3.2 Local Geology
Though the ML area is covered by soil & clay, on examination of the local geology in
the areas adjoining the ML area and rock types encountered in the trial pits and boreholes it
is interpreted that in the ML area three narrow bands of Khondalite schist are sandwiched
between Khondalite Migmatite. The overall trend of this schist is N300 S. Dip is around 160 in
the direction of S 600 E.
Graphite occurs either as disseminated flakes or as segregated veins or pockets in
the schist. All along the strike continuity of the schist, the graphite concentration varies
owing to its nature of occurrences and at some places it is concentrated (FC is more that
10% by visual estimates) to become economically viable for exploitation.
3.5.3.3 Studies reveal the local Litho-Stratigraphy as follows.
Soil (Red coloured)
Laterite, Morrum
Pegmatite/Quartz veins
Khondalite Migmatite
Graphite bearing feldspathic schist (Khondalite)
3.5.3.4 Description of Rock Types:
a. Khondalites
It occurs as gneissic and schistose rocks affected by weathering. It consists of Quartz,
Feldspar, Sillimanite, Garnet, Biotite& Graphite. It is medium to coarse grained and grayish
brown in color.
EIA / EMP Report of Goendamal Graphite Ore Mines of Shri Natwar Lal Agrawal, Balangir,District, Odisha.
Vet By : SHRI ENVIRONMENTAL TECHNOLOGY INSTITUTE ,NEW DELHI
32
b. Granite Gneisses
The exposure of these rocks can be seen in the north of the quarry. It occurs in the
area in patches. It contains fine dots of garnet and hence can be termed as garnetiferous
granite gneisses.
c. Quartz Veins
They are generally found in the fracture zones of older rocks, developed during the
different phases of folding movements. A number of such veins are found exposed in the
quarry.
d. Migmatite
It is a hybrid product of original khondalite in the process of metamorphism. It is
light colored, medium grained rock containing quartz, feldspar, garnet, biotite and graphite.
The pegmatite has intruded into the migmatite and is commonly observed in trial pits
with graphite.
e. Soil
A major part of leasehold area is covered by the soil. In general it is ferruginous in
nature. Occasionally pieces of garnet are found in it. It varies in thickness from 0.5m to
1.5m. On an average its thickness can be taken as one meter of which the top layer of 0.3m
thickness is soft &rich in humus.
3.5.3.5 Graphite Genesis
Graphite occur in a wide variety of rocks such as carbonaceous shales,coil
(sedimentary rocks); basalt,peridotite,nepholin syenite, pegmatite, (igneous rocks);marble,
qrartzite,gneiss,schit,migmatite,(metamorphic rock) and even in meteorites.graphite in
these rock formed under various geological envernment.The genesis of graphit in high grade
metamorphic rocks has been the subject of different interpretation such as granulity facies
metamorphism of carbonaceous matter;reduction of oxider of carbon either emanated
from magnetic sources or due to silicification of limestones ; a direct consequence of
granulity fancies metamorphism in the presence of CO2-rich fluid under low O2 condition;
assimilation of cystal material containing biogenic carbon by magma; and methanation of
carbonate menerals by hydrogen. In the eastern ghats complex of Orissa, the sedimentary
percentage of some graphit are sediments metamorphosed under granulity facies
conditions.Methamorphism of carbonaceous marerial producing graphite is well known
(ubbelodhdf and lewis, 1960; walker, 1969; pacault, 1971).A directrelation exists between
graphitistation and metamorphic grade. The first recognized fully crystalline occurs in rocks
EIA / EMP Report of Goendamal Graphite Ore Mines of Shri Natwar Lal Agrawal, Balangir,District, Odisha.
Vet By : SHRI ENVIRONMENTAL TECHNOLOGY INSTITUTE ,NEW DELHI
33
of albite-epidote amphibolites and amphiboite fscies where temparture probably exceeded
400oc and pressure ranged from < 2 kb to> 6kb (landis, 1971).many authors belived that
such carbonaceous materials are of biogenic origin (clark, 1921 ;Tilley, 1921;walker, 1962;
Erdosh ,1970 ;Landis, 1971; Pacault, 1971 ; grew , 1974; Dissanayake, 1981; kucha and
wieczorek,1988; senguota and chhattopadhyay,1991). But the biogenic or abiogenic origin
of such carbon need to be confirmed by carbon isotope data (luque et al,1992),as such
carbon could possibly be abiogenic (Eck et al., 1966; karkhanis, 1977).
Graphite can be formed by the reduction of oxides of carbon produced either as a
result of magnetic process or by silicification of limestone (winchell , 1911 , Bastin, 1921 ;
Tilley , 1921; Bain, 1929; Ford, 1954; Strens, 1965 )following reversible reacation.
2CO=CO2+C (Boudouard reaction)
C+2H2O=CO2+2H2
C+H2O=CO+H2
During metamorphic devolation , vest quantities of fluids were developed , and under deep
seated granulity facies they wear rich in CO2 which were later precipitated as graphite under
reduced H2O (Katz, 1987 ; Santosh, 1992).
However , the objection to such reacaction is the very low value of equilibrium constant of
carbon dioxide (Craig, 1954) is consistent with both stability over the whole range of
temperatures of metamorphic reaction and inabillty to dissociate by itself.Reduction to
carbon requires temperature above 800Oc and the presence of V, Zn,Si , Ti,Al, Mg,or Ca as
native which do not exist in the crust (salotti et al., 1971).
Assimilation magma has crystal material containing biogenic carbon by the ultramafic
magma has been advocated as the source for the graphite vein deposit .The process of
mantle derived ultramafic rocks of serrania da Ronda ,southern spain.the process of maxing
of mentle carbon (δ13c=-7 ‰ ) and biogenic carbon (δ13c=-25‰) would explain the carbon
isotopic composition (δ13c=-18‰ to -16.5‰) of the graphit vein deposit (luque et al.,
1992).Isotopic stydy of graphite s from kerala khondalite belt suggests three different
modes of geneiss viz (a)graphite in the gneisses where charnockite formation is absent
showed lowest δ13c values (upto -43 ‰)corresponding to biogenic carbon.(b)samples from
the charnockite lens yielded a range of -14.4 to -12.2 ‰ δ13c values representing mixed
biogenic-fluid controlled .(c) graphits associated with charnockite adjacent to calc –silicate
EIA / EMP Report of Goendamal Graphite Ore Mines of Shri Natwar Lal Agrawal, Balangir,District, Odisha.
Vet By : SHRI ENVIRONMENTAL TECHNOLOGY INSTITUTE ,NEW DELHI
34
have δ13c in the range of -408 to -9.3 ‰ which have been precipitated from heavier carbon
enriched fluids emanation by decarbonations .relation,1992).
The calc –silicate granulites are considered to be the most probale source of carbon
in the eastern ghats complex of Orissa.methanation of carbonate menaral by hydrogen
takes place at low hydrogen pressure, under 200oC,provided the gases produced (
particularly H2O) leave system or enter into a soild phase. Subsequent pyrolysis of methane
result in the formation of graphite by the reaction CH4→ C +2H2.Once carbon is formed it
would have a catalytic effect on subsequent methane dissociation (salotti et al ,. 1971 ;
Acharya and Dash ,1984).
The field and menaralogical evidences suggest or by CO2-rich fluids generated through
diverse processess (santosh ,1992),if at all ,may be of local and / or minor signification
graphite , after its formation, in solid state through open spaces in rocks to low pressure
sites such as foliation planes, fractures, fold hinges. (Erdosh , 1970). The textural and
microstructral features show graphite as an infilling of a variety of open spaces in rocks and
mineral .The mineral impurities gangue mineral impurities in graphite lodes ,wedges of
gangue mineral withen the cleavage planes of graphite ,branching , step –like margines
,kinks and slips in graphite suggest for its crystalinity (Acharya and Dash ,1984).secondary
manganese and iron minerals like cryptomelane ,psilomelane , lithiophorite,birnessite and
goethite fill the cleavage planes of graphite,replace as well as enclose flakes and tablets of
graphite which suggests that they are later to graphite (Acharya and Rao,1998).
3.5.4 Water Resources
The main drainage pattern of the area is formed by tributaries of Lant river which
flows at a distance of 1.3 km in the north-east of the ML area. Other small nalas flow in NE
to E directions and join Lant River in the North. The drainage pattern is dendritic with
coarse density in the surrounding area. At some places the drainage system is sub-parallel.
There is no seasonal or perennial nala in the lease area.
The drainage map showing the water bodies within the buffer zone of the project
area has been given in figure 3.1.
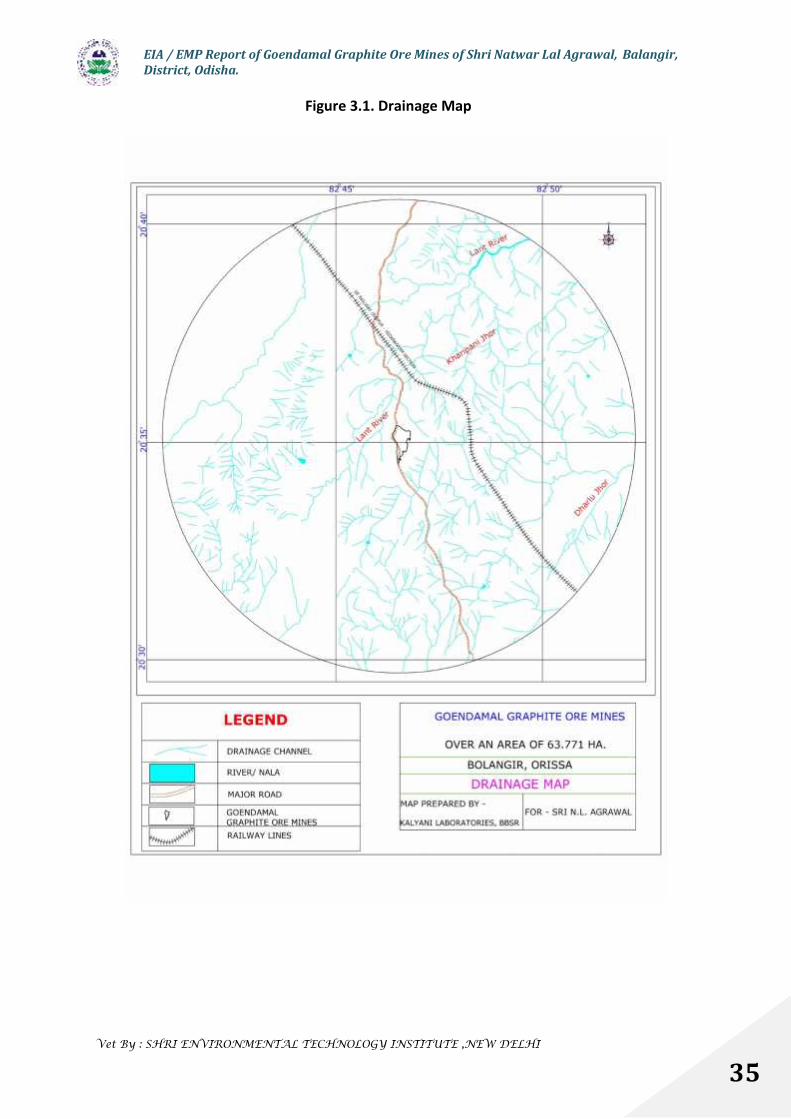
EIA / EMP Report of Goendamal Graphite Ore Mines of Shri Natwar Lal Agrawal, Balangir,District, Odisha.
Vet By : SHRI ENVIRONMENTAL TECHNOLOGY INSTITUTE ,NEW DELHI
35
Figure 3.1. Drainage Map

EIA / EMP Report of Goendamal Graphite Ore Mines of Shri Natwar Lal Agrawal, Balangir,District, Odisha.
Vet By : SHRI ENVIRONMENTAL TECHNOLOGY INSTITUTE ,NEW DELHI
36
3.5.5 Geo-hydrology
The entire study area is underlain by rock types of eastern Ghat Super Group of Pre-Cambrian
age. The rocks constitute Khondalite, Charnockite and Granite gneisses. The lateritic
formations occur as cappings at discontinuous patches.
The pre-monsoon depth to water level varies in the range between 5.0m.bgl and 7.0m.bgl.
The post-monsoon depth to water level varies in the range between 2.3m.bgl and
6.7m.bgl.Rainfall is the principal source of ground water recharge in the study are/buffer
zone. For estimation of ground water resources and stage of ground water development in
the buffer zone, GEC (Ground Water Resource Estimation Committee, 1997) norms have
been adopted and are described below.
3.5.5.1 GROUND WATER RECHARGE
a) Monsoon Ground Water Recharge
I) Based on Rainfall Infiltration Method
Total Area : 314 sq.km
Area suitable for recharge : 295sq.km
Average Rainfall : 1534.5 mm
Infiltration factor : 12%
Annual Recharge : 54.30 MCM
II) Based on Water Table Fluctuation Method
Area suitable for recharge : 295 sq.km
Mean water level fluctuation : 3.5m
Specific yield : 4%
Maximum Ground Water Recharge : 41.3 MCM
The ground water resource estimated by Water table fluctuation method is less. Therefore
as per the norms of GEC, it is to be adopted.
b) Recharge through other sources
Recharge through other sources primarily constitutes recharge through surface water
irrigation. Return recharge from surface water irrigation is estimated to be 30% of the
applied water for irrigation. As per the district irrigation department, about 898 ha. Of land
EIA / EMP Report of Goendamal Graphite Ore Mines of Shri Natwar Lal Agrawal, Balangir,District, Odisha.
Vet By : SHRI ENVIRONMENTAL TECHNOLOGY INSTITUTE ,NEW DELHI
37
is irrigated in the study area. If the gross irrigation requirement is taken as 50 cm/ha, total
applied water will work out to be 449 Ham. The return seepage will be 30% of 449 Ham i.e.
134 ham or 1.34 MCM.
c) Hence annual ground water resources will be
41.3 MCM+1.34 MCM
=42.64 MCM
3.5.5.2 GROUND WATER DRAFT
Ground water is mainly used for domestic, irrigation and industrial need. To estimate the
ground water use, Census data of 2001 have been used for population and irrigated area.
Draft for Drinking Use
Population using groundwater as drinking water : 37635
Per Capita : 70 lit/day
Annual Ground Water Use : 0.00263 MCM
Irrigation Use
About 83 ha of land is being irrigated through ground water. Considering 50 cm/ha of
ground water use, total ground water need for irrigation works out to be 0.415 MCM.
Industrial Use
Several industries are in the process of being set up in the study area. The industrial use can
be taken to be about 3 MCM
Total Ground Water Utilization
0.002MCM+ 0.415 MCM+3 MCM
= 3.417 MCM
Ground Water Balance
Annual Resources =42.64 MCM
Annual Utilisation =3.417 MCM
Balance GW=39.223 MCM
3.5.5.3 STAGE OF GROUND WATER DEVELOPMENT
The stage of ground water development in an area is taken as the ratio of Gross annual draft
for all uses to the total utilizable ground water resource or net annual ground water
availability
Thus the stage of ground water development ( in %) in the buffer zone is8.01 %

EIA / EMP Report of Goendamal Graphite Ore Mines of Shri Natwar Lal Agrawal, Balangir,District, Odisha.
Vet By : SHRI ENVIRONMENTAL TECHNOLOGY INSTITUTE ,NEW DELHI
38
Since the buffer zone represents an area where stage of development is 8.01 % and there is
no long term decline of pre & post monsoon water level , the area is categorized as safe.
3.6 Land Use Pattern
The landuse / landcover classification system standardized by Department of Space,
for mapping different agro-climatic zones has been adopted. This classification system has
six major land use classes at level I and twenty-eight at level II (table 3.4). The land use
classification of the buffer zone of the study point is shown in table -3.5. andfigure-3.2.
Table 3.4 Land use / Land cover Classification System
Sr.No.
Level – I Level – II
1. Built-up Land 1.1 Built-up land1.2 Road1.3 Railway
2. Agricultural Land 2.1 Crop land2.2 Fallow (Residual)
3. Forest 3.1 Evergreen/Semi-evergreen forest3.2 Deciduous forest3.3 Degraded/Scrub land3.4 Forest blank3.5 Forest plantation3.6 Mangrove3.7 Cropland in forest
4. Wasteland 4.1 Salt affected land4.2 Waterlogged land4.3 Marshy/Swampy land4.4 Gullied/Ravinous land4.5 Land with or without scrub4.6 Sandy area (coastal and desert)4.6 Waste/sheetrock area
5. Water bodies 5.1 River/Stream5.2 Lake/Reservoir5.3 Tank/Canal
6. Others 6.1 Grassland/Grazing land6.2 Shifting cultivation6.3 Snow cover/Glacial area
Table 3.5 Land use Classification of Buffer Zone
Sr.No.
Level – I Landuse
Level – IILand use
Area InHectares
Percentage OfTotal Area
1. Built-up Land 1.1 Built-up land 491.76 1.62. Agricultural Land 2.1 Kharif crop 9196.94 29.3
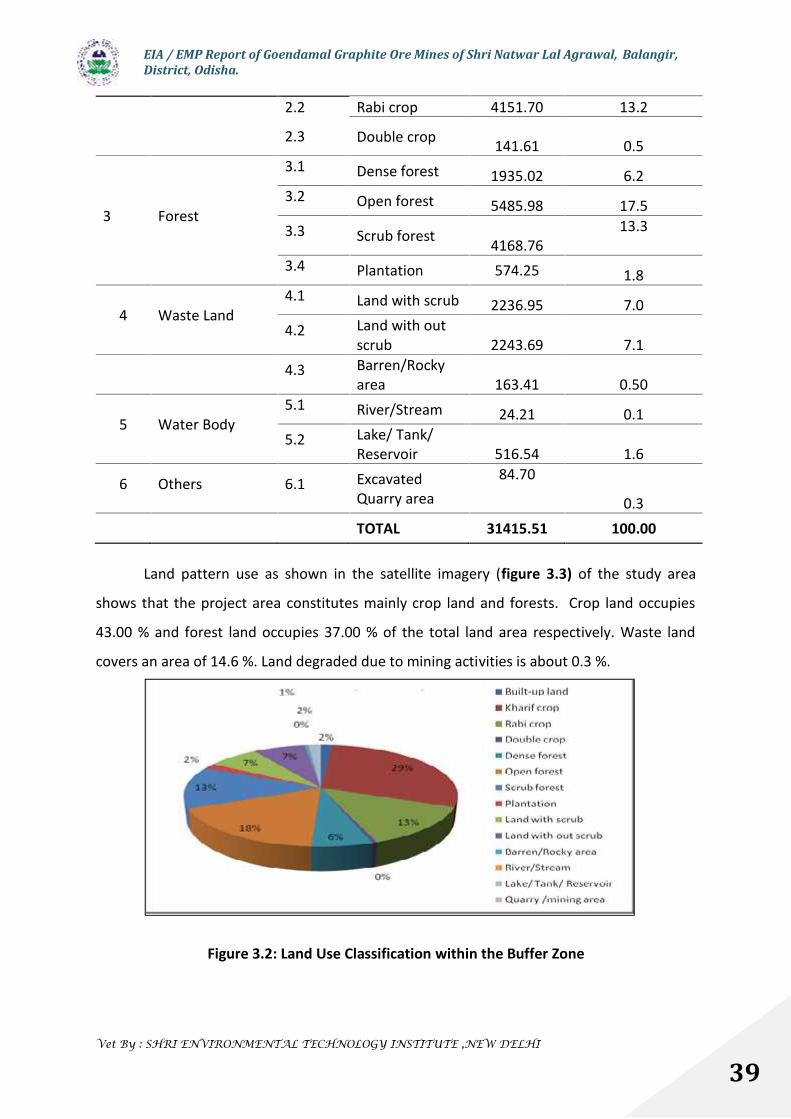
EIA / EMP Report of Goendamal Graphite Ore Mines of Shri Natwar Lal Agrawal, Balangir,District, Odisha.
Vet By : SHRI ENVIRONMENTAL TECHNOLOGY INSTITUTE ,NEW DELHI
39
Land pattern use as shown in the satellite imagery (figure 3.3) of the study area
shows that the project area constitutes mainly crop land and forests. Crop land occupies
43.00 % and forest land occupies 37.00 % of the total land area respectively. Waste land
covers an area of 14.6 %. Land degraded due to mining activities is about 0.3 %.
Figure 3.2: Land Use Classification within the Buffer Zone
2.2
2.3
Rabi crop 4151.70 13.2
Double crop 141.61 0.5
3 Forest
3.1 Dense forest 1935.02 6.23.2 Open forest 5485.98 17.53.3 Scrub forest 4168.76
13.3
3.4 Plantation 574.25 1.8
4 Waste Land4.1 Land with scrub 2236.95 7.04.2 Land with out
scrub 2243.69 7.14.3 Barren/Rocky
area 163.41 0.50
5 Water Body5.1 River/Stream 24.21 0.15.2 Lake/ Tank/
Reservoir 516.54 1.6
6 Others 6.1 ExcavatedQuarry area
84.70
0.3TOTAL 31415.51 100.00

EIA / EMP Report of Goendamal Graphite Ore Mines of Shri Natwar Lal Agrawal, Balangir,District, Odisha.
Vet By : SHRI ENVIRONMENTAL TECHNOLOGY INSTITUTE ,NEW DELHI
40
Figure 3.3. Land use Map
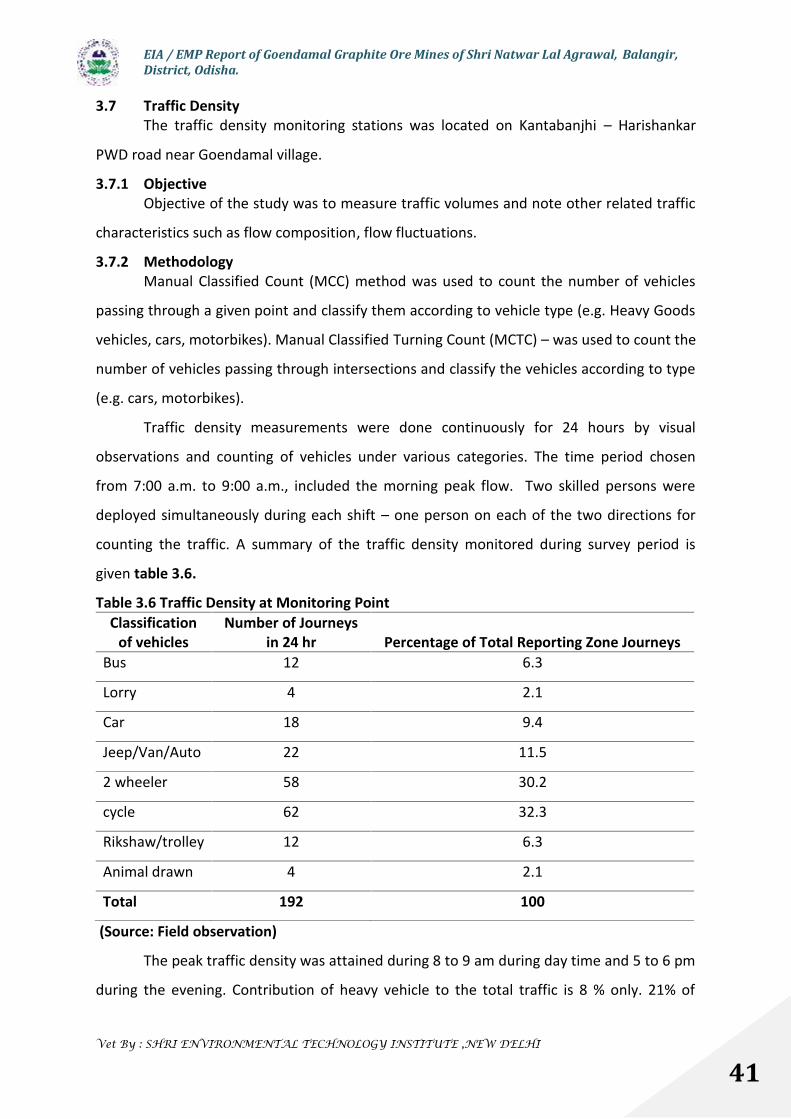
EIA / EMP Report of Goendamal Graphite Ore Mines of Shri Natwar Lal Agrawal, Balangir,District, Odisha.
Vet By : SHRI ENVIRONMENTAL TECHNOLOGY INSTITUTE ,NEW DELHI
41
3.7 Traffic DensityThe traffic density monitoring stations was located on Kantabanjhi – Harishankar
PWD road near Goendamal village.
3.7.1 ObjectiveObjective of the study was to measure traffic volumes and note other related traffic
characteristics such as flow composition, flow fluctuations.
3.7.2 MethodologyManual Classified Count (MCC) method was used to count the number of vehicles
passing through a given point and classify them according to vehicle type (e.g. Heavy Goods
vehicles, cars, motorbikes). Manual Classified Turning Count (MCTC) – was used to count the
number of vehicles passing through intersections and classify the vehicles according to type
(e.g. cars, motorbikes).
Traffic density measurements were done continuously for 24 hours by visual
observations and counting of vehicles under various categories. The time period chosen
from 7:00 a.m. to 9:00 a.m., included the morning peak flow. Two skilled persons were
deployed simultaneously during each shift – one person on each of the two directions for
counting the traffic. A summary of the traffic density monitored during survey period is
given table 3.6.
Table 3.6 Traffic Density at Monitoring PointClassification
of vehiclesNumber of Journeys
in 24 hr Percentage of Total Reporting Zone JourneysBus 12 6.3
Lorry 4 2.1
Car 18 9.4
Jeep/Van/Auto 22 11.5
2 wheeler 58 30.2
cycle 62 32.3
Rikshaw/trolley 12 6.3
Animal drawn 4 2.1
Total 192 100
(Source: Field observation)
The peak traffic density was attained during 8 to 9 am during day time and 5 to 6 pm
during the evening. Contribution of heavy vehicle to the total traffic is 8 % only. 21% of
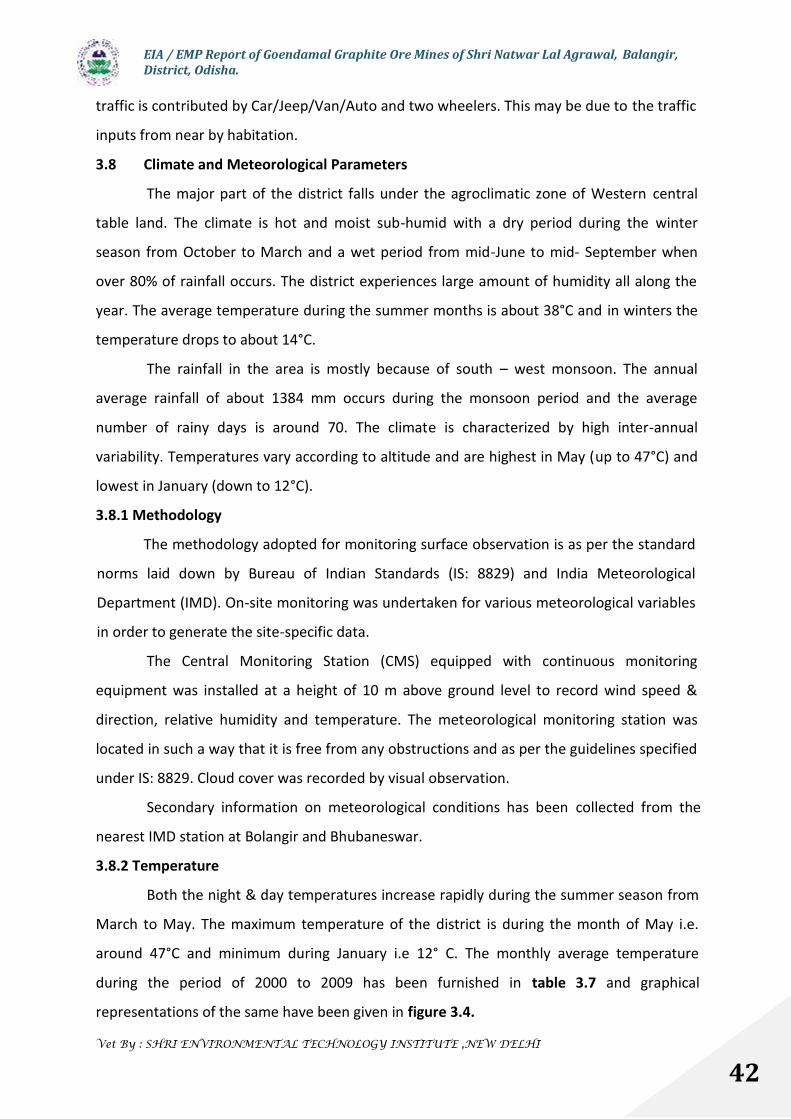
EIA / EMP Report of Goendamal Graphite Ore Mines of Shri Natwar Lal Agrawal, Balangir,District, Odisha.
Vet By : SHRI ENVIRONMENTAL TECHNOLOGY INSTITUTE ,NEW DELHI
42
traffic is contributed by Car/Jeep/Van/Auto and two wheelers. This may be due to the traffic
inputs from near by habitation.
3.8 Climate and Meteorological Parameters
The major part of the district falls under the agroclimatic zone of Western central
table land. The climate is hot and moist sub-humid with a dry period during the winter
season from October to March and a wet period from mid-June to mid- September when
over 80% of rainfall occurs. The district experiences large amount of humidity all along the
year. The average temperature during the summer months is about 38°C and in winters the
temperature drops to about 14°C.
The rainfall in the area is mostly because of south – west monsoon. The annual
average rainfall of about 1384 mm occurs during the monsoon period and the average
number of rainy days is around 70. The climate is characterized by high inter-annual
variability. Temperatures vary according to altitude and are highest in May (up to 47°C) and
lowest in January (down to 12°C).
3.8.1 Methodology
The methodology adopted for monitoring surface observation is as per the standard
norms laid down by Bureau of Indian Standards (IS: 8829) and India Meteorological
Department (IMD). On-site monitoring was undertaken for various meteorological variables
in order to generate the site-specific data.
The Central Monitoring Station (CMS) equipped with continuous monitoring
equipment was installed at a height of 10 m above ground level to record wind speed &
direction, relative humidity and temperature. The meteorological monitoring station was
located in such a way that it is free from any obstructions and as per the guidelines specified
under IS: 8829. Cloud cover was recorded by visual observation.
Secondary information on meteorological conditions has been collected from the
nearest IMD station at Bolangir and Bhubaneswar.
3.8.2 Temperature
Both the night & day temperatures increase rapidly during the summer season from
March to May. The maximum temperature of the district is during the month of May i.e.
around 47°C and minimum during January i.e 12° C. The monthly average temperature
during the period of 2000 to 2009 has been furnished in table 3.7 and graphical
representations of the same have been given in figure 3.4.
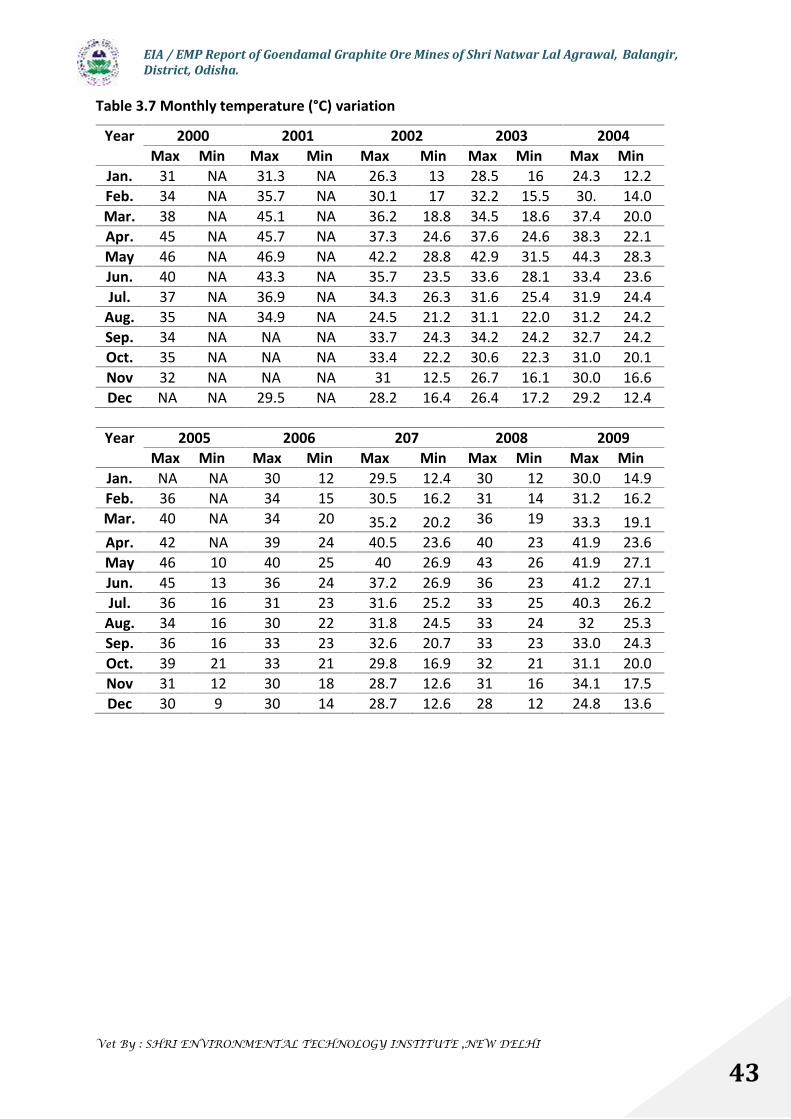
EIA / EMP Report of Goendamal Graphite Ore Mines of Shri Natwar Lal Agrawal, Balangir,District, Odisha.
Vet By : SHRI ENVIRONMENTAL TECHNOLOGY INSTITUTE ,NEW DELHI
43
Table 3.7 Monthly temperature (°C) variation
Year 2000 2001 2002 2003 2004Max Min Max Min Max Min Max Min Max Min
Jan. 31 NA 31.3 NA 26.3 13 28.5 16 24.3 12.2Feb. 34 NA 35.7 NA 30.1 17 32.2 15.5 30. 14.0Mar. 38 NA 45.1 NA 36.2 18.8 34.5 18.6 37.4 20.0Apr. 45 NA 45.7 NA 37.3 24.6 37.6 24.6 38.3 22.1May 46 NA 46.9 NA 42.2 28.8 42.9 31.5 44.3 28.3Jun. 40 NA 43.3 NA 35.7 23.5 33.6 28.1 33.4 23.6Jul. 37 NA 36.9 NA 34.3 26.3 31.6 25.4 31.9 24.4
Aug. 35 NA 34.9 NA 24.5 21.2 31.1 22.0 31.2 24.2Sep. 34 NA NA NA 33.7 24.3 34.2 24.2 32.7 24.2Oct. 35 NA NA NA 33.4 22.2 30.6 22.3 31.0 20.1Nov 32 NA NA NA 31 12.5 26.7 16.1 30.0 16.6Dec NA NA 29.5 NA 28.2 16.4 26.4 17.2 29.2 12.4
Year 2005 2006 207 2008 2009Max Min Max Min Max Min Max Min Max Min
Jan. NA NA 30 12 29.5 12.4 30 12 30.0 14.9Feb. 36 NA 34 15 30.5 16.2 31 14 31.2 16.2Mar. 40 NA 34 20 35.2 20.2 36 19 33.3 19.1Apr. 42 NA 39 24 40.5 23.6 40 23 41.9 23.6May 46 10 40 25 40 26.9 43 26 41.9 27.1Jun. 45 13 36 24 37.2 26.9 36 23 41.2 27.1Jul. 36 16 31 23 31.6 25.2 33 25 40.3 26.2
Aug. 34 16 30 22 31.8 24.5 33 24 32 25.3Sep. 36 16 33 23 32.6 20.7 33 23 33.0 24.3Oct. 39 21 33 21 29.8 16.9 32 21 31.1 20.0Nov 31 12 30 18 28.7 12.6 31 16 34.1 17.5Dec 30 9 30 14 28.7 12.6 28 12 24.8 13.6
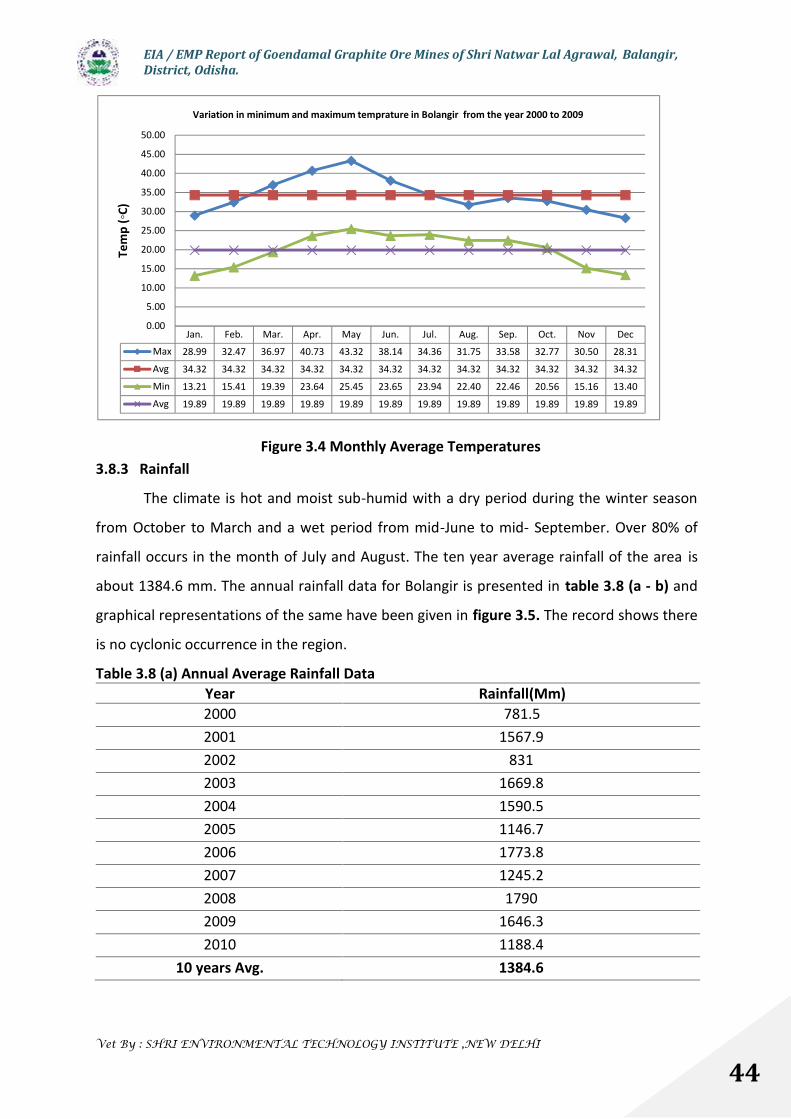
EIA / EMP Report of Goendamal Graphite Ore Mines of Shri Natwar Lal Agrawal, Balangir,District, Odisha.
Vet By : SHRI ENVIRONMENTAL TECHNOLOGY INSTITUTE ,NEW DELHI
44
3.8.3 Rainfall
The climate is hot and moist sub-humid with a dry period during the winter season
from October to March and a wet period from mid-June to mid- September. Over 80% of
rainfall occurs in the month of July and August. The ten year average rainfall of the area is
about 1384.6 mm. The annual rainfall data for Bolangir is presented in table 3.8 (a - b) and
graphical representations of the same have been given in figure 3.5. The record shows there
is no cyclonic occurrence in the region.
Table 3.8 (a) Annual Average Rainfall DataYear Rainfall(Mm)2000 781.52001 1567.92002 8312003 1669.82004 1590.52005 1146.72006 1773.82007 1245.22008 17902009 1646.32010 1188.4
10 years Avg. 1384.6
Jan. Feb. Mar. Apr. May Jun. Jul. Aug. Sep. Oct. Nov Dec
Max 28.99 32.47 36.97 40.73 43.32 38.14 34.36 31.75 33.58 32.77 30.50 28.31
Avg 34.32 34.32 34.32 34.32 34.32 34.32 34.32 34.32 34.32 34.32 34.32 34.32
Min 13.21 15.41 19.39 23.64 25.45 23.65 23.94 22.40 22.46 20.56 15.16 13.40
Avg 19.89 19.89 19.89 19.89 19.89 19.89 19.89 19.89 19.89 19.89 19.89 19.89
0.00
5.00
10.00
15.00
20.00
25.00
30.00
35.00
40.00
45.00
50.00Te
mp
(◦C)
Variation in minimum and maximum temprature in Bolangir from the year 2000 to 2009
Figure 3.4 Monthly Average Temperatures
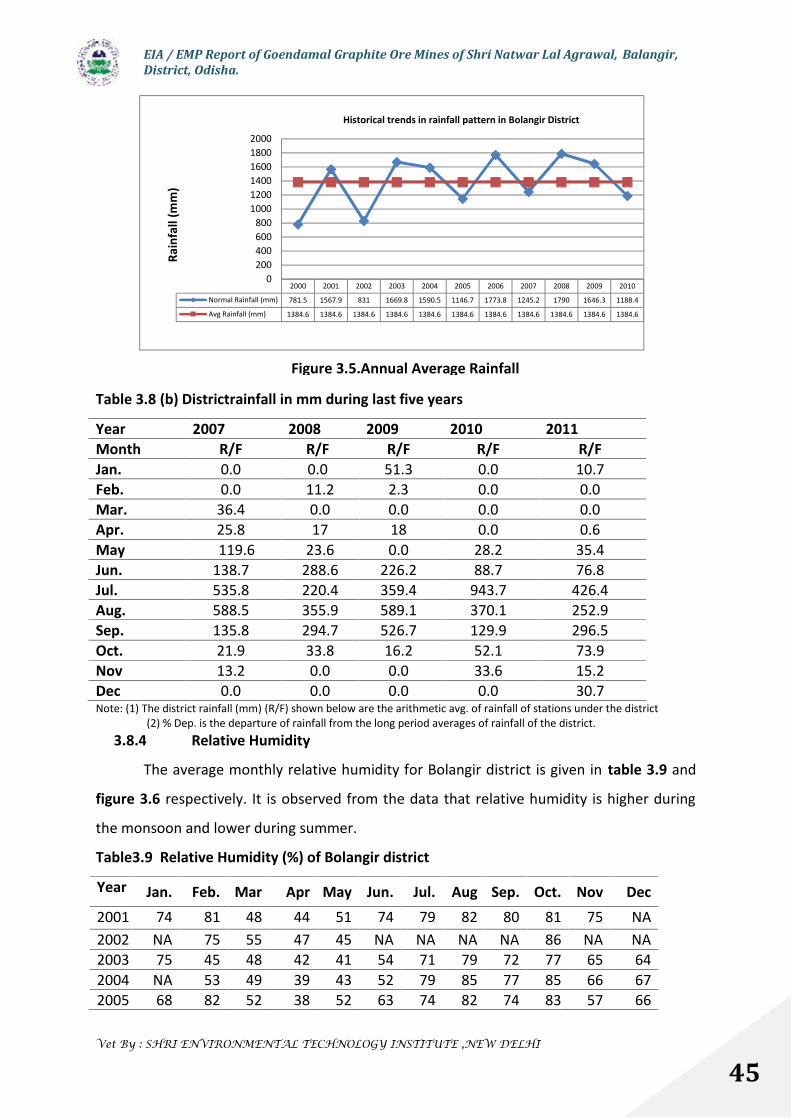
EIA / EMP Report of Goendamal Graphite Ore Mines of Shri Natwar Lal Agrawal, Balangir,District, Odisha.
Vet By : SHRI ENVIRONMENTAL TECHNOLOGY INSTITUTE ,NEW DELHI
45
Table 3.8 (b) Districtrainfall in mm during last five years
Year 2007 2008 2009 2010 2011Month R/F R/F R/F R/F R/FJan. 0.0 0.0 51.3 0.0 10.7Feb. 0.0 11.2 2.3 0.0 0.0Mar. 36.4 0.0 0.0 0.0 0.0Apr. 25.8 17 18 0.0 0.6May 119.6 23.6 0.0 28.2 35.4Jun. 138.7 288.6 226.2 88.7 76.8Jul. 535.8 220.4 359.4 943.7 426.4Aug. 588.5 355.9 589.1 370.1 252.9Sep. 135.8 294.7 526.7 129.9 296.5Oct. 21.9 33.8 16.2 52.1 73.9Nov 13.2 0.0 0.0 33.6 15.2Dec 0.0 0.0 0.0 0.0 30.7Note: (1) The district rainfall (mm) (R/F) shown below are the arithmetic avg. of rainfall of stations under the district
(2) % Dep. is the departure of rainfall from the long period averages of rainfall of the district.3.8.4 Relative Humidity
The average monthly relative humidity for Bolangir district is given in table 3.9 and
figure 3.6 respectively. It is observed from the data that relative humidity is higher during
the monsoon and lower during summer.
Table3.9 Relative Humidity (%) of Bolangir district
Year Jan. Feb. Mar Apr May Jun. Jul. Aug Sep. Oct. Nov Dec2001 74 81 48 44 51 74 79 82 80 81 75 NA2002 NA 75 55 47 45 NA NA NA NA 86 NA NA2003 75 45 48 42 41 54 71 79 72 77 65 642004 NA 53 49 39 43 52 79 85 77 85 66 672005 68 82 52 38 52 63 74 82 74 83 57 66
2000 2001 2002 2003 2004 2005 2006 2007 2008 2009 2010
Normal Rainfall (mm) 781.5 1567.9 831 1669.8 1590.5 1146.7 1773.8 1245.2 1790 1646.3 1188.4
Avg Rainfall (mm) 1384.6 1384.6 1384.6 1384.6 1384.6 1384.6 1384.6 1384.6 1384.6 1384.6 1384.6
0200400600800
100012001400160018002000
Rain
fall
(mm
)
Historical trends in rainfall pattern in Bolangir District
Figure 3.5.Annual Average Rainfall
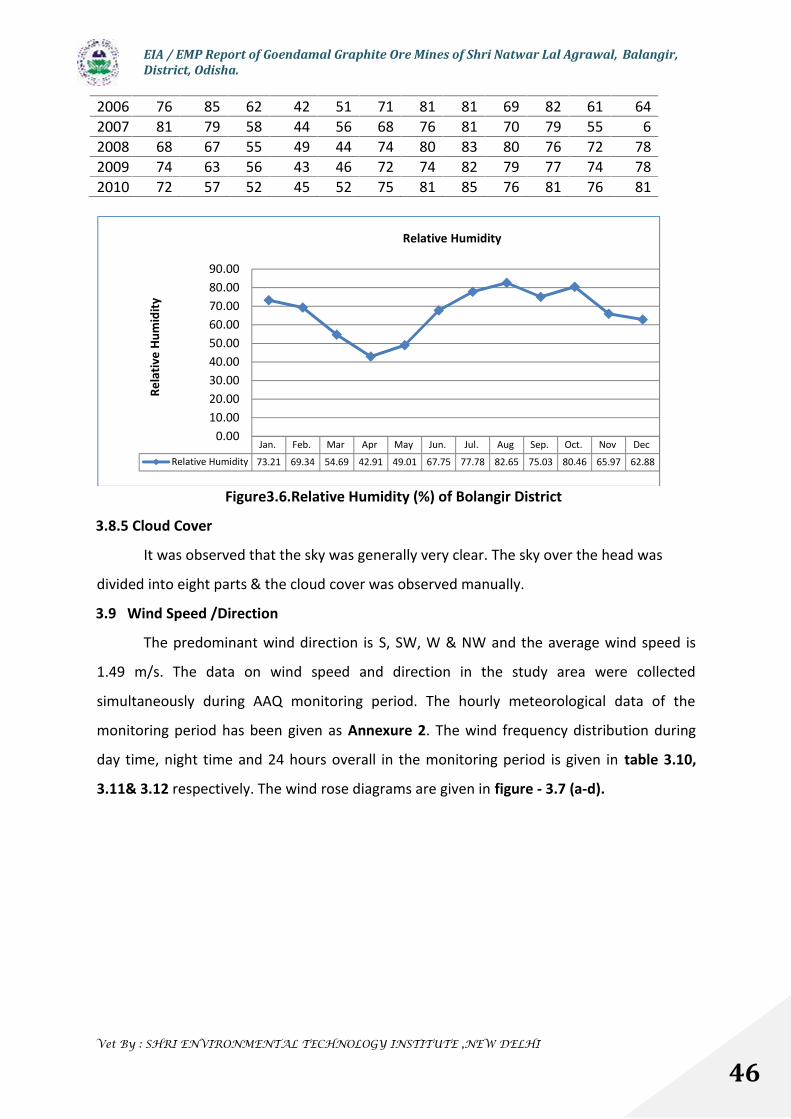
EIA / EMP Report of Goendamal Graphite Ore Mines of Shri Natwar Lal Agrawal, Balangir,District, Odisha.
Vet By : SHRI ENVIRONMENTAL TECHNOLOGY INSTITUTE ,NEW DELHI
46
2006 76 85 62 42 51 71 81 81 69 82 61 642007 81 79 58 44 56 68 76 81 70 79 55 62008 68 67 55 49 44 74 80 83 80 76 72 782009 74 63 56 43 46 72 74 82 79 77 74 782010 72 57 52 45 52 75 81 85 76 81 76 81
Figure3.6.Relative Humidity (%) of Bolangir District
3.8.5 Cloud Cover
It was observed that the sky was generally very clear. The sky over the head was
divided into eight parts & the cloud cover was observed manually.
3.9 Wind Speed /Direction
The predominant wind direction is S, SW, W & NW and the average wind speed is
1.49 m/s. The data on wind speed and direction in the study area were collected
simultaneously during AAQ monitoring period. The hourly meteorological data of the
monitoring period has been given as Annexure 2. The wind frequency distribution during
day time, night time and 24 hours overall in the monitoring period is given in table 3.10,
3.11& 3.12 respectively. The wind rose diagrams are given in figure - 3.7 (a-d).
Jan. Feb. Mar Apr May Jun. Jul. Aug Sep. Oct. Nov Dec
Relative Humidity 73.21 69.34 54.69 42.91 49.01 67.75 77.78 82.65 75.03 80.46 65.97 62.88
0.0010.0020.0030.0040.0050.0060.0070.0080.0090.00
Rela
tive
Hum
idity
Relative Humidity
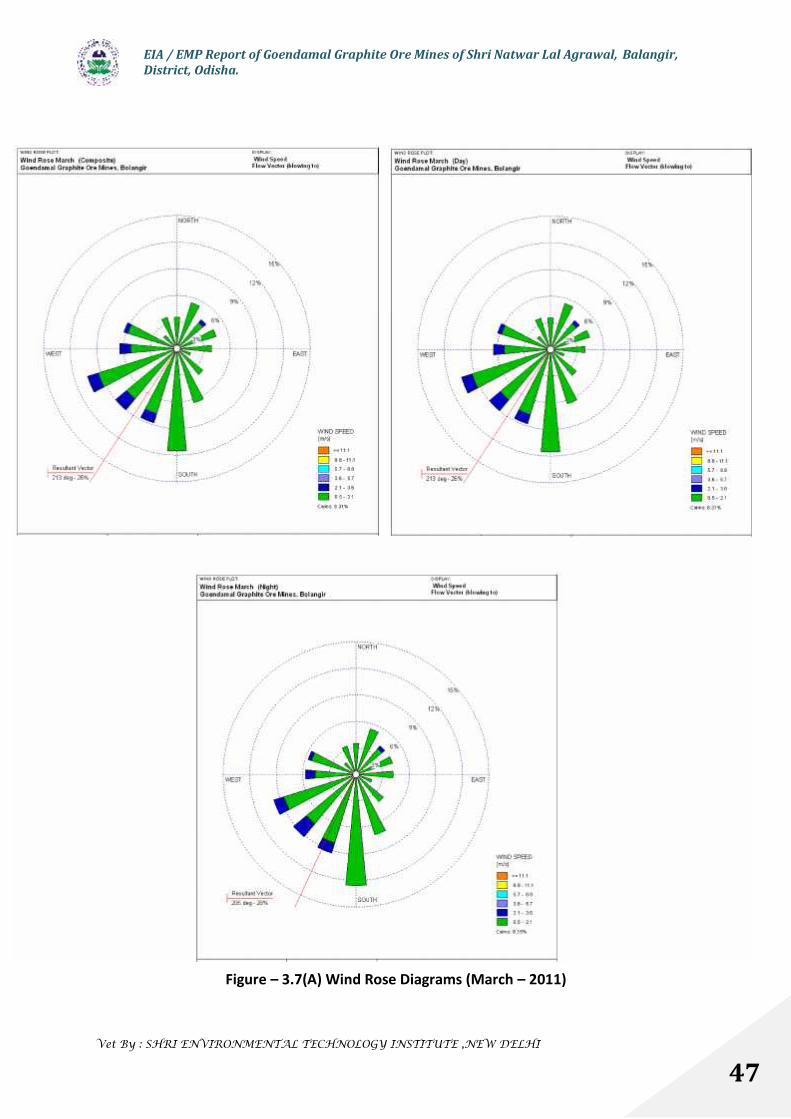
EIA / EMP Report of Goendamal Graphite Ore Mines of Shri Natwar Lal Agrawal, Balangir,District, Odisha.
Vet By : SHRI ENVIRONMENTAL TECHNOLOGY INSTITUTE ,NEW DELHI
47
Figure – 3.7(A) Wind Rose Diagrams (March – 2011)
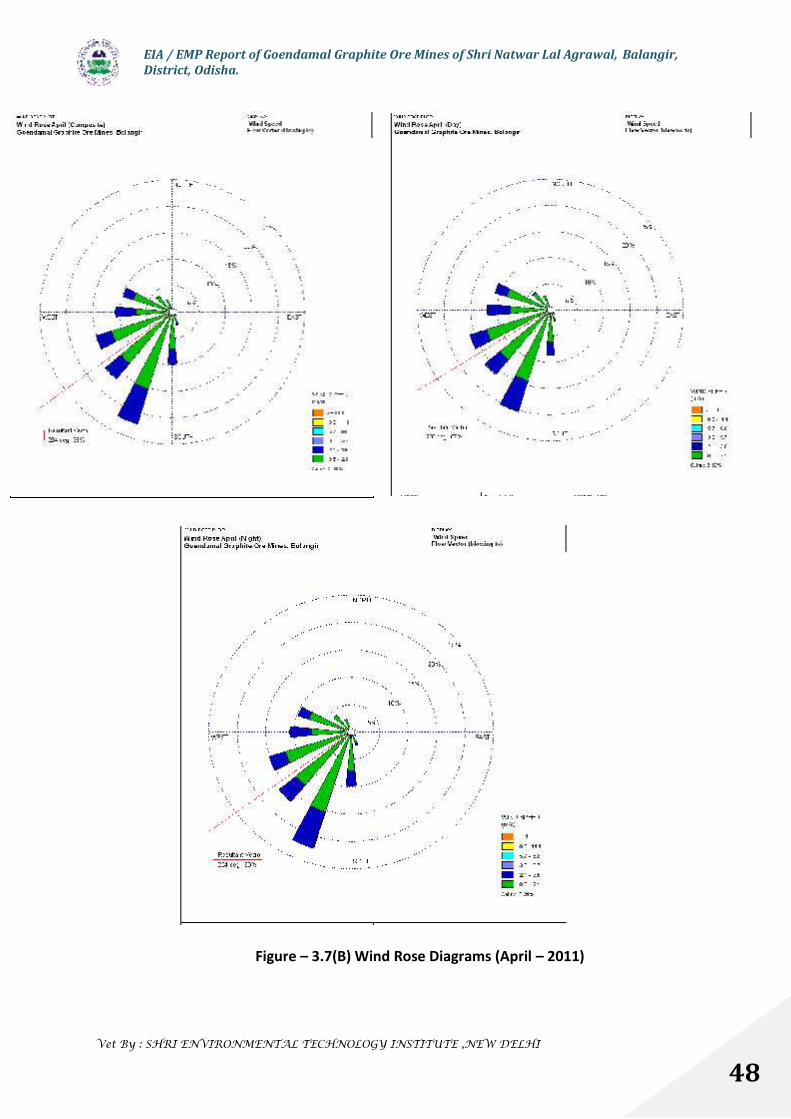
EIA / EMP Report of Goendamal Graphite Ore Mines of Shri Natwar Lal Agrawal, Balangir,District, Odisha.
Vet By : SHRI ENVIRONMENTAL TECHNOLOGY INSTITUTE ,NEW DELHI
48
Figure – 3.7(B) Wind Rose Diagrams (April – 2011)
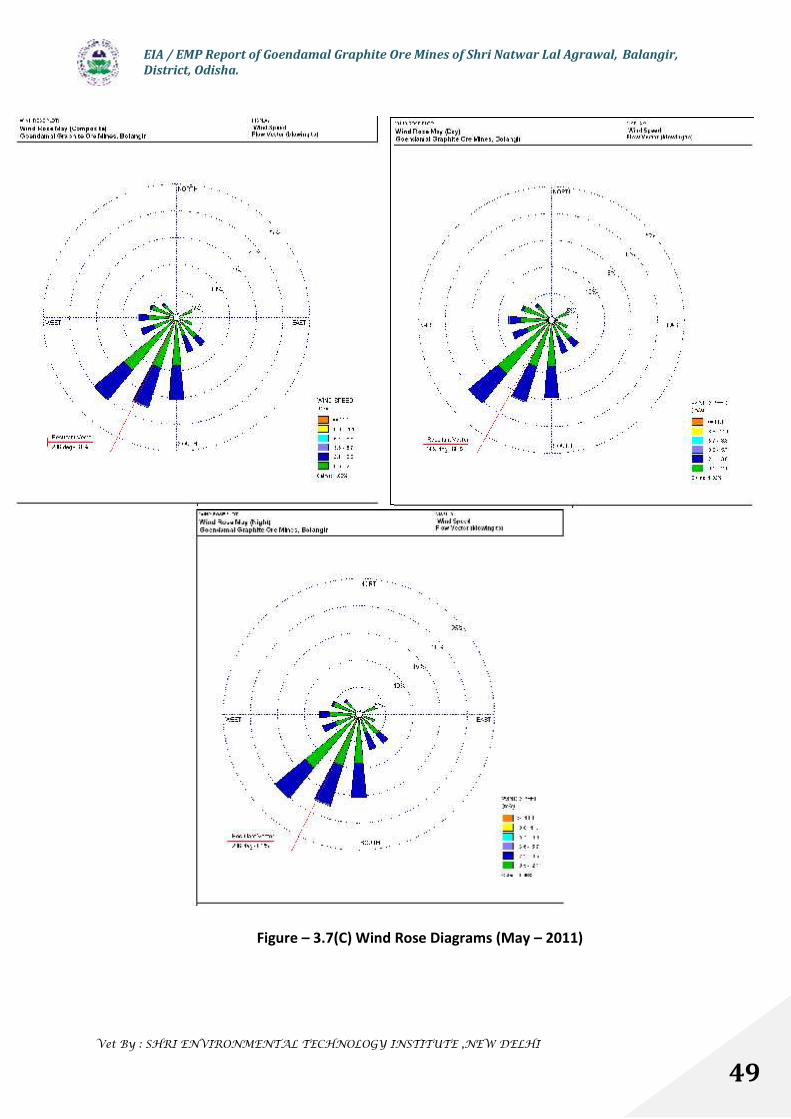
EIA / EMP Report of Goendamal Graphite Ore Mines of Shri Natwar Lal Agrawal, Balangir,District, Odisha.
Vet By : SHRI ENVIRONMENTAL TECHNOLOGY INSTITUTE ,NEW DELHI
49
Figure – 3.7(C) Wind Rose Diagrams (May – 2011)

EIA / EMP Report of Goendamal Graphite Ore Mines of Shri Natwar Lal Agrawal, Balangir,District, Odisha.
Vet By : SHRI ENVIRONMENTAL TECHNOLOGY INSTITUTE ,NEW DELHI
50
Figure – 3.7(D) Wind Rose Diagrams (March, April, May)
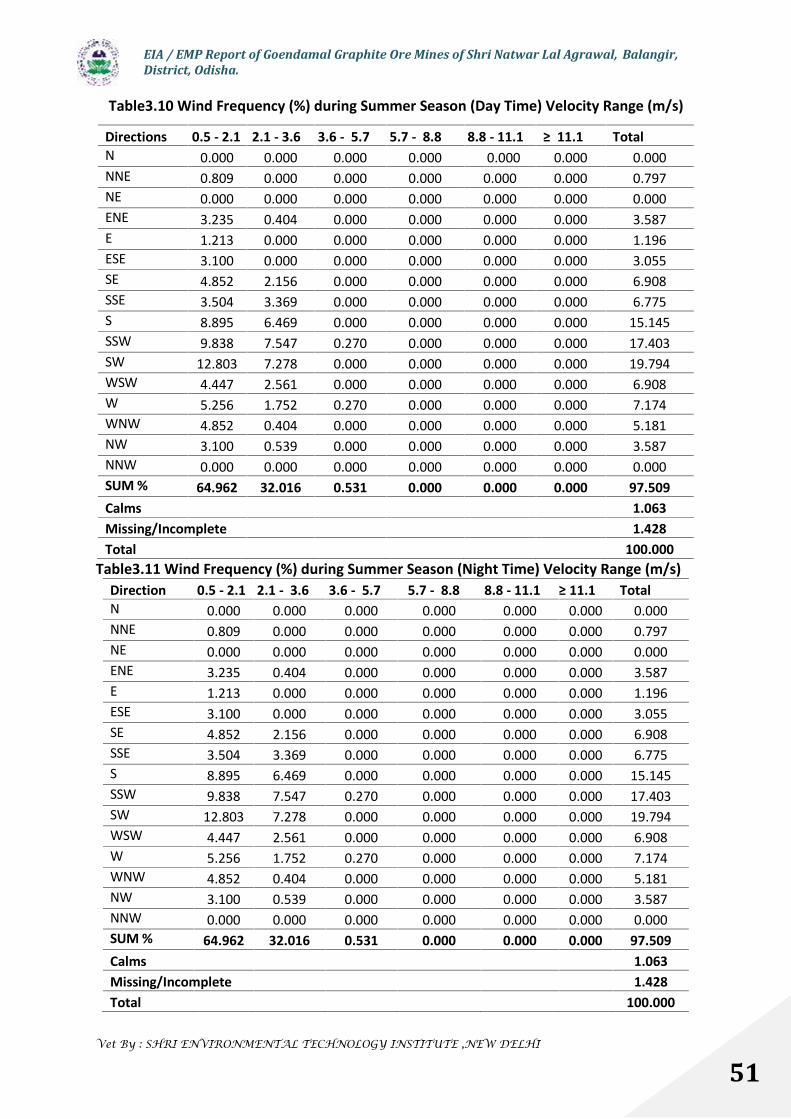
EIA / EMP Report of Goendamal Graphite Ore Mines of Shri Natwar Lal Agrawal, Balangir,District, Odisha.
Vet By : SHRI ENVIRONMENTAL TECHNOLOGY INSTITUTE ,NEW DELHI
51
Table3.10 Wind Frequency (%) during Summer Season (Day Time) Velocity Range (m/s)
Directions 0.5 - 2.1 2.1 - 3.6 3.6 - 5.7 5.7 - 8.8 8.8 - 11.1 ≥ 11.1 TotalN 0.000 0.000 0.000 0.000 0.000 0.000 0.000NNE 0.809 0.000 0.000 0.000 0.000 0.000 0.797NE 0.000 0.000 0.000 0.000 0.000 0.000 0.000ENE 3.235 0.404 0.000 0.000 0.000 0.000 3.587E 1.213 0.000 0.000 0.000 0.000 0.000 1.196ESE 3.100 0.000 0.000 0.000 0.000 0.000 3.055SE 4.852 2.156 0.000 0.000 0.000 0.000 6.908SSE 3.504 3.369 0.000 0.000 0.000 0.000 6.775S 8.895 6.469 0.000 0.000 0.000 0.000 15.145SSW 9.838 7.547 0.270 0.000 0.000 0.000 17.403SW 12.803 7.278 0.000 0.000 0.000 0.000 19.794WSW 4.447 2.561 0.000 0.000 0.000 0.000 6.908W 5.256 1.752 0.270 0.000 0.000 0.000 7.174WNW 4.852 0.404 0.000 0.000 0.000 0.000 5.181NW 3.100 0.539 0.000 0.000 0.000 0.000 3.587NNW 0.000 0.000 0.000 0.000 0.000 0.000 0.000SUM % 64.962 32.016 0.531 0.000 0.000 0.000 97.509Calms 1.063Missing/Incomplete 1.428Total 100.000
Table3.11 Wind Frequency (%) during Summer Season (Night Time) Velocity Range (m/s)Direction 0.5 - 2.1 2.1 - 3.6 3.6 - 5.7 5.7 - 8.8 8.8 - 11.1 ≥ 11.1 TotalN 0.000 0.000 0.000 0.000 0.000 0.000 0.000NNE 0.809 0.000 0.000 0.000 0.000 0.000 0.797NE 0.000 0.000 0.000 0.000 0.000 0.000 0.000ENE 3.235 0.404 0.000 0.000 0.000 0.000 3.587E 1.213 0.000 0.000 0.000 0.000 0.000 1.196ESE 3.100 0.000 0.000 0.000 0.000 0.000 3.055SE 4.852 2.156 0.000 0.000 0.000 0.000 6.908SSE 3.504 3.369 0.000 0.000 0.000 0.000 6.775S 8.895 6.469 0.000 0.000 0.000 0.000 15.145SSW 9.838 7.547 0.270 0.000 0.000 0.000 17.403SW 12.803 7.278 0.000 0.000 0.000 0.000 19.794WSW 4.447 2.561 0.000 0.000 0.000 0.000 6.908W 5.256 1.752 0.270 0.000 0.000 0.000 7.174WNW 4.852 0.404 0.000 0.000 0.000 0.000 5.181NW 3.100 0.539 0.000 0.000 0.000 0.000 3.587NNW 0.000 0.000 0.000 0.000 0.000 0.000 0.000SUM % 64.962 32.016 0.531 0.000 0.000 0.000 97.509Calms 1.063Missing/Incomplete 1.428Total 100.000
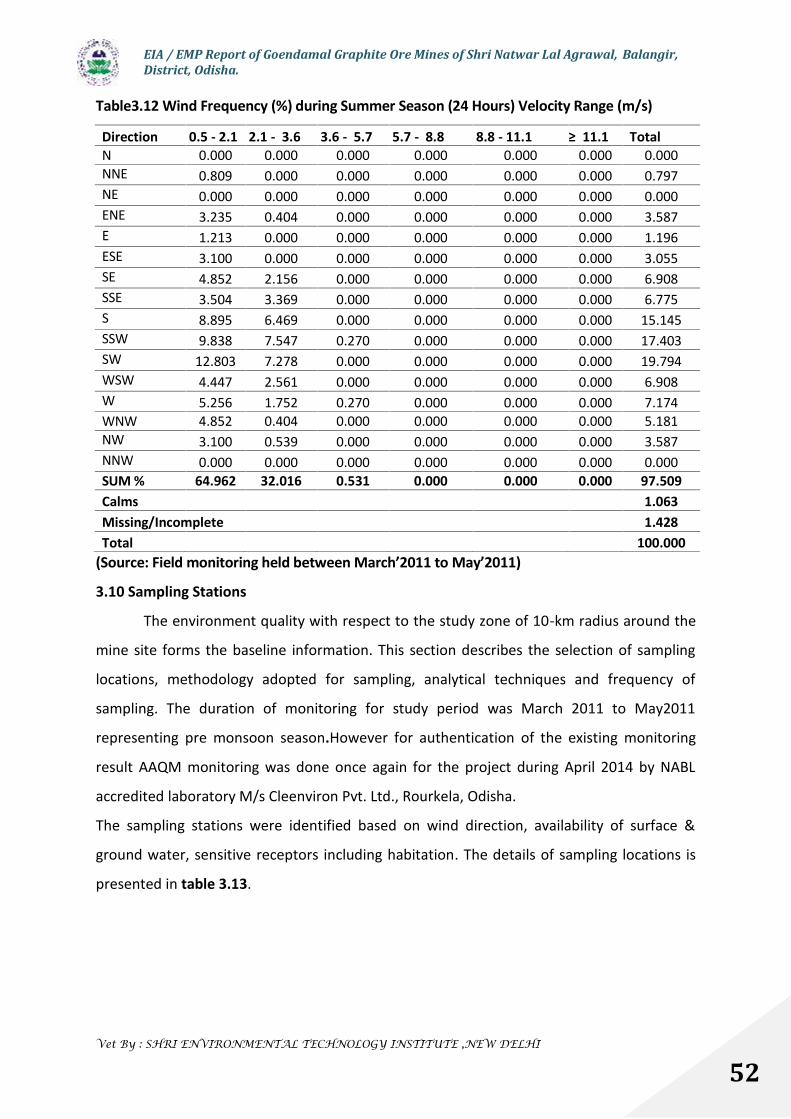
EIA / EMP Report of Goendamal Graphite Ore Mines of Shri Natwar Lal Agrawal, Balangir,District, Odisha.
Vet By : SHRI ENVIRONMENTAL TECHNOLOGY INSTITUTE ,NEW DELHI
52
Table3.12 Wind Frequency (%) during Summer Season (24 Hours) Velocity Range (m/s)
Direction 0.5 - 2.1 2.1 - 3.6 3.6 - 5.7 5.7 - 8.8 8.8 - 11.1 ≥ 11.1 TotalN 0.000 0.000 0.000 0.000 0.000 0.000 0.000NNE 0.809 0.000 0.000 0.000 0.000 0.000 0.797NE 0.000 0.000 0.000 0.000 0.000 0.000 0.000ENE 3.235 0.404 0.000 0.000 0.000 0.000 3.587E 1.213 0.000 0.000 0.000 0.000 0.000 1.196ESE 3.100 0.000 0.000 0.000 0.000 0.000 3.055SE 4.852 2.156 0.000 0.000 0.000 0.000 6.908SSE 3.504 3.369 0.000 0.000 0.000 0.000 6.775S 8.895 6.469 0.000 0.000 0.000 0.000 15.145SSW 9.838 7.547 0.270 0.000 0.000 0.000 17.403SW 12.803 7.278 0.000 0.000 0.000 0.000 19.794WSW 4.447 2.561 0.000 0.000 0.000 0.000 6.908W 5.256 1.752 0.270 0.000 0.000 0.000 7.174WNW 4.852 0.404 0.000 0.000 0.000 0.000 5.181NW 3.100 0.539 0.000 0.000 0.000 0.000 3.587NNW 0.000 0.000 0.000 0.000 0.000 0.000 0.000SUM % 64.962 32.016 0.531 0.000 0.000 0.000 97.509Calms 1.063Missing/Incomplete 1.428Total 100.000
(Source: Field monitoring held between March’2011 to May’2011)
3.10 Sampling Stations
The environment quality with respect to the study zone of 10-km radius around the
mine site forms the baseline information. This section describes the selection of sampling
locations, methodology adopted for sampling, analytical techniques and frequency of
sampling. The duration of monitoring for study period was March 2011 to May2011
representing pre monsoon season.However for authentication of the existing monitoring
result AAQM monitoring was done once again for the project during April 2014 by NABL
accredited laboratory M/s Cleenviron Pvt. Ltd., Rourkela, Odisha.
The sampling stations were identified based on wind direction, availability of surface &
ground water, sensitive receptors including habitation. The details of sampling locations is
presented in table 3.13.
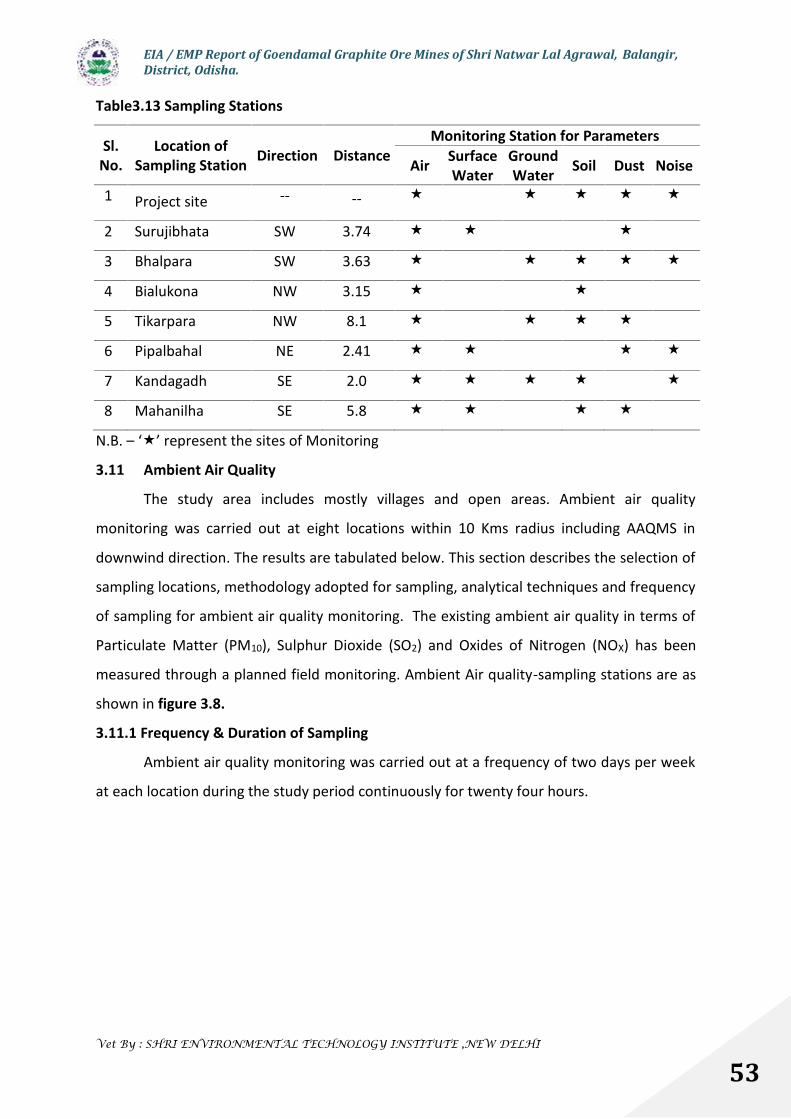
EIA / EMP Report of Goendamal Graphite Ore Mines of Shri Natwar Lal Agrawal, Balangir,District, Odisha.
Vet By : SHRI ENVIRONMENTAL TECHNOLOGY INSTITUTE ,NEW DELHI
53
Table3.13 Sampling Stations
Sl.No.
Location ofSampling Station Direction Distance
Monitoring Station for Parameters
Air SurfaceWater
GroundWater Soil Dust Noise
1 Project site -- --
2 Surujibhata SW 3.74
3 Bhalpara SW 3.63
4 Bialukona NW 3.15
5 Tikarpara NW 8.1
6 Pipalbahal NE 2.41
7 Kandagadh SE 2.0
8 Mahanilha SE 5.8
N.B. – ‘’ represent the sites of Monitoring
3.11 Ambient Air Quality
The study area includes mostly villages and open areas. Ambient air quality
monitoring was carried out at eight locations within 10 Kms radius including AAQMS in
downwind direction. The results are tabulated below. This section describes the selection of
sampling locations, methodology adopted for sampling, analytical techniques and frequency
of sampling for ambient air quality monitoring. The existing ambient air quality in terms of
Particulate Matter (PM10), Sulphur Dioxide (SO2) and Oxides of Nitrogen (NOX) has been
measured through a planned field monitoring. Ambient Air quality-sampling stations are as
shown in figure 3.8.
3.11.1 Frequency & Duration of Sampling
Ambient air quality monitoring was carried out at a frequency of two days per week
at each location during the study period continuously for twenty four hours.

EIA / EMP Report of Goendamal Graphite Ore Mines of Shri Natwar Lal Agrawal, Balangir,District, Odisha.
Vet By : SHRI ENVIRONMENTAL TECHNOLOGY INSTITUTE ,NEW DELHI
54
Figure 3.8. Sampling Location Map (Air)
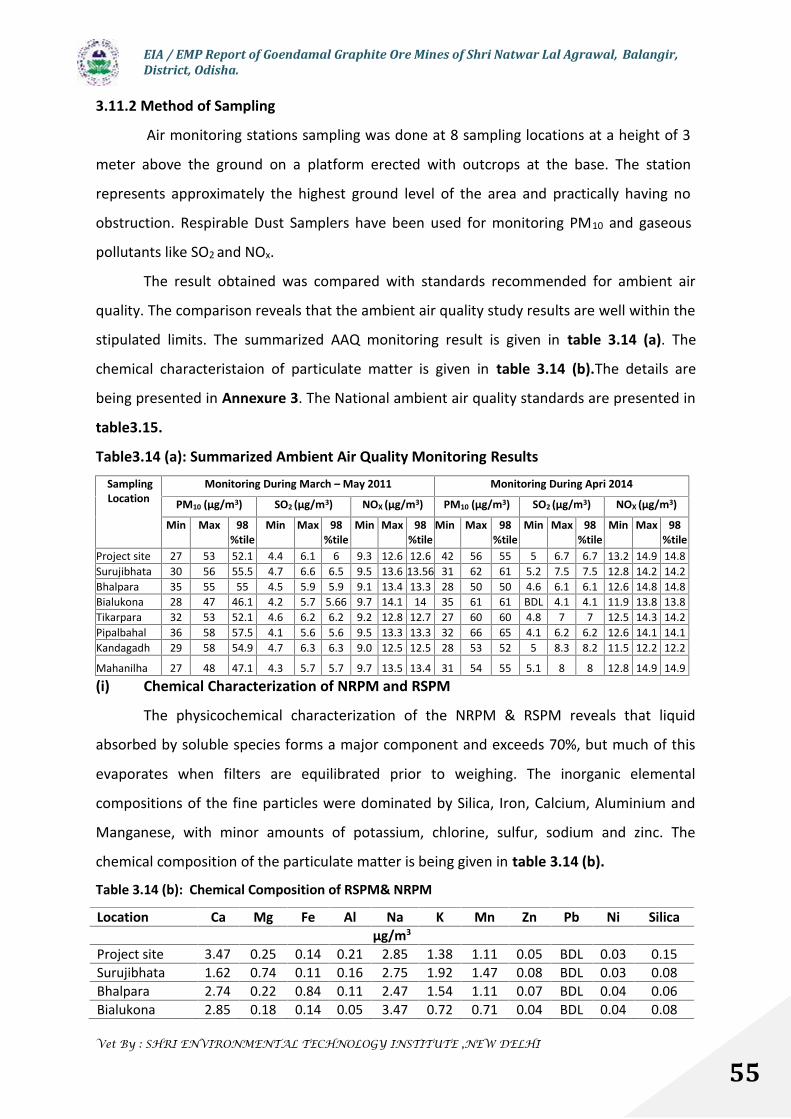
EIA / EMP Report of Goendamal Graphite Ore Mines of Shri Natwar Lal Agrawal, Balangir,District, Odisha.
Vet By : SHRI ENVIRONMENTAL TECHNOLOGY INSTITUTE ,NEW DELHI
55
3.11.2 Method of Sampling
Air monitoring stations sampling was done at 8 sampling locations at a height of 3
meter above the ground on a platform erected with outcrops at the base. The station
represents approximately the highest ground level of the area and practically having no
obstruction. Respirable Dust Samplers have been used for monitoring PM10 and gaseous
pollutants like SO2 and NOx.
The result obtained was compared with standards recommended for ambient air
quality. The comparison reveals that the ambient air quality study results are well within the
stipulated limits. The summarized AAQ monitoring result is given in table 3.14 (a). The
chemical characteristaion of particulate matter is given in table 3.14 (b).The details are
being presented in Annexure 3. The National ambient air quality standards are presented in
table3.15.
Table3.14 (a): Summarized Ambient Air Quality Monitoring Results
SamplingLocation
Monitoring During March – May 2011 Monitoring During Apri 2014
PM10 (µg/m3) SO2 (µg/m3) NOX (µg/m3) PM10 (µg/m3) SO2 (µg/m3) NOX (µg/m3)
Min Max 98%tile
Min Max 98%tile
Min Max 98%tile
Min Max 98%tile
Min Max 98%tile
Min Max 98%tile
Project site 27 53 52.1 4.4 6.1 6 9.3 12.6 12.6 42 56 55 5 6.7 6.7 13.2 14.9 14.8Surujibhata 30 56 55.5 4.7 6.6 6.5 9.5 13.6 13.56 31 62 61 5.2 7.5 7.5 12.8 14.2 14.2Bhalpara 35 55 55 4.5 5.9 5.9 9.1 13.4 13.3 28 50 50 4.6 6.1 6.1 12.6 14.8 14.8Bialukona 28 47 46.1 4.2 5.7 5.66 9.7 14.1 14 35 61 61 BDL 4.1 4.1 11.9 13.8 13.8Tikarpara 32 53 52.1 4.6 6.2 6.2 9.2 12.8 12.7 27 60 60 4.8 7 7 12.5 14.3 14.2Pipalbahal 36 58 57.5 4.1 5.6 5.6 9.5 13.3 13.3 32 66 65 4.1 6.2 6.2 12.6 14.1 14.1Kandagadh 29 58 54.9 4.7 6.3 6.3 9.0 12.5 12.5 28 53 52 5 8.3 8.2 11.5 12.2 12.2
Mahanilha 27 48 47.1 4.3 5.7 5.7 9.7 13.5 13.4 31 54 55 5.1 8 8 12.8 14.9 14.9
(i) Chemical Characterization of NRPM and RSPM
The physicochemical characterization of the NRPM & RSPM reveals that liquid
absorbed by soluble species forms a major component and exceeds 70%, but much of this
evaporates when filters are equilibrated prior to weighing. The inorganic elemental
compositions of the fine particles were dominated by Silica, Iron, Calcium, Aluminium and
Manganese, with minor amounts of potassium, chlorine, sulfur, sodium and zinc. The
chemical composition of the particulate matter is being given in table 3.14 (b).
Table 3.14 (b): Chemical Composition of RSPM& NRPM
Location Ca Mg Fe Al Na K Mn Zn Pb Ni Silicaµg/m3
Project site 3.47 0.25 0.14 0.21 2.85 1.38 1.11 0.05 BDL 0.03 0.15Surujibhata 1.62 0.74 0.11 0.16 2.75 1.92 1.47 0.08 BDL 0.03 0.08Bhalpara 2.74 0.22 0.84 0.11 2.47 1.54 1.11 0.07 BDL 0.04 0.06Bialukona 2.85 0.18 0.14 0.05 3.47 0.72 0.71 0.04 BDL 0.04 0.08
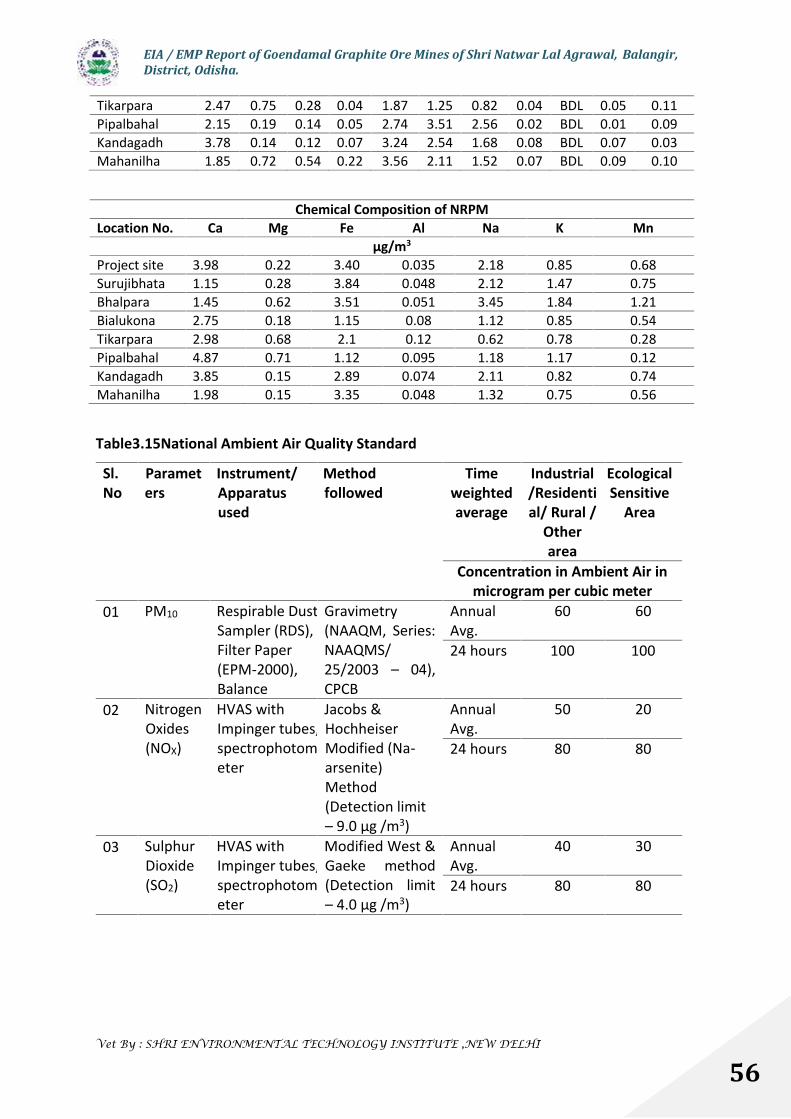
EIA / EMP Report of Goendamal Graphite Ore Mines of Shri Natwar Lal Agrawal, Balangir,District, Odisha.
Vet By : SHRI ENVIRONMENTAL TECHNOLOGY INSTITUTE ,NEW DELHI
56
Tikarpara 2.47 0.75 0.28 0.04 1.87 1.25 0.82 0.04 BDL 0.05 0.11Pipalbahal 2.15 0.19 0.14 0.05 2.74 3.51 2.56 0.02 BDL 0.01 0.09Kandagadh 3.78 0.14 0.12 0.07 3.24 2.54 1.68 0.08 BDL 0.07 0.03Mahanilha 1.85 0.72 0.54 0.22 3.56 2.11 1.52 0.07 BDL 0.09 0.10
Chemical Composition of NRPMLocation No. Ca Mg Fe Al Na K Mn
µg/m3
Project site 3.98 0.22 3.40 0.035 2.18 0.85 0.68Surujibhata 1.15 0.28 3.84 0.048 2.12 1.47 0.75Bhalpara 1.45 0.62 3.51 0.051 3.45 1.84 1.21Bialukona 2.75 0.18 1.15 0.08 1.12 0.85 0.54Tikarpara 2.98 0.68 2.1 0.12 0.62 0.78 0.28Pipalbahal 4.87 0.71 1.12 0.095 1.18 1.17 0.12Kandagadh 3.85 0.15 2.89 0.074 2.11 0.82 0.74Mahanilha 1.98 0.15 3.35 0.048 1.32 0.75 0.56
Table3.15National Ambient Air Quality Standard
Sl.No
Parameters
Instrument/Apparatusused
Methodfollowed
Timeweightedaverage
Industrial/Residential/ Rural /
Otherarea
EcologicalSensitive
Area
Concentration in Ambient Air inmicrogram per cubic meter
01 PM10 Respirable DustSampler (RDS),Filter Paper(EPM-2000),Balance
Gravimetry(NAAQM, Series:NAAQMS/25/2003 – 04),CPCB
AnnualAvg.
60 60
24 hours 100 100
02 NitrogenOxides(NOX)
HVAS withImpinger tubes,spectrophotometer
Jacobs &HochheiserModified (Na-arsenite)Method(Detection limit– 9.0 µg /m3)
AnnualAvg.
50 20
24 hours 80 80
03 SulphurDioxide(SO2)
HVAS withImpinger tubes,spectrophotometer
Modified West &Gaeke method(Detection limit– 4.0 µg /m3)
AnnualAvg.
40 30
24 hours 80 80
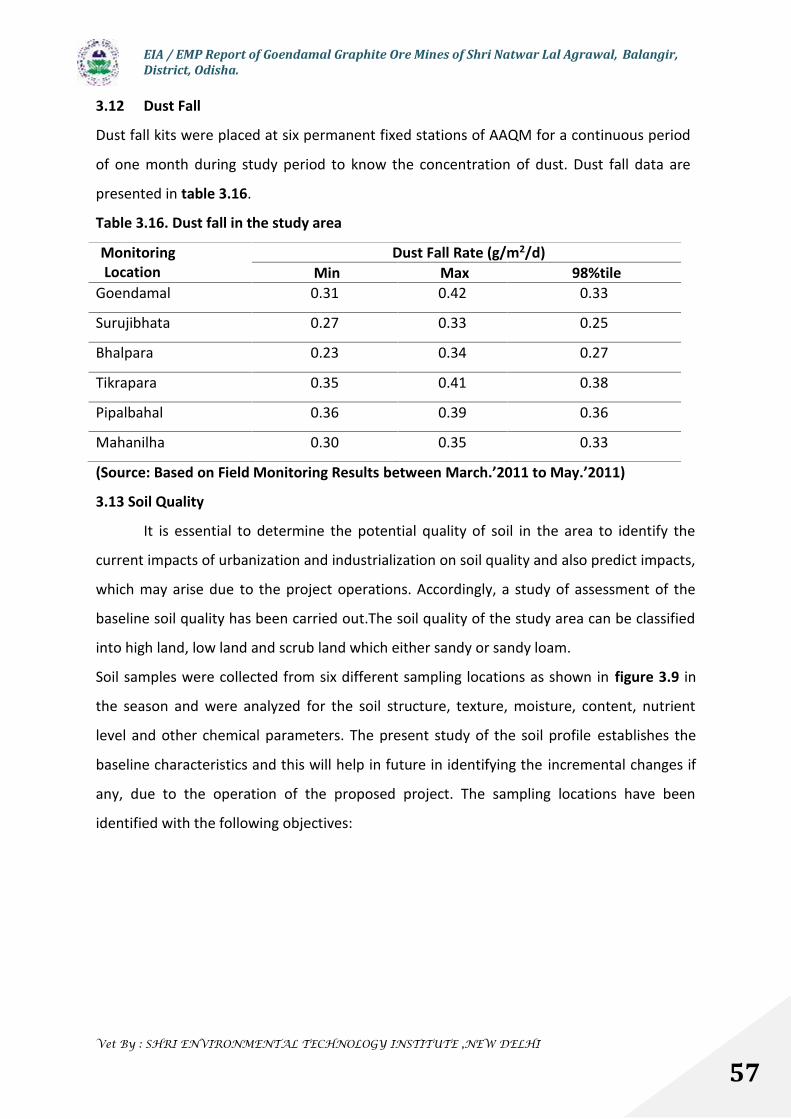
EIA / EMP Report of Goendamal Graphite Ore Mines of Shri Natwar Lal Agrawal, Balangir,District, Odisha.
Vet By : SHRI ENVIRONMENTAL TECHNOLOGY INSTITUTE ,NEW DELHI
57
3.12 Dust Fall
Dust fall kits were placed at six permanent fixed stations of AAQM for a continuous period
of one month during study period to know the concentration of dust. Dust fall data are
presented in table 3.16.
Table 3.16. Dust fall in the study area
(Source: Based on Field Monitoring Results between March.’2011 to May.’2011)
3.13 Soil Quality
It is essential to determine the potential quality of soil in the area to identify the
current impacts of urbanization and industrialization on soil quality and also predict impacts,
which may arise due to the project operations. Accordingly, a study of assessment of the
baseline soil quality has been carried out.The soil quality of the study area can be classified
into high land, low land and scrub land which either sandy or sandy loam.
Soil samples were collected from six different sampling locations as shown in figure 3.9 in
the season and were analyzed for the soil structure, texture, moisture, content, nutrient
level and other chemical parameters. The present study of the soil profile establishes the
baseline characteristics and this will help in future in identifying the incremental changes if
any, due to the operation of the proposed project. The sampling locations have been
identified with the following objectives:
MonitoringLocation
Dust Fall Rate (g/m2/d)Min Max 98%tile
Goendamal 0.31 0.42 0.33
Surujibhata 0.27 0.33 0.25
Bhalpara 0.23 0.34 0.27
Tikrapara 0.35 0.41 0.38
Pipalbahal 0.36 0.39 0.36
Mahanilha 0.30 0.35 0.33
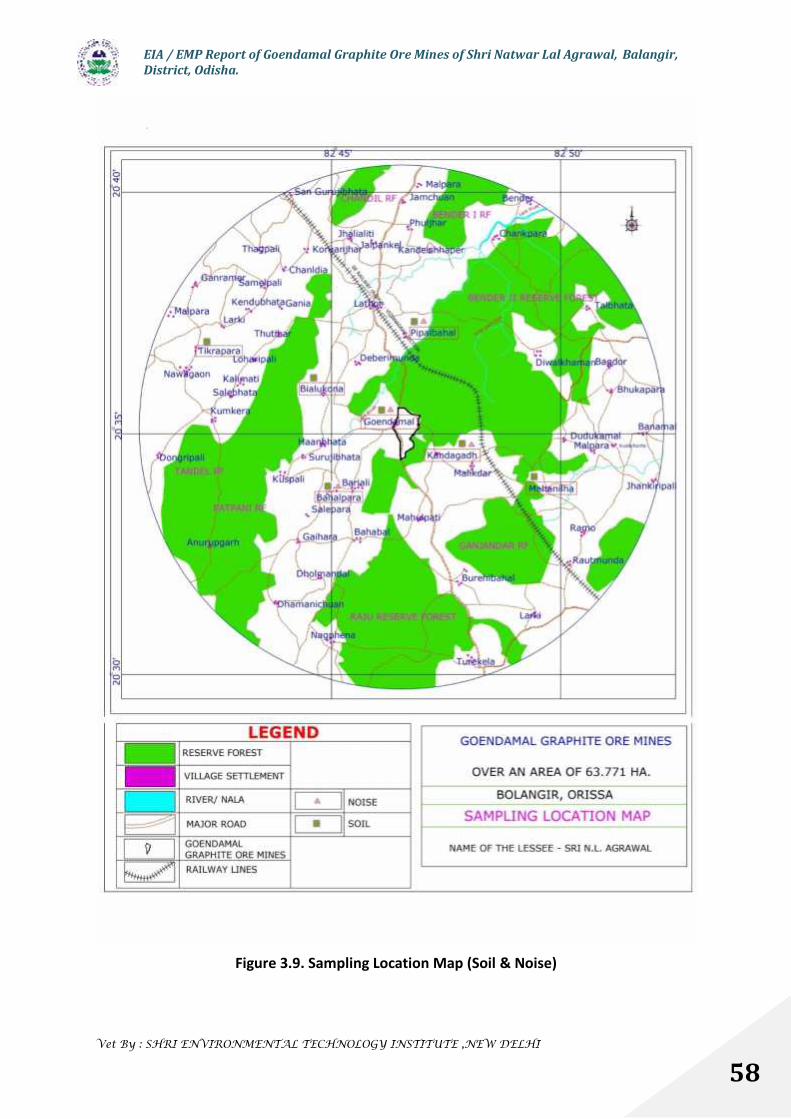
EIA / EMP Report of Goendamal Graphite Ore Mines of Shri Natwar Lal Agrawal, Balangir,District, Odisha.
Vet By : SHRI ENVIRONMENTAL TECHNOLOGY INSTITUTE ,NEW DELHI
58
Figure 3.9. Sampling Location Map (Soil & Noise)
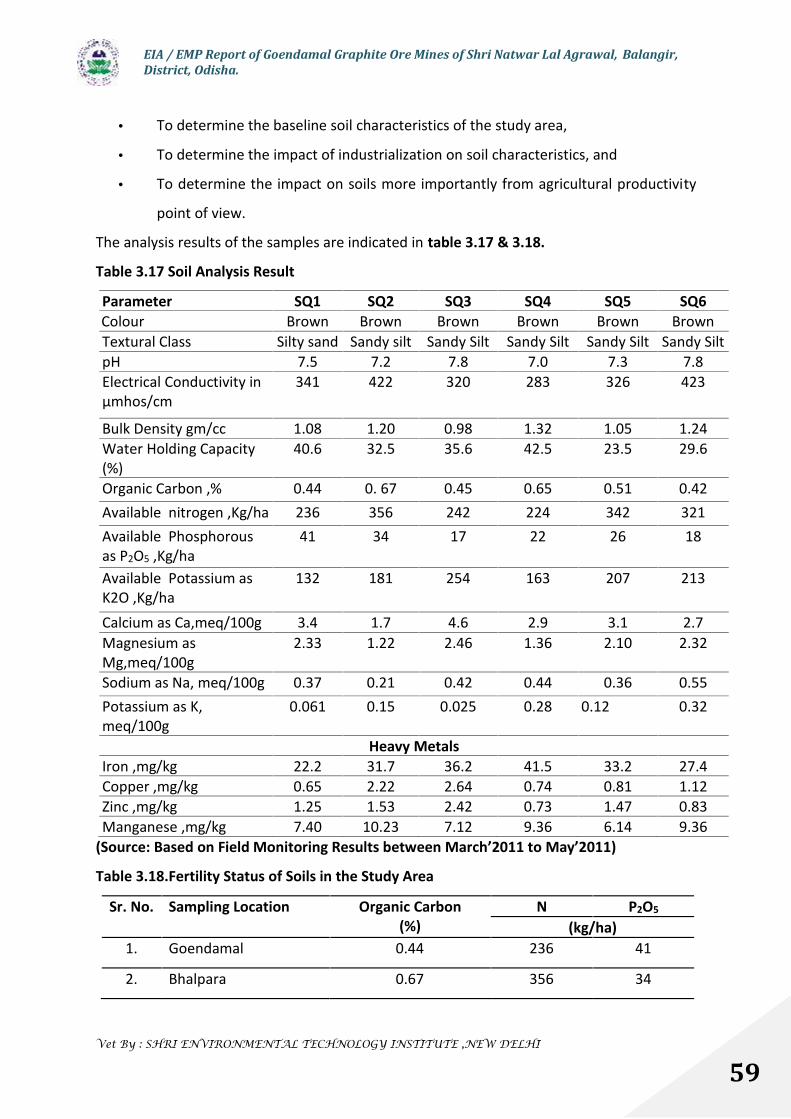
EIA / EMP Report of Goendamal Graphite Ore Mines of Shri Natwar Lal Agrawal, Balangir,District, Odisha.
Vet By : SHRI ENVIRONMENTAL TECHNOLOGY INSTITUTE ,NEW DELHI
59
To determine the baseline soil characteristics of the study area,
To determine the impact of industrialization on soil characteristics, and
To determine the impact on soils more importantly from agricultural productivity
point of view.
The analysis results of the samples are indicated in table 3.17 & 3.18.
Table 3.17 Soil Analysis Result
Parameter SQ1 SQ2 SQ3 SQ4 SQ5 SQ6Colour Brown Brown Brown Brown Brown BrownTextural Class Silty sand Sandy silt Sandy Silt Sandy Silt Sandy Silt Sandy SiltpH 7.5 7.2 7.8 7.0 7.3 7.8Electrical Conductivity inµmhos/cm
341 422 320 283 326 423
Bulk Density gm/cc 1.08 1.20 0.98 1.32 1.05 1.24Water Holding Capacity(%)
40.6 32.5 35.6 42.5 23.5 29.6
Organic Carbon ,% 0.44 0. 67 0.45 0.65 0.51 0.42Available nitrogen ,Kg/ha 236 356 242 224 342 321Available Phosphorousas P2O5 ,Kg/ha
41 34 17 22 26 18
Available Potassium asK2O ,Kg/ha
132 181 254 163 207 213
Calcium as Ca,meq/100g 3.4 1.7 4.6 2.9 3.1 2.7Magnesium asMg,meq/100g
2.33 1.22 2.46 1.36 2.10 2.32
Sodium as Na, meq/100g 0.37 0.21 0.42 0.44 0.36 0.55Potassium as K,meq/100g
0.061 0.15 0.025 0.28 0.12 0.32
Heavy MetalsIron ,mg/kg 22.2 31.7 36.2 41.5 33.2 27.4Copper ,mg/kg 0.65 2.22 2.64 0.74 0.81 1.12Zinc ,mg/kg 1.25 1.53 2.42 0.73 1.47 0.83Manganese ,mg/kg 7.40 10.23 7.12 9.36 6.14 9.36
(Source: Based on Field Monitoring Results between March’2011 to May’2011)
Table 3.18.Fertility Status of Soils in the Study Area
Sr. No. Sampling Location Organic Carbon(%)
N P2O5
(kg/ha)1. Goendamal 0.44 236 41
2. Bhalpara 0.67 356 34
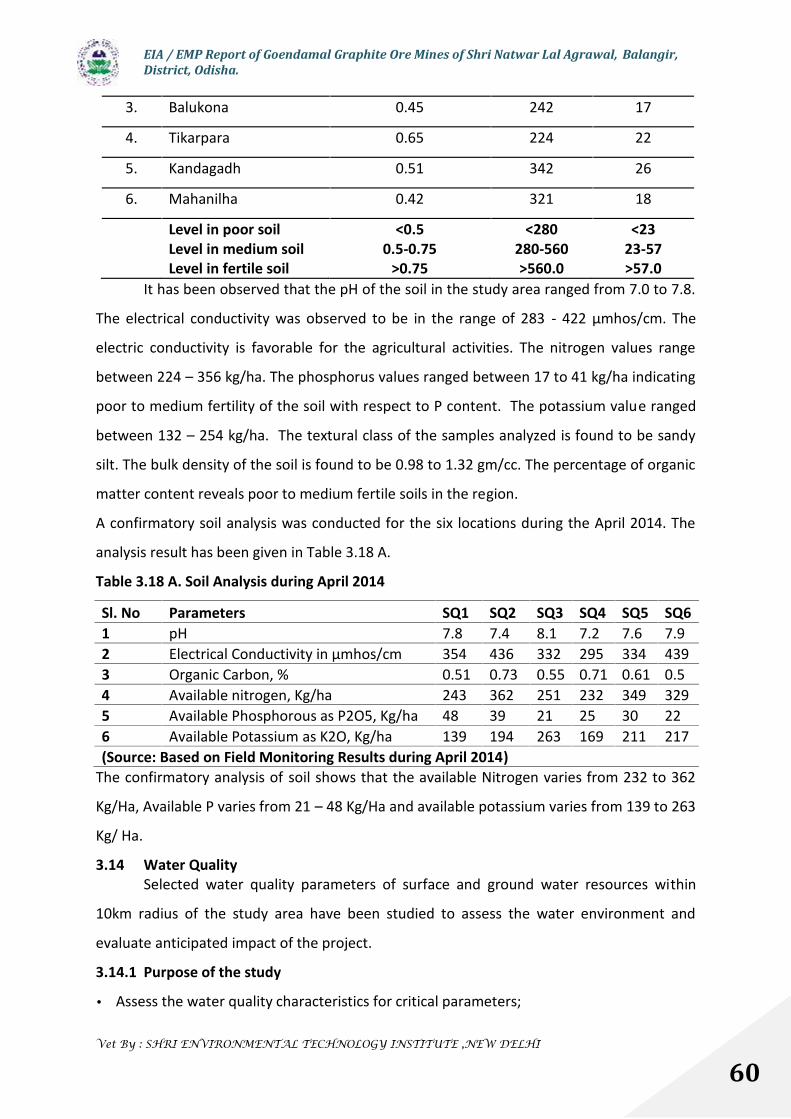
EIA / EMP Report of Goendamal Graphite Ore Mines of Shri Natwar Lal Agrawal, Balangir,District, Odisha.
Vet By : SHRI ENVIRONMENTAL TECHNOLOGY INSTITUTE ,NEW DELHI
60
3. Balukona 0.45 242 17
4. Tikarpara 0.65 224 22
5. Kandagadh 0.51 342 26
6. Mahanilha 0.42 321 18
Level in poor soilLevel in medium soilLevel in fertile soil
<0.50.5-0.75
>0.75
<280280-560>560.0
<2323-57>57.0
It has been observed that the pH of the soil in the study area ranged from 7.0 to 7.8.
The electrical conductivity was observed to be in the range of 283 - 422 µmhos/cm. The
electric conductivity is favorable for the agricultural activities. The nitrogen values range
between 224 – 356 kg/ha. The phosphorus values ranged between 17 to 41 kg/ha indicating
poor to medium fertility of the soil with respect to P content. The potassium value ranged
between 132 – 254 kg/ha. The textural class of the samples analyzed is found to be sandy
silt. The bulk density of the soil is found to be 0.98 to 1.32 gm/cc. The percentage of organic
matter content reveals poor to medium fertile soils in the region.
A confirmatory soil analysis was conducted for the six locations during the April 2014. The
analysis result has been given in Table 3.18 A.
Table 3.18 A. Soil Analysis during April 2014
Sl. No Parameters SQ1 SQ2 SQ3 SQ4 SQ5 SQ61 pH 7.8 7.4 8.1 7.2 7.6 7.92 Electrical Conductivity in µmhos/cm 354 436 332 295 334 4393 Organic Carbon, % 0.51 0.73 0.55 0.71 0.61 0.54 Available nitrogen, Kg/ha 243 362 251 232 349 3295 Available Phosphorous as P2O5, Kg/ha 48 39 21 25 30 226 Available Potassium as K2O, Kg/ha 139 194 263 169 211 217(Source: Based on Field Monitoring Results during April 2014)
The confirmatory analysis of soil shows that the available Nitrogen varies from 232 to 362
Kg/Ha, Available P varies from 21 – 48 Kg/Ha and available potassium varies from 139 to 263
Kg/ Ha.
3.14 Water QualitySelected water quality parameters of surface and ground water resources within
10km radius of the study area have been studied to assess the water environment and
evaluate anticipated impact of the project.
3.14.1 Purpose of the study
Assess the water quality characteristics for critical parameters;
EIA / EMP Report of Goendamal Graphite Ore Mines of Shri Natwar Lal Agrawal, Balangir,District, Odisha.
Vet By : SHRI ENVIRONMENTAL TECHNOLOGY INSTITUTE ,NEW DELHI
61
Evaluate the impacts on agricultural productivity, habitat conditions, recreational
resources and aesthetics in the vicinity; and
Predict impact on water quality by this project and related activities.
The information required has been collected through primary surveys and secondary
sources.
3.14.2 Method of SamplingReconnaissance survey was undertaken and monitoring locations were finalized based on:
Drainage pattern;
Location of residential areas representing different activities /likely impact areas
Likely areas, which can represent baseline conditions.
Four ground water and four surface water sources covering 10km radial distance
from the mine site were examined for physico-chemical, heavy metals and bacteriological
parameters in order to assess the effect of mining and other activities on surface and
ground water. The sampling locations for ground and surface water have been given in
figure 3.10 and table 3.19. The samples were analyzed as per IS code No.3025, 2296 &
APHA.
Samples for chemical analysis were collected in polyethylene carboys. Samples
collected for metal content were acidified with 1 ml HNO3. Samples for bacteriological
analysis were collected in sterilized glass bottles. Selected physico-chemical and
bacteriological parameters have been analyzed for projecting the existing water quality
status in the study area. Parameters like temperature, dissolved oxygen (DO) and pH were
analysed on spot at the time of sample collection.
The results of the water quality monitored during the study period are given in table
3.20 & 3.21.
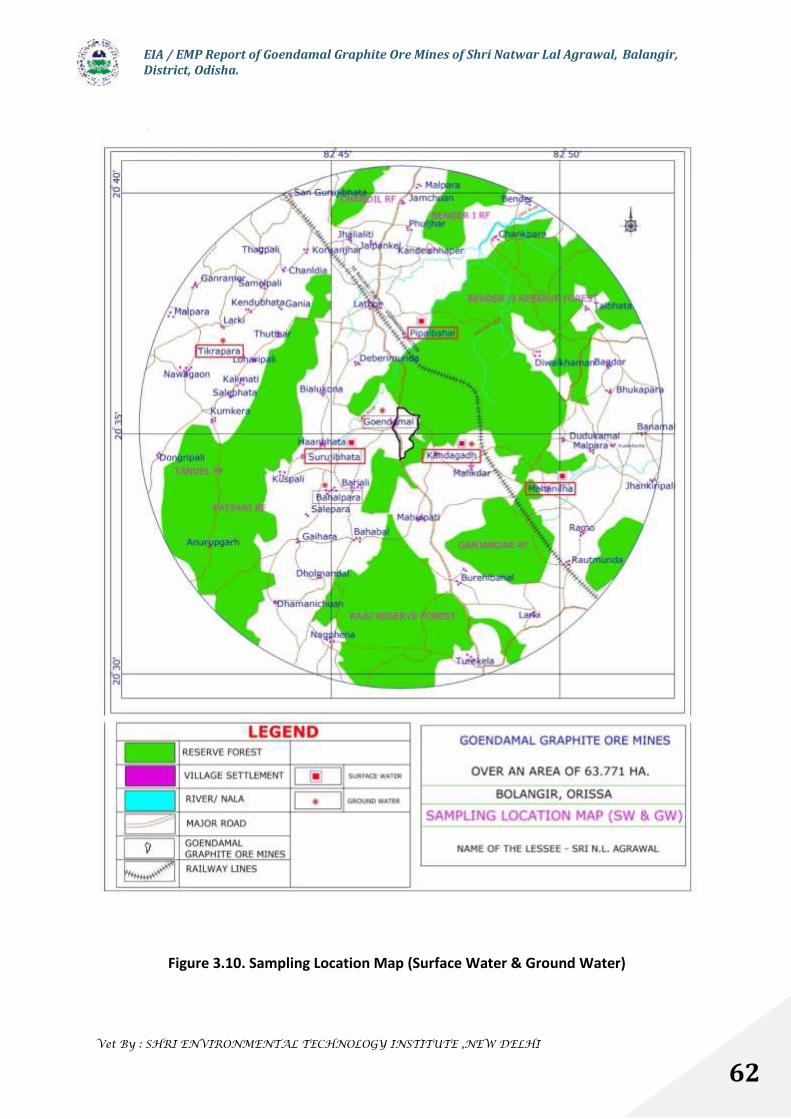
EIA / EMP Report of Goendamal Graphite Ore Mines of Shri Natwar Lal Agrawal, Balangir,District, Odisha.
Vet By : SHRI ENVIRONMENTAL TECHNOLOGY INSTITUTE ,NEW DELHI
62
Figure 3.10. Sampling Location Map (Surface Water & Ground Water)
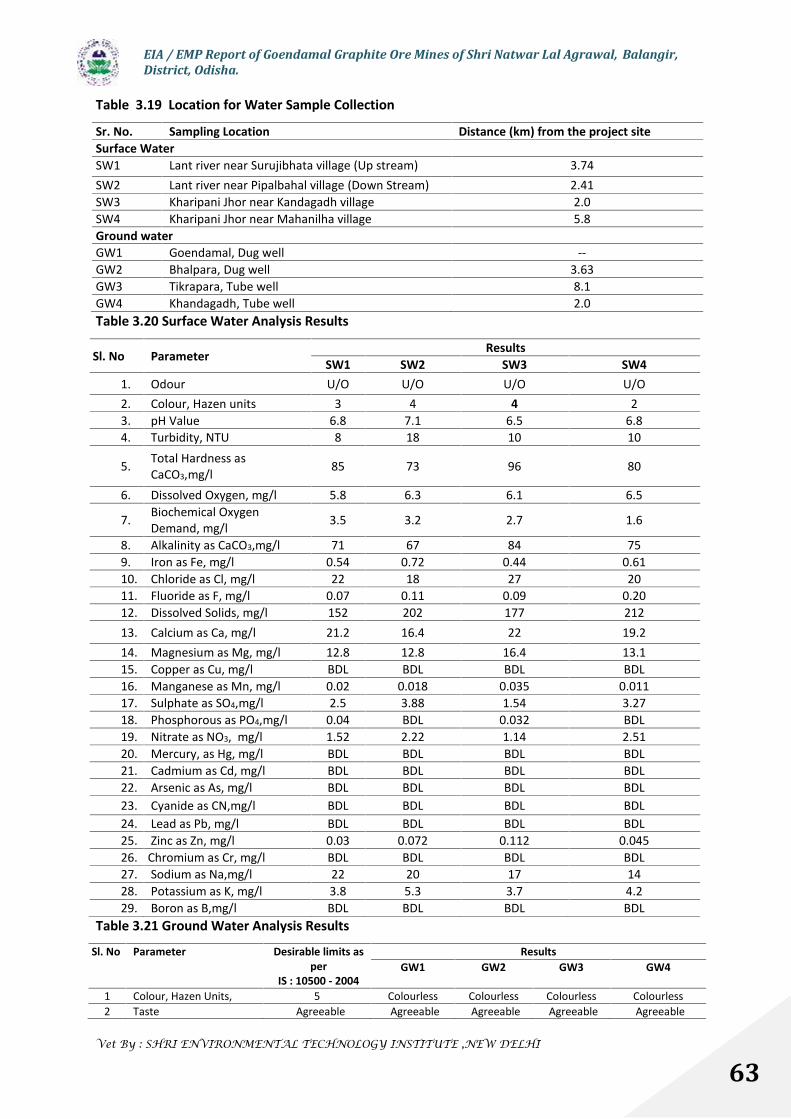
EIA / EMP Report of Goendamal Graphite Ore Mines of Shri Natwar Lal Agrawal, Balangir,District, Odisha.
Vet By : SHRI ENVIRONMENTAL TECHNOLOGY INSTITUTE ,NEW DELHI
63
Table 3.19 Location for Water Sample Collection
Sr. No. Sampling Location Distance (km) from the project siteSurface WaterSW1 Lant river near Surujibhata village (Up stream) 3.74SW2 Lant river near Pipalbahal village (Down Stream) 2.41SW3 Kharipani Jhor near Kandagadh village 2.0SW4 Kharipani Jhor near Mahanilha village 5.8Ground waterGW1 Goendamal, Dug well --GW2 Bhalpara, Dug well 3.63GW3 Tikrapara, Tube well 8.1GW4 Khandagadh, Tube well 2.0Table 3.20 Surface Water Analysis Results
Sl. No ParameterResults
SW1 SW2 SW3 SW41. Odour U/O U/O U/O U/O2. Colour, Hazen units 3 4 4 23. pH Value 6.8 7.1 6.5 6.84. Turbidity, NTU 8 18 10 10
5. Total Hardness asCaCO3,mg/l 85 73 96 80
6. Dissolved Oxygen, mg/l 5.8 6.3 6.1 6.5
7. Biochemical OxygenDemand, mg/l 3.5 3.2 2.7 1.6
8. Alkalinity as CaCO3,mg/l 71 67 84 759. Iron as Fe, mg/l 0.54 0.72 0.44 0.6110. Chloride as Cl, mg/l 22 18 27 2011. Fluoride as F, mg/l 0.07 0.11 0.09 0.2012. Dissolved Solids, mg/l 152 202 177 21213. Calcium as Ca, mg/l 21.2 16.4 22 19.214. Magnesium as Mg, mg/l 12.8 12.8 16.4 13.115. Copper as Cu, mg/l BDL BDL BDL BDL16. Manganese as Mn, mg/l 0.02 0.018 0.035 0.01117. Sulphate as SO4,mg/l 2.5 3.88 1.54 3.2718. Phosphorous as PO4,mg/l 0.04 BDL 0.032 BDL19. Nitrate as NO3, mg/l 1.52 2.22 1.14 2.5120. Mercury, as Hg, mg/l BDL BDL BDL BDL21. Cadmium as Cd, mg/l BDL BDL BDL BDL22. Arsenic as As, mg/l BDL BDL BDL BDL23. Cyanide as CN,mg/l BDL BDL BDL BDL24. Lead as Pb, mg/l BDL BDL BDL BDL25. Zinc as Zn, mg/l 0.03 0.072 0.112 0.04526. Chromium as Cr, mg/l BDL BDL BDL BDL27. Sodium as Na,mg/l 22 20 17 1428. Potassium as K, mg/l 3.8 5.3 3.7 4.229. Boron as B,mg/l BDL BDL BDL BDL
Table 3.21 Ground Water Analysis Results
Sl. No Parameter Desirable limits asper
IS : 10500 - 2004
ResultsGW1 GW2 GW3 GW4
1 Colour, Hazen Units, 5 Colourless Colourless Colourless Colourless2 Taste Agreeable Agreeable Agreeable Agreeable Agreeable
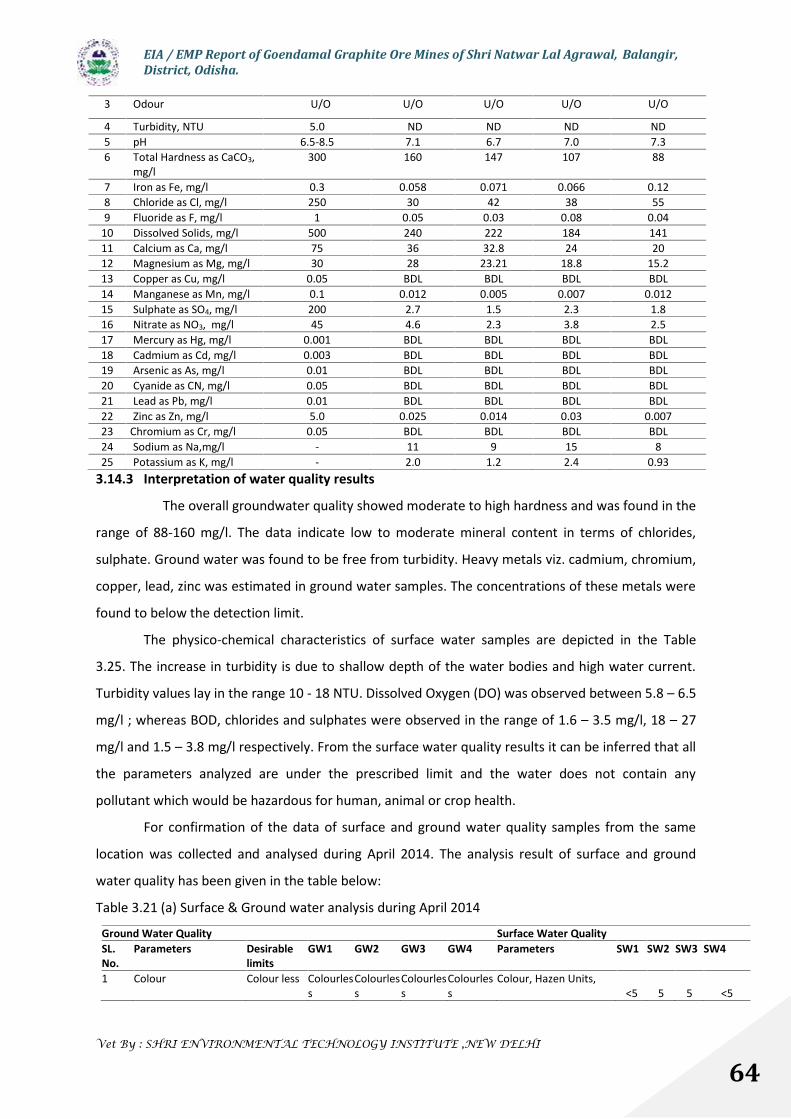
EIA / EMP Report of Goendamal Graphite Ore Mines of Shri Natwar Lal Agrawal, Balangir,District, Odisha.
Vet By : SHRI ENVIRONMENTAL TECHNOLOGY INSTITUTE ,NEW DELHI
64
3 Odour U/O U/O U/O U/O U/O
4 Turbidity, NTU 5.0 ND ND ND ND5 pH 6.5-8.5 7.1 6.7 7.0 7.36 Total Hardness as CaCO3,
mg/l300 160 147 107 88
7 Iron as Fe, mg/l 0.3 0.058 0.071 0.066 0.128 Chloride as Cl, mg/l 250 30 42 38 559 Fluoride as F, mg/l 1 0.05 0.03 0.08 0.04
10 Dissolved Solids, mg/l 500 240 222 184 14111 Calcium as Ca, mg/l 75 36 32.8 24 2012 Magnesium as Mg, mg/l 30 28 23.21 18.8 15.213 Copper as Cu, mg/l 0.05 BDL BDL BDL BDL14 Manganese as Mn, mg/l 0.1 0.012 0.005 0.007 0.01215 Sulphate as SO4, mg/l 200 2.7 1.5 2.3 1.816 Nitrate as NO3, mg/l 45 4.6 2.3 3.8 2.517 Mercury as Hg, mg/l 0.001 BDL BDL BDL BDL18 Cadmium as Cd, mg/l 0.003 BDL BDL BDL BDL19 Arsenic as As, mg/l 0.01 BDL BDL BDL BDL20 Cyanide as CN, mg/l 0.05 BDL BDL BDL BDL21 Lead as Pb, mg/l 0.01 BDL BDL BDL BDL22 Zinc as Zn, mg/l 5.0 0.025 0.014 0.03 0.00723 Chromium as Cr, mg/l 0.05 BDL BDL BDL BDL24 Sodium as Na,mg/l - 11 9 15 825 Potassium as K, mg/l - 2.0 1.2 2.4 0.93
3.14.3 Interpretation of water quality results
The overall groundwater quality showed moderate to high hardness and was found in the
range of 88-160 mg/l. The data indicate low to moderate mineral content in terms of chlorides,
sulphate. Ground water was found to be free from turbidity. Heavy metals viz. cadmium, chromium,
copper, lead, zinc was estimated in ground water samples. The concentrations of these metals were
found to below the detection limit.
The physico-chemical characteristics of surface water samples are depicted in the Table
3.25. The increase in turbidity is due to shallow depth of the water bodies and high water current.
Turbidity values lay in the range 10 - 18 NTU. Dissolved Oxygen (DO) was observed between 5.8 – 6.5
mg/l ; whereas BOD, chlorides and sulphates were observed in the range of 1.6 – 3.5 mg/l, 18 – 27
mg/l and 1.5 – 3.8 mg/l respectively. From the surface water quality results it can be inferred that all
the parameters analyzed are under the prescribed limit and the water does not contain any
pollutant which would be hazardous for human, animal or crop health.
For confirmation of the data of surface and ground water quality samples from the same
location was collected and analysed during April 2014. The analysis result of surface and ground
water quality has been given in the table below:
Table 3.21 (a) Surface & Ground water analysis during April 2014
Ground Water Quality Surface Water QualitySL.No.
Parameters Desirablelimits
GW1 GW2 GW3 GW4 Parameters SW1 SW2 SW3 SW4
1 Colour Colour less Colourless
Colourless
Colourless
Colourless
Colour, Hazen Units,<5 5 5 <5

EIA / EMP Report of Goendamal Graphite Ore Mines of Shri Natwar Lal Agrawal, Balangir,District, Odisha.
Vet By : SHRI ENVIRONMENTAL TECHNOLOGY INSTITUTE ,NEW DELHI
65
2 Taste Agreeable Agreeable
Agreeable
Agreeable
Agreeable
Odour Agreeable
Agreeable
Agreeable
Agreeable
3 Odour U/O U/O U/O U/O U/O Turbidity, NTU 10 22 12 154 Turbidity,NTU 5.0 BDL BDL BDL BDL pH
7.2 7.1 6.8 7.15 pH 6.5-8.5 7.3 7.2 7.4 7.6 Total Hardness (as
CaCO3) mg/l 96 84 108 926 Total hardness (as
CaCO3), mg/l300 168 148 112 100 Dissolved Oxygen, mg/l
6.2 7.6 7.2 7.87 Iron (as Fe), mg/l 0.3 0.08 0.09 0.14 0.18 BOD, mg/l 4.2 3.8 3.2 2.48 Chloride (as Cl), mg/l 250 34 50 42 60 Alkalinity (as CaCO3 ),
mg/l 76 72 92 809 Dissolved Solids mg/l 500 280 240 200 164 Iron (as Fe), mg/l
0.62 0.78 0.52 0.7210 Calcium (as Ca), mg/l 75 42 36 30 26 Chloride (as Cl), mg/l
24 20 30 2211 Magnesium (as Mg),
mg/l30 32 28 22 20 Dissolved Solids, mg/l
164 220 196 24012 Sulphate (as SO4), mg/l200 3.2 1.9 3.8 2.2 Calcium (as Ca), mg/l
22.6 17.2 24 20.613 Nitrate (as NO3) mg/l 45 5.2 3.4 4.2 3.6 Magnesium(as Mg),
mg/l 13.2 13.8 17.8 14.214 Lead (as Pb), mg/l 0.01 BDL BDL BDL BDL Sulphate (as SO4), mg/l
3.2 4.1 1.82 3.6815 Chromium (as Cr),
mg/l0.05 BDL BDL BDL BDL Phosphorous as PO4
mg/l 0.06BDL
0.041BDL
16 Sodium as Na, mg/l 16 12 18 10 Nitrate (as NO3) , mg/l 1.84 2.64 1.23 2.8517 Potassium as K, mg/l 3.2 1.8 3.8 1.2 Lead (as Pb), mg/l BDL BDL BDL BDL
18 -- -- -- -- -- -- Chromium (as Cr), mg/l BDL BDL BDL BDL
19 -- -- -- -- -- -- Sodium as Na, mg/l 28 24 20 1820 -- -- -- -- -- -- Potassium as K, mg/l 4.2 5.9 4.1 4.8
Water Analysis conducted during April 2014
3.15 Noise LevelEvaluation of present status of noise level in the core zone & buffer zone was done on hourly
basis for a continuous period of 24 hrs during the season. Another confirmatory noise monitoring
was conducted during April 2014.
For measurement of ambient noise level, a Digital Sound Level Meter was used. The meter
was calibrated with a standard Acoustic Calibrator before using in the field. The measurements were
carried out continuously for the 24-hour period with one hour interval starting at 00.30 hrs to 00.30
hrs next day to obtain hourly equivalent sound pressure level, 1 hour Leq. From these values, day
and night time as well as 24-hour Leq values were also calculated. The Leq is the equivalent
continuous sound level, which is equivalent to the same sound energy as the fluctuating sound
measured in the same period.
The noise levels were monitored on working days only. The stations for monitoring of noise
level have been given in figure 3.11. The results have been presented as minimum, maximum and
average value in table 3.22.

EIA / EMP Report of Goendamal Graphite Ore Mines of Shri Natwar Lal Agrawal, Balangir,District, Odisha.
Vet By : SHRI ENVIRONMENTAL TECHNOLOGY INSTITUTE ,NEW DELHI
66
Figure 3.11. Sampling Location Map (Noise & Soil)

EIA / EMP Report of Goendamal Graphite Ore Mines of Shri Natwar Lal Agrawal, Balangir,District, Odisha.
Vet By : SHRI ENVIRONMENTAL TECHNOLOGY INSTITUTE ,NEW DELHI
67
Table3.22. Noise Level Monitoring Data of the Study Region (in dBA)
Noise Monitroing result during March to May2011
Noise Monitroing result during April 2014
S. No Location Avg. Daynoise level
(Leq in dBA)
Avg. Nightnoise level (Leq
in dBA
Avg. Day noise level(Leq in dBA)
Avg. Night noise level(Leq in dBA
1 Project Site 43 35 42 392 Bhalpara 42 40 39 353 Pipalbahal 38 35 42 394 Kandagadh 45 37 40 35
Standard as perNoise Rule, 2000
55 45 55 45
3.16 Ecological Pattern
About 24% of the geographical area in the district is covered under forest area. The forest
can be classified under the following five categories.
i) Sal Forest: Sal (Shorea robusta) found in patches at regular flat plains with soil type sandy
loam and loamy sand type. The associates of Sal are Bija (Pterocarpus marsupium), Sahaj
(Terminalia termontosa), Mahua (Madhuca indica), Dhaura (Anogeissus latifolia) In the
middle storey there are Char (Buchania lanzam), Kendu (Diospyros melanxaylon, Harida
(Terminalia chebula), Anla (Phyllanthus emblica), Dhaman (Grewia latiflora), Senha
(Lagerstroemia parviflora), Khair (Accacia catechu),Sunari (Cassia fistula), Bamboo (Bambsa
arundinacea), Dhasuli (Woodfordia floribunda), Nil (Indigofera tinotoria).
ii) Low mixed forest – It grows in mixed patches with Sal forest, generally occupying the
poor soil. The common species are Sahaj, Dhaura, Kendu, Sisoo, Harida, Mahua, Char,
Rohan, Sal, Khair and Chantoo.
iii) Alluvial Mixed Forest – This type is confined primarily to the nallahs and on the flat
ground. The commonest species are Sahaj, Karla (Gleistanthus cooliums), Behera Mundi
(Mitragyna parvifolia), Pandhel (Pterospemum suaveolens), Simul (Bombax malabaricum),
Sisoo (Dalbergia Sisoo).
iv) Teak Forest – Teak is found in the Bolangir – Sonepur border areas. The most important
in this sub type is Teak with a number of miscellaneous species.
v) Bamboo forest in Bolangir – it is found in the valleys and slopes. Different varieties of
bamboo trees used to be there. The forest type of the study area comes under Low mixed
forest. The Reserve Forests in 10km radius of the ML area is given in the table 3.23.
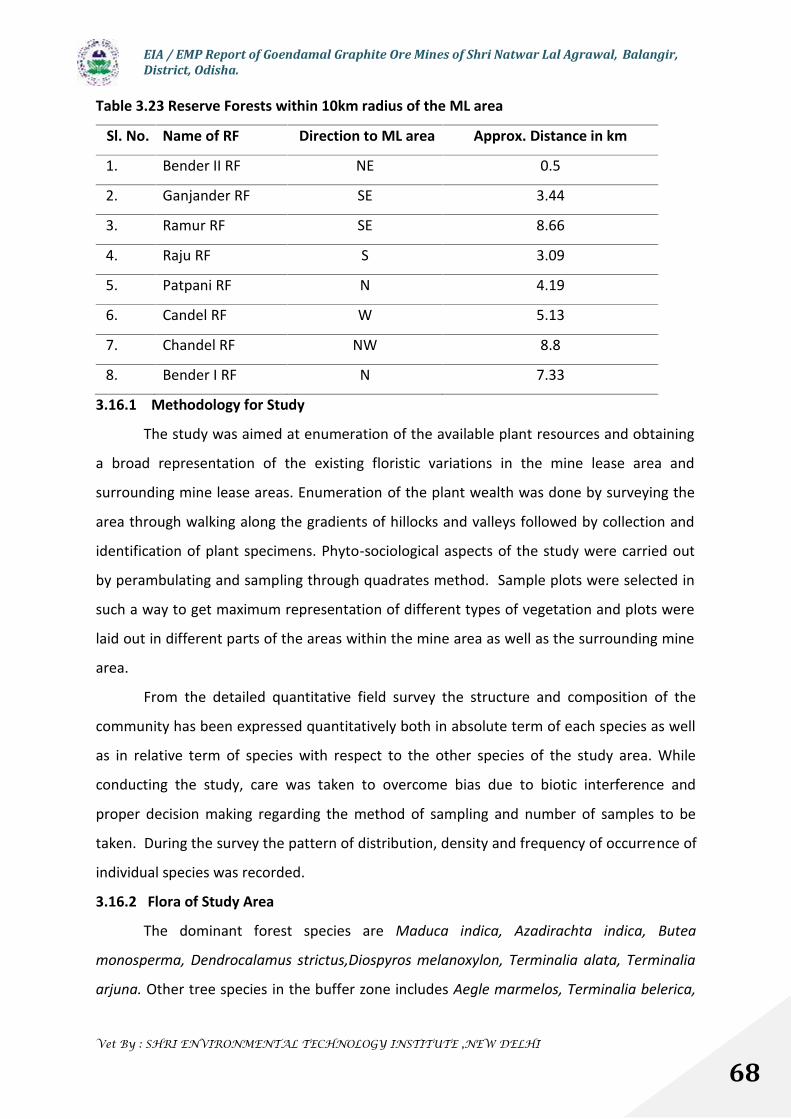
EIA / EMP Report of Goendamal Graphite Ore Mines of Shri Natwar Lal Agrawal, Balangir,District, Odisha.
Vet By : SHRI ENVIRONMENTAL TECHNOLOGY INSTITUTE ,NEW DELHI
68
Table 3.23 Reserve Forests within 10km radius of the ML area
Sl. No. Name of RF Direction to ML area Approx. Distance in km
1. Bender II RF NE 0.5
2. Ganjander RF SE 3.44
3. Ramur RF SE 8.66
4. Raju RF S 3.09
5. Patpani RF N 4.19
6. Candel RF W 5.13
7. Chandel RF NW 8.8
8. Bender I RF N 7.33
3.16.1 Methodology for Study
The study was aimed at enumeration of the available plant resources and obtaining
a broad representation of the existing floristic variations in the mine lease area and
surrounding mine lease areas. Enumeration of the plant wealth was done by surveying the
area through walking along the gradients of hillocks and valleys followed by collection and
identification of plant specimens. Phyto-sociological aspects of the study were carried out
by perambulating and sampling through quadrates method. Sample plots were selected in
such a way to get maximum representation of different types of vegetation and plots were
laid out in different parts of the areas within the mine area as well as the surrounding mine
area.
From the detailed quantitative field survey the structure and composition of the
community has been expressed quantitatively both in absolute term of each species as well
as in relative term of species with respect to the other species of the study area. While
conducting the study, care was taken to overcome bias due to biotic interference and
proper decision making regarding the method of sampling and number of samples to be
taken. During the survey the pattern of distribution, density and frequency of occurrence of
individual species was recorded.
3.16.2 Flora of Study Area
The dominant forest species are Maduca indica, Azadirachta indica, Butea
monosperma, Dendrocalamus strictus,Diospyros melanoxylon, Terminalia alata, Terminalia
arjuna. Other tree species in the buffer zone includes Aegle marmelos, Terminalia belerica,
EIA / EMP Report of Goendamal Graphite Ore Mines of Shri Natwar Lal Agrawal, Balangir,District, Odisha.
Vet By : SHRI ENVIRONMENTAL TECHNOLOGY INSTITUTE ,NEW DELHI
69
Terminalia chebual, Lagerostromea parviflora, Dalbergia sisoo, Schelerecheria oleosa, Cassia
siamea, Gardenia latifolia, Borassus flabelife, Phoenix dactylifera, HShorea robusta,
Syzyzium cumini, Tamarindus indica, Schleichera oleosa, Acacia nilotica, Emblica officinalis,
Ficus benghalensis, Ficus religiosa . The dominant shrubs are Jatropha gossypifolia, Ipomea
tropica, Lantena camara, Vitex nigundo, Woodfordia fruticosa, Cleistanthus collinus,
Euphorbia neriifolia, Opuntia stricta and climbers of the area includes Hemidesmus indicus,
Asparagus racemosus,Tylophora indica, Cuscuta reflexa, Caesalpinia bonduc, Cissampelos
pareira, Dioscorea bulbifera, Tinospora cordifolia. The common herb species of the locality
are Cynodon dactylon, Chrysopogon aciculatus, Elephantpus scaber, Evolvulus nummularius,
Evolvulus alsinoides, Heliotropium indicum, Tridax procumbens, Curculigo orchioides,
Martynia annua, Oldenlandia corymbosa, Sida acuta, Solanum nigrum, Costus speciosus,
Commelina benghalensis .
3.16.3 Medicinal plants:
The medicinal flora of the area includes Aegle marmelos, Bombax ceiba, Terminalia
chebula, Terminali bellirica, Emblica officinalis, Terminalia arjuna, Schleichera oleosa,
Asparagus racemosus, Hemidesmus indicus, Phyllanthus amarus, Tinospora cordifolia,
Azadirachta indica, Butea monosperma, Achyranthes aspera, Vitex nigundo, Nyctanthes
arbor – tristis, Elephantapus scaber, Cyperus rotundus, Celastrus paniculata.
3.16.4 Social Forestry:
The plantation has been done in the village waste lands, road side and non forest
areas. The major species under social forestry includes Teak (Tectona grandis), Jamun
(Syzyzium cuminii), Neem (Azadirachta indica), Babool (Acacia nilotica), Chankunda (Cassia
siamea), Tentuli (Tamarindus indica). The plantation species generally found near the village
sites includes Ata (Annona reticulate), Pijuli (Psidium guajava), Mango (Mangifera indica),
Panas (Artocarpus heterophylus), Amla (Phylanthus emblica), Papaya (Carica papaya), Sajana
(Moringa oleifera), Bara (Ficus benghalensis), Osta (Ficus religiosa). The garden species near
the villages include Nerium oliender, Taburna Montana, Punica granatum, Jasminum
sambac, Lawsonia innermis.
The details of the floral composition of the core zone and buffer zone has been given
in Annexure 4.
EIA / EMP Report of Goendamal Graphite Ore Mines of Shri Natwar Lal Agrawal, Balangir,District, Odisha.
Vet By : SHRI ENVIRONMENTAL TECHNOLOGY INSTITUTE ,NEW DELHI
70
3.16.5 Economically Important Flora of the study area
a. Agricultural Crops
Paddy was the main crop grown during monsoon season. But with the growing
demand of cotton the paddy cultivation has been shifted to cotton cultivation in most of
the area. Mostly cultivation is rain fed with very less irrigation facility. Apart from the
paddy and cotton, there is the cultivation of sugar cane, Maize, Ground nut, Black gram,
green gram in the area. Vegetable farming is being practiced as backyard cultivation. This
includes cauliflower, lady’s finger, Cucurbits, brinjal, tomato. Vegetable cultivation in large
scale is not been practiced due to lower rain fall and less irrigation facility. Photograph
showing agriculture of the area has been shown in Plate 1.
b. Minor Forest Produces:
Most of the people depend on the forest produces for their livelihood. About 30% of the
livelihood in the locality depend on collection and marketing of Mahua (Madhuca indica)
flower. Apart from the mahua flower other forest produces includes Mahua seed, Sal
leaves, and seeds, Kendu (Diospyros melanoxylon)leaves, Char (Buchnania lanzam) seeds,
fire wood, Kusuma (Schelechera oleosa) seeds, mushrooms during rainy season, Arrow
root, broom sticks.
c. Rare and Endangered Floral Species
Floristic survey of both core and buffer zones of the leasehold area did not
encounter any such species, which can be considered to be critically endangered,
endangered or threatened under the IUCN (International Union for Conservation of Nature
and Natural resources) guidelines.
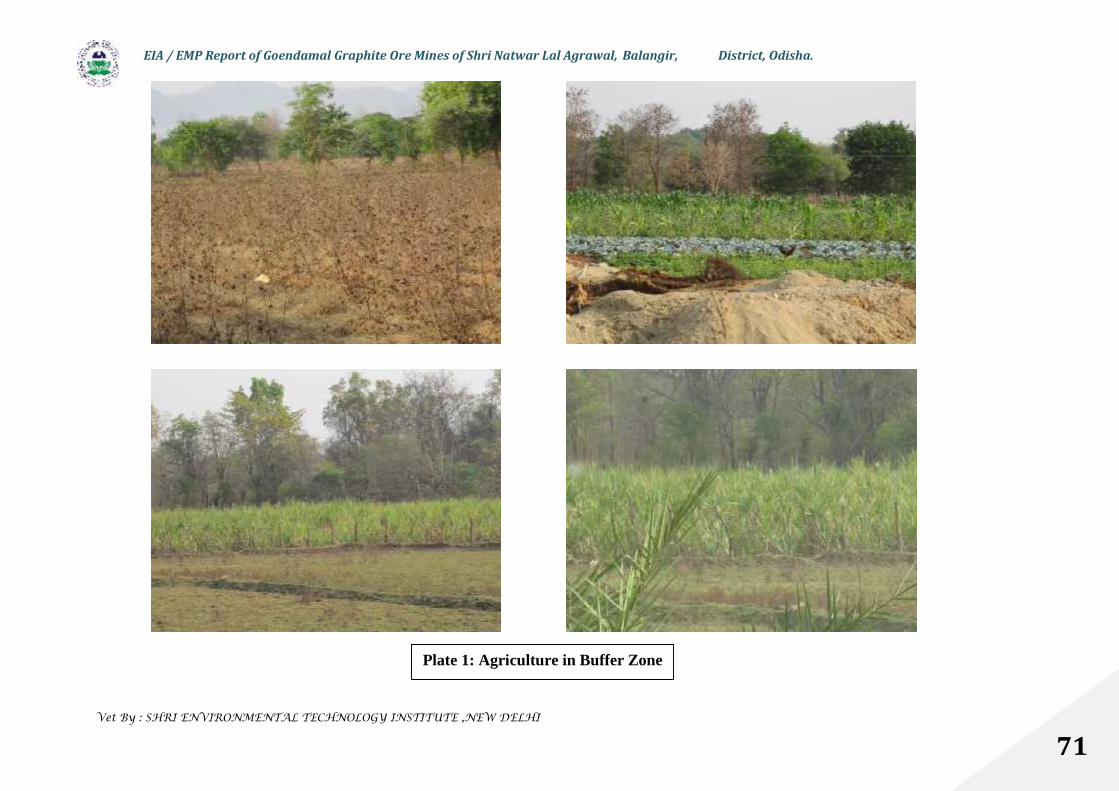
EIA / EMP Report of Goendamal Graphite Ore Mines of Shri Natwar Lal Agrawal, Balangir, District, Odisha.
Vet By : SHRI ENVIRONMENTAL TECHNOLOGY INSTITUTE ,NEW DELHI
71
Plate 1: Agriculture in Buffer Zone
EIA / EMP Report of Goendamal Graphite Ore Mines of Shri Natwar Lal Agrawal, Balangir,District, Odisha.
Vet By : SHRI ENVIRONMENTAL TECHNOLOGY INSTITUTE ,NEW DELHI
72
3.16.6 Faunal Diversity in the Study Area
To prepare a detailed report on the status of wildlife biodiversity in 10 km radial area
(Study Area) around the project site to assess the impacts due to mining activity and evolve
suitable mitigation measures to protect and conserve wildlife biodiversity, following
components were studied:
a) Wildlife survey (diversity)
b) Migratory paths of major wildlife species
c) Distribution of birds
d) Rare & Endangered species of fauna
e) Specific local characteristics of biodiversity in study area
The mammalian species those are reported in the forest areas in the buffer zone
includes Common mongoose, Squirrel, Jackle, Indian fox, Hare, Monkey, Mouse. The common
avifauna of the area are Jungle Crow, sparrow, King fisher,Small Green Bee-eater, House
crow,Indian Myna. The faunal composition of the study area has been given in Annexure 5.
3.16.7 Aquatic Ecology of the Study area
Major component of the aquatic life under study area are listed below:
Aquatic macrophytic vegetation
Phytoplankton & Zooplankton
Benthic fauna
Aquatic vertebrates like fish, Amphibians.
To assess the planktonic profile (Phytoplankton & Zooplankton) perennial nallaha, two
water samples, one in the up stream and one in the down stream were collected at the sub
surface level. The aquatic ecological study was conducted in different water bodies of the study
area and the flora and fauna was recorded.
a. Phytoplankton:
Bacillariophyceae
Asterionella sp., Cymbella sp., Diatoma sp., Melosira sp., Naviclula sp., Nitzschia
sp.,Pinnularia sp.,
Chlorophyceae

EIA / EMP Report of Goendamal Graphite Ore Mines of Shri Natwar Lal Agrawal, Balangir,District, Odisha.
Vet By : SHRI ENVIRONMENTAL TECHNOLOGY INSTITUTE ,NEW DELHI
73
Actinastrum sp., Ankistrodesmus sp., Chlorella sp., Chlorococcum sp., Cosmarium sp. ,
Closterium sp., Pediastrum simplex, Straurastrum sp., Scenedesmus sp., Sirocladium
vandalurensis, Zygnema sp.
Cyanophyceae
Phormidium sp.
3.16.8 Aquatic Fauna
a. Copepoda
Nauplius sp., Oithona nana, Acartia spinata ,Miracia efferata, Harpacticoid sp., Diaptomus,Cyclopusb. Cladocera
Penilia avirostris, Evadna tergestina, Daphnia sp., Ceriodephnia, Alonellac. RotiferaBrachionus, Keratella, Mytilina
B. Aquatic Fish Fauna
Among all the aquatic life in the study area the fish fauna occupies an important place.
The fish fauna of the area includes:
Major carps includes Catla, Rahu, Mirgai, Calcasu, Exotic carps includes Silver carp, Grass carp,
Minor carps, Murrels, Hiisa, Cat fish, Prawn, Mish fish.
The checklist of the environmental studies carried out in the project area has been given
in the following table 3.24. Location of ecological sensitive areas and their distance from buffer
zone of ML area has been given in figure 3.12.
Table 3.24. Checklist of Ecological Field Study
Sl. No Ecological Study List Present/ Absent
1. Trees Present
2. Herbs Present
3. Shrubs Present
4. Grasses Present
5. Bushes Present
6. Climbers Present
7. Lichens Present
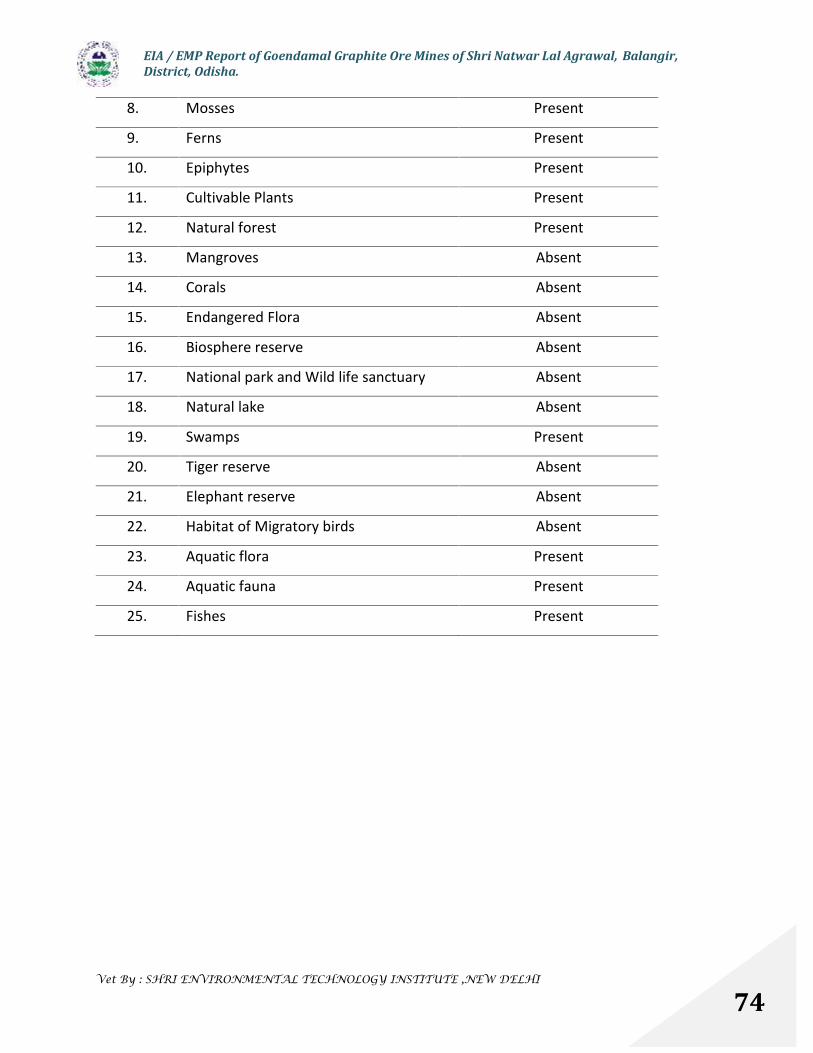
EIA / EMP Report of Goendamal Graphite Ore Mines of Shri Natwar Lal Agrawal, Balangir,District, Odisha.
Vet By : SHRI ENVIRONMENTAL TECHNOLOGY INSTITUTE ,NEW DELHI
74
8. Mosses Present
9. Ferns Present
10. Epiphytes Present
11. Cultivable Plants Present
12. Natural forest Present
13. Mangroves Absent
14. Corals Absent
15. Endangered Flora Absent
16. Biosphere reserve Absent
17. National park and Wild life sanctuary Absent
18. Natural lake Absent
19. Swamps Present
20. Tiger reserve Absent
21. Elephant reserve Absent
22. Habitat of Migratory birds Absent
23. Aquatic flora Present
24. Aquatic fauna Present
25. Fishes Present

EIA / EMP Report of Goendamal Graphite Ore Mines of Shri Natwar Lal Agrawal, Balangir,District, Odisha.
Vet By : SHRI ENVIRONMENTAL TECHNOLOGY INSTITUTE ,NEW DELHI
75
Figure 3.12. Map Showing Ecological sensitive areas of Odisha
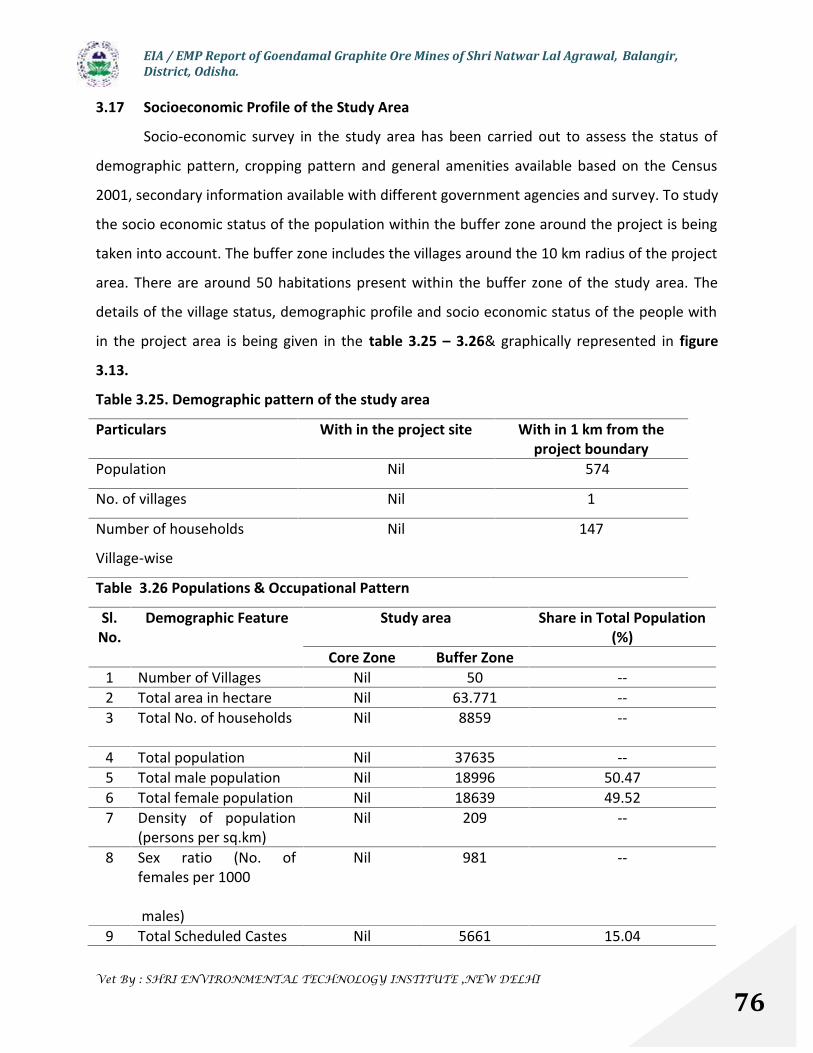
EIA / EMP Report of Goendamal Graphite Ore Mines of Shri Natwar Lal Agrawal, Balangir,District, Odisha.
Vet By : SHRI ENVIRONMENTAL TECHNOLOGY INSTITUTE ,NEW DELHI
76
3.17 Socioeconomic Profile of the Study Area
Socio-economic survey in the study area has been carried out to assess the status of
demographic pattern, cropping pattern and general amenities available based on the Census
2001, secondary information available with different government agencies and survey. To study
the socio economic status of the population within the buffer zone around the project is being
taken into account. The buffer zone includes the villages around the 10 km radius of the project
area. There are around 50 habitations present within the buffer zone of the study area. The
details of the village status, demographic profile and socio economic status of the people with
in the project area is being given in the table 3.25 – 3.26& graphically represented in figure
3.13.
Table 3.25. Demographic pattern of the study area
Particulars With in the project site With in 1 km from theproject boundary
Population Nil 574
No. of villages Nil 1
Number of households
Village-wise
Nil 147
Table 3.26 Populations & Occupational Pattern
Sl.No.
Demographic Feature Study area Share in Total Population(%)
Core Zone Buffer Zone1 Number of Villages Nil 50 --2 Total area in hectare Nil 63.771 --3 Total No. of households Nil 8859 --
4 Total population Nil 37635 --5 Total male population Nil 18996 50.476 Total female population Nil 18639 49.527 Density of population
(persons per sq.km)Nil 209 --
8 Sex ratio (No. offemales per 1000
males)
Nil 981 --
9 Total Scheduled Castes Nil 5661 15.04
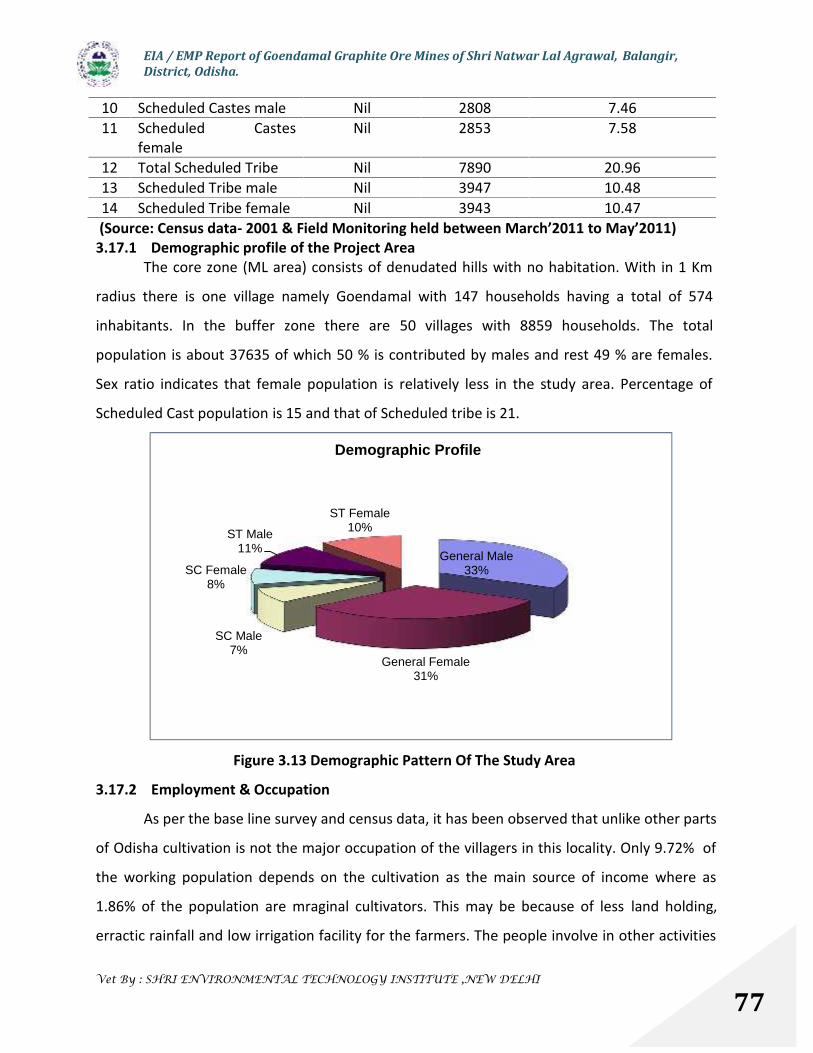
EIA / EMP Report of Goendamal Graphite Ore Mines of Shri Natwar Lal Agrawal, Balangir,District, Odisha.
Vet By : SHRI ENVIRONMENTAL TECHNOLOGY INSTITUTE ,NEW DELHI
77
10 Scheduled Castes male Nil 2808 7.4611 Scheduled Castes
femaleNil 2853 7.58
12 Total Scheduled Tribe Nil 7890 20.9613 Scheduled Tribe male Nil 3947 10.4814 Scheduled Tribe female Nil 3943 10.47(Source: Census data- 2001 & Field Monitoring held between March’2011 to May’2011)
3.17.1 Demographic profile of the Project AreaThe core zone (ML area) consists of denudated hills with no habitation. With in 1 Km
radius there is one village namely Goendamal with 147 households having a total of 574
inhabitants. In the buffer zone there are 50 villages with 8859 households. The total
population is about 37635 of which 50 % is contributed by males and rest 49 % are females.
Sex ratio indicates that female population is relatively less in the study area. Percentage of
Scheduled Cast population is 15 and that of Scheduled tribe is 21.
Figure 3.13 Demographic Pattern Of The Study Area
3.17.2 Employment & Occupation
As per the base line survey and census data, it has been observed that unlike other parts
of Odisha cultivation is not the major occupation of the villagers in this locality. Only 9.72% of
the working population depends on the cultivation as the main source of income where as
1.86% of the population are mraginal cultivators. This may be because of less land holding,
erractic rainfall and low irrigation facility for the farmers. The people involve in other activities
General Male33%
General Female31%
SC Male7%
SC Female8%
ST Male11%
ST Female10%
Demographic Profile
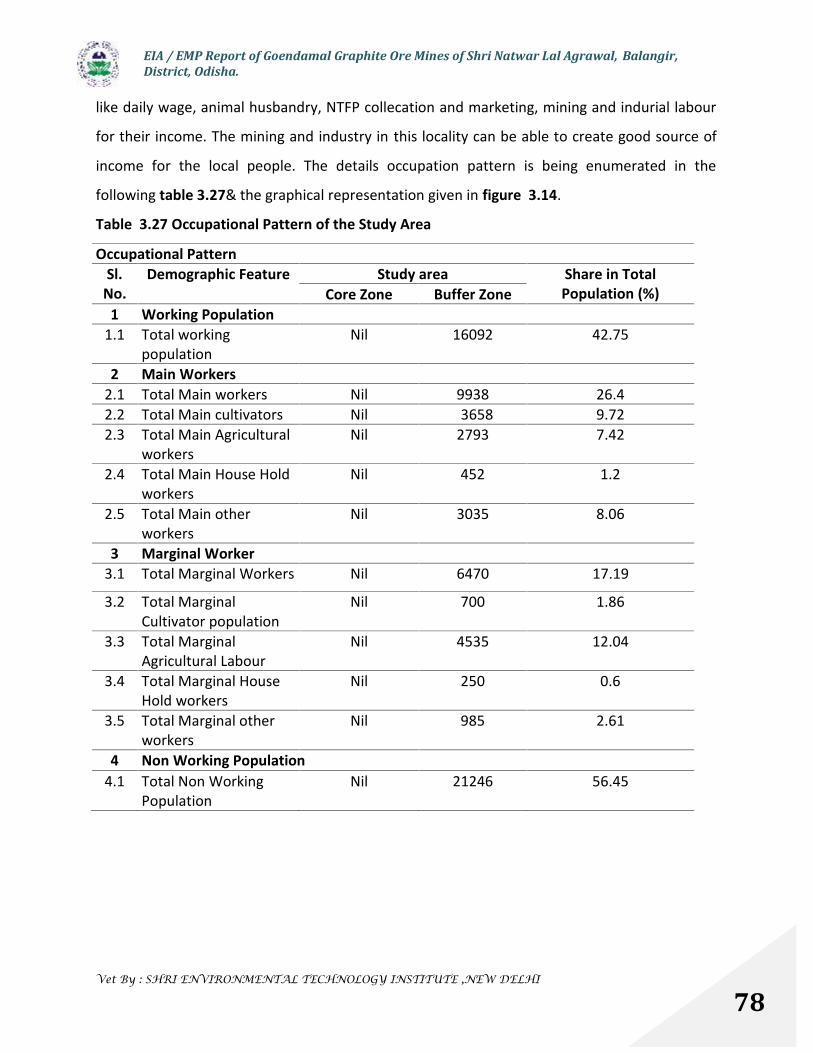
EIA / EMP Report of Goendamal Graphite Ore Mines of Shri Natwar Lal Agrawal, Balangir,District, Odisha.
Vet By : SHRI ENVIRONMENTAL TECHNOLOGY INSTITUTE ,NEW DELHI
78
like daily wage, animal husbandry, NTFP collecation and marketing, mining and indurial labour
for their income. The mining and industry in this locality can be able to create good source of
income for the local people. The details occupation pattern is being enumerated in the
following table 3.27& the graphical representation given in figure 3.14.
Table 3.27 Occupational Pattern of the Study Area
Occupational PatternSl.
No.Demographic Feature Study area Share in Total
Population (%)Core Zone Buffer Zone1 Working Population
1.1 Total workingpopulation
Nil 16092 42.75
2 Main Workers2.1 Total Main workers Nil 9938 26.42.2 Total Main cultivators Nil 3658 9.722.3 Total Main Agricultural
workersNil 2793 7.42
2.4 Total Main House Holdworkers
Nil 452 1.2
2.5 Total Main otherworkers
Nil 3035 8.06
3 Marginal Worker3.1 Total Marginal Workers Nil 6470 17.19
3.2 Total MarginalCultivator population
Nil 700 1.86
3.3 Total MarginalAgricultural Labour
Nil 4535 12.04
3.4 Total Marginal HouseHold workers
Nil 250 0.6
3.5 Total Marginal otherworkers
Nil 985 2.61
4 Non Working Population4.1 Total Non Working
PopulationNil 21246 56.45
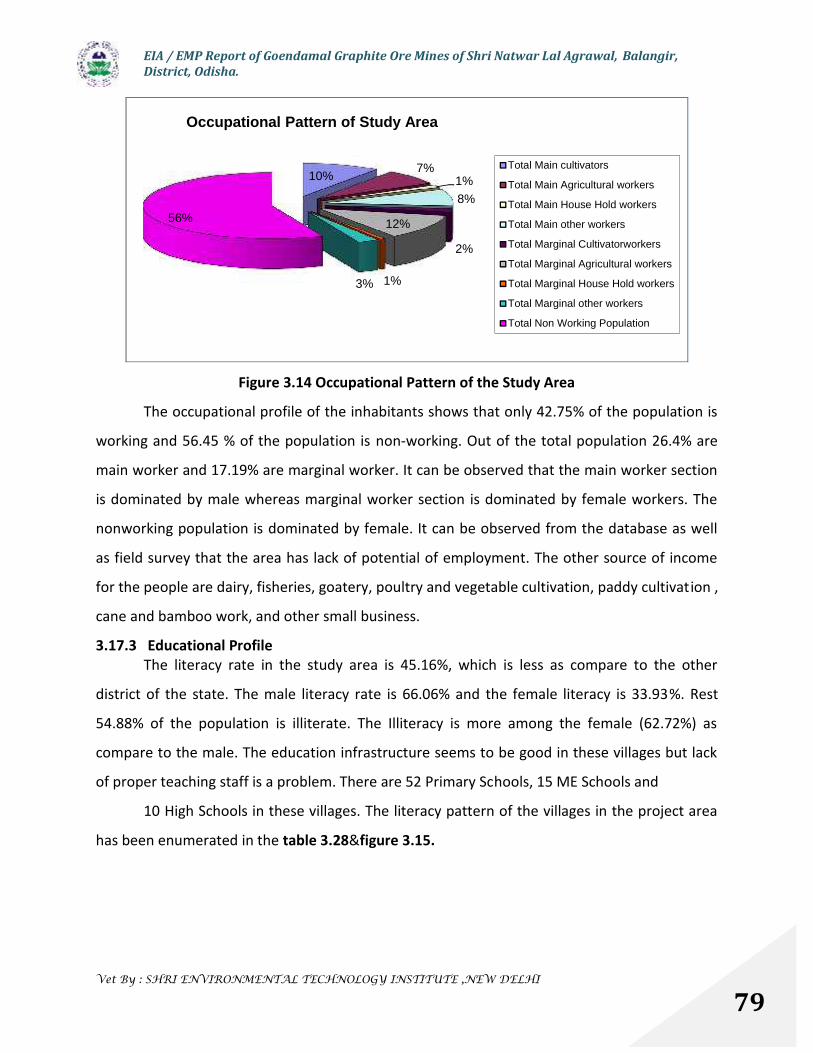
EIA / EMP Report of Goendamal Graphite Ore Mines of Shri Natwar Lal Agrawal, Balangir,District, Odisha.
Vet By : SHRI ENVIRONMENTAL TECHNOLOGY INSTITUTE ,NEW DELHI
79
Figure 3.14 Occupational Pattern of the Study Area
The occupational profile of the inhabitants shows that only 42.75% of the population is
working and 56.45 % of the population is non-working. Out of the total population 26.4% are
main worker and 17.19% are marginal worker. It can be observed that the main worker section
is dominated by male whereas marginal worker section is dominated by female workers. The
nonworking population is dominated by female. It can be observed from the database as well
as field survey that the area has lack of potential of employment. The other source of income
for the people are dairy, fisheries, goatery, poultry and vegetable cultivation, paddy cultivation ,
cane and bamboo work, and other small business.
3.17.3 Educational ProfileThe literacy rate in the study area is 45.16%, which is less as compare to the other
district of the state. The male literacy rate is 66.06% and the female literacy is 33.93%. Rest
54.88% of the population is illiterate. The Illiteracy is more among the female (62.72%) as
compare to the male. The education infrastructure seems to be good in these villages but lack
of proper teaching staff is a problem. There are 52 Primary Schools, 15 ME Schools and
10 High Schools in these villages. The literacy pattern of the villages in the project area
has been enumerated in the table 3.28&figure 3.15.
10% 7%1%8%
2%
12%
1%3%
56%
Occupational Pattern of Study Area
Total Main cultivators
Total Main Agricultural workers
Total Main House Hold workers
Total Main other workers
Total Marginal Cultivatorworkers
Total Marginal Agricultural workers
Total Marginal House Hold workers
Total Marginal other workers
Total Non Working Population
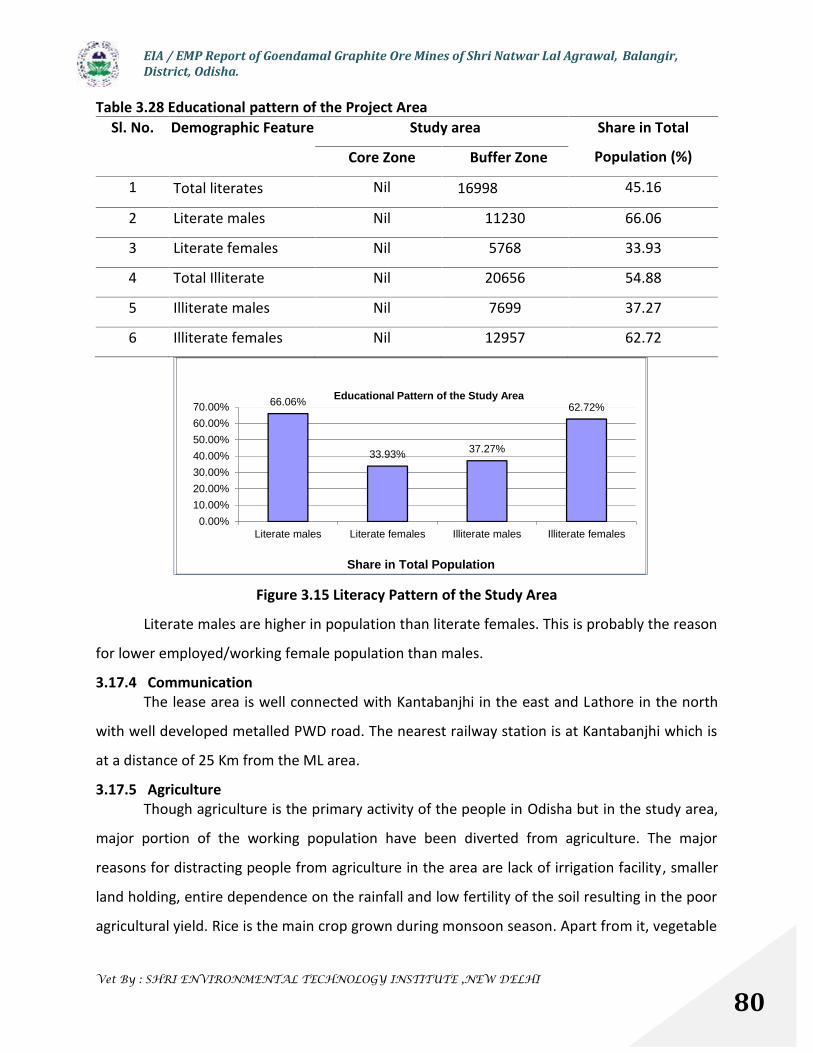
EIA / EMP Report of Goendamal Graphite Ore Mines of Shri Natwar Lal Agrawal, Balangir,District, Odisha.
Vet By : SHRI ENVIRONMENTAL TECHNOLOGY INSTITUTE ,NEW DELHI
80
Table 3.28 Educational pattern of the Project AreaSl. No. Demographic Feature Study area Share in Total
Population (%)Core Zone Buffer Zone
1 Total literates Nil 16998 45.16
2 Literate males Nil 11230 66.06
3 Literate females Nil 5768 33.93
4 Total Illiterate Nil 20656 54.88
5 Illiterate males Nil 7699 37.27
6 Illiterate females Nil 12957 62.72
Figure 3.15 Literacy Pattern of the Study Area
Literate males are higher in population than literate females. This is probably the reason
for lower employed/working female population than males.
3.17.4 CommunicationThe lease area is well connected with Kantabanjhi in the east and Lathore in the north
with well developed metalled PWD road. The nearest railway station is at Kantabanjhi which is
at a distance of 25 Km from the ML area.
3.17.5 AgricultureThough agriculture is the primary activity of the people in Odisha but in the study area,
major portion of the working population have been diverted from agriculture. The major
reasons for distracting people from agriculture in the area are lack of irrigation facility, smaller
land holding, entire dependence on the rainfall and low fertility of the soil resulting in the poor
agricultural yield. Rice is the main crop grown during monsoon season. Apart from it, vegetable
66.06%
33.93% 37.27%
62.72%
0.00%10.00%20.00%30.00%40.00%50.00%60.00%70.00%
Literate males Literate females Illiterate males Illiterate females
Share in Total Population
Educational Pattern of the Study Area
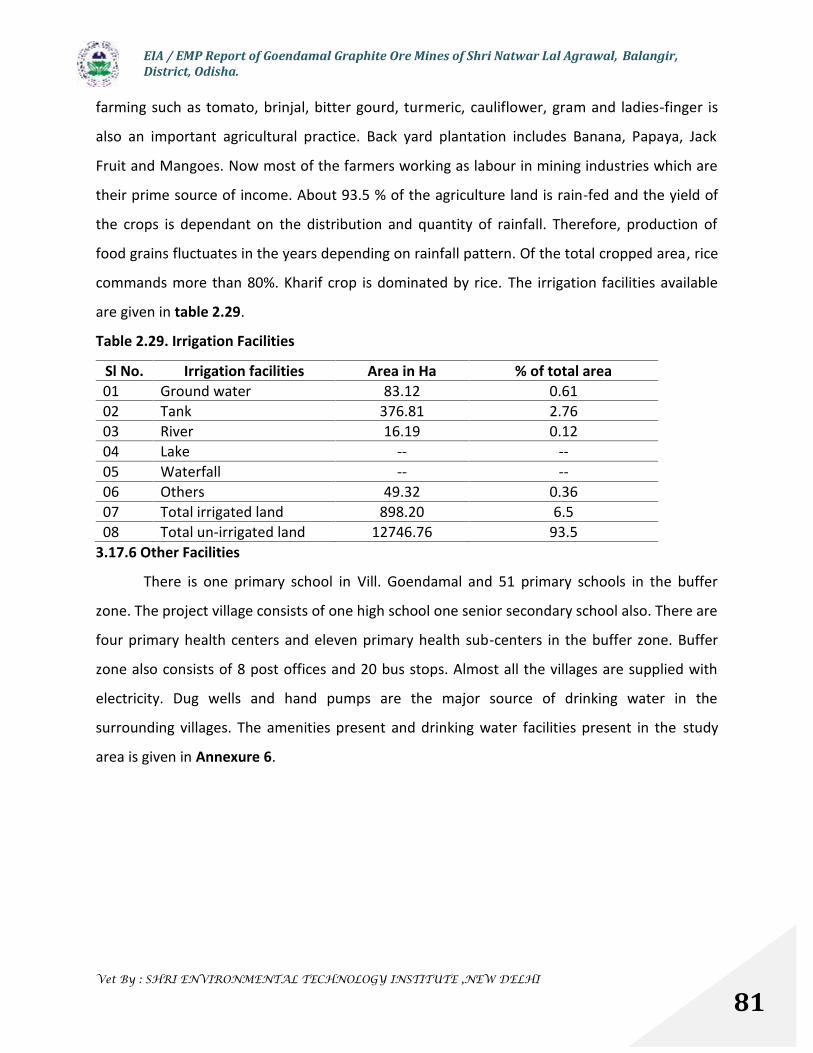
EIA / EMP Report of Goendamal Graphite Ore Mines of Shri Natwar Lal Agrawal, Balangir,District, Odisha.
Vet By : SHRI ENVIRONMENTAL TECHNOLOGY INSTITUTE ,NEW DELHI
81
farming such as tomato, brinjal, bitter gourd, turmeric, cauliflower, gram and ladies-finger is
also an important agricultural practice. Back yard plantation includes Banana, Papaya, Jack
Fruit and Mangoes. Now most of the farmers working as labour in mining industries which are
their prime source of income. About 93.5 % of the agriculture land is rain-fed and the yield of
the crops is dependant on the distribution and quantity of rainfall. Therefore, production of
food grains fluctuates in the years depending on rainfall pattern. Of the total cropped area, rice
commands more than 80%. Kharif crop is dominated by rice. The irrigation facilities available
are given in table 2.29.
Table 2.29. Irrigation Facilities
Sl No. Irrigation facilities Area in Ha % of total area01 Ground water 83.12 0.6102 Tank 376.81 2.7603 River 16.19 0.1204 Lake -- --05 Waterfall -- --06 Others 49.32 0.3607 Total irrigated land 898.20 6.508 Total un-irrigated land 12746.76 93.5
3.17.6 Other Facilities
There is one primary school in Vill. Goendamal and 51 primary schools in the buffer
zone. The project village consists of one high school one senior secondary school also. There are
four primary health centers and eleven primary health sub-centers in the buffer zone. Buffer
zone also consists of 8 post offices and 20 bus stops. Almost all the villages are supplied with
electricity. Dug wells and hand pumps are the major source of drinking water in the
surrounding villages. The amenities present and drinking water facilities present in the study
area is given in Annexure 6.

EIA / EMP Report of Goendamal Graphite Ore Mines of Shri Natwar Lal Agrawal, Balangir,District, Odisha.
Vet By : SHRI ENVIRONMENTAL TECHNOLOGY INSTITUTE ,NEW DELHI
82
4.0 Introduction
In comparison with many other sectors, the potential social and environmental issues
associated with mining and mineral processing operations are both highly significant and
complex to manage. The fixed location of the mineralized zone of interest imposes constraints
on all aspects of mining developments, including the method of mining, location of mine
facilities, requirements for new infrastructure and services (conflict with existing
infrastructure), and the suitability of waste management or disposal methods. This in turn
profoundly influences the environmental, social and health impacts of mining developments, as
well as the economic viability of developing a given mineralized zone.
4.1 Details of Environmental Impacts
The identification of potential environmental impact is first step in the Environmental
Impact Assessment. In order to ensure comprehensiveness the various aspects considered in
impact identification of the project are as follows;
- Investigation of project components
- Investigation of project phases
- Investigation of Impact generating activities
- Investigation of type of Impact
A scientific assessment of the impacts that are likely to influence the existing
environmental scenario is carried out which would facilitate in formulating a suitable
environmental management plan depicting all mitigation measures for sustainable
development of the area. The basic activities involved are:
i) Impact Identificationii) Impact Prediction and Measurement
CHAPTER 4ANTICIPATEDENVIRONMENTALIMPACTS&MITIGATION
MEASURES
EIA / EMP Report of Goendamal Graphite Ore Mines of Shri Natwar Lal Agrawal, Balangir,District, Odisha.
Vet By : SHRI ENVIRONMENTAL TECHNOLOGY INSTITUTE ,NEW DELHI
83
iii) Impact Interpretation and Evaluationiv) Impact Communicationv) Impact Monitoring and Mitigation
Various techniques are available for impact identification. These include checklists,
matrix, networks cause effect diagrams. In the present study, matrix method has been used.
4.1.1 ChecklistsChecklists methodologies range from listing of environmental factors to highly
structured approaches involving scaling of impacts. Such lists can be modified to reflect the
nature of the developmental activities and the geography of the study area.
4.1.2 MatricesMatrices methodologies identify specific sources of potential environmental impacts,
which provide means for communicating the predicted environmental impacts, and can be
communicable in a graphic form.
4.1.3 Flow Diagrams (Network Method)Flow diagrams are some times used to identify action-effect-impact relationship. The
flow diagram permits the analyst to visualize the connection between action and impact. This
method is best suited to single project assessments, and is not recommended for large regional
actions. The network method has been chosen to list the potential impacts of the proposed
project. The graphical feature of the impact network of mining on different environmental
parameters is being given the figure 4.1 to fig 4.7.
The mining and allied activities as proposed in the project area which influence the
environmental attributes include:
1. Excavation2. Construction of approach and haulage road3. Drilling & blasting4. Loading & transportation of ores and wastes5. Processing & sizing of ores6. Disposal of overburden/waste.7. Stockpiling of low-grade ores.8. Site preparation.
The magnitude of the proposed mining activity being small is not likely to create any
serious impacts on the existing environmental set up of the area. However, the likely impacts of
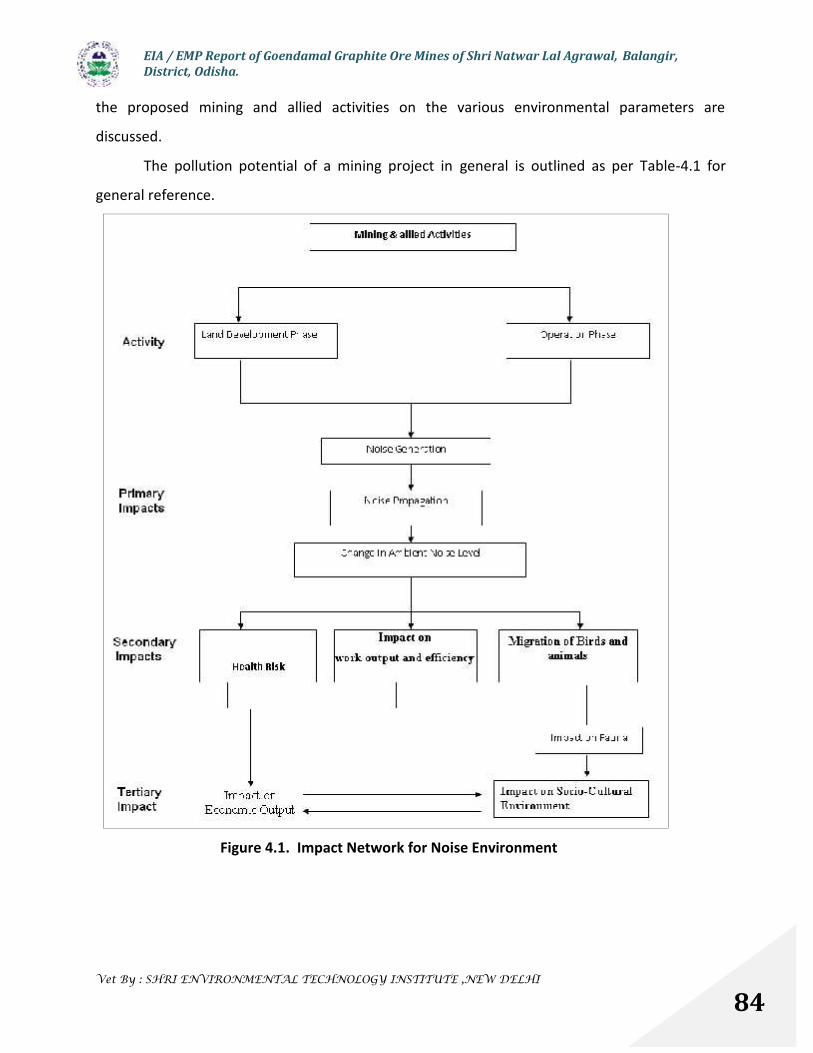
EIA / EMP Report of Goendamal Graphite Ore Mines of Shri Natwar Lal Agrawal, Balangir,District, Odisha.
Vet By : SHRI ENVIRONMENTAL TECHNOLOGY INSTITUTE ,NEW DELHI
84
the proposed mining and allied activities on the various environmental parameters are
discussed.
The pollution potential of a mining project in general is outlined as per Table-4.1 for
general reference.
Figure 4.1. Impact Network for Noise Environment
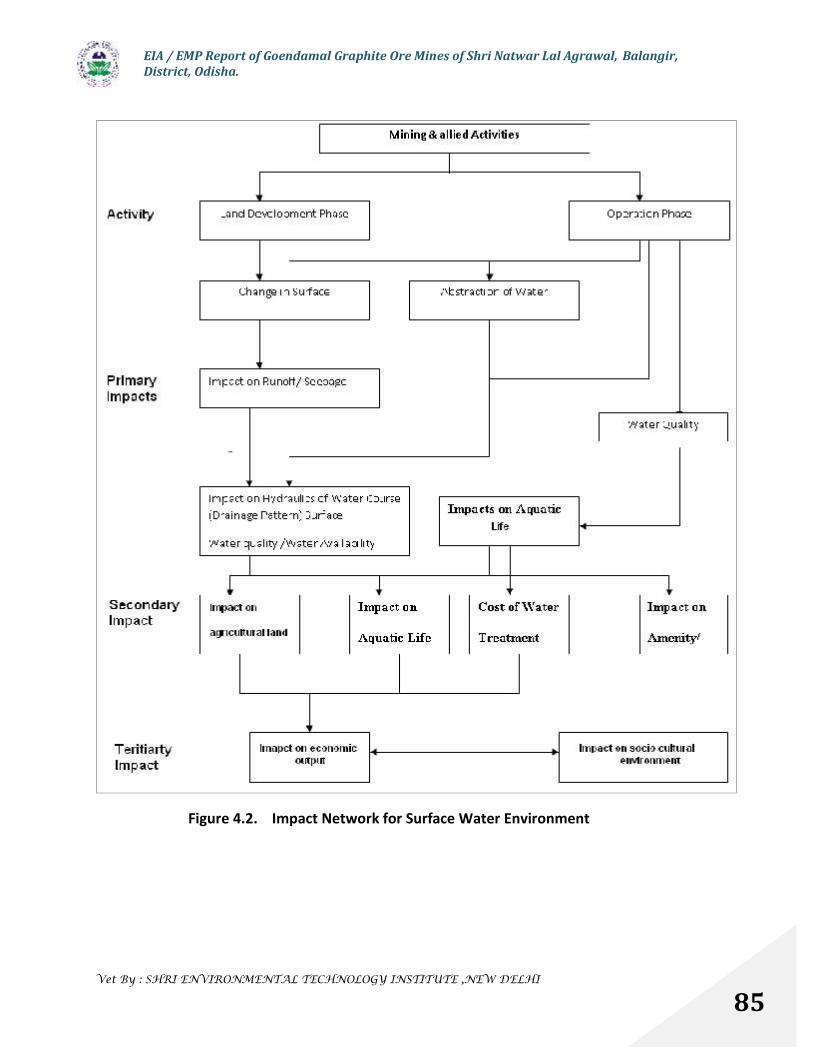
EIA / EMP Report of Goendamal Graphite Ore Mines of Shri Natwar Lal Agrawal, Balangir,District, Odisha.
Vet By : SHRI ENVIRONMENTAL TECHNOLOGY INSTITUTE ,NEW DELHI
85
Figure 4.2. Impact Network for Surface Water Environment
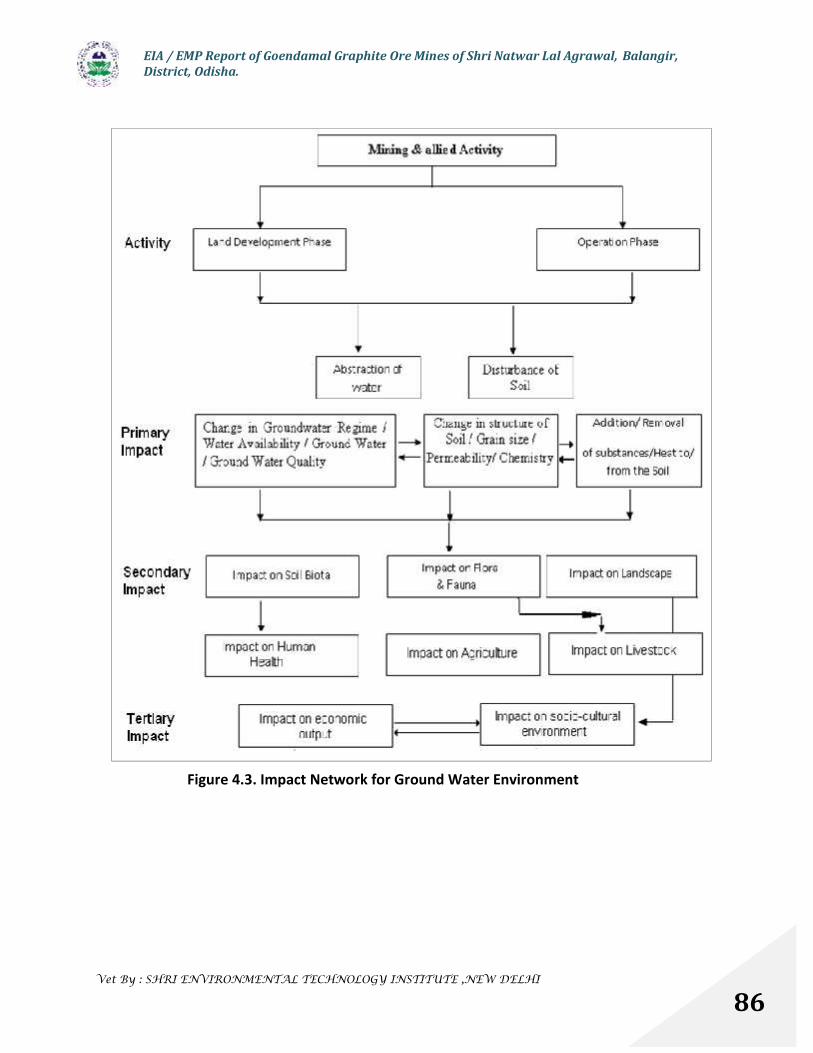
EIA / EMP Report of Goendamal Graphite Ore Mines of Shri Natwar Lal Agrawal, Balangir,District, Odisha.
Vet By : SHRI ENVIRONMENTAL TECHNOLOGY INSTITUTE ,NEW DELHI
86
Figure 4.3. Impact Network for Ground Water Environment

EIA / EMP Report of Goendamal Graphite Ore Mines of Shri Natwar Lal Agrawal, Balangir,District, Odisha.
Vet By : SHRI ENVIRONMENTAL TECHNOLOGY INSTITUTE ,NEW DELHI
87
Figure 4.4. Impact New work for Land Environment
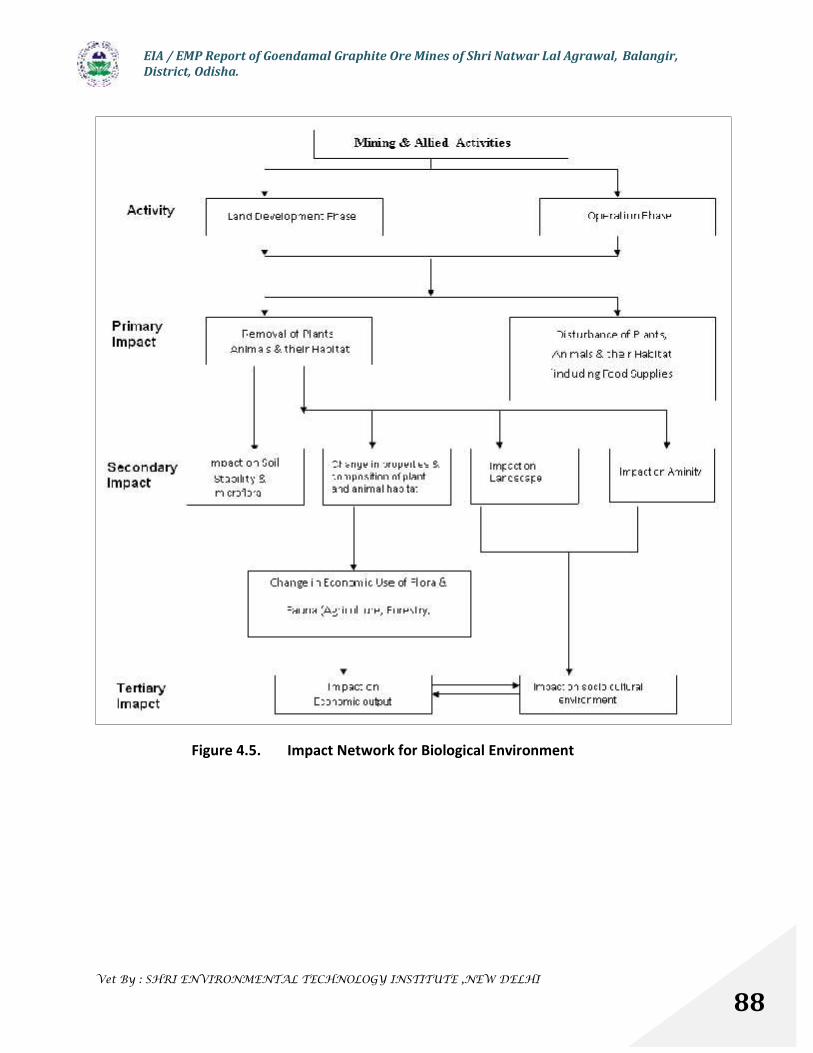
EIA / EMP Report of Goendamal Graphite Ore Mines of Shri Natwar Lal Agrawal, Balangir,District, Odisha.
Vet By : SHRI ENVIRONMENTAL TECHNOLOGY INSTITUTE ,NEW DELHI
88
Figure 4.5. Impact Network for Biological Environment
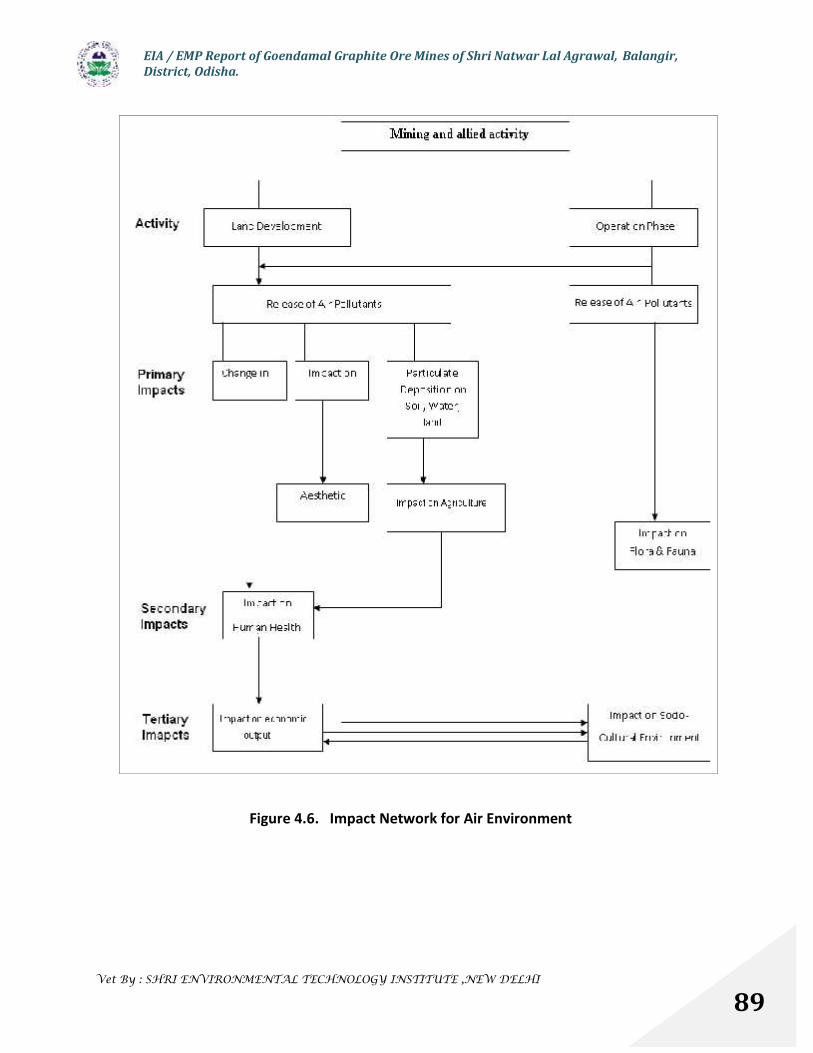
EIA / EMP Report of Goendamal Graphite Ore Mines of Shri Natwar Lal Agrawal, Balangir,District, Odisha.
Vet By : SHRI ENVIRONMENTAL TECHNOLOGY INSTITUTE ,NEW DELHI
89
Figure 4.6. Impact Network for Air Environment

EIA / EMP Report of Goendamal Graphite Ore Mines of Shri Natwar Lal Agrawal, Balangir,District, Odisha.
Vet By : SHRI ENVIRONMENTAL TECHNOLOGY INSTITUTE ,NEW DELHI
90
Figure 4.7. Impact Network for Socio- economic Environment
Table 4.1 Overview of environmental impacts due to different phases of mining
Mining Phase Activity Potential Environmental ImpactExploration andsurveying
Geochemical, Geophysical and air-borne surveys, Drilling and trenching,Blasting for exploration. Explorationcamp housing Vehicle and machineryparks, Fuel point and services. Accessroad construction Waste disposal andcamp sanitation system
Vegetation removal, damage anddestructionHabitat disturbance due to noise andvibrationsDisturbance to residents and wild lifeSoil erosion along trenches andtransectsDumping of drill cores and wastes
MineDevelopment,
Mine construction Striping / sorting ofsoil overburden Installation of power
Habitat loss and disturbance ofhabitation of flora and fauna
EIA / EMP Report of Goendamal Graphite Ore Mines of Shri Natwar Lal Agrawal, Balangir,District, Odisha.
Vet By : SHRI ENVIRONMENTAL TECHNOLOGY INSTITUTE ,NEW DELHI
91
Sourcing andStockpiling
lines Surveying and leveling sites forbuilding and plants. Construction ofmine and surface water treatmentplants. Construction of mine facilities,offices and roads. Construction ofprocessing plants, smelters and refinery
Reduction in biodiversity of thelocalityAltered landforms due toconstructionAltered drainage and runoff flowsIncreased erosion of site areaIncreased situation of surface water
Removal andstorage of oresand wastematerials
Stripping /sorting of soil overburdenWaste rock stock piling, Low grade orestock piling, High grade ore stock piling
Land alienation from waste rockstock pilesDisturbance form vehicle andmachinery noise and site illuminationAcceleration of acid rock drainagethrough exposure of ores to air andwater
Blasting, Miningand Grinding
Blasting of rock for extraction Ground surface disturbanceDisturbance due to noise andvibrationsDust and fumes from explosion, minevehicles and transport systemsContamination from explosiveresidues.
Transport offinal product tomarkets
Packaging /loading of final product intotransportationTransportation of final product via raillink
Disturbance due to noise, vibrationsand site illuminationDust and fumes from exposedproduct stockpiles
Mine closureand postoperationalwaste
Decommissioning of roadsDismantling of buildingsPlanting of disturbed areasRecounting waste dumpsWater Quality treatmentFencing dangerous areasMonitoring of seepage.
Noise & dust during dismantlingSubsidence, slumping and flooding ofpreviously mined areasContinuous discharge ofcontaminants to ground and surfacewater via seepage.
4.2 Impact of mining on Land environment
4.2.1 Impact on Topography & drainage
The impact on the topography is in the form of changed landscape due to the mining
activities in the form of excavation& dumping of waste. This is confined to core zone only.
Beyond the core zone no such changes in the buffer zone is envisaged.
The main drainage pattern of the area is formed by tributaries of Lant River which flows
at a distance of 1.3 km in the north-east of the ML area. Other small nalas flow in NE to E
directions and join Lant River in the North. There is no seasonal or perennial nala in the lease
area. Direct impact on hydrology is not envisaged.

EIA / EMP Report of Goendamal Graphite Ore Mines of Shri Natwar Lal Agrawal, Balangir,District, Odisha.
Vet By : SHRI ENVIRONMENTAL TECHNOLOGY INSTITUTE ,NEW DELHI
92
Ground water is likely to occur at a depth of 10 m bgl. The mine is to be worked through
pumping and drain off the quarried area through peripheral drain. The peripheral drain is
provided with a settling tank.
4.2.2 Impact on Land use Pattern
4.2.3 Impact on Land environment and Land use
Mining operations involve development of benches, approach roads, haul roads, drilling,
blasting, excavation and transport and handling of product and waste materials. These activities
can have significant impact on the land environment if proper mitigation measures are not
adopted. Overburden and waste rock including the non-mineralized strata overlying or
interleaving mineralized zones and low grade mineralization which can not be economically
processed is also a source of adverse impact on the land use. The magnitude of such
environmental impacts depends upon
The extent and depth of the mineralized zone
The quantities of material to be mined and disposed of and the effects on dump locations
and designs
The possible inherent toxicity of the wastes
Health and safety issues relating to transportation, storage, use of explosives and toxic
materials.
Management (containment, control, and disposal) of overburden
The potential adverse environmental implications of these activities include impacts on
water quality or hydrology, plant and animal life, loss of natural habitats, resettlement, loss of
cultural heritage or religious sites, effects on visual amenity, noise nuisance, and loss of
agricultural land or forestry resources.
In the present case following are the identified sources which may degrade the land
environment of the area:
o Change in land use due to mining, dumping and infrastructure development.
o Leachates from the waste dump and contaminated water from the mines that may
affecting the characteristic of the top soil affecting the land use.
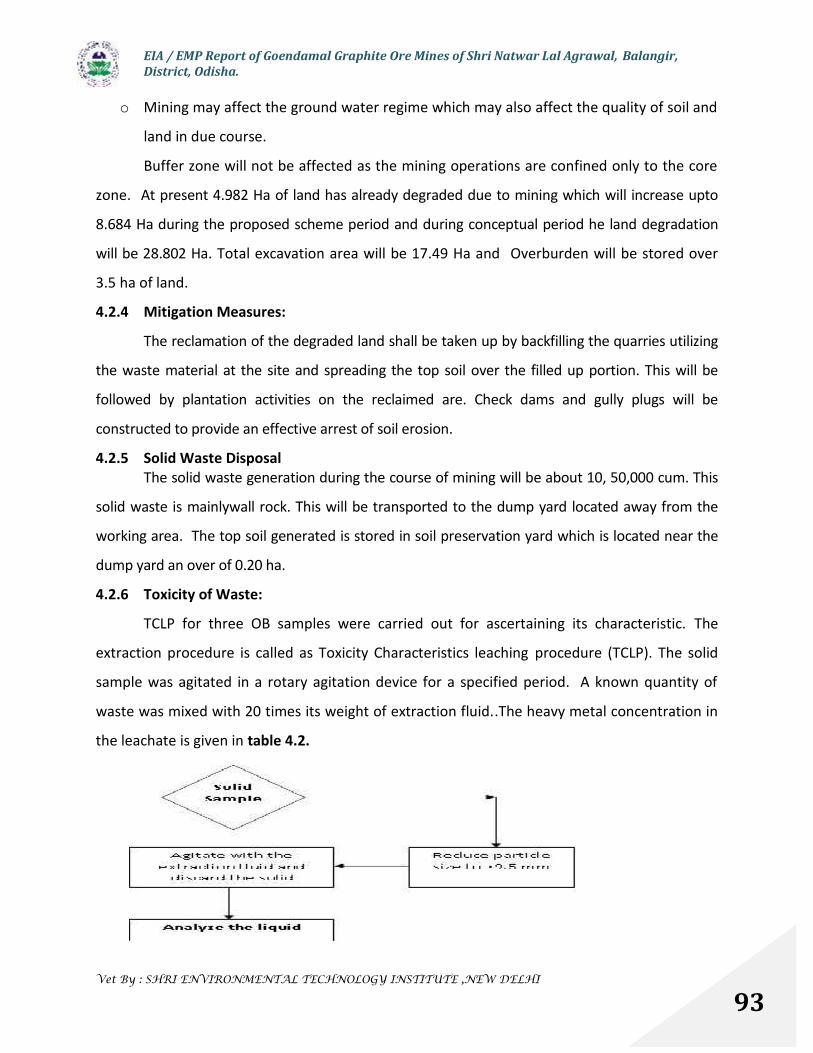
EIA / EMP Report of Goendamal Graphite Ore Mines of Shri Natwar Lal Agrawal, Balangir,District, Odisha.
Vet By : SHRI ENVIRONMENTAL TECHNOLOGY INSTITUTE ,NEW DELHI
93
o Mining may affect the ground water regime which may also affect the quality of soil and
land in due course.
Buffer zone will not be affected as the mining operations are confined only to the core
zone. At present 4.982 Ha of land has already degraded due to mining which will increase upto
8.684 Ha during the proposed scheme period and during conceptual period he land degradation
will be 28.802 Ha. Total excavation area will be 17.49 Ha and Overburden will be stored over
3.5 ha of land.
4.2.4 Mitigation Measures:
The reclamation of the degraded land shall be taken up by backfilling the quarries utilizing
the waste material at the site and spreading the top soil over the filled up portion. This will be
followed by plantation activities on the reclaimed are. Check dams and gully plugs will be
constructed to provide an effective arrest of soil erosion.
4.2.5 Solid Waste DisposalThe solid waste generation during the course of mining will be about 10, 50,000 cum. This
solid waste is mainlywall rock. This will be transported to the dump yard located away from the
working area. The top soil generated is stored in soil preservation yard which is located near the
dump yard an over of 0.20 ha.
4.2.6 Toxicity of Waste:
TCLP for three OB samples were carried out for ascertaining its characteristic. The
extraction procedure is called as Toxicity Characteristics leaching procedure (TCLP). The solid
sample was agitated in a rotary agitation device for a specified period. A known quantity of
waste was mixed with 20 times its weight of extraction fluid..The heavy metal concentration in
the leachate is given in table 4.2.
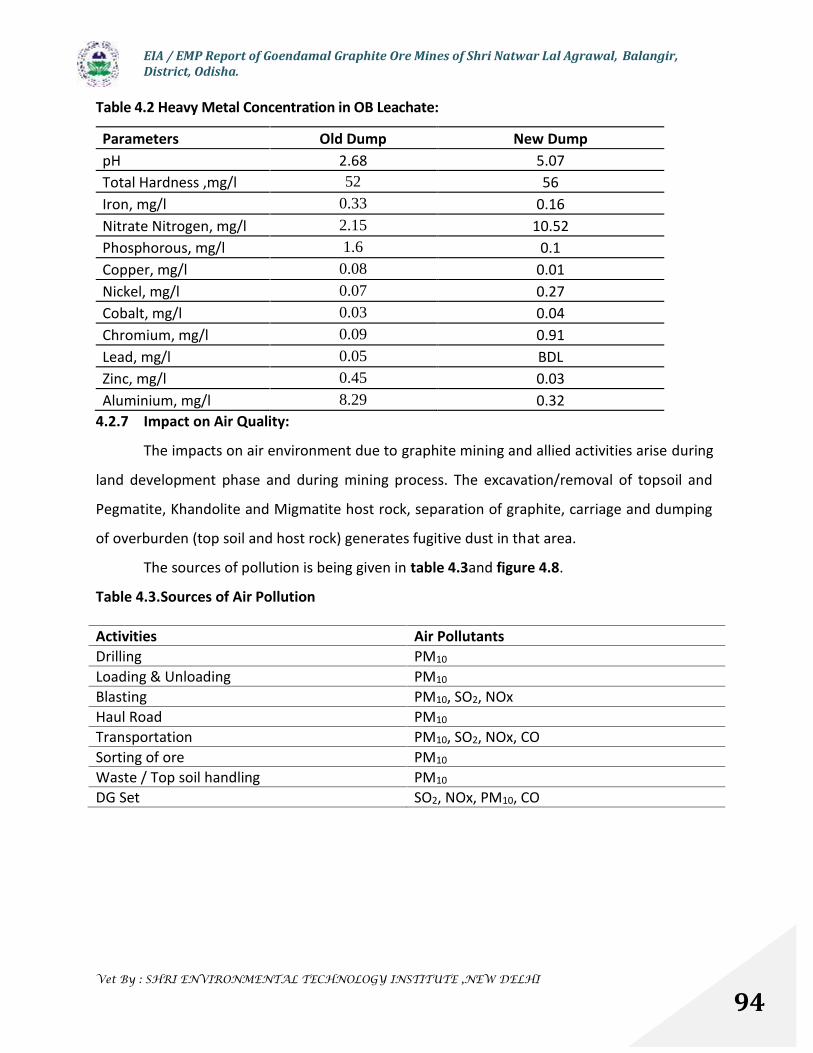
EIA / EMP Report of Goendamal Graphite Ore Mines of Shri Natwar Lal Agrawal, Balangir,District, Odisha.
Vet By : SHRI ENVIRONMENTAL TECHNOLOGY INSTITUTE ,NEW DELHI
94
Table 4.2 Heavy Metal Concentration in OB Leachate:
Parameters Old Dump New DumppH 2.68 5.07Total Hardness ,mg/l 52 56Iron, mg/l 0.33 0.16Nitrate Nitrogen, mg/l 2.15 10.52Phosphorous, mg/l 1.6 0.1Copper, mg/l 0.08 0.01Nickel, mg/l 0.07 0.27Cobalt, mg/l 0.03 0.04Chromium, mg/l 0.09 0.91Lead, mg/l 0.05 BDLZinc, mg/l 0.45 0.03Aluminium, mg/l 8.29 0.32
4.2.7 Impact on Air Quality:
The impacts on air environment due to graphite mining and allied activities arise during
land development phase and during mining process. The excavation/removal of topsoil and
Pegmatite, Khandolite and Migmatite host rock, separation of graphite, carriage and dumping
of overburden (top soil and host rock) generates fugitive dust in that area.
The sources of pollution is being given in table 4.3and figure 4.8.
Table 4.3.Sources of Air Pollution
Activities Air PollutantsDrilling PM10
Loading & Unloading PM10
Blasting PM10, SO2, NOxHaul Road PM10
Transportation PM10, SO2, NOx, COSorting of ore PM10
Waste / Top soil handling PM10
DG Set SO2, NOx, PM10, CO
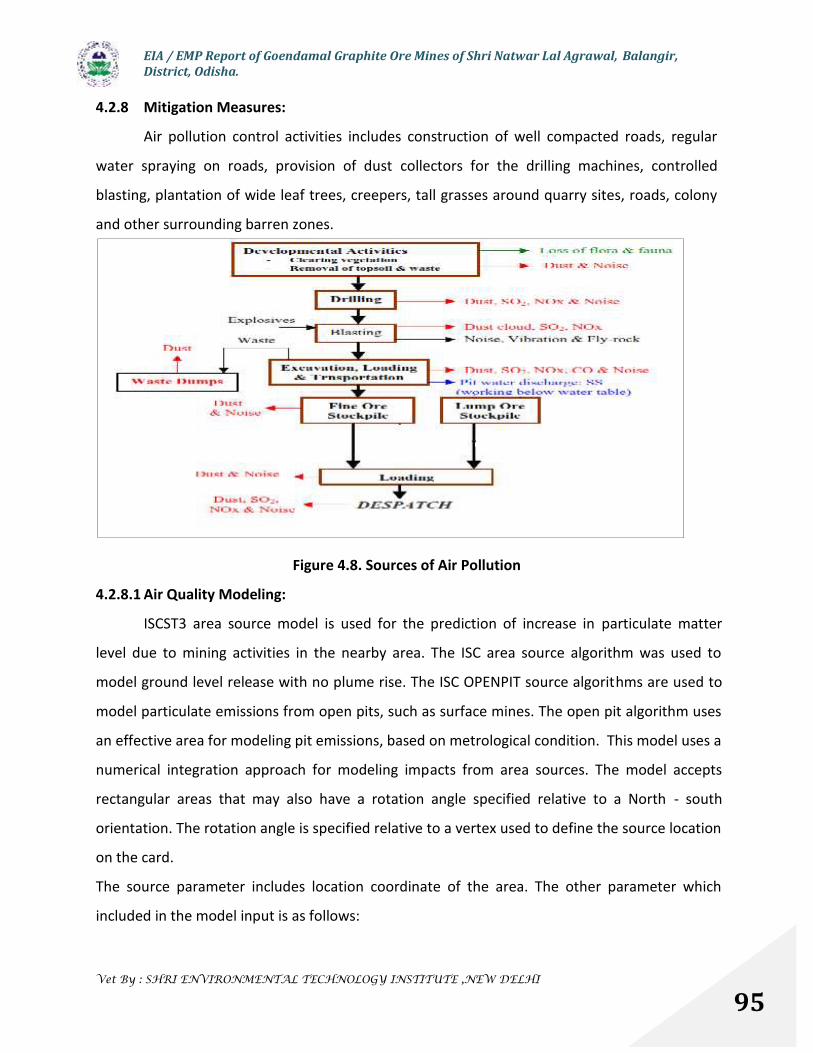
EIA / EMP Report of Goendamal Graphite Ore Mines of Shri Natwar Lal Agrawal, Balangir,District, Odisha.
Vet By : SHRI ENVIRONMENTAL TECHNOLOGY INSTITUTE ,NEW DELHI
95
4.2.8 Mitigation Measures:
Air pollution control activities includes construction of well compacted roads, regular
water spraying on roads, provision of dust collectors for the drilling machines, controlled
blasting, plantation of wide leaf trees, creepers, tall grasses around quarry sites, roads, colony
and other surrounding barren zones.
Figure 4.8. Sources of Air Pollution
4.2.8.1 Air Quality Modeling:
ISCST3 area source model is used for the prediction of increase in particulate matter
level due to mining activities in the nearby area. The ISC area source algorithm was used to
model ground level release with no plume rise. The ISC OPENPIT source algorithms are used to
model particulate emissions from open pits, such as surface mines. The open pit algorithm uses
an effective area for modeling pit emissions, based on metrological condition. This model uses a
numerical integration approach for modeling impacts from area sources. The model accepts
rectangular areas that may also have a rotation angle specified relative to a North - south
orientation. The rotation angle is specified relative to a vertex used to define the source location
on the card.
The source parameter includes location coordinate of the area. The other parameter which
included in the model input is as follows:
EIA / EMP Report of Goendamal Graphite Ore Mines of Shri Natwar Lal Agrawal, Balangir,District, Odisha.
Vet By : SHRI ENVIRONMENTAL TECHNOLOGY INSTITUTE ,NEW DELHI
96
Aremis – Area emission rate in g/(s-m2)
Relhgt - Release height above the ground in m.
x init – length of x side of the area in meters.
y init – length of y side of the area
Angle – Orientation angle for rectangular area in degrees from north, measured positive in
clockwise direction
The following source /emission inputs have been considered for air pollution prediction
modeling:
1. Pollution Sources in multiple combinations of active mining areas (as area source) and
haul roads (as line source) have been considered.
2. Emission rates utilized for mines of similar capacity and geo-mining conditions
elsewhere as noted from secondary data have been used for the present case. Emission
rates for active mining area and haul roads have been taken to be 1.4 X 10⁻⁷ g/s/m2 and
1.6 x 10⁻⁵ g/s/m2 respectively.
3. Extent of quarried area changes with time. Fugitive dust level at any particular time is,
by large extent, function of this available active mining area; haul road length. under a
given set of meteorological conditions.
The impact has been predicted over the study area, which is around 10 km radius of the
project site. It is evident from data furnished in the table 4.4 below that, the PM10
concentration will be maximum within 500 m radial distance and gradually decreases with
increase in distance. Therefore, it can be predicted that, the M.L. area & its vicinity will be
slightly affected by suspended particles; whereas beyond 1km distance no effect will be
envisaged. The isopleths showing the spread of fugitive dust is shown in figure 4.9. The
modeling output has been given in Annexure - 7.
Table 4.4 Predicted Maximum Ground Level Concentration Values of PM10
Direction
PM10 concentration in g/m3
At 500 m distance At 1 km distance At 2 km distance
Predicted Existing Total Predicted Existing Total Predicted Existing Total
SW 7.8 64.2 72 5.19 61.2 66.39 1.44 54.2 55.64
EIA / EMP Report of Goendamal Graphite Ore Mines of Shri Natwar Lal Agrawal, Balangir,District, Odisha.
Vet By : SHRI ENVIRONMENTAL TECHNOLOGY INSTITUTE ,NEW DELHI
97
S 6.0 60.8 66.8 3.25 58.5 61.75 2.36 50.6 52.96W 3.0 56.6 59.6 2.05 57.6 59.65 1.85 51.2 53.05
The prediction of air quality due to proposed activities through simulation model shows
that, the maximum incremental Ground Level Concentration (GLC) of PM10 will be 7.8 μ g/m3 in
SW direction at a distance of 500m.
Above result shows that the increase in pollution in the ambient air is low. It has been
predicted from the model output data that the maximum GLC will be at a distance of 300m
from the M.L. area in the prevalent wind directions i.e. SW, S and W directions. It has been
observed during air quality monitoring that, the dust generations are short term and settle
quickly within close ranges.
4.2.9 Impact on Noise Quality:
Different activities in mining such as loading, hauling, drilling, ore handling, mining. lead
to generation of noise. The existing noise level in the core zone as measured at project site of
Goendamal Graphite ore mines is 38 to 45 dB during daytime and 35 to 40 dB during the
nighttime.
The various sources of noise mentioned above shall only be periodical and are limited
to a fixed period of operation only. In addition to this, the transportation of ores might cause a
little effect on the noise level. The noise generated by different machinery used in mining
operation is given in table 4.5.
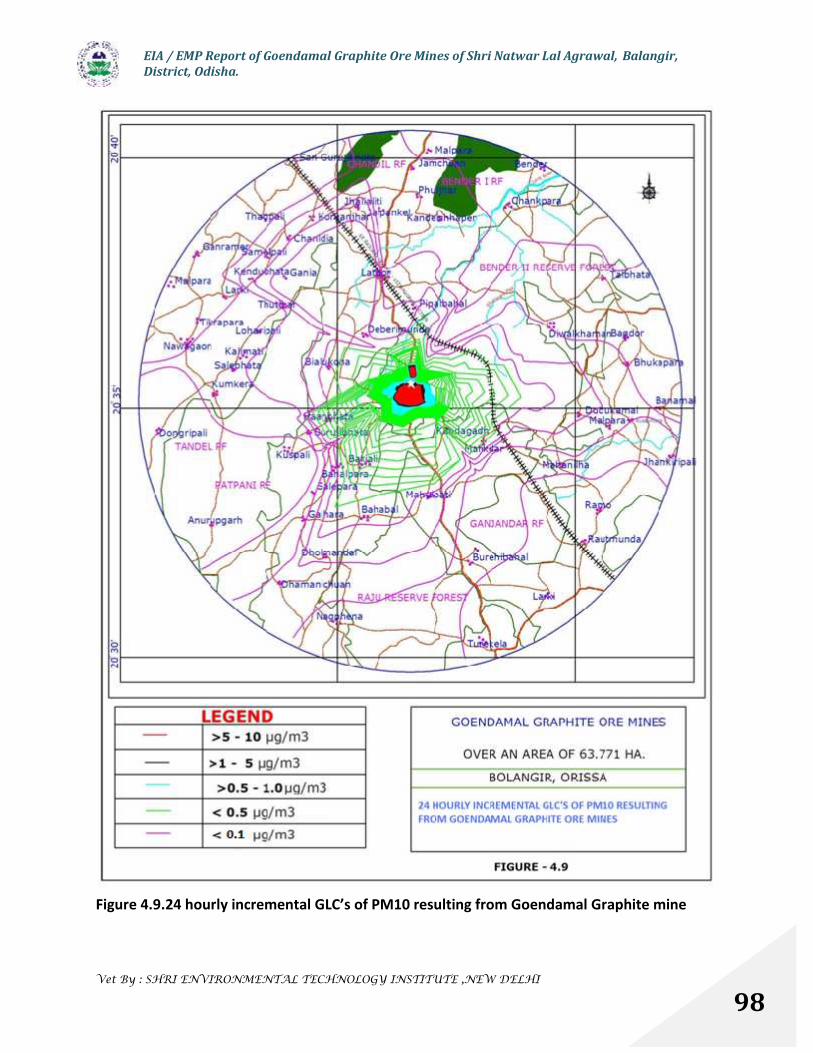
EIA / EMP Report of Goendamal Graphite Ore Mines of Shri Natwar Lal Agrawal, Balangir,District, Odisha.
Vet By : SHRI ENVIRONMENTAL TECHNOLOGY INSTITUTE ,NEW DELHI
98
Figure 4.9.24 hourly incremental GLC’s of PM10 resulting from Goendamal Graphite mine
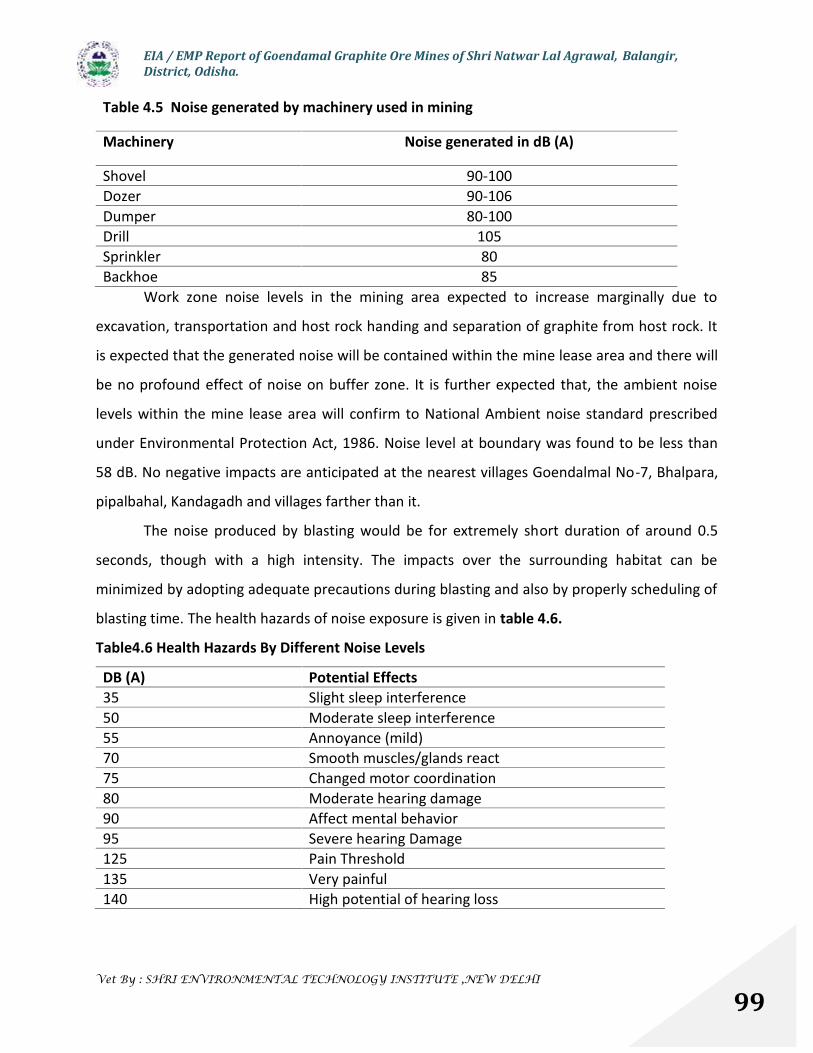
EIA / EMP Report of Goendamal Graphite Ore Mines of Shri Natwar Lal Agrawal, Balangir,District, Odisha.
Vet By : SHRI ENVIRONMENTAL TECHNOLOGY INSTITUTE ,NEW DELHI
99
Table 4.5 Noise generated by machinery used in mining
Machinery Noise generated in dB (A)
Shovel 90-100Dozer 90-106Dumper 80-100Drill 105Sprinkler 80Backhoe 85
Work zone noise levels in the mining area expected to increase marginally due to
excavation, transportation and host rock handing and separation of graphite from host rock. It
is expected that the generated noise will be contained within the mine lease area and there will
be no profound effect of noise on buffer zone. It is further expected that, the ambient noise
levels within the mine lease area will confirm to National Ambient noise standard prescribed
under Environmental Protection Act, 1986. Noise level at boundary was found to be less than
58 dB. No negative impacts are anticipated at the nearest villages Goendalmal No-7, Bhalpara,
pipalbahal, Kandagadh and villages farther than it.
The noise produced by blasting would be for extremely short duration of around 0.5
seconds, though with a high intensity. The impacts over the surrounding habitat can be
minimized by adopting adequate precautions during blasting and also by properly scheduling of
blasting time. The health hazards of noise exposure is given in table 4.6.
Table4.6 Health Hazards By Different Noise Levels
DB (A) Potential Effects35 Slight sleep interference50 Moderate sleep interference55 Annoyance (mild)70 Smooth muscles/glands react75 Changed motor coordination80 Moderate hearing damage90 Affect mental behavior95 Severe hearing Damage125 Pain Threshold135 Very painful140 High potential of hearing loss
EIA / EMP Report of Goendamal Graphite Ore Mines of Shri Natwar Lal Agrawal, Balangir,District, Odisha.
Vet By : SHRI ENVIRONMENTAL TECHNOLOGY INSTITUTE ,NEW DELHI
100
4.2.10 Blasting Effects:
Noise of blast is site specific and depends on type, quantity of explosives, dimension of
drill holes, degree of compaction of explosive in the hole and rock. Here the impact of noise will
be very less as the blasting will be performed during the day time. Shot hole drilling &Blasting
will be in practice so that the effect of blasting in terms of fly rock and maximum ground
vibration will be negligible. Time of blasting will be 12 noon to 12.30 PM in day time with prior
intimation to the villagers for taking shelter. The blasting site is located at distance of 450m from
the office. The practice of regularly wetting the blasting ground and spraying water over the
blasted material will be adopted to control air pollution. Proposal is to adopt wet drilling on the
benches.
4.2.11 Impact on Water Quality
The mining activities can cause adverse impacts due to mine drainage, siltation due to
storm water & contaminated water from domestic sewage. Water shall be used only for
Afforestation and domestic purposes which will be met by ground water sources and hence
exploitation of surface water and aquatic biodiversity is not anticipated.
The potential impact on the surface water quality is likely to be due to higher load of
suspended solids. Sources of suspended solids would be:
Discharge of mine runoff during rains to the surface water channels;
Wash off from waste dumps and limestone stock piles during rainy season;
Oil spillage from maintenance of machineries
a. Impact due to Mine drainage Water
The ground water occurs at 316 mRL and mining will continue upto 305 mRL. During the
conceptual period mining activities will intersect the sub surface water regime. About 54 cum/d
of sub surface water will be generated. Two numbers of 15 HP pumps will be used to pump out
the mine water for 6 hours daily for draining of the quarried area through the peripheral drains.
The peripheral drain is provided with settling tank and clean water will be stored and used for
miscellaneous purpose. Excess water will be provided to the farmers for agriculture in the
surrounding areas. The water is neither acidic nor alkaline in nature and it does contain any
harmful chemicals. Hence treatment of water other than desilting is not required.
EIA / EMP Report of Goendamal Graphite Ore Mines of Shri Natwar Lal Agrawal, Balangir,District, Odisha.
Vet By : SHRI ENVIRONMENTAL TECHNOLOGY INSTITUTE ,NEW DELHI
101
b. Impact due to Water use in Mines:
Water will be mainly used for dust suppression and washing of machineries. Since no
chemical transformation takes place and the ore is naturally occurring there is no possibility of
any chemical contamination in the wastewater. The domestic effluents being generated will be
discharged to soak pits through septic tank.
c. Impact due to Surface Runoff from the Dumps:
The waste dumps are more prone to erosion. The garland drains around the dumpsites
helps to check the flow of fines during the surface runoff and helps in minimizing the impact on
the surrounding environment. Grasses will also be planted on the dump slope to check the soil
erosion.
4.2.12 Impact on Vegetation:
The mining lease area does not include any forest land. The ML area and the buffer
zone is devoid of any endangered flora and fauna species. The existing vegetation with in the
ML area includes few shrubs which are sparsely scattered. As the existing vegetation in the ML
area is very less there will be negligible impact on vegetation of the project area.
4.2.13 Impact on Socioeconomic Conditions
The mine lease area comprises of mainly non-forestland and the project does not
involve any loss of agriculture land. Commencement of mining activity will have beneficial to
the socio-economic environment. It is being proposed to employ 93 persons and provision of
improved infrastructure facility. Preference will be given to skilled, semi skilled and unskilled
categories for employment. General medical facilities of area to be provided to the villagers
from the first – aid – center depending upon the availability. There will be a development of
infrastructural facilities and amenities due to proposed mines in the region.
In terms of the major socio-economic impacts, the project will provide more direct and
indirect job opportunities and better economic standards to the project affected people and
others, through improved infrastructural and community facilities. Development of residential
colony, creation of civic and welfare amenities like primary health care, communications,
educational institutes, recreational facilities, that will develop along with the project will ensure
better quality of life for the local population.
EIA / EMP Report of Goendamal Graphite Ore Mines of Shri Natwar Lal Agrawal, Balangir,District, Odisha.
Vet By : SHRI ENVIRONMENTAL TECHNOLOGY INSTITUTE ,NEW DELHI
102
4.2.14 Impact on Occupational Health
The process of excavation / quarrying leads to some health hazards. The most significant
occupational health impacts are Noise Induced Hearing Loss (NIHL) and Occupational Lung
Disease (OLD) due to inhalation of dust. As per Mines Rules, 1955, medical examination of
employees at the initial stage and periodically, shall be done by a team of qualified medical
officers provided by the project proponent. Regular medical check up camps shall also be
arranged for detection of occupational diseases and minor disease in the nearby rural
population. Free check up and medicine for treatment for their acute and chronic illness shall
be provided.
4.2.15 Impact on Traffic Density
All transportation will be done by 15T trucks and tippers. Five trucks / tippers are
provided for transportation of ore and waste from mine. The rate of production is 15000 Tonns
per year with 220 no. of working days. Therefore two numbers of trucks will be engaged in
transportation of ore @ 3 trips per day. This truck will be engaged for removal of waste during
the balance period of the week. Hence, there is a very insignificant increase in traffic density of
the locality. This can be manageable within the present capacity of the highway and the
connective link from the highway to project site. The road is wide & black top to sustain the
negligible increase. There shall be an insignificant increase in traffic resulting from to and fro
movement of people.
4.3. Irreversible / Irretrievable Commitments of Environmental Components
Except short term aesthetic change, no irreversible change in the prevailing
environment will be there. The change in landscape is temporary in nature, which will soon be
restored by backfilling of stored overburden and afforestation in that area.
4.4 Significance of Impacts
This activity has two distinct inter-related operations. Firstly it refers to the need to
determine the importance of an impact. Secondly, the relative importance of impacts in
comparison with other impacts of a different nature some times is considered as part of the
impact interpretation. This is termed as evaluation. The environmental impact evaluation
follows the identification and quantification of the impacts. The significant impacts, which have
EIA / EMP Report of Goendamal Graphite Ore Mines of Shri Natwar Lal Agrawal, Balangir,District, Odisha.
Vet By : SHRI ENVIRONMENTAL TECHNOLOGY INSTITUTE ,NEW DELHI
103
been identified and quantified in the previous chapter, are based on the baseline data
generated in the field during to March to May 2011. The data obtained from other sources like
Indian Meteorological Department, Census of Odisha, Directorate of Economics and Statistics
& other Government Organizations on different aspects have also been utilized. These are
expressed in appropriate units in this chapter so as to get the aggregate score of the
“Environmental Impact” of the mining lease area and its surroundings. This exercise results in a
whole number that could be used in decision making without any ambiguity.
4.4.1 Evaluation of Environmental Impacts
Matrix method has been adopted in this report for the purposes of impact evaluation.
The advantage of matrix method is that it is possible to identify the most severe cause-effect
relationship. The matrix method employs a list of project activities in addition to a checklist of
potentially affected environmental characteristics. These two lists are related in a matrix,
which identify cause-effect relationship between specific activities and impacts.
Among matrix methodologies, “Modified Matrix” has been adopted, similar to matrix method,
involves assignment of “Parameter Importance Value” (PIV) against each environmental
impact parameter. These values are determined by subjective judgment considering the
relative importance or significance of individual parameter. After deciding PIV, these values
have to be distributed among all the cause-effect relationship, which are established between
those particular affected environmental parameters and the concerned project activities by
means of indices, which are called “Relative Parameters Importance Indices” (RPII). The RPII is
chosen in such a way that the sum of all the indices is equal to unity. The value of RPII is
decided based on the relative importance of cause-effect relationships. Higher important one
is given higher RPII value and the next important one is given next higher RPII value.
Another index which is to be determined for each cause effect relationship is called
“Environmental Impact Index” (EII). The scale for EII varies from zero to one. The value one is
assigned to an impact of highest order and zero is assigned to an impact of negligible
magnitude. For adverse impacts, EII carries a negative sign and for beneficial impacts, it carries
positive sign. For determining the value of EII, the environmental impact parameters are
divided into two categories.
EIA / EMP Report of Goendamal Graphite Ore Mines of Shri Natwar Lal Agrawal, Balangir,District, Odisha.
Vet By : SHRI ENVIRONMENTAL TECHNOLOGY INSTITUTE ,NEW DELHI
104
Category “A” incorporates environmental impact parameters whose quality varies linearly with
the magnitude of impact and includes
- surface and ground water resources
- socio-economic aspects
- land use pattern
- human settlement
Category “B” incorporates environmental impact parameters whose quality varies
logarithmically with the magnitude of impact and includes
- surface ground water quality
- air quality
- noise quality
- health
- Biodiversity
In the later cause, a slight change in impact magnitude will have insignificant change in
environmental quality, but as the magnitude increases, the deterioration in quality increases
logarithmically. The basis for determination of EII for category A and category B are given in
tables 4.7 and 4.8 respectively. After determining EII for each cause-effect relationship the
same will be multiplied with RPII to get a “Weighted Environmental Impact Index” (WEII).
These values are once again multiplied with PIV and addition of all these values gives the
impact score of that particular environmental parameters. The impact score so obtained for all
environmental impact parameters is added together to get total impact score. This total
impact score is used for interpretation and decision-making.
Table4.7. Determination of EII for Category “A” Parameters
Sl. No. Impact Magnitude in Percentage EII
1 No change 0
2 0-4.9% change 0.05
3 5-14.9 % change 0.1
4 15-24.9% change 0.2
5 25-34.9% change 0.3

EIA / EMP Report of Goendamal Graphite Ore Mines of Shri Natwar Lal Agrawal, Balangir,District, Odisha.
Vet By : SHRI ENVIRONMENTAL TECHNOLOGY INSTITUTE ,NEW DELHI
105
6 35-44.9% change 0.4
7 45-54.9% change 0.5
8 55-64.9% change 0.6
9 65-74.9% change 0.7
10 65-84.9% change 0.8
11 85-94.9% change 0.9
12 >95 change 1.0
Table4.8. Determination of EII for Category “B” Parameters
Sl. No. Impact Magnitude in Percentage EII
1 No change 0
2 0-4.9% change 0.02
3 5-14.9 % change 0.05
4 15-24.9% change 0.10
5 25-34.9% change 0.15
6 35-44.9% change 0.25
7 45-54.9% change 0.50
8 55-64.9% change 0.75
9 >65% change 1.00
The mining and allied activities, which are likely to cause potential impacts on
environment, are identified and listed as below:
1. Mining operations2. Sizing of ores3. Disposal of solid wastes4. Transportation5. Provision of civic amenities6. Plantation programmeEach of the above activities is discussed below:
1. Mining Operation
This includes the activities like occasional drilling, blasting and excavation.
2. Sizing of Ores
This includes the breaking and sizing of the ore to the required sizes.

EIA / EMP Report of Goendamal Graphite Ore Mines of Shri Natwar Lal Agrawal, Balangir,District, Odisha.
Vet By : SHRI ENVIRONMENTAL TECHNOLOGY INSTITUTE ,NEW DELHI
106
3. Disposal of solid wastes
The activity includes removal and disposal of solid wastes associated with ore bodies.
4. Transportation
This includes total transportation system i.e. movement of ore from stack yard to the
destination and transportation of overburden waste from mines to dump yard.
5. Provision of civic amenities
Civic amenities like water supply, sewage collection and disposal, recreational facility,
power supply, medical facility and educational facilities will be provided in the residential
colony at the project site.
6. Plantation programme
Development of green belt along the periphery of the lease area, colony area and avenue
plantation along the roadside shall be organized.
The environmental parameters, which are likely to be affected, are given below:
1. Impact on surface water resources2. Impact on ground water resources3. Impact on air quality4. Impact on water quality5. Impact on noise quality6. Impact on health7. Impact on public utilities8. Impact on economic aspects9. Impact on land use and soil characteristics10. Impact on wild life11. Impact on flora12. Impact on human settlement4.4.2 Parameter Importance Value for Environmental Components
The environmental components listed in the earlier section are assigned with PIV so as
to convert the environmental impacts into commensurate units, which could be aggregated
easily to get the total score of environmental impacts. The parameter importance values are
assigned by marking and pair-wise comparison procedure. This procedure involves preparation
of a table containing number of columns corresponding to the range of value, which can be
assigned a “Score of importance” against each impact area. The score of importance is any
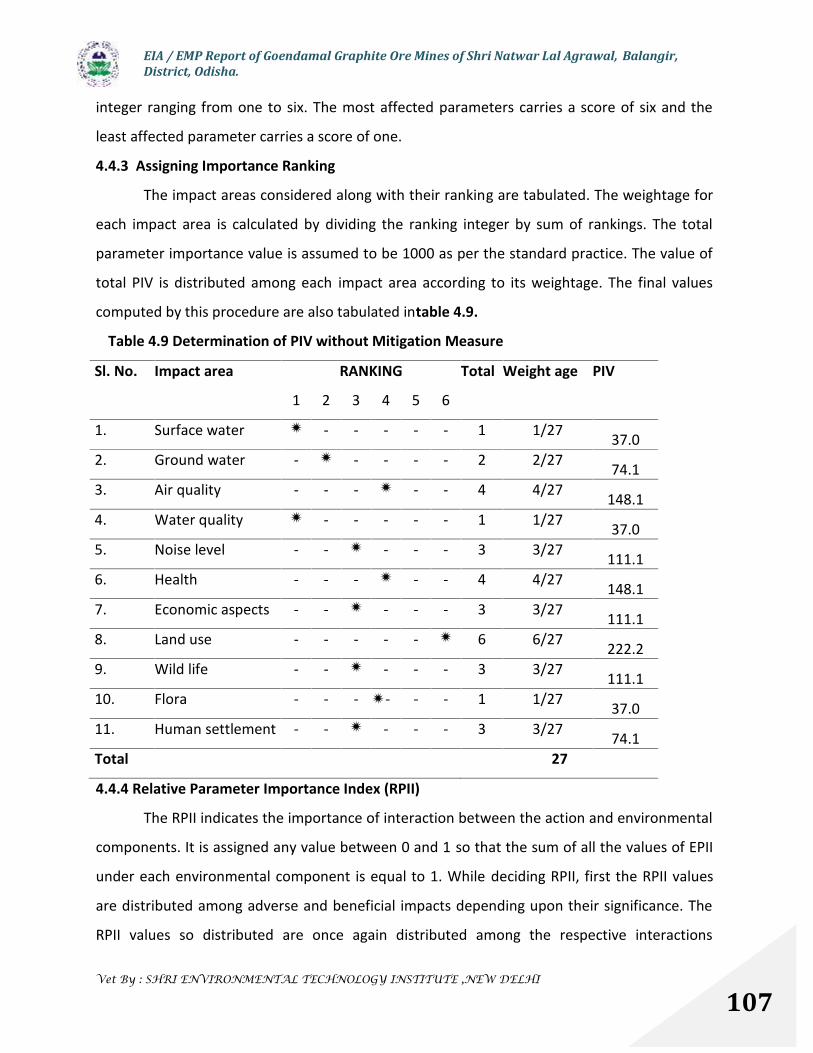
EIA / EMP Report of Goendamal Graphite Ore Mines of Shri Natwar Lal Agrawal, Balangir,District, Odisha.
Vet By : SHRI ENVIRONMENTAL TECHNOLOGY INSTITUTE ,NEW DELHI
107
integer ranging from one to six. The most affected parameters carries a score of six and the
least affected parameter carries a score of one.
4.4.3 Assigning Importance Ranking
The impact areas considered along with their ranking are tabulated. The weightage for
each impact area is calculated by dividing the ranking integer by sum of rankings. The total
parameter importance value is assumed to be 1000 as per the standard practice. The value of
total PIV is distributed among each impact area according to its weightage. The final values
computed by this procedure are also tabulated intable 4.9.
Table 4.9 Determination of PIV without Mitigation Measure
Sl. No. Impact area RANKING Total Weight age PIV
1 2 3 4 5 6
1. Surface water - - - - - 1 1/27 37.02. Ground water - - - - - 2 2/27 74.13. Air quality - - - - - 4 4/27 148.14. Water quality - - - - - 1 1/27 37.05. Noise level - - - - - 3 3/27 111.16. Health - - - - - 4 4/27 148.17. Economic aspects - - - - - 3 3/27 111.18. Land use - - - - - 6 6/27 222.29. Wild life - - - - - 3 3/27 111.110. Flora - - - - - - 1 1/27 37.011. Human settlement - - - - - 3 3/27 74.1Total 27
4.4.4 Relative Parameter Importance Index (RPII)
The RPII indicates the importance of interaction between the action and environmental
components. It is assigned any value between 0 and 1 so that the sum of all the values of EPII
under each environmental component is equal to 1. While deciding RPII, first the RPII values
are distributed among adverse and beneficial impacts depending upon their significance. The
RPII values so distributed are once again distributed among the respective interactions
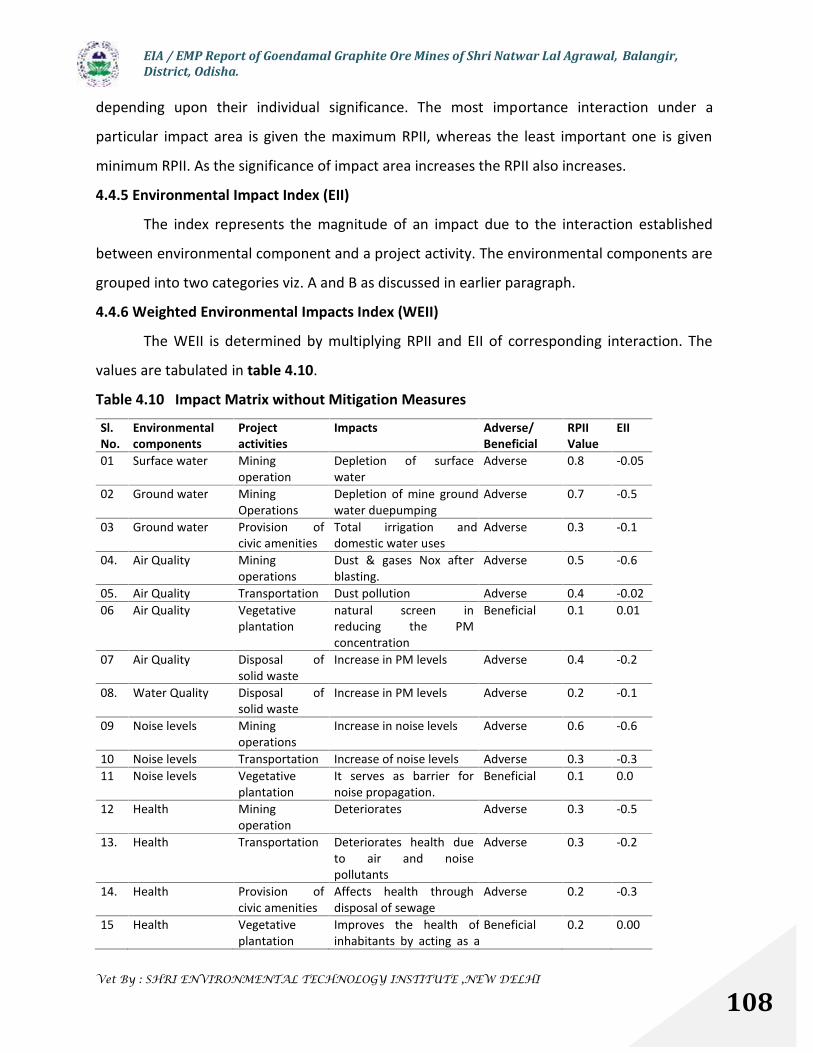
EIA / EMP Report of Goendamal Graphite Ore Mines of Shri Natwar Lal Agrawal, Balangir,District, Odisha.
Vet By : SHRI ENVIRONMENTAL TECHNOLOGY INSTITUTE ,NEW DELHI
108
depending upon their individual significance. The most importance interaction under a
particular impact area is given the maximum RPII, whereas the least important one is given
minimum RPII. As the significance of impact area increases the RPII also increases.
4.4.5 Environmental Impact Index (EII)
The index represents the magnitude of an impact due to the interaction established
between environmental component and a project activity. The environmental components are
grouped into two categories viz. A and B as discussed in earlier paragraph.
4.4.6 Weighted Environmental Impacts Index (WEII)
The WEII is determined by multiplying RPII and EII of corresponding interaction. The
values are tabulated in table 4.10.
Table 4.10 Impact Matrix without Mitigation Measures
Sl.No.
Environmentalcomponents
Projectactivities
Impacts Adverse/Beneficial
RPIIValue
EII
01 Surface water Miningoperation
Depletion of surfacewater
Adverse 0.8 -0.05
02 Ground water MiningOperations
Depletion of mine groundwater duepumping
Adverse 0.7 -0.5
03 Ground water Provision ofcivic amenities
Total irrigation anddomestic water uses
Adverse 0.3 -0.1
04. Air Quality Miningoperations
Dust & gases Nox afterblasting.
Adverse 0.5 -0.6
05. Air Quality Transportation Dust pollution Adverse 0.4 -0.0206 Air Quality Vegetative
plantationnatural screen inreducing the PMconcentration
Beneficial 0.1 0.01
07 Air Quality Disposal ofsolid waste
Increase in PM levels Adverse 0.4 -0.2
08. Water Quality Disposal ofsolid waste
Increase in PM levels Adverse 0.2 -0.1
09 Noise levels Miningoperations
Increase in noise levels Adverse 0.6 -0.6
10 Noise levels Transportation Increase of noise levels Adverse 0.3 -0.311 Noise levels Vegetative
plantationIt serves as barrier fornoise propagation.
Beneficial 0.1 0.0
12 Health Miningoperation
Deteriorates Adverse 0.3 -0.5
13. Health Transportation Deteriorates health dueto air and noisepollutants
Adverse 0.3 -0.2
14. Health Provision ofcivic amenities
Affects health throughdisposal of sewage
Adverse 0.2 -0.3
15 Health Vegetativeplantation
Improves the health ofinhabitants by acting as a
Beneficial 0.2 0.00

EIA / EMP Report of Goendamal Graphite Ore Mines of Shri Natwar Lal Agrawal, Balangir,District, Odisha.
Vet By : SHRI ENVIRONMENTAL TECHNOLOGY INSTITUTE ,NEW DELHI
109
barrier to air and noisepollution
16. Economicaspects
Miningoperation
Increased employmentopportunities
Beneficial 0.6 +0.4
17. Economicaspects
Transportation Increased employmentopportunity
Beneficial 0.3 +0.3
18 Economicaspects
Provision ofcivic amenities
Increased employment Beneficial 0.1 +0.1
19 Land use & soilcharacteristic
Disposal ofsolid waste
Land degradation Adverse 0.3 -0.1
20. Land use & soilcharacteristic
Civil structures Lands degradation Adverse 0.1 -0.1
21 Land use & soilcharacteristics
Provision ofcivic amenities
Adverse effect on soilcharacteristics
Adverse 0.05 -0.3
22. Land use & soilcharacteristics
Vegetativeplantation
Beneficial effect on landas it improves aestheticsand provides shelter forwild animals
Beneficial 0.1 0.0
23 Land use & soilcharacteristic
Transportation Impact due to dust Adverse 0.1 -0.2
24 Land use & soilcharacteristic
Mining Impact due to excavation Adverse 0.45 -.0.4
25. Wild Life Mining Affects wildlife throughair and noise pollutionand habit destruction
Adverse 0.5 -0.4
26 Wild Life Transportation Adverse effect due to airand noise pollution
Adverse 0.3 -0.2
27 Wild Life Vegetativeplantation
Habitat to be createdwhich will be suitable forwildlife
Beneficial 0.2 0.0
28 Flora Mining Impact due to air, noisepollution
Adverse 0.4 -0.2
29 Flora Transportation Adverse impact of dustemission
Adverse 0.4 -0.1
30 Flora Civil structures Habitat destruction Adverse 0.1 -0.131 Flora Vegetative
plantationCreation of vegetativehabitat
Beneficial 0.1 -0.0
32 Humansettlement
Miningoperation
Increased populationdensity therebyenvironmentaldegradation
Adverse 0.4 -0.5
33. Humansettlement
Provision ofcivic amenities
Increased employmentopportunities
Adverse 0.3 -0.2
34 Humansettlement
Transportation This helps in transportingpeople from far off places
Beneficial 0.3 +0.2
4.4.7 Environmental Impact Matrix without Mitigation Measures
The environment impact matrix incorporating all the environmental components and
project activities (with in-built control measures) is presented in table 4.11. The RPII and EII
values are shown above while the WEII are shown below these against each interaction. The

EIA / EMP Report of Goendamal Graphite Ore Mines of Shri Natwar Lal Agrawal, Balangir,District, Odisha.
Vet By : SHRI ENVIRONMENTAL TECHNOLOGY INSTITUTE ,NEW DELHI
110
impact score is calculated by multiplying the sum of all WEII’s against each environmental
component by its corresponding PIV. Total impact score is calculated by adding all individual
impact scores. The total impact score is assessed by using following relative scale.
Table 4.11 Impact Score Matrix without Mitigation Measure
Scale
Up to -200 : No appreciable impact on environment
-200 to –400 : Appreciable but reversible impact and measures impact
-400 to –600 : Significant impact mostly reversible after a short period and
mitigation measures crucial
-600 to –900 : Major impact which is mostly irreversible
-900 to –1000 : Permanent irreversible impacts
4.4.8 Summary of Impacts without mitigation measures
The total impact score is found to be –253.80.From the above table in comparison with
the present result indicates that, presently the impacts are not appreciable. But, it is certain
ParameterImportanceValue (PIV)
Project activityenvironmentalcomponents
Miningoperation &allied activities
Disposalof solidwaste
Transportation
Civilstructure
Provision ofcivilamenities
Vegetativeplantation
Impactscore
37.0Surface waterresource
0.8 ×-0.05=-0.04
-- -- -- -- -- - 1.48
74.1Ground waterresource
0.7 × -0.5 =–0.35
-- -- -- 0.3 ×-0.1 = -0.08
-- - 31.86
148.1Air Quality 0.5 × -0.6 =
-0.300.4 × -0.2 =-0.08
0.4 × -0.02= -0.008
-- -- 0.1 × - 0.01 =0.001
- 68.27
37.0Water Quality -- 0.2 × -0.1 =
-0.02-- -- -- -- - 0.74
111.1Noise Levels 0.6 × -0.6 =
-0.36-- 0.3 × -0.3
= -0.09-- -- 0.1 × 0.0 =
0.0 - 49.99
148.1Health 0.3 × -0.5 =
-0.15-- 0.3 × -0.2
= -0.06-- 0.2 × -0.3 = -
0.060.2 × 0.0 =0.0
- 32.58
111.1Economic aspect 0.6 × 0.4 =
+0.24-- 0.3 × 0.3 =
+0.09-- 0.1 × 0.1 =
+0.01-- + 37.77
222.2Land use & soilCharacteristic
0.45 ×-0.4=-0.18
0.3 × -0.1 =-0.03
0.1 × -0.2= -0.02
0.1 × -0.1 =-0.01
0.5 × -0.3 = -0.015
0.1 × 0.0 =0.0
- 56.66
111.1Wild Life 0.5 × -0.4 =
-0.2-- 0.3 × -0.2
= -0.06-- -- 0.2 × 0.0 =
0.0- 28.88
37.0Flora 0.4 ×-0.2 =
-0.08-- 0.4 × -0.1
= -0.080.1 × -0.1 =-0.01
-- 0.1 × 0 = 0 - 6.29
74.1Humansettlement
0.4 × -0.5=-0.20
-- 0.3 × +0.2= +0.06
0.3 × -0.2 =-0.06
-- -- - 14.82
TOTAL SCORE -253.8

EIA / EMP Report of Goendamal Graphite Ore Mines of Shri Natwar Lal Agrawal, Balangir,District, Odisha.
Vet By : SHRI ENVIRONMENTAL TECHNOLOGY INSTITUTE ,NEW DELHI
111
that the negative impacts are getting accumulated. Even though, the assimilative capacity of
the region is not damaged completely, it is amply endangered. The mitigation measures for the
present mining and allied activities are important and they are very crucial in the context of
the future development expansions of the existing leases in the region. The predominantly
affected environmental attributes are air quality, water quality, land use, soil characteristics
and health. On the other hand, economic aspects and public utilities in the region will be
benefited with the advent of new industries.
4.5 Mitigation Measures
In order to minimize the impact of the project activities on the ecosystem and to
achieve the desired objectives of mineral excavation the different management strategies are
to be undertaken, which includes both physical as well as socio-economic factors, to minimize
the adverse environmental impacts on the following environmental components.
- Degradation of land/soil
- Degradation of natural vegetation cover/forest
- Water pollution
- Air pollution
- Noise pollution
- Disturbance of habitat
- Disposal and management of waste
- Socio-economic measures
- Occupational safety and health.
4.6 Assessment of Environmental Impacts after Implementation of Mitigation Measures
Assessment of the environmental impacts due to the proposed project after adhering
to different mitigation measures has been computed in the matrix method and presented in
the similar method as without mitigation measure.
Table 4.12 Impact Matrix with Mitigation Measures
Sl. No. Environmentalcomponents
Projectactivities Impacts Adverse/
BeneficialRPII
Value EII
1. 01Surface waterresources
Miningoperation Depletion of surface water Adverse 0.6 -0.04
2. 0Ground waterMining Depletion of mine ground waterAdverse 0.5 -0.4

EIA / EMP Report of Goendamal Graphite Ore Mines of Shri Natwar Lal Agrawal, Balangir,District, Odisha.
Vet By : SHRI ENVIRONMENTAL TECHNOLOGY INSTITUTE ,NEW DELHI
112
2resources Operations duepumping3. 0
3Ground waterresources
Provision ofcivic amenities
Total irrigation and domestic wateruses Adverse 0.3 -0.1
4. 04.Air Quality Mining
operations Dust & gases Nox after blasting. Adverse 0.3 -0.4
5. 05.Air Quality Transportation Dust pollution Adverse 0.3 -0.02
6. 06Air Quality Vegetative
plantationnatural screen in reducing the PMconcentration Beneficial 0.1 -0.05
7. 07Air Quality Disposal of
solid waste Increase in PM levels Adverse 0.2 -0.1
8. 08.Water Quality Disposal of
solid waste Increase in PM levels Adverse 0.2 -0.06
9. 09Noise levels Mining
operations Increase in noise levels Adverse 0.3 -0.4
10. 10Noise levels Transportation Increase of noise levels Adverse 0.3 -0.3
11. 11Noise levels Vegetative
plantationIt serves as barrier for noisepropagation. Beneficial 0.1 0.0
12. 12Health Mining
operation Deteriorates Adverse 0.3 -0.5
13. 13.Health Transportation Deteriorates health due to air and
noise pollutants Adverse 0.3 -0.2
14. 14.Health Provision of
civic amenitiesAffects health through disposal ofsewage Adverse 0.2 -0.3
15. 15Health Vegetative
plantation
Improves the health of inhabitantsby acting as a barrier to air andnoise pollution
Beneficial 0.2 0.00
16. 19.Economic aspects Mining
operation Land degradation Beneficial 0.6 +0.4
17. 20.Economic aspects Transportation Lands degradation Beneficial 0.3 +0.3
18. 21Economic aspects Provision of
civic amenitiesAdverse effect on soilcharacteristics Beneficial 0.1 +0.1
19. 22Land use & soilcharacteristics
Disposal ofsolid waste
Beneficial effect on land as itimproves aesthetics and providesshelter for wild animals
Adverse 0.3 -0.3
20. 23.
Land use & soilcharacteristics Civil structures Impact due to dust Adverse 0.1 -0.2
21. 24Land use & soilcharacteristics
Provision ofcivic amenities Impact due to excavation Adverse 0.05 -0.3
22. 25Land use & soilcharacteristics
Vegetativeplantation
Affects wildlife through air andnoise pollution and habit Beneficial 0.1 0.0
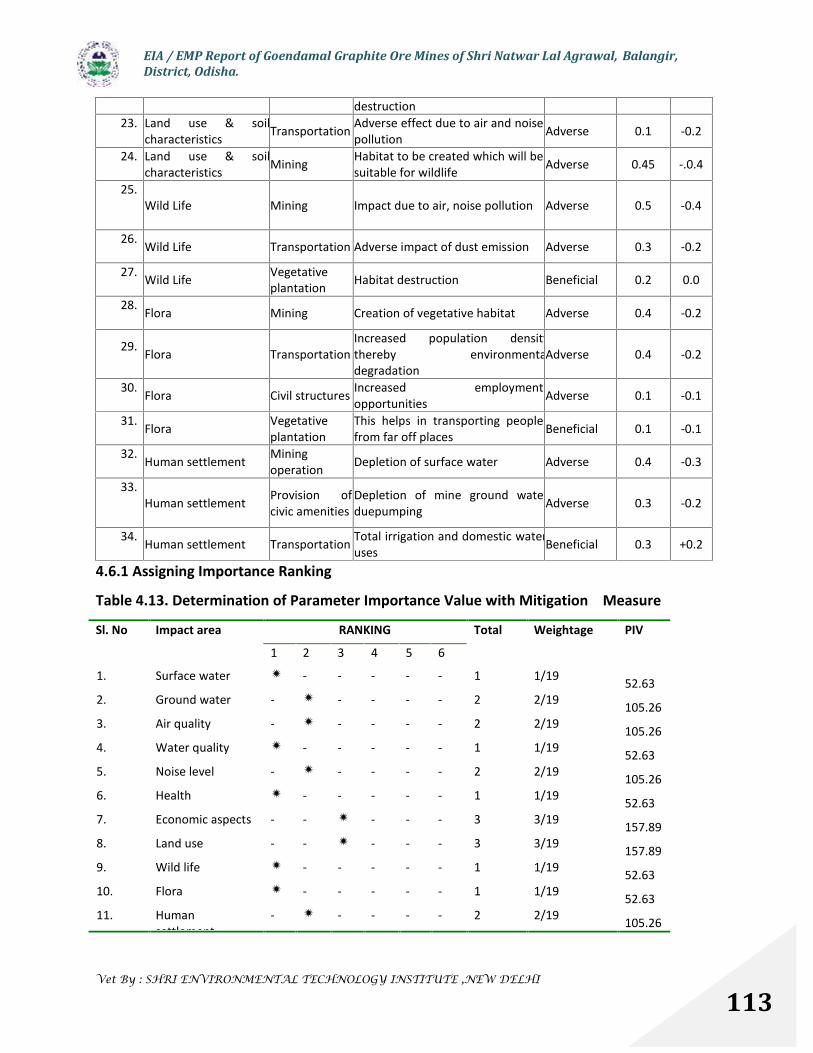
EIA / EMP Report of Goendamal Graphite Ore Mines of Shri Natwar Lal Agrawal, Balangir,District, Odisha.
Vet By : SHRI ENVIRONMENTAL TECHNOLOGY INSTITUTE ,NEW DELHI
113
. destruction23. 2
6Land use & soilcharacteristics Transportation Adverse effect due to air and noise
pollution Adverse 0.1 -0.2
24. 27Land use & soilcharacteristics Mining Habitat to be created which will be
suitable for wildlife Adverse 0.45 -.0.4
25. 28.Wild Life Mining Impact due to air, noise pollution Adverse 0.5 -0.4
26. 29Wild Life Transportation Adverse impact of dust emission Adverse 0.3 -0.2
27. 30Wild Life Vegetative
plantation Habitat destruction Beneficial 0.2 0.0
28. 31Flora Mining Creation of vegetative habitat Adverse 0.4 -0.2
29. 32Flora Transportation
Increased population densitythereby environmentaldegradation
Adverse 0.4 -0.2
30. 33Flora Civil structures Increased employment
opportunities Adverse 0.1 -0.1
31. 34Flora Vegetative
plantationThis helps in transporting peoplefrom far off places Beneficial 0.1 -0.1
32. 35Human settlement Mining
operation Depletion of surface water Adverse 0.4 -0.3
33. 36.Human settlement Provision of
civic amenitiesDepletion of mine ground waterduepumping Adverse 0.3 -0.2
34. 37Human settlement Transportation Total irrigation and domestic water
uses Beneficial 0.3 +0.2
4.6.1 Assigning Importance Ranking
Table 4.13. Determination of Parameter Importance Value with Mitigation Measure
Sl. No Impact area RANKING Total Weightage PIV
1 2 3 4 5 6
1. Surface water - - - - - 1 1/19 52.632. Ground water - - - - - 2 2/19 105.263. Air quality - - - - - 2 2/19 105.264. Water quality - - - - - 1 1/19 52.635. Noise level - - - - - 2 2/19 105.266. Health - - - - - 1 1/19 52.637. Economic aspects - - - - - 3 3/19 157.898. Land use - - - - - 3 3/19 157.899. Wild life - - - - - 1 1/19 52.6310. Flora - - - - - 1 1/19 52.6311. Human
settlement- - - - - 2 2/19 105.26

EIA / EMP Report of Goendamal Graphite Ore Mines of Shri Natwar Lal Agrawal, Balangir,District, Odisha.
Vet By : SHRI ENVIRONMENTAL TECHNOLOGY INSTITUTE ,NEW DELHI
114
Total 19 1.0 1000
Table 4.14. Impact Score Matrix with Mitigation Measures
Scale
Up to -200 : No appreciable impact on environment
-200 to –400 : Appreciable but reversible impact and measures impact
-400 to –600 : Significant impact mostly reversible after a short period and
mitigation measures crucial
-600 to –900 : Major impact which is mostly irreversible
-900 to –1000 : Permanent irreversible impacts
4.6.2 Summary of Impacts with mitigation measures
After incorporating all the mitigation measures as part of the action plan, an impact
matrix has been prepared. The total impact score after mitigation measure is found to be –
111.28. This indicates that presently the impacts are not significant when the benefits are
accounted for. But, it is certain that the negative impacts are being accumulated. Even though,
ParameterImportanceValue (PIV)
Project activityenvironmentalcomponents
Miningoperation &alliedactivities
Disposalof solidwaste
Transportation
Civilstructure
Provision ofcivilamenities
Vegetativeplantation
Impactscore
52.63Surface waterresource
0.4 ×-0.06=-0.024
-- -- -- -- -- -1.26
105.26Ground waterresource
0.5 × -0.4 =–0.20
-- -- -- 0.3 ×-0.1 = -0.03
-- -24.2
105.26Air Quality 0.3 × -0.4 =
-0.120.2 × -0.1= -0.02
0.3 × -0.02= -0.006
-- -- 0.1 × 0.01 =0.001
-15.47
52.63Water Quality -- -- -- -- 0.2 × -0.06 =
-0.012-- -0.631
105.26Noise Levels 0.3 × -0.4 =
-0.12-- 0.3 × -0.3
= -0.09-- -- 0.1 × 0.0 =
0.0-22.1
52.63Health 0.3 × -0.5 =
-0.15-- 0.3 × -0.2
= -0.06-- 0.2 × -0.3 = -
0.060.2 × 0.0 =0.0
-14.21
157.89Economicaspect
0.6 × 0.4 =+0.24
-- 0.3 × 0.3= +0.09
-- 0.1 × 0.1 =+0.01
-- +53.68
157.89Land use & soilCharacteristic
0.45 ×-0.4=-0.18
0.3 × -0.3= -0.09
0.1 × -0.2= -0.02
0.1 × -0.2 =-0.02
0.05 × -0.3 = -0.015
0.1 × 0.0 =0.0
-51.31
52.63Wild Life 0.5 × -0.4 =
-0.2-- 0.3 × -0.2
= -0.06-- -- 0.2 × 0.0 =
0.0-13.68
52.63Flora 0.4 ×-0.2 =
-0.08-- 0.4 × -0.2
= -0.080.1 × -0.1 =-0.01
-- 0.1 × -0.1 = -0.01
-9.47
105.26Humansettlement
0.4 × -0.3=-0.12
-- 0.3 × +0.2= +0.06
-- 0.3 × -0.2 = -0.06
-- -12.63
TOTAL SCORE -111.28
EIA / EMP Report of Goendamal Graphite Ore Mines of Shri Natwar Lal Agrawal, Balangir,District, Odisha.
Vet By : SHRI ENVIRONMENTAL TECHNOLOGY INSTITUTE ,NEW DELHI
115
the assimilative capacity of the region is not damaged completely, it is amply endangered. The
mitigation measures for the present mining and allied activities are important and they are
very crucial in the context of the future development expansion of the existing lease in the
region. The predominantly affected environmental attributes are air quality, water quality,
land use, soil characteristic and health. On the other hand economic aspect and public utilizes
in the region have improved.

EIA / EMP Report of Goendamal Graphite Ore Mines of Shri Natwar Lal Agrawal, Balangir,District, Odisha.
Vet By : SHRI ENVIRONMENTAL TECHNOLOGY INSTITUTE ,NEW DELHI
116
5.0 Introduction
Regular monitoring of various environmental parameters is necessary to evaluate the
efficacy of the management programme so that necessary corrective measures can be taken.
Since environmental quality parameters at work zone are important for maintaining safety, the
monitoring work forms part of safety measures also.
5.1 Proposed Set-Up
Keeping the utility of monitoring results in the implementation of the environmental
management programme in view, an organizational chart has been proposed under the
Environment Department Head.
Organizational Chart For Environmental Management
The
said
team will be responsible for:
Monitoring of air samples
Analyzing the air samples.
CHAPTER 5ENVIRONMENTALMONITORING
PROGRAMME
EMD (Head)
MONITORING TEAMIN CHARGE - 1
TETEM
IMPLEMENTATIONTEAM IN CHARGE -1
CHEMISTS - 2
INSTRUMENTOPERATION /TECHNICIANS 2
GARDENER - 1HOUSE KEEPINGIN CHARGE - 1
WORKERS - 2
EIA / EMP Report of Goendamal Graphite Ore Mines of Shri Natwar Lal Agrawal, Balangir,District, Odisha.
Vet By : SHRI ENVIRONMENTAL TECHNOLOGY INSTITUTE ,NEW DELHI
117
Implementing the control and protective measures.
Coordinating the environment related activities within the project as well as with outside
agencies. Collecting statistics of health of workers and population of the surrounding
villages. Green belt development.
Monitoring the progress of implementation of environmental management programme.
Monitoring the noise generation in and around the project areas.
Monitoring of wastewater treatment and disposal of solid waste.
The laboratory will be suitably equipped for sampling/testing for various environmental
pollutants
5.2 Measurement Methodology5.2.1 Ambient Air Quality
Ambient air quality will be monitored for SO2, NOx, SPM, PM10 and PM2.5. The
instruments like high volume air samplers and Respirable dust samplers would be used for this
purpose. These parameters will be monitored as mentioned in the monitoring schedule
previously.
5.2.2 Water QualityWater quality analysis will be done quarterly and the monitored parameters include
flow rate, pH, temperature, TDS, Oil and Grease as specified by SPCB from time to time.
5.2.3 Noise MonitoringNoise level will be monitored in working environment, main noise producing sources,
over the boundary and around the mining area.
5.2.4 Green Belt And Afforested AreasContinuous vigilance and monitoring of green belt will be done for performance and
survival rate of the saplings. Watch and ward personnel will properly guard the plantation.
Provision will be made for fertilizers application and watering on schedule.
5.2.5 Socio-EconomicsGravity modeling (traffic density) studies will be done with the objective to know about
the interaction of nearby situated towns. Central Place Hierarchization studies (studies related
to change in amenities/services) would be conducted to know about the socio-economic status
of the villages along with the above-mentioned studies at every five-year interval.
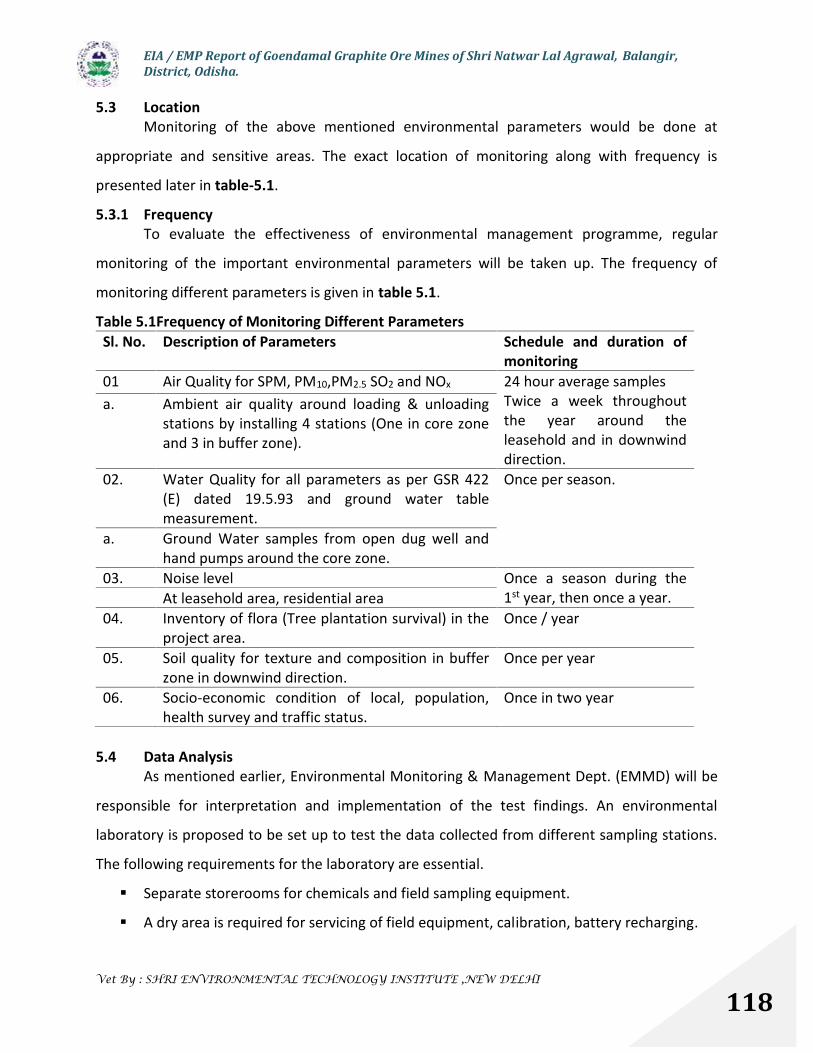
EIA / EMP Report of Goendamal Graphite Ore Mines of Shri Natwar Lal Agrawal, Balangir,District, Odisha.
Vet By : SHRI ENVIRONMENTAL TECHNOLOGY INSTITUTE ,NEW DELHI
118
5.3 LocationMonitoring of the above mentioned environmental parameters would be done at
appropriate and sensitive areas. The exact location of monitoring along with frequency is
presented later in table-5.1.
5.3.1 FrequencyTo evaluate the effectiveness of environmental management programme, regular
monitoring of the important environmental parameters will be taken up. The frequency of
monitoring different parameters is given in table 5.1.
Table 5.1Frequency of Monitoring Different ParametersSl. No. Description of Parameters Schedule and duration of
monitoring01 Air Quality for SPM, PM10,PM2.5 SO2 and NOx 24 hour average samples
Twice a week throughoutthe year around theleasehold and in downwinddirection.
a. Ambient air quality around loading & unloadingstations by installing 4 stations (One in core zoneand 3 in buffer zone).
02. Water Quality for all parameters as per GSR 422(E) dated 19.5.93 and ground water tablemeasurement.
Once per season.
a. Ground Water samples from open dug well andhand pumps around the core zone.
03. Noise level Once a season during the1st year, then once a year.At leasehold area, residential area
04. Inventory of flora (Tree plantation survival) in theproject area.
Once / year
05. Soil quality for texture and composition in bufferzone in downwind direction.
Once per year
06. Socio-economic condition of local, population,health survey and traffic status.
Once in two year
5.4 Data AnalysisAs mentioned earlier, Environmental Monitoring & Management Dept. (EMMD) will be
responsible for interpretation and implementation of the test findings. An environmental
laboratory is proposed to be set up to test the data collected from different sampling stations.
The following requirements for the laboratory are essential.
Separate storerooms for chemicals and field sampling equipment.
A dry area is required for servicing of field equipment, calibration, battery recharging.

EIA / EMP Report of Goendamal Graphite Ore Mines of Shri Natwar Lal Agrawal, Balangir,District, Odisha.
Vet By : SHRI ENVIRONMENTAL TECHNOLOGY INSTITUTE ,NEW DELHI
119
The meteorological station could be located nearby on an open ground, the
responsibility for its maintenance and operation will be with the environmental
laboratory staff.
The equipment required in the laboratory (apart from a comprehensive range of laboratory
glassware, analytical grade chemicals, sampling containers) is listed in table 5.2. The periodicity
of the monitoring will be governed by the OSPCB.
Table 5.2. Equipment Required for Environmental MonitoringSl. No. Particulars Numbers1. High volume sampler (complete with particle size
partitioning)02
2. Hygrometer 013. Air Drying Oven 014. Balance (analytical –electrical) 015. Muffle furnace 016. Rain Gauge 017. pH Meter (Portable Type) 018. Spectrophotometer (non-Scanning type) 019. BOD Incubator 0110. Meteorological Kit (Manual type) 0111. Hot plate 0112. Turbidity Meter 0113. D.O. meter 0114. Conductivity Meter 01
5.5 Reports to Be GeneratedThe EMMD will maintain records of each test and its interpretation so as to formulate
an adequate environmental management plan. The set of records planned to be maintained by
EMMD are given in table 5.3.
Table5.3 Important Records to be maintained by EMMDSl. No. Particulars1. Field monitoring results for air, water, meteorology.2. Inspection records of slope failure, land erosion, drainage, socio-economic
development.3. Format to record/monitor plantation measures4. Nursery records5. Environmental and related standards/ norms6. Records pertaining to statutory consents, approvals.7. Code of actions for pollution control in defined areas
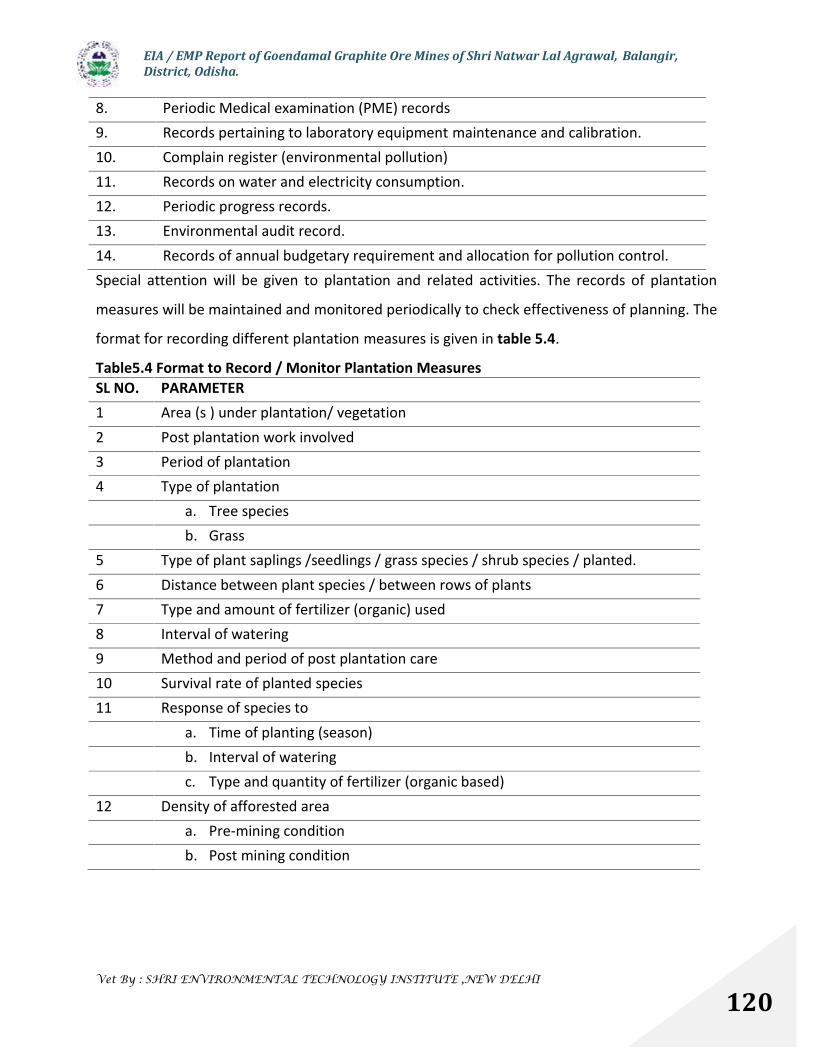
EIA / EMP Report of Goendamal Graphite Ore Mines of Shri Natwar Lal Agrawal, Balangir,District, Odisha.
Vet By : SHRI ENVIRONMENTAL TECHNOLOGY INSTITUTE ,NEW DELHI
120
8. Periodic Medical examination (PME) records9. Records pertaining to laboratory equipment maintenance and calibration.10. Complain register (environmental pollution)11. Records on water and electricity consumption.12. Periodic progress records.13. Environmental audit record.14. Records of annual budgetary requirement and allocation for pollution control.Special attention will be given to plantation and related activities. The records of plantation
measures will be maintained and monitored periodically to check effectiveness of planning. The
format for recording different plantation measures is given in table 5.4.
Table5.4 Format to Record / Monitor Plantation MeasuresSL NO. PARAMETER1 Area (s ) under plantation/ vegetation2 Post plantation work involved3 Period of plantation4 Type of plantation
a. Tree speciesb. Grass
5 Type of plant saplings /seedlings / grass species / shrub species / planted.6 Distance between plant species / between rows of plants7 Type and amount of fertilizer (organic) used8 Interval of watering9 Method and period of post plantation care10 Survival rate of planted species11 Response of species to
a. Time of planting (season)b. Interval of wateringc. Type and quantity of fertilizer (organic based)
12 Density of afforested areaa. Pre-mining conditionb. Post mining condition
EIA / EMP Report of Goendamal Graphite Ore Mines of Shri Natwar Lal Agrawal, Balangir,District, Odisha.
Vet By : SHRI ENVIRONMENTAL TECHNOLOGY INSTITUTE ,NEW DELHI
121
5.6 Updating Of EMPThe action plan of EMP will be updated every year with respect to the results achieved and
proposed activities for next year. Any new regulation considered by OSPCB/CPCB will be taken
care of. Budget sanctions will be made while updating EMP.
5.7 Emergency ProceduresEmergency procedures to be followed in the mining, transportation and dumping process to
prevent an emergency are as follows;
Construction of Rest Shelter for workers
Presence of First Aid equipments to cater any emergency
Provision of clean & safe drinking water in the mining sight
EIA / EMP Report of Goendamal Graphite Ore Mines of Shri Natwar Lal Agrawal, Balangir,District, Odisha.
Vet By : SHRI ENVIRONMENTAL TECHNOLOGY INSTITUTE ,NEW DELHI
122
6.1 Risk Assessment and Disaster Management Plan
Risk is the probability of the harm or likelihood of harmful occurrence being released
and its severity. Environmental risk is a measure of the potential threats to the environment,
life and property and which is more likely to happen in the mining activities. All the type of
developmental activities like mining, industries, developmental projects may face certain type
of hazards which can disrupt the normal activities abruptly and lead to disaster like fires,
inundation, failure of machinery, explosion. A risk assessment has been carried out and the
disaster management plan formulated with an aim of taking precautionary measures to control
the hazard propagation and avert disaster and to take such action after the disaster, which
limits the damage to the minimum.
6.2 Objectives
The objectives of environmental risk assessment are governed by the following, which
excludes natural calamities:
a) To identify the potential hazardous areas so that necessary design safety measures can
be adopted to minimize the probability of accidental events.
b) To identify the potential areas of environmental disaster which can be prevented by
proper design of the installations and its controlled operation.
c) To manage the emergency situation or a disastrous event, if any, from the mining
operation.
The major hazards related to the mining activities are as follows:
Open cast bench slope failure
Accident due to fall of quarry sides
Accident due to machineries
Accident due to explosives
Electrical hazards
CHAPTER 6
ADDITIONALSTUDIES
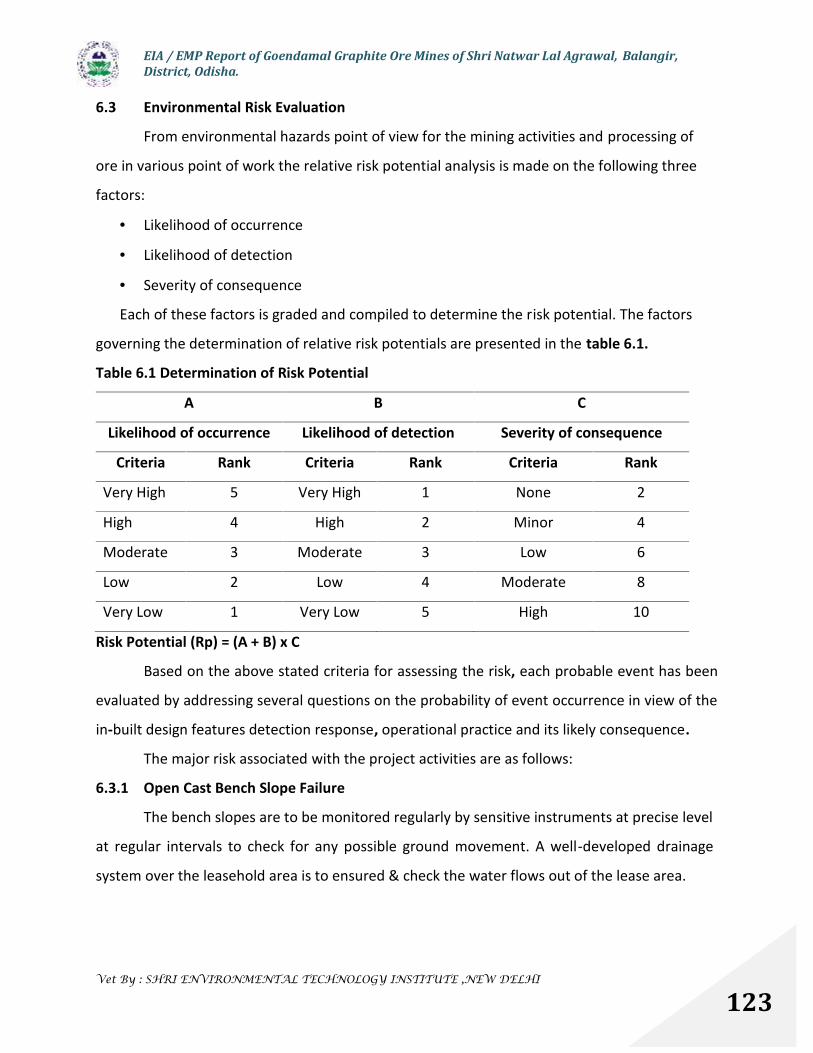
EIA / EMP Report of Goendamal Graphite Ore Mines of Shri Natwar Lal Agrawal, Balangir,District, Odisha.
Vet By : SHRI ENVIRONMENTAL TECHNOLOGY INSTITUTE ,NEW DELHI
123
6.3 Environmental Risk Evaluation
From environmental hazards point of view for the mining activities and processing of
ore in various point of work the relative risk potential analysis is made on the following three
factors:
Likelihood of occurrence
Likelihood of detection
Severity of consequence
Each of these factors is graded and compiled to determine the risk potential. The factors
governing the determination of relative risk potentials are presented in the table 6.1.
Table 6.1 Determination of Risk Potential
A B C
Likelihood of occurrence Likelihood of detection Severity of consequence
Criteria Rank Criteria Rank Criteria Rank
Very High 5 Very High 1 None 2
High 4 High 2 Minor 4
Moderate 3 Moderate 3 Low 6
Low 2 Low 4 Moderate 8
Very Low 1 Very Low 5 High 10
Risk Potential (Rp) = (A + B) x C
Based on the above stated criteria for assessing the risk, each probable event has been
evaluated by addressing several questions on the probability of event occurrence in view of the
in-built design features detection response, operational practice and its likely consequence.
The major risk associated with the project activities are as follows:
6.3.1 Open Cast Bench Slope Failure
The bench slopes are to be monitored regularly by sensitive instruments at precise level
at regular intervals to check for any possible ground movement. A well-developed drainage
system over the leasehold area is to ensured & check the water flows out of the lease area.
EIA / EMP Report of Goendamal Graphite Ore Mines of Shri Natwar Lal Agrawal, Balangir,District, Odisha.
Vet By : SHRI ENVIRONMENTAL TECHNOLOGY INSTITUTE ,NEW DELHI
124
6.3.2 Probable Reasons of Accident
6.3.2.1 Accidents Due To Fall of Sides
Failure to make and keep the quarry sides secure by proper benching, sloping and
keeping benches of adequate height and width.
Undercutting so as to cause dangerous covering.
Inadequate nos. of competent persons for carrying out statutory inspections.
Lack of supervision.
6.3.2.2 Accidents Due To Transportation Machinery (Shovels, Trucks AndDumpers)
During reversal operation
Unauthorized driving of vehicles (mostly by helpers)
Unauthorized riding of vehicles
Attempt to ride moving vehicles
Overloading
Driving vehicles in a intoxicated stage
Vehicles moving in steep gradient or on benches of inadequate width
6.3.2.3 Other Than Transportation Machinery
Use of sub standard equipments
Attempt to clean moving parts of machinery
Non-provision or removal of guards from moving parts of machinery
6.3.2.4 Accidents Due To Use of Explosives
Fly rock throw due to blasting
Inadvertent handling of explosives
6.3.2.5 Miscellaneous
Electrical hazards
Small scale fires
6.4 Disaster Management Plan
To address the probable risk associate with the project activities and to minimize the
risk in different stage the disaster management plan has been framed by the project
EIA / EMP Report of Goendamal Graphite Ore Mines of Shri Natwar Lal Agrawal, Balangir,District, Odisha.
Vet By : SHRI ENVIRONMENTAL TECHNOLOGY INSTITUTE ,NEW DELHI
125
implementing agency. The following precautionary measures shall be taken to prevent any kind
of disaster in the mining operations:
Top edge of opencast workings shall be kept properly fenced off to prevent failing
down of man and animals.
At the final stage, the workings shall be fenced with masonry wall (of not less that
0.13m thick and 1.2m high with a parapet top).
The sides of excavation and the height and width of benches shall be properly
maintained as per mining regulations.
Quarrying shall be done from top downwards. No overhand will be allowed.
Special attention and requisite precautions shall be taken while working in areas of
geological weakness like existence of slip, fault.
Regular dressing of bench sides to ensure safety of workers employed with in 5m of
working face.
Provision of safety belt or rope while persons are at work at the quarry sides or
benches from where there are chances of falling down for more than 1.8m.
Spoil banks not to be retained by artificial means at an angle of repose in excess of its
natural angle.
Drafting and implementation of preventive maintenance schedule for various kinds of
machinery deployed in opencast workings.
Provision of maintenance of properly laid haul roads with parapet wall fencing or
guards and road signs at strategic points.
Precautions against danger while traversing dumpers, excavators. by installing audio-
visual alarms and appointment of spotters.
Transportation of ore within mine workings by vehicles under the direction, supervision
and control of Mine Management only.
Proper maintenance of vehicles and weekly examination by an engineer and daily
examination by a competent person.
Training and retraining (at specified interval) of the machinery operators.
Use of controlled blasting techniques. 500m-radius danger zone to be followed strictly.
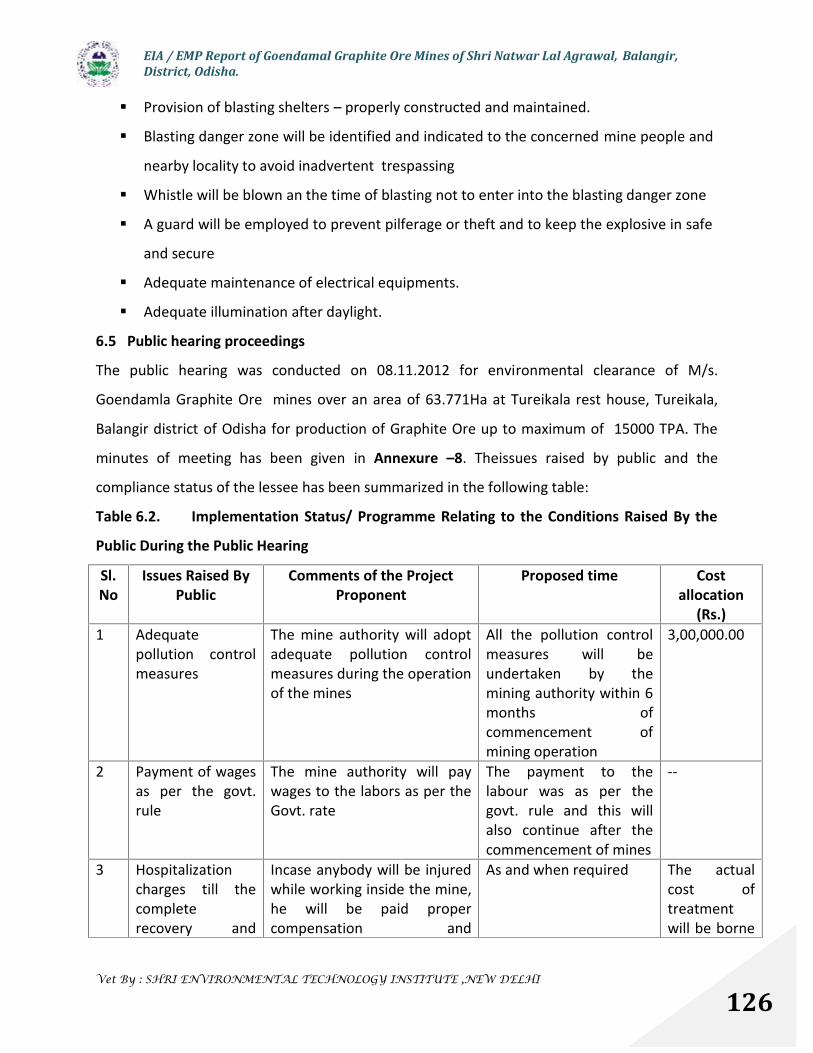
EIA / EMP Report of Goendamal Graphite Ore Mines of Shri Natwar Lal Agrawal, Balangir,District, Odisha.
Vet By : SHRI ENVIRONMENTAL TECHNOLOGY INSTITUTE ,NEW DELHI
126
Provision of blasting shelters – properly constructed and maintained.
Blasting danger zone will be identified and indicated to the concerned mine people and
nearby locality to avoid inadvertent trespassing
Whistle will be blown an the time of blasting not to enter into the blasting danger zone
A guard will be employed to prevent pilferage or theft and to keep the explosive in safe
and secure
Adequate maintenance of electrical equipments.
Adequate illumination after daylight.
6.5 Public hearing proceedings
The public hearing was conducted on 08.11.2012 for environmental clearance of M/s.
Goendamla Graphite Ore mines over an area of 63.771Ha at Tureikala rest house, Tureikala,
Balangir district of Odisha for production of Graphite Ore up to maximum of 15000 TPA. The
minutes of meeting has been given in Annexure –8. Theissues raised by public and the
compliance status of the lessee has been summarized in the following table:
Table 6.2. Implementation Status/ Programme Relating to the Conditions Raised By the
Public During the Public Hearing
Sl.No
Issues Raised ByPublic
Comments of the ProjectProponent
Proposed time Costallocation
(Rs.)1 Adequate
pollution controlmeasures
The mine authority will adoptadequate pollution controlmeasures during the operationof the mines
All the pollution controlmeasures will beundertaken by themining authority within 6months ofcommencement ofmining operation
3,00,000.00
2 Payment of wagesas per the govt.rule
The mine authority will paywages to the labors as per theGovt. rate
The payment to thelabour was as per thegovt. rule and this willalso continue after thecommencement of mines
--
3 Hospitalizationcharges till thecompleterecovery and
Incase anybody will be injuredwhile working inside the mine,he will be paid propercompensation and
As and when required The actualcost oftreatmentwill be borne
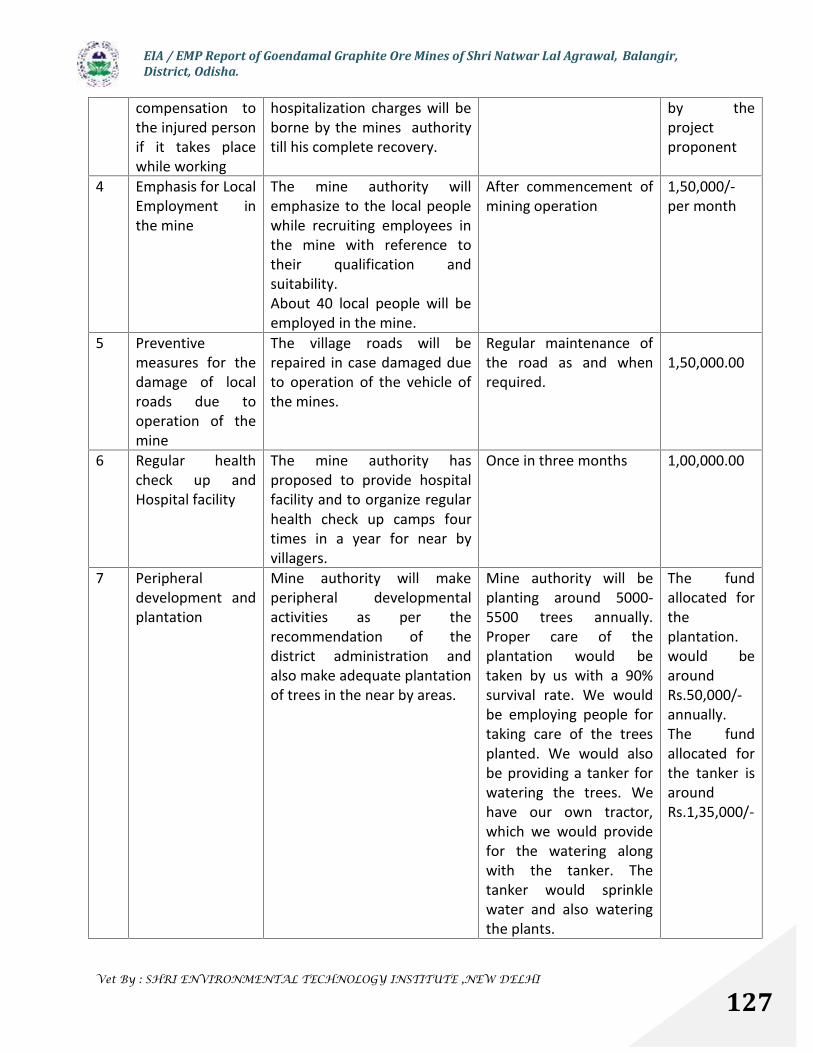
EIA / EMP Report of Goendamal Graphite Ore Mines of Shri Natwar Lal Agrawal, Balangir,District, Odisha.
Vet By : SHRI ENVIRONMENTAL TECHNOLOGY INSTITUTE ,NEW DELHI
127
compensation tothe injured personif it takes placewhile working
hospitalization charges will beborne by the mines authoritytill his complete recovery.
by theprojectproponent
4 Emphasis for LocalEmployment inthe mine
The mine authority willemphasize to the local peoplewhile recruiting employees inthe mine with reference totheir qualification andsuitability.About 40 local people will beemployed in the mine.
After commencement ofmining operation
1,50,000/-per month
5 Preventivemeasures for thedamage of localroads due tooperation of themine
The village roads will berepaired in case damaged dueto operation of the vehicle ofthe mines.
Regular maintenance ofthe road as and whenrequired.
1,50,000.00
6 Regular healthcheck up andHospital facility
The mine authority hasproposed to provide hospitalfacility and to organize regularhealth check up camps fourtimes in a year for near byvillagers.
Once in three months 1,00,000.00
7 Peripheraldevelopment andplantation
Mine authority will makeperipheral developmentalactivities as per therecommendation of thedistrict administration andalso make adequate plantationof trees in the near by areas.
Mine authority will beplanting around 5000-5500 trees annually.Proper care of theplantation would betaken by us with a 90%survival rate. We wouldbe employing people fortaking care of the treesplanted. We would alsobe providing a tanker forwatering the trees. Wehave our own tractor,which we would providefor the watering alongwith the tanker. Thetanker would sprinklewater and also wateringthe plants.
The fundallocated fortheplantation.would bearoundRs.50,000/-annually.The fundallocated forthe tanker isaroundRs.1,35,000/-
EIA / EMP Report of Goendamal Graphite Ore Mines of Shri Natwar Lal Agrawal, Balangir,District, Odisha.
Vet By : SHRI ENVIRONMENTAL TECHNOLOGY INSTITUTE ,NEW DELHI
128
There will be no adverse effect of mining
on the socioeconomic status of the people rather the mining activities helps in improvement in
the standard of living of the people. The mining activity creates the employment opportunity
for the local people and this definitely hike the economic status of the local people. Apart from
overall beneficial impact of the project on the local people of the region, it is felt necessary to
augment facilities in the fields of employment and education, health and social awareness
including concern for environment and eco-system.
7.1 Improvement in the Physical Infrastructure
The mining project in the locality helps in improvement of the physical infrastructure
like roads, vehicles for public transportation, water and sanitation facility, office, staff quarters
and rest shed for the mines worker, safety equipments for the mines workers.
The development of panchayat Road, which passes through the lease area to Kandagarh
furnished by Morrum and earth in subsequent intervals. The plantation work
undertaken and maintain on each side of the same road.
Maintenance of PWD road passing through the lease area from Tureikela to Lathore
7.2 Improvement in the Social Infrastructure
With the commitment of the upcoming mine there will be substantial improvement of
economy of the local people. Amenities such as education and healthcare will be
developing in and around the lease area, which will be available to the local people also.
Development in business activity shall lead to infrastructure development in and around
the project site.
On regular intervals medical camp set up for free medical check up of the local
inhabitants. In these camps First Aid Medicines with casual check up is provided.
CHAPTER 7
PROJECT BENEFITS
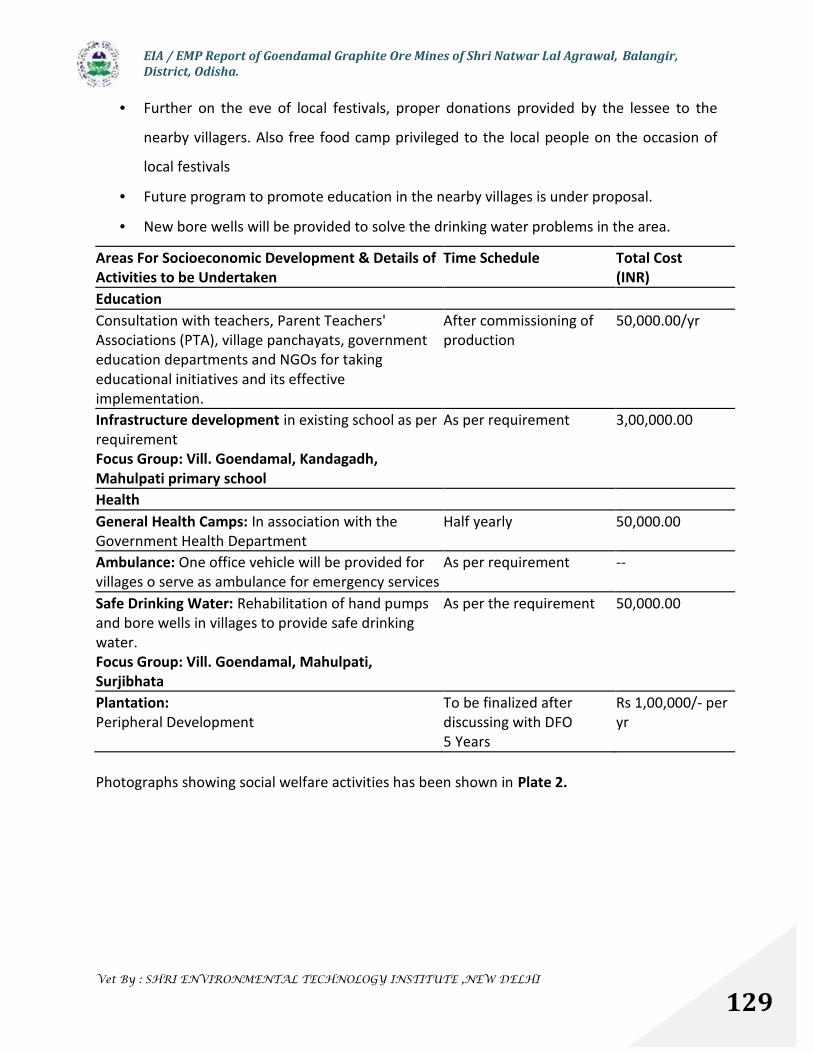
EIA / EMP Report of Goendamal Graphite Ore Mines of Shri Natwar Lal Agrawal, Balangir,District, Odisha.
Vet By : SHRI ENVIRONMENTAL TECHNOLOGY INSTITUTE ,NEW DELHI
129
Further on the eve of local festivals, proper donations provided by the lessee to the
nearby villagers. Also free food camp privileged to the local people on the occasion of
local festivals
Future program to promote education in the nearby villages is under proposal.
New bore wells will be provided to solve the drinking water problems in the area.
Areas For Socioeconomic Development & Details ofActivities to be Undertaken
Time Schedule Total Cost(INR)
EducationConsultation with teachers, Parent Teachers'Associations (PTA), village panchayats, governmenteducation departments and NGOs for takingeducational initiatives and its effectiveimplementation.
After commissioning ofproduction
50,000.00/yr
Infrastructure development in existing school as perrequirementFocus Group: Vill. Goendamal, Kandagadh,Mahulpati primary school
As per requirement 3,00,000.00
HealthGeneral Health Camps: In association with theGovernment Health Department
Half yearly 50,000.00
Ambulance: One office vehicle will be provided forvillages o serve as ambulance for emergency services
As per requirement --
Safe Drinking Water: Rehabilitation of hand pumpsand bore wells in villages to provide safe drinkingwater.Focus Group: Vill. Goendamal, Mahulpati,Surjibhata
As per the requirement 50,000.00
Plantation:Peripheral Development
To be finalized afterdiscussing with DFO5 Years
Rs 1,00,000/- peryr
Photographs showing social welfare activities has been shown in Plate 2.

EIA / EMP Report of Goendamal Graphite Ore Mines of Shri Natwar Lal Agrawal, Balangir,District, Odisha.
Vet By : SHRI ENVIRONMENTAL TECHNOLOGY INSTITUTE ,NEW DELHI
130
Plate 2: Social Welfare Activities
7.3 Employment Potential
With the commencement of the mine there will be substantial improvement of the
income of the people through employment in the mining. The mining activity will able to
create employment opportunity for the local people. There will be creation of employment
opportunity for 93 people in the proposed mining period. Depending upon the population
density, economic status, local enforcement and working experience of the people in the
EIA / EMP Report of Goendamal Graphite Ore Mines of Shri Natwar Lal Agrawal, Balangir,District, Odisha.
Vet By : SHRI ENVIRONMENTAL TECHNOLOGY INSTITUTE ,NEW DELHI
131
nearby village the employment will be provided. The work force of the mine will include 12%
Schedule Caste, 29% Schedule Tribe and 59% general people.
7.4 Other Tangible Benefits
Apart from overall beneficial impact of the project on the local people, the following
measures will be taken up by the mine as periphery development project;
- Planting of economic important trees in the open spaces around the mining lease
area which will be accessible to the local people
- Encouraging to use boiled /cleaned drinking water and mosquito nets
- Development of socio economic status of the people of the project area
- Decrease in the rate of migration from the project villages as the employment
opportunity will be created in the locality.

EIA / EMP Report of Goendamal Graphite Ore Mines of Shri Natwar Lal Agrawal, Balangir,District, Odisha.
Vet By : SHRI ENVIRONMENTAL TECHNOLOGY INSTITUTE ,NEW DELHI
132
The potential impacts the project have been discussed in Chapter 4. It is evident that the
proposed activities will have negligible adverse impact on different environmental
components. To mitigate such adverse impacts, appropriate remedial measurers have been
proposed. An EMP is an implementation plan to mitigate and offset the adverse environmental
impacts of the project and to protect and where possible, enhance the environment. EMP
should be viewed as a legal commitment on the part of the proponent to minimize
environmental impacts. This chapter proposes Environmental Management Plan (EMP), which
will be an integral part of the project for minimizing the adverse impacts and to ensure the
sustainable development of the area.
8.1 Objectives
The EMP has been worked out with the following objectives:
Reclamation of the mined out area where ever and when ever possible.
Restoration of landscape as near to its original form as far as possible, consistent with
the economy of mining operations, keeping in view the drainage pattern, geological
stability, vegetation.
Minimization, mitigation and where possible elimination of degradation in land, quality
of air and water.
Making least disturbance to the water regime and water quality.
Least disruption to the existing basic ecological status in the mining area during mining.
Improvement of the overall flora scenario of the area.
CHAPTER 8
ENVIRONMENTAL MANAGEMENT PLAN
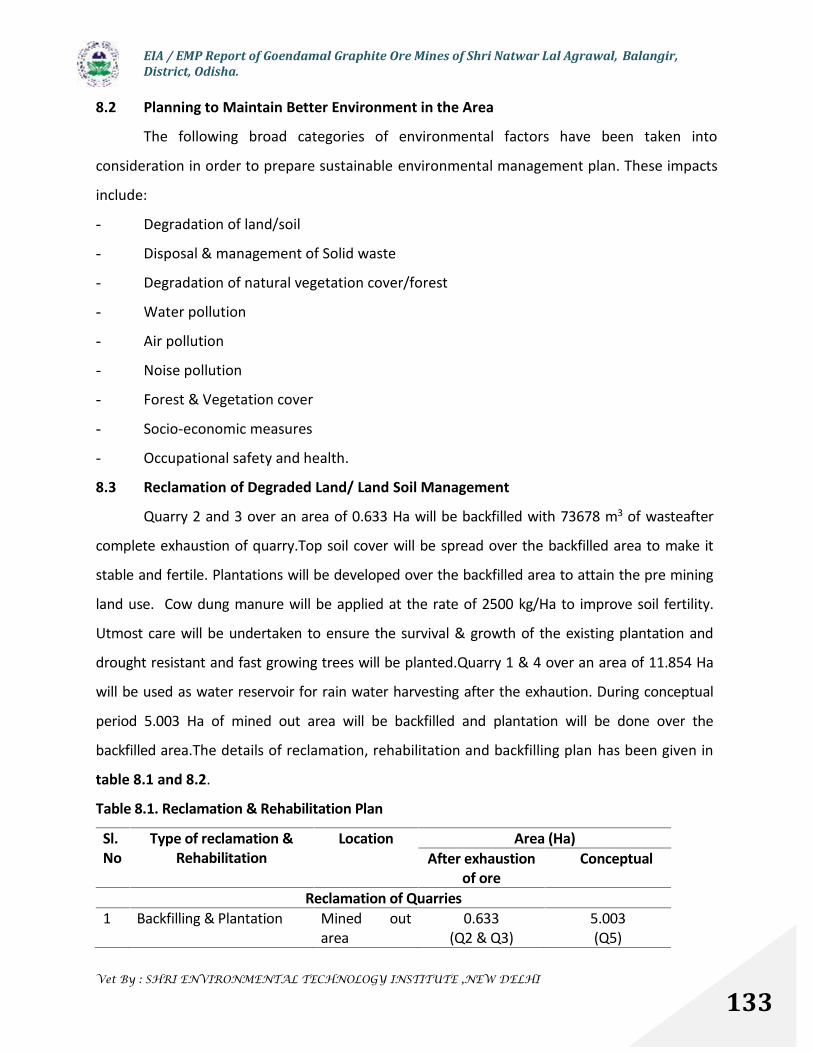
EIA / EMP Report of Goendamal Graphite Ore Mines of Shri Natwar Lal Agrawal, Balangir,District, Odisha.
Vet By : SHRI ENVIRONMENTAL TECHNOLOGY INSTITUTE ,NEW DELHI
133
8.2 Planning to Maintain Better Environment in the Area
The following broad categories of environmental factors have been taken into
consideration in order to prepare sustainable environmental management plan. These impacts
include:
- Degradation of land/soil
- Disposal & management of Solid waste
- Degradation of natural vegetation cover/forest
- Water pollution
- Air pollution
- Noise pollution
- Forest & Vegetation cover
- Socio-economic measures
- Occupational safety and health.
8.3 Reclamation of Degraded Land/ Land Soil Management
Quarry 2 and 3 over an area of 0.633 Ha will be backfilled with 73678 m3 of wasteafter
complete exhaustion of quarry.Top soil cover will be spread over the backfilled area to make it
stable and fertile. Plantations will be developed over the backfilled area to attain the pre mining
land use. Cow dung manure will be applied at the rate of 2500 kg/Ha to improve soil fertility.
Utmost care will be undertaken to ensure the survival & growth of the existing plantation and
drought resistant and fast growing trees will be planted.Quarry 1 & 4 over an area of 11.854 Ha
will be used as water reservoir for rain water harvesting after the exhaution. During conceptual
period 5.003 Ha of mined out area will be backfilled and plantation will be done over the
backfilled area.The details of reclamation, rehabilitation and backfilling plan has been given in
table 8.1 and 8.2.
Table 8.1. Reclamation & Rehabilitation Plan
Sl.No
Type of reclamation &Rehabilitation
Location Area (Ha)After exhaustion
of oreConceptual
Reclamation of Quarries1 Backfilling & Plantation Mined out
area0.633
(Q2 & Q3)5.003(Q5)
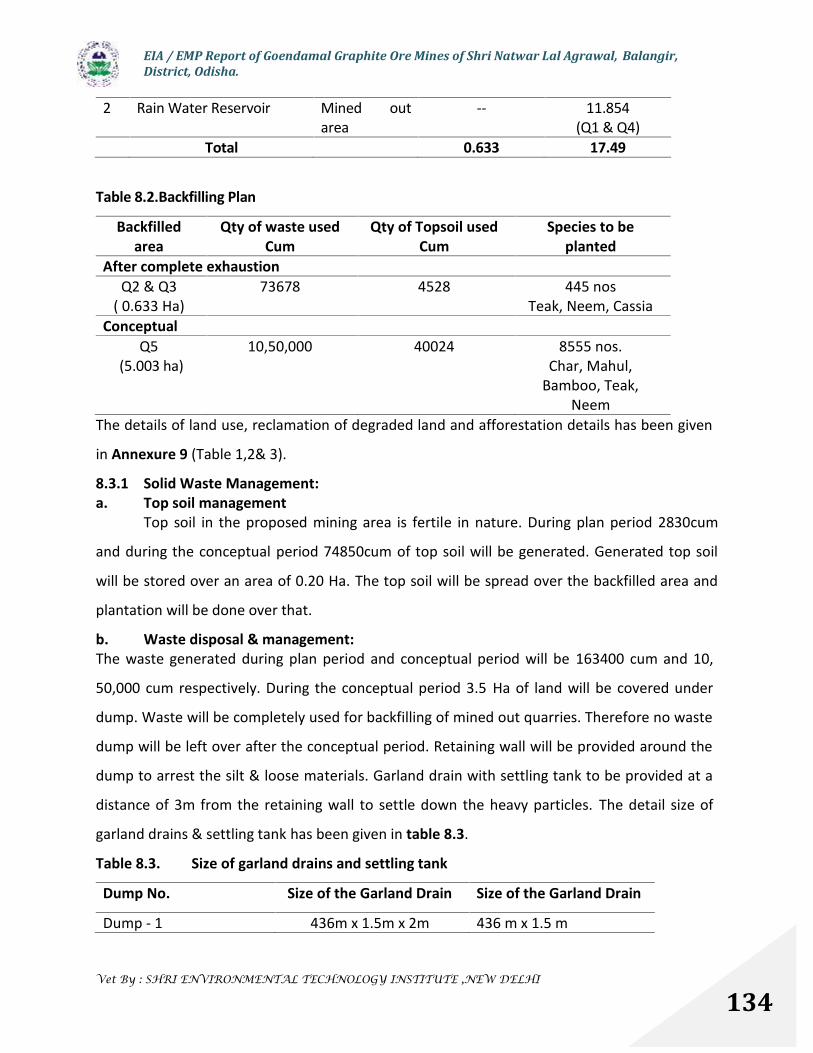
EIA / EMP Report of Goendamal Graphite Ore Mines of Shri Natwar Lal Agrawal, Balangir,District, Odisha.
Vet By : SHRI ENVIRONMENTAL TECHNOLOGY INSTITUTE ,NEW DELHI
134
2 Rain Water Reservoir Mined outarea
-- 11.854(Q1 & Q4)
Total 0.633 17.49
Table 8.2.Backfilling Plan
Backfilledarea
Qty of waste usedCum
Qty of Topsoil usedCum
Species to beplanted
After complete exhaustionQ2 & Q3
( 0.633 Ha)73678 4528 445 nos
Teak, Neem, CassiaConceptual
Q5(5.003 ha)
10,50,000 40024 8555 nos.Char, Mahul,
Bamboo, Teak,Neem
The details of land use, reclamation of degraded land and afforestation details has been given
in Annexure 9 (Table 1,2& 3).
8.3.1 Solid Waste Management:a. Top soil management
Top soil in the proposed mining area is fertile in nature. During plan period 2830cum
and during the conceptual period 74850cum of top soil will be generated. Generated top soil
will be stored over an area of 0.20 Ha. The top soil will be spread over the backfilled area and
plantation will be done over that.
b. Waste disposal & management:The waste generated during plan period and conceptual period will be 163400 cum and 10,
50,000 cum respectively. During the conceptual period 3.5 Ha of land will be covered under
dump. Waste will be completely used for backfilling of mined out quarries. Therefore no waste
dump will be left over after the conceptual period. Retaining wall will be provided around the
dump to arrest the silt & loose materials. Garland drain with settling tank to be provided at a
distance of 3m from the retaining wall to settle down the heavy particles. The detail size of
garland drains & settling tank has been given in table 8.3.
Table 8.3. Size of garland drains and settling tank
Dump No. Size of the Garland Drain Size of the Garland Drain
Dump - 1 436m x 1.5m x 2m 436 m x 1.5 m
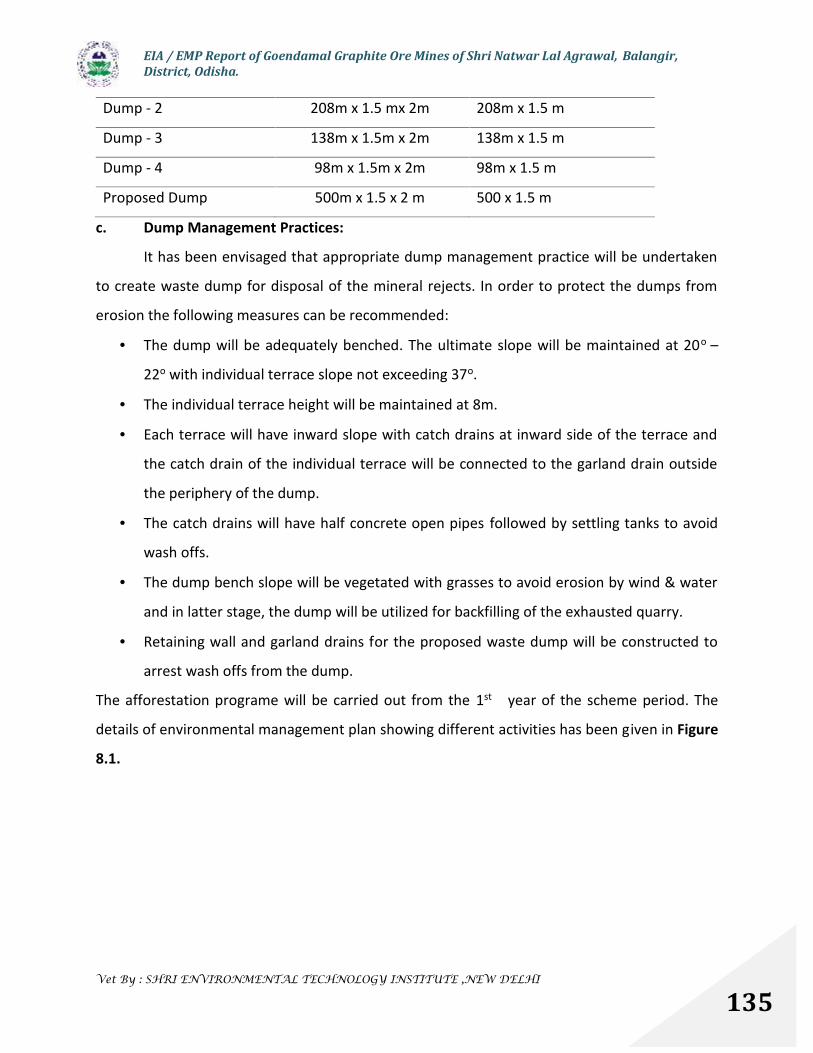
EIA / EMP Report of Goendamal Graphite Ore Mines of Shri Natwar Lal Agrawal, Balangir,District, Odisha.
Vet By : SHRI ENVIRONMENTAL TECHNOLOGY INSTITUTE ,NEW DELHI
135
Dump - 2 208m x 1.5 mx 2m 208m x 1.5 m
Dump - 3 138m x 1.5m x 2m 138m x 1.5 m
Dump - 4 98m x 1.5m x 2m 98m x 1.5 m
Proposed Dump 500m x 1.5 x 2 m 500 x 1.5 m
c. Dump Management Practices:
It has been envisaged that appropriate dump management practice will be undertaken
to create waste dump for disposal of the mineral rejects. In order to protect the dumps from
erosion the following measures can be recommended:
The dump will be adequately benched. The ultimate slope will be maintained at 20o –
22o with individual terrace slope not exceeding 37o.
The individual terrace height will be maintained at 8m.
Each terrace will have inward slope with catch drains at inward side of the terrace and
the catch drain of the individual terrace will be connected to the garland drain outside
the periphery of the dump.
The catch drains will have half concrete open pipes followed by settling tanks to avoid
wash offs.
The dump bench slope will be vegetated with grasses to avoid erosion by wind & water
and in latter stage, the dump will be utilized for backfilling of the exhausted quarry.
Retaining wall and garland drains for the proposed waste dump will be constructed to
arrest wash offs from the dump.
The afforestation programe will be carried out from the 1st year of the scheme period. The
details of environmental management plan showing different activities has been given in Figure
8.1.
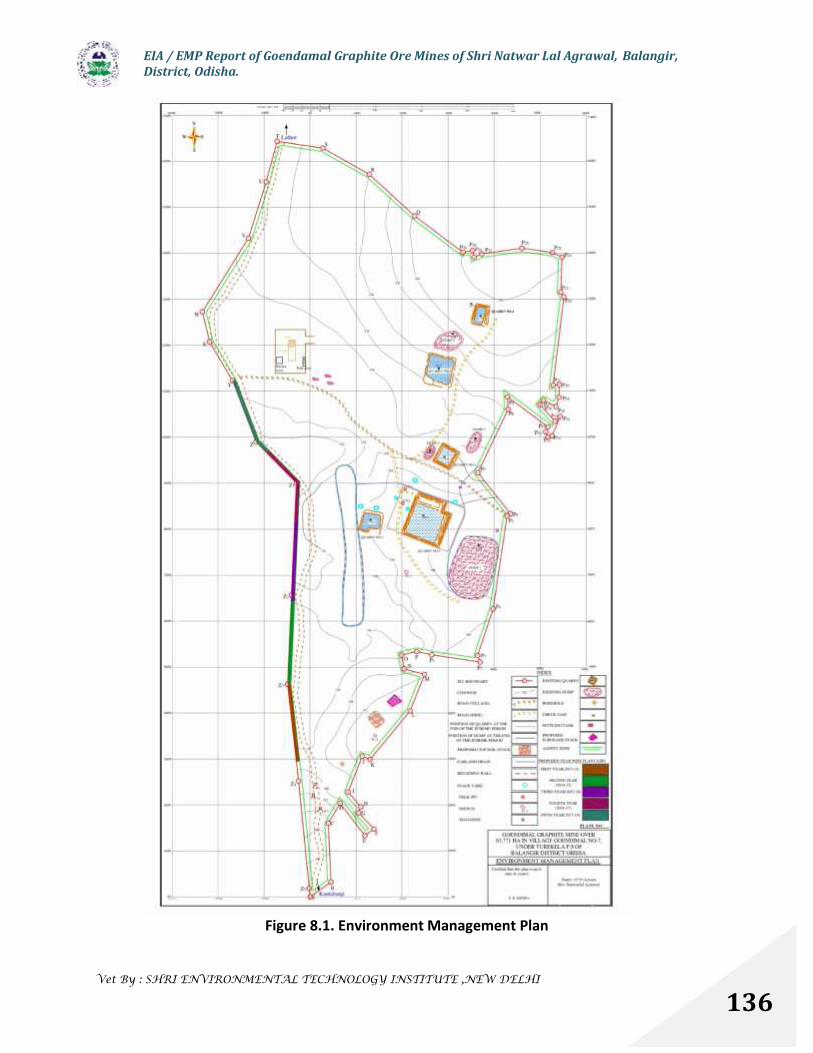
EIA / EMP Report of Goendamal Graphite Ore Mines of Shri Natwar Lal Agrawal, Balangir,District, Odisha.
Vet By : SHRI ENVIRONMENTAL TECHNOLOGY INSTITUTE ,NEW DELHI
136
Figure 8.1. Environment Management Plan
EIA / EMP Report of Goendamal Graphite Ore Mines of Shri Natwar Lal Agrawal, Balangir,District, Odisha.
Vet By : SHRI ENVIRONMENTAL TECHNOLOGY INSTITUTE ,NEW DELHI
137
8.4 Water Management & Water Pollution Control
8.41 Surface Water Management
No perennial water body is present in the close proximity to the mine. Surface runoff
around the quarries and dumps near the natural drains will follow the garland drains to arrest
the eroded sediments, which shall pass through a series of garland drains before being
discharged to the natural drainage system. This practice shall be carried out only in rainy season
at the time of heavy rains. Other wise the water from garland drains shall be collected in
reservoirs after settling and shall be used for afforestation uses. The sediments thus collected
shall be analyzed for hazardous substances. Quarterly monitoring of water quality will be done
and for this purpose water quality monitoring station will be erected.
The pumped out water from the mining pit will be guided through channel and this
water will not cause any adverse impact on the water regime of the area. A boulder bund will
be provided beyond the toe of the waste dump which retains dump wash offs during rains. At a
distance of 3-4m beyond the retaining wall, a garland drain with settling tank (5mx15mx5m) is
provided to allow slime and silt to settle down. There after only clean water is allowed to pass
to the adjacent area.
8.4.2 Ground Water Management
The ground water table of the area is 10 m below ground level. So seepage of water is
likely to be encountered when the mining activities continue below this depth. The ground
water occurs at 316 mRL and mining will continue upto 305 mRL. During the conceptual period
mining activities will intersect the sub surface water regime. About 54 cum/d of sub surface
water will be generated. Two numbers of 15 HP pumps will be used to pump out the mine
water for 6 hours daily for draining of the quarried area through the peripheral drains. The
peripheral drain is provided with settling tank and clean water will be stored and used for
miscellaneous purpose. Excess water will be provided to the farmers for agriculture in the
surrounding areas. The water is neither acidic nor alkaline in nature and it does contain any
harmful chemicals. Hence treatment of water other than desilting is not required.The project
got clearance from central ground water board for water requirement of 64 cu.m/ day includes
54 cum/day of mine seepage water.

EIA / EMP Report of Goendamal Graphite Ore Mines of Shri Natwar Lal Agrawal, Balangir,District, Odisha.
Vet By : SHRI ENVIRONMENTAL TECHNOLOGY INSTITUTE ,NEW DELHI
138
8.4.3 Rain Water Harvesting
In the first phase Quarry no. 1 & 4 will be dedicated for rainwater storage reservoir.
Following considerations are made for RWH;
The total quarry area = 4095 Sq.m.
Total roof top area of the office building = 1000 Sq.m
Annual avg. rainfalls: 1384mm (Historical data of 10yrs)
Hourly rainfall of peak intensity: 50 mm
15 minutes rainfall of peak intensity: 22 mm
Rate of rainfall: 0.022 m/hr
Runoff Coefficient for roof top (corrugated): 0.70
Coefficient of evaporation, spillage and first flush wastage: 0.80
8.4.3.1 Harvestable rain water from the ML area
Corrugated roof top (1000 sq m)
1000 x 1.384 = 1384 cum
Possible harvestable quantity: 1384 x 0.70 x 0.80 = 775 cum
Quarry Areas (4095 sq m)
4095 x 1.384= 5667 cum
Possible harvestable quantity: 5667 x 0.80 = 4533 cum
8.4.3.2 Storage facilities
For Roof top RWH (concrete)
Through rain barrels of capacity 3 x 1000 lts
Assuming daily use of 3 cum per day
8.5 Air Pollution ControlIn order to reduce fugitive dust emissions during loading/unloading of overburden and
topsoil, water will be sprayed. Topsoil banks and overburden dumps will be periodically wetted
to reduce fugitive dust generation.
Haul roads are expected to be the major source of fugitive dust. To reduce dust from
haul roads the following measures will be taken:
EIA / EMP Report of Goendamal Graphite Ore Mines of Shri Natwar Lal Agrawal, Balangir,District, Odisha.
Vet By : SHRI ENVIRONMENTAL TECHNOLOGY INSTITUTE ,NEW DELHI
139
The unmetalled hauls roads shall be adequately compacted before being put into use.
Periodically water will be sprinkled on these roads in amounts just sufficient to wet the
surface. Water will also be sprinkled on stacks of topsoil.
Overloading of transport equipment shall be prevented in order to stop spillage.
Wherever possible by the sides of haul roads, trees will be planted.
Following control measures are suggested for controlling the emission of particulate
matter to permissible limit.
Table 8.4. Suggested Pollution Control Measures
Areas of dust generation Suggested pollution control measuresFaces/sites before andafter blasting Faces/siteswhile loading
Dust suppression systems (water spraying)
Drill machines Dust extraction systemsUse of sharp drill bits for drilling holes and drills with waterflushing systems (wet drilling) to reduce dust generation.
Stock piles Mist spraysHaul roads Trucks to be covered with tarpaulin and over filling of tippers
to be strictly avoided maintenance of haulage road onregular basis.Regular water spraying on haulage roads(Twice daily)
8.6 Noise Pollution Control
Noise level shall be maintained below 70 dB (A) in the working zone (for 8 hr. Exposure).
The mitigation measures for noise are of following types:
Prevention at source
Attenuation in transmission path and
Protective measures on work environment.
The following measures will be taken up to reduce the noise level:
Diesel powered machineries, which are major; source of noise in open cast environment
will be properly maintained. Scheduled to prevent undesirable noise. Attention shall be
paid towards rigorous maintenance of the silencer of the diesel engines.
Static diesel engines shall be housed as far as possible. If possible they will be placed on
vibration isolators.
EIA / EMP Report of Goendamal Graphite Ore Mines of Shri Natwar Lal Agrawal, Balangir,District, Odisha.
Vet By : SHRI ENVIRONMENTAL TECHNOLOGY INSTITUTE ,NEW DELHI
140
Truck drivers will be issued ear plugs and ear muffs. Duty of the operators of the noisy
machineries will be regulated to keep their noise exposures levels with in the limits
Green belt will be developed around the office building and mine to reduce noise
exposure level.
8.7 Protective measures for ground vibration/ Air blast caused by Blasting8.7.1 Control Measures for Vibration
Blast design can be altered to result in reduced levels of ground vibration by:
Reducing the maximum instantaneous charge (MIC) by using delays, reduced hole
diameter and/or deck loading.
Blast vibration research shows the level of ground vibration is proportional to the Scaled
Distance (vibration) which is defined as the distance to the blast divided by the square
root of the MIC. So, at a given distance, reducing the MIC will generally result in lower
levels of vibration.
Changing the burden and spacing by: altering the drilling pattern, and/or delay layout,
or altering the hole inclination.
Exercise strict control over spacing and orienting all blast drill holes.
Establish times of blasting to suit local conditions.
8.7.2 Control Measures for Noise Selecting low noise plant and equipment incorporating available noise control kits.
Optimum placement of waste dumps, location of haul roads, location of fixed plant
loading hoppers. Waste dumps, stockpiles can be used to shield fixed items of plant
which generate noise.
Provision of sound walls and acoustical screening.
Also, earth embankments can often be constructed from overburden, from stripping
and initial excavation works and provide an alternative means of stockpiling soil for
future rehabilitation works.
Incorporating optimum buffer zones and setback distances. This is only of use where
large distances are involved. In general, doubling the distance between the source and
receiver will result in a 6 dBA reduction in noise level.
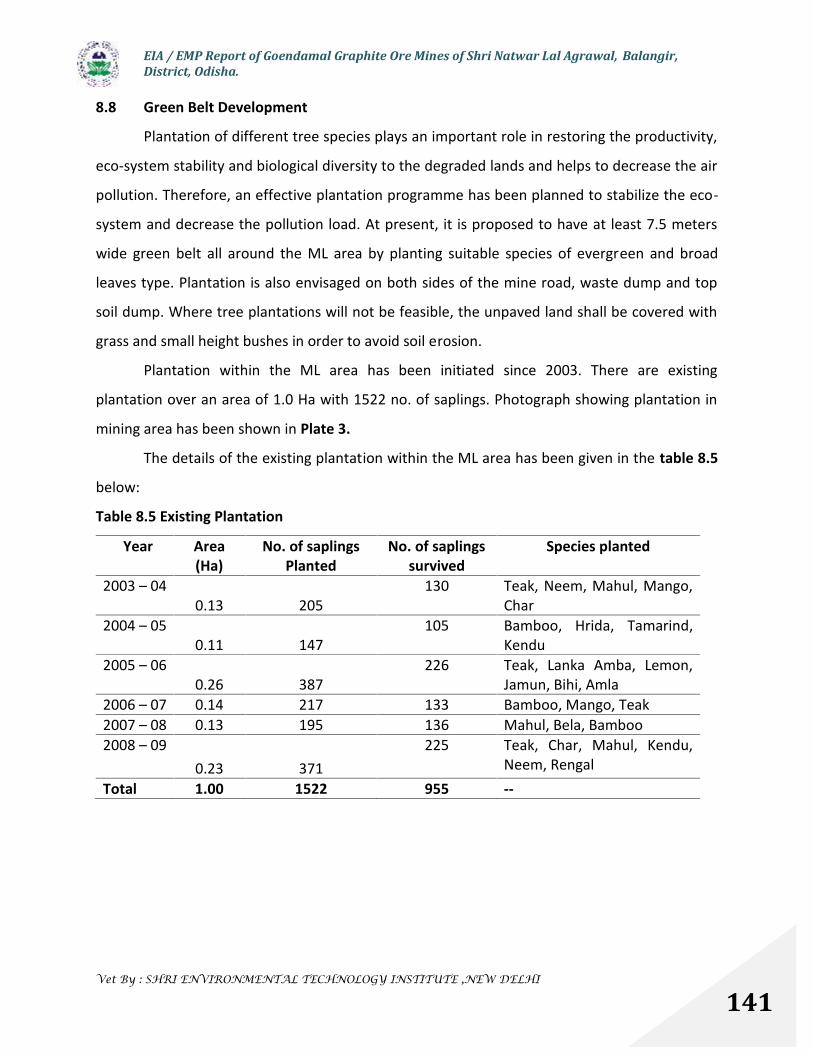
EIA / EMP Report of Goendamal Graphite Ore Mines of Shri Natwar Lal Agrawal, Balangir,District, Odisha.
Vet By : SHRI ENVIRONMENTAL TECHNOLOGY INSTITUTE ,NEW DELHI
141
8.8 Green Belt Development
Plantation of different tree species plays an important role in restoring the productivity,
eco-system stability and biological diversity to the degraded lands and helps to decrease the air
pollution. Therefore, an effective plantation programme has been planned to stabilize the eco-
system and decrease the pollution load. At present, it is proposed to have at least 7.5 meters
wide green belt all around the ML area by planting suitable species of evergreen and broad
leaves type. Plantation is also envisaged on both sides of the mine road, waste dump and top
soil dump. Where tree plantations will not be feasible, the unpaved land shall be covered with
grass and small height bushes in order to avoid soil erosion.
Plantation within the ML area has been initiated since 2003. There are existing
plantation over an area of 1.0 Ha with 1522 no. of saplings. Photograph showing plantation in
mining area has been shown in Plate 3.
The details of the existing plantation within the ML area has been given in the table 8.5
below:
Table 8.5 Existing Plantation
Year Area(Ha)
No. of saplingsPlanted
No. of saplingssurvived
Species planted
2003 – 040.13 205
130 Teak, Neem, Mahul, Mango,Char
2004 – 050.11 147
105 Bamboo, Hrida, Tamarind,Kendu
2005 – 060.26 387
226 Teak, Lanka Amba, Lemon,Jamun, Bihi, Amla
2006 – 07 0.14 217 133 Bamboo, Mango, Teak2007 – 08 0.13 195 136 Mahul, Bela, Bamboo2008 – 09
0.23 371225 Teak, Char, Mahul, Kendu,
Neem, RengalTotal 1.00 1522 955 --

EIA / EMP Report of Goendamal Graphite Ore Mines of Shri Natwar Lal Agrawal, Balangir,District, Odisha.
Vet By : SHRI ENVIRONMENTAL TECHNOLOGY INSTITUTE ,NEW DELHI
142
Plate 3: Plantation within ML Area
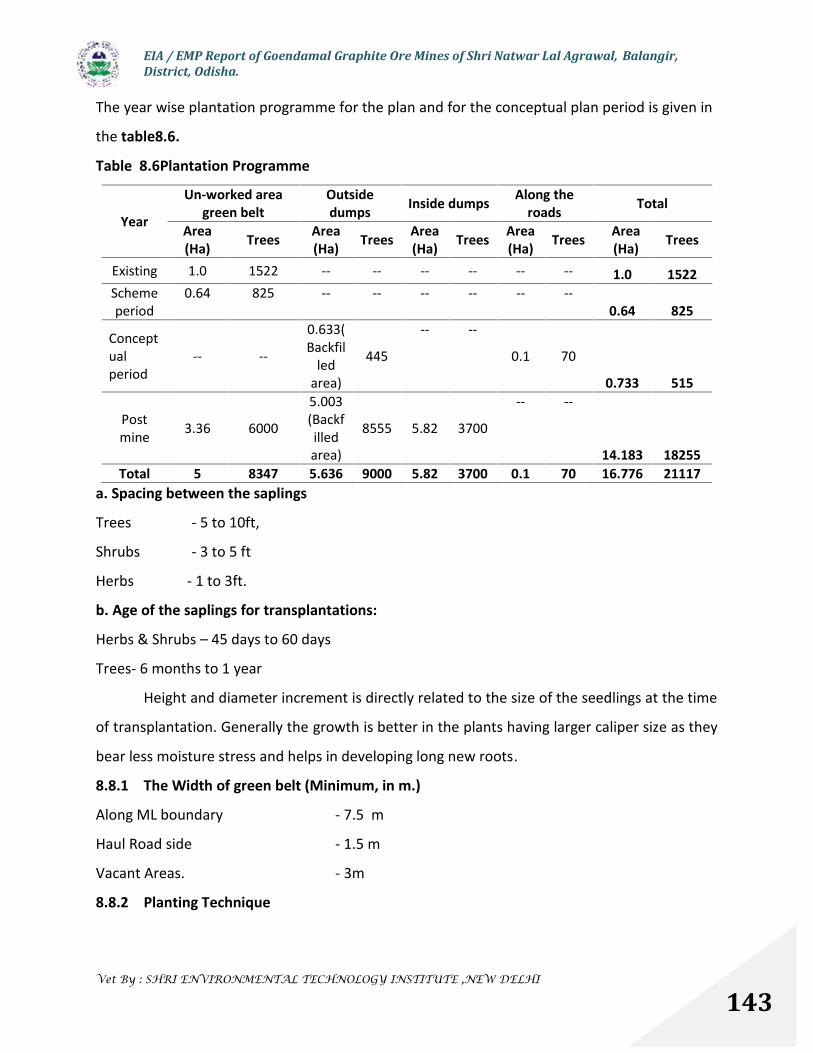
EIA / EMP Report of Goendamal Graphite Ore Mines of Shri Natwar Lal Agrawal, Balangir,District, Odisha.
Vet By : SHRI ENVIRONMENTAL TECHNOLOGY INSTITUTE ,NEW DELHI
143
The year wise plantation programme for the plan and for the conceptual plan period is given in
the table8.6.
Table 8.6Plantation Programme
Year
Un-worked areagreen belt
Outsidedumps Inside dumps Along the
roads Total
Area(Ha) Trees Area
(Ha) Trees Area(Ha) Trees Area
(Ha) Trees Area(Ha) Trees
Existing 1.0 1522 -- -- -- -- -- -- 1.0 1522Schemeperiod
0.64 825 -- -- -- -- -- --0.64 825
Conceptualperiod
-- --
0.633(Backfil
ledarea)
445
-- --
0.1 70
0.733 515
Postmine 3.36 6000
5.003(Backfilledarea)
8555 5.82 3700
-- --
14.183 18255Total 5 8347 5.636 9000 5.82 3700 0.1 70 16.776 21117
a. Spacing between the saplings
Trees - 5 to 10ft,
Shrubs - 3 to 5 ft
Herbs - 1 to 3ft.
b. Age of the saplings for transplantations:
Herbs & Shrubs – 45 days to 60 days
Trees- 6 months to 1 year
Height and diameter increment is directly related to the size of the seedlings at the time
of transplantation. Generally the growth is better in the plants having larger caliper size as they
bear less moisture stress and helps in developing long new roots.
8.8.1 The Width of green belt (Minimum, in m.)
Along ML boundary - 7.5 m
Haul Road side - 1.5 m
Vacant Areas. - 3m
8.8.2 Planting Technique

EIA / EMP Report of Goendamal Graphite Ore Mines of Shri Natwar Lal Agrawal, Balangir,District, Odisha.
Vet By : SHRI ENVIRONMENTAL TECHNOLOGY INSTITUTE ,NEW DELHI
144
The identified sites were prepared and made ready for taking up plantation in the
month of March and April. Pitting work done at a space of 10 X10 mts of 0.75 X 0.75 X 0.75.
After the on set of Monsoon (July) the plantation has been taken up and the fencing to each
plant with the locally available material like thorny bushes has been done. Trained watch and
wards will be appointed and issued instructions to protect the plantation. Every plantation
location has been provided with peripheral Trench (PPT) all around the site.
Apart from the green belt, there will be plantation on the reclaimed area i.e. mining
quarries, overburden and top soil dumps.
Table 8.7. Proposed species for plantation
Green BeltName of the Plant Local NameAzadirachta indica NeemSimarrouba sps SimaroubaCedrus deodara DebdaruDelonix regia KrushnachudaMangifera indica AmbaSyzygium cuminii JamunAilanthus excellus MahaneemAnthocephalus kadamba KadambaAlstonia scholaris ChatianaSaraca asoca AsokaLawsonia innermis ManjuatiJatropha sps BaigabaCallistemon linniaris Bottle brush
Dumping Area Nerium oleander KaniarTaburna montana TagaraBougainvillea species BougainvilleaCalestemon liniaris Bottle BrushDypsis lutescems ArecaPhoenix canriensis ArecaRavenala madagaseariensis Travellers palmTaburna montana Tagara
8.9 Socio-economic Activities
The following CSR activities have been undertaken by the lessee in the area;
The development of panchayat Road, which passes through the lease area to Kandagarh
furnished by Morrum and earth in subsequent intervals. The plantation work
undertaken and maintain on each side of the same road.

EIA / EMP Report of Goendamal Graphite Ore Mines of Shri Natwar Lal Agrawal, Balangir,District, Odisha.
Vet By : SHRI ENVIRONMENTAL TECHNOLOGY INSTITUTE ,NEW DELHI
145
Maintenance of PWD road passing through the lease area from Tureikela to Lathore
On regular intervals medical camp set up for free medical check up of the local
inhabitants. In these camps First Aid Medicines with casual check up is provided.
Further on the eve of local festivals, proper donations provided by the lessee to the
nearby villagers. Also free food camp privileged to the local people on the occasion of
local festivals
Future program to promote education in the nearby villages is under proposal.
New bore wells will be provided to solve the drinking water problems in the area.
8.10 Occupational Health & Safety
General health check up for employees is being conducted once in a year.
8.10.1 Process Specific Safety and Health
The following occupational safety and health measures will be adopted to ensure that
the employees are not exposed to pollutants;
i) Medical Surveillance
All employees will be medically examined by a qualified Medical Officer once in two
years to ascertain the health status of all workers in respect of Occupational Heath hazard to
which they are exposed.
List of Tests to be conducted and recorded every two years
1. Eyes 8. Ears
2. Respirator system 9. Circulatory system (Blood Pressure)
3. Abdomen 10. Nervous System
4. Locomotors System 11. Skin
5. Hernia 12. Hydrocele
6. Urine 13. Blood
7. Audiogram 14. Chest X Ray
ii) Medical examinations:
The following medical check up/examinations should be done:
1. X-ray of chest
2. Pulmonary Functiontest

EIA / EMP Report of Goendamal Graphite Ore Mines of Shri Natwar Lal Agrawal, Balangir,District, Odisha.
Vet By : SHRI ENVIRONMENTAL TECHNOLOGY INSTITUTE ,NEW DELHI
146
3. Cardio vascular assessment
4. Audiometry
5. Occupational health assessment
iii) Schedule for Medical Examination
The following schedule for medical checkup will be followed:
1. Comprehensive Pre-employment medical check up for all employees.
2. General check up of all employees once every year
3. Chest X- Ray for all employees once every 3 years.
4. Pulmonary function test for all employees once every 6 months.
5. Clinical examination of all employees once every 6 months.
6. Comprehensive medical examination of all the employees after retirement and all those
employees with more than 5 years of service leaving the company.
7. Local hospitals and Govt. health monitoring system will be engaged.
8. All safety gears will be provided to workers and care will be taken that these are used
properly by them. All safety norms will be followed.
A health check up camp for the employees of the mines has been conducted by Utkal Poly
Clinic, Bhubaneswar and the detail is as follows:
DISEASES TOTAL NOS. OF CASES:10
IME PME
No. of cases:00 No. of Cases :10
Nos. (%) Nos. (%)
Hypertension 00 00.00 01 10.00
Diabetes/ High Blood Sugar 00 00.00 00 00.00
Hearing Problems 00 00.00 00 00.00
Noise Induced Hearing Loss 00 00.00 00 00.00
Eye problems 00 00.00 00 00.00
Heart Diseases 00 00.00 00 00.00
Hydrocele 00 00.00 00 00.00
Hernia 00 00.00 00 00.00
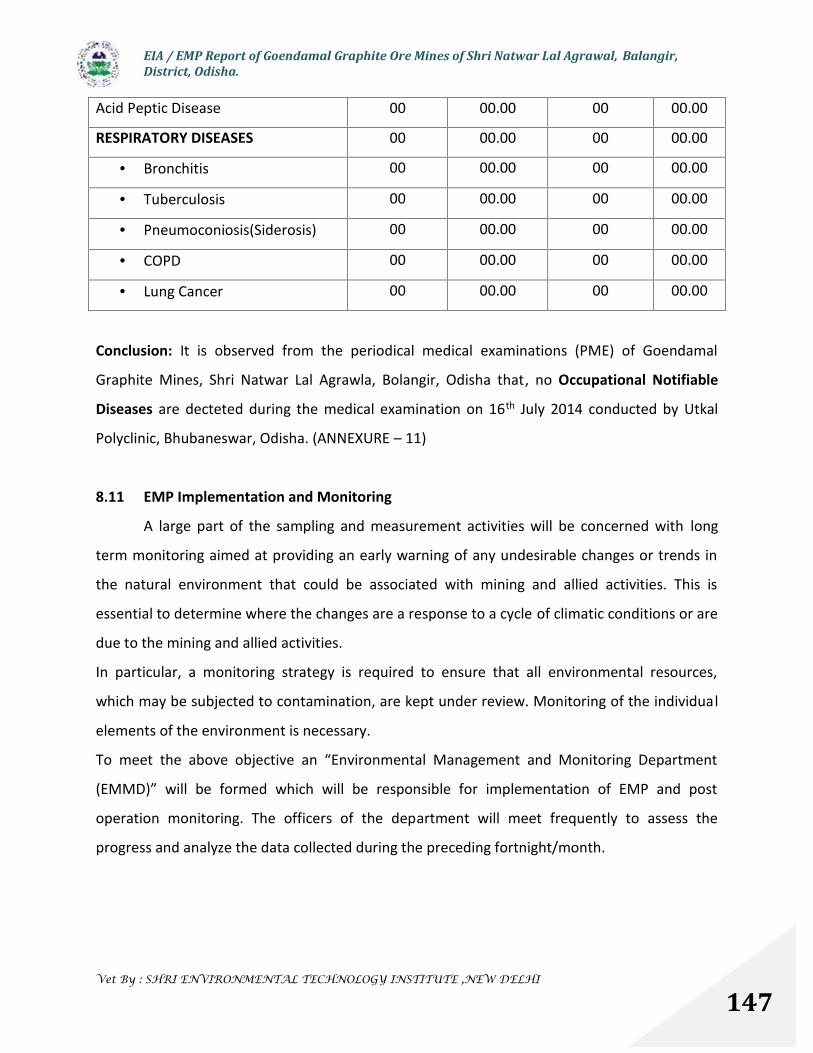
EIA / EMP Report of Goendamal Graphite Ore Mines of Shri Natwar Lal Agrawal, Balangir,District, Odisha.
Vet By : SHRI ENVIRONMENTAL TECHNOLOGY INSTITUTE ,NEW DELHI
147
Acid Peptic Disease 00 00.00 00 00.00
RESPIRATORY DISEASES 00 00.00 00 00.00
Bronchitis 00 00.00 00 00.00
Tuberculosis 00 00.00 00 00.00
Pneumoconiosis(Siderosis) 00 00.00 00 00.00
COPD 00 00.00 00 00.00
Lung Cancer 00 00.00 00 00.00
Conclusion: It is observed from the periodical medical examinations (PME) of Goendamal
Graphite Mines, Shri Natwar Lal Agrawla, Bolangir, Odisha that, no Occupational Notifiable
Diseases are decteted during the medical examination on 16th July 2014 conducted by Utkal
Polyclinic, Bhubaneswar, Odisha. (ANNEXURE – 11)
8.11 EMP Implementation and Monitoring
A large part of the sampling and measurement activities will be concerned with long
term monitoring aimed at providing an early warning of any undesirable changes or trends in
the natural environment that could be associated with mining and allied activities. This is
essential to determine where the changes are a response to a cycle of climatic conditions or are
due to the mining and allied activities.
In particular, a monitoring strategy is required to ensure that all environmental resources,
which may be subjected to contamination, are kept under review. Monitoring of the individual
elements of the environment is necessary.
To meet the above objective an “Environmental Management and Monitoring Department
(EMMD)” will be formed which will be responsible for implementation of EMP and post
operation monitoring. The officers of the department will meet frequently to assess the
progress and analyze the data collected during the preceding fortnight/month.
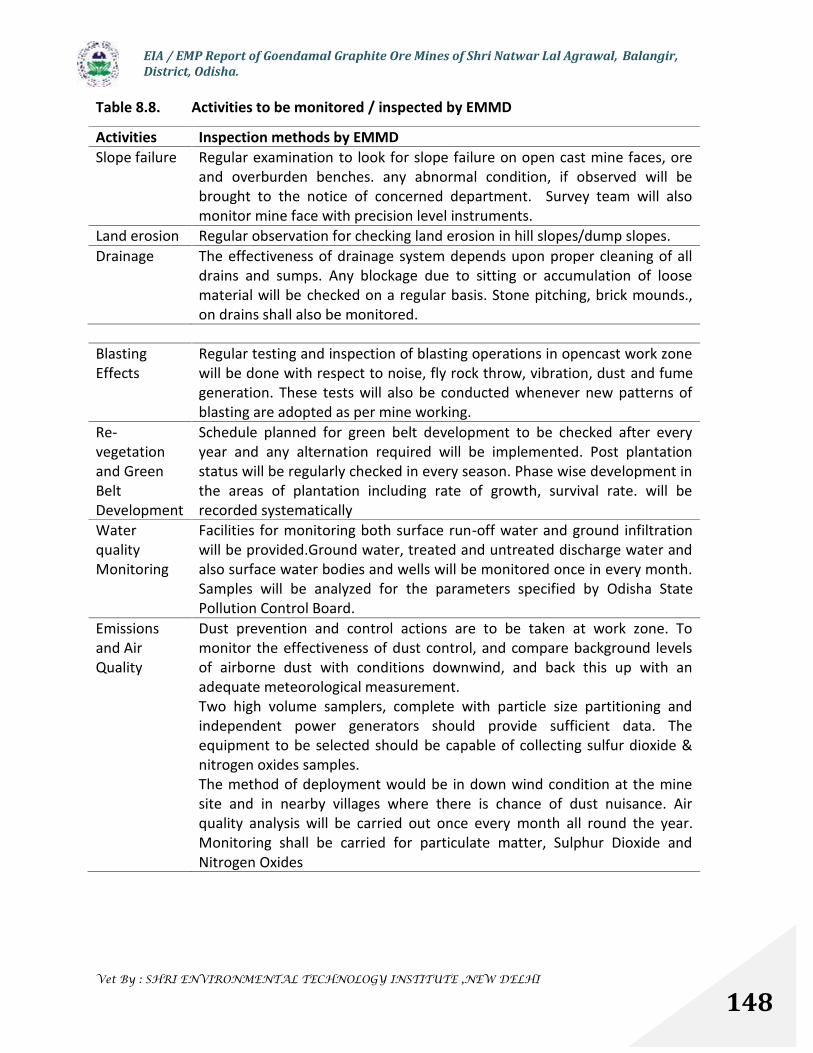
EIA / EMP Report of Goendamal Graphite Ore Mines of Shri Natwar Lal Agrawal, Balangir,District, Odisha.
Vet By : SHRI ENVIRONMENTAL TECHNOLOGY INSTITUTE ,NEW DELHI
148
Table 8.8. Activities to be monitored / inspected by EMMD
Activities Inspection methods by EMMDSlope failure Regular examination to look for slope failure on open cast mine faces, ore
and overburden benches. any abnormal condition, if observed will bebrought to the notice of concerned department. Survey team will alsomonitor mine face with precision level instruments.
Land erosion Regular observation for checking land erosion in hill slopes/dump slopes.Drainage The effectiveness of drainage system depends upon proper cleaning of all
drains and sumps. Any blockage due to sitting or accumulation of loosematerial will be checked on a regular basis. Stone pitching, brick mounds.,on drains shall also be monitored.
BlastingEffects
Regular testing and inspection of blasting operations in opencast work zonewill be done with respect to noise, fly rock throw, vibration, dust and fumegeneration. These tests will also be conducted whenever new patterns ofblasting are adopted as per mine working.
Re-vegetationand GreenBeltDevelopment
Schedule planned for green belt development to be checked after everyyear and any alternation required will be implemented. Post plantationstatus will be regularly checked in every season. Phase wise development inthe areas of plantation including rate of growth, survival rate. will berecorded systematically
WaterqualityMonitoring
Facilities for monitoring both surface run-off water and ground infiltrationwill be provided.Ground water, treated and untreated discharge water andalso surface water bodies and wells will be monitored once in every month.Samples will be analyzed for the parameters specified by Odisha StatePollution Control Board.
Emissionsand AirQuality
Dust prevention and control actions are to be taken at work zone. Tomonitor the effectiveness of dust control, and compare background levelsof airborne dust with conditions downwind, and back this up with anadequate meteorological measurement.Two high volume samplers, complete with particle size partitioning andindependent power generators should provide sufficient data. Theequipment to be selected should be capable of collecting sulfur dioxide &nitrogen oxides samples.The method of deployment would be in down wind condition at the minesite and in nearby villages where there is chance of dust nuisance. Airquality analysis will be carried out once every month all round the year.Monitoring shall be carried for particulate matter, Sulphur Dioxide andNitrogen Oxides
EIA / EMP Report of Goendamal Graphite Ore Mines of Shri Natwar Lal Agrawal, Balangir,District, Odisha.
Vet By : SHRI ENVIRONMENTAL TECHNOLOGY INSTITUTE ,NEW DELHI
149
OccupationalHealth
Facilities for checking, levels of dust in the workplace will be provided.Each group of mine workers will be monitored for health at regular intervalsby a specialist
Socio-economicdevelopment
The environment department will be in regular touch with surroundingvillages to monitor the implementation of various developmental schemesmade by the mine authorities. They will also consider any immediaterequirement, which can be taken care of.
DumpManagement
Adjacent to the periphery of the waste dump, a boulder wall of 1.2m to1.5m height will be built; followed by garland drain to provide protection ofwash off or leaching from dump in rainy season and plantation of quickgrowing plant species like Acacia in rows.
8.11.1 Duties of EMMD
In order to carry out the above monitoring /inspection in a systematic manner EMMD will
practice the following:
Plan conservation programmes in respect of water and energy.
Identity and record the constraints in respect of environmental planning and
implementation.
Systematically document all the field monitoring and laboratory analysis results.
Analyze the monitoring results and inspection findings. The results can be compared
with various standards/ norms. EMMD will prepare periodic progress reports, which
will include the analysis and inspection results. Environmental audit results and actions
taken should also be systematically documented.
Plan the management responsibilities defined for various environmental matters. This
should be displayed in the notice board in the office of EMMD.
Interact and liaison with H.Q officials and with State /Central Government
departments.
8.12 Organization Manpower & Training
8.12.1 Organizational Setup
Environmental monitoring and reporting will be designed to provide a close watch on the
surrounding natural environment and provide early warnings of any adverse changes that may
be related to some dimension of the mining and allied operations.
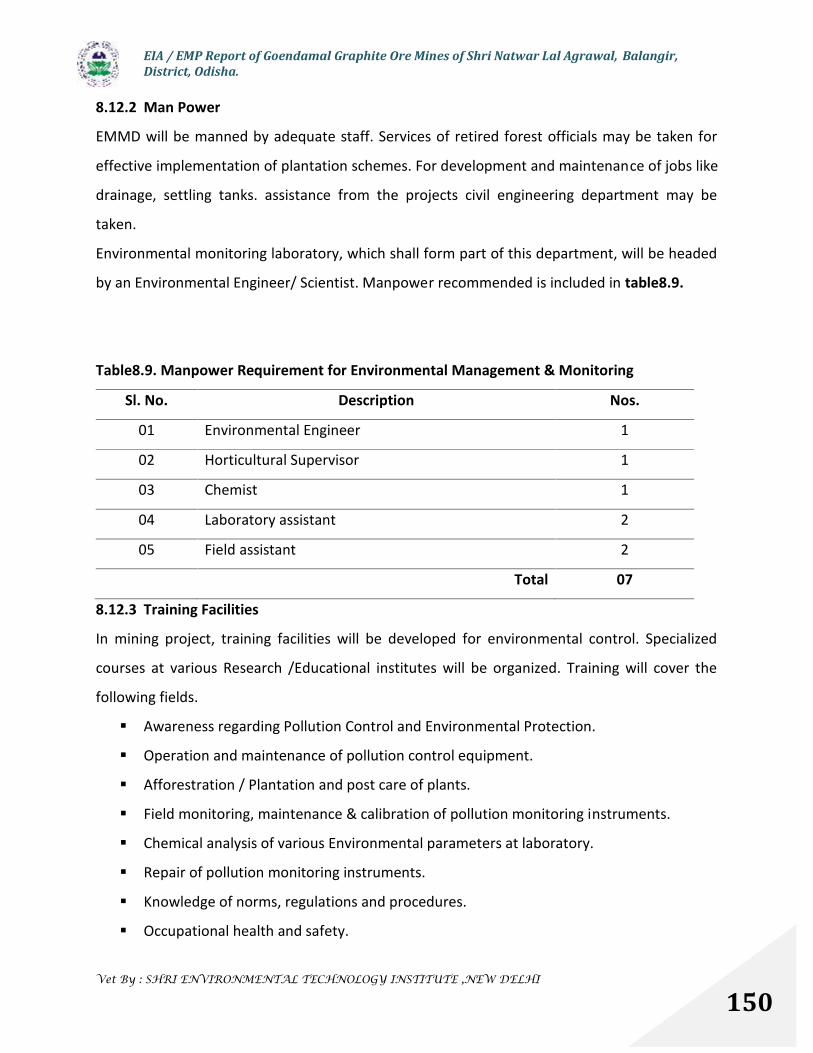
EIA / EMP Report of Goendamal Graphite Ore Mines of Shri Natwar Lal Agrawal, Balangir,District, Odisha.
Vet By : SHRI ENVIRONMENTAL TECHNOLOGY INSTITUTE ,NEW DELHI
150
8.12.2 Man Power
EMMD will be manned by adequate staff. Services of retired forest officials may be taken for
effective implementation of plantation schemes. For development and maintenance of jobs like
drainage, settling tanks. assistance from the projects civil engineering department may be
taken.
Environmental monitoring laboratory, which shall form part of this department, will be headed
by an Environmental Engineer/ Scientist. Manpower recommended is included in table8.9.
Table8.9. Manpower Requirement for Environmental Management & Monitoring
Sl. No. Description Nos.
01 Environmental Engineer 1
02 Horticultural Supervisor 1
03 Chemist 1
04 Laboratory assistant 2
05 Field assistant 2
Total 07
8.12.3 Training Facilities
In mining project, training facilities will be developed for environmental control. Specialized
courses at various Research /Educational institutes will be organized. Training will cover the
following fields.
Awareness regarding Pollution Control and Environmental Protection.
Operation and maintenance of pollution control equipment.
Afforestration / Plantation and post care of plants.
Field monitoring, maintenance & calibration of pollution monitoring instruments.
Chemical analysis of various Environmental parameters at laboratory.
Repair of pollution monitoring instruments.
Knowledge of norms, regulations and procedures.
Occupational health and safety.

EIA / EMP Report of Goendamal Graphite Ore Mines of Shri Natwar Lal Agrawal, Balangir,District, Odisha.
Vet By : SHRI ENVIRONMENTAL TECHNOLOGY INSTITUTE ,NEW DELHI
151
Risk assessment and Disaster Management Plan.
8.13 Cost Of Environmental Control Measures
In the process of environmental impact assessment a no. of site specific issues have
been identified which require due consideration as part of the development planning and
environmental project costing. The measures suggested are detailed under environmental
management plan. The updated capital cost and recurring cost (per annum) for the
environmental facilities for the project works out to 8.0 lakhs and 3.5 lakh / year respectively
given in table 8.10.
Table 8.10 Cost of Environmental Control Measures
Measures Capital Cost ( Lakhs Rs.) Recurring Cost ( Lakhs Rs. / Yr.)
Pollution Control 2.5 1.0
Pollution Monitoring -- 4.0
Occupational Safety 1.0 0.5
Green belt 1.0 0.5
Rainwater harvesting 1.0 0.5
Garland drains and
settling pits
2.0 0.5
Total 7.5 7.0
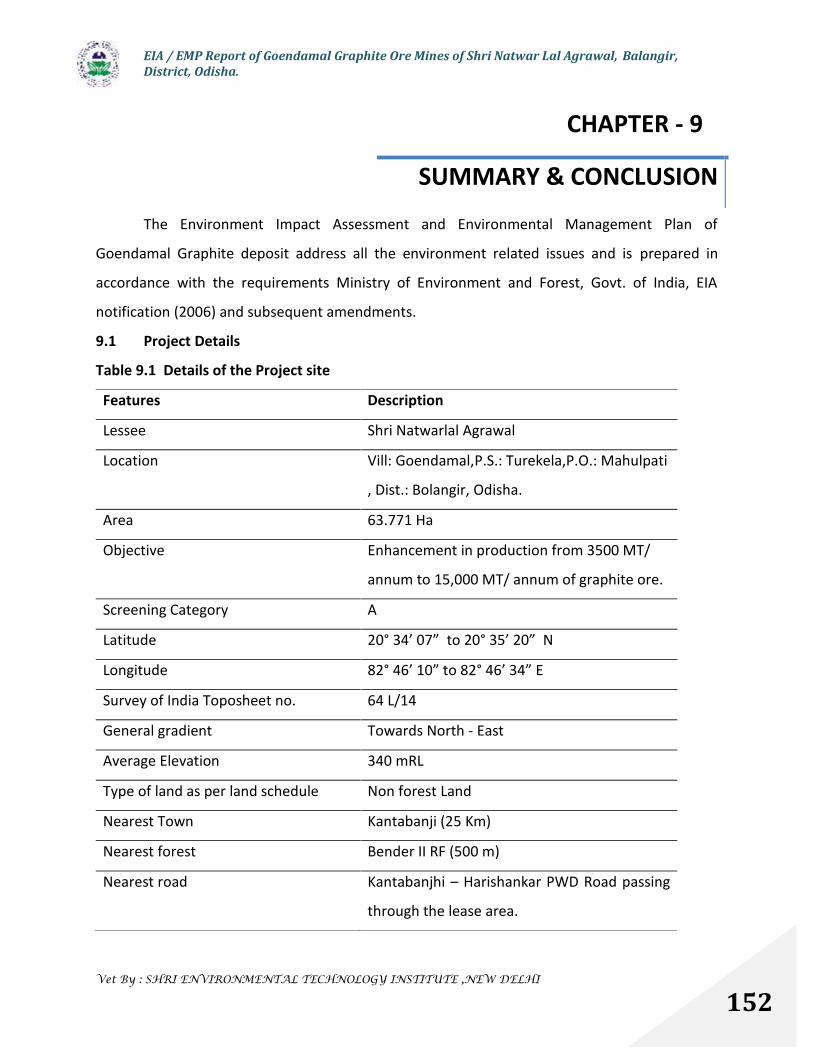
EIA / EMP Report of Goendamal Graphite Ore Mines of Shri Natwar Lal Agrawal, Balangir,District, Odisha.
Vet By : SHRI ENVIRONMENTAL TECHNOLOGY INSTITUTE ,NEW DELHI
152
The Environment Impact Assessment and Environmental Management Plan of
Goendamal Graphite deposit address all the environment related issues and is prepared in
accordance with the requirements Ministry of Environment and Forest, Govt. of India, EIA
notification (2006) and subsequent amendments.
9.1 Project Details
Table 9.1 Details of the Project site
Features Description
Lessee Shri Natwarlal Agrawal
Location Vill: Goendamal,P.S.: Turekela,P.O.: Mahulpati
, Dist.: Bolangir, Odisha.
Area 63.771 Ha
Objective Enhancement in production from 3500 MT/
annum to 15,000 MT/ annum of graphite ore.
Screening Category A
Latitude 20° 34’ 07” to 20° 35’ 20” N
Longitude 82° 46’ 10” to 82° 46’ 34” E
Survey of India Toposheet no. 64 L/14
General gradient Towards North - East
Average Elevation 340 mRL
Type of land as per land schedule Non forest Land
Nearest Town Kantabanji (25 Km)
Nearest forest Bender II RF (500 m)
Nearest road Kantabanjhi – Harishankar PWD Road passing
through the lease area.
CHAPTER - 9
SUMMARY & CONCLUSION

EIA / EMP Report of Goendamal Graphite Ore Mines of Shri Natwar Lal Agrawal, Balangir,District, Odisha.
Vet By : SHRI ENVIRONMENTAL TECHNOLOGY INSTITUTE ,NEW DELHI
153
Nearest railway Station Harishankar Road about 6 km
Notified sensitive area within 10 km Nil
Cost of the project 50 lakhs
9.2 Project Profile
9.2.1 Drainage
The main drainage pattern of the area is formed by tributaries of Lant river which flows
at a distance of 1.3 km in the north-east of the ML area. Other small nalas flow in N-E to E
directions and join Lant River in the North. There is no seasonal or perennial nala in the lease
area.
9.2.2 Mining profile
During the course of mining a total of five quarries (Q1- Q5) have been developed. At
present mining activities have been discontinued due to non availability of environmental
clearance. Keeping in view of production target of 15000 MT per annum the life of mine has
been estimated as 75 years. The mining activity is being proposed to carried out in Q-5 during
the proposed scheme period.
9.2.3 Reserve
The updated geological and mineable reserve up to 01.04.2011 is 1699621MT and
1122374 MT respectively.
9.2.4 Year wise production for ensuing five-year period
Based upon the surface geological data, the excavation planning is confined to the
existing quarry Q5. During the proposed scheme period total production will be 74948.58MT.
9.2.5 Waste Generation
Waste materials from the mining include soil, laterite morrum, quartzite, quartz,
feldspar, granet. The area also consists of 0.5 – 1.5 meter soil cover which is treated as fertile
soil. There are four existing waste dumps within the ML area and one number of proposed
dumps. During the proposed scheme period 164300 Cu.m of waste will be generated and
during the conceptual period 10,50,000 cum of waste will be generated.
9.2.6 Grade of Ore
Grade of ore generated from the mines is fixed carbon content ranging from 2 to 18.46 %.
EIA / EMP Report of Goendamal Graphite Ore Mines of Shri Natwar Lal Agrawal, Balangir,District, Odisha.
Vet By : SHRI ENVIRONMENTAL TECHNOLOGY INSTITUTE ,NEW DELHI
154
9.2.7 Drilling/ Blasting
Ammonium nitrate and fuel oil (ANFO) mixture based explosives are recommended for
blasting. The blasted rocks are upgraded manually by manual breaking, sorting and sizing, and
transported to stack yard for stacking. A permanent magazine is proposed to be constructed
within the lease hold area for secure and safe storage of explosives.
9.2.8 Loading & Transport
Waste materials will be removed from the working faces and transported to the stacking
yard by tipper.
9.2.9 Water Requirement
About 10 cum/d of potable water will be used for domestic purpose which will be
sourced from bore well. Another 54 cum/d of mine drainage water will be used for dust
suppression, plantation and other ancillary uses.
9.2.10 Site Services
All the site services such as office, Office, canteen, rest shed, creche & Toilets, First aid
center are well constructed within the ML area.
9.2.11 Employment Potential
A total of 93 people have been employed for smooth operation of the mine.
9.2.12 Land use Plan
At present 4.982 Ha of land has already degraded due to mining which will increase upto
8.684 Ha during the proposed scheme period and during conceptual period he land degradation
will be 28.802 Ha.Preset dumping area is 1.51 Ha which extends upto 3.5 Ha during the conceptual
period. Presently 4.97 Ha of land has been degraded due to mining activities which will increase to
26.7 Ha during the conceptual period
9.3 Baseline Environmental Status
The EIA/EMP report is based on the data generated from March 2011 to May 2011.The
study area is confined to 10 km radius of the ML area. The baseline data was revalidated with
the fresh data collected during April 2014 by M/s Cleenviron Pvt. Ltd., Odisha (NABL accredited
laboratory).

EIA / EMP Report of Goendamal Graphite Ore Mines of Shri Natwar Lal Agrawal, Balangir,District, Odisha.
Vet By : SHRI ENVIRONMENTAL TECHNOLOGY INSTITUTE ,NEW DELHI
155
9.3.1Land Use Pattern
Land pattern use as shown in the satellite imagery around 10 km radius shows that the
project area constitutes mainly crop land and forests. Crop land occupies 43.00 % and forest
land occupies 37.00 % of the total land area respectively. Waste land covers an area of 14.6 %.
Land degraded due to mining activities is about 0.3 %.
9.3.2 Soil Type in the Study Area:
The soil quality of the study area can be classified into high land, low land and scrub land
which either sandy or sandy loam.
9.3.3 Climate and Meteorological Parameters
The rainfall in the area is mostly because of south – west monsoon. The annual average rainfall
of about 1384 mm occurs during the monsoon period and the average number of rainy days is
around 70. The climate is characterized by high inter-annual variability. Temperatures vary
according to altitude and are highest in May (up to 47°C) and lowest in January (down to 12°C).
9.3.4 Ambient Air Quality
Ambient air quality monitoring was carried out at eight locations within 10 Kms radius
including AAQMS in downwind direction. The concentration of PM10 was found to be in the
range of 27 – 48 µg/m3, SO2 in the range of 4.3 – 5.7 µg/m3 and NOx in the range of 9.7-13.5
µg/m3.
9.3.5 Soil Quality
It has been observed that the pH of the soil in the study area ranged from 7.0 to 7.8. The
electrical conductivity was observed to be in the range of 283 - 422 µmhos/cm. The electric
conductivity is favorable for the agricultural activities. The nitrogen values range between 224 –
356 kg/ha. The phosphorus values ranged between 17 to 41 kg/ha indicating poor to medium
fertility of the soil with respect to P content. The potassium value ranged between 132 – 254
kg/ha. The textural class of the samples analyzed is found to be sandy silt. The bulk density of
the soil is found to be 0.98 to 1.32 gm/cc. The percentage of organic matter content reveals
poor to medium fertile soils in the region.
EIA / EMP Report of Goendamal Graphite Ore Mines of Shri Natwar Lal Agrawal, Balangir,District, Odisha.
Vet By : SHRI ENVIRONMENTAL TECHNOLOGY INSTITUTE ,NEW DELHI
156
9.3.6 Water Quality
The overall groundwater quality showed moderate to high hardness and was found
in the range of 88-160 mg/l. The data indicate low to moderate mineral content in terms of
chlorides, sulphate. Ground water was found to be free from turbidity. Heavy metals viz.
cadmium, chromium, copper, lead, zinc was not found in ground water samples.
The surface water analysis result shows turbidity values lie in the range 10 - 18 NTU.
Dissolved Oxygen (DO) was observed between 5.8 – 6.5 mg/l ; whereas BOD, chlorides and
sulphates were observed in the range of 1.6 – 3.5, 18 - 27 and 1.5 – 3.8 mg/l respectively. From
the surface water quality results it can be inferred that all the parameters analyzed are under
the prescribed limit and the water does not contain any pollutant which would be hazardous
for human, animal or crop health.
9.3.7 Noise Level
The noise levels were monitored on working days only. The day time noise level ranges
from 38-45 dBA and night time noise limit varies fron 35-40 dBA.
9.3.8 Ecological Pattern
The forest type of the study area comes under Low mixed forest.
9.3.9Flora of Study Area
The dominant forest species are Maduca indica, Azadirachta indica, Butea monosperma,
Dendrocalamus strictus,Diospyros melanoxylon, Terminalia alata, Terminalia arjuna.
9.3.10 Medicinal plants:
The medicinal flora of the area includes Aegle marmelos, Bombax ceiba, Terminalia
chebula, Terminali bellirica, Emblica officinalis, Terminalia arjuna, Schleichera oleosa, Asparagus
racemosus, Hemidesmus indicus, Phyllanthus amarus, Tinospora cordifolia, Azadirachta indica,
Butea monosperma.
9.3.11 Faunal Diversity in the Study Area
The mammalian species those are reported in the forest areas in the buffer zone
includes Common mongoose, Squirrel, Jackle, Indian fox, Hare, Monkey, Mouse. The common
avifauna of the area are Jungle Crow, sparrow, King fisher, Small Green Bee-eater, House crow,
Indian Myna.
EIA / EMP Report of Goendamal Graphite Ore Mines of Shri Natwar Lal Agrawal, Balangir,District, Odisha.
Vet By : SHRI ENVIRONMENTAL TECHNOLOGY INSTITUTE ,NEW DELHI
157
9.3.12 Socioeconomic Profile of the Study Area
The core zone (ML area) consists of denudated hills with no habitation. With in 1 Km
radius there is one village namely Goendamal with 147 households having a total of 574
inhabitants. In the buffer zone there are 50 villages with 8859 households. The total
population is about 37635 of which 50 % is contributed by males and rest 49 % are females.
9.3.13 Educational Profile
The literacy rate in the study area is 45.16%, which is less as compare to the other
district of the state. The male literacy rate is 66.06% and the female literacy is 33.93%. Rest
54.88% of the population are illiterate. The Illiteracy is more among the female (62.72%) as
compare to the male. The education infrastructure seems to be good in these villages but lack
of proper teaching staff is a problem. There are 52 Primary Schools, 15 ME Schools and 10 High
Schools in these villages.
9.4 Anticipated Environmental Impacts and Mitigation Measures
9.4.1 Impact on Topography & drainage
The main drainage pattern of the area is formed by tributaries of Lant River which flows
at a distance of 1.3 km in the north-east of the ML area. Other small nalas flow in NE to E
directions and join Lant River in the North. There is no seasonal or perennial nala in the lease
area. Direct impact on hydrology is not envisaged.
Ground water is likely to occur at a depth of 10 m bgl. The mine is to be worked through
pumping and drain off the quarried area through peripheral drain. The peripheral drain is
provided with a settling tank.
9.4.2 Impact on Land use Pattern
Buffer zone will not be affected as the mining operations are confined only to the core
zone. During the life of the mine, 17.49 hectares will be utilised for mining, activities. At present
4.982 Ha of land has already degraded due to mining which will increase upto 8.684 Ha during the
proposed scheme period and during conceptual period he land degradation will be 28.802 Ha.
Total excavation area will be 17.49 Ha and Overburden will be stored over 3.5 ha of land.
EIA / EMP Report of Goendamal Graphite Ore Mines of Shri Natwar Lal Agrawal, Balangir,District, Odisha.
Vet By : SHRI ENVIRONMENTAL TECHNOLOGY INSTITUTE ,NEW DELHI
158
9.4.3 Impact on Air Quality
The impacts on air environment due to Graphite mining and allied activities arises
during land development phase and during mining process. The excavation/removal of topsoil
and Pegmatite, Khandolite and Migmatite host rock, separation of graphite, carriage and
dumping of overburden (top soil and host rock) generates fugitive dust in that area. Dust
suppression through spraying of water is to be adopted to minimize its harmful effect.
9.4.4 Air Quality Modeling
ISCST3 area source model is used for the prediction of increase in fugitive dust level due
to mining activities in the nearby area. It has been predicted that the PM10 concentration will
be maximum within 500 m radial distance and gradually decreases with increase in distance.
The prediction of air quality due to proposed activities through simulation model shows that,
the maximum incremental Ground Level Concentration (GLC) of PM10 will be 7.8 μ g/m3 in SW
direction at a distance of 500m.
9.4.5 Impact on Noise Quality
Different activities in mining such as loading, hauling, drilling, ore handling, mining. lead
to generation of noise. The existing noise level in the core zone as measured at project site of
Goendamal Graphite ore mines is 38 to 45 dB during daytime and 35 to 40 dB during the
nighttime.
9.4.6 Blasting Effects
Shot hole drilling &blasting will be in practice so that the effect of blasting in terms of fly
rock and maximum ground vibration will be negligible. Time of blasting will be 12 noon to 12.30
PM in day time with prior intimation to the villagers for taking shelter. The practice of regularly
wetting the blasting ground and spraying water over the blasted material will be adopted to
control air pollution. Proposal is to adopt wet drilling on the benches.
9.4.7 Impact on Water Quality
The ground water occurs at 316 mRL and mining will continue upto 305 mRL. During the
conceptual period mining activities will intersect the sub surface water regime. About 54 cum/d
of sub surface water will be generated. Two numbers of 15 HP pumps will be used to pump out
the mine water for 6 hours daily for draining of the quarried area through the peripheral drains.
EIA / EMP Report of Goendamal Graphite Ore Mines of Shri Natwar Lal Agrawal, Balangir,District, Odisha.
Vet By : SHRI ENVIRONMENTAL TECHNOLOGY INSTITUTE ,NEW DELHI
159
9.4.8 Impact on Vegetation
The mining lease area does not include any forest land. The ML area and the buffer
zone is devoid of any endangered flora and fauna species. The existing vegetation with in the
ML area includes few shrubs which are sparsely scattered.
9.4.9 Impact on Socioeconomic Conditions
The mine lease area comprises of mainly non-forestland and the project does not
involve any loss of agriculture land. Commencement of mining activity will have beneficial to
the socio-economic environment. It is being proposed to employ 93 persons and provision of
improved infrastructure facility. Preference will be given to local skilled, semi skilled and
unskilled categories for employment. General medical facilities of area to be provided to the
villagers from the first – aid – center depending upon the availability. There will be a
development of infrastructural facilities and amenities due to proposed mines in the region.
9.5 Environmental Management Plan
9.5.1 Reclamation of Degraded Land/ land Soil Management
Quarry 2 and 3 will be backfilled after complete exhaustion of the quarries with 73678 m3
of waste.Top soil cover will be spread over the backfilled area to make it stable and fertile.
Plantations will be developed over the backfilled area to attain the pre mining land use. Cow dung
manure will be applied at the rate of 2500 kg/Ha to improve soil fertility. Utmost care will be
undertaken to ensure the survival & growth of the existing plantation and drought resistant and
fast growing trees will be planted.Quarry 1 & 4 will be used as water reservoir for rain water
harvesting. During conceptual period 5.003 Ha of mined out area will be backfilled and planted
over.
9.5.2 Solid Waste Management
9.5.2.1 Top soil management
Top soil in the proposed mining area is fertile in nature. During the planning period 2830
m3of top soil will be generated. The top soil will be spread over the backfilled area and
plantation will be done over that.
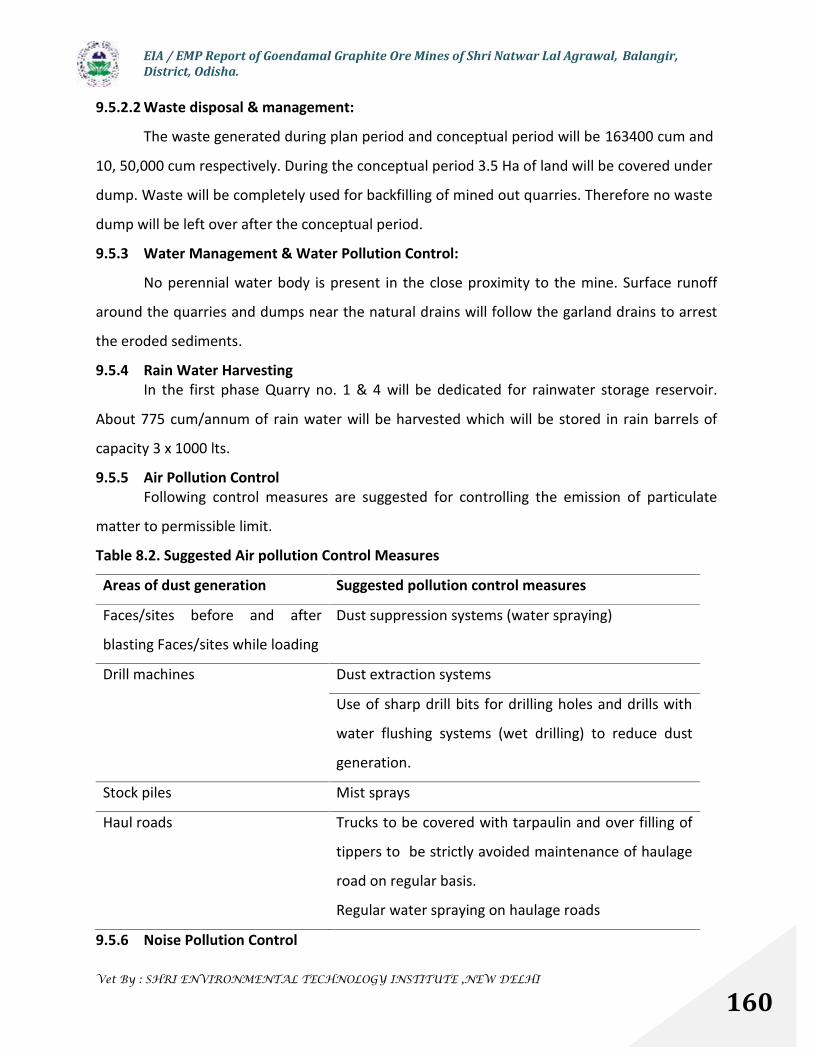
EIA / EMP Report of Goendamal Graphite Ore Mines of Shri Natwar Lal Agrawal, Balangir,District, Odisha.
Vet By : SHRI ENVIRONMENTAL TECHNOLOGY INSTITUTE ,NEW DELHI
160
9.5.2.2 Waste disposal & management:
The waste generated during plan period and conceptual period will be 163400 cum and
10, 50,000 cum respectively. During the conceptual period 3.5 Ha of land will be covered under
dump. Waste will be completely used for backfilling of mined out quarries. Therefore no waste
dump will be left over after the conceptual period.
9.5.3 Water Management & Water Pollution Control:
No perennial water body is present in the close proximity to the mine. Surface runoff
around the quarries and dumps near the natural drains will follow the garland drains to arrest
the eroded sediments.
9.5.4 Rain Water HarvestingIn the first phase Quarry no. 1 & 4 will be dedicated for rainwater storage reservoir.
About 775 cum/annum of rain water will be harvested which will be stored in rain barrels of
capacity 3 x 1000 lts.
9.5.5 Air Pollution ControlFollowing control measures are suggested for controlling the emission of particulate
matter to permissible limit.
Table 8.2. Suggested Air pollution Control Measures
Areas of dust generation Suggested pollution control measures
Faces/sites before and after
blasting Faces/sites while loading
Dust suppression systems (water spraying)
Drill machines Dust extraction systems
Use of sharp drill bits for drilling holes and drills with
water flushing systems (wet drilling) to reduce dust
generation.
Stock piles Mist sprays
Haul roads Trucks to be covered with tarpaulin and over filling of
tippers to be strictly avoided maintenance of haulage
road on regular basis.
Regular water spraying on haulage roads
9.5.6 Noise Pollution Control

EIA / EMP Report of Goendamal Graphite Ore Mines of Shri Natwar Lal Agrawal, Balangir,District, Odisha.
Vet By : SHRI ENVIRONMENTAL TECHNOLOGY INSTITUTE ,NEW DELHI
161
Noise level shall be maintained below 70 dB (A) in the working zone (for 8 hr. Exposure).
Diesel powered machineries, which are major; source of noise in open cast environment will be
properly maintained. Attention shall be paid towards rigorous maintenance of the silencer of
the diesel engines.Static diesel engines shall be housed as far as possible. If possible they will be
placed on vibration isolators.
9.5.7 Protective Measures for Ground Vibration/ Air Blast Caused By Blasting:Blast design can be altered to result in reduced levels of ground vibration by:
Reducing the maximum instantaneous charge (MIC) by using delays, reduced hole
diameter and/or deck loading.
Changing the burden and spacing by: altering the drilling pattern, and/or delay layout,
or altering the hole inclination.
Exercise strict control over spacing and orienting all blast drill holes.
Establish times of blasting to suit local conditions.
9.5.8 Green Belt DevelopmentPlantation within the ML area has been initiated since 2003. There is existing plantation
over an area of 1.0 Ha with 1522 no. of saplings. The year wise plantation programme is also
proposed in the EIA report.
9.6 Socio-Economic Activities
The following CSR activities have been undertaken by the lessee in the area;
The development of panchayat Road, which passes through the lease area to Kandagarh
furnished by Morrum and earth in subsequent intervals. The plantation work
undertaken and maintain on each side of the same road.
Maintenance of PWD road passing through the lease area from Tureikela to Lathore
On regular intervals medical camp set up for free medical check up of the local
inhabitants. In these camps First Aid Medicines with casual check up is provided.
Further on the eve of local festivals, proper donations provided by the lessee to the
nearby villagers. Also free food camp privileged to the local people on the occasion of
local festivals
Future program to promote education in the nearby villages is under proposal.
New bore wells will be provided to solve the drinking water problems in the area.
EIA / EMP Report of Goendamal Graphite Ore Mines of Shri Natwar Lal Agrawal, Balangir,District, Odisha.
Vet By : SHRI ENVIRONMENTAL TECHNOLOGY INSTITUTE ,NEW DELHI
162
M/s Shri Environmental Technology Institute is the proprietorship firm with Mrs. Rani Gupta is
being the proprietor of the firm involves in preparation of EIA/EMP report and other
environmental related studies. The Firm has its registerd office at WZ-679A, Nangal Raya,
Padam Basti, New Delhi -46.
The organization is duly allowed by Hon’ble high court, New Delhi in LPA No. 23/20/3 vides
order dated 17.01.2014 to prepare and present EIA report before all EAC and SEAC.
Mr. A.K. gupta, EIA co-ordinator is the power of attorney holder for the organization. The copy
of highcourt order and power of attorney letter is attached herewith.
CHAPTER 10
DISCLOSURE OF CONSULTANT ENGAGED

EIA / EMP Report of Goendamal Graphite Ore Mines of Shri Natwar Lal Agrawal, Balangir,District, Odisha.
Vet By : SHRI ENVIRONMENTAL TECHNOLOGY INSTITUTE ,NEW DELHI
163

EIA / EMP Report of Goendamal Graphite Ore Mines of Shri Natwar Lal Agrawal, Balangir,District, Odisha.
Vet By : SHRI ENVIRONMENTAL TECHNOLOGY INSTITUTE ,NEW DELHI
164

EIA / EMP Report of Goendamal Graphite Ore Mines of Shri Natwar Lal Agrawal, Balangir,District, Odisha.
Vet By : SHRI ENVIRONMENTAL TECHNOLOGY INSTITUTE ,NEW DELHI
165

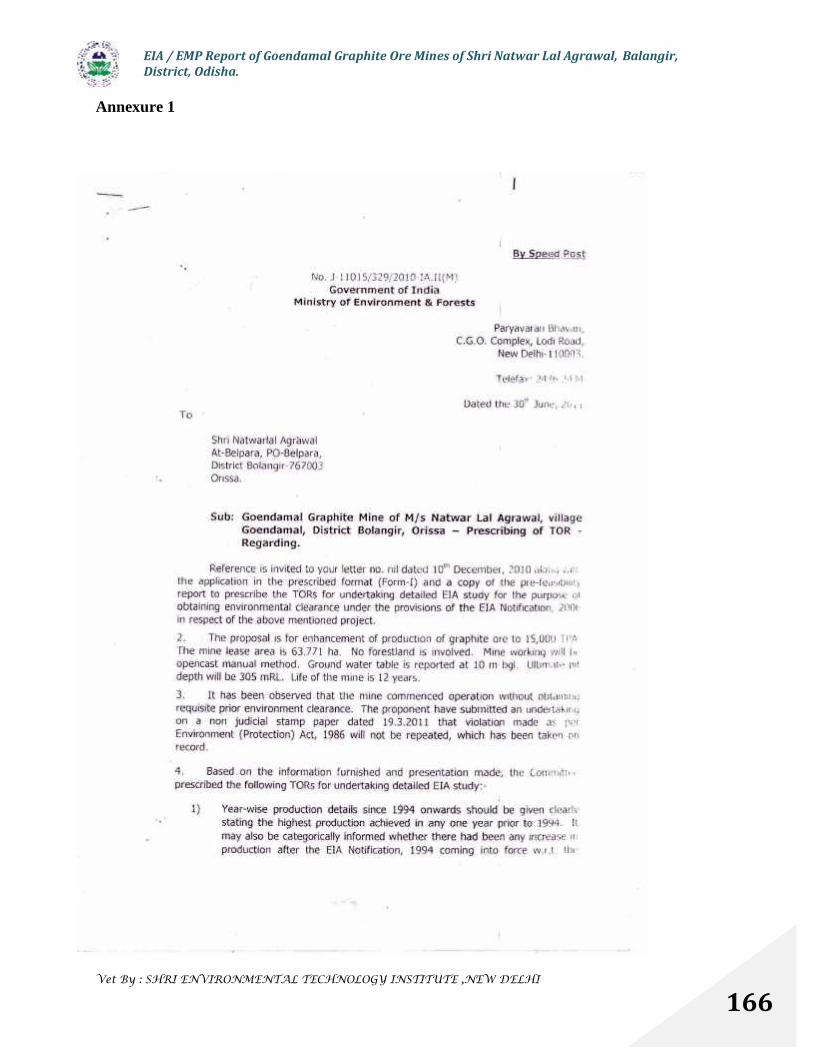
EIA / EMP Report of Goendamal Graphite Ore Mines of Shri Natwar Lal Agrawal, Balangir,District, Odisha.
Vet By : SHRI ENVIRONMENTAL TECHNOLOGY INSTITUTE ,NEW DELHI
166
Annexure 1
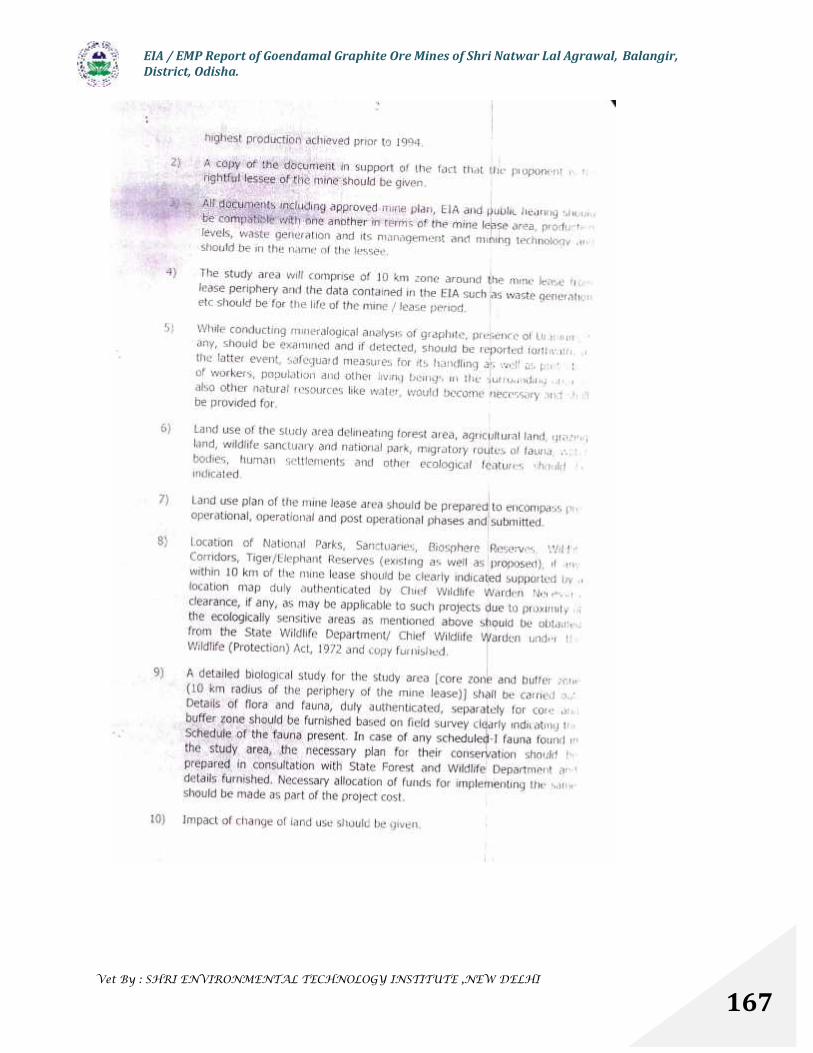
EIA / EMP Report of Goendamal Graphite Ore Mines of Shri Natwar Lal Agrawal, Balangir,District, Odisha.
Vet By : SHRI ENVIRONMENTAL TECHNOLOGY INSTITUTE ,NEW DELHI
167
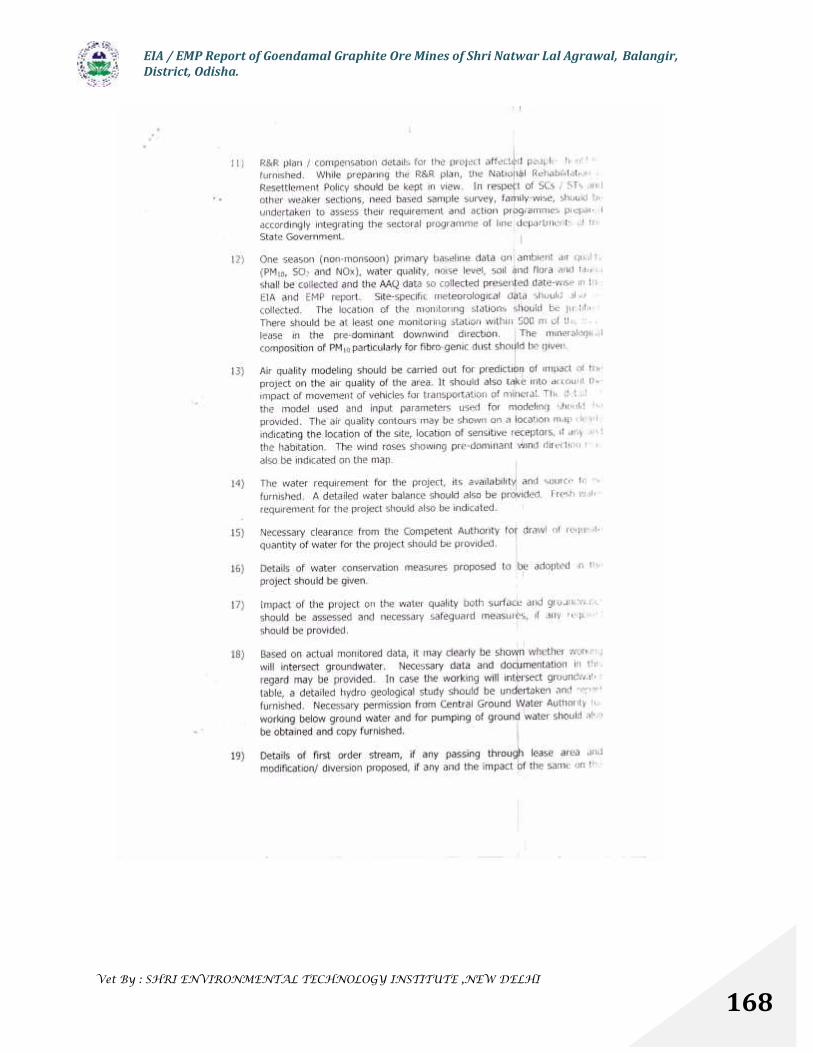
EIA / EMP Report of Goendamal Graphite Ore Mines of Shri Natwar Lal Agrawal, Balangir,District, Odisha.
Vet By : SHRI ENVIRONMENTAL TECHNOLOGY INSTITUTE ,NEW DELHI
168
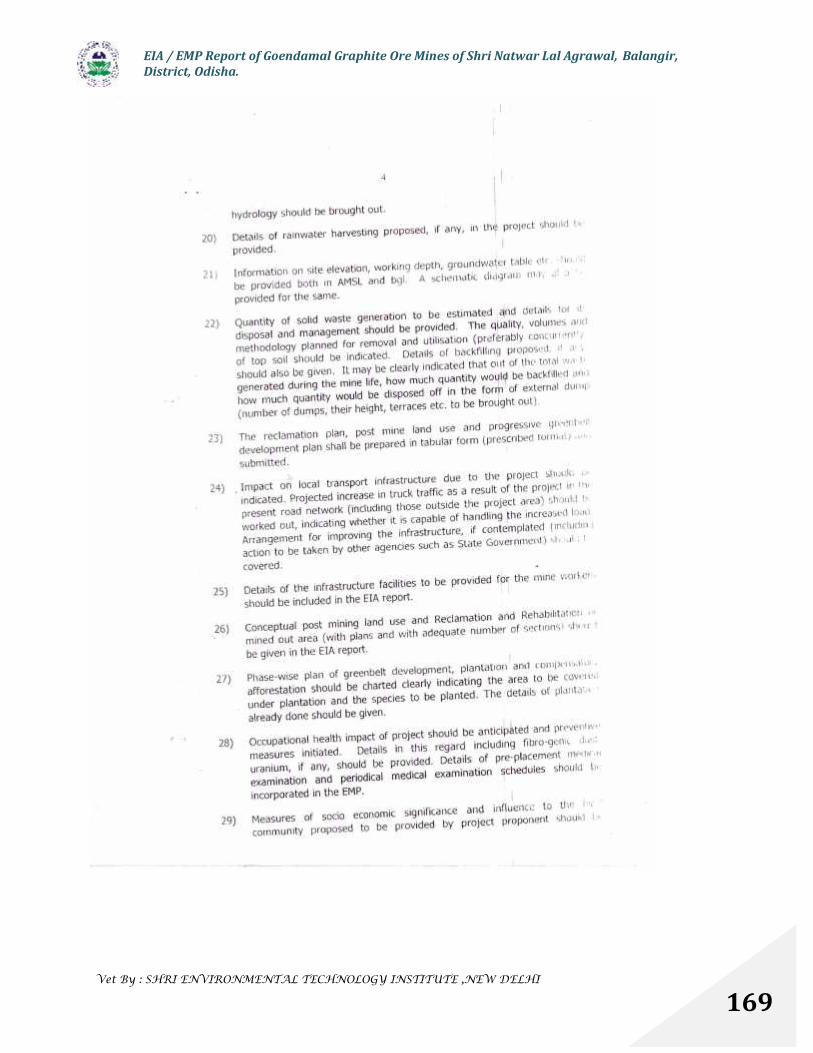
EIA / EMP Report of Goendamal Graphite Ore Mines of Shri Natwar Lal Agrawal, Balangir,District, Odisha.
Vet By : SHRI ENVIRONMENTAL TECHNOLOGY INSTITUTE ,NEW DELHI
169
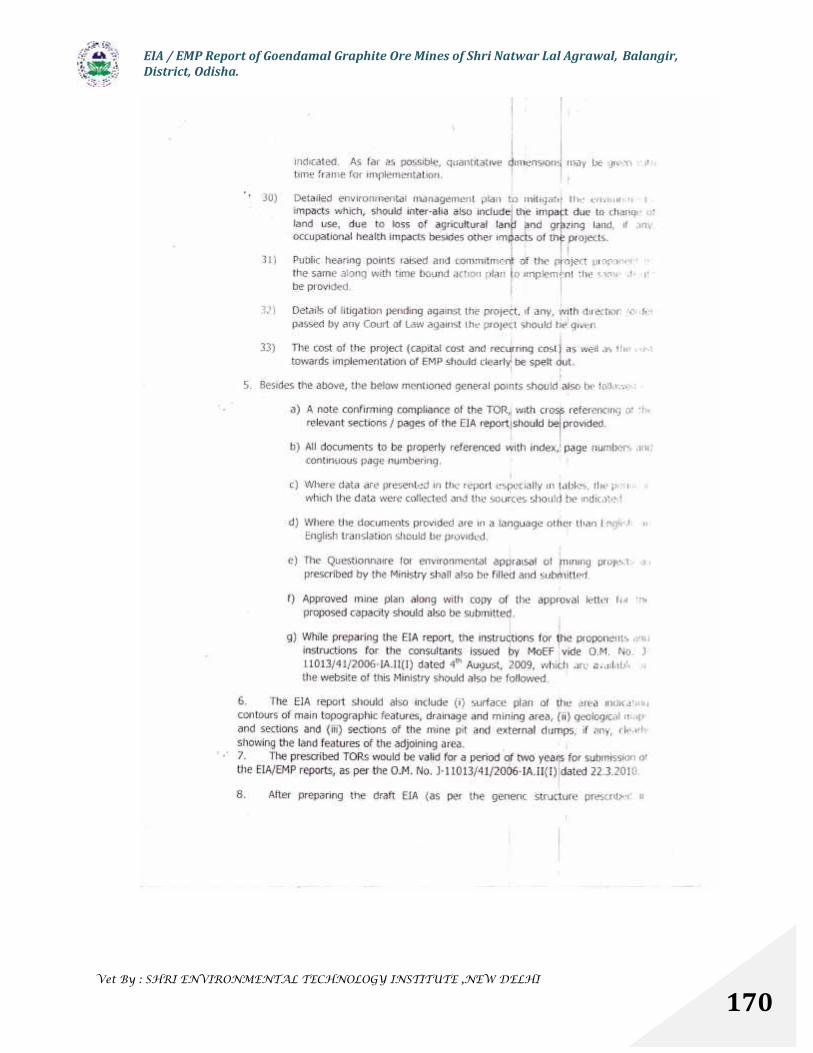
EIA / EMP Report of Goendamal Graphite Ore Mines of Shri Natwar Lal Agrawal, Balangir,District, Odisha.
Vet By : SHRI ENVIRONMENTAL TECHNOLOGY INSTITUTE ,NEW DELHI
170
EIA / EMP Report of Goendamal Graphite Ore Mines of Shri Natwar Lal Agrawal, Balangir,District, Odisha.
Vet By : SHRI ENVIRONMENTAL TECHNOLOGY INSTITUTE ,NEW DELHI
171
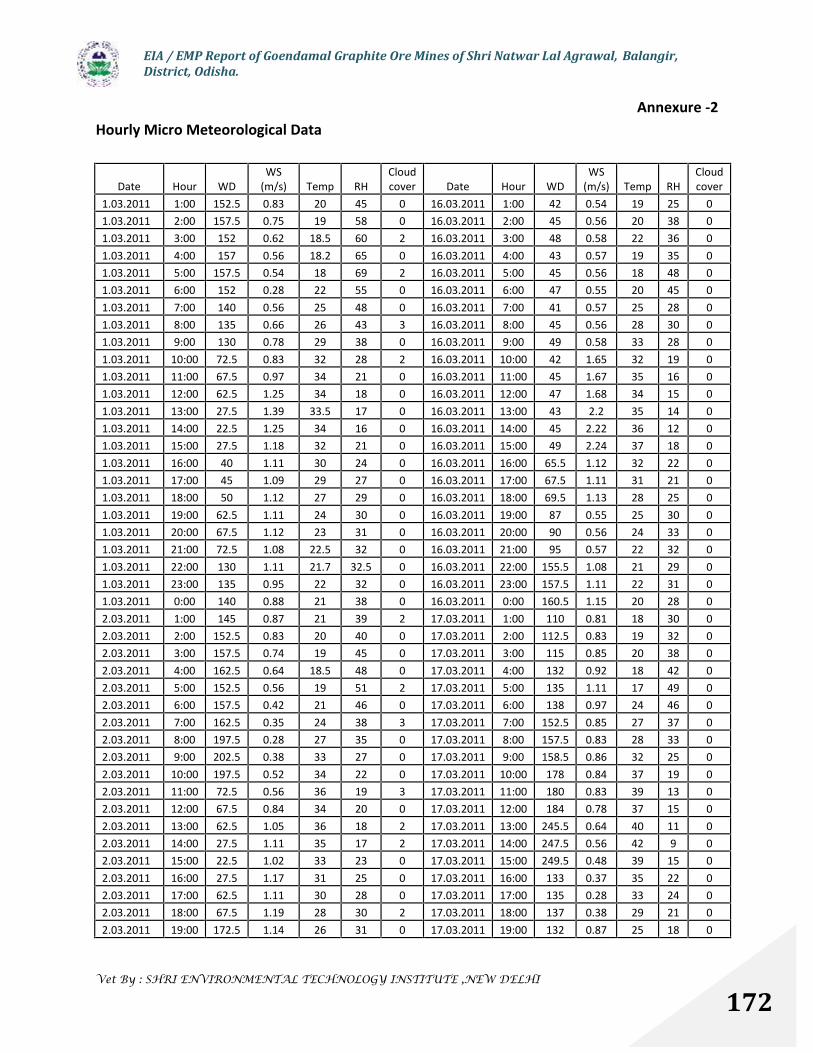
EIA / EMP Report of Goendamal Graphite Ore Mines of Shri Natwar Lal Agrawal, Balangir,District, Odisha.
Vet By : SHRI ENVIRONMENTAL TECHNOLOGY INSTITUTE ,NEW DELHI
172
Annexure -2Hourly Micro Meteorological Data
Date Hour WDWS
(m/s) Temp RHCloudcover Date Hour WD
WS(m/s) Temp RH
Cloudcover
1.03.2011 1:00 152.5 0.83 20 45 0 16.03.2011 1:00 42 0.54 19 25 01.03.2011 2:00 157.5 0.75 19 58 0 16.03.2011 2:00 45 0.56 20 38 01.03.2011 3:00 152 0.62 18.5 60 2 16.03.2011 3:00 48 0.58 22 36 01.03.2011 4:00 157 0.56 18.2 65 0 16.03.2011 4:00 43 0.57 19 35 01.03.2011 5:00 157.5 0.54 18 69 2 16.03.2011 5:00 45 0.56 18 48 01.03.2011 6:00 152 0.28 22 55 0 16.03.2011 6:00 47 0.55 20 45 01.03.2011 7:00 140 0.56 25 48 0 16.03.2011 7:00 41 0.57 25 28 01.03.2011 8:00 135 0.66 26 43 3 16.03.2011 8:00 45 0.56 28 30 01.03.2011 9:00 130 0.78 29 38 0 16.03.2011 9:00 49 0.58 33 28 01.03.2011 10:00 72.5 0.83 32 28 2 16.03.2011 10:00 42 1.65 32 19 01.03.2011 11:00 67.5 0.97 34 21 0 16.03.2011 11:00 45 1.67 35 16 01.03.2011 12:00 62.5 1.25 34 18 0 16.03.2011 12:00 47 1.68 34 15 01.03.2011 13:00 27.5 1.39 33.5 17 0 16.03.2011 13:00 43 2.2 35 14 01.03.2011 14:00 22.5 1.25 34 16 0 16.03.2011 14:00 45 2.22 36 12 01.03.2011 15:00 27.5 1.18 32 21 0 16.03.2011 15:00 49 2.24 37 18 01.03.2011 16:00 40 1.11 30 24 0 16.03.2011 16:00 65.5 1.12 32 22 01.03.2011 17:00 45 1.09 29 27 0 16.03.2011 17:00 67.5 1.11 31 21 01.03.2011 18:00 50 1.12 27 29 0 16.03.2011 18:00 69.5 1.13 28 25 01.03.2011 19:00 62.5 1.11 24 30 0 16.03.2011 19:00 87 0.55 25 30 01.03.2011 20:00 67.5 1.12 23 31 0 16.03.2011 20:00 90 0.56 24 33 01.03.2011 21:00 72.5 1.08 22.5 32 0 16.03.2011 21:00 95 0.57 22 32 01.03.2011 22:00 130 1.11 21.7 32.5 0 16.03.2011 22:00 155.5 1.08 21 29 01.03.2011 23:00 135 0.95 22 32 0 16.03.2011 23:00 157.5 1.11 22 31 01.03.2011 0:00 140 0.88 21 38 0 16.03.2011 0:00 160.5 1.15 20 28 02.03.2011 1:00 145 0.87 21 39 2 17.03.2011 1:00 110 0.81 18 30 02.03.2011 2:00 152.5 0.83 20 40 0 17.03.2011 2:00 112.5 0.83 19 32 02.03.2011 3:00 157.5 0.74 19 45 0 17.03.2011 3:00 115 0.85 20 38 02.03.2011 4:00 162.5 0.64 18.5 48 0 17.03.2011 4:00 132 0.92 18 42 02.03.2011 5:00 152.5 0.56 19 51 2 17.03.2011 5:00 135 1.11 17 49 02.03.2011 6:00 157.5 0.42 21 46 0 17.03.2011 6:00 138 0.97 24 46 02.03.2011 7:00 162.5 0.35 24 38 3 17.03.2011 7:00 152.5 0.85 27 37 02.03.2011 8:00 197.5 0.28 27 35 0 17.03.2011 8:00 157.5 0.83 28 33 02.03.2011 9:00 202.5 0.38 33 27 0 17.03.2011 9:00 158.5 0.86 32 25 02.03.2011 10:00 197.5 0.52 34 22 0 17.03.2011 10:00 178 0.84 37 19 02.03.2011 11:00 72.5 0.56 36 19 3 17.03.2011 11:00 180 0.83 39 13 02.03.2011 12:00 67.5 0.84 34 20 0 17.03.2011 12:00 184 0.78 37 15 02.03.2011 13:00 62.5 1.05 36 18 2 17.03.2011 13:00 245.5 0.64 40 11 02.03.2011 14:00 27.5 1.11 35 17 2 17.03.2011 14:00 247.5 0.56 42 9 02.03.2011 15:00 22.5 1.02 33 23 0 17.03.2011 15:00 249.5 0.48 39 15 02.03.2011 16:00 27.5 1.17 31 25 0 17.03.2011 16:00 133 0.37 35 22 02.03.2011 17:00 62.5 1.11 30 28 0 17.03.2011 17:00 135 0.28 33 24 02.03.2011 18:00 67.5 1.19 28 30 2 17.03.2011 18:00 137 0.38 29 21 02.03.2011 19:00 172.5 1.14 26 31 0 17.03.2011 19:00 132 0.87 25 18 0
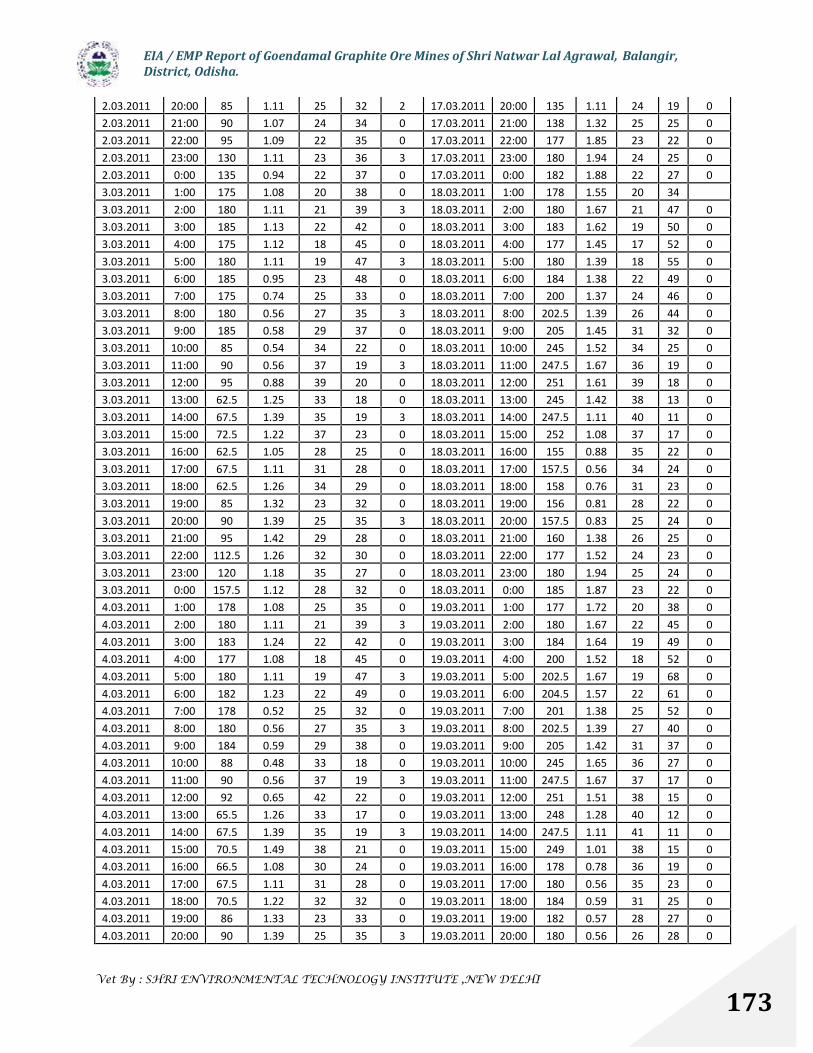
EIA / EMP Report of Goendamal Graphite Ore Mines of Shri Natwar Lal Agrawal, Balangir,District, Odisha.
Vet By : SHRI ENVIRONMENTAL TECHNOLOGY INSTITUTE ,NEW DELHI
173
2.03.2011 20:00 85 1.11 25 32 2 17.03.2011 20:00 135 1.11 24 19 02.03.2011 21:00 90 1.07 24 34 0 17.03.2011 21:00 138 1.32 25 25 02.03.2011 22:00 95 1.09 22 35 0 17.03.2011 22:00 177 1.85 23 22 02.03.2011 23:00 130 1.11 23 36 3 17.03.2011 23:00 180 1.94 24 25 02.03.2011 0:00 135 0.94 22 37 0 17.03.2011 0:00 182 1.88 22 27 03.03.2011 1:00 175 1.08 20 38 0 18.03.2011 1:00 178 1.55 20 343.03.2011 2:00 180 1.11 21 39 3 18.03.2011 2:00 180 1.67 21 47 03.03.2011 3:00 185 1.13 22 42 0 18.03.2011 3:00 183 1.62 19 50 03.03.2011 4:00 175 1.12 18 45 0 18.03.2011 4:00 177 1.45 17 52 03.03.2011 5:00 180 1.11 19 47 3 18.03.2011 5:00 180 1.39 18 55 03.03.2011 6:00 185 0.95 23 48 0 18.03.2011 6:00 184 1.38 22 49 03.03.2011 7:00 175 0.74 25 33 0 18.03.2011 7:00 200 1.37 24 46 03.03.2011 8:00 180 0.56 27 35 3 18.03.2011 8:00 202.5 1.39 26 44 03.03.2011 9:00 185 0.58 29 37 0 18.03.2011 9:00 205 1.45 31 32 03.03.2011 10:00 85 0.54 34 22 0 18.03.2011 10:00 245 1.52 34 25 03.03.2011 11:00 90 0.56 37 19 3 18.03.2011 11:00 247.5 1.67 36 19 03.03.2011 12:00 95 0.88 39 20 0 18.03.2011 12:00 251 1.61 39 18 03.03.2011 13:00 62.5 1.25 33 18 0 18.03.2011 13:00 245 1.42 38 13 03.03.2011 14:00 67.5 1.39 35 19 3 18.03.2011 14:00 247.5 1.11 40 11 03.03.2011 15:00 72.5 1.22 37 23 0 18.03.2011 15:00 252 1.08 37 17 03.03.2011 16:00 62.5 1.05 28 25 0 18.03.2011 16:00 155 0.88 35 22 03.03.2011 17:00 67.5 1.11 31 28 0 18.03.2011 17:00 157.5 0.56 34 24 03.03.2011 18:00 62.5 1.26 34 29 0 18.03.2011 18:00 158 0.76 31 23 03.03.2011 19:00 85 1.32 23 32 0 18.03.2011 19:00 156 0.81 28 22 03.03.2011 20:00 90 1.39 25 35 3 18.03.2011 20:00 157.5 0.83 25 24 03.03.2011 21:00 95 1.42 29 28 0 18.03.2011 21:00 160 1.38 26 25 03.03.2011 22:00 112.5 1.26 32 30 0 18.03.2011 22:00 177 1.52 24 23 03.03.2011 23:00 120 1.18 35 27 0 18.03.2011 23:00 180 1.94 25 24 03.03.2011 0:00 157.5 1.12 28 32 0 18.03.2011 0:00 185 1.87 23 22 04.03.2011 1:00 178 1.08 25 35 0 19.03.2011 1:00 177 1.72 20 38 04.03.2011 2:00 180 1.11 21 39 3 19.03.2011 2:00 180 1.67 22 45 04.03.2011 3:00 183 1.24 22 42 0 19.03.2011 3:00 184 1.64 19 49 04.03.2011 4:00 177 1.08 18 45 0 19.03.2011 4:00 200 1.52 18 52 04.03.2011 5:00 180 1.11 19 47 3 19.03.2011 5:00 202.5 1.67 19 68 04.03.2011 6:00 182 1.23 22 49 0 19.03.2011 6:00 204.5 1.57 22 61 04.03.2011 7:00 178 0.52 25 32 0 19.03.2011 7:00 201 1.38 25 52 04.03.2011 8:00 180 0.56 27 35 3 19.03.2011 8:00 202.5 1.39 27 40 04.03.2011 9:00 184 0.59 29 38 0 19.03.2011 9:00 205 1.42 31 37 04.03.2011 10:00 88 0.48 33 18 0 19.03.2011 10:00 245 1.65 36 27 04.03.2011 11:00 90 0.56 37 19 3 19.03.2011 11:00 247.5 1.67 37 17 04.03.2011 12:00 92 0.65 42 22 0 19.03.2011 12:00 251 1.51 38 15 04.03.2011 13:00 65.5 1.26 33 17 0 19.03.2011 13:00 248 1.28 40 12 04.03.2011 14:00 67.5 1.39 35 19 3 19.03.2011 14:00 247.5 1.11 41 11 04.03.2011 15:00 70.5 1.49 38 21 0 19.03.2011 15:00 249 1.01 38 15 04.03.2011 16:00 66.5 1.08 30 24 0 19.03.2011 16:00 178 0.78 36 19 04.03.2011 17:00 67.5 1.11 31 28 0 19.03.2011 17:00 180 0.56 35 23 04.03.2011 18:00 70.5 1.22 32 32 0 19.03.2011 18:00 184 0.59 31 25 04.03.2011 19:00 86 1.33 23 33 0 19.03.2011 19:00 182 0.57 28 27 04.03.2011 20:00 90 1.39 25 35 3 19.03.2011 20:00 180 0.56 26 28 0
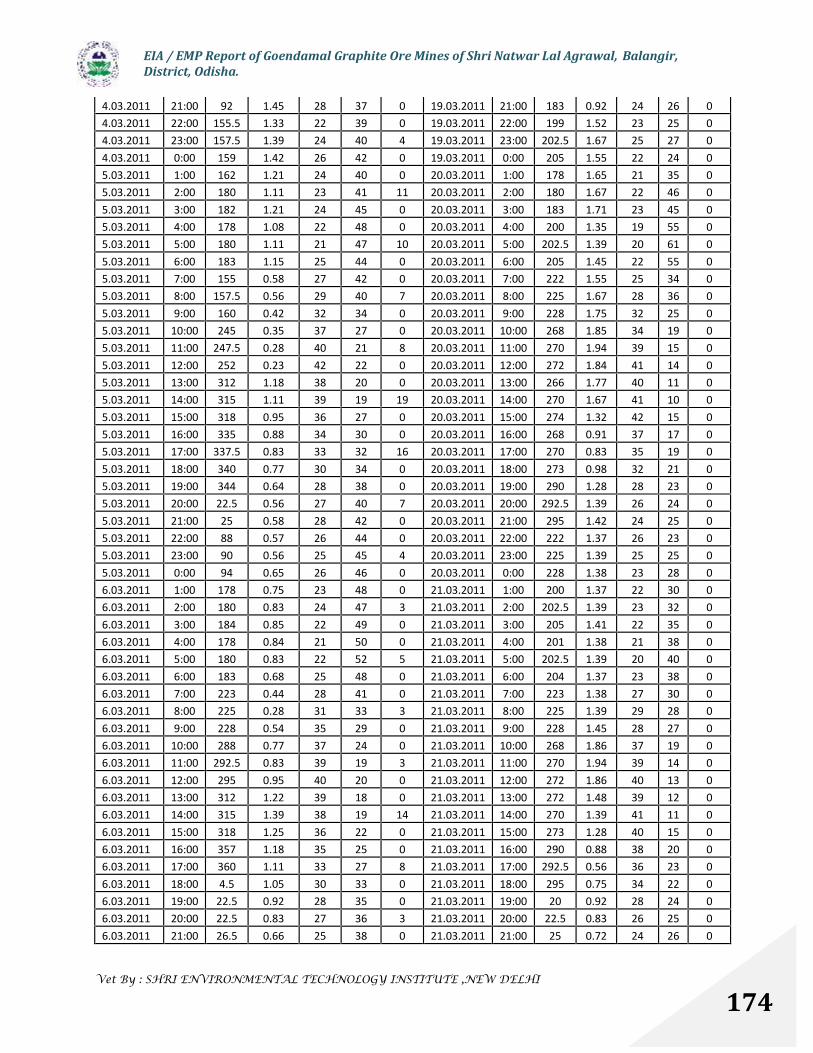
EIA / EMP Report of Goendamal Graphite Ore Mines of Shri Natwar Lal Agrawal, Balangir,District, Odisha.
Vet By : SHRI ENVIRONMENTAL TECHNOLOGY INSTITUTE ,NEW DELHI
174
4.03.2011 21:00 92 1.45 28 37 0 19.03.2011 21:00 183 0.92 24 26 04.03.2011 22:00 155.5 1.33 22 39 0 19.03.2011 22:00 199 1.52 23 25 04.03.2011 23:00 157.5 1.39 24 40 4 19.03.2011 23:00 202.5 1.67 25 27 04.03.2011 0:00 159 1.42 26 42 0 19.03.2011 0:00 205 1.55 22 24 05.03.2011 1:00 162 1.21 24 40 0 20.03.2011 1:00 178 1.65 21 35 05.03.2011 2:00 180 1.11 23 41 11 20.03.2011 2:00 180 1.67 22 46 05.03.2011 3:00 182 1.21 24 45 0 20.03.2011 3:00 183 1.71 23 45 05.03.2011 4:00 178 1.08 22 48 0 20.03.2011 4:00 200 1.35 19 55 05.03.2011 5:00 180 1.11 21 47 10 20.03.2011 5:00 202.5 1.39 20 61 05.03.2011 6:00 183 1.15 25 44 0 20.03.2011 6:00 205 1.45 22 55 05.03.2011 7:00 155 0.58 27 42 0 20.03.2011 7:00 222 1.55 25 34 05.03.2011 8:00 157.5 0.56 29 40 7 20.03.2011 8:00 225 1.67 28 36 05.03.2011 9:00 160 0.42 32 34 0 20.03.2011 9:00 228 1.75 32 25 05.03.2011 10:00 245 0.35 37 27 0 20.03.2011 10:00 268 1.85 34 19 05.03.2011 11:00 247.5 0.28 40 21 8 20.03.2011 11:00 270 1.94 39 15 05.03.2011 12:00 252 0.23 42 22 0 20.03.2011 12:00 272 1.84 41 14 05.03.2011 13:00 312 1.18 38 20 0 20.03.2011 13:00 266 1.77 40 11 05.03.2011 14:00 315 1.11 39 19 19 20.03.2011 14:00 270 1.67 41 10 05.03.2011 15:00 318 0.95 36 27 0 20.03.2011 15:00 274 1.32 42 15 05.03.2011 16:00 335 0.88 34 30 0 20.03.2011 16:00 268 0.91 37 17 05.03.2011 17:00 337.5 0.83 33 32 16 20.03.2011 17:00 270 0.83 35 19 05.03.2011 18:00 340 0.77 30 34 0 20.03.2011 18:00 273 0.98 32 21 05.03.2011 19:00 344 0.64 28 38 0 20.03.2011 19:00 290 1.28 28 23 05.03.2011 20:00 22.5 0.56 27 40 7 20.03.2011 20:00 292.5 1.39 26 24 05.03.2011 21:00 25 0.58 28 42 0 20.03.2011 21:00 295 1.42 24 25 05.03.2011 22:00 88 0.57 26 44 0 20.03.2011 22:00 222 1.37 26 23 05.03.2011 23:00 90 0.56 25 45 4 20.03.2011 23:00 225 1.39 25 25 05.03.2011 0:00 94 0.65 26 46 0 20.03.2011 0:00 228 1.38 23 28 06.03.2011 1:00 178 0.75 23 48 0 21.03.2011 1:00 200 1.37 22 30 06.03.2011 2:00 180 0.83 24 47 3 21.03.2011 2:00 202.5 1.39 23 32 06.03.2011 3:00 184 0.85 22 49 0 21.03.2011 3:00 205 1.41 22 35 06.03.2011 4:00 178 0.84 21 50 0 21.03.2011 4:00 201 1.38 21 38 06.03.2011 5:00 180 0.83 22 52 5 21.03.2011 5:00 202.5 1.39 20 40 06.03.2011 6:00 183 0.68 25 48 0 21.03.2011 6:00 204 1.37 23 38 06.03.2011 7:00 223 0.44 28 41 0 21.03.2011 7:00 223 1.38 27 30 06.03.2011 8:00 225 0.28 31 33 3 21.03.2011 8:00 225 1.39 29 28 06.03.2011 9:00 228 0.54 35 29 0 21.03.2011 9:00 228 1.45 28 27 06.03.2011 10:00 288 0.77 37 24 0 21.03.2011 10:00 268 1.86 37 19 06.03.2011 11:00 292.5 0.83 39 19 3 21.03.2011 11:00 270 1.94 39 14 06.03.2011 12:00 295 0.95 40 20 0 21.03.2011 12:00 272 1.86 40 13 06.03.2011 13:00 312 1.22 39 18 0 21.03.2011 13:00 272 1.48 39 12 06.03.2011 14:00 315 1.39 38 19 14 21.03.2011 14:00 270 1.39 41 11 06.03.2011 15:00 318 1.25 36 22 0 21.03.2011 15:00 273 1.28 40 15 06.03.2011 16:00 357 1.18 35 25 0 21.03.2011 16:00 290 0.88 38 20 06.03.2011 17:00 360 1.11 33 27 8 21.03.2011 17:00 292.5 0.56 36 23 06.03.2011 18:00 4.5 1.05 30 33 0 21.03.2011 18:00 295 0.75 34 22 06.03.2011 19:00 22.5 0.92 28 35 0 21.03.2011 19:00 20 0.92 28 24 06.03.2011 20:00 22.5 0.83 27 36 3 21.03.2011 20:00 22.5 0.83 26 25 06.03.2011 21:00 26.5 0.66 25 38 0 21.03.2011 21:00 25 0.72 24 26 0
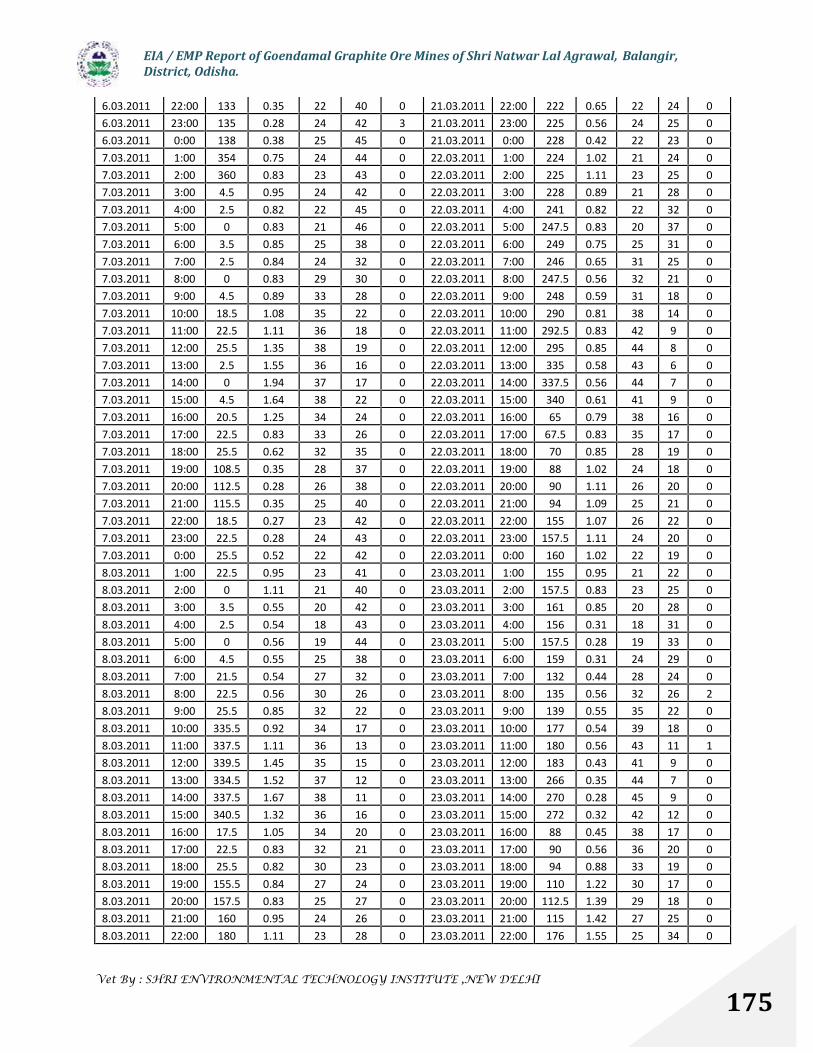
EIA / EMP Report of Goendamal Graphite Ore Mines of Shri Natwar Lal Agrawal, Balangir,District, Odisha.
Vet By : SHRI ENVIRONMENTAL TECHNOLOGY INSTITUTE ,NEW DELHI
175
6.03.2011 22:00 133 0.35 22 40 0 21.03.2011 22:00 222 0.65 22 24 06.03.2011 23:00 135 0.28 24 42 3 21.03.2011 23:00 225 0.56 24 25 06.03.2011 0:00 138 0.38 25 45 0 21.03.2011 0:00 228 0.42 22 23 07.03.2011 1:00 354 0.75 24 44 0 22.03.2011 1:00 224 1.02 21 24 07.03.2011 2:00 360 0.83 23 43 0 22.03.2011 2:00 225 1.11 23 25 07.03.2011 3:00 4.5 0.95 24 42 0 22.03.2011 3:00 228 0.89 21 28 07.03.2011 4:00 2.5 0.82 22 45 0 22.03.2011 4:00 241 0.82 22 32 07.03.2011 5:00 0 0.83 21 46 0 22.03.2011 5:00 247.5 0.83 20 37 07.03.2011 6:00 3.5 0.85 25 38 0 22.03.2011 6:00 249 0.75 25 31 07.03.2011 7:00 2.5 0.84 24 32 0 22.03.2011 7:00 246 0.65 31 25 07.03.2011 8:00 0 0.83 29 30 0 22.03.2011 8:00 247.5 0.56 32 21 07.03.2011 9:00 4.5 0.89 33 28 0 22.03.2011 9:00 248 0.59 31 18 07.03.2011 10:00 18.5 1.08 35 22 0 22.03.2011 10:00 290 0.81 38 14 07.03.2011 11:00 22.5 1.11 36 18 0 22.03.2011 11:00 292.5 0.83 42 9 07.03.2011 12:00 25.5 1.35 38 19 0 22.03.2011 12:00 295 0.85 44 8 07.03.2011 13:00 2.5 1.55 36 16 0 22.03.2011 13:00 335 0.58 43 6 07.03.2011 14:00 0 1.94 37 17 0 22.03.2011 14:00 337.5 0.56 44 7 07.03.2011 15:00 4.5 1.64 38 22 0 22.03.2011 15:00 340 0.61 41 9 07.03.2011 16:00 20.5 1.25 34 24 0 22.03.2011 16:00 65 0.79 38 16 07.03.2011 17:00 22.5 0.83 33 26 0 22.03.2011 17:00 67.5 0.83 35 17 07.03.2011 18:00 25.5 0.62 32 35 0 22.03.2011 18:00 70 0.85 28 19 07.03.2011 19:00 108.5 0.35 28 37 0 22.03.2011 19:00 88 1.02 24 18 07.03.2011 20:00 112.5 0.28 26 38 0 22.03.2011 20:00 90 1.11 26 20 07.03.2011 21:00 115.5 0.35 25 40 0 22.03.2011 21:00 94 1.09 25 21 07.03.2011 22:00 18.5 0.27 23 42 0 22.03.2011 22:00 155 1.07 26 22 07.03.2011 23:00 22.5 0.28 24 43 0 22.03.2011 23:00 157.5 1.11 24 20 07.03.2011 0:00 25.5 0.52 22 42 0 22.03.2011 0:00 160 1.02 22 19 08.03.2011 1:00 22.5 0.95 23 41 0 23.03.2011 1:00 155 0.95 21 22 08.03.2011 2:00 0 1.11 21 40 0 23.03.2011 2:00 157.5 0.83 23 25 08.03.2011 3:00 3.5 0.55 20 42 0 23.03.2011 3:00 161 0.85 20 28 08.03.2011 4:00 2.5 0.54 18 43 0 23.03.2011 4:00 156 0.31 18 31 08.03.2011 5:00 0 0.56 19 44 0 23.03.2011 5:00 157.5 0.28 19 33 08.03.2011 6:00 4.5 0.55 25 38 0 23.03.2011 6:00 159 0.31 24 29 08.03.2011 7:00 21.5 0.54 27 32 0 23.03.2011 7:00 132 0.44 28 24 08.03.2011 8:00 22.5 0.56 30 26 0 23.03.2011 8:00 135 0.56 32 26 28.03.2011 9:00 25.5 0.85 32 22 0 23.03.2011 9:00 139 0.55 35 22 08.03.2011 10:00 335.5 0.92 34 17 0 23.03.2011 10:00 177 0.54 39 18 08.03.2011 11:00 337.5 1.11 36 13 0 23.03.2011 11:00 180 0.56 43 11 18.03.2011 12:00 339.5 1.45 35 15 0 23.03.2011 12:00 183 0.43 41 9 08.03.2011 13:00 334.5 1.52 37 12 0 23.03.2011 13:00 266 0.35 44 7 08.03.2011 14:00 337.5 1.67 38 11 0 23.03.2011 14:00 270 0.28 45 9 08.03.2011 15:00 340.5 1.32 36 16 0 23.03.2011 15:00 272 0.32 42 12 08.03.2011 16:00 17.5 1.05 34 20 0 23.03.2011 16:00 88 0.45 38 17 08.03.2011 17:00 22.5 0.83 32 21 0 23.03.2011 17:00 90 0.56 36 20 08.03.2011 18:00 25.5 0.82 30 23 0 23.03.2011 18:00 94 0.88 33 19 08.03.2011 19:00 155.5 0.84 27 24 0 23.03.2011 19:00 110 1.22 30 17 08.03.2011 20:00 157.5 0.83 25 27 0 23.03.2011 20:00 112.5 1.39 29 18 08.03.2011 21:00 160 0.95 24 26 0 23.03.2011 21:00 115 1.42 27 25 08.03.2011 22:00 180 1.11 23 28 0 23.03.2011 22:00 176 1.55 25 34 0
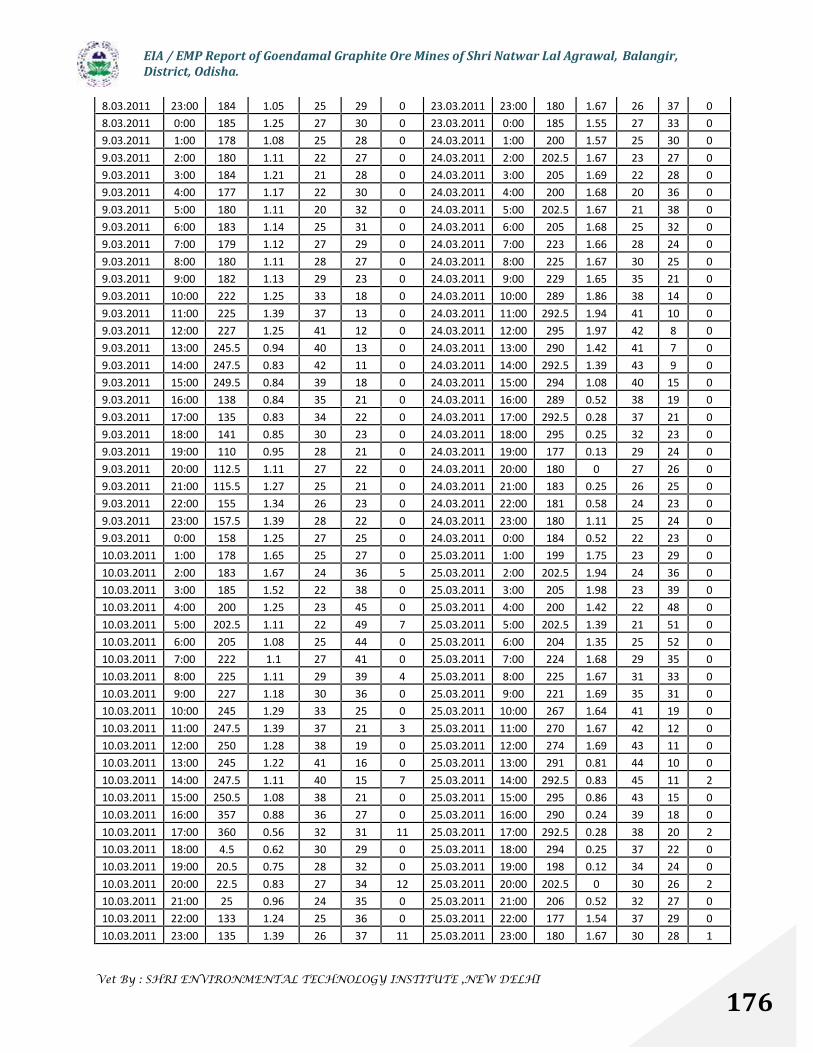
EIA / EMP Report of Goendamal Graphite Ore Mines of Shri Natwar Lal Agrawal, Balangir,District, Odisha.
Vet By : SHRI ENVIRONMENTAL TECHNOLOGY INSTITUTE ,NEW DELHI
176
8.03.2011 23:00 184 1.05 25 29 0 23.03.2011 23:00 180 1.67 26 37 08.03.2011 0:00 185 1.25 27 30 0 23.03.2011 0:00 185 1.55 27 33 09.03.2011 1:00 178 1.08 25 28 0 24.03.2011 1:00 200 1.57 25 30 09.03.2011 2:00 180 1.11 22 27 0 24.03.2011 2:00 202.5 1.67 23 27 09.03.2011 3:00 184 1.21 21 28 0 24.03.2011 3:00 205 1.69 22 28 09.03.2011 4:00 177 1.17 22 30 0 24.03.2011 4:00 200 1.68 20 36 09.03.2011 5:00 180 1.11 20 32 0 24.03.2011 5:00 202.5 1.67 21 38 09.03.2011 6:00 183 1.14 25 31 0 24.03.2011 6:00 205 1.68 25 32 09.03.2011 7:00 179 1.12 27 29 0 24.03.2011 7:00 223 1.66 28 24 09.03.2011 8:00 180 1.11 28 27 0 24.03.2011 8:00 225 1.67 30 25 09.03.2011 9:00 182 1.13 29 23 0 24.03.2011 9:00 229 1.65 35 21 09.03.2011 10:00 222 1.25 33 18 0 24.03.2011 10:00 289 1.86 38 14 09.03.2011 11:00 225 1.39 37 13 0 24.03.2011 11:00 292.5 1.94 41 10 09.03.2011 12:00 227 1.25 41 12 0 24.03.2011 12:00 295 1.97 42 8 09.03.2011 13:00 245.5 0.94 40 13 0 24.03.2011 13:00 290 1.42 41 7 09.03.2011 14:00 247.5 0.83 42 11 0 24.03.2011 14:00 292.5 1.39 43 9 09.03.2011 15:00 249.5 0.84 39 18 0 24.03.2011 15:00 294 1.08 40 15 09.03.2011 16:00 138 0.84 35 21 0 24.03.2011 16:00 289 0.52 38 19 09.03.2011 17:00 135 0.83 34 22 0 24.03.2011 17:00 292.5 0.28 37 21 09.03.2011 18:00 141 0.85 30 23 0 24.03.2011 18:00 295 0.25 32 23 09.03.2011 19:00 110 0.95 28 21 0 24.03.2011 19:00 177 0.13 29 24 09.03.2011 20:00 112.5 1.11 27 22 0 24.03.2011 20:00 180 0 27 26 09.03.2011 21:00 115.5 1.27 25 21 0 24.03.2011 21:00 183 0.25 26 25 09.03.2011 22:00 155 1.34 26 23 0 24.03.2011 22:00 181 0.58 24 23 09.03.2011 23:00 157.5 1.39 28 22 0 24.03.2011 23:00 180 1.11 25 24 09.03.2011 0:00 158 1.25 27 25 0 24.03.2011 0:00 184 0.52 22 23 010.03.2011 1:00 178 1.65 25 27 0 25.03.2011 1:00 199 1.75 23 29 010.03.2011 2:00 183 1.67 24 36 5 25.03.2011 2:00 202.5 1.94 24 36 010.03.2011 3:00 185 1.52 22 38 0 25.03.2011 3:00 205 1.98 23 39 010.03.2011 4:00 200 1.25 23 45 0 25.03.2011 4:00 200 1.42 22 48 010.03.2011 5:00 202.5 1.11 22 49 7 25.03.2011 5:00 202.5 1.39 21 51 010.03.2011 6:00 205 1.08 25 44 0 25.03.2011 6:00 204 1.35 25 52 010.03.2011 7:00 222 1.1 27 41 0 25.03.2011 7:00 224 1.68 29 35 010.03.2011 8:00 225 1.11 29 39 4 25.03.2011 8:00 225 1.67 31 33 010.03.2011 9:00 227 1.18 30 36 0 25.03.2011 9:00 221 1.69 35 31 010.03.2011 10:00 245 1.29 33 25 0 25.03.2011 10:00 267 1.64 41 19 010.03.2011 11:00 247.5 1.39 37 21 3 25.03.2011 11:00 270 1.67 42 12 010.03.2011 12:00 250 1.28 38 19 0 25.03.2011 12:00 274 1.69 43 11 010.03.2011 13:00 245 1.22 41 16 0 25.03.2011 13:00 291 0.81 44 10 010.03.2011 14:00 247.5 1.11 40 15 7 25.03.2011 14:00 292.5 0.83 45 11 210.03.2011 15:00 250.5 1.08 38 21 0 25.03.2011 15:00 295 0.86 43 15 010.03.2011 16:00 357 0.88 36 27 0 25.03.2011 16:00 290 0.24 39 18 010.03.2011 17:00 360 0.56 32 31 11 25.03.2011 17:00 292.5 0.28 38 20 210.03.2011 18:00 4.5 0.62 30 29 0 25.03.2011 18:00 294 0.25 37 22 010.03.2011 19:00 20.5 0.75 28 32 0 25.03.2011 19:00 198 0.12 34 24 010.03.2011 20:00 22.5 0.83 27 34 12 25.03.2011 20:00 202.5 0 30 26 210.03.2011 21:00 25 0.96 24 35 0 25.03.2011 21:00 206 0.52 32 27 010.03.2011 22:00 133 1.24 25 36 0 25.03.2011 22:00 177 1.54 37 29 010.03.2011 23:00 135 1.39 26 37 11 25.03.2011 23:00 180 1.67 30 28 1
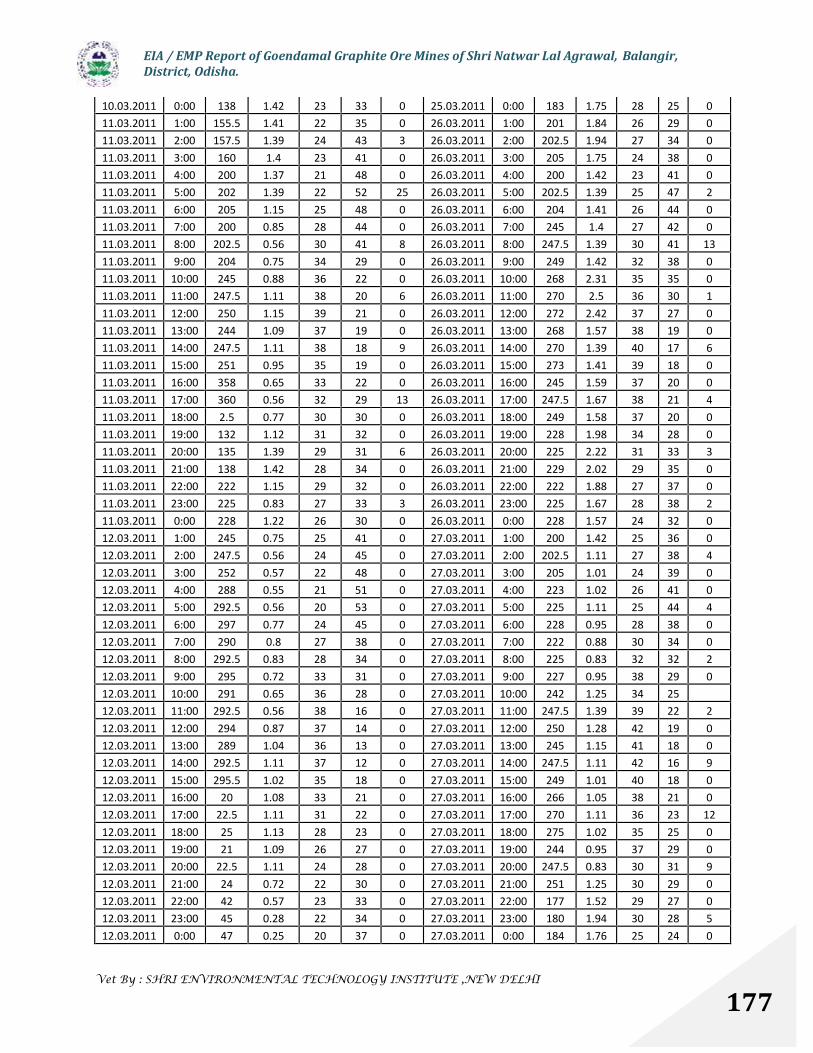
EIA / EMP Report of Goendamal Graphite Ore Mines of Shri Natwar Lal Agrawal, Balangir,District, Odisha.
Vet By : SHRI ENVIRONMENTAL TECHNOLOGY INSTITUTE ,NEW DELHI
177
10.03.2011 0:00 138 1.42 23 33 0 25.03.2011 0:00 183 1.75 28 25 011.03.2011 1:00 155.5 1.41 22 35 0 26.03.2011 1:00 201 1.84 26 29 011.03.2011 2:00 157.5 1.39 24 43 3 26.03.2011 2:00 202.5 1.94 27 34 011.03.2011 3:00 160 1.4 23 41 0 26.03.2011 3:00 205 1.75 24 38 011.03.2011 4:00 200 1.37 21 48 0 26.03.2011 4:00 200 1.42 23 41 011.03.2011 5:00 202 1.39 22 52 25 26.03.2011 5:00 202.5 1.39 25 47 211.03.2011 6:00 205 1.15 25 48 0 26.03.2011 6:00 204 1.41 26 44 011.03.2011 7:00 200 0.85 28 44 0 26.03.2011 7:00 245 1.4 27 42 011.03.2011 8:00 202.5 0.56 30 41 8 26.03.2011 8:00 247.5 1.39 30 41 1311.03.2011 9:00 204 0.75 34 29 0 26.03.2011 9:00 249 1.42 32 38 011.03.2011 10:00 245 0.88 36 22 0 26.03.2011 10:00 268 2.31 35 35 011.03.2011 11:00 247.5 1.11 38 20 6 26.03.2011 11:00 270 2.5 36 30 111.03.2011 12:00 250 1.15 39 21 0 26.03.2011 12:00 272 2.42 37 27 011.03.2011 13:00 244 1.09 37 19 0 26.03.2011 13:00 268 1.57 38 19 011.03.2011 14:00 247.5 1.11 38 18 9 26.03.2011 14:00 270 1.39 40 17 611.03.2011 15:00 251 0.95 35 19 0 26.03.2011 15:00 273 1.41 39 18 011.03.2011 16:00 358 0.65 33 22 0 26.03.2011 16:00 245 1.59 37 20 011.03.2011 17:00 360 0.56 32 29 13 26.03.2011 17:00 247.5 1.67 38 21 411.03.2011 18:00 2.5 0.77 30 30 0 26.03.2011 18:00 249 1.58 37 20 011.03.2011 19:00 132 1.12 31 32 0 26.03.2011 19:00 228 1.98 34 28 011.03.2011 20:00 135 1.39 29 31 6 26.03.2011 20:00 225 2.22 31 33 311.03.2011 21:00 138 1.42 28 34 0 26.03.2011 21:00 229 2.02 29 35 011.03.2011 22:00 222 1.15 29 32 0 26.03.2011 22:00 222 1.88 27 37 011.03.2011 23:00 225 0.83 27 33 3 26.03.2011 23:00 225 1.67 28 38 211.03.2011 0:00 228 1.22 26 30 0 26.03.2011 0:00 228 1.57 24 32 012.03.2011 1:00 245 0.75 25 41 0 27.03.2011 1:00 200 1.42 25 36 012.03.2011 2:00 247.5 0.56 24 45 0 27.03.2011 2:00 202.5 1.11 27 38 412.03.2011 3:00 252 0.57 22 48 0 27.03.2011 3:00 205 1.01 24 39 012.03.2011 4:00 288 0.55 21 51 0 27.03.2011 4:00 223 1.02 26 41 012.03.2011 5:00 292.5 0.56 20 53 0 27.03.2011 5:00 225 1.11 25 44 412.03.2011 6:00 297 0.77 24 45 0 27.03.2011 6:00 228 0.95 28 38 012.03.2011 7:00 290 0.8 27 38 0 27.03.2011 7:00 222 0.88 30 34 012.03.2011 8:00 292.5 0.83 28 34 0 27.03.2011 8:00 225 0.83 32 32 212.03.2011 9:00 295 0.72 33 31 0 27.03.2011 9:00 227 0.95 38 29 012.03.2011 10:00 291 0.65 36 28 0 27.03.2011 10:00 242 1.25 34 2512.03.2011 11:00 292.5 0.56 38 16 0 27.03.2011 11:00 247.5 1.39 39 22 212.03.2011 12:00 294 0.87 37 14 0 27.03.2011 12:00 250 1.28 42 19 012.03.2011 13:00 289 1.04 36 13 0 27.03.2011 13:00 245 1.15 41 18 012.03.2011 14:00 292.5 1.11 37 12 0 27.03.2011 14:00 247.5 1.11 42 16 912.03.2011 15:00 295.5 1.02 35 18 0 27.03.2011 15:00 249 1.01 40 18 012.03.2011 16:00 20 1.08 33 21 0 27.03.2011 16:00 266 1.05 38 21 012.03.2011 17:00 22.5 1.11 31 22 0 27.03.2011 17:00 270 1.11 36 23 1212.03.2011 18:00 25 1.13 28 23 0 27.03.2011 18:00 275 1.02 35 25 012.03.2011 19:00 21 1.09 26 27 0 27.03.2011 19:00 244 0.95 37 29 012.03.2011 20:00 22.5 1.11 24 28 0 27.03.2011 20:00 247.5 0.83 30 31 912.03.2011 21:00 24 0.72 22 30 0 27.03.2011 21:00 251 1.25 30 29 012.03.2011 22:00 42 0.57 23 33 0 27.03.2011 22:00 177 1.52 29 27 012.03.2011 23:00 45 0.28 22 34 0 27.03.2011 23:00 180 1.94 30 28 512.03.2011 0:00 47 0.25 20 37 0 27.03.2011 0:00 184 1.76 25 24 0
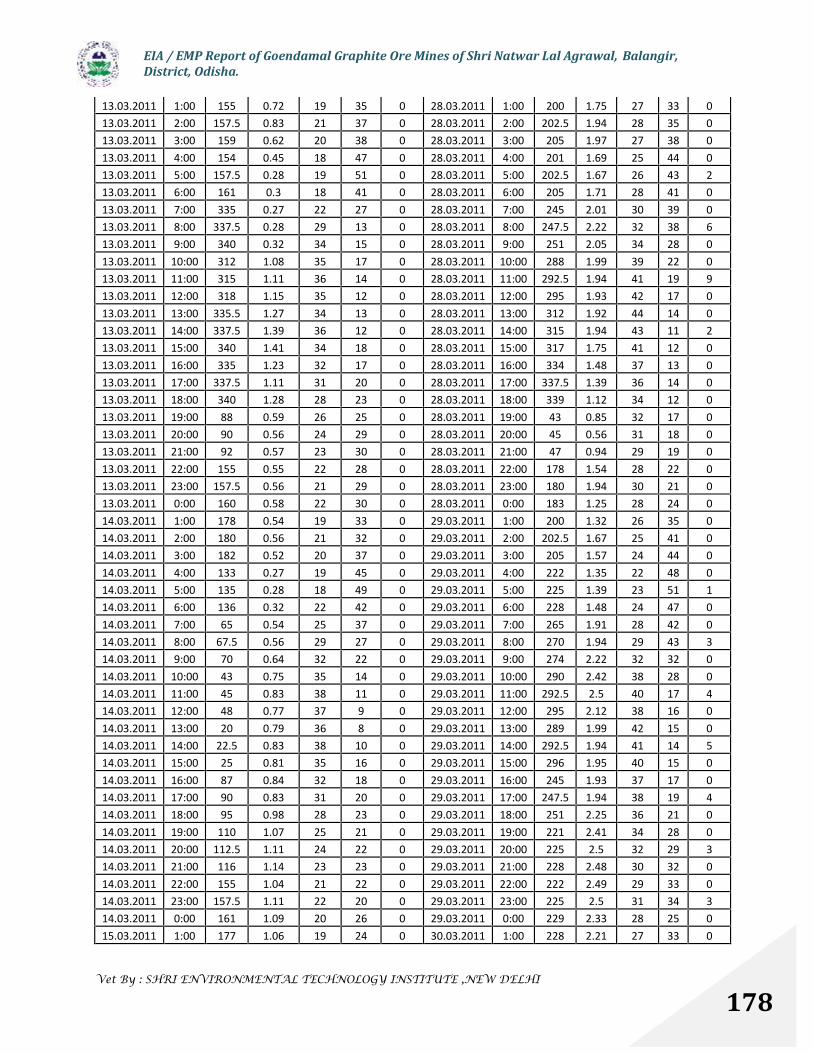
EIA / EMP Report of Goendamal Graphite Ore Mines of Shri Natwar Lal Agrawal, Balangir,District, Odisha.
Vet By : SHRI ENVIRONMENTAL TECHNOLOGY INSTITUTE ,NEW DELHI
178
13.03.2011 1:00 155 0.72 19 35 0 28.03.2011 1:00 200 1.75 27 33 013.03.2011 2:00 157.5 0.83 21 37 0 28.03.2011 2:00 202.5 1.94 28 35 013.03.2011 3:00 159 0.62 20 38 0 28.03.2011 3:00 205 1.97 27 38 013.03.2011 4:00 154 0.45 18 47 0 28.03.2011 4:00 201 1.69 25 44 013.03.2011 5:00 157.5 0.28 19 51 0 28.03.2011 5:00 202.5 1.67 26 43 213.03.2011 6:00 161 0.3 18 41 0 28.03.2011 6:00 205 1.71 28 41 013.03.2011 7:00 335 0.27 22 27 0 28.03.2011 7:00 245 2.01 30 39 013.03.2011 8:00 337.5 0.28 29 13 0 28.03.2011 8:00 247.5 2.22 32 38 613.03.2011 9:00 340 0.32 34 15 0 28.03.2011 9:00 251 2.05 34 28 013.03.2011 10:00 312 1.08 35 17 0 28.03.2011 10:00 288 1.99 39 22 013.03.2011 11:00 315 1.11 36 14 0 28.03.2011 11:00 292.5 1.94 41 19 913.03.2011 12:00 318 1.15 35 12 0 28.03.2011 12:00 295 1.93 42 17 013.03.2011 13:00 335.5 1.27 34 13 0 28.03.2011 13:00 312 1.92 44 14 013.03.2011 14:00 337.5 1.39 36 12 0 28.03.2011 14:00 315 1.94 43 11 213.03.2011 15:00 340 1.41 34 18 0 28.03.2011 15:00 317 1.75 41 12 013.03.2011 16:00 335 1.23 32 17 0 28.03.2011 16:00 334 1.48 37 13 013.03.2011 17:00 337.5 1.11 31 20 0 28.03.2011 17:00 337.5 1.39 36 14 013.03.2011 18:00 340 1.28 28 23 0 28.03.2011 18:00 339 1.12 34 12 013.03.2011 19:00 88 0.59 26 25 0 28.03.2011 19:00 43 0.85 32 17 013.03.2011 20:00 90 0.56 24 29 0 28.03.2011 20:00 45 0.56 31 18 013.03.2011 21:00 92 0.57 23 30 0 28.03.2011 21:00 47 0.94 29 19 013.03.2011 22:00 155 0.55 22 28 0 28.03.2011 22:00 178 1.54 28 22 013.03.2011 23:00 157.5 0.56 21 29 0 28.03.2011 23:00 180 1.94 30 21 013.03.2011 0:00 160 0.58 22 30 0 28.03.2011 0:00 183 1.25 28 24 014.03.2011 1:00 178 0.54 19 33 0 29.03.2011 1:00 200 1.32 26 35 014.03.2011 2:00 180 0.56 21 32 0 29.03.2011 2:00 202.5 1.67 25 41 014.03.2011 3:00 182 0.52 20 37 0 29.03.2011 3:00 205 1.57 24 44 014.03.2011 4:00 133 0.27 19 45 0 29.03.2011 4:00 222 1.35 22 48 014.03.2011 5:00 135 0.28 18 49 0 29.03.2011 5:00 225 1.39 23 51 114.03.2011 6:00 136 0.32 22 42 0 29.03.2011 6:00 228 1.48 24 47 014.03.2011 7:00 65 0.54 25 37 0 29.03.2011 7:00 265 1.91 28 42 014.03.2011 8:00 67.5 0.56 29 27 0 29.03.2011 8:00 270 1.94 29 43 314.03.2011 9:00 70 0.64 32 22 0 29.03.2011 9:00 274 2.22 32 32 014.03.2011 10:00 43 0.75 35 14 0 29.03.2011 10:00 290 2.42 38 28 014.03.2011 11:00 45 0.83 38 11 0 29.03.2011 11:00 292.5 2.5 40 17 414.03.2011 12:00 48 0.77 37 9 0 29.03.2011 12:00 295 2.12 38 16 014.03.2011 13:00 20 0.79 36 8 0 29.03.2011 13:00 289 1.99 42 15 014.03.2011 14:00 22.5 0.83 38 10 0 29.03.2011 14:00 292.5 1.94 41 14 514.03.2011 15:00 25 0.81 35 16 0 29.03.2011 15:00 296 1.95 40 15 014.03.2011 16:00 87 0.84 32 18 0 29.03.2011 16:00 245 1.93 37 17 014.03.2011 17:00 90 0.83 31 20 0 29.03.2011 17:00 247.5 1.94 38 19 414.03.2011 18:00 95 0.98 28 23 0 29.03.2011 18:00 251 2.25 36 21 014.03.2011 19:00 110 1.07 25 21 0 29.03.2011 19:00 221 2.41 34 28 014.03.2011 20:00 112.5 1.11 24 22 0 29.03.2011 20:00 225 2.5 32 29 314.03.2011 21:00 116 1.14 23 23 0 29.03.2011 21:00 228 2.48 30 32 014.03.2011 22:00 155 1.04 21 22 0 29.03.2011 22:00 222 2.49 29 33 014.03.2011 23:00 157.5 1.11 22 20 0 29.03.2011 23:00 225 2.5 31 34 314.03.2011 0:00 161 1.09 20 26 0 29.03.2011 0:00 229 2.33 28 25 015.03.2011 1:00 177 1.06 19 24 0 30.03.2011 1:00 228 2.21 27 33 0
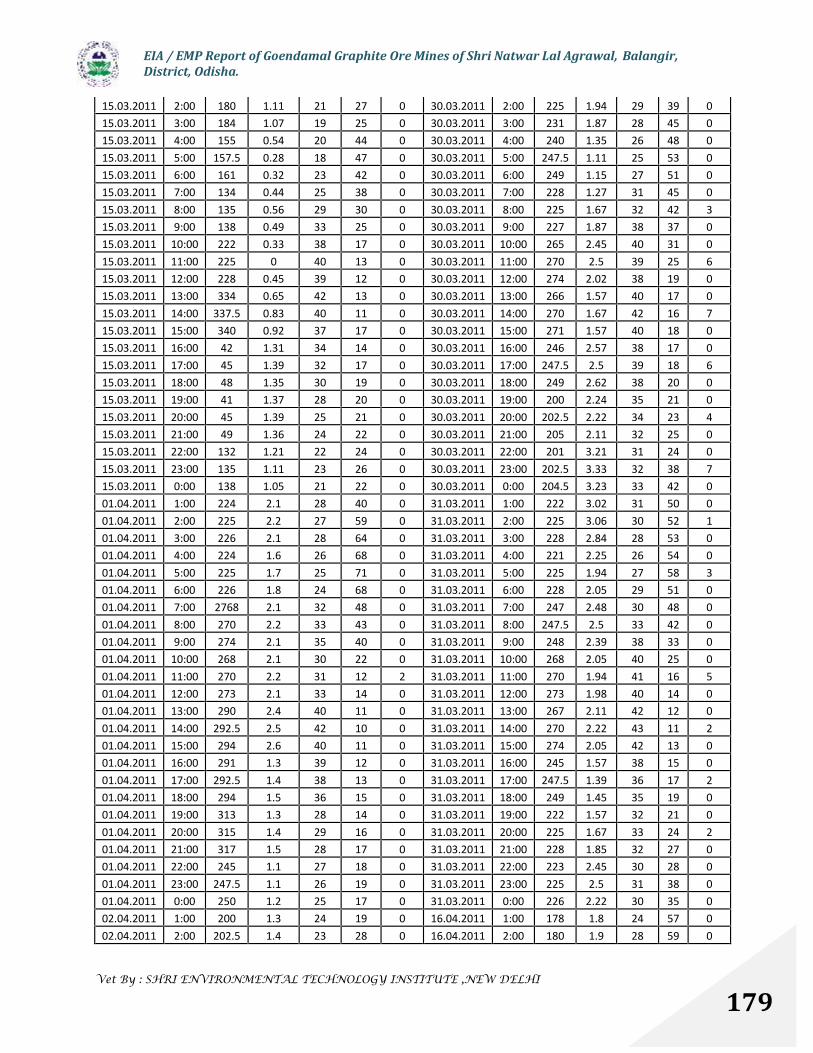
EIA / EMP Report of Goendamal Graphite Ore Mines of Shri Natwar Lal Agrawal, Balangir,District, Odisha.
Vet By : SHRI ENVIRONMENTAL TECHNOLOGY INSTITUTE ,NEW DELHI
179
15.03.2011 2:00 180 1.11 21 27 0 30.03.2011 2:00 225 1.94 29 39 015.03.2011 3:00 184 1.07 19 25 0 30.03.2011 3:00 231 1.87 28 45 015.03.2011 4:00 155 0.54 20 44 0 30.03.2011 4:00 240 1.35 26 48 015.03.2011 5:00 157.5 0.28 18 47 0 30.03.2011 5:00 247.5 1.11 25 53 015.03.2011 6:00 161 0.32 23 42 0 30.03.2011 6:00 249 1.15 27 51 015.03.2011 7:00 134 0.44 25 38 0 30.03.2011 7:00 228 1.27 31 45 015.03.2011 8:00 135 0.56 29 30 0 30.03.2011 8:00 225 1.67 32 42 315.03.2011 9:00 138 0.49 33 25 0 30.03.2011 9:00 227 1.87 38 37 015.03.2011 10:00 222 0.33 38 17 0 30.03.2011 10:00 265 2.45 40 31 015.03.2011 11:00 225 0 40 13 0 30.03.2011 11:00 270 2.5 39 25 615.03.2011 12:00 228 0.45 39 12 0 30.03.2011 12:00 274 2.02 38 19 015.03.2011 13:00 334 0.65 42 13 0 30.03.2011 13:00 266 1.57 40 17 015.03.2011 14:00 337.5 0.83 40 11 0 30.03.2011 14:00 270 1.67 42 16 715.03.2011 15:00 340 0.92 37 17 0 30.03.2011 15:00 271 1.57 40 18 015.03.2011 16:00 42 1.31 34 14 0 30.03.2011 16:00 246 2.57 38 17 015.03.2011 17:00 45 1.39 32 17 0 30.03.2011 17:00 247.5 2.5 39 18 615.03.2011 18:00 48 1.35 30 19 0 30.03.2011 18:00 249 2.62 38 20 015.03.2011 19:00 41 1.37 28 20 0 30.03.2011 19:00 200 2.24 35 21 015.03.2011 20:00 45 1.39 25 21 0 30.03.2011 20:00 202.5 2.22 34 23 415.03.2011 21:00 49 1.36 24 22 0 30.03.2011 21:00 205 2.11 32 25 015.03.2011 22:00 132 1.21 22 24 0 30.03.2011 22:00 201 3.21 31 24 015.03.2011 23:00 135 1.11 23 26 0 30.03.2011 23:00 202.5 3.33 32 38 715.03.2011 0:00 138 1.05 21 22 0 30.03.2011 0:00 204.5 3.23 33 42 001.04.2011 1:00 224 2.1 28 40 0 31.03.2011 1:00 222 3.02 31 50 001.04.2011 2:00 225 2.2 27 59 0 31.03.2011 2:00 225 3.06 30 52 101.04.2011 3:00 226 2.1 28 64 0 31.03.2011 3:00 228 2.84 28 53 001.04.2011 4:00 224 1.6 26 68 0 31.03.2011 4:00 221 2.25 26 54 001.04.2011 5:00 225 1.7 25 71 0 31.03.2011 5:00 225 1.94 27 58 301.04.2011 6:00 226 1.8 24 68 0 31.03.2011 6:00 228 2.05 29 51 001.04.2011 7:00 2768 2.1 32 48 0 31.03.2011 7:00 247 2.48 30 48 001.04.2011 8:00 270 2.2 33 43 0 31.03.2011 8:00 247.5 2.5 33 42 001.04.2011 9:00 274 2.1 35 40 0 31.03.2011 9:00 248 2.39 38 33 001.04.2011 10:00 268 2.1 30 22 0 31.03.2011 10:00 268 2.05 40 25 001.04.2011 11:00 270 2.2 31 12 2 31.03.2011 11:00 270 1.94 41 16 501.04.2011 12:00 273 2.1 33 14 0 31.03.2011 12:00 273 1.98 40 14 001.04.2011 13:00 290 2.4 40 11 0 31.03.2011 13:00 267 2.11 42 12 001.04.2011 14:00 292.5 2.5 42 10 0 31.03.2011 14:00 270 2.22 43 11 201.04.2011 15:00 294 2.6 40 11 0 31.03.2011 15:00 274 2.05 42 13 001.04.2011 16:00 291 1.3 39 12 0 31.03.2011 16:00 245 1.57 38 15 001.04.2011 17:00 292.5 1.4 38 13 0 31.03.2011 17:00 247.5 1.39 36 17 201.04.2011 18:00 294 1.5 36 15 0 31.03.2011 18:00 249 1.45 35 19 001.04.2011 19:00 313 1.3 28 14 0 31.03.2011 19:00 222 1.57 32 21 001.04.2011 20:00 315 1.4 29 16 0 31.03.2011 20:00 225 1.67 33 24 201.04.2011 21:00 317 1.5 28 17 0 31.03.2011 21:00 228 1.85 32 27 001.04.2011 22:00 245 1.1 27 18 0 31.03.2011 22:00 223 2.45 30 28 001.04.2011 23:00 247.5 1.1 26 19 0 31.03.2011 23:00 225 2.5 31 38 001.04.2011 0:00 250 1.2 25 17 0 31.03.2011 0:00 226 2.22 30 35 002.04.2011 1:00 200 1.3 24 19 0 16.04.2011 1:00 178 1.8 24 57 002.04.2011 2:00 202.5 1.4 23 28 0 16.04.2011 2:00 180 1.9 28 59 0
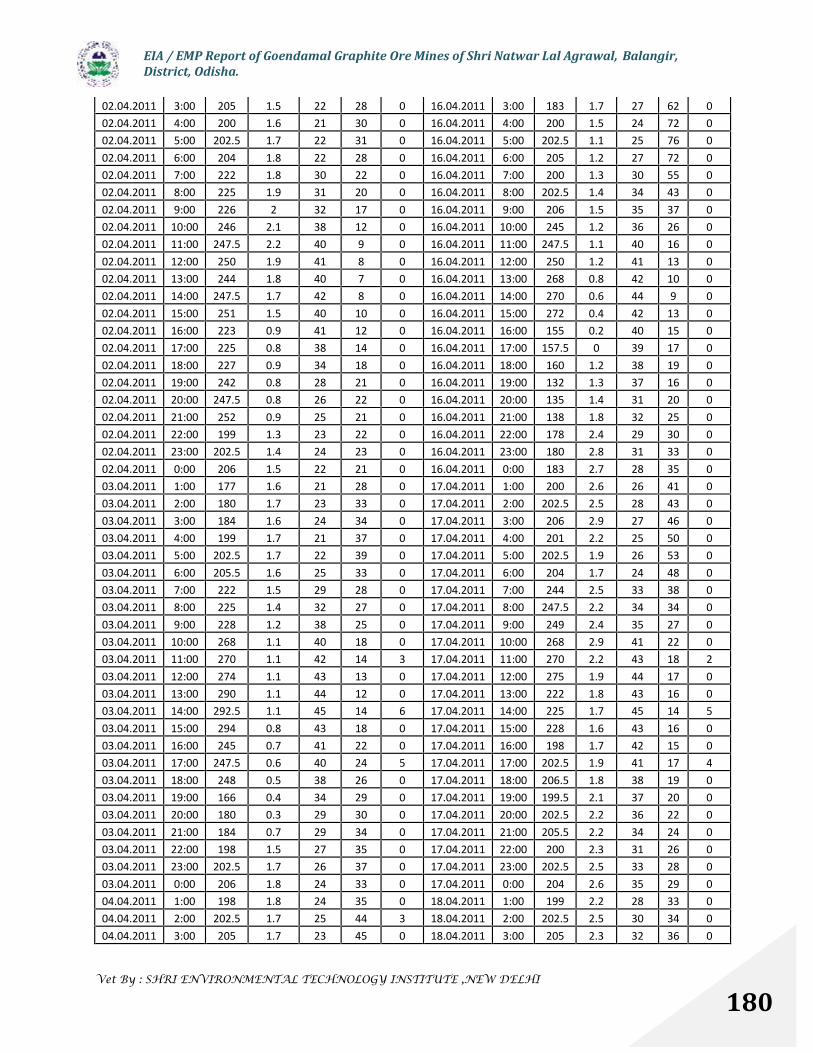
EIA / EMP Report of Goendamal Graphite Ore Mines of Shri Natwar Lal Agrawal, Balangir,District, Odisha.
Vet By : SHRI ENVIRONMENTAL TECHNOLOGY INSTITUTE ,NEW DELHI
180
02.04.2011 3:00 205 1.5 22 28 0 16.04.2011 3:00 183 1.7 27 62 002.04.2011 4:00 200 1.6 21 30 0 16.04.2011 4:00 200 1.5 24 72 002.04.2011 5:00 202.5 1.7 22 31 0 16.04.2011 5:00 202.5 1.1 25 76 002.04.2011 6:00 204 1.8 22 28 0 16.04.2011 6:00 205 1.2 27 72 002.04.2011 7:00 222 1.8 30 22 0 16.04.2011 7:00 200 1.3 30 55 002.04.2011 8:00 225 1.9 31 20 0 16.04.2011 8:00 202.5 1.4 34 43 002.04.2011 9:00 226 2 32 17 0 16.04.2011 9:00 206 1.5 35 37 002.04.2011 10:00 246 2.1 38 12 0 16.04.2011 10:00 245 1.2 36 26 002.04.2011 11:00 247.5 2.2 40 9 0 16.04.2011 11:00 247.5 1.1 40 16 002.04.2011 12:00 250 1.9 41 8 0 16.04.2011 12:00 250 1.2 41 13 002.04.2011 13:00 244 1.8 40 7 0 16.04.2011 13:00 268 0.8 42 10 002.04.2011 14:00 247.5 1.7 42 8 0 16.04.2011 14:00 270 0.6 44 9 002.04.2011 15:00 251 1.5 40 10 0 16.04.2011 15:00 272 0.4 42 13 002.04.2011 16:00 223 0.9 41 12 0 16.04.2011 16:00 155 0.2 40 15 002.04.2011 17:00 225 0.8 38 14 0 16.04.2011 17:00 157.5 0 39 17 002.04.2011 18:00 227 0.9 34 18 0 16.04.2011 18:00 160 1.2 38 19 002.04.2011 19:00 242 0.8 28 21 0 16.04.2011 19:00 132 1.3 37 16 002.04.2011 20:00 247.5 0.8 26 22 0 16.04.2011 20:00 135 1.4 31 20 002.04.2011 21:00 252 0.9 25 21 0 16.04.2011 21:00 138 1.8 32 25 002.04.2011 22:00 199 1.3 23 22 0 16.04.2011 22:00 178 2.4 29 30 002.04.2011 23:00 202.5 1.4 24 23 0 16.04.2011 23:00 180 2.8 31 33 002.04.2011 0:00 206 1.5 22 21 0 16.04.2011 0:00 183 2.7 28 35 003.04.2011 1:00 177 1.6 21 28 0 17.04.2011 1:00 200 2.6 26 41 003.04.2011 2:00 180 1.7 23 33 0 17.04.2011 2:00 202.5 2.5 28 43 003.04.2011 3:00 184 1.6 24 34 0 17.04.2011 3:00 206 2.9 27 46 003.04.2011 4:00 199 1.7 21 37 0 17.04.2011 4:00 201 2.2 25 50 003.04.2011 5:00 202.5 1.7 22 39 0 17.04.2011 5:00 202.5 1.9 26 53 003.04.2011 6:00 205.5 1.6 25 33 0 17.04.2011 6:00 204 1.7 24 48 003.04.2011 7:00 222 1.5 29 28 0 17.04.2011 7:00 244 2.5 33 38 003.04.2011 8:00 225 1.4 32 27 0 17.04.2011 8:00 247.5 2.2 34 34 003.04.2011 9:00 228 1.2 38 25 0 17.04.2011 9:00 249 2.4 35 27 003.04.2011 10:00 268 1.1 40 18 0 17.04.2011 10:00 268 2.9 41 22 003.04.2011 11:00 270 1.1 42 14 3 17.04.2011 11:00 270 2.2 43 18 203.04.2011 12:00 274 1.1 43 13 0 17.04.2011 12:00 275 1.9 44 17 003.04.2011 13:00 290 1.1 44 12 0 17.04.2011 13:00 222 1.8 43 16 003.04.2011 14:00 292.5 1.1 45 14 6 17.04.2011 14:00 225 1.7 45 14 503.04.2011 15:00 294 0.8 43 18 0 17.04.2011 15:00 228 1.6 43 16 003.04.2011 16:00 245 0.7 41 22 0 17.04.2011 16:00 198 1.7 42 15 003.04.2011 17:00 247.5 0.6 40 24 5 17.04.2011 17:00 202.5 1.9 41 17 403.04.2011 18:00 248 0.5 38 26 0 17.04.2011 18:00 206.5 1.8 38 19 003.04.2011 19:00 166 0.4 34 29 0 17.04.2011 19:00 199.5 2.1 37 20 003.04.2011 20:00 180 0.3 29 30 0 17.04.2011 20:00 202.5 2.2 36 22 003.04.2011 21:00 184 0.7 29 34 0 17.04.2011 21:00 205.5 2.2 34 24 003.04.2011 22:00 198 1.5 27 35 0 17.04.2011 22:00 200 2.3 31 26 003.04.2011 23:00 202.5 1.7 26 37 0 17.04.2011 23:00 202.5 2.5 33 28 003.04.2011 0:00 206 1.8 24 33 0 17.04.2011 0:00 204 2.6 35 29 004.04.2011 1:00 198 1.8 24 35 0 18.04.2011 1:00 199 2.2 28 33 004.04.2011 2:00 202.5 1.7 25 44 3 18.04.2011 2:00 202.5 2.5 30 34 004.04.2011 3:00 205 1.7 23 45 0 18.04.2011 3:00 205 2.3 32 36 0

EIA / EMP Report of Goendamal Graphite Ore Mines of Shri Natwar Lal Agrawal, Balangir,District, Odisha.
Vet By : SHRI ENVIRONMENTAL TECHNOLOGY INSTITUTE ,NEW DELHI
181
04.04.2011 4:00 222 1.7 22 46 0 18.04.2011 4:00 222 1.8 27 38 004.04.2011 5:00 225 1.7 24 47 3 18.04.2011 5:00 225 1.9 28 45 004.04.2011 6:00 228 1.7 22 42 0 18.04.2011 6:00 228 1.7 29 42 004.04.2011 7:00 245 1.8 31 35 0 18.04.2011 7:00 245 1.5 36 38 004.04.2011 8:00 247.5 1.9 33 32 0 18.04.2011 8:00 247.5 2.5 35 36 004.04.2011 9:00 249 1.8 35 28 0 18.04.2011 9:00 249 2.4 38 28 004.04.2011 10:00 267 1.7 40 12 0 18.04.2011 10:00 267 1.7 42 18 004.04.2011 11:00 270 1.9 42 10 0 18.04.2011 11:00 270 1.9 45 13 004.04.2011 12:00 272 1.8 43 8 0 18.04.2011 12:00 274 1.8 42 12 004.04.2011 13:00 290 1.8 42 7 0 18.04.2011 13:00 266 1.6 47 11 004.04.2011 14:00 292.5 1.9 43 9 0 18.04.2011 14:00 270 1.7 46 10 204.04.2011 15:00 295 1.7 42 10 0 18.04.2011 15:00 272 1.5 44 13 004.04.2011 16:00 291 1.5 36 11 0 18.04.2011 16:00 245.5 1.2 42 10 004.04.2011 17:00 292.5 1.1 38 13 0 18.04.2011 17:00 247.5 1.4 43 12 004.04.2011 18:00 296 1 32 15 0 18.04.2011 18:00 250.5 1.5 40 14 004.04.2011 19:00 290 1.1 29 17 0 18.04.2011 19:00 246.5 1.6 38 15 004.04.2011 20:00 292.5 1.1 28 18 0 18.04.2011 20:00 247.5 1.7 35 17 004.04.2011 21:00 296 1 27 20 0 18.04.2011 21:00 249 1.8 35 18 004.04.2011 22:00 244 1.1 25 19 0 18.04.2011 22:00 222.5 2.1 30 19 004.04.2011 23:00 247.5 1.1 26 20 0 18.04.2011 23:00 225 2.2 33 20 004.04.2011 0:00 248 1.1 25 22 0 18.04.2011 0:00 225.5 2.4 32 22 005.04.2011 1:00 200 1 22 25 0 19.04.2011 1:00 222 1.7 28 28 005.04.2011 2:00 202.5 1.1 23 27 0 19.04.2011 2:00 225 1.9 30 30 005.04.2011 3:00 205 1.2 22 29 0 19.04.2011 3:00 228 1.8 32 31 005.04.2011 4:00 201 1.3 20 30 0 19.04.2011 4:00 221 1.7 27 42 005.04.2011 5:00 202.5 1.4 21 33 0 19.04.2011 5:00 225 1.9 29 40 005.04.2011 6:00 206 1.3 24 30 0 19.04.2011 6:00 229 1.8 28 42 005.04.2011 7:00 244 1.2 28 27 0 19.04.2011 7:00 267 3.2 35 28 005.04.2011 8:00 247.5 1.4 32 21 0 19.04.2011 8:00 270 3.1 37 30 005.04.2011 9:00 251 1.2 34 17 0 19.04.2011 9:00 272 3.2 36 38 005.04.2011 10:00 312 1.3 42 12 0 19.04.2011 10:00 287 2.6 42 15 005.04.2011 11:00 315 1.4 43 9 0 19.04.2011 11:00 292.5 2.5 45 11 205.04.2011 12:00 317 1.3 45 7 0 19.04.2011 12:00 295 2.2 46 15 005.04.2011 13:00 318 1.2 43 6 0 19.04.2011 13:00 268 3.2 47 12 005.04.2011 14:00 315 1.1 44 8 0 19.04.2011 14:00 270 3.1 43 15 405.04.2011 15:00 318 0.9 40 12 0 19.04.2011 15:00 273 3.5 46 17 005.04.2011 16:00 245 0.7 39 14 0 19.04.2011 16:00 221 1.9 37 19 005.04.2011 17:00 247.5 0.6 38 16 0 19.04.2011 17:00 225 2.2 38 20 005.04.2011 18:00 248 0.5 37 22 0 19.04.2011 18:00 226.5 2.3 39 22 005.04.2011 19:00 201 0.7 29 32 0 19.04.2011 19:00 200.5 1.6 34 24 005.04.2011 20:00 202.5 0.6 27 36 0 19.04.2011 20:00 202.5 1.7 35 25 005.04.2011 21:00 206 0.5 25 38 0 19.04.2011 21:00 204.5 1.8 36 27 005.04.2011 22:00 245 0.6 23 45 0 19.04.2011 22:00 200 2.1 32 29 005.04.2011 23:00 247.5 0.6 24 54 0 19.04.2011 23:00 202.5 2.2 33 34 005.04.2011 0:00 252 0.7 22 51 0 19.04.2011 0:00 205.5 2.4 35 30 006.04.2011 1:00 222 0.6 21 35 0 20.04.2011 1:00 222 2.4 33 37 006.04.2011 2:00 225 0.8 22 24 0 20.04.2011 2:00 225 2.5 31 36 406.04.2011 3:00 228 0.7 23 28 0 20.04.2011 3:00 228 2.6 32 37 006.04.2011 4:00 227 0.6 21 30 0 20.04.2011 4:00 221 1.8 34 38 0

EIA / EMP Report of Goendamal Graphite Ore Mines of Shri Natwar Lal Agrawal, Balangir,District, Odisha.
Vet By : SHRI ENVIRONMENTAL TECHNOLOGY INSTITUTE ,NEW DELHI
182
06.04.2011 5:00 225 0.8 20 31 0 20.04.2011 5:00 225 1.9 31 36 406.04.2011 6:00 229 0.7 25 28 0 20.04.2011 6:00 226 2.4 32 37 006.04.2011 7:00 245.5 0.8 34 18 0 20.04.2011 7:00 269 2.2 33 30 006.04.2011 8:00 247.5 0.6 35 15 0 20.04.2011 8:00 270 2.5 35 29 206.04.2011 9:00 251.5 0.5 38 28 0 20.04.2011 9:00 274 2.3 37 28 006.04.2011 10:00 20 0.4 44 8 0 20.04.2011 10:00 290 1.8 38 15 006.04.2011 11:00 22.5 0.6 46 7 0 20.04.2011 11:00 292.5 1.9 41 14 006.04.2011 12:00 25 0.5 46 9 0 20.04.2011 12:00 295 1.7 43 12 006.04.2011 13:00 335 0.4 47 8 0 20.04.2011 13:00 245 2.2 41 11 006.04.2011 14:00 337.5 0.3 46 7 0 20.04.2011 14:00 247.5 2.8 44 10 006.04.2011 15:00 339 0.4 45 18 0 20.04.2011 15:00 248 2.5 45 9 006.04.2011 16:00 337 0.2 41 15 0 20.04.2011 16:00 244 2.4 43 8 006.04.2011 17:00 337.5 0.3 39 14 0 20.04.2011 17:00 247.5 2.2 42 10 006.04.2011 18:00 338 0.4 37 22 0 20.04.2011 18:00 249.5 2.3 45 12 006.04.2011 19:00 65 0.2 31 35 0 20.04.2011 19:00 222.5 1.8 30 17 006.04.2011 20:00 67.5 0.3 27 37 0 20.04.2011 20:00 225 1.7 31 19 006.04.2011 21:00 69 0.4 26 31 0 20.04.2011 21:00 228 1.6 32 17 006.04.2011 22:00 155 0.2 27 25 0 20.04.2011 22:00 200.5 2.4 28 34 006.04.2011 23:00 157.5 1.9 28 16 0 20.04.2011 23:00 202.5 2.2 29 35 006.04.2011 0:00 159 1.8 25 14 0 20.04.2011 0:00 205 2.4 27 32 007.04.2011 1:00 198 1.5 23 19 0 21.04.2011 1:00 200.5 1.8 26 33 007.04.2011 2:00 202.5 1.4 24 32 0 21.04.2011 2:00 202.5 1.9 27 50 007.04.2011 3:00 205 1.2 23 38 0 21.04.2011 3:00 204.5 1.7 28 53 007.04.2011 4:00 245 1.3 20 47 0 21.04.2011 4:00 201 1.8 26 52 007.04.2011 5:00 247.5 1.1 21 54 0 21.04.2011 5:00 202.5 1.7 25 54 007.04.2011 6:00 251 1 25 49 0 21.04.2011 6:00 205.5 1.8 29 45 007.04.2011 7:00 244 0.8 30 32 0 21.04.2011 7:00 245 1.5 33 33 007.04.2011 8:00 247.5 0.6 34 25 0 21.04.2011 8:00 247.5 1.7 35 23 007.04.2011 9:00 252 0.5 39 18 0 21.04.2011 9:00 251.5 1.9 38 20 007.04.2011 10:00 357 0.4 42 12 0 21.04.2011 10:00 290.5 2.1 42 15 007.04.2011 11:00 360 0.6 45 9 0 21.04.2011 11:00 292.5 2.2 44 9 007.04.2011 12:00 364 0.7 46 7 0 21.04.2011 12:00 295 2.3 46 7 007.04.2011 13:00 334 0.5 47 8 0 21.04.2011 13:00 268 2.4 43 9 007.04.2011 14:00 337.5 0.6 46 7 0 21.04.2011 14:00 270 2.5 45 8 007.04.2011 15:00 339 0.7 46 9 0 21.04.2011 15:00 275 2.7 44 6 007.04.2011 16:00 335 0.4 42 12 0 21.04.2011 16:00 244.5 1.5 43 8 007.04.2011 17:00 337.5 0.3 40 14 0 21.04.2011 17:00 247.5 1.4 41 10 007.04.2011 18:00 339 0.4 38 18 0 21.04.2011 18:00 249 1.6 38 13 007.04.2011 19:00 65 0.5 29 25 0 21.04.2011 19:00 222 1.5 33 15 007.04.2011 20:00 67.5 0.6 28 28 0 21.04.2011 20:00 225 1.4 30 18 007.04.2011 21:00 69 0.8 29 29 0 21.04.2011 21:00 228 1.8 31 22 007.04.2011 22:00 154 1.5 26 22 0 21.04.2011 22:00 221 1.4 29 23 007.04.2011 23:00 157.5 1.7 27 21 0 21.04.2011 23:00 225 1.1 28 24 007.04.2011 0:00 161 1.2 28 22 0 21.04.2011 0:00 229 1.2 27 22 008.04.2011 1:00 176 1.3 22 28 0 22.04.2011 1:00 222 1.8 26 36 008.04.2011 2:00 180 1.4 23 37 19 22.04.2011 2:00 225 1.9 27 35 008.04.2011 3:00 185 1.2 21 39 0 22.04.2011 3:00 228 2.1 25 38 008.04.2011 4:00 175 0.9 22 45 0 22.04.2011 4:00 221 1.6 26 42 008.04.2011 5:00 180 0.8 21 52 27 22.04.2011 5:00 225 1.7 25 46 2
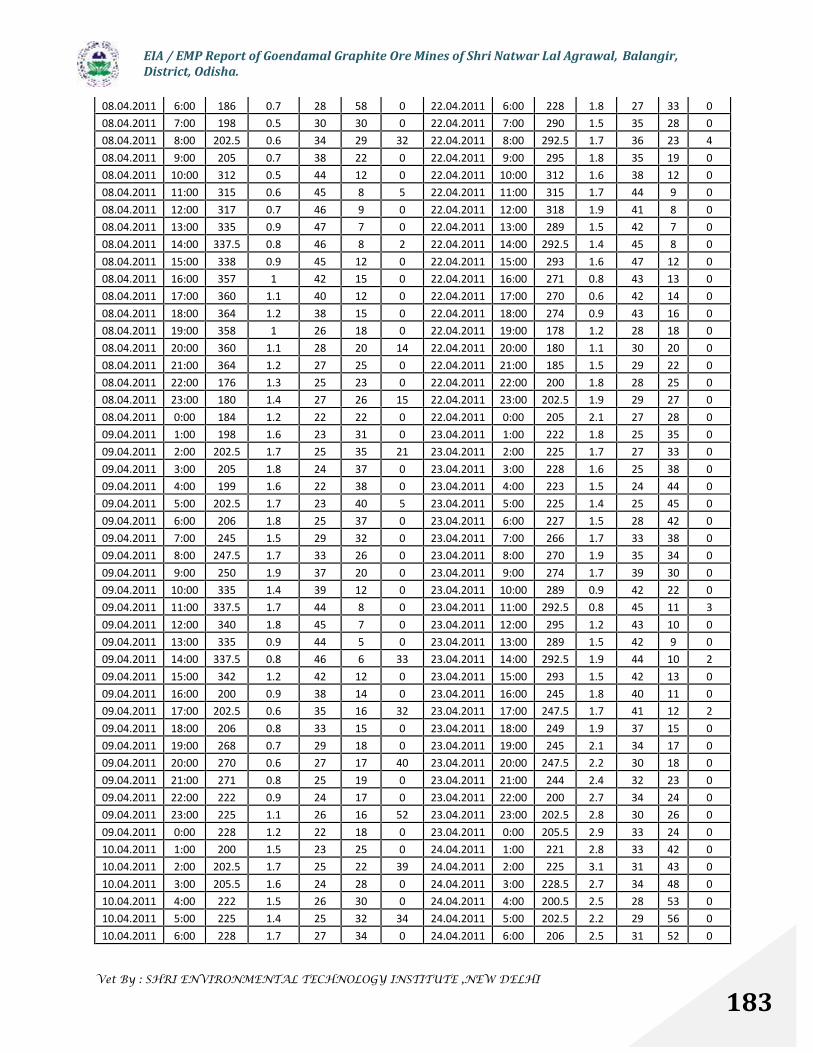
EIA / EMP Report of Goendamal Graphite Ore Mines of Shri Natwar Lal Agrawal, Balangir,District, Odisha.
Vet By : SHRI ENVIRONMENTAL TECHNOLOGY INSTITUTE ,NEW DELHI
183
08.04.2011 6:00 186 0.7 28 58 0 22.04.2011 6:00 228 1.8 27 33 008.04.2011 7:00 198 0.5 30 30 0 22.04.2011 7:00 290 1.5 35 28 008.04.2011 8:00 202.5 0.6 34 29 32 22.04.2011 8:00 292.5 1.7 36 23 408.04.2011 9:00 205 0.7 38 22 0 22.04.2011 9:00 295 1.8 35 19 008.04.2011 10:00 312 0.5 44 12 0 22.04.2011 10:00 312 1.6 38 12 008.04.2011 11:00 315 0.6 45 8 5 22.04.2011 11:00 315 1.7 44 9 008.04.2011 12:00 317 0.7 46 9 0 22.04.2011 12:00 318 1.9 41 8 008.04.2011 13:00 335 0.9 47 7 0 22.04.2011 13:00 289 1.5 42 7 008.04.2011 14:00 337.5 0.8 46 8 2 22.04.2011 14:00 292.5 1.4 45 8 008.04.2011 15:00 338 0.9 45 12 0 22.04.2011 15:00 293 1.6 47 12 008.04.2011 16:00 357 1 42 15 0 22.04.2011 16:00 271 0.8 43 13 008.04.2011 17:00 360 1.1 40 12 0 22.04.2011 17:00 270 0.6 42 14 008.04.2011 18:00 364 1.2 38 15 0 22.04.2011 18:00 274 0.9 43 16 008.04.2011 19:00 358 1 26 18 0 22.04.2011 19:00 178 1.2 28 18 008.04.2011 20:00 360 1.1 28 20 14 22.04.2011 20:00 180 1.1 30 20 008.04.2011 21:00 364 1.2 27 25 0 22.04.2011 21:00 185 1.5 29 22 008.04.2011 22:00 176 1.3 25 23 0 22.04.2011 22:00 200 1.8 28 25 008.04.2011 23:00 180 1.4 27 26 15 22.04.2011 23:00 202.5 1.9 29 27 008.04.2011 0:00 184 1.2 22 22 0 22.04.2011 0:00 205 2.1 27 28 009.04.2011 1:00 198 1.6 23 31 0 23.04.2011 1:00 222 1.8 25 35 009.04.2011 2:00 202.5 1.7 25 35 21 23.04.2011 2:00 225 1.7 27 33 009.04.2011 3:00 205 1.8 24 37 0 23.04.2011 3:00 228 1.6 25 38 009.04.2011 4:00 199 1.6 22 38 0 23.04.2011 4:00 223 1.5 24 44 009.04.2011 5:00 202.5 1.7 23 40 5 23.04.2011 5:00 225 1.4 25 45 009.04.2011 6:00 206 1.8 25 37 0 23.04.2011 6:00 227 1.5 28 42 009.04.2011 7:00 245 1.5 29 32 0 23.04.2011 7:00 266 1.7 33 38 009.04.2011 8:00 247.5 1.7 33 26 0 23.04.2011 8:00 270 1.9 35 34 009.04.2011 9:00 250 1.9 37 20 0 23.04.2011 9:00 274 1.7 39 30 009.04.2011 10:00 335 1.4 39 12 0 23.04.2011 10:00 289 0.9 42 22 009.04.2011 11:00 337.5 1.7 44 8 0 23.04.2011 11:00 292.5 0.8 45 11 309.04.2011 12:00 340 1.8 45 7 0 23.04.2011 12:00 295 1.2 43 10 009.04.2011 13:00 335 0.9 44 5 0 23.04.2011 13:00 289 1.5 42 9 009.04.2011 14:00 337.5 0.8 46 6 33 23.04.2011 14:00 292.5 1.9 44 10 209.04.2011 15:00 342 1.2 42 12 0 23.04.2011 15:00 293 1.5 42 13 009.04.2011 16:00 200 0.9 38 14 0 23.04.2011 16:00 245 1.8 40 11 009.04.2011 17:00 202.5 0.6 35 16 32 23.04.2011 17:00 247.5 1.7 41 12 209.04.2011 18:00 206 0.8 33 15 0 23.04.2011 18:00 249 1.9 37 15 009.04.2011 19:00 268 0.7 29 18 0 23.04.2011 19:00 245 2.1 34 17 009.04.2011 20:00 270 0.6 27 17 40 23.04.2011 20:00 247.5 2.2 30 18 009.04.2011 21:00 271 0.8 25 19 0 23.04.2011 21:00 244 2.4 32 23 009.04.2011 22:00 222 0.9 24 17 0 23.04.2011 22:00 200 2.7 34 24 009.04.2011 23:00 225 1.1 26 16 52 23.04.2011 23:00 202.5 2.8 30 26 009.04.2011 0:00 228 1.2 22 18 0 23.04.2011 0:00 205.5 2.9 33 24 010.04.2011 1:00 200 1.5 23 25 0 24.04.2011 1:00 221 2.8 33 42 010.04.2011 2:00 202.5 1.7 25 22 39 24.04.2011 2:00 225 3.1 31 43 010.04.2011 3:00 205.5 1.6 24 28 0 24.04.2011 3:00 228.5 2.7 34 48 010.04.2011 4:00 222 1.5 26 30 0 24.04.2011 4:00 200.5 2.5 28 53 010.04.2011 5:00 225 1.4 25 32 34 24.04.2011 5:00 202.5 2.2 29 56 010.04.2011 6:00 228 1.7 27 34 0 24.04.2011 6:00 206 2.5 31 52 0
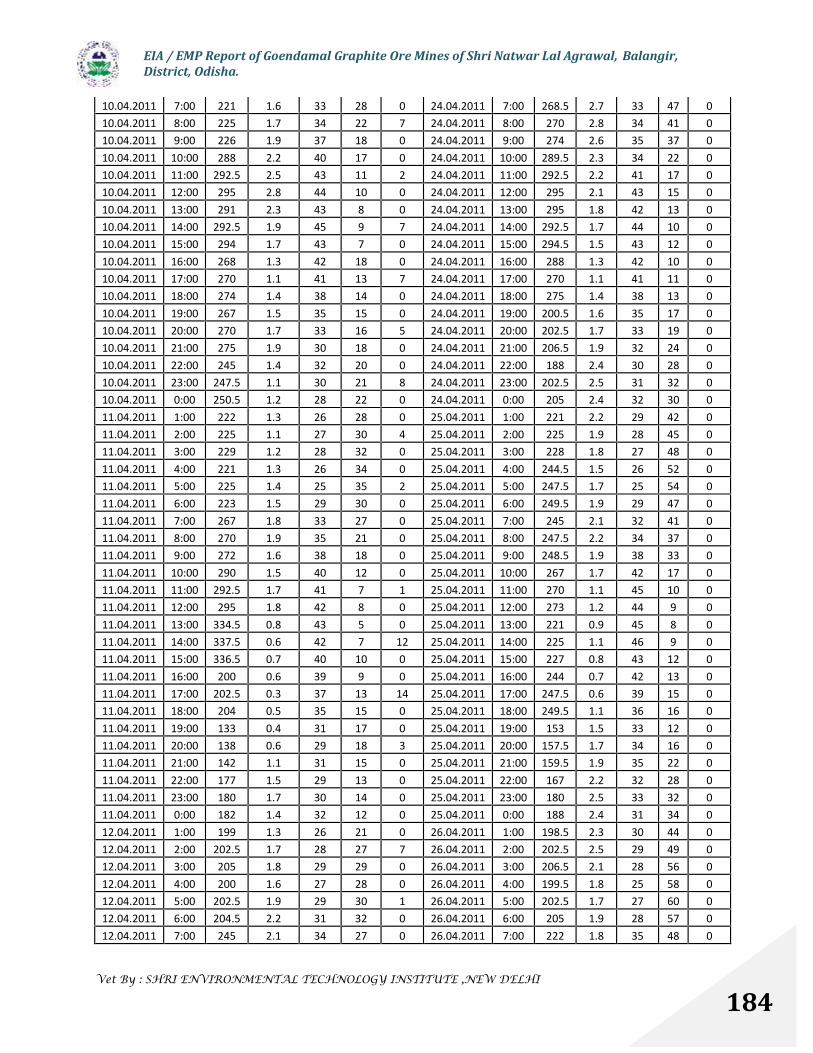
EIA / EMP Report of Goendamal Graphite Ore Mines of Shri Natwar Lal Agrawal, Balangir,District, Odisha.
Vet By : SHRI ENVIRONMENTAL TECHNOLOGY INSTITUTE ,NEW DELHI
184
10.04.2011 7:00 221 1.6 33 28 0 24.04.2011 7:00 268.5 2.7 33 47 010.04.2011 8:00 225 1.7 34 22 7 24.04.2011 8:00 270 2.8 34 41 010.04.2011 9:00 226 1.9 37 18 0 24.04.2011 9:00 274 2.6 35 37 010.04.2011 10:00 288 2.2 40 17 0 24.04.2011 10:00 289.5 2.3 34 22 010.04.2011 11:00 292.5 2.5 43 11 2 24.04.2011 11:00 292.5 2.2 41 17 010.04.2011 12:00 295 2.8 44 10 0 24.04.2011 12:00 295 2.1 43 15 010.04.2011 13:00 291 2.3 43 8 0 24.04.2011 13:00 295 1.8 42 13 010.04.2011 14:00 292.5 1.9 45 9 7 24.04.2011 14:00 292.5 1.7 44 10 010.04.2011 15:00 294 1.7 43 7 0 24.04.2011 15:00 294.5 1.5 43 12 010.04.2011 16:00 268 1.3 42 18 0 24.04.2011 16:00 288 1.3 42 10 010.04.2011 17:00 270 1.1 41 13 7 24.04.2011 17:00 270 1.1 41 11 010.04.2011 18:00 274 1.4 38 14 0 24.04.2011 18:00 275 1.4 38 13 010.04.2011 19:00 267 1.5 35 15 0 24.04.2011 19:00 200.5 1.6 35 17 010.04.2011 20:00 270 1.7 33 16 5 24.04.2011 20:00 202.5 1.7 33 19 010.04.2011 21:00 275 1.9 30 18 0 24.04.2011 21:00 206.5 1.9 32 24 010.04.2011 22:00 245 1.4 32 20 0 24.04.2011 22:00 188 2.4 30 28 010.04.2011 23:00 247.5 1.1 30 21 8 24.04.2011 23:00 202.5 2.5 31 32 010.04.2011 0:00 250.5 1.2 28 22 0 24.04.2011 0:00 205 2.4 32 30 011.04.2011 1:00 222 1.3 26 28 0 25.04.2011 1:00 221 2.2 29 42 011.04.2011 2:00 225 1.1 27 30 4 25.04.2011 2:00 225 1.9 28 45 011.04.2011 3:00 229 1.2 28 32 0 25.04.2011 3:00 228 1.8 27 48 011.04.2011 4:00 221 1.3 26 34 0 25.04.2011 4:00 244.5 1.5 26 52 011.04.2011 5:00 225 1.4 25 35 2 25.04.2011 5:00 247.5 1.7 25 54 011.04.2011 6:00 223 1.5 29 30 0 25.04.2011 6:00 249.5 1.9 29 47 011.04.2011 7:00 267 1.8 33 27 0 25.04.2011 7:00 245 2.1 32 41 011.04.2011 8:00 270 1.9 35 21 0 25.04.2011 8:00 247.5 2.2 34 37 011.04.2011 9:00 272 1.6 38 18 0 25.04.2011 9:00 248.5 1.9 38 33 011.04.2011 10:00 290 1.5 40 12 0 25.04.2011 10:00 267 1.7 42 17 011.04.2011 11:00 292.5 1.7 41 7 1 25.04.2011 11:00 270 1.1 45 10 011.04.2011 12:00 295 1.8 42 8 0 25.04.2011 12:00 273 1.2 44 9 011.04.2011 13:00 334.5 0.8 43 5 0 25.04.2011 13:00 221 0.9 45 8 011.04.2011 14:00 337.5 0.6 42 7 12 25.04.2011 14:00 225 1.1 46 9 011.04.2011 15:00 336.5 0.7 40 10 0 25.04.2011 15:00 227 0.8 43 12 011.04.2011 16:00 200 0.6 39 9 0 25.04.2011 16:00 244 0.7 42 13 011.04.2011 17:00 202.5 0.3 37 13 14 25.04.2011 17:00 247.5 0.6 39 15 011.04.2011 18:00 204 0.5 35 15 0 25.04.2011 18:00 249.5 1.1 36 16 011.04.2011 19:00 133 0.4 31 17 0 25.04.2011 19:00 153 1.5 33 12 011.04.2011 20:00 138 0.6 29 18 3 25.04.2011 20:00 157.5 1.7 34 16 011.04.2011 21:00 142 1.1 31 15 0 25.04.2011 21:00 159.5 1.9 35 22 011.04.2011 22:00 177 1.5 29 13 0 25.04.2011 22:00 167 2.2 32 28 011.04.2011 23:00 180 1.7 30 14 0 25.04.2011 23:00 180 2.5 33 32 011.04.2011 0:00 182 1.4 32 12 0 25.04.2011 0:00 188 2.4 31 34 012.04.2011 1:00 199 1.3 26 21 0 26.04.2011 1:00 198.5 2.3 30 44 012.04.2011 2:00 202.5 1.7 28 27 7 26.04.2011 2:00 202.5 2.5 29 49 012.04.2011 3:00 205 1.8 29 29 0 26.04.2011 3:00 206.5 2.1 28 56 012.04.2011 4:00 200 1.6 27 28 0 26.04.2011 4:00 199.5 1.8 25 58 012.04.2011 5:00 202.5 1.9 29 30 1 26.04.2011 5:00 202.5 1.7 27 60 012.04.2011 6:00 204.5 2.2 31 32 0 26.04.2011 6:00 205 1.9 28 57 012.04.2011 7:00 245 2.1 34 27 0 26.04.2011 7:00 222 1.8 35 48 0

EIA / EMP Report of Goendamal Graphite Ore Mines of Shri Natwar Lal Agrawal, Balangir,District, Odisha.
Vet By : SHRI ENVIRONMENTAL TECHNOLOGY INSTITUTE ,NEW DELHI
185
12.04.2011 8:00 247.5 2.2 36 20 0 26.04.2011 8:00 225 1.9 34 41 012.04.2011 9:00 246 2.4 37 17 0 26.04.2011 9:00 228 1.5 35 38 012.04.2011 10:00 312 1.5 39 11 0 26.04.2011 10:00 267 1.2 39 25 012.04.2011 11:00 315 1.7 40 8 4 26.04.2011 11:00 270 1.1 41 12 212.04.2011 12:00 318 1.8 41 5 0 26.04.2011 12:00 275 0.9 42 10 012.04.2011 13:00 290 1.3 42 5 0 26.04.2011 13:00 290.5 0.7 45 9 012.04.2011 14:00 292.5 1.4 42 7 5 26.04.2011 14:00 292.5 0.6 42 8 012.04.2011 15:00 295 1.5 41 9 0 26.04.2011 15:00 295.5 0.7 41 10 012.04.2011 16:00 289 0.7 40 10 0 26.04.2011 16:00 200.5 0.3 41 12 012.04.2011 17:00 292.5 0.8 39 11 3 26.04.2011 17:00 202.5 0.8 40 13 012.04.2011 18:00 296 0.9 36 18 0 26.04.2011 18:00 204.5 1.2 37 15 012.04.2011 19:00 267 0.4 32 28 0 26.04.2011 19:00 177 1.7 32 18 012.04.2011 20:00 270 0.6 29 41 13 26.04.2011 20:00 180 1.9 33 21 012.04.2011 21:00 273 0.8 32 32 0 26.04.2011 21:00 184.5 1.8 31 25 012.04.2011 22:00 178 2.2 25 28 0 26.04.2011 22:00 178.5 1.4 29 31 012.04.2011 23:00 180 1.9 27 25 16 26.04.2011 23:00 180 2.2 30 34 012.04.2011 0:00 185 1.7 28 24 0 26.04.2011 0:00 184 2.1 28 35 013.04.2011 1:00 198 1.8 27 33 0 27.04.2011 1:00 200.5 2.2 27 45 013.04.2011 2:00 202.5 1.9 26 37 43 27.04.2011 2:00 202.5 1.9 28 46 013.04.2011 3:00 206 2.2 24 36 0 27.04.2011 3:00 205.5 1.7 29 47 013.04.2011 4:00 221 1.8 23 37 0 27.04.2011 4:00 199.5 1.8 25 54 013.04.2011 5:00 225 1.9 25 38 47 27.04.2011 5:00 202.5 1.7 26 58 013.04.2011 6:00 229 2.2 27 40 0 27.04.2011 6:00 204.5 1.8 27 55 013.04.2011 7:00 244 1.6 31 23 0 27.04.2011 7:00 222 1.6 35 45 013.04.2011 8:00 247.5 1.7 35 25 32 27.04.2011 8:00 225 1.7 34 40 013.04.2011 9:00 250 1.8 38 26 0 27.04.2011 9:00 228 1.5 37 35 013.04.2011 10:00 311 1.7 41 8 0 27.04.2011 10:00 267 1.6 42 22 013.04.2011 11:00 315 1.9 44 10 35 27.04.2011 11:00 270 1.4 44 17 213.04.2011 12:00 318 2.5 46 12 0 27.04.2011 12:00 275 1.2 45 16 013.04.2011 13:00 298 1.8 47 7 0 27.04.2011 13:00 198.5 0.8 46 12 013.04.2011 14:00 292.5 1.4 44 9 57 27.04.2011 14:00 202.5 0.6 47 10 213.04.2011 15:00 296 1.1 45 13 0 27.04.2011 15:00 205.5 0.7 47 13 013.04.2011 16:00 223 0.8 37 12 0 27.04.2011 16:00 155.5 0.9 45 12 013.04.2011 17:00 225 0.6 39 14 62 27.04.2011 17:00 157.5 0.8 42 14 013.04.2011 18:00 229 0.8 41 16 0 27.04.2011 18:00 161 1.3 38 17 013.04.2011 19:00 177 0.5 31 14 0 27.04.2011 19:00 177 1.5 35 20 013.04.2011 20:00 180 0.6 28 18 32 27.04.2011 20:00 180 1.9 33 21 213.04.2011 21:00 183 1.3 35 22 0 27.04.2011 21:00 183 2.1 32 25 013.04.2011 22:00 177 1.5 28 7 0 27.04.2011 22:00 176 2.4 30 33 013.04.2011 23:00 180 1.7 29 10 34 27.04.2011 23:00 180 2.5 31 37 013.04.2011 0:00 184 1.8 27 7 0 27.04.2011 0:00 185 2.7 32 33 014.04.2011 1:00 198 1.8 25 33 0 28.04.2011 1:00 199.5 2.6 30 45 014.04.2011 2:00 202.5 1.7 26 31 44 28.04.2011 2:00 202.5 2.5 29 46 114.04.2011 3:00 205.5 1.6 27 36 0 28.04.2011 3:00 204.5 2.6 27 44 014.04.2011 4:00 222 1.5 26 40 0 28.04.2011 4:00 200.5 2.4 26 52 014.04.2011 5:00 225 1.7 25 41 36 28.04.2011 5:00 202.5 2.5 28 54 114.04.2011 6:00 228.5 1.9 24 43 0 28.04.2011 6:00 205 2.5 31 42 014.04.2011 7:00 245 1.8 33 35 0 28.04.2011 7:00 222 2.1 34 40 014.04.2011 8:00 247.5 1.9 35 31 37 28.04.2011 8:00 225 1.9 35 41 0
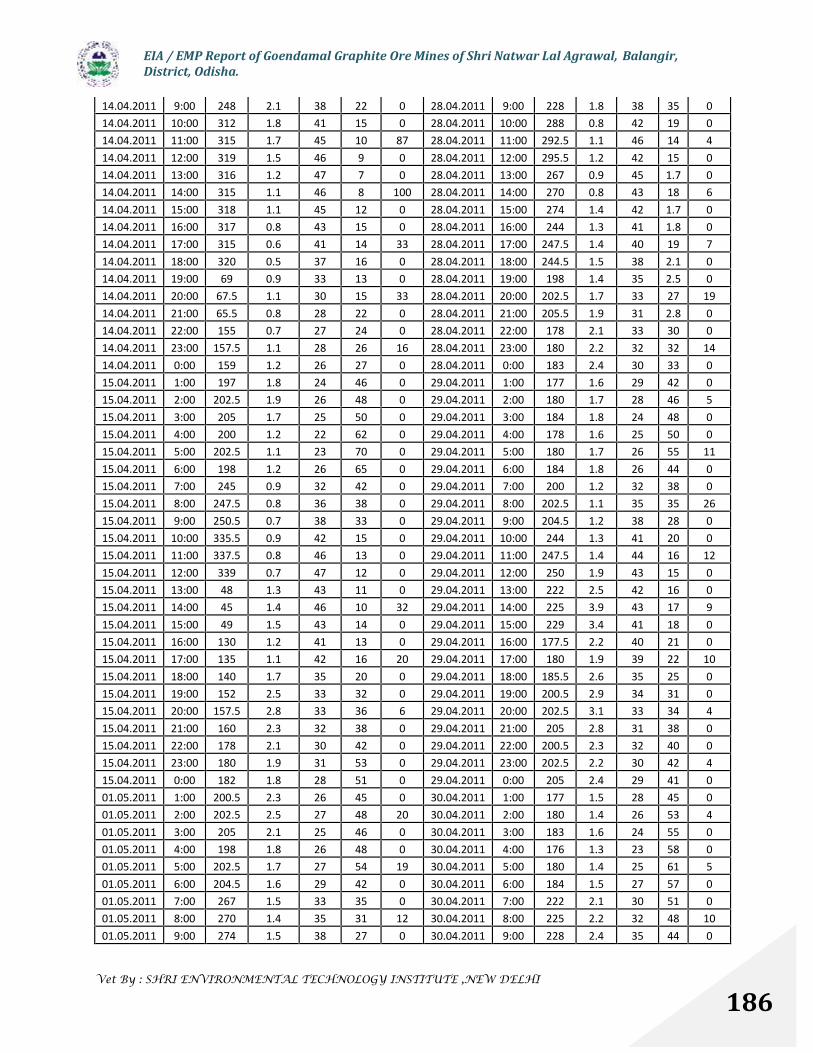
EIA / EMP Report of Goendamal Graphite Ore Mines of Shri Natwar Lal Agrawal, Balangir,District, Odisha.
Vet By : SHRI ENVIRONMENTAL TECHNOLOGY INSTITUTE ,NEW DELHI
186
14.04.2011 9:00 248 2.1 38 22 0 28.04.2011 9:00 228 1.8 38 35 014.04.2011 10:00 312 1.8 41 15 0 28.04.2011 10:00 288 0.8 42 19 014.04.2011 11:00 315 1.7 45 10 87 28.04.2011 11:00 292.5 1.1 46 14 414.04.2011 12:00 319 1.5 46 9 0 28.04.2011 12:00 295.5 1.2 42 15 014.04.2011 13:00 316 1.2 47 7 0 28.04.2011 13:00 267 0.9 45 1.7 014.04.2011 14:00 315 1.1 46 8 100 28.04.2011 14:00 270 0.8 43 18 614.04.2011 15:00 318 1.1 45 12 0 28.04.2011 15:00 274 1.4 42 1.7 014.04.2011 16:00 317 0.8 43 15 0 28.04.2011 16:00 244 1.3 41 1.8 014.04.2011 17:00 315 0.6 41 14 33 28.04.2011 17:00 247.5 1.4 40 19 714.04.2011 18:00 320 0.5 37 16 0 28.04.2011 18:00 244.5 1.5 38 2.1 014.04.2011 19:00 69 0.9 33 13 0 28.04.2011 19:00 198 1.4 35 2.5 014.04.2011 20:00 67.5 1.1 30 15 33 28.04.2011 20:00 202.5 1.7 33 27 1914.04.2011 21:00 65.5 0.8 28 22 0 28.04.2011 21:00 205.5 1.9 31 2.8 014.04.2011 22:00 155 0.7 27 24 0 28.04.2011 22:00 178 2.1 33 30 014.04.2011 23:00 157.5 1.1 28 26 16 28.04.2011 23:00 180 2.2 32 32 1414.04.2011 0:00 159 1.2 26 27 0 28.04.2011 0:00 183 2.4 30 33 015.04.2011 1:00 197 1.8 24 46 0 29.04.2011 1:00 177 1.6 29 42 015.04.2011 2:00 202.5 1.9 26 48 0 29.04.2011 2:00 180 1.7 28 46 515.04.2011 3:00 205 1.7 25 50 0 29.04.2011 3:00 184 1.8 24 48 015.04.2011 4:00 200 1.2 22 62 0 29.04.2011 4:00 178 1.6 25 50 015.04.2011 5:00 202.5 1.1 23 70 0 29.04.2011 5:00 180 1.7 26 55 1115.04.2011 6:00 198 1.2 26 65 0 29.04.2011 6:00 184 1.8 26 44 015.04.2011 7:00 245 0.9 32 42 0 29.04.2011 7:00 200 1.2 32 38 015.04.2011 8:00 247.5 0.8 36 38 0 29.04.2011 8:00 202.5 1.1 35 35 2615.04.2011 9:00 250.5 0.7 38 33 0 29.04.2011 9:00 204.5 1.2 38 28 015.04.2011 10:00 335.5 0.9 42 15 0 29.04.2011 10:00 244 1.3 41 20 015.04.2011 11:00 337.5 0.8 46 13 0 29.04.2011 11:00 247.5 1.4 44 16 1215.04.2011 12:00 339 0.7 47 12 0 29.04.2011 12:00 250 1.9 43 15 015.04.2011 13:00 48 1.3 43 11 0 29.04.2011 13:00 222 2.5 42 16 015.04.2011 14:00 45 1.4 46 10 32 29.04.2011 14:00 225 3.9 43 17 915.04.2011 15:00 49 1.5 43 14 0 29.04.2011 15:00 229 3.4 41 18 015.04.2011 16:00 130 1.2 41 13 0 29.04.2011 16:00 177.5 2.2 40 21 015.04.2011 17:00 135 1.1 42 16 20 29.04.2011 17:00 180 1.9 39 22 1015.04.2011 18:00 140 1.7 35 20 0 29.04.2011 18:00 185.5 2.6 35 25 015.04.2011 19:00 152 2.5 33 32 0 29.04.2011 19:00 200.5 2.9 34 31 015.04.2011 20:00 157.5 2.8 33 36 6 29.04.2011 20:00 202.5 3.1 33 34 415.04.2011 21:00 160 2.3 32 38 0 29.04.2011 21:00 205 2.8 31 38 015.04.2011 22:00 178 2.1 30 42 0 29.04.2011 22:00 200.5 2.3 32 40 015.04.2011 23:00 180 1.9 31 53 0 29.04.2011 23:00 202.5 2.2 30 42 415.04.2011 0:00 182 1.8 28 51 0 29.04.2011 0:00 205 2.4 29 41 001.05.2011 1:00 200.5 2.3 26 45 0 30.04.2011 1:00 177 1.5 28 45 001.05.2011 2:00 202.5 2.5 27 48 20 30.04.2011 2:00 180 1.4 26 53 401.05.2011 3:00 205 2.1 25 46 0 30.04.2011 3:00 183 1.6 24 55 001.05.2011 4:00 198 1.8 26 48 0 30.04.2011 4:00 176 1.3 23 58 001.05.2011 5:00 202.5 1.7 27 54 19 30.04.2011 5:00 180 1.4 25 61 501.05.2011 6:00 204.5 1.6 29 42 0 30.04.2011 6:00 184 1.5 27 57 001.05.2011 7:00 267 1.5 33 35 0 30.04.2011 7:00 222 2.1 30 51 001.05.2011 8:00 270 1.4 35 31 12 30.04.2011 8:00 225 2.2 32 48 1001.05.2011 9:00 274 1.5 38 27 0 30.04.2011 9:00 228 2.4 35 44 0

EIA / EMP Report of Goendamal Graphite Ore Mines of Shri Natwar Lal Agrawal, Balangir,District, Odisha.
Vet By : SHRI ENVIRONMENTAL TECHNOLOGY INSTITUTE ,NEW DELHI
187
01.05.2011 10:00 266 1.6 41 22 0 30.04.2011 10:00 267 2.9 36 38 001.05.2011 11:00 270 1.7 42 17 8 30.04.2011 11:00 270 3.1 37 32 801.05.2011 12:00 275.5 1.6 40 16 0 30.04.2011 12:00 274 2.8 36 36 001.05.2011 13:00 245.5 1.8 42 17 0 30.04.2011 13:00 267 2.4 40 28 001.05.2011 14:00 247.5 1.7 41 18 14 30.04.2011 14:00 270 2.5 39 25 4301.05.2011 15:00 250.5 1.8 38 22 0 30.04.2011 15:00 275 2.2 38 29 001.05.2011 16:00 222.5 2.1 37 24 0 30.04.2011 16:00 200 2.3 37 30 001.05.2011 17:00 225 2.2 36 26 21 30.04.2011 17:00 202.5 2.5 36 31 2201.05.2011 18:00 225 2.3 35 28 0 30.04.2011 18:00 205 2.4 35 35 001.05.2011 19:00 244.5 2.7 34 30 0 30.04.2011 19:00 201 2.3 32 40 001.05.2011 20:00 247.5 2.5 33 32 15 30.04.2011 20:00 202.5 2.5 31 42 1501.05.2011 21:00 251.5 2.4 32 34 0 30.04.2011 21:00 206 2.6 32 43 001.05.2011 22:00 246.5 1.8 32 36 0 30.04.2011 22:00 198 2.4 29 44 001.05.2011 23:00 247.5 1.4 31 38 13 30.04.2011 23:00 202.5 2.5 30 46 2701.05.2011 0:00 252.5 1.6 33 35 0 30.04.2011 0:00 204.5 2.2 28 43 002.05.2011 1:00 199.5 1.5 27 41 0 16.05.2011 1:00 200 1.6 30 48 002.05.2011 2:00 202.5 1.7 28 43 15 16.05.2011 2:00 202.5 1.7 28 50 002.05.2011 3:00 205 1.6 29 45 0 16.05.2011 3:00 205.5 1.8 27 52 002.05.2011 4:00 222 1.8 27 42 0 16.05.2011 4:00 199.5 1.5 26 51 002.05.2011 5:00 225 1.7 28 44 14 16.05.2011 5:00 202.5 1.7 28 50 002.05.2011 6:00 228 1.6 25 40 0 16.05.2011 6:00 206.5 1.8 29 45 002.05.2011 7:00 267 1.5 33 35 0 16.05.2011 7:00 199 1.6 33 42 002.05.2011 8:00 270 1.4 35 31 12 16.05.2011 8:00 202.5 1.7 35 39 002.05.2011 9:00 275 1.5 38 27 0 16.05.2011 9:00 205.5 1.8 36 36 002.05.2011 10:00 289 1.6 41 22 0 16.05.2011 10:00 245.5 2.7 40 32 002.05.2011 11:00 292.5 1.7 42 19 14 16.05.2011 11:00 247.5 2.8 41 30 902.05.2011 12:00 295 1.2 44 18 0 16.05.2011 12:00 250.5 2.9 42 28 002.05.2011 13:00 298 0.9 41 21 0 16.05.2011 13:00 244 1.6 41 29 002.05.2011 14:00 292.5 0.8 43 20 19 16.05.2011 14:00 247.5 1.7 40 30 2502.05.2011 15:00 294.5 0.9 42 21 0 16.05.2011 15:00 251.5 1.8 41 27 002.05.2011 16:00 267 0.7 41 22 0 16.05.2011 16:00 221 1.6 38 28 002.05.2011 17:00 270 0.8 40 23 18 16.05.2011 17:00 225 1.7 39 29 602.05.2011 18:00 275 0.9 38 25 0 16.05.2011 18:00 228 1.8 35 33 002.05.2011 19:00 222.5 1.2 35 27 0 16.05.2011 19:00 177 1.3 32 35 002.05.2011 20:00 225 1.1 33 28 13 16.05.2011 20:00 180 1.4 33 39 002.05.2011 21:00 228.5 1.5 31 25 0 16.05.2011 21:00 184 1.5 34 42 002.05.2011 22:00 199 1.8 29 30 0 16.05.2011 22:00 175 2.1 31 44 002.05.2011 23:00 202.5 2.2 30 34 18 16.05.2011 23:00 180 2.2 32 46 002.05.2011 0:00 205.5 2.1 28 35 0 16.05.2011 0:00 184 2.3 33 48 003.05.2011 1:00 199.5 2.5 26 38 0 17.05.2011 1:00 200.5 2.1 31 52 003.05.2011 2:00 202.5 2.8 27 40 17 17.05.2011 2:00 202.5 1.9 29 58 003.05.2011 3:00 204.5 2.7 28 44 0 17.05.2011 3:00 205 1.8 28 62 003.05.2011 4:00 222.5 2.6 26 45 0 17.05.2011 4:00 177 1.1 26 65 003.05.2011 5:00 225 2.5 25 46 18 17.05.2011 5:00 180 1.1 27 67 203.05.2011 6:00 228 2.7 27 47 0 17.05.2011 6:00 185 1.3 29 68 003.05.2011 7:00 245.5 1.6 33 40 0 17.05.2011 7:00 221 1.2 35 42 003.05.2011 8:00 247.5 1.7 35 29 44 17.05.2011 8:00 225 1.4 37 37 003.05.2011 9:00 249.5 1.8 40 25 0 17.05.2011 9:00 228 1.5 41 33 003.05.2011 10:00 245 1.7 41 22 0 17.05.2011 10:00 289 1.3 44 25 0
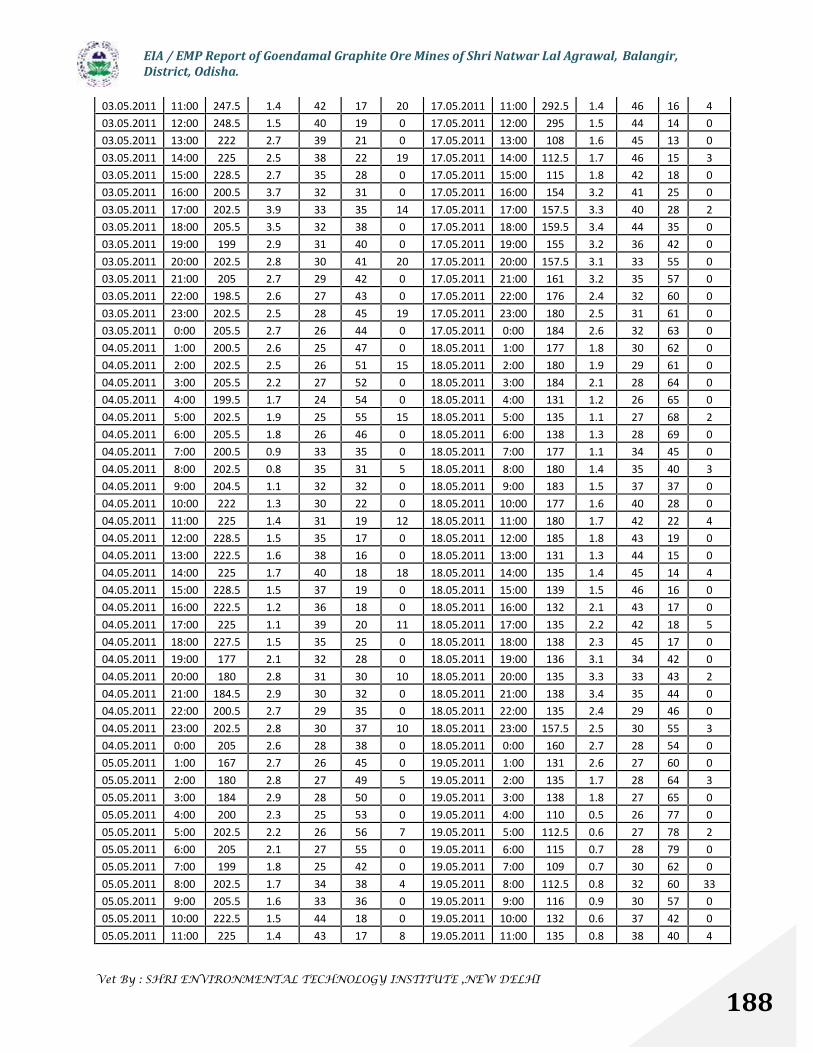
EIA / EMP Report of Goendamal Graphite Ore Mines of Shri Natwar Lal Agrawal, Balangir,District, Odisha.
Vet By : SHRI ENVIRONMENTAL TECHNOLOGY INSTITUTE ,NEW DELHI
188
03.05.2011 11:00 247.5 1.4 42 17 20 17.05.2011 11:00 292.5 1.4 46 16 403.05.2011 12:00 248.5 1.5 40 19 0 17.05.2011 12:00 295 1.5 44 14 003.05.2011 13:00 222 2.7 39 21 0 17.05.2011 13:00 108 1.6 45 13 003.05.2011 14:00 225 2.5 38 22 19 17.05.2011 14:00 112.5 1.7 46 15 303.05.2011 15:00 228.5 2.7 35 28 0 17.05.2011 15:00 115 1.8 42 18 003.05.2011 16:00 200.5 3.7 32 31 0 17.05.2011 16:00 154 3.2 41 25 003.05.2011 17:00 202.5 3.9 33 35 14 17.05.2011 17:00 157.5 3.3 40 28 203.05.2011 18:00 205.5 3.5 32 38 0 17.05.2011 18:00 159.5 3.4 44 35 003.05.2011 19:00 199 2.9 31 40 0 17.05.2011 19:00 155 3.2 36 42 003.05.2011 20:00 202.5 2.8 30 41 20 17.05.2011 20:00 157.5 3.1 33 55 003.05.2011 21:00 205 2.7 29 42 0 17.05.2011 21:00 161 3.2 35 57 003.05.2011 22:00 198.5 2.6 27 43 0 17.05.2011 22:00 176 2.4 32 60 003.05.2011 23:00 202.5 2.5 28 45 19 17.05.2011 23:00 180 2.5 31 61 003.05.2011 0:00 205.5 2.7 26 44 0 17.05.2011 0:00 184 2.6 32 63 004.05.2011 1:00 200.5 2.6 25 47 0 18.05.2011 1:00 177 1.8 30 62 004.05.2011 2:00 202.5 2.5 26 51 15 18.05.2011 2:00 180 1.9 29 61 004.05.2011 3:00 205.5 2.2 27 52 0 18.05.2011 3:00 184 2.1 28 64 004.05.2011 4:00 199.5 1.7 24 54 0 18.05.2011 4:00 131 1.2 26 65 004.05.2011 5:00 202.5 1.9 25 55 15 18.05.2011 5:00 135 1.1 27 68 204.05.2011 6:00 205.5 1.8 26 46 0 18.05.2011 6:00 138 1.3 28 69 004.05.2011 7:00 200.5 0.9 33 35 0 18.05.2011 7:00 177 1.1 34 45 004.05.2011 8:00 202.5 0.8 35 31 5 18.05.2011 8:00 180 1.4 35 40 304.05.2011 9:00 204.5 1.1 32 32 0 18.05.2011 9:00 183 1.5 37 37 004.05.2011 10:00 222 1.3 30 22 0 18.05.2011 10:00 177 1.6 40 28 004.05.2011 11:00 225 1.4 31 19 12 18.05.2011 11:00 180 1.7 42 22 404.05.2011 12:00 228.5 1.5 35 17 0 18.05.2011 12:00 185 1.8 43 19 004.05.2011 13:00 222.5 1.6 38 16 0 18.05.2011 13:00 131 1.3 44 15 004.05.2011 14:00 225 1.7 40 18 18 18.05.2011 14:00 135 1.4 45 14 404.05.2011 15:00 228.5 1.5 37 19 0 18.05.2011 15:00 139 1.5 46 16 004.05.2011 16:00 222.5 1.2 36 18 0 18.05.2011 16:00 132 2.1 43 17 004.05.2011 17:00 225 1.1 39 20 11 18.05.2011 17:00 135 2.2 42 18 504.05.2011 18:00 227.5 1.5 35 25 0 18.05.2011 18:00 138 2.3 45 17 004.05.2011 19:00 177 2.1 32 28 0 18.05.2011 19:00 136 3.1 34 42 004.05.2011 20:00 180 2.8 31 30 10 18.05.2011 20:00 135 3.3 33 43 204.05.2011 21:00 184.5 2.9 30 32 0 18.05.2011 21:00 138 3.4 35 44 004.05.2011 22:00 200.5 2.7 29 35 0 18.05.2011 22:00 135 2.4 29 46 004.05.2011 23:00 202.5 2.8 30 37 10 18.05.2011 23:00 157.5 2.5 30 55 304.05.2011 0:00 205 2.6 28 38 0 18.05.2011 0:00 160 2.7 28 54 005.05.2011 1:00 167 2.7 26 45 0 19.05.2011 1:00 131 2.6 27 60 005.05.2011 2:00 180 2.8 27 49 5 19.05.2011 2:00 135 1.7 28 64 305.05.2011 3:00 184 2.9 28 50 0 19.05.2011 3:00 138 1.8 27 65 005.05.2011 4:00 200 2.3 25 53 0 19.05.2011 4:00 110 0.5 26 77 005.05.2011 5:00 202.5 2.2 26 56 7 19.05.2011 5:00 112.5 0.6 27 78 205.05.2011 6:00 205 2.1 27 55 0 19.05.2011 6:00 115 0.7 28 79 005.05.2011 7:00 199 1.8 25 42 0 19.05.2011 7:00 109 0.7 30 62 005.05.2011 8:00 202.5 1.7 34 38 4 19.05.2011 8:00 112.5 0.8 32 60 3305.05.2011 9:00 205.5 1.6 33 36 0 19.05.2011 9:00 116 0.9 30 57 005.05.2011 10:00 222.5 1.5 44 18 0 19.05.2011 10:00 132 0.6 37 42 005.05.2011 11:00 225 1.4 43 17 8 19.05.2011 11:00 135 0.8 38 40 4
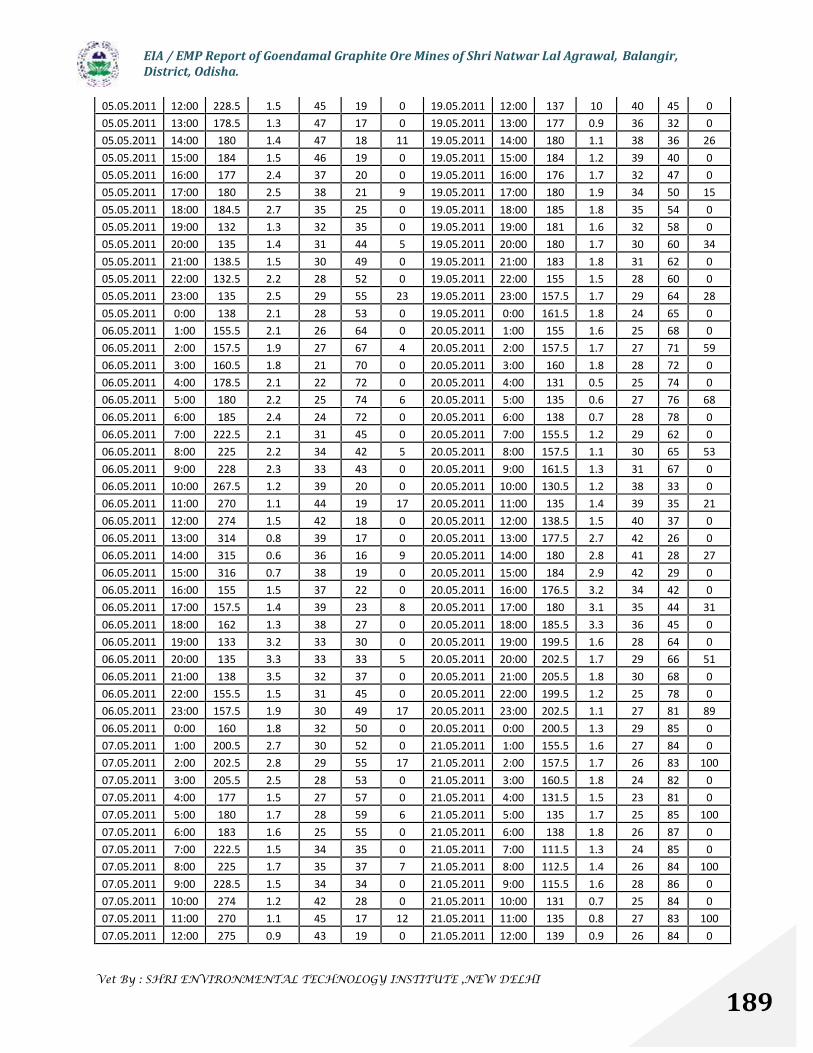
EIA / EMP Report of Goendamal Graphite Ore Mines of Shri Natwar Lal Agrawal, Balangir,District, Odisha.
Vet By : SHRI ENVIRONMENTAL TECHNOLOGY INSTITUTE ,NEW DELHI
189
05.05.2011 12:00 228.5 1.5 45 19 0 19.05.2011 12:00 137 10 40 45 005.05.2011 13:00 178.5 1.3 47 17 0 19.05.2011 13:00 177 0.9 36 32 005.05.2011 14:00 180 1.4 47 18 11 19.05.2011 14:00 180 1.1 38 36 2605.05.2011 15:00 184 1.5 46 19 0 19.05.2011 15:00 184 1.2 39 40 005.05.2011 16:00 177 2.4 37 20 0 19.05.2011 16:00 176 1.7 32 47 005.05.2011 17:00 180 2.5 38 21 9 19.05.2011 17:00 180 1.9 34 50 1505.05.2011 18:00 184.5 2.7 35 25 0 19.05.2011 18:00 185 1.8 35 54 005.05.2011 19:00 132 1.3 32 35 0 19.05.2011 19:00 181 1.6 32 58 005.05.2011 20:00 135 1.4 31 44 5 19.05.2011 20:00 180 1.7 30 60 3405.05.2011 21:00 138.5 1.5 30 49 0 19.05.2011 21:00 183 1.8 31 62 005.05.2011 22:00 132.5 2.2 28 52 0 19.05.2011 22:00 155 1.5 28 60 005.05.2011 23:00 135 2.5 29 55 23 19.05.2011 23:00 157.5 1.7 29 64 2805.05.2011 0:00 138 2.1 28 53 0 19.05.2011 0:00 161.5 1.8 24 65 006.05.2011 1:00 155.5 2.1 26 64 0 20.05.2011 1:00 155 1.6 25 68 006.05.2011 2:00 157.5 1.9 27 67 4 20.05.2011 2:00 157.5 1.7 27 71 5906.05.2011 3:00 160.5 1.8 21 70 0 20.05.2011 3:00 160 1.8 28 72 006.05.2011 4:00 178.5 2.1 22 72 0 20.05.2011 4:00 131 0.5 25 74 006.05.2011 5:00 180 2.2 25 74 6 20.05.2011 5:00 135 0.6 27 76 6806.05.2011 6:00 185 2.4 24 72 0 20.05.2011 6:00 138 0.7 28 78 006.05.2011 7:00 222.5 2.1 31 45 0 20.05.2011 7:00 155.5 1.2 29 62 006.05.2011 8:00 225 2.2 34 42 5 20.05.2011 8:00 157.5 1.1 30 65 5306.05.2011 9:00 228 2.3 33 43 0 20.05.2011 9:00 161.5 1.3 31 67 006.05.2011 10:00 267.5 1.2 39 20 0 20.05.2011 10:00 130.5 1.2 38 33 006.05.2011 11:00 270 1.1 44 19 17 20.05.2011 11:00 135 1.4 39 35 2106.05.2011 12:00 274 1.5 42 18 0 20.05.2011 12:00 138.5 1.5 40 37 006.05.2011 13:00 314 0.8 39 17 0 20.05.2011 13:00 177.5 2.7 42 26 006.05.2011 14:00 315 0.6 36 16 9 20.05.2011 14:00 180 2.8 41 28 2706.05.2011 15:00 316 0.7 38 19 0 20.05.2011 15:00 184 2.9 42 29 006.05.2011 16:00 155 1.5 37 22 0 20.05.2011 16:00 176.5 3.2 34 42 006.05.2011 17:00 157.5 1.4 39 23 8 20.05.2011 17:00 180 3.1 35 44 3106.05.2011 18:00 162 1.3 38 27 0 20.05.2011 18:00 185.5 3.3 36 45 006.05.2011 19:00 133 3.2 33 30 0 20.05.2011 19:00 199.5 1.6 28 64 006.05.2011 20:00 135 3.3 33 33 5 20.05.2011 20:00 202.5 1.7 29 66 5106.05.2011 21:00 138 3.5 32 37 0 20.05.2011 21:00 205.5 1.8 30 68 006.05.2011 22:00 155.5 1.5 31 45 0 20.05.2011 22:00 199.5 1.2 25 78 006.05.2011 23:00 157.5 1.9 30 49 17 20.05.2011 23:00 202.5 1.1 27 81 8906.05.2011 0:00 160 1.8 32 50 0 20.05.2011 0:00 200.5 1.3 29 85 007.05.2011 1:00 200.5 2.7 30 52 0 21.05.2011 1:00 155.5 1.6 27 84 007.05.2011 2:00 202.5 2.8 29 55 17 21.05.2011 2:00 157.5 1.7 26 83 10007.05.2011 3:00 205.5 2.5 28 53 0 21.05.2011 3:00 160.5 1.8 24 82 007.05.2011 4:00 177 1.5 27 57 0 21.05.2011 4:00 131.5 1.5 23 81 007.05.2011 5:00 180 1.7 28 59 6 21.05.2011 5:00 135 1.7 25 85 10007.05.2011 6:00 183 1.6 25 55 0 21.05.2011 6:00 138 1.8 26 87 007.05.2011 7:00 222.5 1.5 34 35 0 21.05.2011 7:00 111.5 1.3 24 85 007.05.2011 8:00 225 1.7 35 37 7 21.05.2011 8:00 112.5 1.4 26 84 10007.05.2011 9:00 228.5 1.5 34 34 0 21.05.2011 9:00 115.5 1.6 28 86 007.05.2011 10:00 274 1.2 42 28 0 21.05.2011 10:00 131 0.7 25 84 007.05.2011 11:00 270 1.1 45 17 12 21.05.2011 11:00 135 0.8 27 83 10007.05.2011 12:00 275 0.9 43 19 0 21.05.2011 12:00 139 0.9 26 84 0
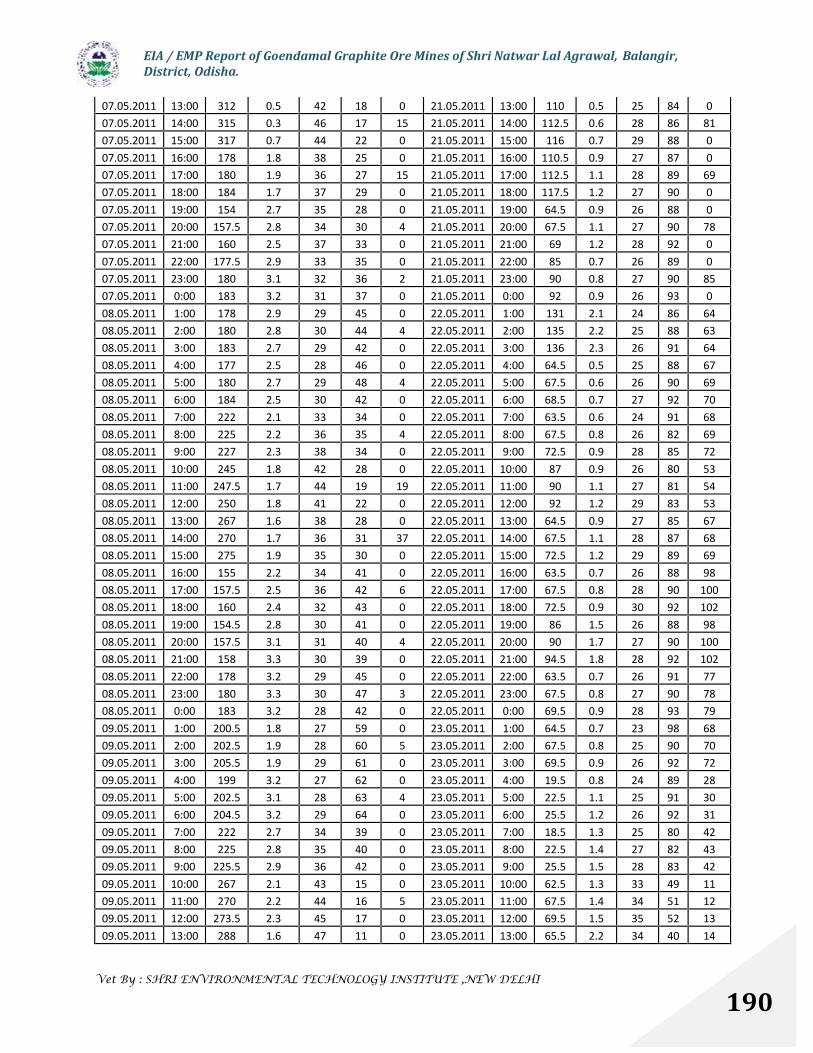
EIA / EMP Report of Goendamal Graphite Ore Mines of Shri Natwar Lal Agrawal, Balangir,District, Odisha.
Vet By : SHRI ENVIRONMENTAL TECHNOLOGY INSTITUTE ,NEW DELHI
190
07.05.2011 13:00 312 0.5 42 18 0 21.05.2011 13:00 110 0.5 25 84 007.05.2011 14:00 315 0.3 46 17 15 21.05.2011 14:00 112.5 0.6 28 86 8107.05.2011 15:00 317 0.7 44 22 0 21.05.2011 15:00 116 0.7 29 88 007.05.2011 16:00 178 1.8 38 25 0 21.05.2011 16:00 110.5 0.9 27 87 007.05.2011 17:00 180 1.9 36 27 15 21.05.2011 17:00 112.5 1.1 28 89 6907.05.2011 18:00 184 1.7 37 29 0 21.05.2011 18:00 117.5 1.2 27 90 007.05.2011 19:00 154 2.7 35 28 0 21.05.2011 19:00 64.5 0.9 26 88 007.05.2011 20:00 157.5 2.8 34 30 4 21.05.2011 20:00 67.5 1.1 27 90 7807.05.2011 21:00 160 2.5 37 33 0 21.05.2011 21:00 69 1.2 28 92 007.05.2011 22:00 177.5 2.9 33 35 0 21.05.2011 22:00 85 0.7 26 89 007.05.2011 23:00 180 3.1 32 36 2 21.05.2011 23:00 90 0.8 27 90 8507.05.2011 0:00 183 3.2 31 37 0 21.05.2011 0:00 92 0.9 26 93 008.05.2011 1:00 178 2.9 29 45 0 22.05.2011 1:00 131 2.1 24 86 6408.05.2011 2:00 180 2.8 30 44 4 22.05.2011 2:00 135 2.2 25 88 6308.05.2011 3:00 183 2.7 29 42 0 22.05.2011 3:00 136 2.3 26 91 6408.05.2011 4:00 177 2.5 28 46 0 22.05.2011 4:00 64.5 0.5 25 88 6708.05.2011 5:00 180 2.7 29 48 4 22.05.2011 5:00 67.5 0.6 26 90 6908.05.2011 6:00 184 2.5 30 42 0 22.05.2011 6:00 68.5 0.7 27 92 7008.05.2011 7:00 222 2.1 33 34 0 22.05.2011 7:00 63.5 0.6 24 91 6808.05.2011 8:00 225 2.2 36 35 4 22.05.2011 8:00 67.5 0.8 26 82 6908.05.2011 9:00 227 2.3 38 34 0 22.05.2011 9:00 72.5 0.9 28 85 7208.05.2011 10:00 245 1.8 42 28 0 22.05.2011 10:00 87 0.9 26 80 5308.05.2011 11:00 247.5 1.7 44 19 19 22.05.2011 11:00 90 1.1 27 81 5408.05.2011 12:00 250 1.8 41 22 0 22.05.2011 12:00 92 1.2 29 83 5308.05.2011 13:00 267 1.6 38 28 0 22.05.2011 13:00 64.5 0.9 27 85 6708.05.2011 14:00 270 1.7 36 31 37 22.05.2011 14:00 67.5 1.1 28 87 6808.05.2011 15:00 275 1.9 35 30 0 22.05.2011 15:00 72.5 1.2 29 89 6908.05.2011 16:00 155 2.2 34 41 0 22.05.2011 16:00 63.5 0.7 26 88 9808.05.2011 17:00 157.5 2.5 36 42 6 22.05.2011 17:00 67.5 0.8 28 90 10008.05.2011 18:00 160 2.4 32 43 0 22.05.2011 18:00 72.5 0.9 30 92 10208.05.2011 19:00 154.5 2.8 30 41 0 22.05.2011 19:00 86 1.5 26 88 9808.05.2011 20:00 157.5 3.1 31 40 4 22.05.2011 20:00 90 1.7 27 90 10008.05.2011 21:00 158 3.3 30 39 0 22.05.2011 21:00 94.5 1.8 28 92 10208.05.2011 22:00 178 3.2 29 45 0 22.05.2011 22:00 63.5 0.7 26 91 7708.05.2011 23:00 180 3.3 30 47 3 22.05.2011 23:00 67.5 0.8 27 90 7808.05.2011 0:00 183 3.2 28 42 0 22.05.2011 0:00 69.5 0.9 28 93 7909.05.2011 1:00 200.5 1.8 27 59 0 23.05.2011 1:00 64.5 0.7 23 98 6809.05.2011 2:00 202.5 1.9 28 60 5 23.05.2011 2:00 67.5 0.8 25 90 7009.05.2011 3:00 205.5 1.9 29 61 0 23.05.2011 3:00 69.5 0.9 26 92 7209.05.2011 4:00 199 3.2 27 62 0 23.05.2011 4:00 19.5 0.8 24 89 2809.05.2011 5:00 202.5 3.1 28 63 4 23.05.2011 5:00 22.5 1.1 25 91 3009.05.2011 6:00 204.5 3.2 29 64 0 23.05.2011 6:00 25.5 1.2 26 92 3109.05.2011 7:00 222 2.7 34 39 0 23.05.2011 7:00 18.5 1.3 25 80 4209.05.2011 8:00 225 2.8 35 40 0 23.05.2011 8:00 22.5 1.4 27 82 4309.05.2011 9:00 225.5 2.9 36 42 0 23.05.2011 9:00 25.5 1.5 28 83 4209.05.2011 10:00 267 2.1 43 15 0 23.05.2011 10:00 62.5 1.3 33 49 1109.05.2011 11:00 270 2.2 44 16 5 23.05.2011 11:00 67.5 1.4 34 51 1209.05.2011 12:00 273.5 2.3 45 17 0 23.05.2011 12:00 69.5 1.5 35 52 1309.05.2011 13:00 288 1.6 47 11 0 23.05.2011 13:00 65.5 2.2 34 40 14
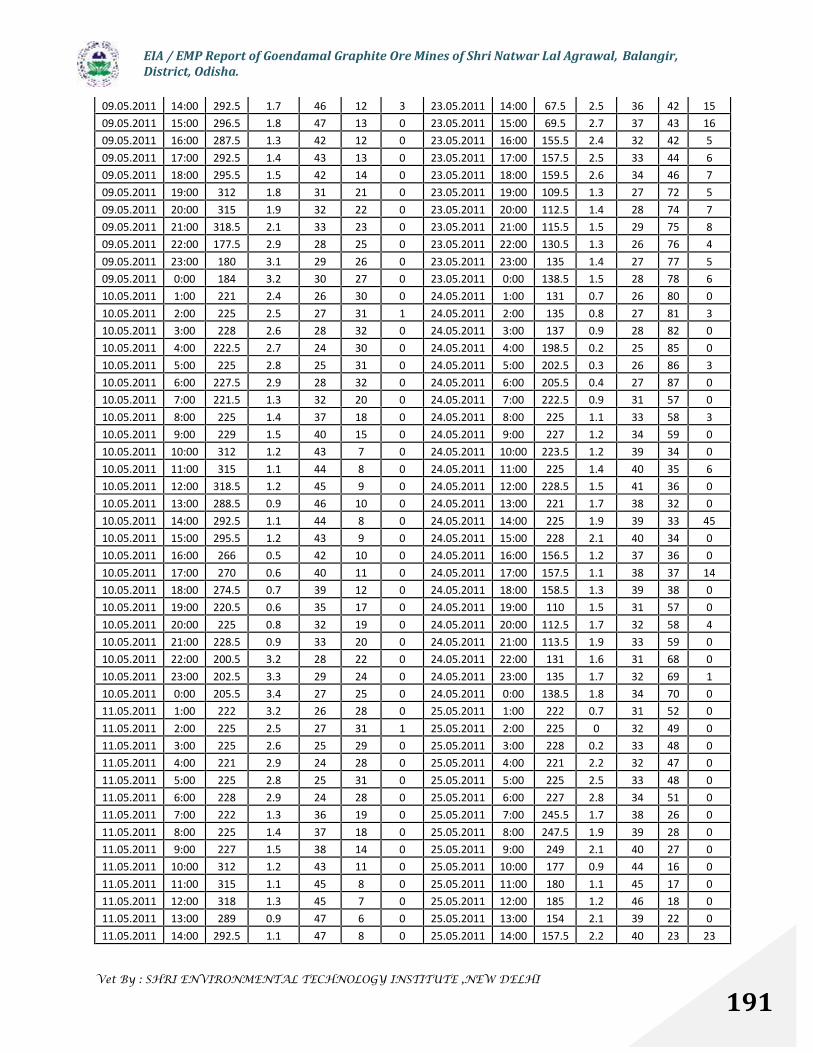
EIA / EMP Report of Goendamal Graphite Ore Mines of Shri Natwar Lal Agrawal, Balangir,District, Odisha.
Vet By : SHRI ENVIRONMENTAL TECHNOLOGY INSTITUTE ,NEW DELHI
191
09.05.2011 14:00 292.5 1.7 46 12 3 23.05.2011 14:00 67.5 2.5 36 42 1509.05.2011 15:00 296.5 1.8 47 13 0 23.05.2011 15:00 69.5 2.7 37 43 1609.05.2011 16:00 287.5 1.3 42 12 0 23.05.2011 16:00 155.5 2.4 32 42 509.05.2011 17:00 292.5 1.4 43 13 0 23.05.2011 17:00 157.5 2.5 33 44 609.05.2011 18:00 295.5 1.5 42 14 0 23.05.2011 18:00 159.5 2.6 34 46 709.05.2011 19:00 312 1.8 31 21 0 23.05.2011 19:00 109.5 1.3 27 72 509.05.2011 20:00 315 1.9 32 22 0 23.05.2011 20:00 112.5 1.4 28 74 709.05.2011 21:00 318.5 2.1 33 23 0 23.05.2011 21:00 115.5 1.5 29 75 809.05.2011 22:00 177.5 2.9 28 25 0 23.05.2011 22:00 130.5 1.3 26 76 409.05.2011 23:00 180 3.1 29 26 0 23.05.2011 23:00 135 1.4 27 77 509.05.2011 0:00 184 3.2 30 27 0 23.05.2011 0:00 138.5 1.5 28 78 610.05.2011 1:00 221 2.4 26 30 0 24.05.2011 1:00 131 0.7 26 80 010.05.2011 2:00 225 2.5 27 31 1 24.05.2011 2:00 135 0.8 27 81 310.05.2011 3:00 228 2.6 28 32 0 24.05.2011 3:00 137 0.9 28 82 010.05.2011 4:00 222.5 2.7 24 30 0 24.05.2011 4:00 198.5 0.2 25 85 010.05.2011 5:00 225 2.8 25 31 0 24.05.2011 5:00 202.5 0.3 26 86 310.05.2011 6:00 227.5 2.9 28 32 0 24.05.2011 6:00 205.5 0.4 27 87 010.05.2011 7:00 221.5 1.3 32 20 0 24.05.2011 7:00 222.5 0.9 31 57 010.05.2011 8:00 225 1.4 37 18 0 24.05.2011 8:00 225 1.1 33 58 310.05.2011 9:00 229 1.5 40 15 0 24.05.2011 9:00 227 1.2 34 59 010.05.2011 10:00 312 1.2 43 7 0 24.05.2011 10:00 223.5 1.2 39 34 010.05.2011 11:00 315 1.1 44 8 0 24.05.2011 11:00 225 1.4 40 35 610.05.2011 12:00 318.5 1.2 45 9 0 24.05.2011 12:00 228.5 1.5 41 36 010.05.2011 13:00 288.5 0.9 46 10 0 24.05.2011 13:00 221 1.7 38 32 010.05.2011 14:00 292.5 1.1 44 8 0 24.05.2011 14:00 225 1.9 39 33 4510.05.2011 15:00 295.5 1.2 43 9 0 24.05.2011 15:00 228 2.1 40 34 010.05.2011 16:00 266 0.5 42 10 0 24.05.2011 16:00 156.5 1.2 37 36 010.05.2011 17:00 270 0.6 40 11 0 24.05.2011 17:00 157.5 1.1 38 37 1410.05.2011 18:00 274.5 0.7 39 12 0 24.05.2011 18:00 158.5 1.3 39 38 010.05.2011 19:00 220.5 0.6 35 17 0 24.05.2011 19:00 110 1.5 31 57 010.05.2011 20:00 225 0.8 32 19 0 24.05.2011 20:00 112.5 1.7 32 58 410.05.2011 21:00 228.5 0.9 33 20 0 24.05.2011 21:00 113.5 1.9 33 59 010.05.2011 22:00 200.5 3.2 28 22 0 24.05.2011 22:00 131 1.6 31 68 010.05.2011 23:00 202.5 3.3 29 24 0 24.05.2011 23:00 135 1.7 32 69 110.05.2011 0:00 205.5 3.4 27 25 0 24.05.2011 0:00 138.5 1.8 34 70 011.05.2011 1:00 222 3.2 26 28 0 25.05.2011 1:00 222 0.7 31 52 011.05.2011 2:00 225 2.5 27 31 1 25.05.2011 2:00 225 0 32 49 011.05.2011 3:00 225 2.6 25 29 0 25.05.2011 3:00 228 0.2 33 48 011.05.2011 4:00 221 2.9 24 28 0 25.05.2011 4:00 221 2.2 32 47 011.05.2011 5:00 225 2.8 25 31 0 25.05.2011 5:00 225 2.5 33 48 011.05.2011 6:00 228 2.9 24 28 0 25.05.2011 6:00 227 2.8 34 51 011.05.2011 7:00 222 1.3 36 19 0 25.05.2011 7:00 245.5 1.7 38 26 011.05.2011 8:00 225 1.4 37 18 0 25.05.2011 8:00 247.5 1.9 39 28 011.05.2011 9:00 227 1.5 38 14 0 25.05.2011 9:00 249 2.1 40 27 011.05.2011 10:00 312 1.2 43 11 0 25.05.2011 10:00 177 0.9 44 16 011.05.2011 11:00 315 1.1 45 8 0 25.05.2011 11:00 180 1.1 45 17 011.05.2011 12:00 318 1.3 45 7 0 25.05.2011 12:00 185 1.2 46 18 011.05.2011 13:00 289 0.9 47 6 0 25.05.2011 13:00 154 2.1 39 22 011.05.2011 14:00 292.5 1.1 47 8 0 25.05.2011 14:00 157.5 2.2 40 23 23
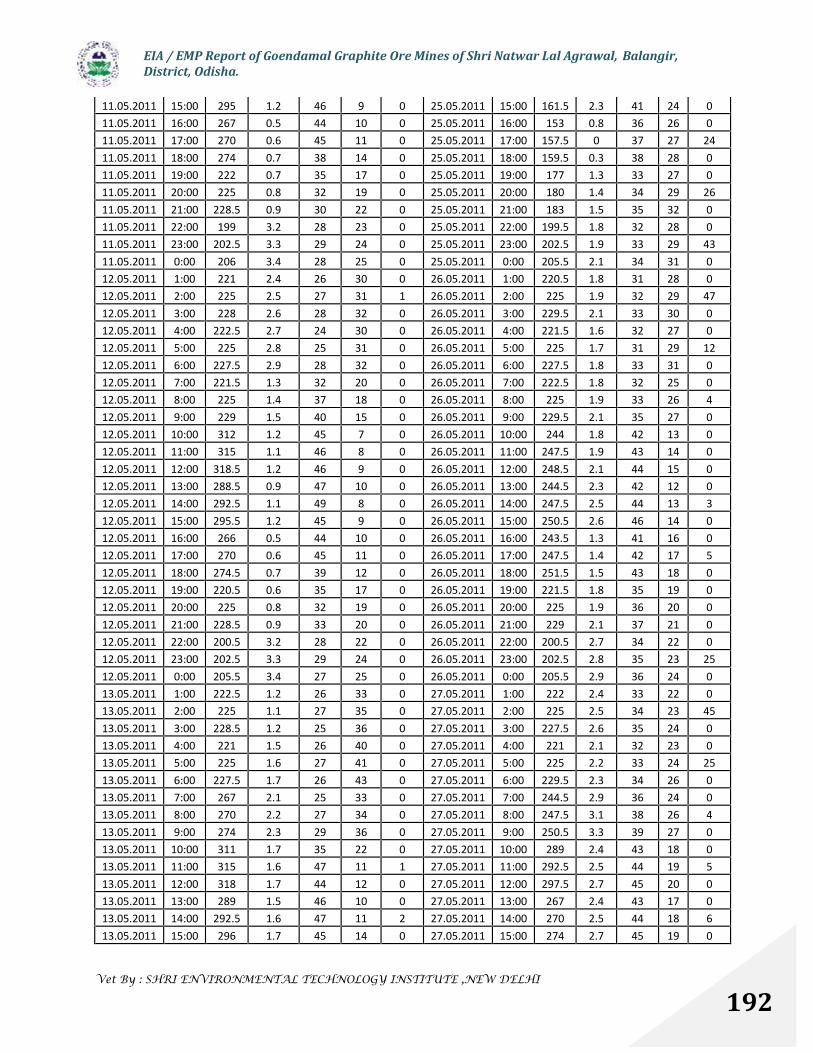
EIA / EMP Report of Goendamal Graphite Ore Mines of Shri Natwar Lal Agrawal, Balangir,District, Odisha.
Vet By : SHRI ENVIRONMENTAL TECHNOLOGY INSTITUTE ,NEW DELHI
192
11.05.2011 15:00 295 1.2 46 9 0 25.05.2011 15:00 161.5 2.3 41 24 011.05.2011 16:00 267 0.5 44 10 0 25.05.2011 16:00 153 0.8 36 26 011.05.2011 17:00 270 0.6 45 11 0 25.05.2011 17:00 157.5 0 37 27 2411.05.2011 18:00 274 0.7 38 14 0 25.05.2011 18:00 159.5 0.3 38 28 011.05.2011 19:00 222 0.7 35 17 0 25.05.2011 19:00 177 1.3 33 27 011.05.2011 20:00 225 0.8 32 19 0 25.05.2011 20:00 180 1.4 34 29 2611.05.2011 21:00 228.5 0.9 30 22 0 25.05.2011 21:00 183 1.5 35 32 011.05.2011 22:00 199 3.2 28 23 0 25.05.2011 22:00 199.5 1.8 32 28 011.05.2011 23:00 202.5 3.3 29 24 0 25.05.2011 23:00 202.5 1.9 33 29 4311.05.2011 0:00 206 3.4 28 25 0 25.05.2011 0:00 205.5 2.1 34 31 012.05.2011 1:00 221 2.4 26 30 0 26.05.2011 1:00 220.5 1.8 31 28 012.05.2011 2:00 225 2.5 27 31 1 26.05.2011 2:00 225 1.9 32 29 4712.05.2011 3:00 228 2.6 28 32 0 26.05.2011 3:00 229.5 2.1 33 30 012.05.2011 4:00 222.5 2.7 24 30 0 26.05.2011 4:00 221.5 1.6 32 27 012.05.2011 5:00 225 2.8 25 31 0 26.05.2011 5:00 225 1.7 31 29 1212.05.2011 6:00 227.5 2.9 28 32 0 26.05.2011 6:00 227.5 1.8 33 31 012.05.2011 7:00 221.5 1.3 32 20 0 26.05.2011 7:00 222.5 1.8 32 25 012.05.2011 8:00 225 1.4 37 18 0 26.05.2011 8:00 225 1.9 33 26 412.05.2011 9:00 229 1.5 40 15 0 26.05.2011 9:00 229.5 2.1 35 27 012.05.2011 10:00 312 1.2 45 7 0 26.05.2011 10:00 244 1.8 42 13 012.05.2011 11:00 315 1.1 46 8 0 26.05.2011 11:00 247.5 1.9 43 14 012.05.2011 12:00 318.5 1.2 46 9 0 26.05.2011 12:00 248.5 2.1 44 15 012.05.2011 13:00 288.5 0.9 47 10 0 26.05.2011 13:00 244.5 2.3 42 12 012.05.2011 14:00 292.5 1.1 49 8 0 26.05.2011 14:00 247.5 2.5 44 13 312.05.2011 15:00 295.5 1.2 45 9 0 26.05.2011 15:00 250.5 2.6 46 14 012.05.2011 16:00 266 0.5 44 10 0 26.05.2011 16:00 243.5 1.3 41 16 012.05.2011 17:00 270 0.6 45 11 0 26.05.2011 17:00 247.5 1.4 42 17 512.05.2011 18:00 274.5 0.7 39 12 0 26.05.2011 18:00 251.5 1.5 43 18 012.05.2011 19:00 220.5 0.6 35 17 0 26.05.2011 19:00 221.5 1.8 35 19 012.05.2011 20:00 225 0.8 32 19 0 26.05.2011 20:00 225 1.9 36 20 012.05.2011 21:00 228.5 0.9 33 20 0 26.05.2011 21:00 229 2.1 37 21 012.05.2011 22:00 200.5 3.2 28 22 0 26.05.2011 22:00 200.5 2.7 34 22 012.05.2011 23:00 202.5 3.3 29 24 0 26.05.2011 23:00 202.5 2.8 35 23 2512.05.2011 0:00 205.5 3.4 27 25 0 26.05.2011 0:00 205.5 2.9 36 24 013.05.2011 1:00 222.5 1.2 26 33 0 27.05.2011 1:00 222 2.4 33 22 013.05.2011 2:00 225 1.1 27 35 0 27.05.2011 2:00 225 2.5 34 23 4513.05.2011 3:00 228.5 1.2 25 36 0 27.05.2011 3:00 227.5 2.6 35 24 013.05.2011 4:00 221 1.5 26 40 0 27.05.2011 4:00 221 2.1 32 23 013.05.2011 5:00 225 1.6 27 41 0 27.05.2011 5:00 225 2.2 33 24 2513.05.2011 6:00 227.5 1.7 26 43 0 27.05.2011 6:00 229.5 2.3 34 26 013.05.2011 7:00 267 2.1 25 33 0 27.05.2011 7:00 244.5 2.9 36 24 013.05.2011 8:00 270 2.2 27 34 0 27.05.2011 8:00 247.5 3.1 38 26 413.05.2011 9:00 274 2.3 29 36 0 27.05.2011 9:00 250.5 3.3 39 27 013.05.2011 10:00 311 1.7 35 22 0 27.05.2011 10:00 289 2.4 43 18 013.05.2011 11:00 315 1.6 47 11 1 27.05.2011 11:00 292.5 2.5 44 19 513.05.2011 12:00 318 1.7 44 12 0 27.05.2011 12:00 297.5 2.7 45 20 013.05.2011 13:00 289 1.5 46 10 0 27.05.2011 13:00 267 2.4 43 17 013.05.2011 14:00 292.5 1.6 47 11 2 27.05.2011 14:00 270 2.5 44 18 613.05.2011 15:00 296 1.7 45 14 0 27.05.2011 15:00 274 2.7 45 19 0

EIA / EMP Report of Goendamal Graphite Ore Mines of Shri Natwar Lal Agrawal, Balangir,District, Odisha.
Vet By : SHRI ENVIRONMENTAL TECHNOLOGY INSTITUTE ,NEW DELHI
193
13.05.2011 16:00 244 1.2 42 12 0 27.05.2011 16:00 267 3.5 39 22 013.05.2011 17:00 247.5 1.1 44 13 2 27.05.2011 17:00 270 3.6 40 25 1313.05.2011 18:00 250 1.3 40 14 0 27.05.2011 18:00 275.5 3.8 42 27 013.05.2011 19:00 200 1.4 37 19 0 27.05.2011 19:00 221.5 1.3 34 29 013.05.2011 20:00 202.5 1.6 35 21 0 27.05.2011 20:00 225 1.4 35 30 213.05.2011 21:00 205 1.7 36 23 0 27.05.2011 21:00 228.5 1.5 37 33 013.05.2011 22:00 177 1.4 32 24 0 27.05.2011 22:00 198.5 1.6 32 28 013.05.2011 23:00 180 1.9 34 26 0 27.05.2011 23:00 202.5 1.7 33 31 213.05.2011 0:00 182 1.7 32 27 0 27.05.2011 0:00 205.5 1.8 35 33 014.05.2011 1:00 200 1.8 32 29 0 28.05.2011 1:00 200.5 0.7 30 37 014.05.2011 2:00 202.5 1.9 33 33 0 28.05.2011 2:00 202.5 0.8 32 38 1214.05.2011 3:00 205 2.1 34 34 0 28.05.2011 3:00 205.5 0.9 33 39 014.05.2011 4:00 201 1.6 30 39 0 28.05.2011 4:00 178 0.9 29 34 014.05.2011 5:00 202.5 1.7 31 40 0 28.05.2011 5:00 180 1.1 31 35 2114.05.2011 6:00 205 1.8 33 38 0 28.05.2011 6:00 183 1.2 33 36 014.05.2011 7:00 222 2.1 37 32 0 28.05.2011 7:00 222 1.6 34 26 014.05.2011 8:00 225 2.2 38 34 0 28.05.2011 8:00 225 1.7 35 27 1614.05.2011 9:00 222 2.3 39 35 0 28.05.2011 9:00 229 1.8 37 28 014.05.2011 10:00 267 2.3 42 16 0 28.05.2011 10:00 267 0.9 42 16 014.05.2011 11:00 270 2.2 45 17 8 28.05.2011 11:00 270 1.1 43 17 1814.05.2011 12:00 274 2.4 47 19 0 28.05.2011 12:00 273 1.2 45 18 014.05.2011 13:00 200 2.4 43 22 0 28.05.2011 13:00 244.5 0.9 43 12 014.05.2011 14:00 202.5 2.5 42 21 9 28.05.2011 14:00 247.5 1.1 44 13 4414.05.2011 15:00 205.5 2.6 40 24 0 28.05.2011 15:00 249.5 1.3 45 14 014.05.2011 16:00 177 3.3 38 25 0 28.05.2011 16:00 199.5 0.8 41 12 014.05.2011 17:00 180 3.3 39 26 4 28.05.2011 17:00 202.5 1.1 42 15 1214.05.2011 18:00 184 3.4 41 28 0 28.05.2011 18:00 205.5 1.3 44 17 014.05.2011 19:00 176 2.1 34 31 0 28.05.2011 19:00 177.5 1.8 34 18 014.05.2011 20:00 180 1.9 34 33 3 28.05.2011 20:00 180 1.9 36 19 214.05.2011 21:00 185 2.1 33 35 0 28.05.2011 21:00 184 2.1 37 21 014.05.2011 22:00 177 1.8 32 34 0 28.05.2011 22:00 176.5 1.9 32 29 014.05.2011 23:00 180 1.9 33 37 0 28.05.2011 23:00 180 2.2 34 30 014.05.2011 0:00 183 2.1 31 36 0 28.05.2011 0:00 184.5 2.4 35 32 015.05.2011 1:00 199 2.2 32 38 0 29.05.2011 1:00 176 1.6 29 38 015.05.2011 2:00 202.5 1.9 31 47 0 29.05.2011 2:00 180 1.7 31 41 015.05.2011 3:00 205 1.8 32 44 0 29.05.2011 3:00 184.5 18 33 43 015.05.2011 4:00 200 2.1 28 46 0 29.05.2011 4:00 198.5 1.6 28 42 015.05.2011 5:00 202.5 1.9 30 49 0 29.05.2011 5:00 202.5 1.7 29 44 015.05.2011 6:00 205 2.1 32 47 0 29.05.2011 6:00 205.5 1.8 31 45 015.05.2011 7:00 228 2.1 35 33 0 29.05.2011 7:00 244.5 2.1 35 21 015.05.2011 8:00 225 2.2 37 32 2 29.05.2011 8:00 247.5 2.2 37 23 015.05.2011 9:00 229 2.3 39 31 0 29.05.2011 9:00 251.5 2.4 38 24 015.05.2011 10:00 244 2.1 41 23 0 29.05.2011 10:00 312 1.3 44 11 015.05.2011 11:00 247.5 2.2 44 17 5 29.05.2011 11:00 315 1.4 45 12 115.05.2011 12:00 251 2.3 42 18 0 29.05.2011 12:00 318 1.5 47 13 015.05.2011 13:00 267 0.7 43 17 0 29.05.2011 13:00 290.5 0.7 45 10 015.05.2011 14:00 270 0.8 44 19 7 29.05.2011 14:00 292.5 0.8 47 11 215.05.2011 15:00 274 0.9 42 18 0 29.05.2011 15:00 295.5 0.9 49 12 015.05.2011 16:00 177 1.2 41 17 0 29.05.2011 16:00 221.5 0.8 40 14 0
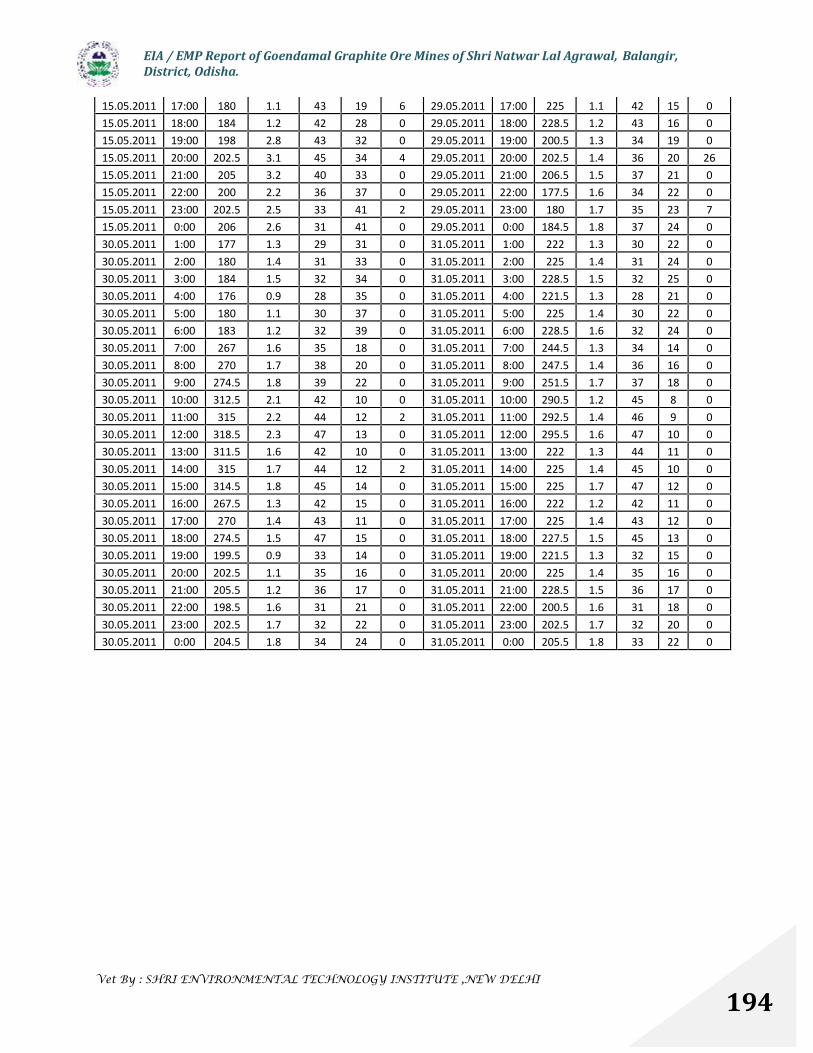
EIA / EMP Report of Goendamal Graphite Ore Mines of Shri Natwar Lal Agrawal, Balangir,District, Odisha.
Vet By : SHRI ENVIRONMENTAL TECHNOLOGY INSTITUTE ,NEW DELHI
194
15.05.2011 17:00 180 1.1 43 19 6 29.05.2011 17:00 225 1.1 42 15 015.05.2011 18:00 184 1.2 42 28 0 29.05.2011 18:00 228.5 1.2 43 16 015.05.2011 19:00 198 2.8 43 32 0 29.05.2011 19:00 200.5 1.3 34 19 015.05.2011 20:00 202.5 3.1 45 34 4 29.05.2011 20:00 202.5 1.4 36 20 2615.05.2011 21:00 205 3.2 40 33 0 29.05.2011 21:00 206.5 1.5 37 21 015.05.2011 22:00 200 2.2 36 37 0 29.05.2011 22:00 177.5 1.6 34 22 015.05.2011 23:00 202.5 2.5 33 41 2 29.05.2011 23:00 180 1.7 35 23 715.05.2011 0:00 206 2.6 31 41 0 29.05.2011 0:00 184.5 1.8 37 24 030.05.2011 1:00 177 1.3 29 31 0 31.05.2011 1:00 222 1.3 30 22 030.05.2011 2:00 180 1.4 31 33 0 31.05.2011 2:00 225 1.4 31 24 030.05.2011 3:00 184 1.5 32 34 0 31.05.2011 3:00 228.5 1.5 32 25 030.05.2011 4:00 176 0.9 28 35 0 31.05.2011 4:00 221.5 1.3 28 21 030.05.2011 5:00 180 1.1 30 37 0 31.05.2011 5:00 225 1.4 30 22 030.05.2011 6:00 183 1.2 32 39 0 31.05.2011 6:00 228.5 1.6 32 24 030.05.2011 7:00 267 1.6 35 18 0 31.05.2011 7:00 244.5 1.3 34 14 030.05.2011 8:00 270 1.7 38 20 0 31.05.2011 8:00 247.5 1.4 36 16 030.05.2011 9:00 274.5 1.8 39 22 0 31.05.2011 9:00 251.5 1.7 37 18 030.05.2011 10:00 312.5 2.1 42 10 0 31.05.2011 10:00 290.5 1.2 45 8 030.05.2011 11:00 315 2.2 44 12 2 31.05.2011 11:00 292.5 1.4 46 9 030.05.2011 12:00 318.5 2.3 47 13 0 31.05.2011 12:00 295.5 1.6 47 10 030.05.2011 13:00 311.5 1.6 42 10 0 31.05.2011 13:00 222 1.3 44 11 030.05.2011 14:00 315 1.7 44 12 2 31.05.2011 14:00 225 1.4 45 10 030.05.2011 15:00 314.5 1.8 45 14 0 31.05.2011 15:00 225 1.7 47 12 030.05.2011 16:00 267.5 1.3 42 15 0 31.05.2011 16:00 222 1.2 42 11 030.05.2011 17:00 270 1.4 43 11 0 31.05.2011 17:00 225 1.4 43 12 030.05.2011 18:00 274.5 1.5 47 15 0 31.05.2011 18:00 227.5 1.5 45 13 030.05.2011 19:00 199.5 0.9 33 14 0 31.05.2011 19:00 221.5 1.3 32 15 030.05.2011 20:00 202.5 1.1 35 16 0 31.05.2011 20:00 225 1.4 35 16 030.05.2011 21:00 205.5 1.2 36 17 0 31.05.2011 21:00 228.5 1.5 36 17 030.05.2011 22:00 198.5 1.6 31 21 0 31.05.2011 22:00 200.5 1.6 31 18 030.05.2011 23:00 202.5 1.7 32 22 0 31.05.2011 23:00 202.5 1.7 32 20 030.05.2011 0:00 204.5 1.8 34 24 0 31.05.2011 0:00 205.5 1.8 33 22 0
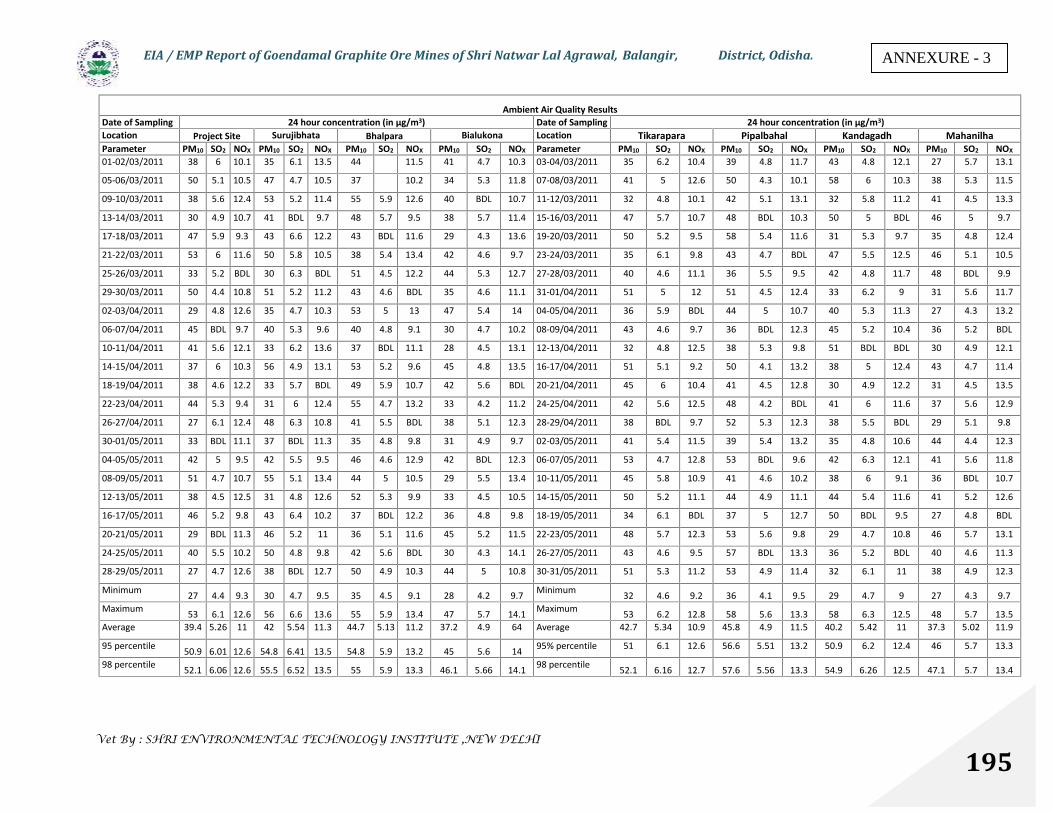
EIA / EMP Report of Goendamal Graphite Ore Mines of Shri Natwar Lal Agrawal, Balangir, District, Odisha.
Vet By : SHRI ENVIRONMENTAL TECHNOLOGY INSTITUTE ,NEW DELHI
195
Ambient Air Quality ResultsDate of Sampling 24 hour concentration (in μg/m3) Date of Sampling 24 hour concentration (in μg/m3)Location Project Site Surujibhata Bhalpara Bialukona Location Tikarapara Pipalbahal Kandagadh MahanilhaParameter PM10 SO2 NOX PM10 SO2 NOX PM10 SO2 NOX PM10 SO2 NOX Parameter PM10 SO2 NOX PM10 SO2 NOX PM10 SO2 NOX PM10 SO2 NOX
01-02/03/2011 38 6 10.1 35 6.1 13.5 44 11.5 41 4.7 10.3 03-04/03/2011 35 6.2 10.4 39 4.8 11.7 43 4.8 12.1 27 5.7 13.1
05-06/03/2011 50 5.1 10.5 47 4.7 10.5 37 10.2 34 5.3 11.8 07-08/03/2011 41 5 12.6 50 4.3 10.1 58 6 10.3 38 5.3 11.5
09-10/03/2011 38 5.6 12.4 53 5.2 11.4 55 5.9 12.6 40 BDL 10.7 11-12/03/2011 32 4.8 10.1 42 5.1 13.1 32 5.8 11.2 41 4.5 13.3
13-14/03/2011 30 4.9 10.7 41 BDL 9.7 48 5.7 9.5 38 5.7 11.4 15-16/03/2011 47 5.7 10.7 48 BDL 10.3 50 5 BDL 46 5 9.7
17-18/03/2011 47 5.9 9.3 43 6.6 12.2 43 BDL 11.6 29 4.3 13.6 19-20/03/2011 50 5.2 9.5 58 5.4 11.6 31 5.3 9.7 35 4.8 12.4
21-22/03/2011 53 6 11.6 50 5.8 10.5 38 5.4 13.4 42 4.6 9.7 23-24/03/2011 35 6.1 9.8 43 4.7 BDL 47 5.5 12.5 46 5.1 10.5
25-26/03/2011 33 5.2 BDL 30 6.3 BDL 51 4.5 12.2 44 5.3 12.7 27-28/03/2011 40 4.6 11.1 36 5.5 9.5 42 4.8 11.7 48 BDL 9.9
29-30/03/2011 50 4.4 10.8 51 5.2 11.2 43 4.6 BDL 35 4.6 11.1 31-01/04/2011 51 5 12 51 4.5 12.4 33 6.2 9 31 5.6 11.7
02-03/04/2011 29 4.8 12.6 35 4.7 10.3 53 5 13 47 5.4 14 04-05/04/2011 36 5.9 BDL 44 5 10.7 40 5.3 11.3 27 4.3 13.2
06-07/04/2011 45 BDL 9.7 40 5.3 9.6 40 4.8 9.1 30 4.7 10.2 08-09/04/2011 43 4.6 9.7 36 BDL 12.3 45 5.2 10.4 36 5.2 BDL
10-11/04/2011 41 5.6 12.1 33 6.2 13.6 37 BDL 11.1 28 4.5 13.1 12-13/04/2011 32 4.8 12.5 38 5.3 9.8 51 BDL BDL 30 4.9 12.1
14-15/04/2011 37 6 10.3 56 4.9 13.1 53 5.2 9.6 45 4.8 13.5 16-17/04/2011 51 5.1 9.2 50 4.1 13.2 38 5 12.4 43 4.7 11.4
18-19/04/2011 38 4.6 12.2 33 5.7 BDL 49 5.9 10.7 42 5.6 BDL 20-21/04/2011 45 6 10.4 41 4.5 12.8 30 4.9 12.2 31 4.5 13.5
22-23/04/2011 44 5.3 9.4 31 6 12.4 55 4.7 13.2 33 4.2 11.2 24-25/04/2011 42 5.6 12.5 48 4.2 BDL 41 6 11.6 37 5.6 12.9
26-27/04/2011 27 6.1 12.4 48 6.3 10.8 41 5.5 BDL 38 5.1 12.3 28-29/04/2011 38 BDL 9.7 52 5.3 12.3 38 5.5 BDL 29 5.1 9.8
30-01/05/2011 33 BDL 11.1 37 BDL 11.3 35 4.8 9.8 31 4.9 9.7 02-03/05/2011 41 5.4 11.5 39 5.4 13.2 35 4.8 10.6 44 4.4 12.3
04-05/05/2011 42 5 9.5 42 5.5 9.5 46 4.6 12.9 42 BDL 12.3 06-07/05/2011 53 4.7 12.8 53 BDL 9.6 42 6.3 12.1 41 5.6 11.8
08-09/05/2011 51 4.7 10.7 55 5.1 13.4 44 5 10.5 29 5.5 13.4 10-11/05/2011 45 5.8 10.9 41 4.6 10.2 38 6 9.1 36 BDL 10.7
12-13/05/2011 38 4.5 12.5 31 4.8 12.6 52 5.3 9.9 33 4.5 10.5 14-15/05/2011 50 5.2 11.1 44 4.9 11.1 44 5.4 11.6 41 5.2 12.6
16-17/05/2011 46 5.2 9.8 43 6.4 10.2 37 BDL 12.2 36 4.8 9.8 18-19/05/2011 34 6.1 BDL 37 5 12.7 50 BDL 9.5 27 4.8 BDL
20-21/05/2011 29 BDL 11.3 46 5.2 11 36 5.1 11.6 45 5.2 11.5 22-23/05/2011 48 5.7 12.3 53 5.6 9.8 29 4.7 10.8 46 5.7 13.1
24-25/05/2011 40 5.5 10.2 50 4.8 9.8 42 5.6 BDL 30 4.3 14.1 26-27/05/2011 43 4.6 9.5 57 BDL 13.3 36 5.2 BDL 40 4.6 11.3
28-29/05/2011 27 4.7 12.6 38 BDL 12.7 50 4.9 10.3 44 5 10.8 30-31/05/2011 51 5.3 11.2 53 4.9 11.4 32 6.1 11 38 4.9 12.3
Minimum 27 4.4 9.3 30 4.7 9.5 35 4.5 9.1 28 4.2 9.7 Minimum 32 4.6 9.2 36 4.1 9.5 29 4.7 9 27 4.3 9.7Maximum 53 6.1 12.6 56 6.6 13.6 55 5.9 13.4 47 5.7 14.1 Maximum 53 6.2 12.8 58 5.6 13.3 58 6.3 12.5 48 5.7 13.5Average 39.4 5.26 11 42 5.54 11.3 44.7 5.13 11.2 37.2 4.9 64 Average 42.7 5.34 10.9 45.8 4.9 11.5 40.2 5.42 11 37.3 5.02 11.9
95 percentile 50.9 6.01 12.6 54.8 6.41 13.5 54.8 5.9 13.2 45 5.6 14 95% percentile 51 6.1 12.6 56.6 5.51 13.2 50.9 6.2 12.4 46 5.7 13.3
98 percentile 52.1 6.06 12.6 55.5 6.52 13.5 55 5.9 13.3 46.1 5.66 14.1 98 percentile 52.1 6.16 12.7 57.6 5.56 13.3 54.9 6.26 12.5 47.1 5.7 13.4
ANNEXURE - 3
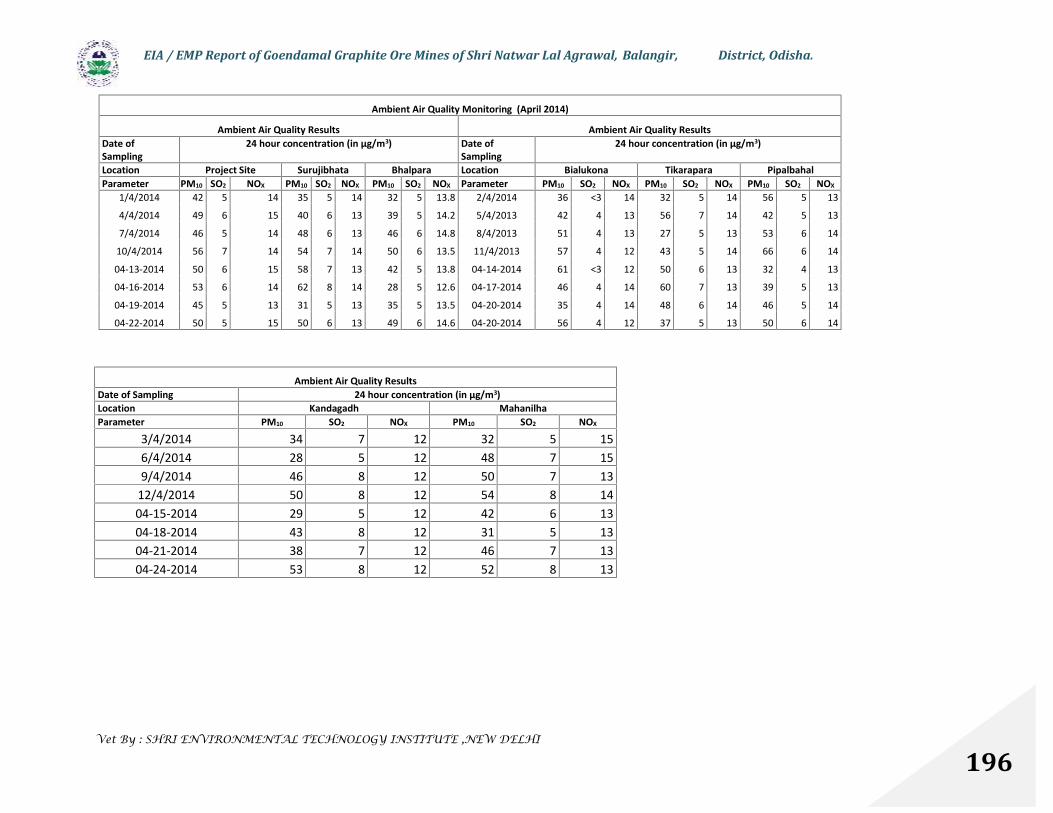
EIA / EMP Report of Goendamal Graphite Ore Mines of Shri Natwar Lal Agrawal, Balangir, District, Odisha.
Vet By : SHRI ENVIRONMENTAL TECHNOLOGY INSTITUTE ,NEW DELHI
196
Ambient Air Quality Monitoring (April 2014)
Ambient Air Quality Results Ambient Air Quality ResultsDate ofSampling
24 hour concentration (in μg/m3) Date ofSampling
24 hour concentration (in μg/m3)
Location Project Site Surujibhata Bhalpara Location Bialukona Tikarapara PipalbahalParameter PM10 SO2 NOX PM10 SO2 NOX PM10 SO2 NOX Parameter PM10 SO2 NOX PM10 SO2 NOX PM10 SO2 NOX
1/4/2014 42 5 14 35 5 14 32 5 13.8 2/4/2014 36 <3 14 32 5 14 56 5 13
4/4/2014 49 6 15 40 6 13 39 5 14.2 5/4/2013 42 4 13 56 7 14 42 5 13
7/4/2014 46 5 14 48 6 13 46 6 14.8 8/4/2013 51 4 13 27 5 13 53 6 14
10/4/2014 56 7 14 54 7 14 50 6 13.5 11/4/2013 57 4 12 43 5 14 66 6 14
04-13-2014 50 6 15 58 7 13 42 5 13.8 04-14-2014 61 <3 12 50 6 13 32 4 13
04-16-2014 53 6 14 62 8 14 28 5 12.6 04-17-2014 46 4 14 60 7 13 39 5 13
04-19-2014 45 5 13 31 5 13 35 5 13.5 04-20-2014 35 4 14 48 6 14 46 5 14
04-22-2014 50 5 15 50 6 13 49 6 14.6 04-20-2014 56 4 12 37 5 13 50 6 14
Ambient Air Quality ResultsDate of Sampling 24 hour concentration (in μg/m3)Location Kandagadh MahanilhaParameter PM10 SO2 NOX PM10 SO2 NOX
3/4/2014 34 7 12 32 5 156/4/2014 28 5 12 48 7 159/4/2014 46 8 12 50 7 13
12/4/2014 50 8 12 54 8 1404-15-2014 29 5 12 42 6 1304-18-2014 43 8 12 31 5 1304-21-2014 38 7 12 46 7 1304-24-2014 53 8 12 52 8 13

EIA / EMP Report of Goendamal Graphite Ore Mines of Shri Natwar Lal Agrawal, Balangir,District, Odisha.
Vet By : SHRI ENVIRONMENTAL TECHNOLOGY INSTITUTE ,NEW DELHI
197
Annexure-4Flora Of Core Zone
Sl. No Species Name Local Name1. Tectona grandis Teak2. Azadirachta indica Neem3. Madhuca indica Mahula4. Mangifera indica Mango5. Buchnania lanzam Char6. Bambusa sps Baunsa7. Terminalia chebula Harida8. Tamarindus indica Tentuli9. Diospyrus melanoxylon Kendu10. Anacardium occidentale Lanka Bhalia11. Citrus sps Lembu12. Syzygium cuminii Jamun13. Phyllanthus emblical Aonla14. Aegle marmelos Bela15. Hemidesmus indicus Anantamul16. Schleichera aleosa Kusum17. Semecarpus anacardium Bhalia18. Terminatia alata Asan19. Cyperus rotundus Mutha20. Lantana camera Nagaairi21. Cassia fistula Sunari22. Annona reticulata Ata
Flora of Buffer Zone
A. Large to Medium Trees
Sl. No Species Name Local Name1. Acacia nilotica Babool2. Adina cordifolia Kurum3. Aegle marmelas Bel4. Anogeissus latifalia Dhaura5. Artocurpus heterophyllus Panasa6. Azadirachta indica Neem7. Bauhunia parpurea Kanchan8. Bridelia retusa Kasi9. Buchania lanzan Char10. Careya arborea Kumbhi11. Dalbargia sisso Bali Sisso12. Drospyros melaxoxylon Kendu13. Eugeinia oojeinensis Bandhan14. Ficus Bengalensis Bara

EIA / EMP Report of Goendamal Graphite Ore Mines of Shri Natwar Lal Agrawal, Balangir,District, Odisha.
Vet By : SHRI ENVIRONMENTAL TECHNOLOGY INSTITUTE ,NEW DELHI
198
15. Ficus glomerata Dimiri16. Ficus religiosa Aswastha17. Gmelina arborea Gambhari18. Lagerstroemia parviflora Sidha19. Madhuca longifolia Mahul20. Mangifera indica Amba21. Morinda tinctoria Acchu22. Pongamia pinnata Karanj23. Prerocarpus marsupium Piasal24. Bombax ceiba Simili25. Samania saman Chakunda26. Schleichera aleosa Kusum27. Semecarpus anacardium Bhalia28. Shorea robusta Sal29. Syzygium cumini Jamu30. Tamarindus indica Tentuli31. Terminalia alata Asan32. Terminalia arjuna Arjuna33. Terminalia bellerica Bahada34. Terminalia chebula Harida35. Tectona grandis Saguan
B. Small Trees to shrubsSl. No Species Name Local Name1. Alangium salvifolium Ankul2. Cassia fistula Sunari3. Chromolaena odorata Poksunga4. Emblica officinalis Aonla5. Flemingia chappar Ranidantkathi6. Helicteres isora Antia7. Holarrhena antidysenterica Kurei8. Justicia adhatoda Basanga9. Lantana camara Naga airi10. Nyctanthes arbor – tristis Gangasiuli11. Pavetta indica Kukur chhalia12. Vitex nigundo Begunia13. Zizyphus mauritiana BarakoliC. Herbs and grasses & (Ferns)Sl. No Species Name1. Acalypha indica Nakachana2. Achyranthes aspera Apamaranga3. Amaranthus spinosus Kanta leutia4. Andrographis paniculata Bhuin neem

EIA / EMP Report of Goendamal Graphite Ore Mines of Shri Natwar Lal Agrawal, Balangir,District, Odisha.
Vet By : SHRI ENVIRONMENTAL TECHNOLOGY INSTITUTE ,NEW DELHI
199
5. Barleria prionitis Daskerenda6. Commelina benghalensis Kanasiri7. Curculigo orchoides Talamuli8. Cynodon dactylon Duba9. Cyperus rotundus Mutha10. Elephantapus scaber Mayurchulia11. Evolvulus alsinoides Jyotismati12. Oldenlandia corymbosa Gharapodia13. Phyllanthus amarus Bhuin amla14. Scoparia dulsis Badi justimadhu15. Sida cordifolia Bajramuli16. Tridax procumbens BisalyakaraniD. ClimbersSl. No Species Name Local Name1 Celastrus paniculatus Korsana2 Combretum roxburghii Atundi4 Bauhinia vahlii Siali6 Smilax zylanicum Muturi7 Ichnocarpus frutescens Dudhnai9 Asparagus racemosus Satabari10 Dioscorea sps Pita alu11 Tragia involucrate Bichuati
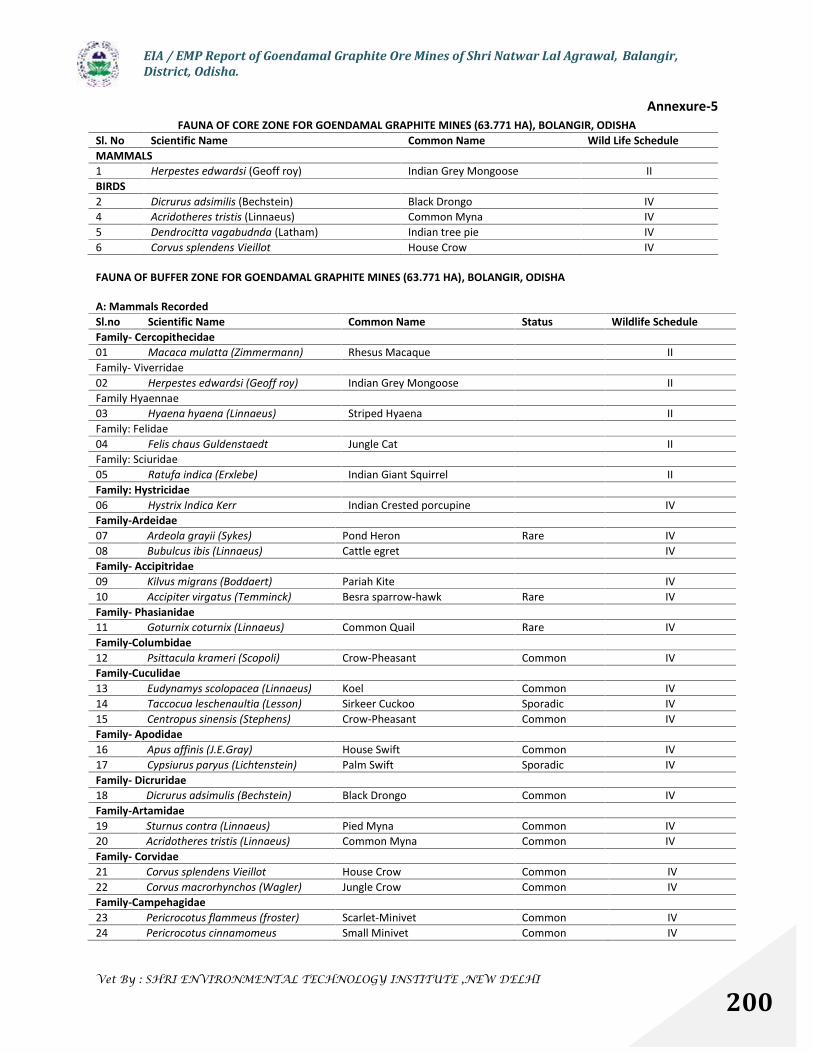
EIA / EMP Report of Goendamal Graphite Ore Mines of Shri Natwar Lal Agrawal, Balangir,District, Odisha.
Vet By : SHRI ENVIRONMENTAL TECHNOLOGY INSTITUTE ,NEW DELHI
200
Annexure-5FAUNA OF CORE ZONE FOR GOENDAMAL GRAPHITE MINES (63.771 HA), BOLANGIR, ODISHA
Sl. No Scientific Name Common Name Wild Life ScheduleMAMMALS1 Herpestes edwardsi (Geoff roy) Indian Grey Mongoose IIBIRDS2 Dicrurus adsimilis (Bechstein) Black Drongo IV4 Acridotheres tristis (Linnaeus) Common Myna IV5 Dendrocitta vagabudnda (Latham) Indian tree pie IV6 Corvus splendens Vieillot House Crow IV
FAUNA OF BUFFER ZONE FOR GOENDAMAL GRAPHITE MINES (63.771 HA), BOLANGIR, ODISHA
A: Mammals RecordedSl.no Scientific Name Common Name Status Wildlife ScheduleFamily- Cercopithecidae01 Macaca mulatta (Zimmermann) Rhesus Macaque IIFamily- Viverridae02 Herpestes edwardsi (Geoff roy) Indian Grey Mongoose IIFamily Hyaennae03 Hyaena hyaena (Linnaeus) Striped Hyaena IIFamily: Felidae04 Felis chaus Guldenstaedt Jungle Cat IIFamily: Sciuridae05 Ratufa indica (Erxlebe) Indian Giant Squirrel IIFamily: Hystricidae06 Hystrix Indica Kerr Indian Crested porcupine IVFamily-Ardeidae07 Ardeola grayii (Sykes) Pond Heron Rare IV08 Bubulcus ibis (Linnaeus) Cattle egret IVFamily- Accipitridae09 Kilvus migrans (Boddaert) Pariah Kite IV10 Accipiter virgatus (Temminck) Besra sparrow-hawk Rare IVFamily- Phasianidae11 Goturnix coturnix (Linnaeus) Common Quail Rare IVFamily-Columbidae12 Psittacula krameri (Scopoli) Crow-Pheasant Common IVFamily-Cuculidae13 Eudynamys scolopacea (Linnaeus) Koel Common IV14 Taccocua leschenaultia (Lesson) Sirkeer Cuckoo Sporadic IV15 Centropus sinensis (Stephens) Crow-Pheasant Common IVFamily- Apodidae16 Apus affinis (J.E.Gray) House Swift Common IV17 Cypsiurus paryus (Lichtenstein) Palm Swift Sporadic IVFamily- Dicruridae18 Dicrurus adsimulis (Bechstein) Black Drongo Common IVFamily-Artamidae19 Sturnus contra (Linnaeus) Pied Myna Common IV20 Acridotheres tristis (Linnaeus) Common Myna Common IVFamily- Corvidae21 Corvus splendens Vieillot House Crow Common IV22 Corvus macrorhynchos (Wagler) Jungle Crow Common IVFamily-Campehagidae23 Pericrocotus flammeus (froster) Scarlet-Minivet Common IV24 Pericrocotus cinnamomeus Small Minivet Common IV

EIA / EMP Report of Goendamal Graphite Ore Mines of Shri Natwar Lal Agrawal, Balangir,District, Odisha.
Vet By : SHRI ENVIRONMENTAL TECHNOLOGY INSTITUTE ,NEW DELHI
201
(Linnaeus)Family- Pycnotidae25 Pycnonotus jocosus (Linnaeus) Red whiskered Bulbul Common IV26 Pycnonotus cafer (Linaeus) Red vented Bulbul Common IVFamily- Muscicapidae27 Turdoides stridatus orissae jerdon Jungle Babbler Common IV28 Orthotomus sutorius (pennant) Tailor Bird Common IVFamily-Ploceidae29 Passer domesticus (Linnaeus) House Sparrow Common IVC: ReptilesSl.no Scientific Name Common Name Status Wildlife ScheduleFamily-Scinicidae01 Mabuya carinata(Schneider) Common of Brahminy
SkinkCommon IV
Family-Typhlopidae02 Ramphotyphlops braminus (Daudin) Common Blind Snake Occasional IVFamily-Elapidae
03 Naja naja (Linnaeus) Indian Cobra Rare IID: AmphibiansSl.no Scientific Name Common Name Status Wildlife ScheduleFamily bufonidae01 Bufo melanosticus (Schneider) Common Indian Toad CommonFamily-Ranidae02 Rana limnocharis (Wiegmann) Paddy-field Frog Common IV
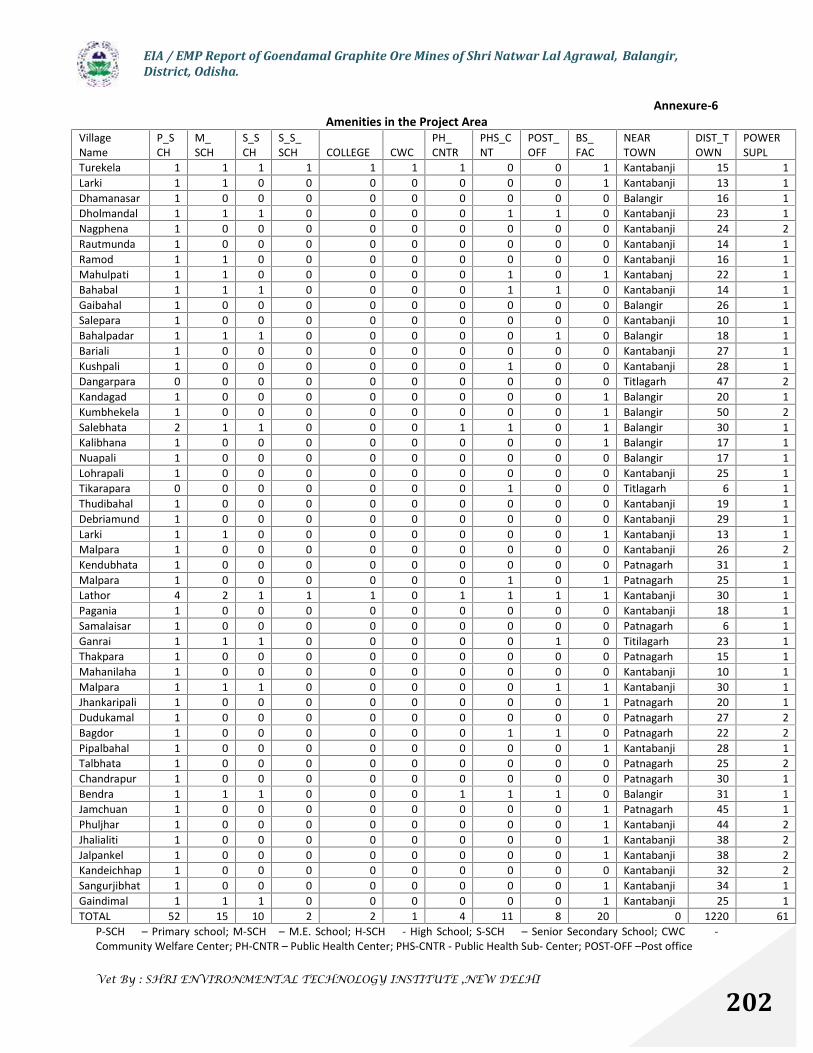
EIA / EMP Report of Goendamal Graphite Ore Mines of Shri Natwar Lal Agrawal, Balangir,District, Odisha.
Vet By : SHRI ENVIRONMENTAL TECHNOLOGY INSTITUTE ,NEW DELHI
202
Annexure-6Amenities in the Project Area
VillageName
P_SCH
M_SCH
S_SCH
S_S_SCH COLLEGE CWC
PH_CNTR
PHS_CNT
POST_OFF
BS_FAC
NEARTOWN
DIST_TOWN
POWERSUPL
Turekela 1 1 1 1 1 1 1 0 0 1 Kantabanji 15 1Larki 1 1 0 0 0 0 0 0 0 1 Kantabanji 13 1Dhamanasar 1 0 0 0 0 0 0 0 0 0 Balangir 16 1Dholmandal 1 1 1 0 0 0 0 1 1 0 Kantabanji 23 1Nagphena 1 0 0 0 0 0 0 0 0 0 Kantabanji 24 2Rautmunda 1 0 0 0 0 0 0 0 0 0 Kantabanji 14 1Ramod 1 1 0 0 0 0 0 0 0 0 Kantabanji 16 1Mahulpati 1 1 0 0 0 0 0 1 0 1 Kantabanj 22 1Bahabal 1 1 1 0 0 0 0 1 1 0 Kantabanji 14 1Gaibahal 1 0 0 0 0 0 0 0 0 0 Balangir 26 1Salepara 1 0 0 0 0 0 0 0 0 0 Kantabanji 10 1Bahalpadar 1 1 1 0 0 0 0 0 1 0 Balangir 18 1Bariali 1 0 0 0 0 0 0 0 0 0 Kantabanji 27 1Kushpali 1 0 0 0 0 0 0 1 0 0 Kantabanji 28 1Dangarpara 0 0 0 0 0 0 0 0 0 0 Titlagarh 47 2Kandagad 1 0 0 0 0 0 0 0 0 1 Balangir 20 1Kumbhekela 1 0 0 0 0 0 0 0 0 1 Balangir 50 2Salebhata 2 1 1 0 0 0 1 1 0 1 Balangir 30 1Kalibhana 1 0 0 0 0 0 0 0 0 1 Balangir 17 1Nuapali 1 0 0 0 0 0 0 0 0 0 Balangir 17 1Lohrapali 1 0 0 0 0 0 0 0 0 0 Kantabanji 25 1Tikarapara 0 0 0 0 0 0 0 1 0 0 Titlagarh 6 1Thudibahal 1 0 0 0 0 0 0 0 0 0 Kantabanji 19 1Debriamund 1 0 0 0 0 0 0 0 0 0 Kantabanji 29 1Larki 1 1 0 0 0 0 0 0 0 1 Kantabanji 13 1Malpara 1 0 0 0 0 0 0 0 0 0 Kantabanji 26 2Kendubhata 1 0 0 0 0 0 0 0 0 0 Patnagarh 31 1Malpara 1 0 0 0 0 0 0 1 0 1 Patnagarh 25 1Lathor 4 2 1 1 1 0 1 1 1 1 Kantabanji 30 1Pagania 1 0 0 0 0 0 0 0 0 0 Kantabanji 18 1Samalaisar 1 0 0 0 0 0 0 0 0 0 Patnagarh 6 1Ganrai 1 1 1 0 0 0 0 0 1 0 Titilagarh 23 1Thakpara 1 0 0 0 0 0 0 0 0 0 Patnagarh 15 1Mahanilaha 1 0 0 0 0 0 0 0 0 0 Kantabanji 10 1Malpara 1 1 1 0 0 0 0 0 1 1 Kantabanji 30 1Jhankaripali 1 0 0 0 0 0 0 0 0 1 Patnagarh 20 1Dudukamal 1 0 0 0 0 0 0 0 0 0 Patnagarh 27 2Bagdor 1 0 0 0 0 0 0 1 1 0 Patnagarh 22 2Pipalbahal 1 0 0 0 0 0 0 0 0 1 Kantabanji 28 1Talbhata 1 0 0 0 0 0 0 0 0 0 Patnagarh 25 2Chandrapur 1 0 0 0 0 0 0 0 0 0 Patnagarh 30 1Bendra 1 1 1 0 0 0 1 1 1 0 Balangir 31 1Jamchuan 1 0 0 0 0 0 0 0 0 1 Patnagarh 45 1Phuljhar 1 0 0 0 0 0 0 0 0 1 Kantabanji 44 2Jhalialiti 1 0 0 0 0 0 0 0 0 1 Kantabanji 38 2Jalpankel 1 0 0 0 0 0 0 0 0 1 Kantabanji 38 2Kandeichhap 1 0 0 0 0 0 0 0 0 0 Kantabanji 32 2Sangurjibhat 1 0 0 0 0 0 0 0 0 1 Kantabanji 34 1Gaindimal 1 1 1 0 0 0 0 0 0 1 Kantabanji 25 1TOTAL 52 15 10 2 2 1 4 11 8 20 0 1220 61
P-SCH – Primary school; M-SCH – M.E. School; H-SCH - High School; S-SCH – Senior Secondary School; CWC -Community Welfare Center; PH-CNTR – Public Health Center; PHS-CNTR - Public Health Sub- Center; POST-OFF –Post office
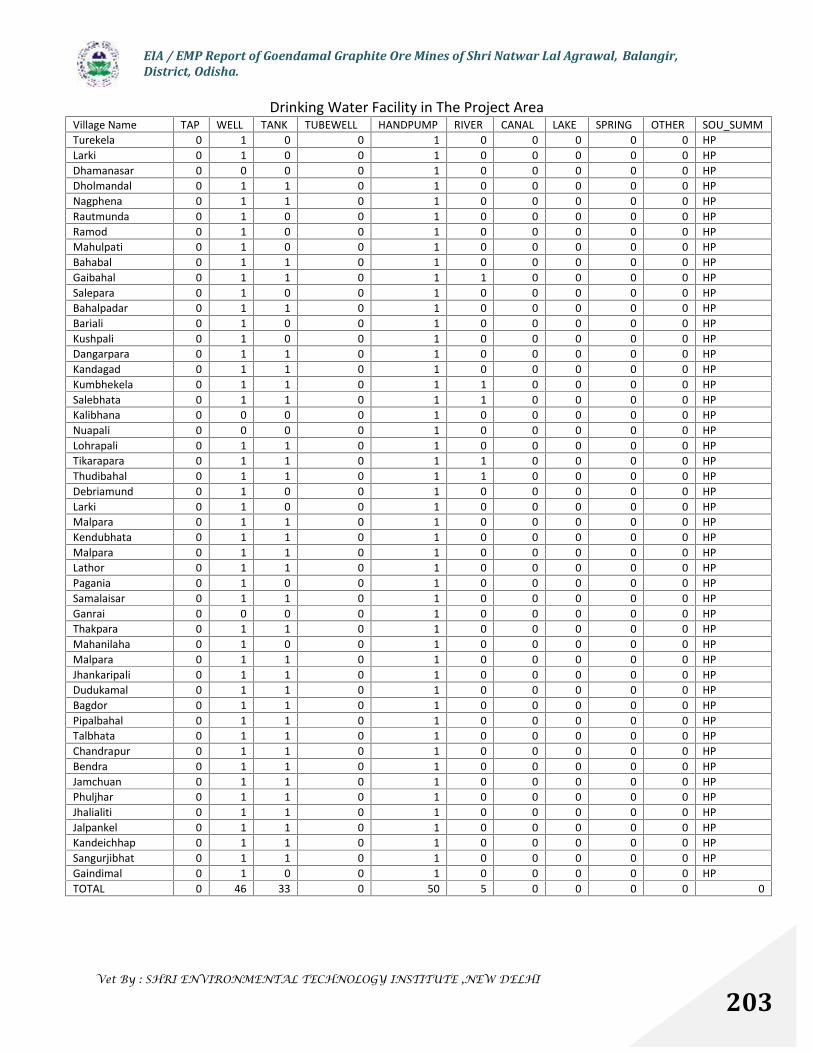
EIA / EMP Report of Goendamal Graphite Ore Mines of Shri Natwar Lal Agrawal, Balangir,District, Odisha.
Vet By : SHRI ENVIRONMENTAL TECHNOLOGY INSTITUTE ,NEW DELHI
203
Drinking Water Facility in The Project AreaVillage Name TAP WELL TANK TUBEWELL HANDPUMP RIVER CANAL LAKE SPRING OTHER SOU_SUMMTurekela 0 1 0 0 1 0 0 0 0 0 HPLarki 0 1 0 0 1 0 0 0 0 0 HPDhamanasar 0 0 0 0 1 0 0 0 0 0 HPDholmandal 0 1 1 0 1 0 0 0 0 0 HPNagphena 0 1 1 0 1 0 0 0 0 0 HPRautmunda 0 1 0 0 1 0 0 0 0 0 HPRamod 0 1 0 0 1 0 0 0 0 0 HPMahulpati 0 1 0 0 1 0 0 0 0 0 HPBahabal 0 1 1 0 1 0 0 0 0 0 HPGaibahal 0 1 1 0 1 1 0 0 0 0 HPSalepara 0 1 0 0 1 0 0 0 0 0 HPBahalpadar 0 1 1 0 1 0 0 0 0 0 HPBariali 0 1 0 0 1 0 0 0 0 0 HPKushpali 0 1 0 0 1 0 0 0 0 0 HPDangarpara 0 1 1 0 1 0 0 0 0 0 HPKandagad 0 1 1 0 1 0 0 0 0 0 HPKumbhekela 0 1 1 0 1 1 0 0 0 0 HPSalebhata 0 1 1 0 1 1 0 0 0 0 HPKalibhana 0 0 0 0 1 0 0 0 0 0 HPNuapali 0 0 0 0 1 0 0 0 0 0 HPLohrapali 0 1 1 0 1 0 0 0 0 0 HPTikarapara 0 1 1 0 1 1 0 0 0 0 HPThudibahal 0 1 1 0 1 1 0 0 0 0 HPDebriamund 0 1 0 0 1 0 0 0 0 0 HPLarki 0 1 0 0 1 0 0 0 0 0 HPMalpara 0 1 1 0 1 0 0 0 0 0 HPKendubhata 0 1 1 0 1 0 0 0 0 0 HPMalpara 0 1 1 0 1 0 0 0 0 0 HPLathor 0 1 1 0 1 0 0 0 0 0 HPPagania 0 1 0 0 1 0 0 0 0 0 HPSamalaisar 0 1 1 0 1 0 0 0 0 0 HPGanrai 0 0 0 0 1 0 0 0 0 0 HPThakpara 0 1 1 0 1 0 0 0 0 0 HPMahanilaha 0 1 0 0 1 0 0 0 0 0 HPMalpara 0 1 1 0 1 0 0 0 0 0 HPJhankaripali 0 1 1 0 1 0 0 0 0 0 HPDudukamal 0 1 1 0 1 0 0 0 0 0 HPBagdor 0 1 1 0 1 0 0 0 0 0 HPPipalbahal 0 1 1 0 1 0 0 0 0 0 HPTalbhata 0 1 1 0 1 0 0 0 0 0 HPChandrapur 0 1 1 0 1 0 0 0 0 0 HPBendra 0 1 1 0 1 0 0 0 0 0 HPJamchuan 0 1 1 0 1 0 0 0 0 0 HPPhuljhar 0 1 1 0 1 0 0 0 0 0 HPJhalialiti 0 1 1 0 1 0 0 0 0 0 HPJalpankel 0 1 1 0 1 0 0 0 0 0 HPKandeichhap 0 1 1 0 1 0 0 0 0 0 HPSangurjibhat 0 1 1 0 1 0 0 0 0 0 HPGaindimal 0 1 0 0 1 0 0 0 0 0 HPTOTAL 0 46 33 0 50 5 0 0 0 0 0
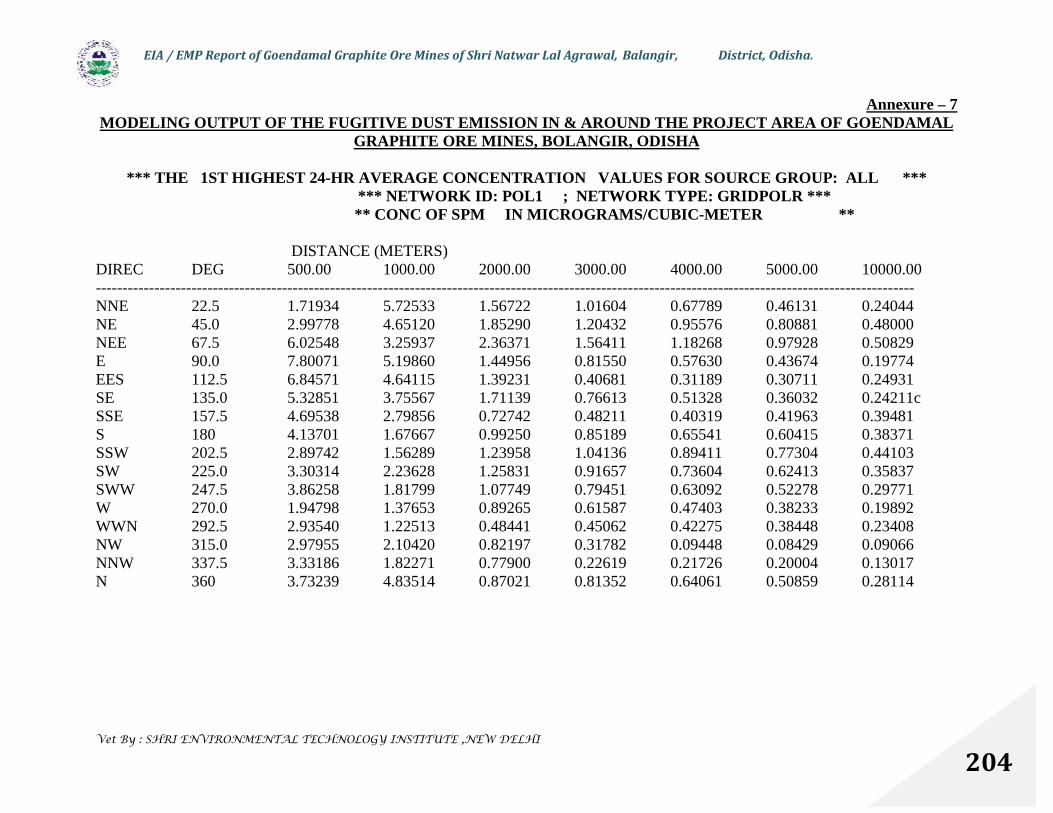
EIA / EMP Report of Goendamal Graphite Ore Mines of Shri Natwar Lal Agrawal, Balangir, District, Odisha.
Vet By : SHRI ENVIRONMENTAL TECHNOLOGY INSTITUTE ,NEW DELHI
204
Annexure – 7MODELING OUTPUT OF THE FUGITIVE DUST EMISSION IN & AROUND THE PROJECT AREA OF GOENDAMAL
GRAPHITE ORE MINES, BOLANGIR, ODISHA
*** THE 1ST HIGHEST 24-HR AVERAGE CONCENTRATION VALUES FOR SOURCE GROUP: ALL ****** NETWORK ID: POL1 ; NETWORK TYPE: GRIDPOLR ***** CONC OF SPM IN MICROGRAMS/CUBIC-METER **
DISTANCE (METERS)DIREC DEG 500.00 1000.00 2000.00 3000.00 4000.00 5000.00 10000.00----------------------------------------------------------------------------------------------------------------------------------------------------------NNE 22.5 1.71934 5.72533 1.56722 1.01604 0.67789 0.46131 0.24044NE 45.0 2.99778 4.65120 1.85290 1.20432 0.95576 0.80881 0.48000NEE 67.5 6.02548 3.25937 2.36371 1.56411 1.18268 0.97928 0.50829E 90.0 7.80071 5.19860 1.44956 0.81550 0.57630 0.43674 0.19774EES 112.5 6.84571 4.64115 1.39231 0.40681 0.31189 0.30711 0.24931SE 135.0 5.32851 3.75567 1.71139 0.76613 0.51328 0.36032 0.24211cSSE 157.5 4.69538 2.79856 0.72742 0.48211 0.40319 0.41963 0.39481S 180 4.13701 1.67667 0.99250 0.85189 0.65541 0.60415 0.38371SSW 202.5 2.89742 1.56289 1.23958 1.04136 0.89411 0.77304 0.44103SW 225.0 3.30314 2.23628 1.25831 0.91657 0.73604 0.62413 0.35837SWW 247.5 3.86258 1.81799 1.07749 0.79451 0.63092 0.52278 0.29771W 270.0 1.94798 1.37653 0.89265 0.61587 0.47403 0.38233 0.19892WWN 292.5 2.93540 1.22513 0.48441 0.45062 0.42275 0.38448 0.23408NW 315.0 2.97955 2.10420 0.82197 0.31782 0.09448 0.08429 0.09066NNW 337.5 3.33186 1.82271 0.77900 0.22619 0.21726 0.20004 0.13017N 360 3.73239 4.83514 0.87021 0.81352 0.64061 0.50859 0.28114
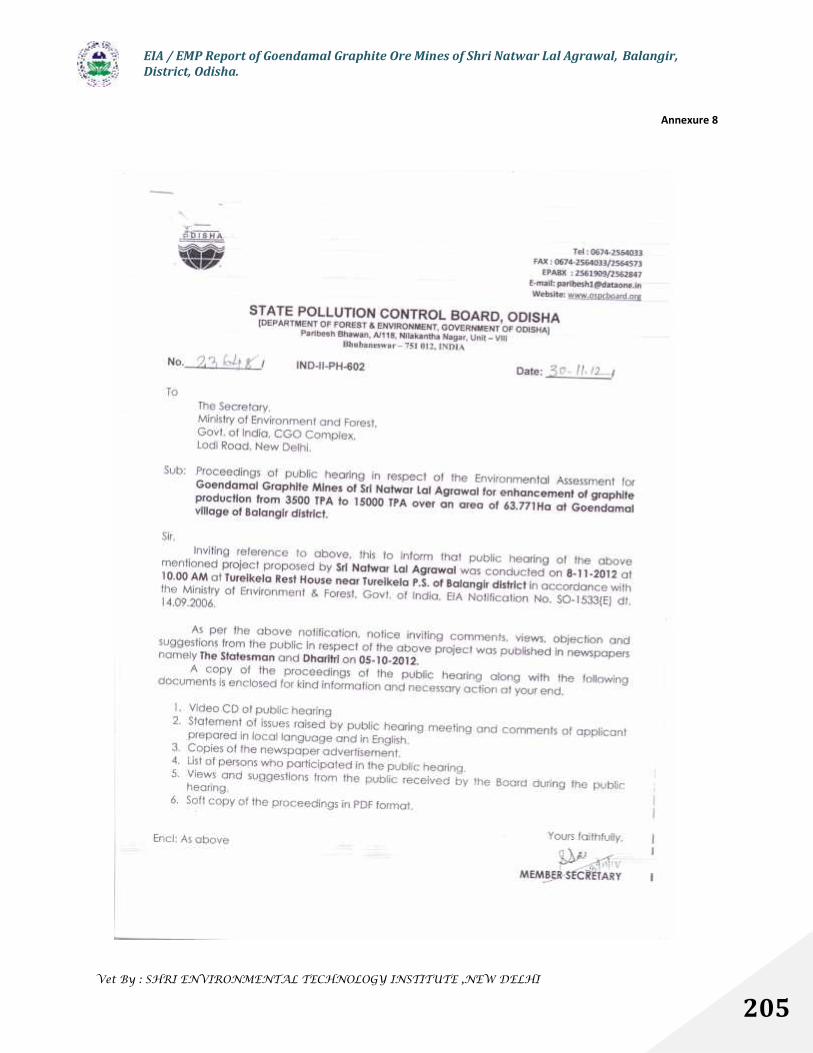
EIA / EMP Report of Goendamal Graphite Ore Mines of Shri Natwar Lal Agrawal, Balangir,District, Odisha.
Vet By : SHRI ENVIRONMENTAL TECHNOLOGY INSTITUTE ,NEW DELHI
205
Annexure 8
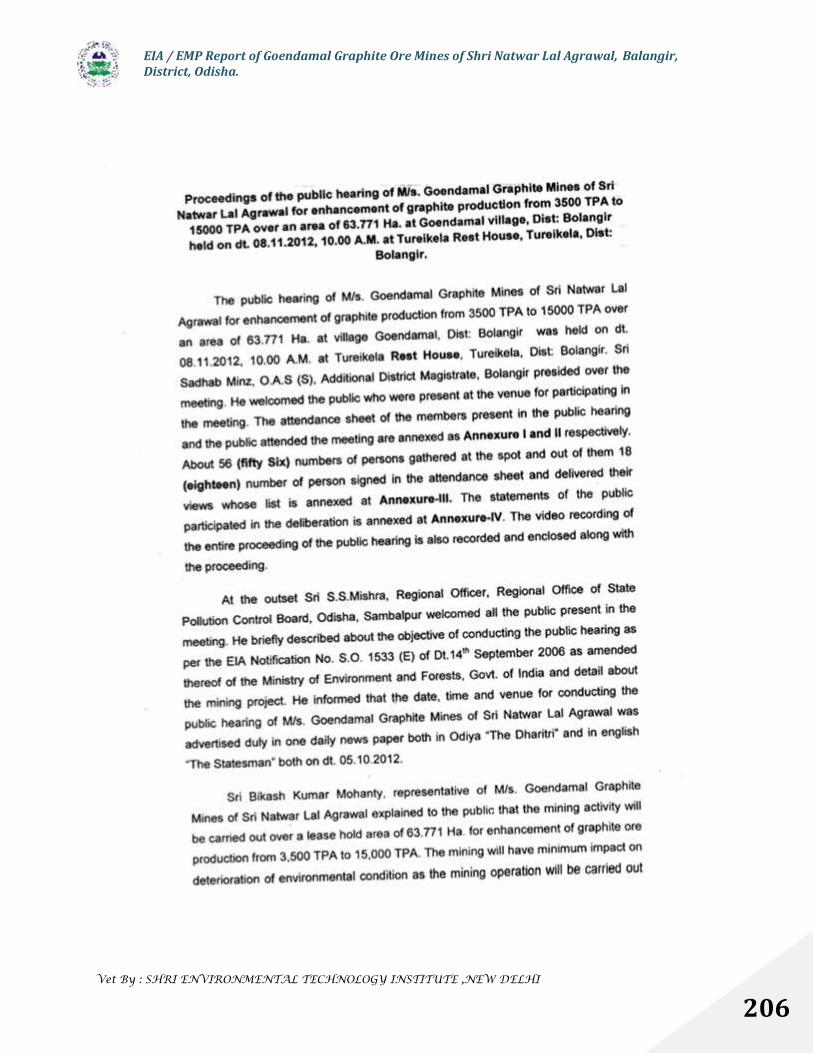
EIA / EMP Report of Goendamal Graphite Ore Mines of Shri Natwar Lal Agrawal, Balangir,District, Odisha.
Vet By : SHRI ENVIRONMENTAL TECHNOLOGY INSTITUTE ,NEW DELHI
206

EIA / EMP Report of Goendamal Graphite Ore Mines of Shri Natwar Lal Agrawal, Balangir,District, Odisha.
Vet By : SHRI ENVIRONMENTAL TECHNOLOGY INSTITUTE ,NEW DELHI
207
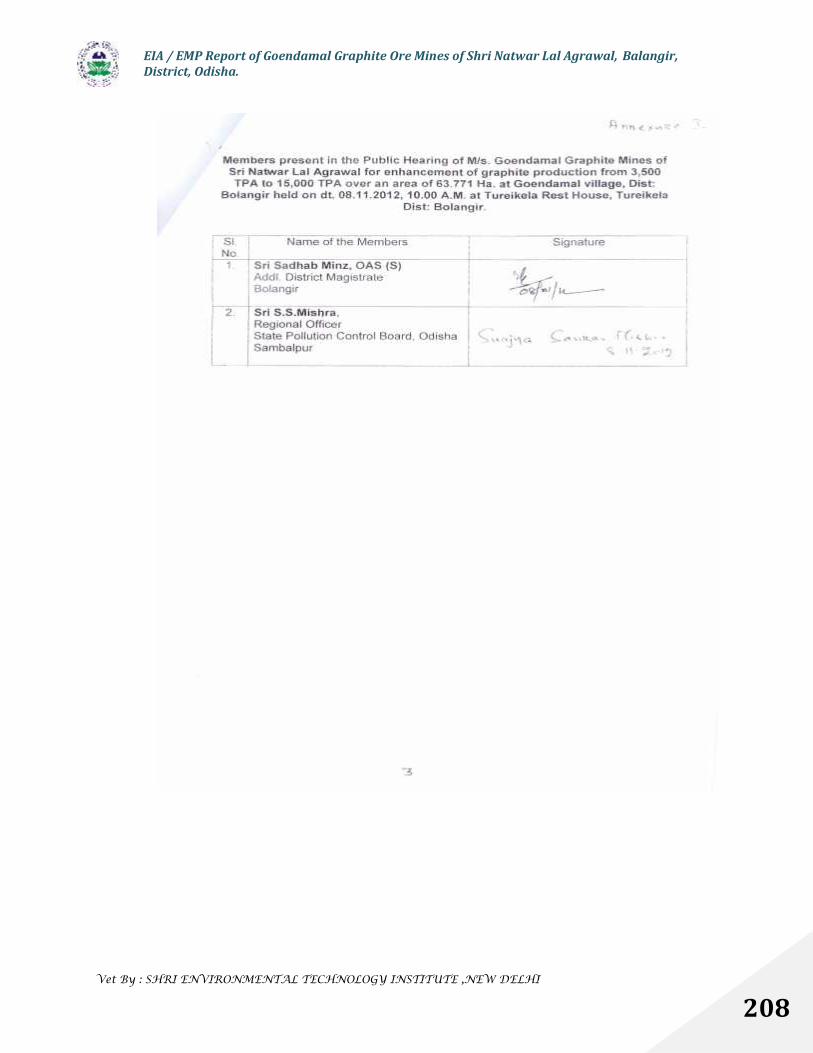
EIA / EMP Report of Goendamal Graphite Ore Mines of Shri Natwar Lal Agrawal, Balangir,District, Odisha.
Vet By : SHRI ENVIRONMENTAL TECHNOLOGY INSTITUTE ,NEW DELHI
208
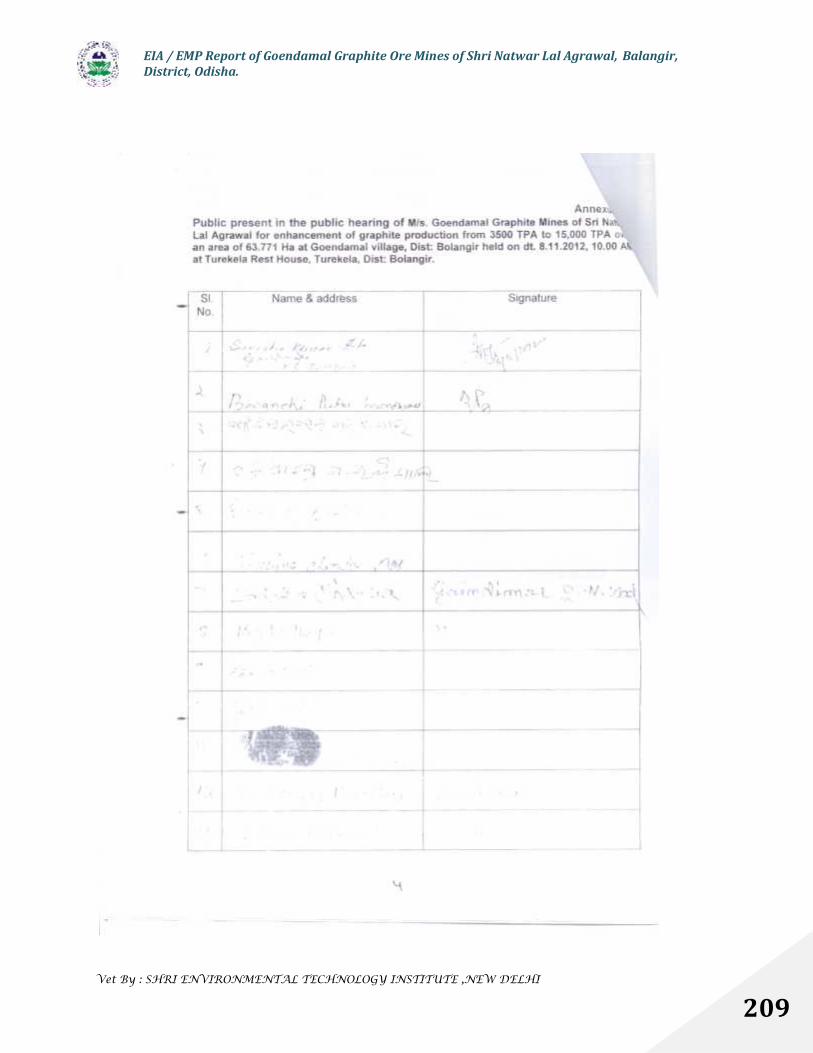
EIA / EMP Report of Goendamal Graphite Ore Mines of Shri Natwar Lal Agrawal, Balangir,District, Odisha.
Vet By : SHRI ENVIRONMENTAL TECHNOLOGY INSTITUTE ,NEW DELHI
209
EIA / EMP Report of Goendamal Graphite Ore Mines of Shri Natwar Lal Agrawal, Balangir,District, Odisha.
Vet By : SHRI ENVIRONMENTAL TECHNOLOGY INSTITUTE ,NEW DELHI
210
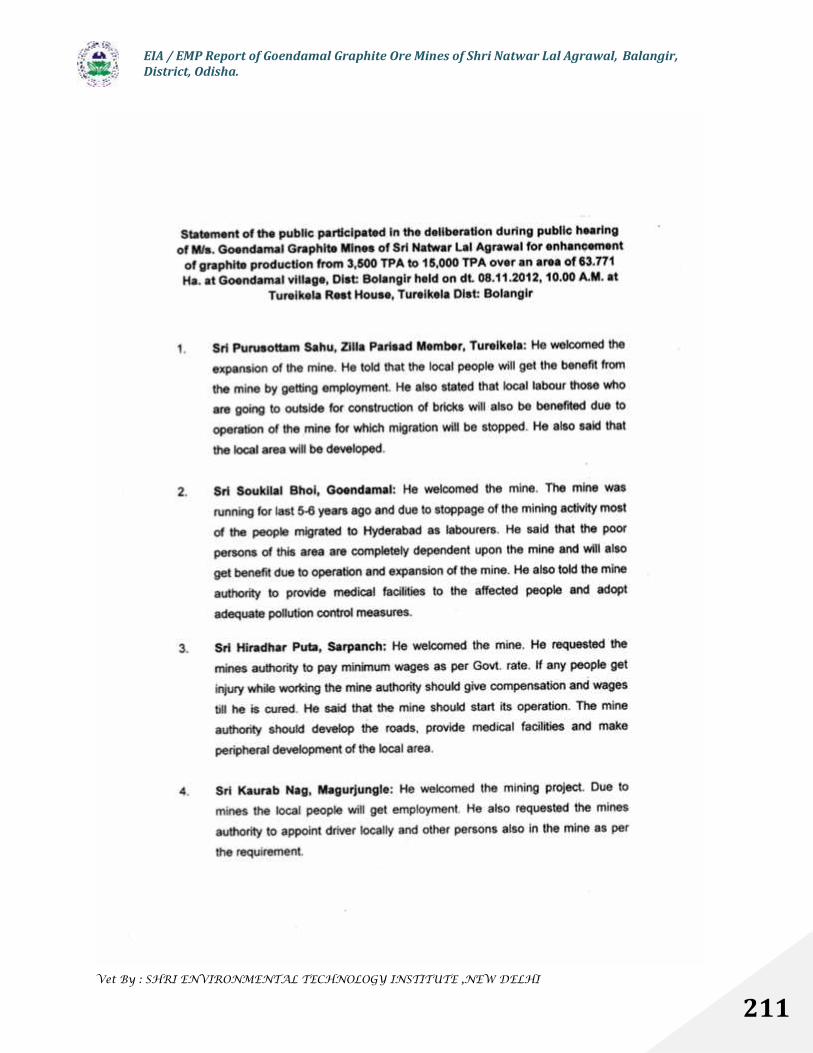
EIA / EMP Report of Goendamal Graphite Ore Mines of Shri Natwar Lal Agrawal, Balangir,District, Odisha.
Vet By : SHRI ENVIRONMENTAL TECHNOLOGY INSTITUTE ,NEW DELHI
211
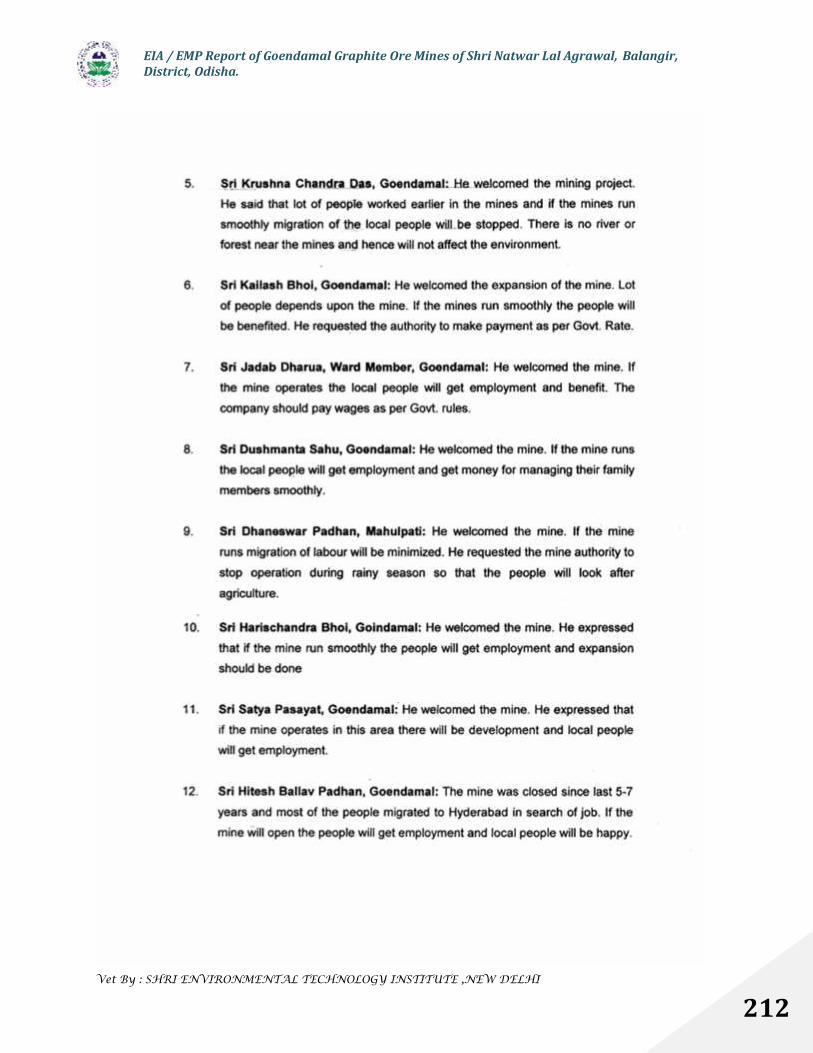
EIA / EMP Report of Goendamal Graphite Ore Mines of Shri Natwar Lal Agrawal, Balangir,District, Odisha.
Vet By : SHRI ENVIRONMENTAL TECHNOLOGY INSTITUTE ,NEW DELHI
212
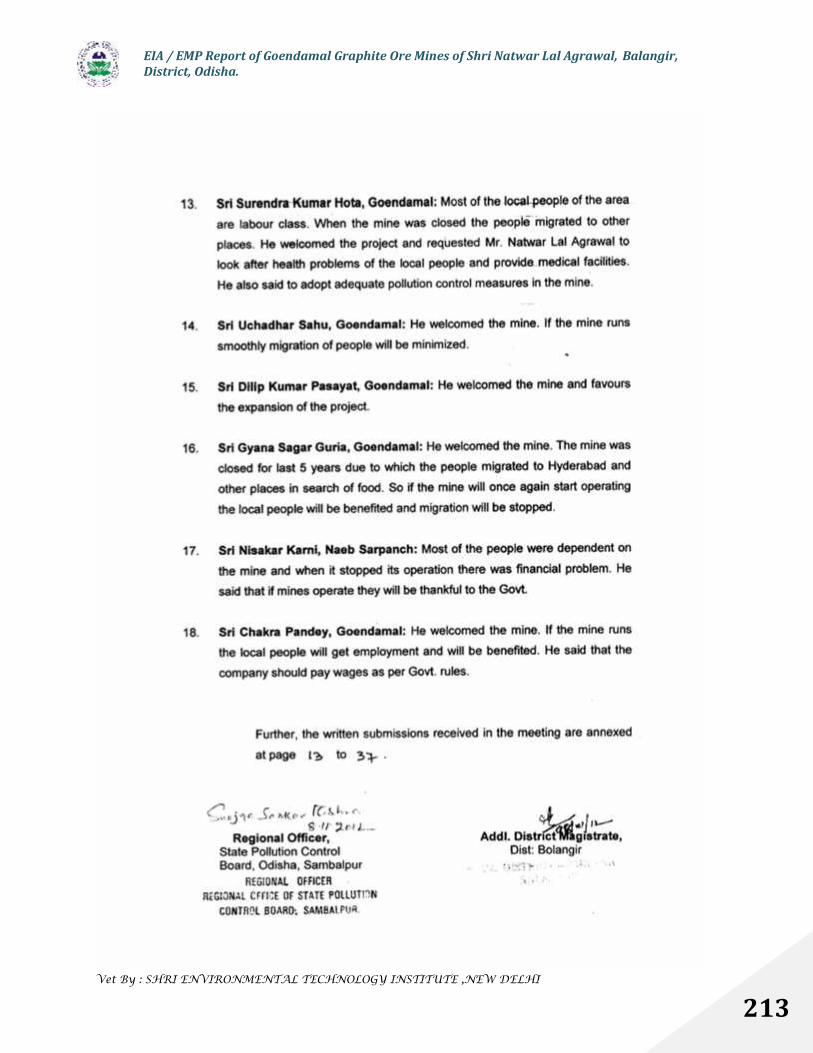
EIA / EMP Report of Goendamal Graphite Ore Mines of Shri Natwar Lal Agrawal, Balangir,District, Odisha.
Vet By : SHRI ENVIRONMENTAL TECHNOLOGY INSTITUTE ,NEW DELHI
213
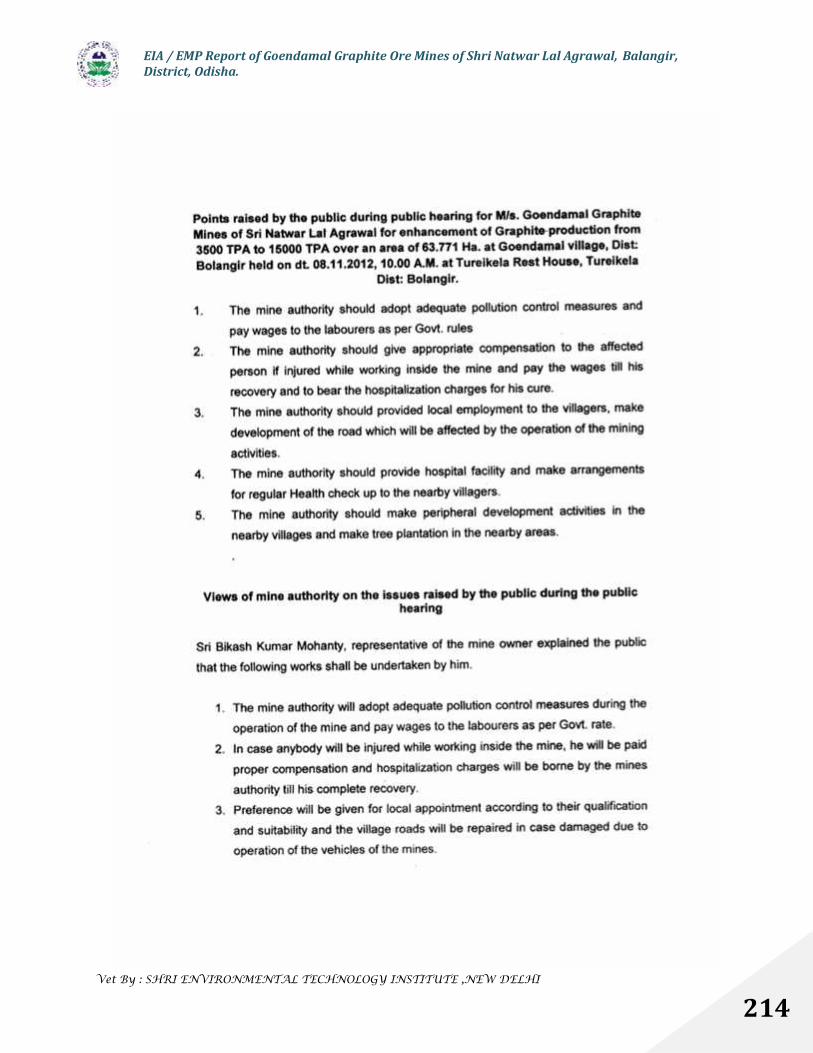
EIA / EMP Report of Goendamal Graphite Ore Mines of Shri Natwar Lal Agrawal, Balangir,District, Odisha.
Vet By : SHRI ENVIRONMENTAL TECHNOLOGY INSTITUTE ,NEW DELHI
214
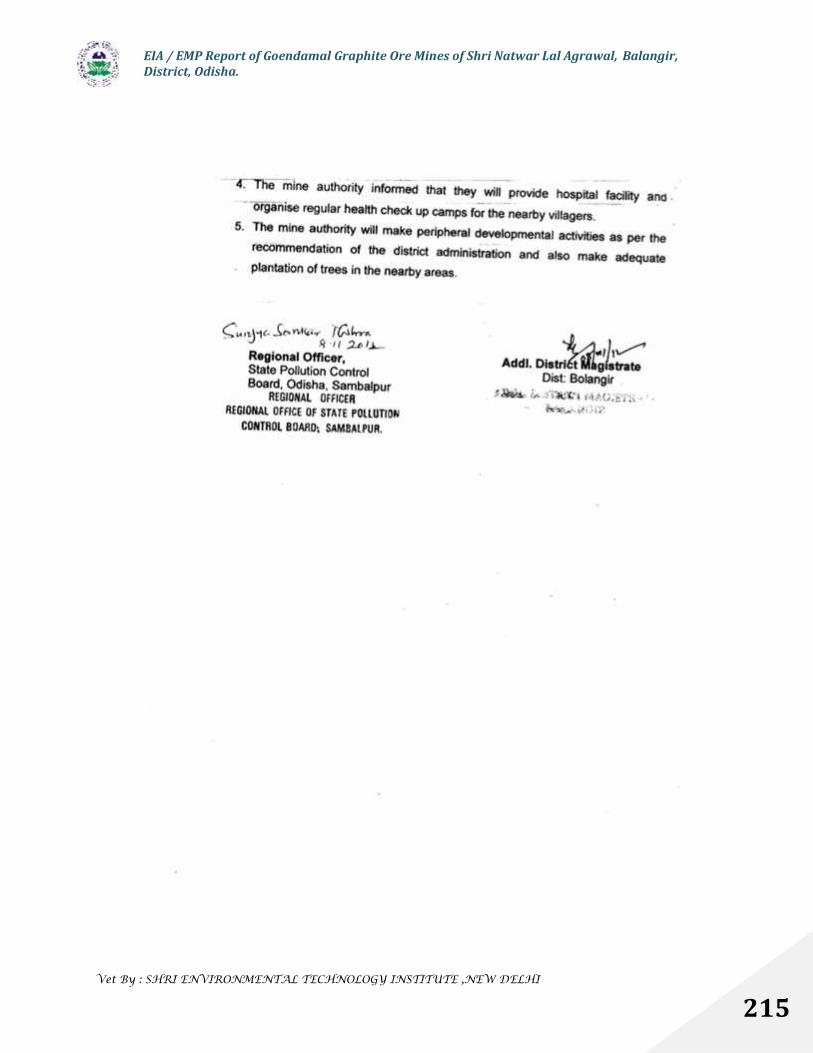
EIA / EMP Report of Goendamal Graphite Ore Mines of Shri Natwar Lal Agrawal, Balangir,District, Odisha.
Vet By : SHRI ENVIRONMENTAL TECHNOLOGY INSTITUTE ,NEW DELHI
215
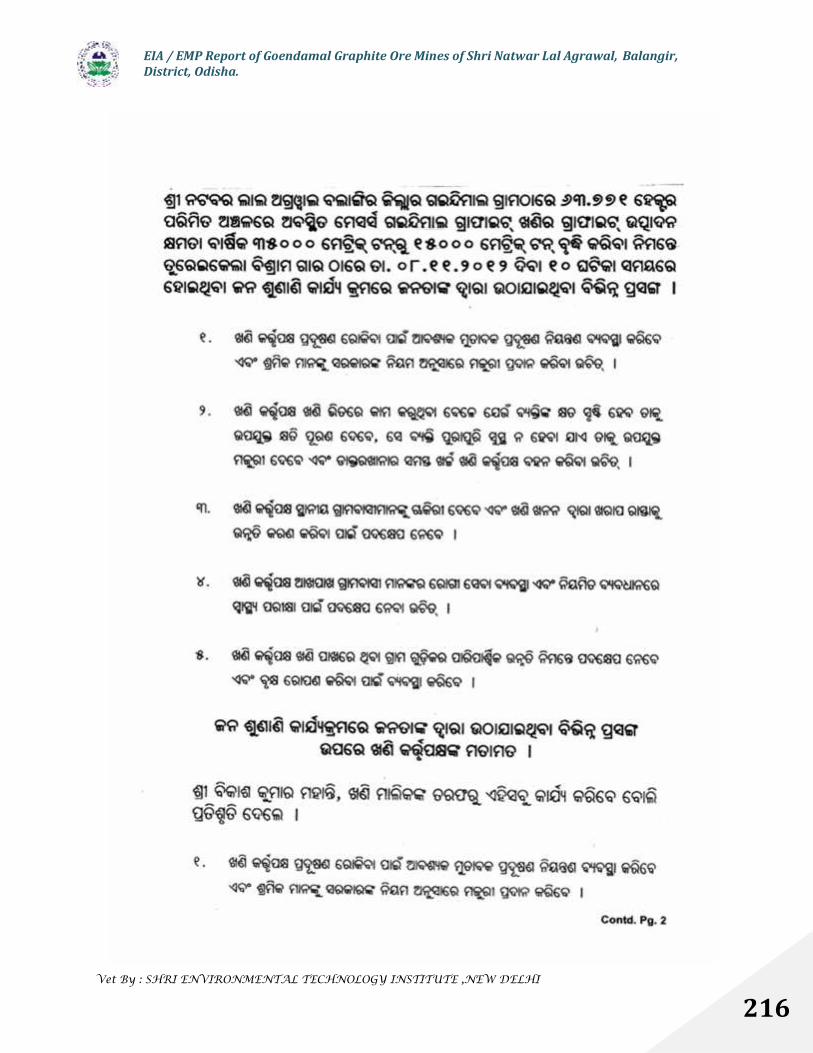
EIA / EMP Report of Goendamal Graphite Ore Mines of Shri Natwar Lal Agrawal, Balangir,District, Odisha.
Vet By : SHRI ENVIRONMENTAL TECHNOLOGY INSTITUTE ,NEW DELHI
216
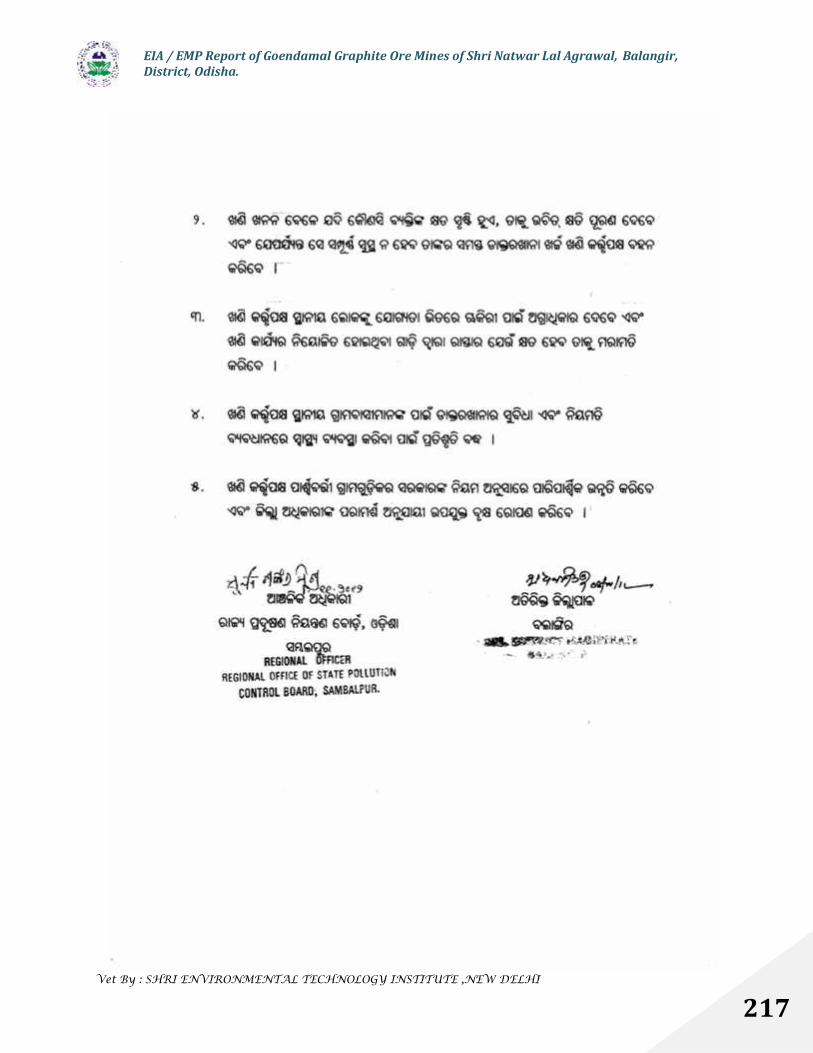
EIA / EMP Report of Goendamal Graphite Ore Mines of Shri Natwar Lal Agrawal, Balangir,District, Odisha.
Vet By : SHRI ENVIRONMENTAL TECHNOLOGY INSTITUTE ,NEW DELHI
217

EIA / EMP Report of Goendamal Graphite Ore Mines of Shri Natwar Lal Agrawal, Balangir,District, Odisha.
Vet By : SHRI ENVIRONMENTAL TECHNOLOGY INSTITUTE ,NEW DELHI
218
EIA / EMP Report of Goendamal Graphite Ore Mines of Shri Natwar Lal Agrawal, Balangir,District, Odisha.
Vet By : SHRI ENVIRONMENTAL TECHNOLOGY INSTITUTE ,NEW DELHI
219
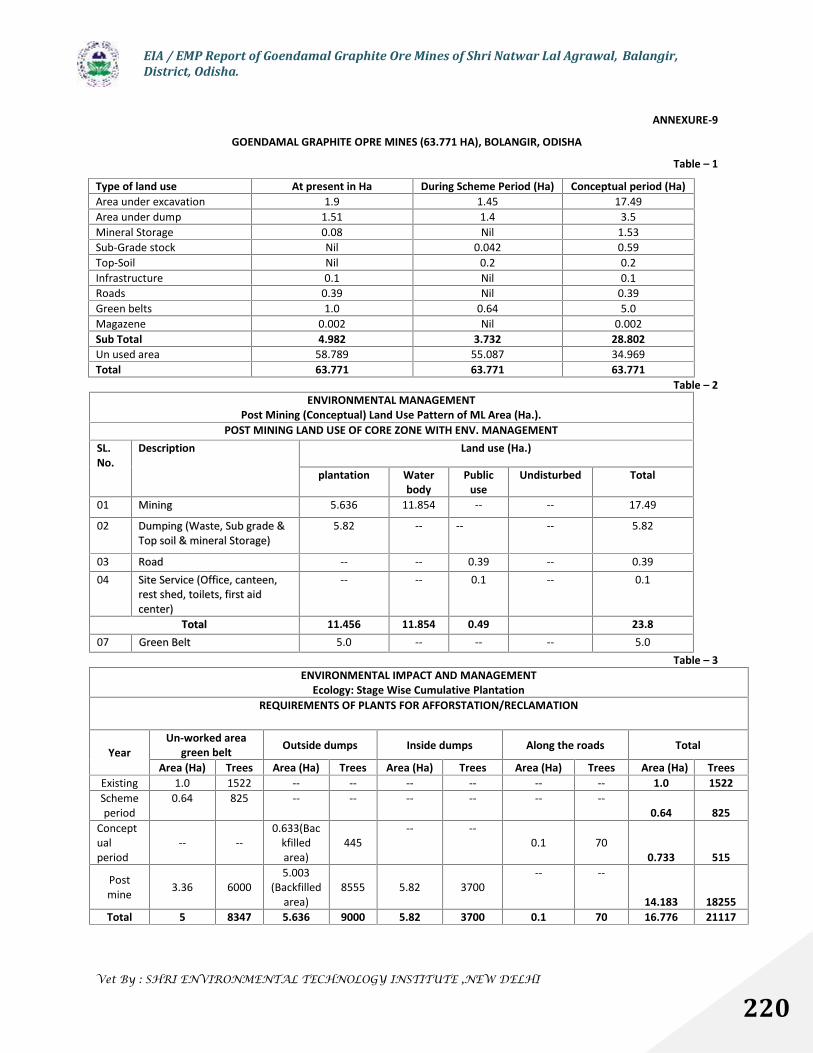
EIA / EMP Report of Goendamal Graphite Ore Mines of Shri Natwar Lal Agrawal, Balangir,District, Odisha.
Vet By : SHRI ENVIRONMENTAL TECHNOLOGY INSTITUTE ,NEW DELHI
220
ANNEXURE-9
GOENDAMAL GRAPHITE OPRE MINES (63.771 HA), BOLANGIR, ODISHA
Table – 1
Type of land use At present in Ha During Scheme Period (Ha) Conceptual period (Ha)Area under excavation 1.9 1.45 17.49Area under dump 1.51 1.4 3.5Mineral Storage 0.08 Nil 1.53Sub-Grade stock Nil 0.042 0.59Top-Soil Nil 0.2 0.2Infrastructure 0.1 Nil 0.1Roads 0.39 Nil 0.39Green belts 1.0 0.64 5.0Magazene 0.002 Nil 0.002Sub Total 4.982 3.732 28.802Un used area 58.789 55.087 34.969Total 63.771 63.771 63.771
Table – 2ENVIRONMENTAL MANAGEMENT
Post Mining (Conceptual) Land Use Pattern of ML Area (Ha.).POST MINING LAND USE OF CORE ZONE WITH ENV. MANAGEMENT
SL.No.
Description Land use (Ha.)
plantation Waterbody
Publicuse
Undisturbed Total
01 MMiinniinngg 5.636 11.854 -- -- 17.49
02 DDuummppiinngg ((WWaassttee,, SSuubb ggrraaddee &&TToopp ssooiill && mmiinneerraall SSttoorraaggee))
5.82 -- -- -- 5.82
03 RRooaadd -- -- 0.39 -- 0.3904 SSiittee SSeerrvviiccee ((OOffffiiccee,, ccaanntteeeenn,,
rreesstt sshheedd,, ttooiilleettss,, ffiirrsstt aaiiddcceenntteerr))
-- -- 0.1 -- 0.1
TToottaall 11.456 11.854 0.49 23.807 GGrreeeenn BBeelltt 5.0 -- -- -- 5.0
Table – 3ENVIRONMENTAL IMPACT AND MANAGEMENT
Ecology: Stage Wise Cumulative PlantationREQUIREMENTS OF PLANTS FOR AFFORSTATION/RECLAMATION
YearUn-worked area
green belt Outside dumps Inside dumps Along the roads Total
Area (Ha) Trees Area (Ha) Trees Area (Ha) Trees Area (Ha) Trees Area (Ha) TreesExisting 1.0 1522 -- -- -- -- -- -- 1.0 1522Schemeperiod
0.64 825 -- -- -- -- -- --0.64 825
Conceptualperiod
-- --0.633(Bac
kfilledarea)
445-- --
0.1 700.733 515
Postmine 3.36 6000
5.003(Backfilled
area)8555 5.82 3700
-- --
14.183 18255Total 5 8347 5.636 9000 5.82 3700 0.1 70 16.776 21117
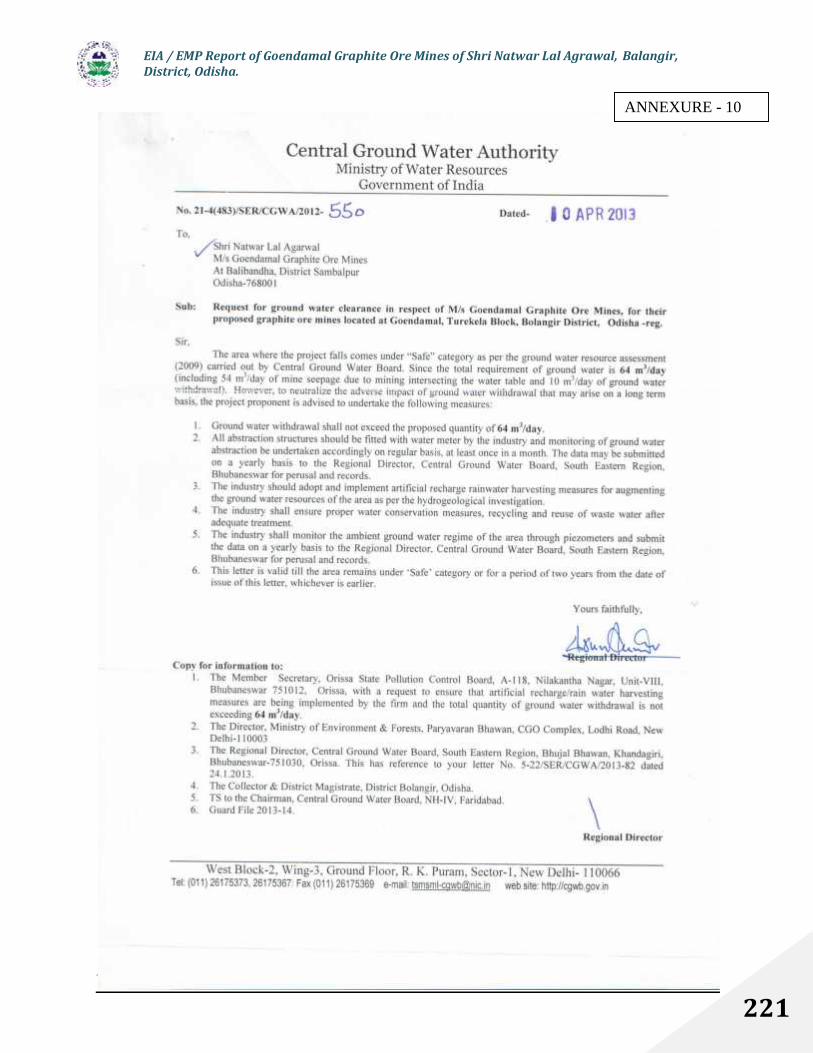
EIA / EMP Report of Goendamal Graphite Ore Mines of Shri Natwar Lal Agrawal, Balangir,District, Odisha.
Vet By : SHRI ENVIRONMENTAL TECHNOLOGY INSTITUTE ,NEW DELHI
221
ANNEXURE - 10

EIA / EMP Report of Goendamal Graphite Ore Mines of Shri Natwar Lal Agrawal, Balangir,District, Odisha.
Vet By : SHRI ENVIRONMENTAL TECHNOLOGY INSTITUTE ,NEW DELHI
222
EIA / EMP Report of Goendamal Graphite Ore Mines of Shri Natwar Lal Agrawal, Balangir, District, Odisha.
Vet By : SHRI ENVIRONMENTAL TECHNOLOGY INSTITUTE ,NEW DELHI
ii
QUESTIONNAIRE & SCHEDULE - II
EIA CONSULTANT:
SHRI ENVIRONMENTAL TECHNOLOGY INSTITUTE Registered Off. : WZ – 679 A
Nangal Raya, Padam Basti, New Delhi - 46
GOENDAMAL GRAPHITE MINES Over an area of 63.771 Ha.
Vill: Goendamal, P.S.: Turekela, P.O.: Mahulpati Dist.: Bolangir, Odisha
LESSEE: SRI NATWARLAL AGRAWAL

EIA / EMP Report of Goendamal Graphite Ore Mines of Shri Natwar Lal Agrawal, Balangir,District, Odisha.
Vet By : SHRI ENVIRONMENTAL TECHNOLOGY INSTITUTE ,NEW DELHI 1
FOR ENVIRONMENTAL APPRAISAL OF MINING PROJECTS(MINING SECTOR PROJECTS)
1. General Information
(i) Name of the project : Goendmal Graphite ore mines(ii) Name of the proponent : Shri N. L. Agrawal
Mailing Address : Belpara,: Balangir, Odisha-76
E-mail : [email protected] :0663-2520696Fax No. :0663-2404670
(b) Objective of the project : Enhancement in production of Graphite ore from3500 MTPA to 15,000 MTPA
(c) Location of mine (s)Village(s) P.S. District State
Goendamal Turekela Bolangir Odisha
(d) Does the proposal relate to
(i) New mine
(ii) Expansion
Increase in ML area
Increase in annualproduction
(iii) Renewal of ML
GOENDAMAL GRAPHITE ORE MINES
Vill: Goendamal, P.S.: Turekela, P.O.: MahulpatiDist.: Bolangir, Odisha
LESSEE: SRI NATWARLAL AGRAWAL
PLAN
Note 1 : All information to be given in the form of Annex/s should be properlynumbered and form part of reply to this proforma.
3.5 Note 2 : Please enter √ in appropriate box where answer is Yes / NoNote 3 : No abbreviation to be used - Not available or Not applicable should be
clearly mentioned.
Note 4 :Core zone is the mining lease area.Buffer zone in case of ML area up to 25 ha.is to be considered as 5 km allaround the periphery of the core zone and for ML area above 25 ha. an area 10km all around the periphery of the core zone.
Note 5 : Adopt Scoping process in carrying out EIA study
Note 6 : Please indicate source of data.
Yes No
Yes No
Yes No
Yes No
Yes No
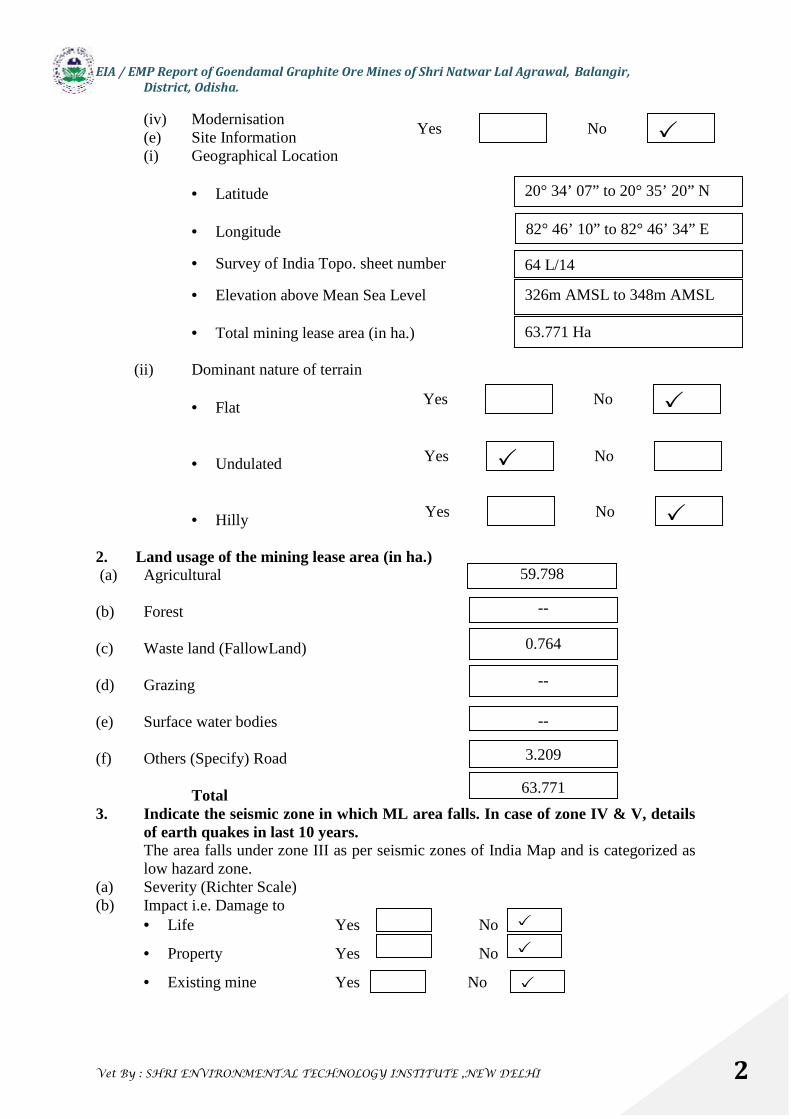
EIA / EMP Report of Goendamal Graphite Ore Mines of Shri Natwar Lal Agrawal, Balangir,District, Odisha.
Vet By : SHRI ENVIRONMENTAL TECHNOLOGY INSTITUTE ,NEW DELHI 2
(iv) Modernisation(e) Site Information(i) Geographical Location
Latitude
Longitude
Survey of India Topo. sheet number
Elevation above Mean Sea Level
Total mining lease area (in ha.)
(ii) Dominant nature of terrain
Flat
Undulated
Hilly
2. Land usage of the mining lease area (in ha.)(a) Agricultural
(b) Forest
(c) Waste land (FallowLand)
(d) Grazing
(e) Surface water bodies
(f) Others (Specify) Road
Total3. Indicate the seismic zone in which ML area falls. In case of zone IV & V, details
of earth quakes in last 10 years.The area falls under zone III as per seismic zones of India Map and is categorized aslow hazard zone.
(a) Severity (Richter Scale)(b) Impact i.e. Damage to
Life Yes No
Property Yes No
Existing mine Yes No
20° 34’ 07” to 20° 35’ 20” N
--
0.764
--
--
3.209
63.771
82° 46’ 10” to 82° 46’ 34” E
64 L/14
326m AMSL to 348m AMSL
63.771 Ha
Yes No
Yes No
Yes No
Yes No
59.798

EIA / EMP Report of Goendamal Graphite Ore Mines of Shri Natwar Lal Agrawal, Balangir, District, Odisha.
Vet By : SHRI ENVIRONMENTAL TECHNOLOGY INSTITUTE ,NEW DELHI
4. Break-up of mining lease area (in ha.) as per approved conceptual plan:Purpose Mining Lease Area Total Area acquired Area to be acquired
Government Private Government
Private Government Private
Forest(DLC)
Others Agri. Others
Forest
Others
Agri. Others Forest
Others
Agri. Others
1. Area to be excavated 17.49 17.492. Storage for top soil 0.2 0.23. Overburden / Dumps 3.5 3.54. Mineral storage/Sub grade 2.12 2.125. Infrastructure (Workshop, Administrative
Building, & Magazine)0.1 0.1
6.Roads 0.39 0.397.Railways8. Green Belt 5.0 5.09.Tailings pond10.Effluent treatment plant11.Coal handling plant / Mineral separation
plant12.Township area13.Other (Construction of building powerstation, workshop ore based industry, orebeneficiation plant, magazine storage)
0.002 0.002
14. Right of way of power line
15. Untouched area 34.969 34.969
TOTAL 63.771 63.771
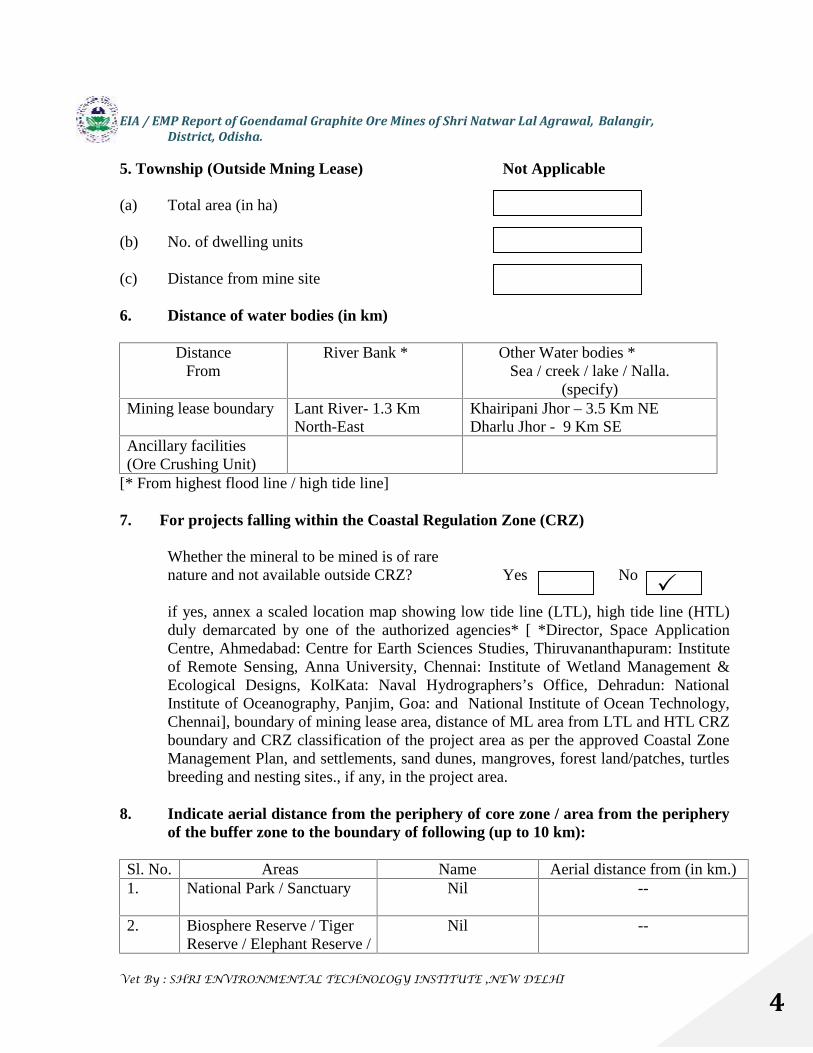
EIA / EMP Report of Goendamal Graphite Ore Mines of Shri Natwar Lal Agrawal, Balangir,District, Odisha.
Vet By : SHRI ENVIRONMENTAL TECHNOLOGY INSTITUTE ,NEW DELHI
4
5. Township (Outside Mning Lease) Not Applicable
(a) Total area (in ha)
(b) No. of dwelling units
(c) Distance from mine site
6. Distance of water bodies (in km)
DistanceFrom
River Bank * Other Water bodies *Sea / creek / lake / Nalla.
(specify)Mining lease boundary Lant River- 1.3 Km
North-EastKhairipani Jhor – 3.5 Km NEDharlu Jhor - 9 Km SE
Ancillary facilities(Ore Crushing Unit)
[* From highest flood line / high tide line]
7. For projects falling within the Coastal Regulation Zone (CRZ)
Whether the mineral to be mined is of rarenature and not available outside CRZ? Yes No
if yes, annex a scaled location map showing low tide line (LTL), high tide line (HTL)duly demarcated by one of the authorized agencies* [ *Director, Space ApplicationCentre, Ahmedabad: Centre for Earth Sciences Studies, Thiruvananthapuram: Instituteof Remote Sensing, Anna University, Chennai: Institute of Wetland Management &Ecological Designs, KolKata: Naval Hydrographers’s Office, Dehradun: NationalInstitute of Oceanography, Panjim, Goa: and National Institute of Ocean Technology,Chennai], boundary of mining lease area, distance of ML area from LTL and HTL CRZboundary and CRZ classification of the project area as per the approved Coastal ZoneManagement Plan, and settlements, sand dunes, mangroves, forest land/patches, turtlesbreeding and nesting sites., if any, in the project area.
8. Indicate aerial distance from the periphery of core zone / area from the peripheryof the buffer zone to the boundary of following (up to 10 km):
Sl. No. Areas Name Aerial distance from (in km.)1. National Park / Sanctuary Nil --
2. Biosphere Reserve / TigerReserve / Elephant Reserve /
Nil --
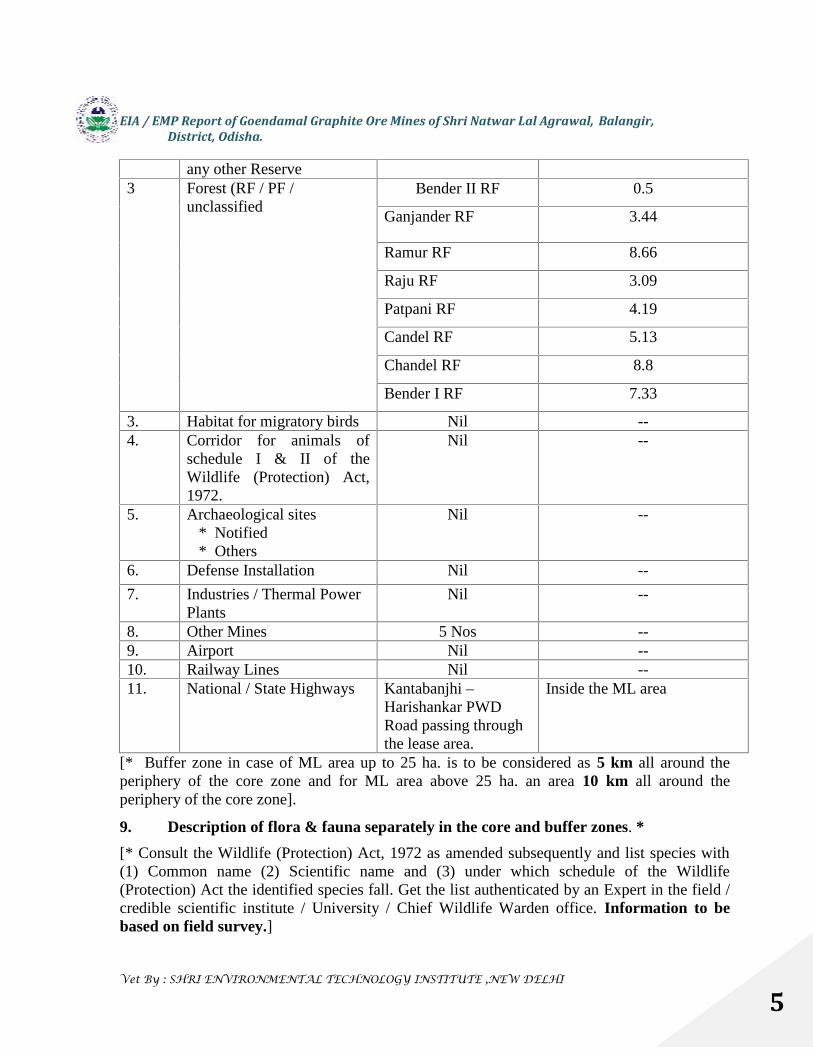
EIA / EMP Report of Goendamal Graphite Ore Mines of Shri Natwar Lal Agrawal, Balangir,District, Odisha.
Vet By : SHRI ENVIRONMENTAL TECHNOLOGY INSTITUTE ,NEW DELHI
5
any other Reserve3 Forest (RF / PF /
unclassifiedBender II RF 0.5
Ganjander RF 3.44
Ramur RF 8.66
Raju RF 3.09
Patpani RF 4.19
Candel RF 5.13
Chandel RF 8.8
Bender I RF 7.33
3. Habitat for migratory birds Nil --4. Corridor for animals of
schedule I & II of theWildlife (Protection) Act,1972.
Nil --
5. Archaeological sites* Notified* Others
Nil --
6. Defense Installation Nil --
7. Industries / Thermal PowerPlants
Nil --
8. Other Mines 5 Nos --9. Airport Nil --10. Railway Lines Nil --11. National / State Highways Kantabanjhi –
Harishankar PWDRoad passing throughthe lease area.
Inside the ML area
[* Buffer zone in case of ML area up to 25 ha. is to be considered as 5 km all around theperiphery of the core zone and for ML area above 25 ha. an area 10 km all around theperiphery of the core zone].
9. Description of flora & fauna separately in the core and buffer zones. *
[* Consult the Wildlife (Protection) Act, 1972 as amended subsequently and list species with(1) Common name (2) Scientific name and (3) under which schedule of the Wildlife(Protection) Act the identified species fall. Get the list authenticated by an Expert in the field /credible scientific institute / University / Chief Wildlife Warden office. Information to bebased on field survey.]
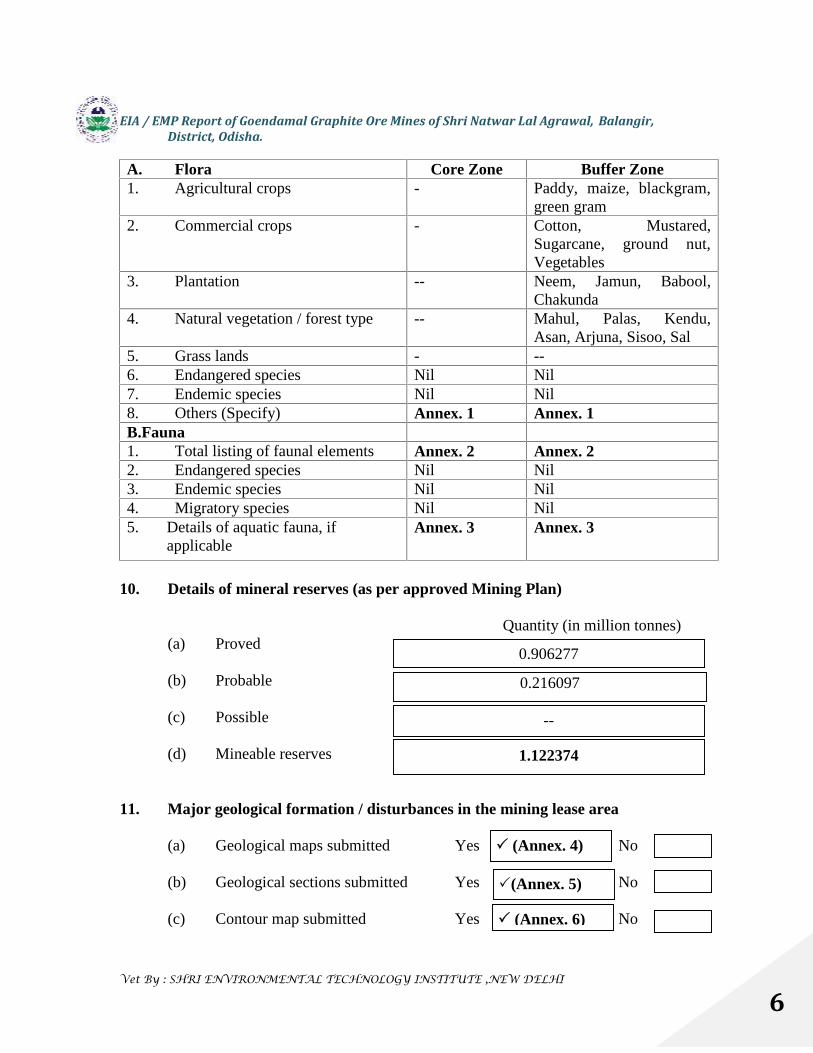
EIA / EMP Report of Goendamal Graphite Ore Mines of Shri Natwar Lal Agrawal, Balangir,District, Odisha.
Vet By : SHRI ENVIRONMENTAL TECHNOLOGY INSTITUTE ,NEW DELHI
6
A. Flora Core Zone Buffer Zone1. Agricultural crops - Paddy, maize, blackgram,
green gram2. Commercial crops - Cotton, Mustared,
Sugarcane, ground nut,Vegetables
3. Plantation -- Neem, Jamun, Babool,Chakunda
4. Natural vegetation / forest type -- Mahul, Palas, Kendu,Asan, Arjuna, Sisoo, Sal
5. Grass lands - --6. Endangered species Nil Nil7. Endemic species Nil Nil8. Others (Specify) Annex. 1 Annex. 1B.Fauna1. Total listing of faunal elements Annex. 2 Annex. 22. Endangered species Nil Nil3. Endemic species Nil Nil4. Migratory species Nil Nil5. Details of aquatic fauna, if
applicableAnnex. 3 Annex. 3
10. Details of mineral reserves (as per approved Mining Plan)
Quantity (in million tonnes)(a) Proved
(b) Probable
(c) Possible
(d) Mineable reserves
11. Major geological formation / disturbances in the mining lease area
(a) Geological maps submitted Yes No
(b) Geological sections submitted Yes No
(c) Contour map submitted Yes No
0.906277
(Annex. 4)
0.216097
--
1.122374
(Annex. 5)
(Annex. 6)
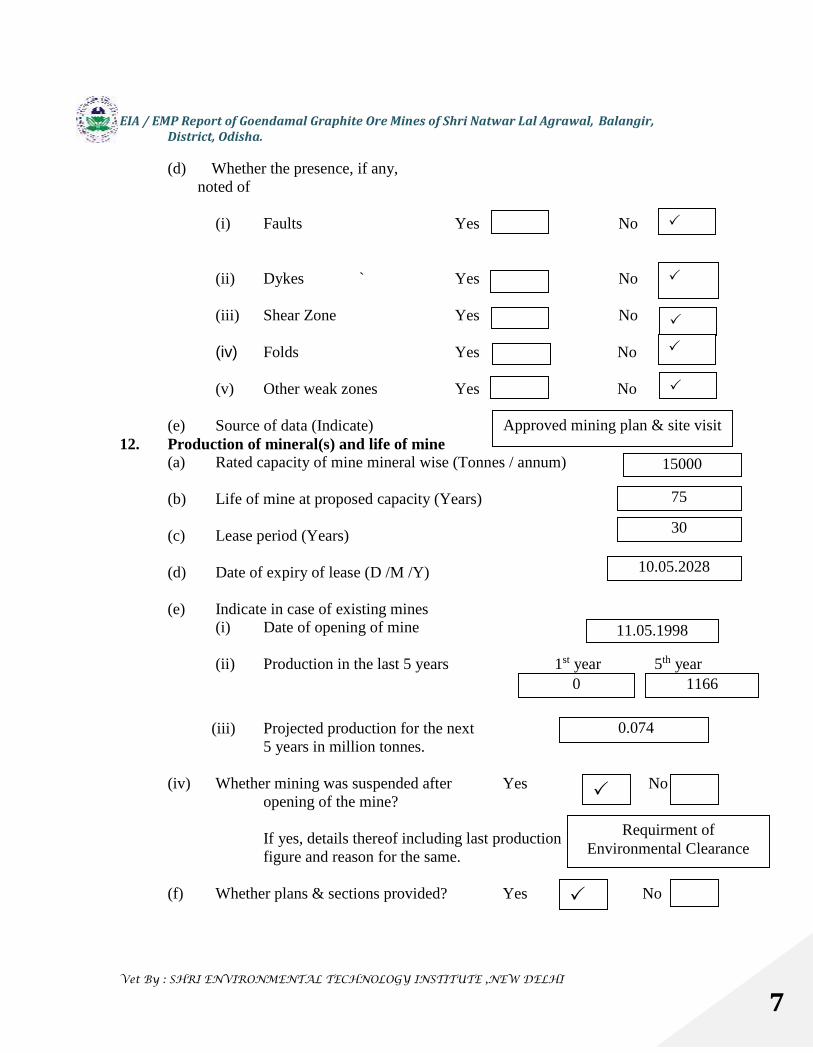
EIA / EMP Report of Goendamal Graphite Ore Mines of Shri Natwar Lal Agrawal, Balangir,District, Odisha.
Vet By : SHRI ENVIRONMENTAL TECHNOLOGY INSTITUTE ,NEW DELHI
7
(d) Whether the presence, if any,noted of
(i) Faults Yes No
(ii) Dykes ` Yes No
(iii) Shear Zone Yes No
(iv) Folds Yes No
(v) Other weak zones Yes No
(e) Source of data (Indicate)12. Production of mineral(s) and life of mine
(a) Rated capacity of mine mineral wise (Tonnes / annum)
(b) Life of mine at proposed capacity (Years)
(c) Lease period (Years)
(d) Date of expiry of lease (D /M /Y)
(e) Indicate in case of existing mines(i) Date of opening of mine
(ii) Production in the last 5 years 1st year 5th year
(iii) Projected production for the next5 years in million tonnes.
(iv) Whether mining was suspended after Yes No Noopening of the mine?
If yes, details thereof including last productionfigure and reason for the same.
(f) Whether plans & sections provided? Yes No
15000
75
10.05.2028
30
11.05.1998
0
Requirment ofEnvironmental Clearance
1166
0.074
Approved mining plan & site visit

EIA / EMP Report of Goendamal Graphite Ore Mines of Shri Natwar Lal Agrawal, Balangir,District, Odisha.
Vet By : SHRI ENVIRONMENTAL TECHNOLOGY INSTITUTE ,NEW DELHI
8
13. Type and method of mining operations
TYPE METHODOpencast Manual
Underground Semi-mechanized
Both Mechanized
14. Details of ancillary operations for mineral processing
(a) Existing
(a) Additional
15. Mine details
(a) Opencast mine
(i) Stripping ratio (mineral in tonnes to over burden in m3)
(ii) Ultimate working depth (in m bgl)
(iii) Indicate present working depth in case of
existing mine (in m bgl)
(iv) Thickness of top soil (in m.)
Minimum Maximum Average
(v) Thickness of overburden (in m.)
Minimum Maximum Average
(vi) Mining Plan
305 mRL
0.5
1.5
1.0
330 mRL
--
--
--
Not Applicable
Not Applicable
1:2.18
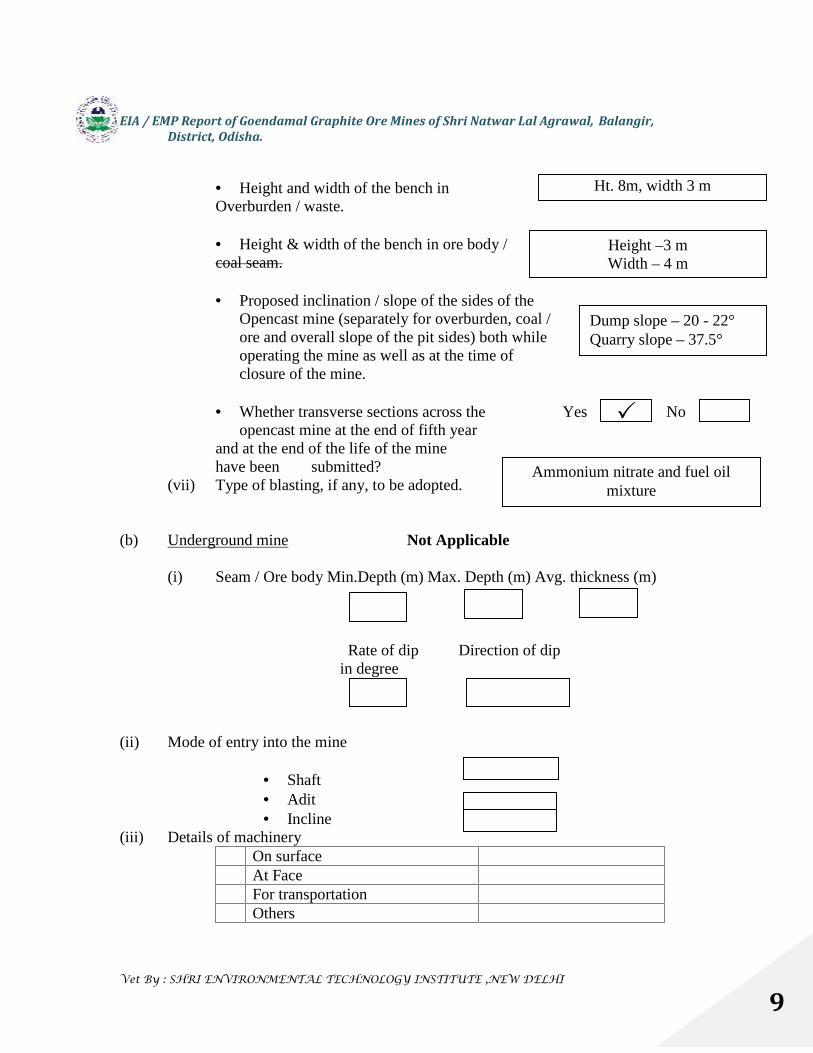
EIA / EMP Report of Goendamal Graphite Ore Mines of Shri Natwar Lal Agrawal, Balangir,District, Odisha.
Vet By : SHRI ENVIRONMENTAL TECHNOLOGY INSTITUTE ,NEW DELHI
9
Height and width of the bench inOverburden / waste.
Height & width of the bench in ore body /coal seam.
Proposed inclination / slope of the sides of theOpencast mine (separately for overburden, coal /ore and overall slope of the pit sides) both whileoperating the mine as well as at the time ofclosure of the mine.
Whether transverse sections across the Yes Noopencast mine at the end of fifth year
and at the end of the life of the minehave been submitted?
(vii) Type of blasting, if any, to be adopted.
(b) Underground mine Not Applicable
(i) Seam / Ore body Min.Depth (m) Max. Depth (m) Avg. thickness (m)
Rate of dip Direction of dipin degree
(ii) Mode of entry into the mine
Shaft Adit Incline
(iii) Details of machineryOn surfaceAt FaceFor transportationOthers
Ht. 8m, width 3 m
Height –3 mWidth – 4 m
Dump slope – 20 - 22°Quarry slope – 37.5°
Ammonium nitrate and fuel oilmixture
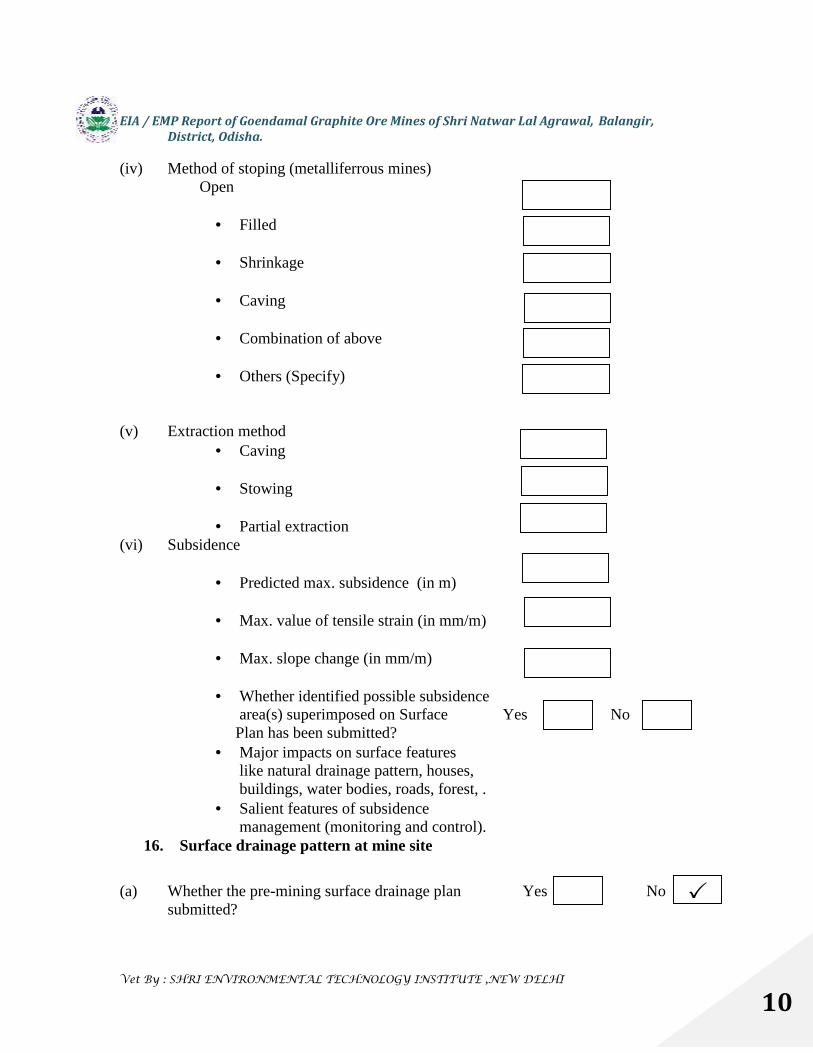
EIA / EMP Report of Goendamal Graphite Ore Mines of Shri Natwar Lal Agrawal, Balangir,District, Odisha.
Vet By : SHRI ENVIRONMENTAL TECHNOLOGY INSTITUTE ,NEW DELHI
10
(iv) Method of stoping (metalliferrous mines)Open
Filled
Shrinkage
Caving
Combination of above
Others (Specify)
(v) Extraction method Caving
Stowing
Partial extraction(vi) Subsidence
Predicted max. subsidence (in m)
Max. value of tensile strain (in mm/m)
Max. slope change (in mm/m)
Whether identified possible subsidencearea(s) superimposed on Surface Yes No
Plan has been submitted? Major impacts on surface features
like natural drainage pattern, houses,buildings, water bodies, roads, forest, .
Salient features of subsidencemanagement (monitoring and control).
16. Surface drainage pattern at mine site
(a) Whether the pre-mining surface drainage plan Yes Nosubmitted?
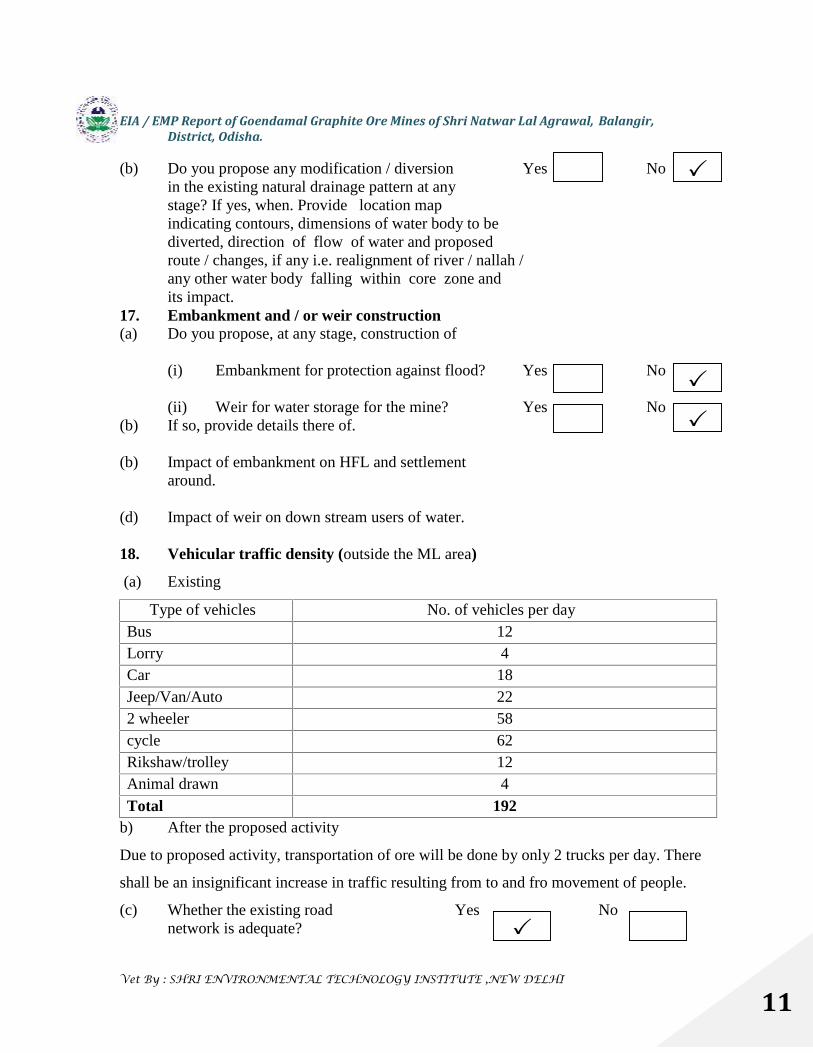
EIA / EMP Report of Goendamal Graphite Ore Mines of Shri Natwar Lal Agrawal, Balangir,District, Odisha.
Vet By : SHRI ENVIRONMENTAL TECHNOLOGY INSTITUTE ,NEW DELHI
11
(b) Do you propose any modification / diversion Yes Noin the existing natural drainage pattern at anystage? If yes, when. Provide location mapindicating contours, dimensions of water body to bediverted, direction of flow of water and proposedroute / changes, if any i.e. realignment of river / nallah /any other water body falling within core zone andits impact.
17. Embankment and / or weir construction(a) Do you propose, at any stage, construction of
(i) Embankment for protection against flood? Yes No
(ii) Weir for water storage for the mine? Yes No(b) If so, provide details there of.
(b) Impact of embankment on HFL and settlementaround.
(d) Impact of weir on down stream users of water.
18. Vehicular traffic density (outside the ML area)
(a) Existing
Type of vehicles No. of vehicles per dayBus 12Lorry 4Car 18Jeep/Van/Auto 222 wheeler 58cycle 62Rikshaw/trolley 12Animal drawn 4Total 192
b) After the proposed activity
Due to proposed activity, transportation of ore will be done by only 2 trucks per day. There
shall be an insignificant increase in traffic resulting from to and fro movement of people.
(c) Whether the existing road Yes Nonetwork is adequate?

EIA / EMP Report of Goendamal Graphite Ore Mines of Shri Natwar Lal Agrawal, Balangir,District, Odisha.
Vet By : SHRI ENVIRONMENTAL TECHNOLOGY INSTITUTE ,NEW DELHI
12
If no, provide details of alternative proposal?19. Loading, transportation and unloading of mineral and waste rocks on surface:
(a) Manual Yes No
(b) Tubs, mine cars, etc. Yes No
(c) Scraper, shovels, dumpers / trucks. Yes No
(d) Conveyors (belt, chain, etc.) Yes No
(e) Others (specify).
20. Mineral(s) transportation outside the ML areaQty. (in TPD) Percentage (%) Length (in km)
(a) Road
(b) Rail
(c) Conveyors
(d) Rope way
(e) Water ways
(f) Pipeline
(g) Others (Specify)
Total
21. Baseline Meteorological and Air Quality data
(a) Micro-meteorological data[Continuous monitoring through autographic instrument for one full season other thanmonsoon]
(i) Wind rose pattern for one full season (16 points of compass i.e. N, NNE, NE, ---) basedon 24-hourly data. For coastal area also furnish day-time and night time data.
Day time Night time 24 – hours period
68
Nil
Nil
Nil
Nil
Nil
Nil
100%
Nil
Nil
Nil
Nil
Nil
Nil
Nil
Nil
Nil
35 Km
Nil
Annex. 7 – Composite wind rose map
68
Nil
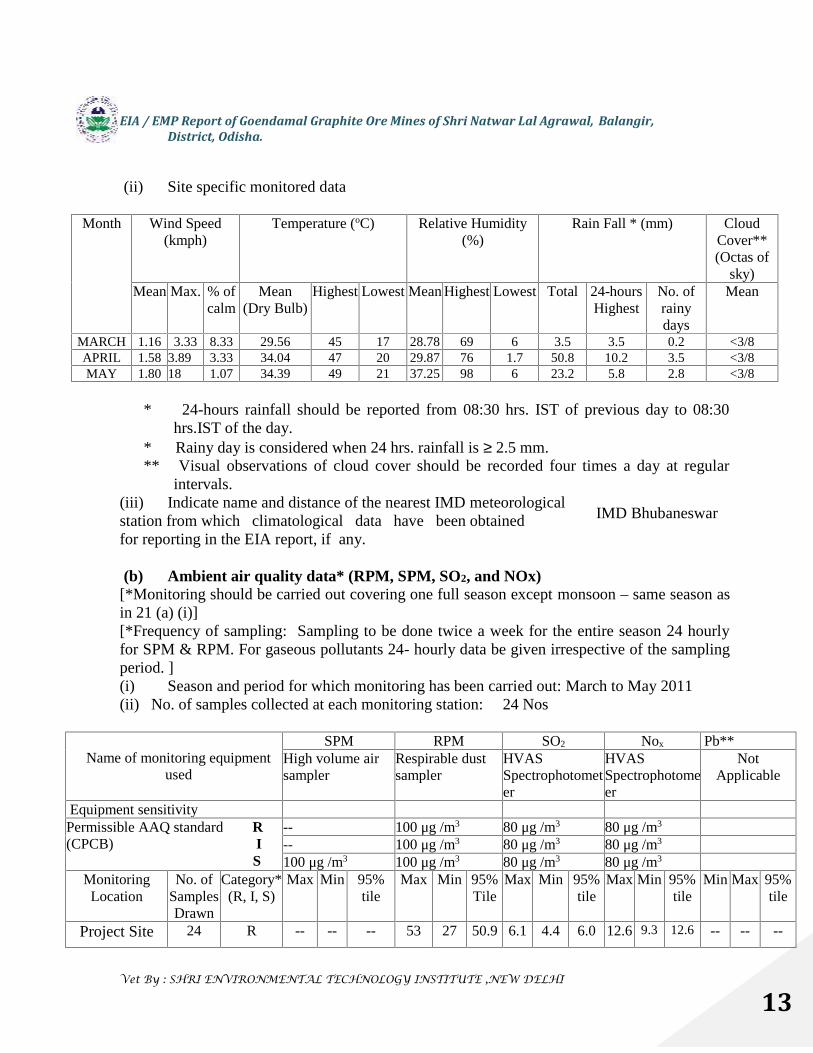
EIA / EMP Report of Goendamal Graphite Ore Mines of Shri Natwar Lal Agrawal, Balangir,District, Odisha.
Vet By : SHRI ENVIRONMENTAL TECHNOLOGY INSTITUTE ,NEW DELHI
13
(ii) Site specific monitored data
Month Wind Speed(kmph)
Temperature (oC) Relative Humidity(%)
Rain Fall * (mm) CloudCover**(Octas of
sky)Mean Max. % of
calmMean
(Dry Bulb)Highest Lowest Mean Highest Lowest Total 24-hours
HighestNo. ofrainydays
Mean
MARCH 1.16 3.33 8.33 29.56 45 17 28.78 69 6 3.5 3.5 0.2 <3/8APRIL 1.58 3.89 3.33 34.04 47 20 29.87 76 1.7 50.8 10.2 3.5 <3/8MAY 1.80 18 1.07 34.39 49 21 37.25 98 6 23.2 5.8 2.8 <3/8
* 24-hours rainfall should be reported from 08:30 hrs. IST of previous day to 08:30hrs.IST of the day.
* Rainy day is considered when 24 hrs. rainfall is 2.5 mm.** Visual observations of cloud cover should be recorded four times a day at regular
intervals.(iii) Indicate name and distance of the nearest IMD meteorologicalstation from which climatological data have been obtainedfor reporting in the EIA report, if any.
(b) Ambient air quality data* (RPM, SPM, SO2, and NOx)[*Monitoring should be carried out covering one full season except monsoon – same season asin 21 (a) (i)][*Frequency of sampling: Sampling to be done twice a week for the entire season 24 hourlyfor SPM & RPM. For gaseous pollutants 24- hourly data be given irrespective of the samplingperiod. ](i) Season and period for which monitoring has been carried out: March to May 2011(ii) No. of samples collected at each monitoring station: 24 Nos
Name of monitoring equipmentused
SPM RPM SO2 Nox Pb**High volume airsampler
Respirable dustsampler
HVASSpectrophotometer
HVASSpectrophotometer
NotApplicable
Equipment sensitivityPermissible AAQ standard R(CPCB) I
S
-- 100 μg /m3 80 μg /m3 80 μg /m3
-- 100 μg /m3 80 μg /m3 80 μg /m3
100 μg /m3 100 μg /m3 80 μg /m3 80 μg /m3
MonitoringLocation
No. ofSamplesDrawn
Category*(R, I, S)
Max Min 95%tile
Max Min 95%Tile
Max Min 95%tile
Max Min 95%tile
Min Max 95%tile
Project Site 24 R -- -- -- 53 27 50.9 6.1 4.4 6.0 12.6 9.3 12.6 -- -- --
IMD Bhubaneswar
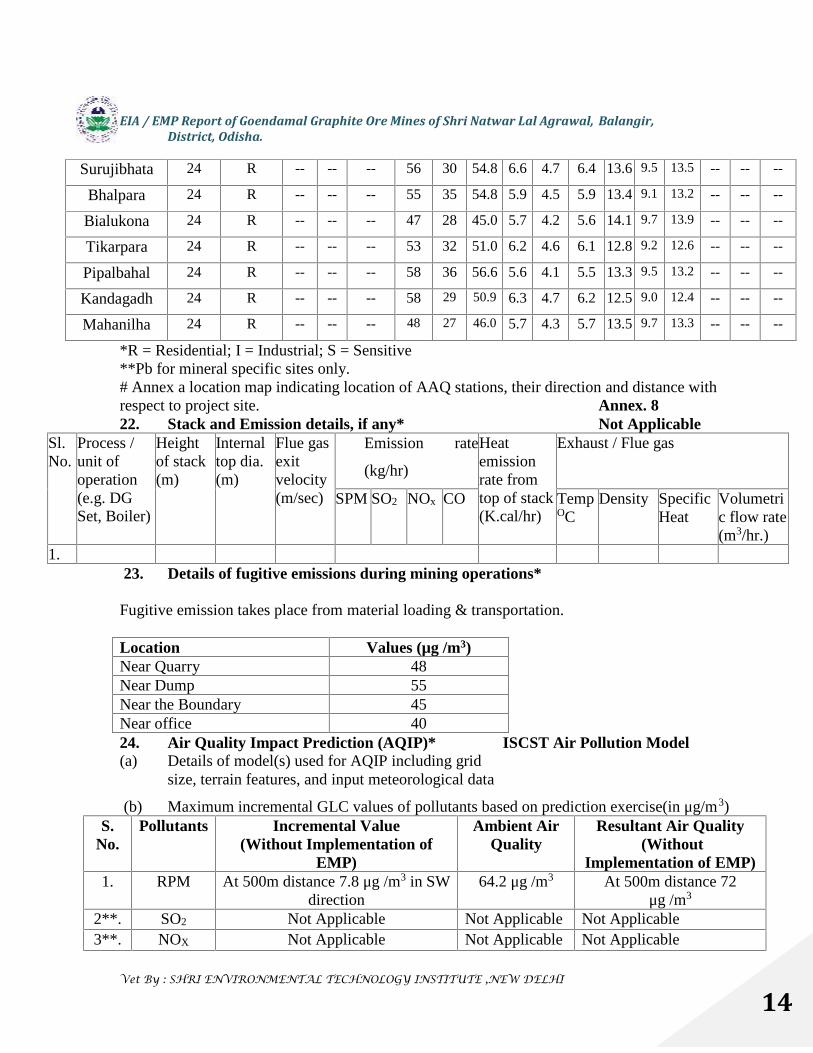
EIA / EMP Report of Goendamal Graphite Ore Mines of Shri Natwar Lal Agrawal, Balangir,District, Odisha.
Vet By : SHRI ENVIRONMENTAL TECHNOLOGY INSTITUTE ,NEW DELHI
14
Surujibhata 24 R -- -- -- 56 30 54.8 6.6 4.7 6.4 13.6 9.5 13.5 -- -- --
Bhalpara 24 R -- -- -- 55 35 54.8 5.9 4.5 5.9 13.4 9.1 13.2 -- -- --
Bialukona 24 R -- -- -- 47 28 45.0 5.7 4.2 5.6 14.1 9.7 13.9 -- -- --
Tikarpara 24 R -- -- -- 53 32 51.0 6.2 4.6 6.1 12.8 9.2 12.6 -- -- --
Pipalbahal 24 R -- -- -- 58 36 56.6 5.6 4.1 5.5 13.3 9.5 13.2 -- -- --
Kandagadh 24 R -- -- -- 58 29 50.9 6.3 4.7 6.2 12.5 9.0 12.4 -- -- --
Mahanilha 24 R -- -- -- 48 27 46.0 5.7 4.3 5.7 13.5 9.7 13.3 -- -- --
*R = Residential; I = Industrial; S = Sensitive**Pb for mineral specific sites only.# Annex a location map indicating location of AAQ stations, their direction and distance withrespect to project site. Annex. 822. Stack and Emission details, if any* Not Applicable
Sl.No.
Process /unit ofoperation(e.g. DGSet, Boiler)
Heightof stack(m)
Internaltop dia.(m)
Flue gasexitvelocity(m/sec)
Emission rate
(kg/hr)
Heatemissionrate fromtop of stack(K.cal/hr)
Exhaust / Flue gas
SPM SO2 NOx CO TempOC
Density SpecificHeat
Volumetric flow rate(m3/hr.)
1.23. Details of fugitive emissions during mining operations*
Fugitive emission takes place from material loading & transportation.
Location Values (μg /m3)Near Quarry 48Near Dump 55Near the Boundary 45Near office 4024. Air Quality Impact Prediction (AQIP)* ISCST Air Pollution Model(a) Details of model(s) used for AQIP including grid
size, terrain features, and input meteorological data
(b) Maximum incremental GLC values of pollutants based on prediction exercise(in μg/m3)S.
No.Pollutants Incremental Value
(Without Implementation ofEMP)
Ambient AirQuality
Resultant Air Quality(Without
Implementation of EMP)1. RPM At 500m distance 7.8 μg /m3 in SW
direction64.2 μg /m3 At 500m distance 72
μg /m3
2**. SO2 Not Applicable Not Applicable Not Applicable3**. NOX Not Applicable Not Applicable Not Applicable
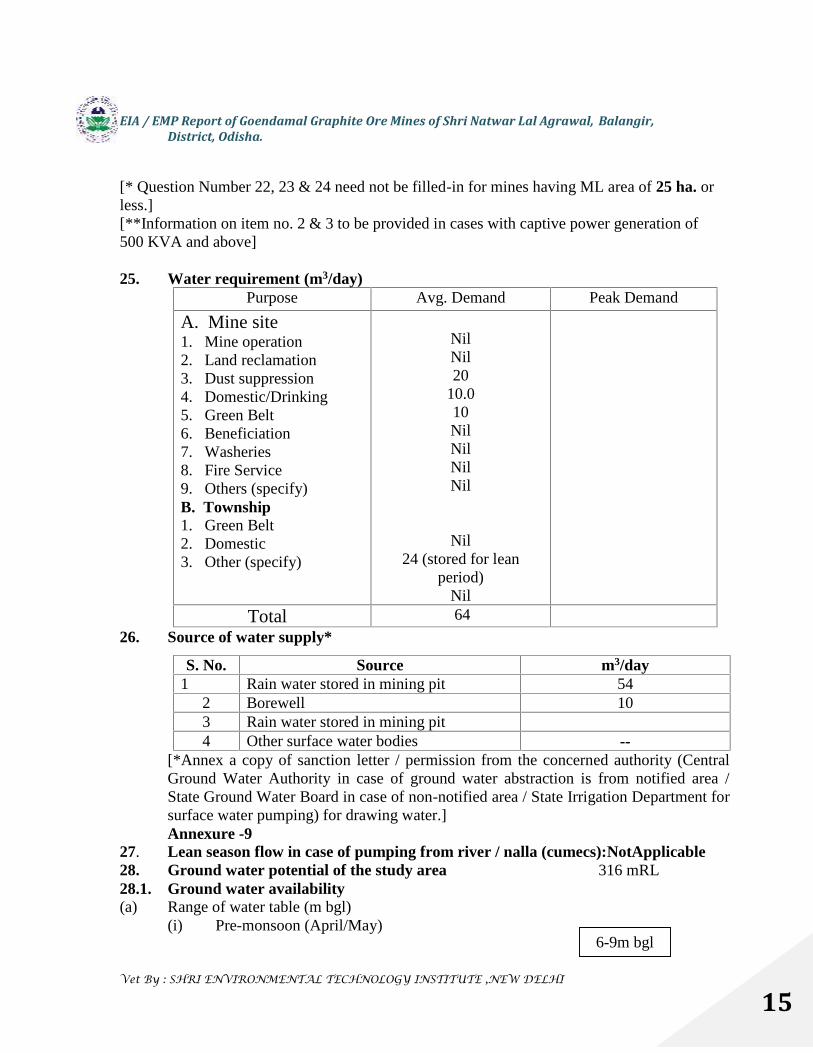
EIA / EMP Report of Goendamal Graphite Ore Mines of Shri Natwar Lal Agrawal, Balangir,District, Odisha.
Vet By : SHRI ENVIRONMENTAL TECHNOLOGY INSTITUTE ,NEW DELHI
15
[* Question Number 22, 23 & 24 need not be filled-in for mines having ML area of 25 ha. orless.][**Information on item no. 2 & 3 to be provided in cases with captive power generation of500 KVA and above]
25. Water requirement (m3/day)Purpose Avg. Demand Peak Demand
A. Mine site1. Mine operation2. Land reclamation3. Dust suppression4. Domestic/Drinking5. Green Belt6. Beneficiation7. Washeries8. Fire Service9. Others (specify)B. Township1. Green Belt2. Domestic3. Other (specify)
NilNil20
10.010NilNilNilNil
Nil24 (stored for lean
period)Nil
Total 64
26. Source of water supply*
S. No. Source m3/day1 Rain water stored in mining pit 54
2 Borewell 103 Rain water stored in mining pit4 Other surface water bodies --
[*Annex a copy of sanction letter / permission from the concerned authority (CentralGround Water Authority in case of ground water abstraction is from notified area /State Ground Water Board in case of non-notified area / State Irrigation Department forsurface water pumping) for drawing water.]Annexure -9
27. Lean season flow in case of pumping from river / nalla (cumecs):NotApplicable28. Ground water potential of the study area 316 mRL28.1. Ground water availability(a) Range of water table (m bgl)
(i) Pre-monsoon (April/May)6-9m bgl
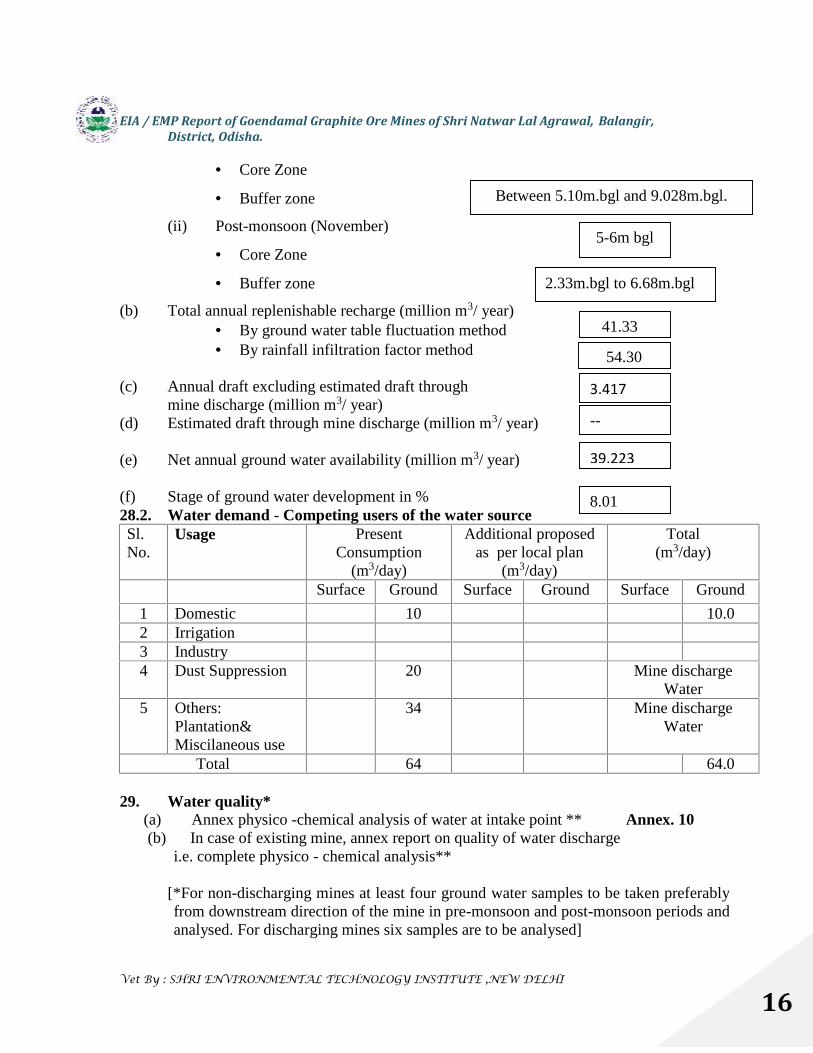
EIA / EMP Report of Goendamal Graphite Ore Mines of Shri Natwar Lal Agrawal, Balangir,District, Odisha.
Vet By : SHRI ENVIRONMENTAL TECHNOLOGY INSTITUTE ,NEW DELHI
16
Core Zone
Buffer zone
(ii) Post-monsoon (November)
Core Zone
Buffer zone
(b) Total annual replenishable recharge (million m3/ year) By ground water table fluctuation method By rainfall infiltration factor method
(c) Annual draft excluding estimated draft throughmine discharge (million m3/ year)
(d) Estimated draft through mine discharge (million m3/ year)
(e) Net annual ground water availability (million m3/ year)
(f) Stage of ground water development in %28.2. Water demand - Competing users of the water sourceSl.No.
Usage PresentConsumption
(m3/day)
Additional proposedas per local plan
(m3/day)
Total(m3/day)
Surface Ground Surface Ground Surface Ground
1 Domestic 10 10.02 Irrigation3 Industry4 Dust Suppression 20 Mine discharge
Water5 Others:
Plantation&Miscilaneous use
34 Mine dischargeWater
Total 64 64.0
29. Water quality*(a) Annex physico -chemical analysis of water at intake point ** Annex. 10(b) In case of existing mine, annex report on quality of water discharge
i.e. complete physico - chemical analysis**
[*For non-discharging mines at least four ground water samples to be taken preferablyfrom downstream direction of the mine in pre-monsoon and post-monsoon periods andanalysed. For discharging mines six samples are to be analysed]
3.417MCM
Between 5.10m.bgl and 9.028m.bgl.
5-6m bgl
2.33m.bgl to 6.68m.bgl
41.33
54.30
39.223MCM8.01
--
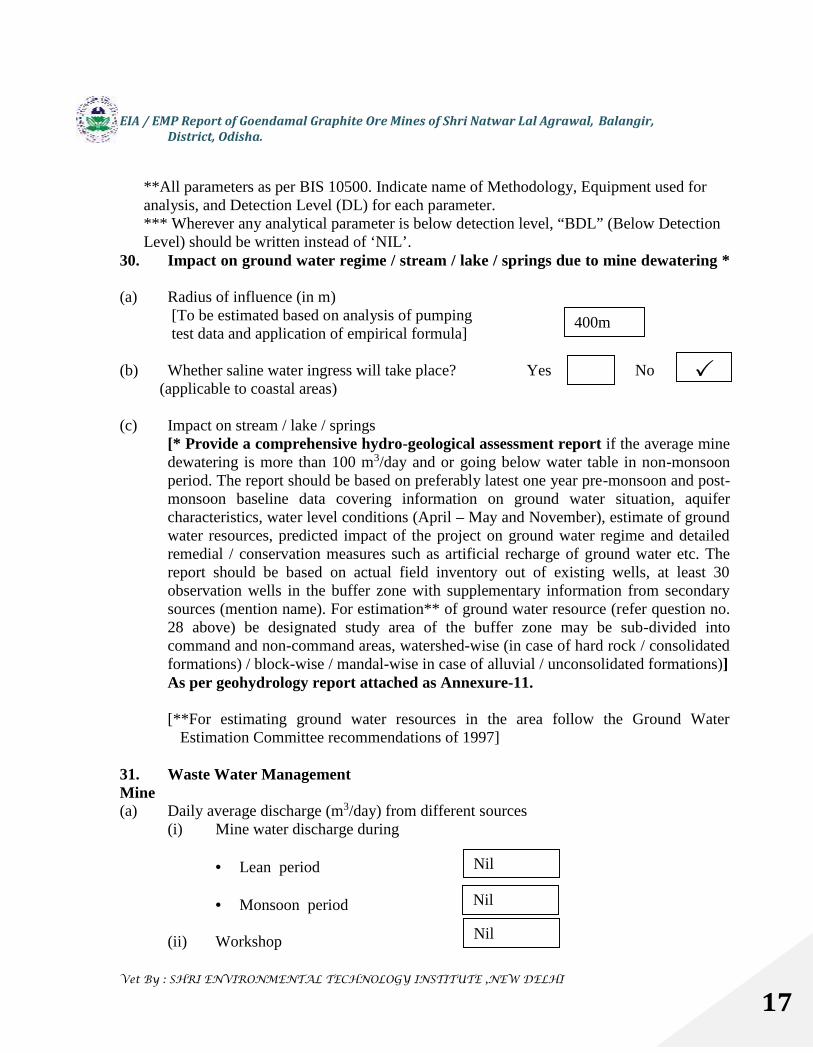
EIA / EMP Report of Goendamal Graphite Ore Mines of Shri Natwar Lal Agrawal, Balangir,District, Odisha.
Vet By : SHRI ENVIRONMENTAL TECHNOLOGY INSTITUTE ,NEW DELHI
17
**All parameters as per BIS 10500. Indicate name of Methodology, Equipment used foranalysis, and Detection Level (DL) for each parameter.*** Wherever any analytical parameter is below detection level, “BDL” (Below DetectionLevel) should be written instead of ‘NIL’.
30. Impact on ground water regime / stream / lake / springs due to mine dewatering *
(a) Radius of influence (in m)[To be estimated based on analysis of pumpingtest data and application of empirical formula]
(b) Whether saline water ingress will take place? Yes No(applicable to coastal areas)
(c) Impact on stream / lake / springs[* Provide a comprehensive hydro-geological assessment report if the average minedewatering is more than 100 m3/day and or going below water table in non-monsoonperiod. The report should be based on preferably latest one year pre-monsoon and post-monsoon baseline data covering information on ground water situation, aquifercharacteristics, water level conditions (April – May and November), estimate of groundwater resources, predicted impact of the project on ground water regime and detailedremedial / conservation measures such as artificial recharge of ground water etc. Thereport should be based on actual field inventory out of existing wells, at least 30observation wells in the buffer zone with supplementary information from secondarysources (mention name). For estimation** of ground water resource (refer question no.28 above) be designated study area of the buffer zone may be sub-divided intocommand and non-command areas, watershed-wise (in case of hard rock / consolidatedformations) / block-wise / mandal-wise in case of alluvial / unconsolidated formations)]As per geohydrology report attached as Annexure-11.
[**For estimating ground water resources in the area follow the Ground WaterEstimation Committee recommendations of 1997]
31. Waste Water ManagementMine(a) Daily average discharge (m3/day) from different sources
(i) Mine water discharge during
Lean period
Monsoon period
(ii) Workshop
Nil
400m
Nil
Nil
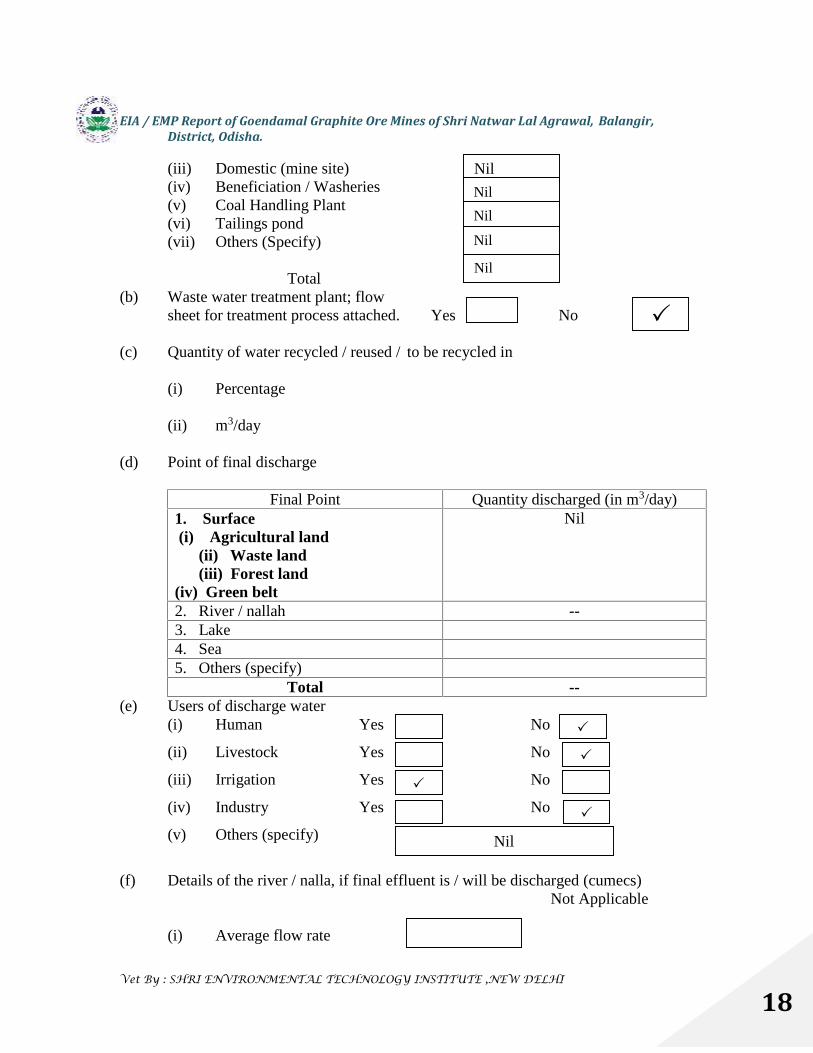
EIA / EMP Report of Goendamal Graphite Ore Mines of Shri Natwar Lal Agrawal, Balangir,District, Odisha.
Vet By : SHRI ENVIRONMENTAL TECHNOLOGY INSTITUTE ,NEW DELHI
18
(iii) Domestic (mine site)(iv) Beneficiation / Washeries(v) Coal Handling Plant(vi) Tailings pond(vii) Others (Specify)
Total(b) Waste water treatment plant; flow
sheet for treatment process attached. Yes No
(c) Quantity of water recycled / reused / to be recycled in
(i) Percentage
(ii) m3/day
(d) Point of final discharge
Final Point Quantity discharged (in m3/day)1. Surface(i) Agricultural land
(ii) Waste land(iii) Forest land
(iv) Green belt
Nil
2. River / nallah --3. Lake4. Sea5. Others (specify)
Total --(e) Users of discharge water
(i) Human Yes No
(ii) Livestock Yes No
(iii) Irrigation Yes No
(iv) Industry Yes No
(v) Others (specify)
(f) Details of the river / nalla, if final effluent is / will be discharged (cumecs)Not Applicable
(i) Average flow rate
Nil
Nil
Nil
Nil
Nil
Nil
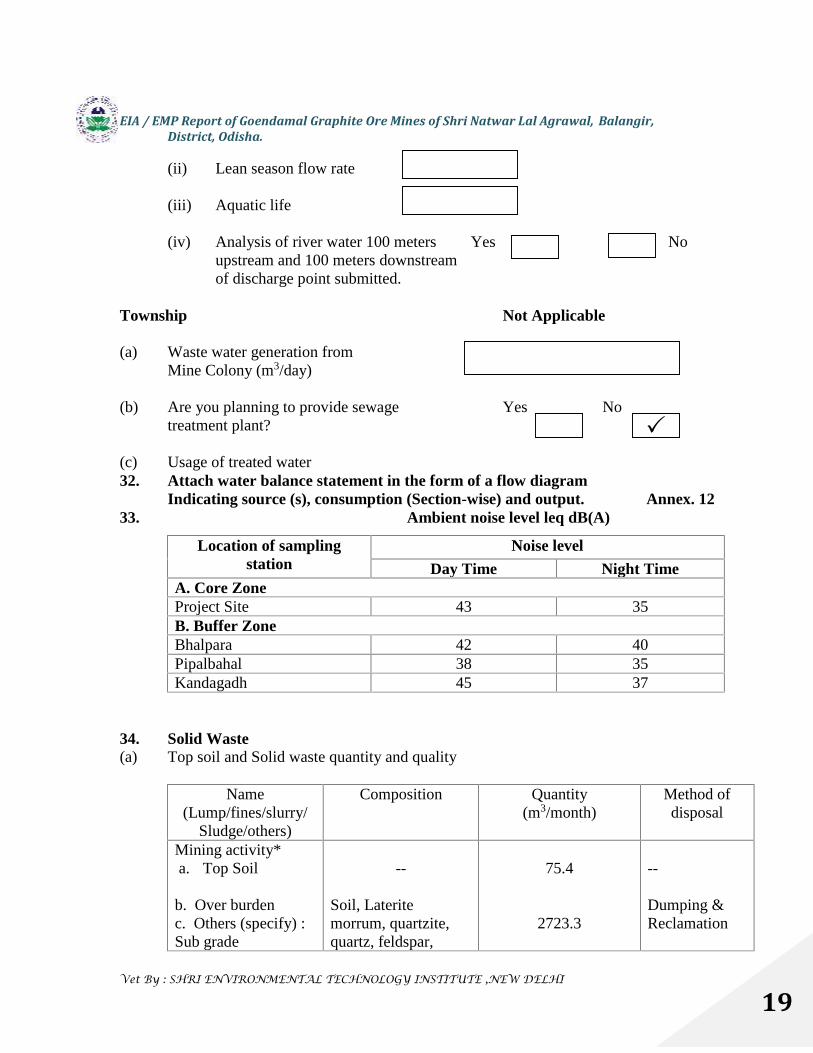
EIA / EMP Report of Goendamal Graphite Ore Mines of Shri Natwar Lal Agrawal, Balangir,District, Odisha.
Vet By : SHRI ENVIRONMENTAL TECHNOLOGY INSTITUTE ,NEW DELHI
19
(ii) Lean season flow rate
(iii) Aquatic life
(iv) Analysis of river water 100 meters Yes Noupstream and 100 meters downstreamof discharge point submitted.
Township Not Applicable
(a) Waste water generation fromMine Colony (m3/day)
(b) Are you planning to provide sewage Yes Notreatment plant?
(c) Usage of treated water32. Attach water balance statement in the form of a flow diagram
Indicating source (s), consumption (Section-wise) and output. Annex. 1233. Ambient noise level leq dB(A)
Location of samplingstation
Noise level
Day Time Night TimeA. Core ZoneProject Site 43 35B. Buffer ZoneBhalpara 42 40Pipalbahal 38 35Kandagadh 45 37
34. Solid Waste(a) Top soil and Solid waste quantity and quality
Name(Lump/fines/slurry/
Sludge/others)
Composition Quantity(m3/month)
Method ofdisposal
Mining activity*a. Top Soil
b. Over burdenc. Others (specify) :Sub grade
--
Soil, Lateritemorrum, quartzite,quartz, feldspar,
75.4
2723.3
--
Dumping &Reclamation
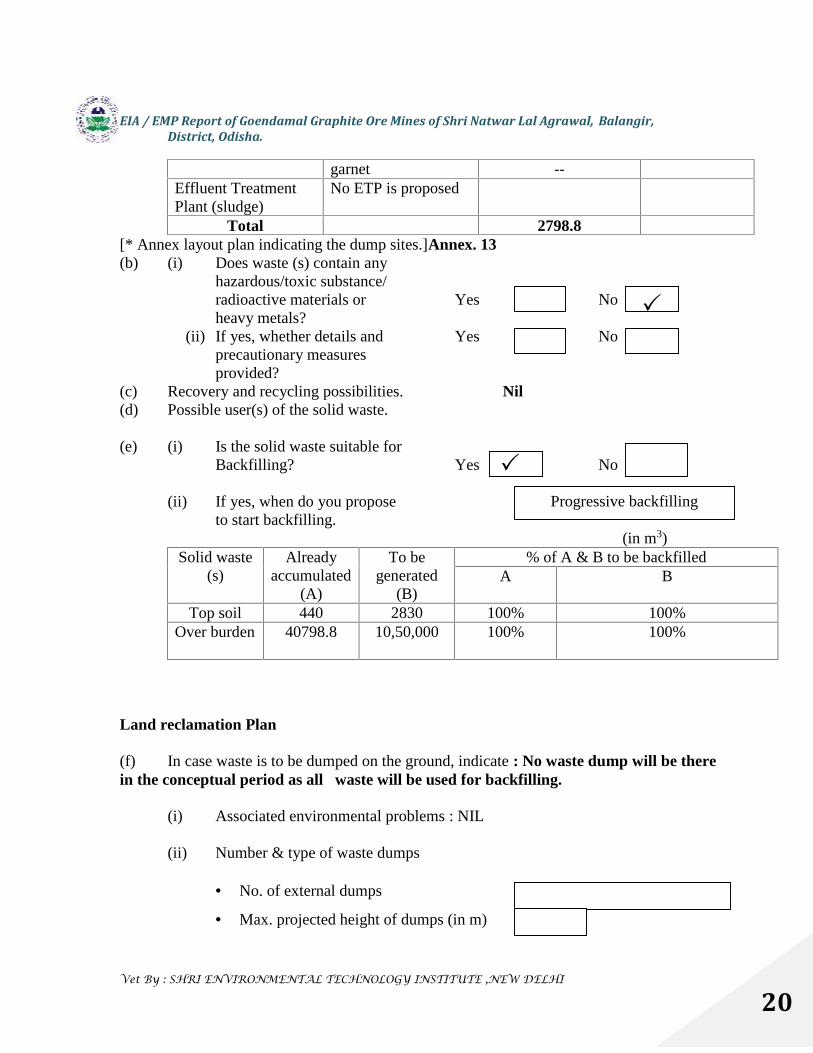
EIA / EMP Report of Goendamal Graphite Ore Mines of Shri Natwar Lal Agrawal, Balangir,District, Odisha.
Vet By : SHRI ENVIRONMENTAL TECHNOLOGY INSTITUTE ,NEW DELHI
20
garnet --Effluent TreatmentPlant (sludge)
No ETP is proposed
Total 2798.8[* Annex layout plan indicating the dump sites.]Annex. 13(b) (i) Does waste (s) contain any
hazardous/toxic substance/radioactive materials or Yes Noheavy metals?
(ii) If yes, whether details and Yes Noprecautionary measuresprovided?
(c) Recovery and recycling possibilities. Nil(d) Possible user(s) of the solid waste.
(e) (i) Is the solid waste suitable forBackfilling? Yes No
(ii) If yes, when do you proposeto start backfilling.
(in m3)Solid waste
(s)Already
accumulated(A)
To begenerated
(B)
% of A & B to be backfilledA B
Top soil 440 2830 100% 100%Over burden 40798.8 10,50,000 100% 100%
Land reclamation Plan
(f) In case waste is to be dumped on the ground, indicate : No waste dump will be therein the conceptual period as all waste will be used for backfilling.
(i) Associated environmental problems : NIL
(ii) Number & type of waste dumps
No. of external dumps
Max. projected height of dumps (in m)
Progressive backfilling
activity*[
a.TopSoil[
b.Overburden[
c.Others(specify)

EIA / EMP Report of Goendamal Graphite Ore Mines of Shri Natwar Lal Agrawal, Balangir,District, Odisha.
Vet By : SHRI ENVIRONMENTAL TECHNOLOGY INSTITUTE ,NEW DELHI
21
No. of terraces and height of each stage
Overall slope of the dump (degree)
Proposed reclamation measures : Waste generated during the presentplanperiod will be dumped in a new proposed dump and used forreclamation of the exhausted quarry.
(iii) Section of the waste dump in relationto the adjacent ground profile attached. Yes No
35. Fuel / Energy requirements*[*To be furnished for mines having ML area more than 25 ha. or captive power generation of500KVA and above]
(a) Total power requirement (in MW)
S. No. MineSite
Township Others (specify) Total
1. Present 5 Kw -- -- 5 Kw2. Proposed /
additional-- -- -- --
Total 5 Kw (ForDomestic use)
-- -- 5 Kw
(b) Source of power (in MW)
S. No. SEB/Grid* Captive power plant DG Sets
1 Present 5 Kw -- --2 Proposed -- -- --
Total 5 Kw -- --[* Annex a copy of the sanction letter from the concerned authority]
(c) Details of fuels
Sl.No.
Fuel Daily Consumption(TPD)
Calorificvalue
(Kcals/kg)
% Ash % Sulphur
Existing Proposed123
HSDLSHSOther(specify)
100 Lits 200 Lits 10226.2 0.005 0.22
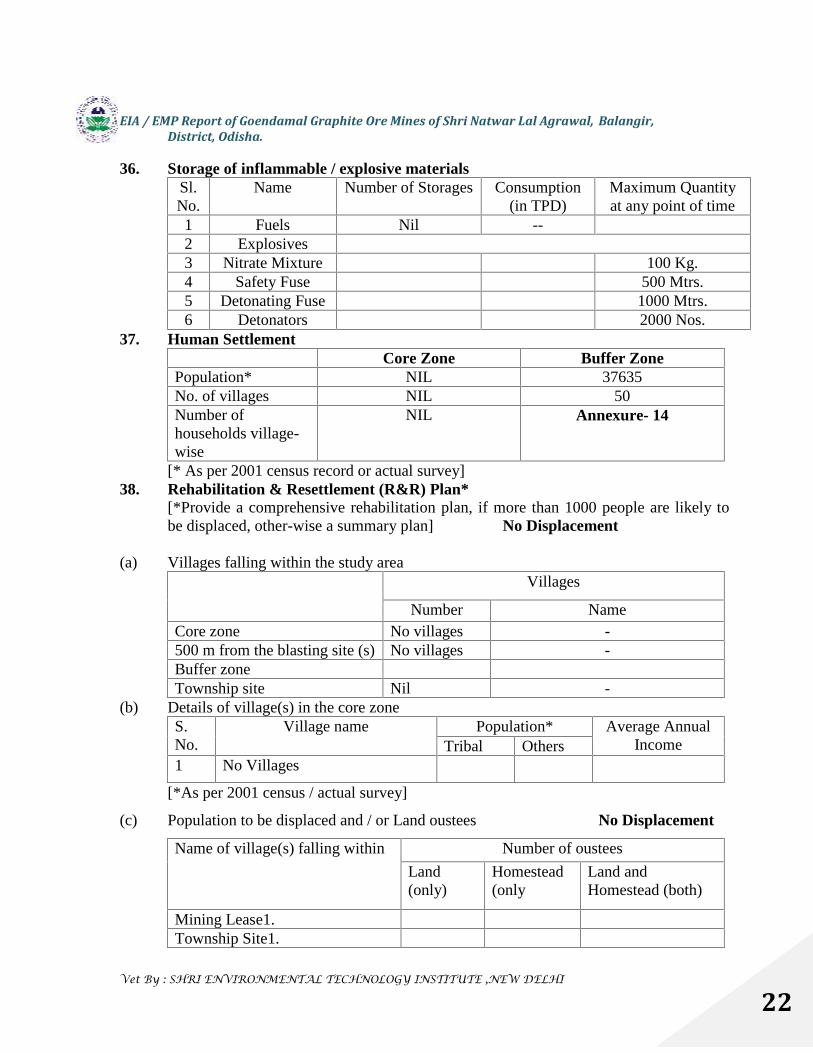
EIA / EMP Report of Goendamal Graphite Ore Mines of Shri Natwar Lal Agrawal, Balangir,District, Odisha.
Vet By : SHRI ENVIRONMENTAL TECHNOLOGY INSTITUTE ,NEW DELHI
22
36. Storage of inflammable / explosive materialsSl.No.
Name Number of Storages Consumption(in TPD)
Maximum Quantityat any point of time
1 Fuels Nil --2 Explosives3 Nitrate Mixture 100 Kg.4 Safety Fuse 500 Mtrs.5 Detonating Fuse 1000 Mtrs.6 Detonators 2000 Nos.
37. Human SettlementCore Zone Buffer Zone
Population* NIL 37635No. of villages NIL 50Number ofhouseholds village-wise
NIL Annexure- 14
[* As per 2001 census record or actual survey]38. Rehabilitation & Resettlement (R&R) Plan*
[*Provide a comprehensive rehabilitation plan, if more than 1000 people are likely tobe displaced, other-wise a summary plan] No Displacement
(a) Villages falling within the study areaVillages
Number NameCore zone No villages -500 m from the blasting site (s) No villages -Buffer zoneTownship site Nil -
(b) Details of village(s) in the core zoneS.No.
Village name Population* Average AnnualIncomeTribal Others
1 No Villages
[*As per 2001 census / actual survey]
(c) Population to be displaced and / or Land oustees No Displacement
Name of village(s) falling within Number of oustees
Land(only)
Homestead(only
Land andHomestead (both)
Mining Lease1.Township Site1.
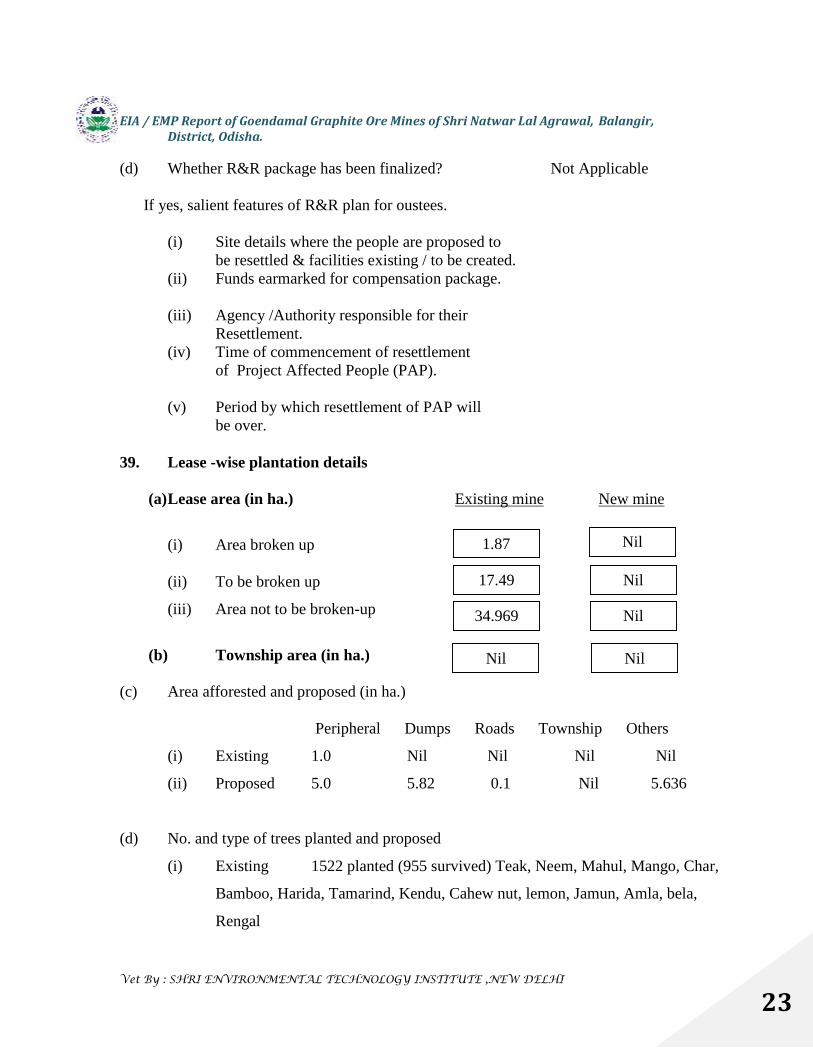
EIA / EMP Report of Goendamal Graphite Ore Mines of Shri Natwar Lal Agrawal, Balangir,District, Odisha.
Vet By : SHRI ENVIRONMENTAL TECHNOLOGY INSTITUTE ,NEW DELHI
23
(d) Whether R&R package has been finalized? Not Applicable
If yes, salient features of R&R plan for oustees.
(i) Site details where the people are proposed tobe resettled & facilities existing / to be created.
(ii) Funds earmarked for compensation package.
(iii) Agency /Authority responsible for theirResettlement.
(iv) Time of commencement of resettlementof Project Affected People (PAP).
(v) Period by which resettlement of PAP willbe over.
39. Lease -wise plantation details
(a)Lease area (in ha.) Existing mine New mine
(i) Area broken up
(ii) To be broken up
(iii) Area not to be broken-up
(b) Township area (in ha.)
(c) Area afforested and proposed (in ha.)
Peripheral Dumps Roads Township Others
(i) Existing 1.0 Nil Nil Nil Nil
(ii) Proposed 5.0 5.82 0.1 Nil 5.636
(d) No. and type of trees planted and proposed
(i) Existing 1522 planted (955 survived) Teak, Neem, Mahul, Mango, Char,
Bamboo, Harida, Tamarind, Kendu, Cahew nut, lemon, Jamun, Amla, bela,
Rengal
1.87 Nil
17.49 Nil
34.969 Nil
Nil Nil

EIA / EMP Report of Goendamal Graphite Ore Mines of Shri Natwar Lal Agrawal, Balangir,District, Odisha.
Vet By : SHRI ENVIRONMENTAL TECHNOLOGY INSTITUTE ,NEW DELHI
24
(ii) When plantation was started? Month / Year
No. of plant species planted Number saplings (per ha.)
15 1500
Survival rate % Avg. height
(ii) Proposed
No. of plant species to be planted Number of saplings (per ha.)
21 1200
40. Environmental health and safety(a) What major health and safety hazards are anticipated?
No major health hazard is anticipated from the mine as the dust generation during the
mining operation is very less due to wet process.
(b) What provisions have been made/proposed to be
Pre employment health checkup of the workers is being carried out. Apart from this
regular health checkup of the employees conducted once in a year. The detail schedule
of health checkup of the employees has been given as below:
Comprehensive Pre-employment medical check up for all employees.
General check up of all employees once every year
Chest X- Ray for all employees once every 3 years.
Lung function test for all employees once every 6 months.
Clinical examination of all employees once every 6 months.
Comprehensive medical examination of all the employees after retirement and
all those employees with more than 5 years of service leaving the company.
Local hospitals and Govt. health monitoring system will be engaged.
All safety gears will be provided to workers and care will be taken that these are
used properly by them. All safety norms will be followed.
July 2003
4.5 m64%

EIA / EMP Report of Goendamal Graphite Ore Mines of Shri Natwar Lal Agrawal, Balangir,District, Odisha.
Vet By : SHRI ENVIRONMENTAL TECHNOLOGY INSTITUTE ,NEW DELHI
25
(c) In case of an existing mine(i) Comprehensive report on health status
of the workers as under the Mines Act attached inAnnexure-15. Yes No
(ii) Mineralogical composition of RPM (dust)
Free silica BDL
Chromium* (Total as well as Hexavalent)
Lead**
[* Only for Chromite mines]
[**Only for Base Metal mines]
(d) Information on radiation protection measures, if applicable. Not Applicable
41. Environmental Management PlanSalient features of environmental protection measures
S.No
Environmentalissues*
Alreadypracticed, ifapplicable
Proposed
1 Air pollution
Dump site, Loading,Transportation
Watersprinkling
Topsoil banks and overburden dumps will beperiodically wetted to reduce fugitive dustgeneration.
Faces/sites beforeand after blastingFaces/sites whileloading
Dust suppression systems (water spraying)
Drill machines Dust extraction systemsUse of sharp drill bits for drilling holes anddrills with water flushing systems (wet drilling)to reduce dust generation.
Stock piles Mist spraysHaul roads Regular
watersprinkling
Trucks to be covered with tarpaulin and overfilling of tippers to be strictly avoidedmaintenance of haulage road on regular basis.Regular water spraying on haulage roads(Twicedaily)
2 Water pollution Surface runoff around the quarries anddumps near the natural drains will follow the
√
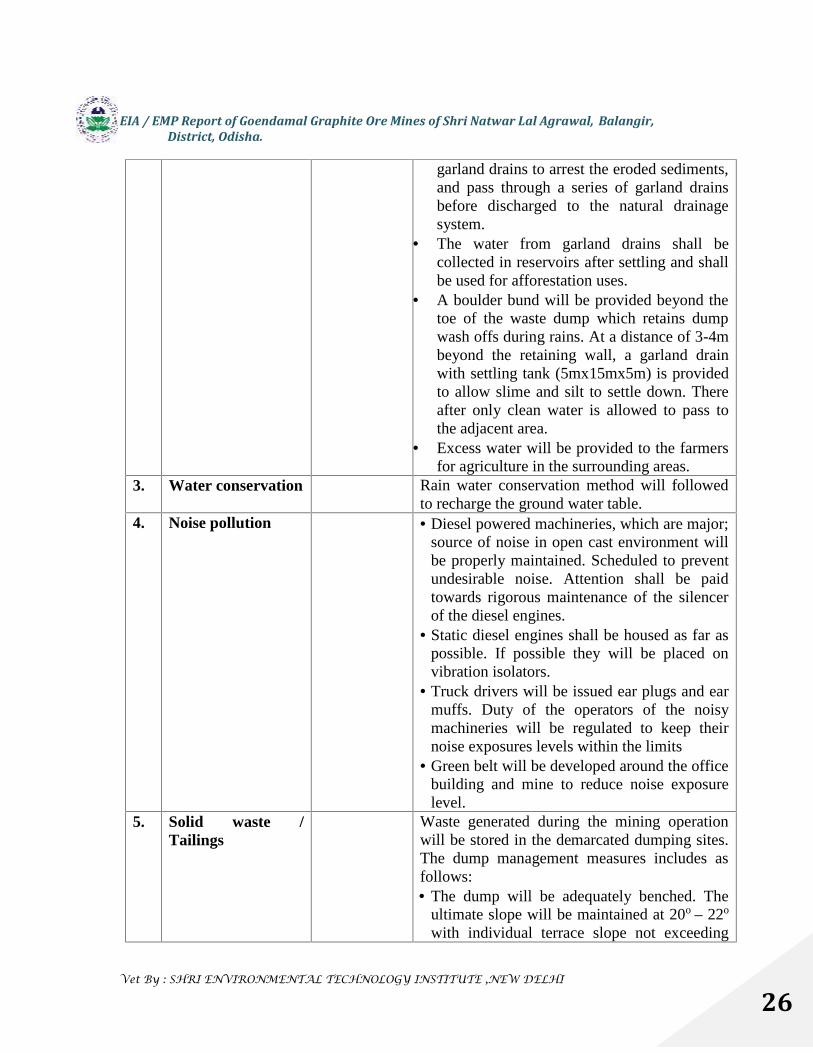
EIA / EMP Report of Goendamal Graphite Ore Mines of Shri Natwar Lal Agrawal, Balangir,District, Odisha.
Vet By : SHRI ENVIRONMENTAL TECHNOLOGY INSTITUTE ,NEW DELHI
26
garland drains to arrest the eroded sediments,and pass through a series of garland drainsbefore discharged to the natural drainagesystem.
The water from garland drains shall becollected in reservoirs after settling and shallbe used for afforestation uses.
A boulder bund will be provided beyond thetoe of the waste dump which retains dumpwash offs during rains. At a distance of 3-4mbeyond the retaining wall, a garland drainwith settling tank (5mx15mx5m) is providedto allow slime and silt to settle down. Thereafter only clean water is allowed to pass tothe adjacent area.
Excess water will be provided to the farmersfor agriculture in the surrounding areas.
3. Water conservation Rain water conservation method will followedto recharge the ground water table.
4. Noise pollution Diesel powered machineries, which are major;source of noise in open cast environment willbe properly maintained. Scheduled to preventundesirable noise. Attention shall be paidtowards rigorous maintenance of the silencerof the diesel engines.
Static diesel engines shall be housed as far aspossible. If possible they will be placed onvibration isolators.
Truck drivers will be issued ear plugs and earmuffs. Duty of the operators of the noisymachineries will be regulated to keep theirnoise exposures levels within the limits
Green belt will be developed around the officebuilding and mine to reduce noise exposurelevel.
5. Solid waste /Tailings
Waste generated during the mining operationwill be stored in the demarcated dumping sites.The dump management measures includes asfollows: The dump will be adequately benched. The
ultimate slope will be maintained at 20o – 22o
with individual terrace slope not exceeding

EIA / EMP Report of Goendamal Graphite Ore Mines of Shri Natwar Lal Agrawal, Balangir,District, Odisha.
Vet By : SHRI ENVIRONMENTAL TECHNOLOGY INSTITUTE ,NEW DELHI
27
37o. The individual terrace height will be
maintained at 8m. Each terrace will have inward slope with
catch drains at inward side of the terrace andthe catch drain of the individual terrace willbe connected to the garland drain outside theperiphery of the dump.
The catch drains will have half concrete openpipes followed by settling tanks to avoid washoffs.
The dump bench slope will be vegetated withgrasses to avoid erosion by wind & water andin latter stage, the dump will be utilized forbackfilling of the exhausted quarry.
Retaining wall and garland drains for theproposed waste dump will be constructed toarrest wash offs from the dump.
6. Land degradation The degraded land due to the mining activitywill be backfilled by the waste generated fromthe mines and reclaimed by plantation
7. Erosion &Sediment8. Top soil The top soil generated will be spread over the
backfilled area and plantation was done on thearea.
9. Ground vibration Reducing the maximum instantaneous charge(MIC) by using delays, reduced holediameter and/or deck loading.
Blast vibration research shows the level ofground vibration is proportional to the ScaledDistance (vibration) which is defined as thedistance to the blast divided by the squareroot of the MIC. So, at a given distance,reducing the MIC will generally result inlower levels of vibration.
Changing the burden and spacing by: alteringthe drilling pattern, and/or delay layout, oraltering the hole inclination.
Exercise strict control over spacing andorienting all blast drill holes.
Establish times of blasting to suit localconditions.
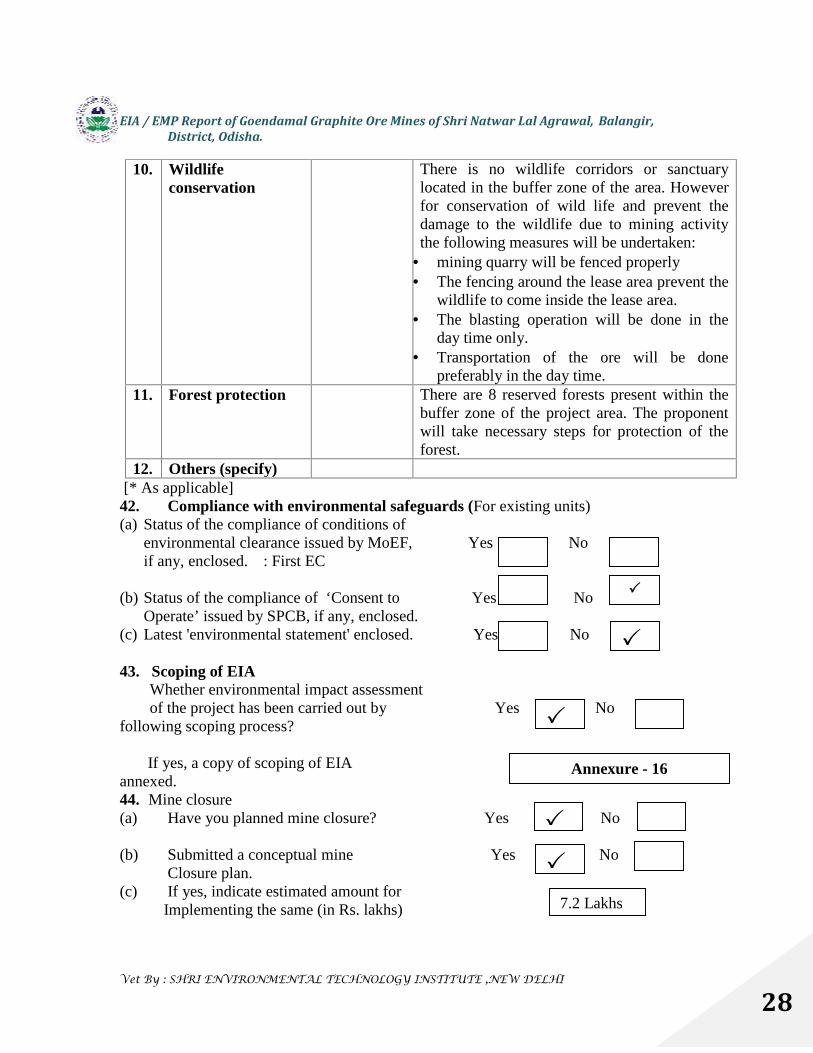
EIA / EMP Report of Goendamal Graphite Ore Mines of Shri Natwar Lal Agrawal, Balangir,District, Odisha.
Vet By : SHRI ENVIRONMENTAL TECHNOLOGY INSTITUTE ,NEW DELHI
28
10. Wildlifeconservation
There is no wildlife corridors or sanctuarylocated in the buffer zone of the area. Howeverfor conservation of wild life and prevent thedamage to the wildlife due to mining activitythe following measures will be undertaken:
mining quarry will be fenced properly The fencing around the lease area prevent the
wildlife to come inside the lease area. The blasting operation will be done in the
day time only. Transportation of the ore will be done
preferably in the day time.11. Forest protection There are 8 reserved forests present within the
buffer zone of the project area. The proponentwill take necessary steps for protection of theforest.
12. Others (specify)[* As applicable]
42. Compliance with environmental safeguards (For existing units)(a) Status of the compliance of conditions of
environmental clearance issued by MoEF, Yes Noif any, enclosed. : First EC
(b) Status of the compliance of ‘Consent to Yes NoOperate’ issued by SPCB, if any, enclosed.
(c) Latest 'environmental statement' enclosed. Yes No
43. Scoping of EIAWhether environmental impact assessmentof the project has been carried out by Yes No
following scoping process?
If yes, a copy of scoping of EIAannexed.44. Mine closure(a) Have you planned mine closure? Yes No
(b) Submitted a conceptual mine Yes NoClosure plan.
(c) If yes, indicate estimated amount forImplementing the same (in Rs. lakhs) 7.2 Lakhs
Annexure - 16
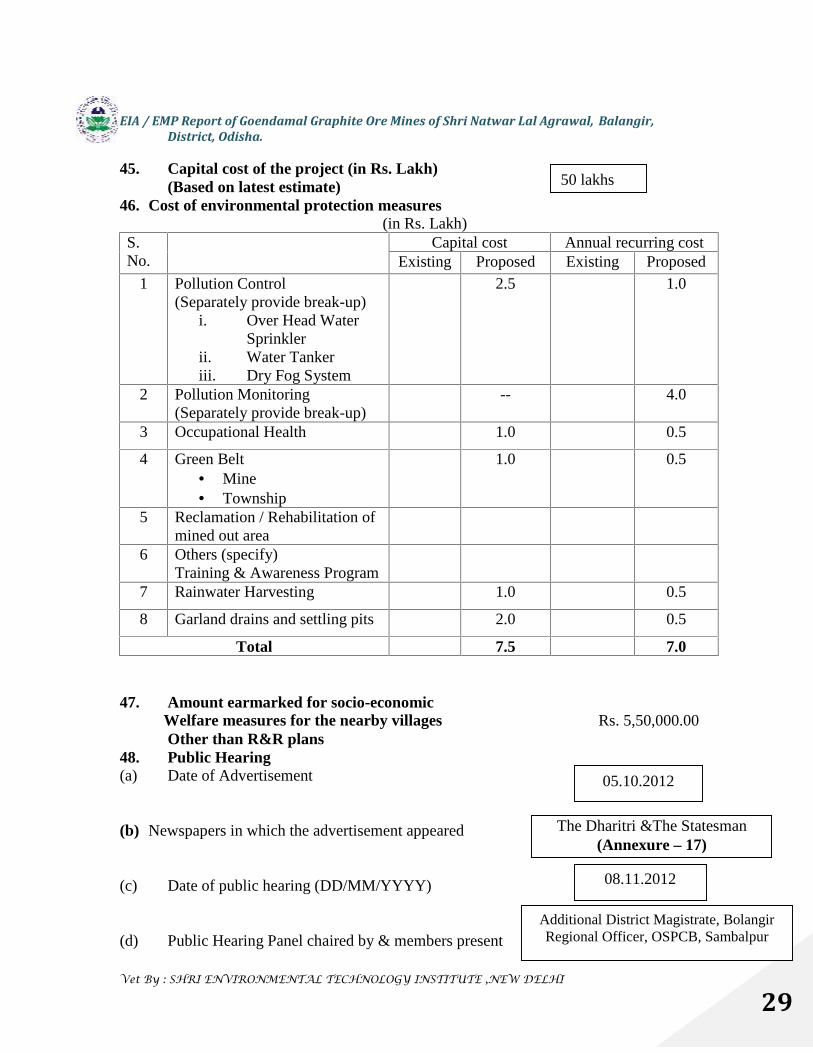
EIA / EMP Report of Goendamal Graphite Ore Mines of Shri Natwar Lal Agrawal, Balangir,District, Odisha.
Vet By : SHRI ENVIRONMENTAL TECHNOLOGY INSTITUTE ,NEW DELHI
29
45. Capital cost of the project (in Rs. Lakh)(Based on latest estimate)
46. Cost of environmental protection measures(in Rs. Lakh)
S.No.
Capital cost Annual recurring costExisting Proposed Existing Proposed
1 Pollution Control(Separately provide break-up)
i. Over Head WaterSprinkler
ii. Water Tankeriii. Dry Fog System
2.5 1.0
2 Pollution Monitoring(Separately provide break-up)
-- 4.0
3 Occupational Health 1.0 0.5
4 Green Belt Mine Township
1.0 0.5
5 Reclamation / Rehabilitation ofmined out area
6 Others (specify)Training & Awareness Program
7 Rainwater Harvesting 1.0 0.5
8 Garland drains and settling pits 2.0 0.5
Total 7.5 7.0
47. Amount earmarked for socio-economicWelfare measures for the nearby villages Rs. 5,50,000.00Other than R&R plans
48. Public Hearing(a) Date of Advertisement
(b) Newspapers in which the advertisement appeared
(c) Date of public hearing (DD/MM/YYYY)
(d) Public Hearing Panel chaired by & members present
50 lakhs
05.10.2012
The Dharitri &The Statesman(Annexure – 17)
08.11.2012
Additional District Magistrate, BolangirRegional Officer, OSPCB, Sambalpur
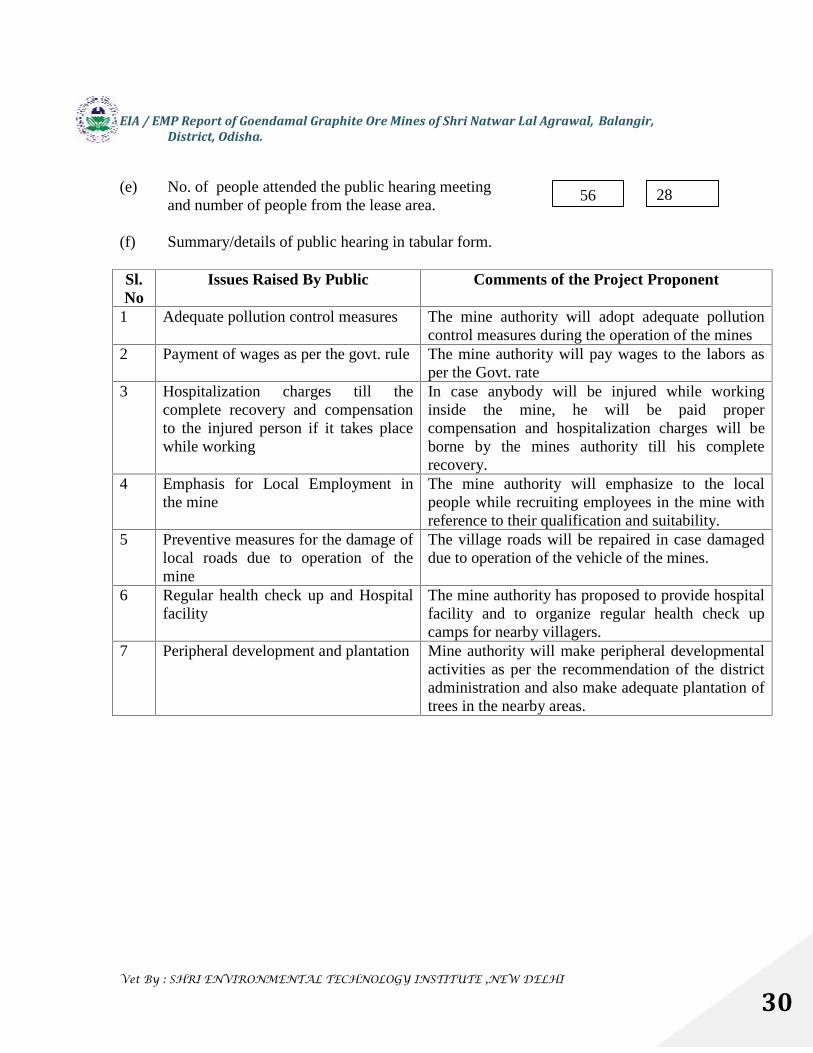
EIA / EMP Report of Goendamal Graphite Ore Mines of Shri Natwar Lal Agrawal, Balangir,District, Odisha.
Vet By : SHRI ENVIRONMENTAL TECHNOLOGY INSTITUTE ,NEW DELHI
30
(e) No. of people attended the public hearing meetingand number of people from the lease area.
(f) Summary/details of public hearing in tabular form.
Sl.No
Issues Raised By Public Comments of the Project Proponent
1 Adequate pollution control measures The mine authority will adopt adequate pollutioncontrol measures during the operation of the mines
2 Payment of wages as per the govt. rule The mine authority will pay wages to the labors asper the Govt. rate
3 Hospitalization charges till thecomplete recovery and compensationto the injured person if it takes placewhile working
In case anybody will be injured while workinginside the mine, he will be paid propercompensation and hospitalization charges will beborne by the mines authority till his completerecovery.
4 Emphasis for Local Employment inthe mine
The mine authority will emphasize to the localpeople while recruiting employees in the mine withreference to their qualification and suitability.
5 Preventive measures for the damage oflocal roads due to operation of themine
The village roads will be repaired in case damageddue to operation of the vehicle of the mines.
6 Regular health check up and Hospitalfacility
The mine authority has proposed to provide hospitalfacility and to organize regular health check upcamps for nearby villagers.
7 Peripheral development and plantation Mine authority will make peripheral developmentalactivities as per the recommendation of the districtadministration and also make adequate plantation oftrees in the nearby areas.
2856
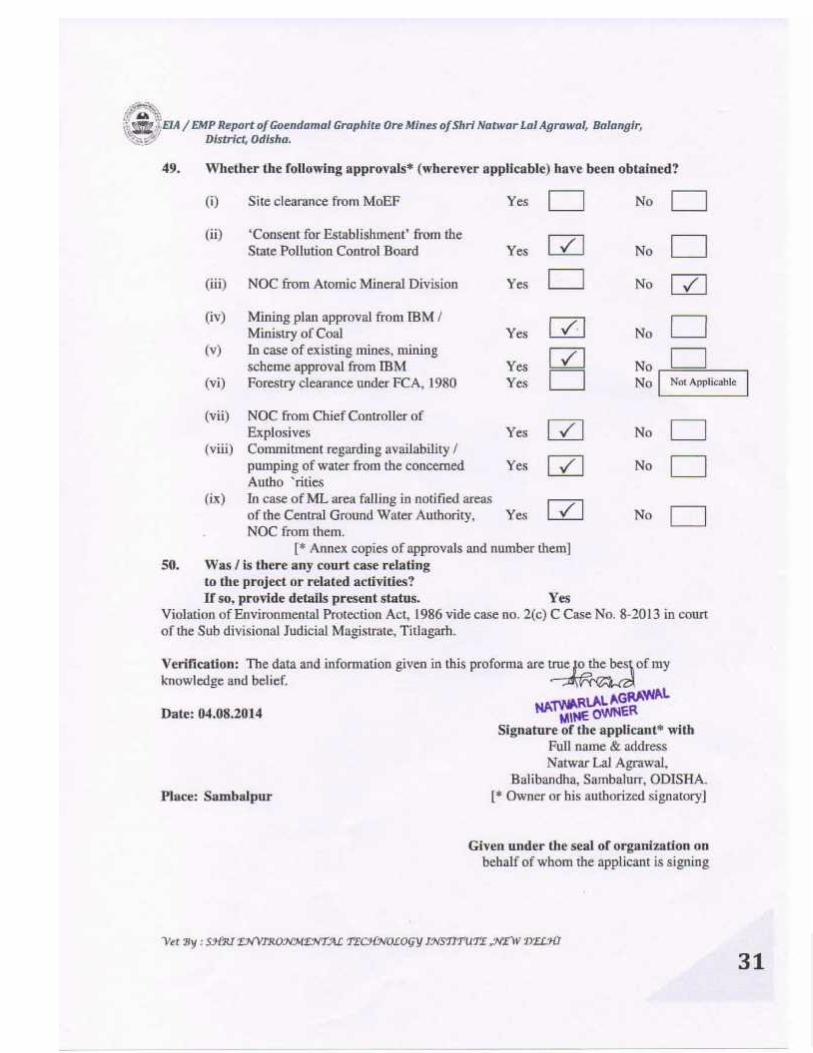
EIA / EMP Report of Goendamal Graphite Ore Mines of Shri Natwar Lal Agrawal, Balangir,District, Odisha.
Vet By : SHRI ENVIRONMENTAL TECHNOLOGY INSTITUTE ,NEW DELHI
31
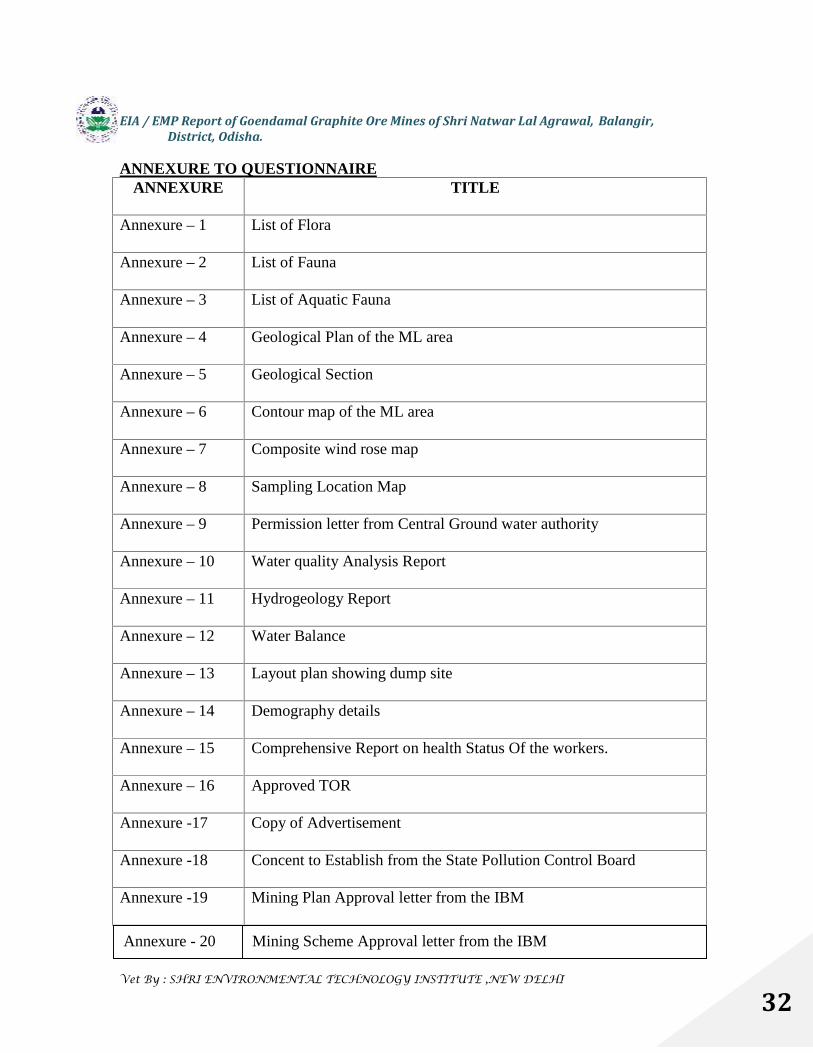
EIA / EMP Report of Goendamal Graphite Ore Mines of Shri Natwar Lal Agrawal, Balangir,District, Odisha.
Vet By : SHRI ENVIRONMENTAL TECHNOLOGY INSTITUTE ,NEW DELHI
32
ANNEXURE TO QUESTIONNAIREANNEXURE TITLE
Annexure – 1 List of Flora
Annexure – 2 List of Fauna
Annexure – 3 List of Aquatic Fauna
Annexure – 4 Geological Plan of the ML area
Annexure – 5 Geological Section
Annexure – 6 Contour map of the ML area
Annexure – 7 Composite wind rose map
Annexure – 8 Sampling Location Map
Annexure – 9 Permission letter from Central Ground water authority
Annexure – 10 Water quality Analysis Report
Annexure – 11 Hydrogeology Report
Annexure – 12 Water Balance
Annexure – 13 Layout plan showing dump site
Annexure – 14 Demography details
Annexure – 15 Comprehensive Report on health Status Of the workers.
Annexure – 16 Approved TOR
Annexure -17 Copy of Advertisement
Annexure -18 Concent to Establish from the State Pollution Control Board
Annexure -19 Mining Plan Approval letter from the IBM
Annexure - 20 Mining Scheme Approval letter from the IBM
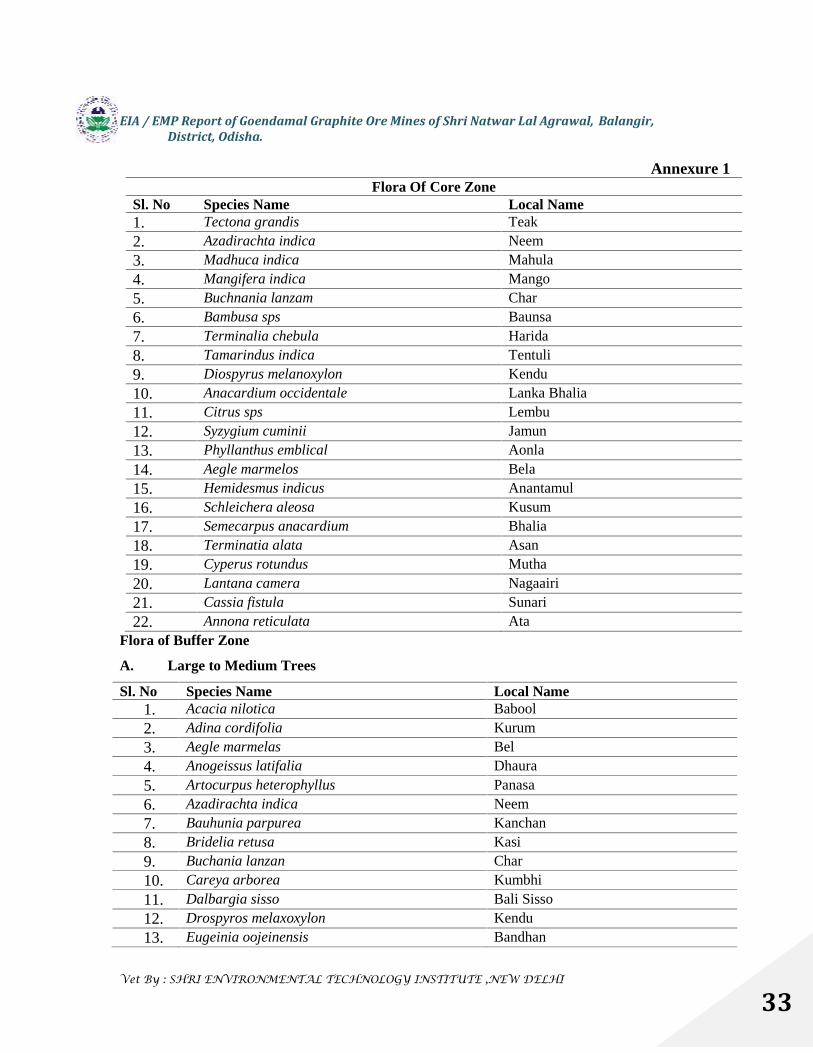
EIA / EMP Report of Goendamal Graphite Ore Mines of Shri Natwar Lal Agrawal, Balangir,District, Odisha.
Vet By : SHRI ENVIRONMENTAL TECHNOLOGY INSTITUTE ,NEW DELHI
33
Annexure 1Flora Of Core Zone
Sl. No Species Name Local Name1. Tectona grandis Teak2. Azadirachta indica Neem3. Madhuca indica Mahula4. Mangifera indica Mango5. Buchnania lanzam Char6. Bambusa sps Baunsa7. Terminalia chebula Harida8. Tamarindus indica Tentuli9. Diospyrus melanoxylon Kendu10. Anacardium occidentale Lanka Bhalia11. Citrus sps Lembu12. Syzygium cuminii Jamun13. Phyllanthus emblical Aonla14. Aegle marmelos Bela15. Hemidesmus indicus Anantamul16. Schleichera aleosa Kusum17. Semecarpus anacardium Bhalia18. Terminatia alata Asan19. Cyperus rotundus Mutha20. Lantana camera Nagaairi21. Cassia fistula Sunari22. Annona reticulata Ata
Flora of Buffer Zone
A. Large to Medium Trees
Sl. No Species Name Local Name1. Acacia nilotica Babool2. Adina cordifolia Kurum3. Aegle marmelas Bel4. Anogeissus latifalia Dhaura5. Artocurpus heterophyllus Panasa6. Azadirachta indica Neem7. Bauhunia parpurea Kanchan8. Bridelia retusa Kasi9. Buchania lanzan Char10. Careya arborea Kumbhi11. Dalbargia sisso Bali Sisso12. Drospyros melaxoxylon Kendu13. Eugeinia oojeinensis Bandhan

EIA / EMP Report of Goendamal Graphite Ore Mines of Shri Natwar Lal Agrawal, Balangir,District, Odisha.
Vet By : SHRI ENVIRONMENTAL TECHNOLOGY INSTITUTE ,NEW DELHI
34
14. Ficus Bengalensis Bara15. Ficus glomerata Dimiri16. Ficus religiosa Aswastha17. Gmelina arborea Gambhari18. Lagerstroemia parviflora Sidha19. Madhuca longifolia Mahul20. Mangifera indica Amba21. Morinda tinctoria Acchu22. Pongamia pinnata Karanj23. Prerocarpus marsupium Piasal24. Bombax ceiba Simili25. Samania saman Chakunda26. Schleichera aleosa Kusum27. Semecarpus anacardium Bhalia28. Shorea robusta Sal29. Syzygium cumini Jamu30. Tamarindus indica Tentuli31. Terminalia alata Asan32. Terminalia arjuna Arjuna33. Terminalia bellerica Bahada34. Terminalia chebula Harida35. Tectona grandis Saguan
B. Small Trees to shrubsSl. No Species Name Local Name1. Alangium salvifolium Ankul2. Cassia fistula Sunari3. Chromolaena odorata Poksunga4. Emblica officinalis Aonla5. Flemingia chappar Ranidantkathi6. Helicteres isora Antia7. Holarrhena antidysenterica Kurei8. Justicia adhatoda Basanga9. Lantana camara Naga airi10. Nyctanthes arbor – tristis Gangasiuli11. Pavetta indica Kukur chhalia12. Vitex nigundo Begunia13. Zizyphus mauritiana BarakoliC. Herbs and grasses & (Ferns)Sl. No Species Name1. Acalypha indica Nakachana2. Achyranthes aspera Apamaranga
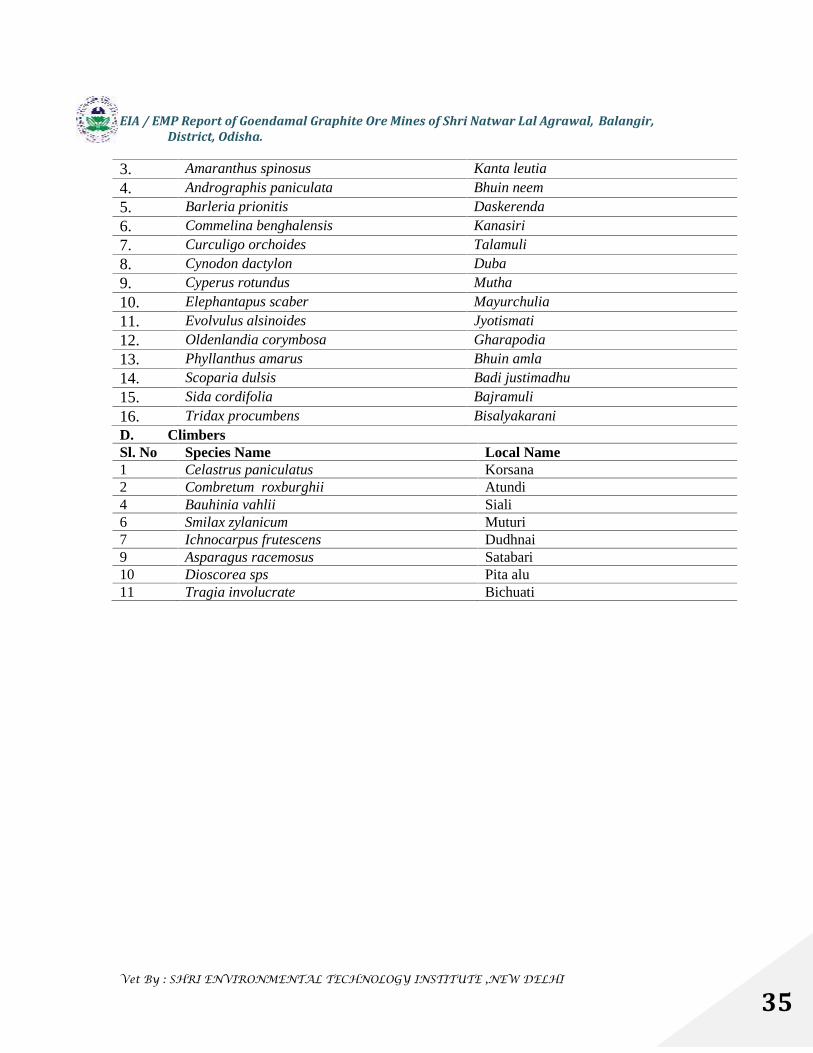
EIA / EMP Report of Goendamal Graphite Ore Mines of Shri Natwar Lal Agrawal, Balangir,District, Odisha.
Vet By : SHRI ENVIRONMENTAL TECHNOLOGY INSTITUTE ,NEW DELHI
35
3. Amaranthus spinosus Kanta leutia
4. Andrographis paniculata Bhuin neem5. Barleria prionitis Daskerenda6. Commelina benghalensis Kanasiri7. Curculigo orchoides Talamuli8. Cynodon dactylon Duba9. Cyperus rotundus Mutha
10. Elephantapus scaber Mayurchulia11. Evolvulus alsinoides Jyotismati12. Oldenlandia corymbosa Gharapodia13. Phyllanthus amarus Bhuin amla14. Scoparia dulsis Badi justimadhu15. Sida cordifolia Bajramuli
16. Tridax procumbens BisalyakaraniD. ClimbersSl. No Species Name Local Name1 Celastrus paniculatus Korsana2 Combretum roxburghii Atundi4 Bauhinia vahlii Siali6 Smilax zylanicum Muturi7 Ichnocarpus frutescens Dudhnai9 Asparagus racemosus Satabari10 Dioscorea sps Pita alu11 Tragia involucrate Bichuati
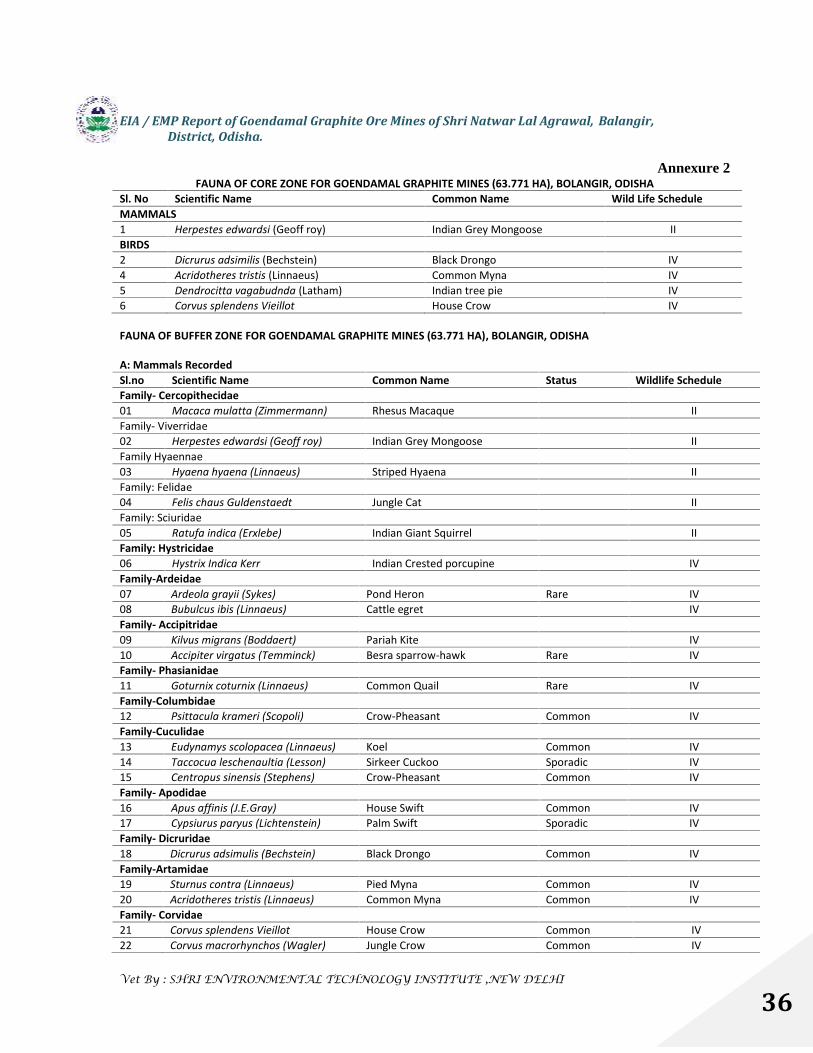
EIA / EMP Report of Goendamal Graphite Ore Mines of Shri Natwar Lal Agrawal, Balangir,District, Odisha.
Vet By : SHRI ENVIRONMENTAL TECHNOLOGY INSTITUTE ,NEW DELHI
36
Annexure 2FAUNA OF CORE ZONE FOR GOENDAMAL GRAPHITE MINES (63.771 HA), BOLANGIR, ODISHA
Sl. No Scientific Name Common Name Wild Life ScheduleMAMMALS1 Herpestes edwardsi (Geoff roy) Indian Grey Mongoose IIBIRDS2 Dicrurus adsimilis (Bechstein) Black Drongo IV4 Acridotheres tristis (Linnaeus) Common Myna IV5 Dendrocitta vagabudnda (Latham) Indian tree pie IV6 Corvus splendens Vieillot House Crow IV
FAUNA OF BUFFER ZONE FOR GOENDAMAL GRAPHITE MINES (63.771 HA), BOLANGIR, ODISHA
A: Mammals RecordedSl.no Scientific Name Common Name Status Wildlife ScheduleFamily- Cercopithecidae01 Macaca mulatta (Zimmermann) Rhesus Macaque IIFamily- Viverridae02 Herpestes edwardsi (Geoff roy) Indian Grey Mongoose IIFamily Hyaennae03 Hyaena hyaena (Linnaeus) Striped Hyaena IIFamily: Felidae04 Felis chaus Guldenstaedt Jungle Cat IIFamily: Sciuridae05 Ratufa indica (Erxlebe) Indian Giant Squirrel IIFamily: Hystricidae06 Hystrix Indica Kerr Indian Crested porcupine IVFamily-Ardeidae07 Ardeola grayii (Sykes) Pond Heron Rare IV08 Bubulcus ibis (Linnaeus) Cattle egret IVFamily- Accipitridae09 Kilvus migrans (Boddaert) Pariah Kite IV10 Accipiter virgatus (Temminck) Besra sparrow-hawk Rare IVFamily- Phasianidae11 Goturnix coturnix (Linnaeus) Common Quail Rare IVFamily-Columbidae12 Psittacula krameri (Scopoli) Crow-Pheasant Common IVFamily-Cuculidae13 Eudynamys scolopacea (Linnaeus) Koel Common IV14 Taccocua leschenaultia (Lesson) Sirkeer Cuckoo Sporadic IV15 Centropus sinensis (Stephens) Crow-Pheasant Common IVFamily- Apodidae16 Apus affinis (J.E.Gray) House Swift Common IV17 Cypsiurus paryus (Lichtenstein) Palm Swift Sporadic IVFamily- Dicruridae18 Dicrurus adsimulis (Bechstein) Black Drongo Common IVFamily-Artamidae19 Sturnus contra (Linnaeus) Pied Myna Common IV20 Acridotheres tristis (Linnaeus) Common Myna Common IVFamily- Corvidae21 Corvus splendens Vieillot House Crow Common IV22 Corvus macrorhynchos (Wagler) Jungle Crow Common IV
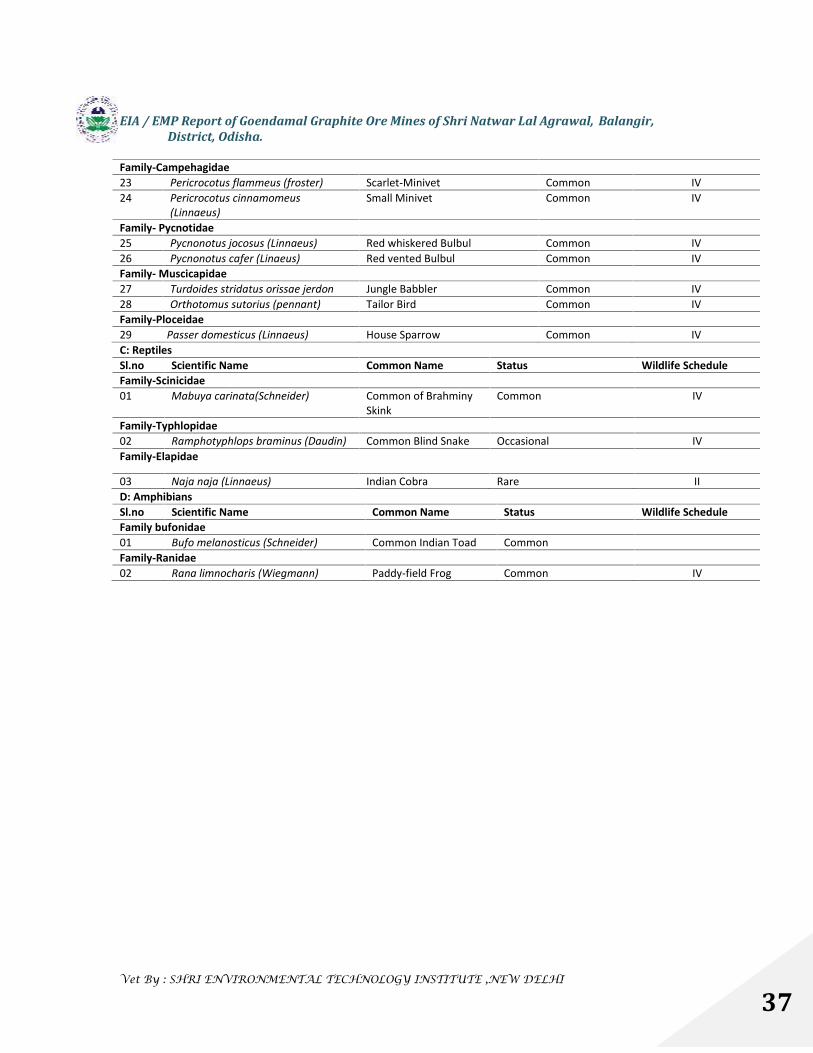
EIA / EMP Report of Goendamal Graphite Ore Mines of Shri Natwar Lal Agrawal, Balangir,District, Odisha.
Vet By : SHRI ENVIRONMENTAL TECHNOLOGY INSTITUTE ,NEW DELHI
37
Family-Campehagidae23 Pericrocotus flammeus (froster) Scarlet-Minivet Common IV24 Pericrocotus cinnamomeus
(Linnaeus)Small Minivet Common IV
Family- Pycnotidae25 Pycnonotus jocosus (Linnaeus) Red whiskered Bulbul Common IV26 Pycnonotus cafer (Linaeus) Red vented Bulbul Common IVFamily- Muscicapidae27 Turdoides stridatus orissae jerdon Jungle Babbler Common IV28 Orthotomus sutorius (pennant) Tailor Bird Common IVFamily-Ploceidae29 Passer domesticus (Linnaeus) House Sparrow Common IVC: ReptilesSl.no Scientific Name Common Name Status Wildlife ScheduleFamily-Scinicidae01 Mabuya carinata(Schneider) Common of Brahminy
SkinkCommon IV
Family-Typhlopidae02 Ramphotyphlops braminus (Daudin) Common Blind Snake Occasional IVFamily-Elapidae
03 Naja naja (Linnaeus) Indian Cobra Rare IID: AmphibiansSl.no Scientific Name Common Name Status Wildlife ScheduleFamily bufonidae01 Bufo melanosticus (Schneider) Common Indian Toad CommonFamily-Ranidae02 Rana limnocharis (Wiegmann) Paddy-field Frog Common IV
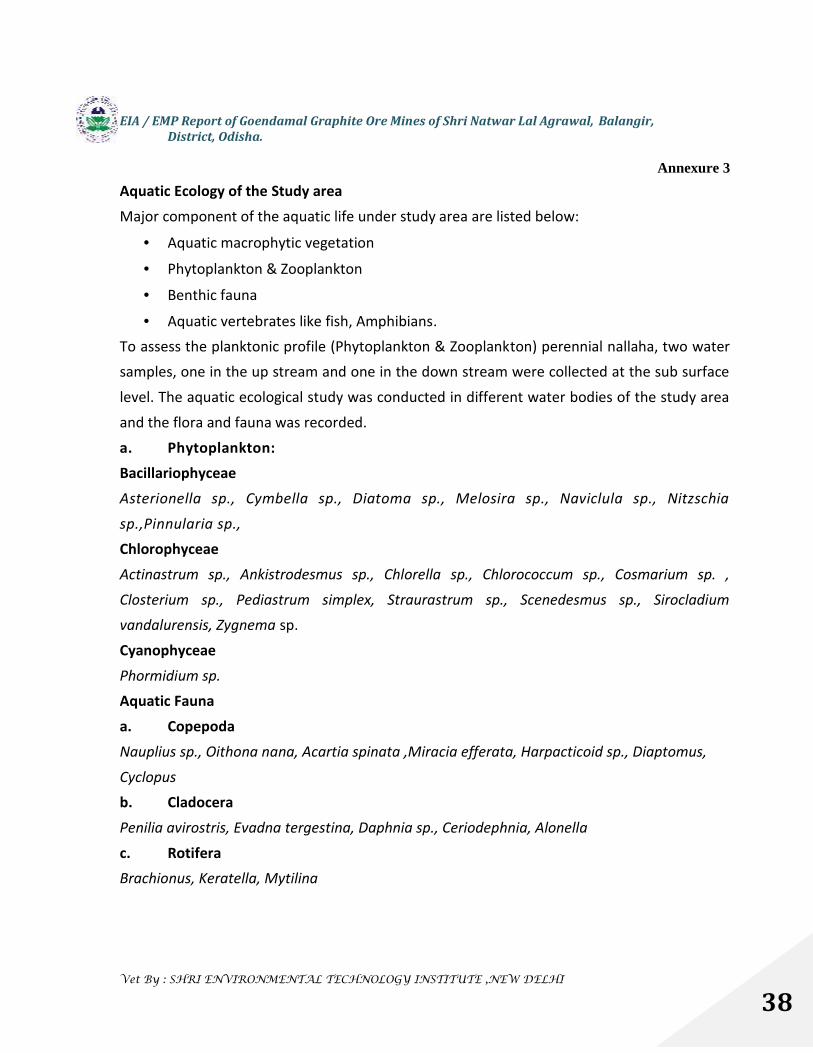
EIA / EMP Report of Goendamal Graphite Ore Mines of Shri Natwar Lal Agrawal, Balangir,District, Odisha.
Vet By : SHRI ENVIRONMENTAL TECHNOLOGY INSTITUTE ,NEW DELHI
38
Annexure 3
Aquatic Ecology of the Study areaMajor component of the aquatic life under study area are listed below:
Aquatic macrophytic vegetation
Phytoplankton & Zooplankton
Benthic fauna
Aquatic vertebrates like fish, Amphibians.To assess the planktonic profile (Phytoplankton & Zooplankton) perennial nallaha, two watersamples, one in the up stream and one in the down stream were collected at the sub surface
level. The aquatic ecological study was conducted in different water bodies of the study area
and the flora and fauna was recorded.
a. Phytoplankton:BacillariophyceaeAsterionella sp., Cymbella sp., Diatoma sp., Melosira sp., Naviclula sp., Nitzschiasp.,Pinnularia sp.,ChlorophyceaeActinastrum sp., Ankistrodesmus sp., Chlorella sp., Chlorococcum sp., Cosmarium sp. ,Closterium sp., Pediastrum simplex, Straurastrum sp., Scenedesmus sp., Sirocladiumvandalurensis, Zygnema sp.
CyanophyceaePhormidium sp.Aquatic Faunaa. CopepodaNauplius sp., Oithona nana, Acartia spinata ,Miracia efferata, Harpacticoid sp., Diaptomus,Cyclopusb. CladoceraPenilia avirostris, Evadna tergestina, Daphnia sp., Ceriodephnia, Alonellac. RotiferaBrachionus, Keratella, Mytilina
EIA / EMP Report of Goendamal Graphite Ore Mines of Shri Natwar Lal Agrawal, Balangir,District, Odisha.
Vet By : SHRI ENVIRONMENTAL TECHNOLOGY INSTITUTE ,NEW DELHI
39
B. Aquatic Fish FaunaAmong all the aquatic life in the study area the fish fauna occupies an important place.
The fish fauna of the area includes:Major carps includes Catla, Rahu, Mirgai, Calcasu, Exoticcarps includes Silver carp, Grass carp, Minor carps, Murrels, Hiisa, Cat fish,Prawn,Mishfish.
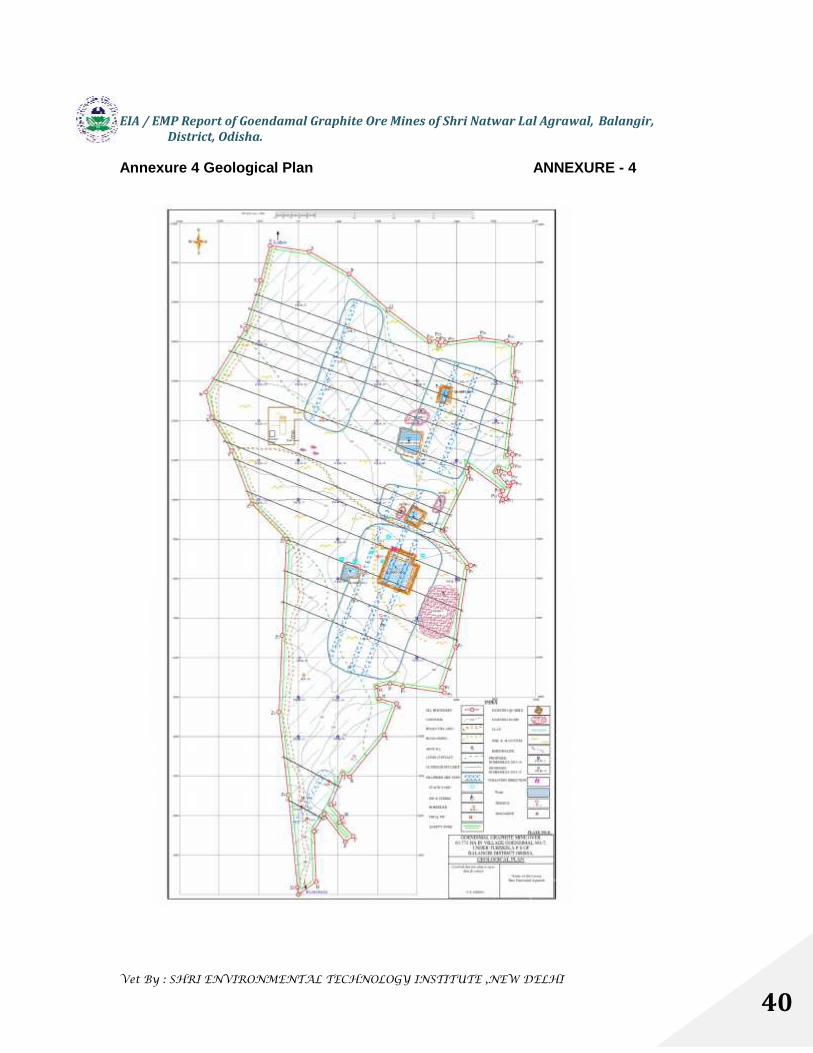
EIA / EMP Report of Goendamal Graphite Ore Mines of Shri Natwar Lal Agrawal, Balangir,District, Odisha.
Vet By : SHRI ENVIRONMENTAL TECHNOLOGY INSTITUTE ,NEW DELHI
40
Annexure 4 Geological Plan ANNEXURE - 4
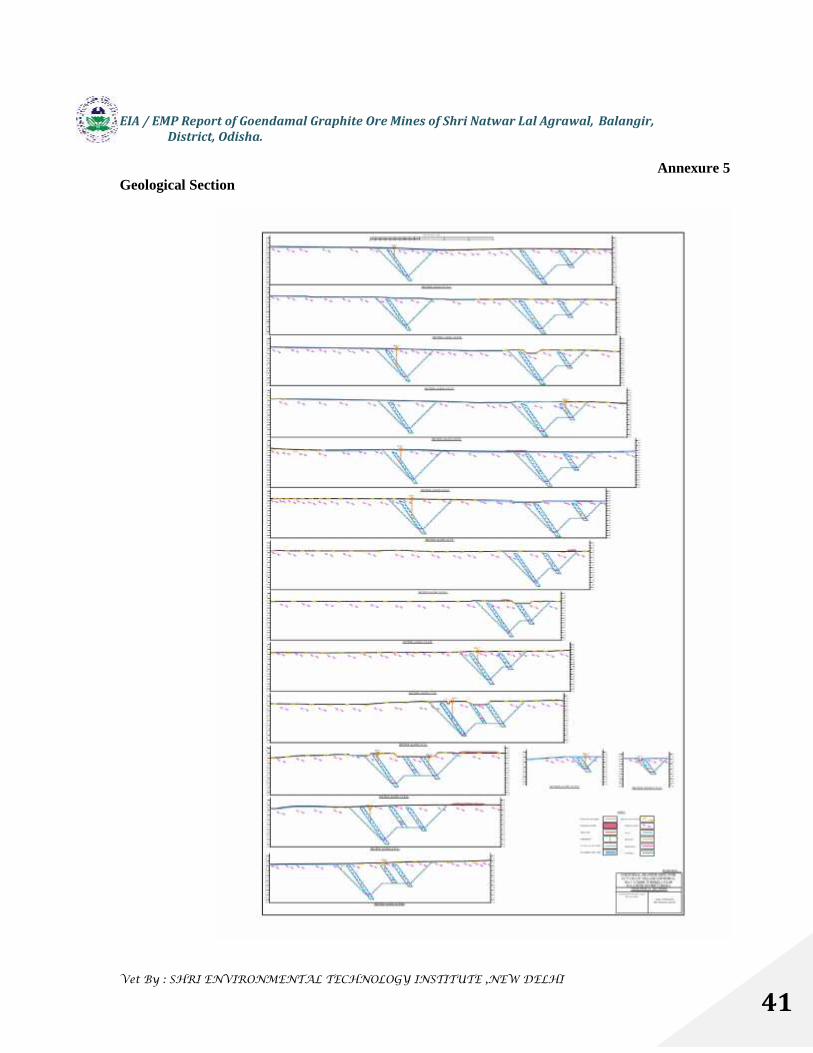
EIA / EMP Report of Goendamal Graphite Ore Mines of Shri Natwar Lal Agrawal, Balangir,District, Odisha.
Vet By : SHRI ENVIRONMENTAL TECHNOLOGY INSTITUTE ,NEW DELHI
41
Annexure 5Geological Section

EIA / EMP Report of Goendamal Graphite Ore Mines of Shri Natwar Lal Agrawal, Balangir,District, Odisha.
Vet By : SHRI ENVIRONMENTAL TECHNOLOGY INSTITUTE ,NEW DELHI
42
Annexure 6Contour map of the ML area

EIA / EMP Report of Goendamal Graphite Ore Mines of Shri Natwar Lal Agrawal, Balangir,District, Odisha.
Vet By : SHRI ENVIRONMENTAL TECHNOLOGY INSTITUTE ,NEW DELHI
43
Annexure 7GOENDAMAL COMPOSITE WIND ROSE DIAGRAMS
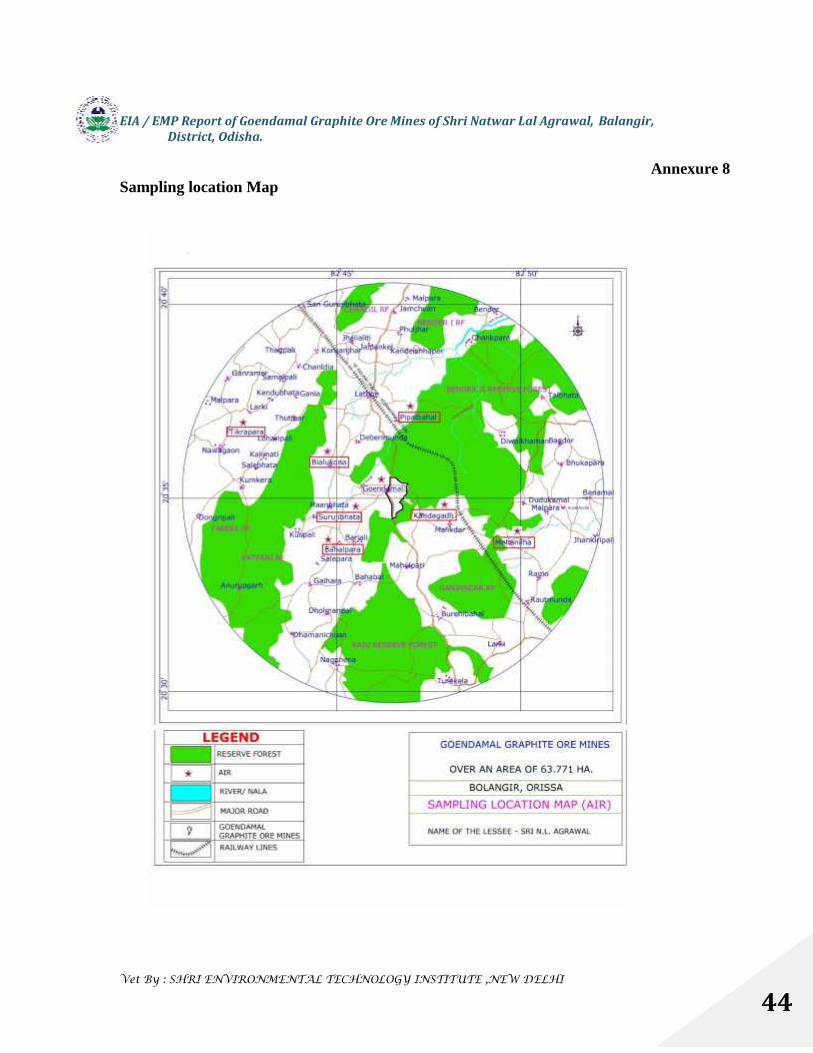
EIA / EMP Report of Goendamal Graphite Ore Mines of Shri Natwar Lal Agrawal, Balangir,District, Odisha.
Vet By : SHRI ENVIRONMENTAL TECHNOLOGY INSTITUTE ,NEW DELHI
44
Annexure 8Sampling location Map

EIA / EMP Report of Goendamal Graphite Ore Mines of Shri Natwar Lal Agrawal, Balangir,District, Odisha.
Vet By : SHRI ENVIRONMENTAL TECHNOLOGY INSTITUTE ,NEW DELHI
45
ANNEXURE - 9

EIA / EMP Report of Goendamal Graphite Ore Mines of Shri Natwar Lal Agrawal, Balangir,District, Odisha.
Vet By : SHRI ENVIRONMENTAL TECHNOLOGY INSTITUTE ,NEW DELHI
46
Annexure 10Surface Water Analysis Results
Sl. No Parameter ResultsSW1 SW2 SW3 SW4
1. Odour U/O U/O U/O U/O2. Colour, Hazen units 3 4 4 23. pH Value 6.8 7.1 6.5 6.84. Turbidity, NTU 8 18 10 10
5. Total Hardness asCaCO3,mg/l 85 73 96 80
6. Dissolved Oxygen, mg/l 5.8 6.3 6.1 6.5
7. Biochemical OxygenDemand, mg/l 3.5 3.2 2.7 1.6
8. Alkalinity as CaCO3,mg/l 71 67 84 759. Iron as Fe, mg/l 0.54 0.72 0.44 0.61
10. Chloride as Cl, mg/l 22 18 27 2011. Fluoride as F, mg/l 0.07 0.11 0.09 0.2012. Dissolved Solids, mg/l 152 202 177 21213. Calcium as Ca, mg/l 21.2 16.4 22 19.214. Magnesium as Mg, mg/l 12.8 12.8 16.4 13.115. Copper as Cu, mg/l BDL BDL BDL BDL16. Manganese as Mn, mg/l 0.02 0.018 0.035 0.01117. Sulphate as SO4,mg/l 2.5 3.88 1.54 3.2718. Phosphorous as PO4,mg/l 0.04 BDL 0.032 BDL19. Nitrate as NO3, mg/l 1.52 2.22 1.14 2.5120. Mercury, as Hg, mg/l BDL BDL BDL BDL21. Cadmium as Cd, mg/l BDL BDL BDL BDL22. Arsenic as As, mg/l BDL BDL BDL BDL23. Cyanide as CN,mg/l BDL BDL BDL BDL24. Lead as Pb, mg/l BDL BDL BDL BDL
25. Zinc as Zn, mg/l 0.03 0.072 0.112 0.04526. Chromium as Cr, mg/l BDL BDL BDL BDL27. Sodium as Na,mg/l 22 20 17 1428. Potassium as K, mg/l 3.8 5.3 3.7 4.229. Boron as B,mg/l BDL BDL BDL BDL
Ground Water Analysis Results
Sl.No
Parameter Desirable limitsas per
IS : 10500 - 2004
ResultsGW1 GW2 GW3 GW4
1 Colour, Hazen Units, 5 Colourless Colourless Colourless Colourless
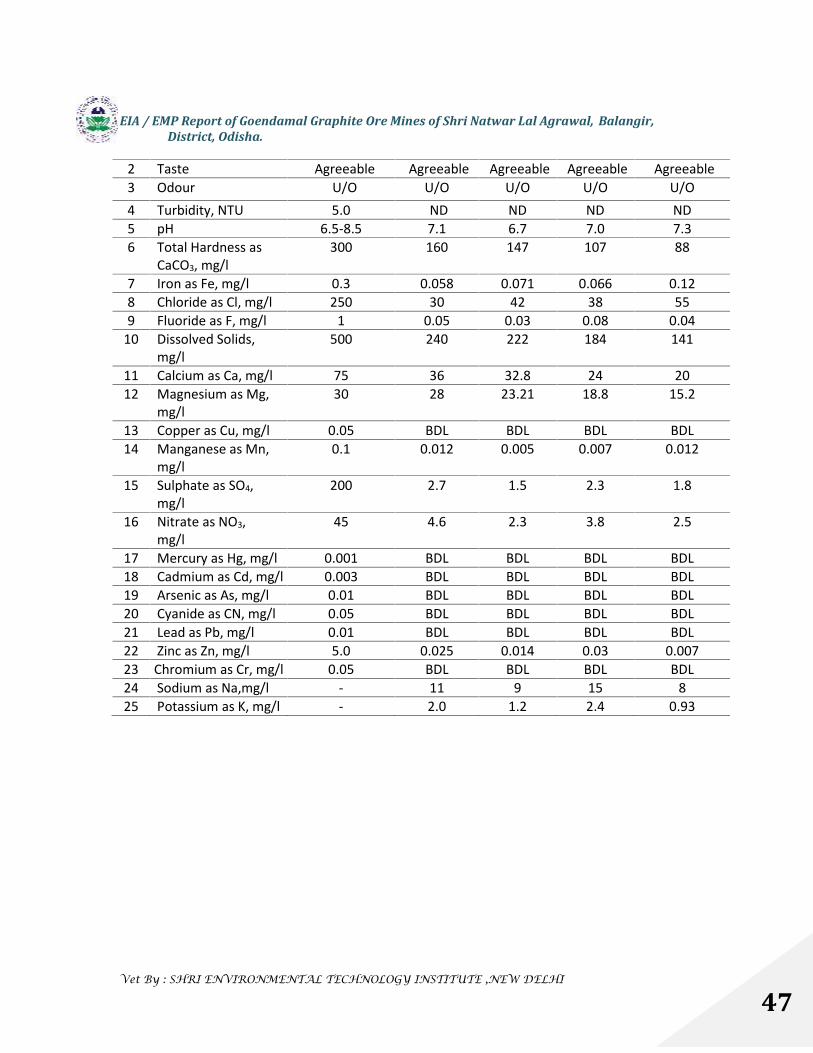
EIA / EMP Report of Goendamal Graphite Ore Mines of Shri Natwar Lal Agrawal, Balangir,District, Odisha.
Vet By : SHRI ENVIRONMENTAL TECHNOLOGY INSTITUTE ,NEW DELHI
47
2 Taste Agreeable Agreeable Agreeable Agreeable Agreeable3 Odour U/O U/O U/O U/O U/O4 Turbidity, NTU 5.0 ND ND ND ND5 pH 6.5-8.5 7.1 6.7 7.0 7.36 Total Hardness as
CaCO3, mg/l300 160 147 107 88
7 Iron as Fe, mg/l 0.3 0.058 0.071 0.066 0.128 Chloride as Cl, mg/l 250 30 42 38 559 Fluoride as F, mg/l 1 0.05 0.03 0.08 0.04
10 Dissolved Solids,mg/l
500 240 222 184 141
11 Calcium as Ca, mg/l 75 36 32.8 24 2012 Magnesium as Mg,
mg/l30 28 23.21 18.8 15.2
13 Copper as Cu, mg/l 0.05 BDL BDL BDL BDL14 Manganese as Mn,
mg/l0.1 0.012 0.005 0.007 0.012
15 Sulphate as SO4,mg/l
200 2.7 1.5 2.3 1.8
16 Nitrate as NO3,mg/l
45 4.6 2.3 3.8 2.5
17 Mercury as Hg, mg/l 0.001 BDL BDL BDL BDL18 Cadmium as Cd, mg/l 0.003 BDL BDL BDL BDL19 Arsenic as As, mg/l 0.01 BDL BDL BDL BDL20 Cyanide as CN, mg/l 0.05 BDL BDL BDL BDL21 Lead as Pb, mg/l 0.01 BDL BDL BDL BDL22 Zinc as Zn, mg/l 5.0 0.025 0.014 0.03 0.00723 Chromium as Cr, mg/l 0.05 BDL BDL BDL BDL24 Sodium as Na,mg/l - 11 9 15 825 Potassium as K, mg/l - 2.0 1.2 2.4 0.93
EIA / EMP Report of Goendamal Graphite Ore Mines of Shri Natwar Lal Agrawal, Balangir,District, Odisha.
Vet By : SHRI ENVIRONMENTAL TECHNOLOGY INSTITUTE ,NEW DELHI
48
Annexure-11HYDROGEOLOGICAL REPORTFOR GOENDAMAL GRAPHITE ORE MINES
CHAPTER 1INTRODUCTION
1.0 INTRODUCTION
Goendamal Graphite Mine is located in Goendamal village in Turekela block in Bolangir
district of Odisha State. The mining lease area spreads over an area of 63.771 hectares
(157.58 acres). The lease was executed in favour of Shri Natwarlal Agarwal on 11.05.1998 for
a period of 30 years which is valid upto 10.05.2028. Mining plan was approved under Rule of
22 of Mineral Conservation and Development Rules 1960 vide letter No. CAL/BG/Gr/MP/540
dated 18.03.1998. Shri. N.L.Agarwal started mining operation with effect from middle of
1998. Mining activity has been discontinued since October 2009 due to requirement of
Environmental clearance. The present mining scheme was prepared for the period of 2013-14
to 2017-18 and approved by Indian Bureau of Mines, vide letter no. MS/OTFM/55-
ORI/BHU/2012-13 dated 13.08.2013.
1.1 LOCATION
Goendamal Graphite Mine lease area falls under village Goendamal in Turekela block of
Bolangir district of Odisha State. The area falls in the Survey of India topo-sheet no. 64 L/14
and is bounded by North latitude 20034’07” to 20035’20” and East longitude 82046’10” to
82046’34”. The lease area spreads over 63.771 hectares non-forest are.
The lease area is approacheable from Kantabanji or Harishankar Railway Station on South-
Eastern Railway of Raipur- Vizayanagaram Section.
The location of mines is shown in fig.no.1.1 and Fig 1.2.
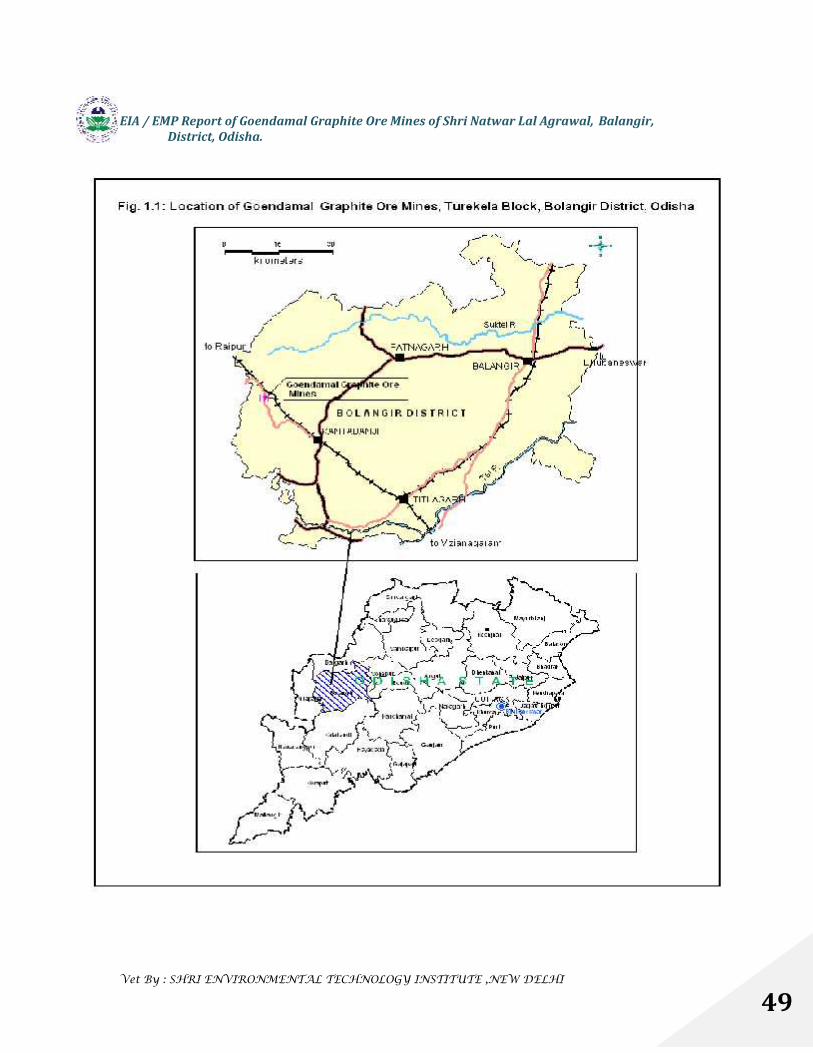
EIA / EMP Report of Goendamal Graphite Ore Mines of Shri Natwar Lal Agrawal, Balangir,District, Odisha.
Vet By : SHRI ENVIRONMENTAL TECHNOLOGY INSTITUTE ,NEW DELHI
49
EIA / EMP Report of Goendamal Graphite Ore Mines of Shri Natwar Lal Agrawal, Balangir,District, Odisha.
Vet By : SHRI ENVIRONMENTAL TECHNOLOGY INSTITUTE ,NEW DELHI
50
1.2 MINING LEASE AREA
Goendamal Graphite Ore Mining Lease area spreads over an area of 63.771 hectares of non-
forest land. The lease area is flat and undulating topography with surface elevation varies in
the range between 326 (in the north-east) and 348m.amsl in the south.(Surface Mining Plan
in plate no.1). There are 5 (five) nos. of quarries i.e. quarry no.1, 2, 3, 4, & 5 but mining will be
resumed only in quarry no.5 (Approved IBM Mining Plan in Plate no.2). Since mining has
intersected local water table, de-watering of mining pit is required for safe mining operation.
De-watering of mining seepage has been described in chapter- 9.
1.3 MINING METHODS
The method of mining is “A” OTFM Method. Benches are making with a maximum height of
3m and minimum width of 3m sloping nearly vertical with overall quarry slope at 370. The
year wise development of the quarry is shown by plan and sections in plate no. III. Existing
Quarry ( no.5) will be developed further to depth and towards south for raising ore in the
ensuring scheme period. Labours will be deployed on the face for excavation and loading
purpose. Equipments like crowbar, pickaxe, spade, chisel, hand shovel. will be used. Where
ever necessary small capacity poclainer (09 CuM) will be used for loading and transportation
purpose 15 tonne tippers will be used. Total annual production will be 15000 tonnes.
Average working days during the year will be 220 days. Average daily production is about
68.18 tonnes.
1.3.1 Dimension of Quarry
Based upon the surface geological data, the excavation planning is confined to the existing
quarry namely Quarry-5. The average annual output has been proposed to be 15000 MT of
graphite ore. The mineral will be exploited by Semi-mechanized means. The Year-wise
volume of excavation, ore recovery, generation of waste, RL of benches and stripping ration
for each year has been mentioned in the following table.
EIA / EMP Report of Goendamal Graphite Ore Mines of Shri Natwar Lal Agrawal, Balangir,District, Odisha.
Vet By : SHRI ENVIRONMENTAL TECHNOLOGY INSTITUTE ,NEW DELHI
51
1.3.2 Land-Use Pattern
Type of land use At present in Ha At the end of theScheme period in Ha
Total area at theConceptual Period in Ha
Area underexcavation
1.9 3.33 17.49
Area underdump
1.51 2.9 3.5
Mineral Storage 0.08 0.08 1.53Sub-Grade stock Nil 0.042 0.59Top-Soil Nil 0.2 0.2Infrastructure 0.1 0.1 0.1Roads 0.39 0.39 0.39Green belts 1.0 1.64 5.0Magazene 0.002 0.002 0.002Sub Total 4.982 8.684 28.802Un used area 58.789 55.087 34.969Total 63.771 63.771 63.7711.4. RESERVE
Updated category wise reserves as on 01.04.2011
Table 1.1 : Updated Reserve
Type of Reserve Geological Reserves (mt) Mineral Reserves (mt)
PROVED 935590 906277
PROBABLE 508664 216097.47
POSSIBLE 255367 -
TOTAL 1699621 1122374.47
1.5 ANTICIPATED LIFE OF THE MINES
The estimated demonstrated mineable reserve of graphite is 1122374 MT. At the average
rate of 15000 MT production as planned in this scheme the deposit will last for 75 years from
now. However, future exploration may enhance the reserve in the conceptual period.
1.6 WATER REQUIREMENT
Water is required for drinking for the labours engaged in mining operation. Water is also
required for drinking and domestic use for the permanent mining staff in the colony & office.
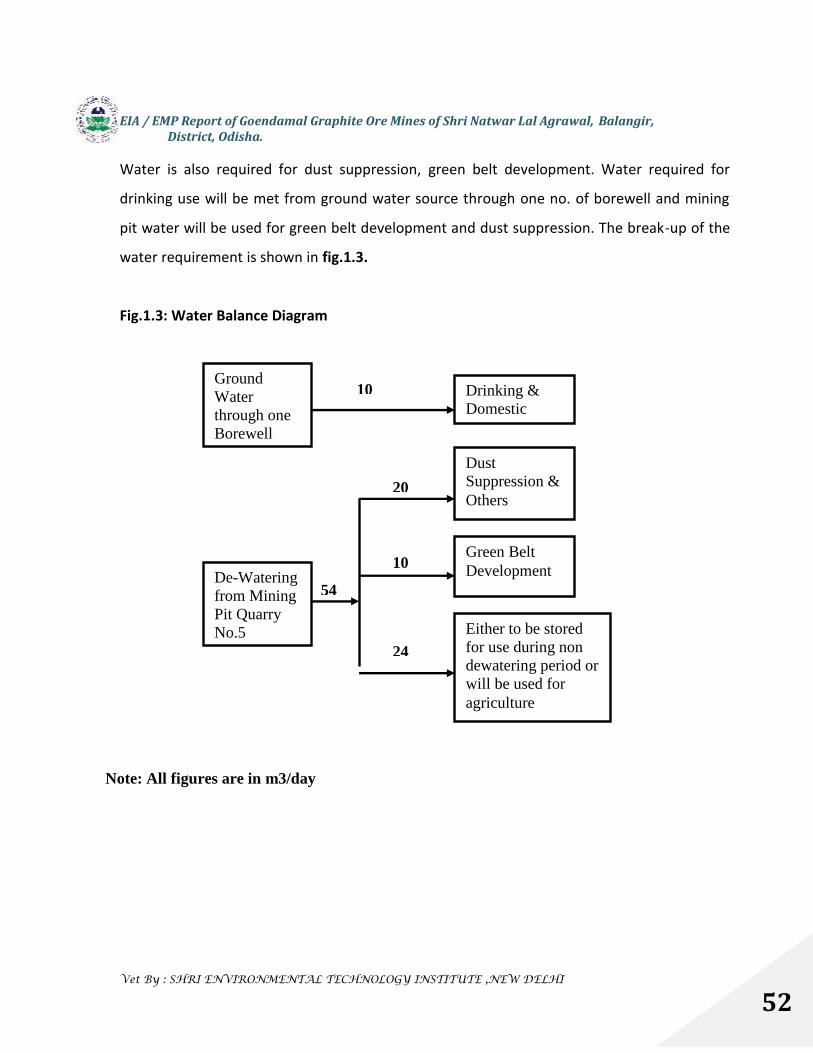
EIA / EMP Report of Goendamal Graphite Ore Mines of Shri Natwar Lal Agrawal, Balangir,District, Odisha.
Vet By : SHRI ENVIRONMENTAL TECHNOLOGY INSTITUTE ,NEW DELHI
52
Water is also required for dust suppression, green belt development. Water required for
drinking use will be met from ground water source through one no. of borewell and mining
pit water will be used for green belt development and dust suppression. The break-up of the
water requirement is shown in fig.1.3.
Fig.1.3: Water Balance Diagram
GroundWaterthrough oneBorewell
Drinking &Domestic
De-Wateringfrom MiningPit QuarryNo.5
DustSuppression &Others
Green BeltDevelopment
Either to be storedfor use during nondewatering period orwill be used foragriculture
10
54
20
10
24
Note: All figures are in m3/day
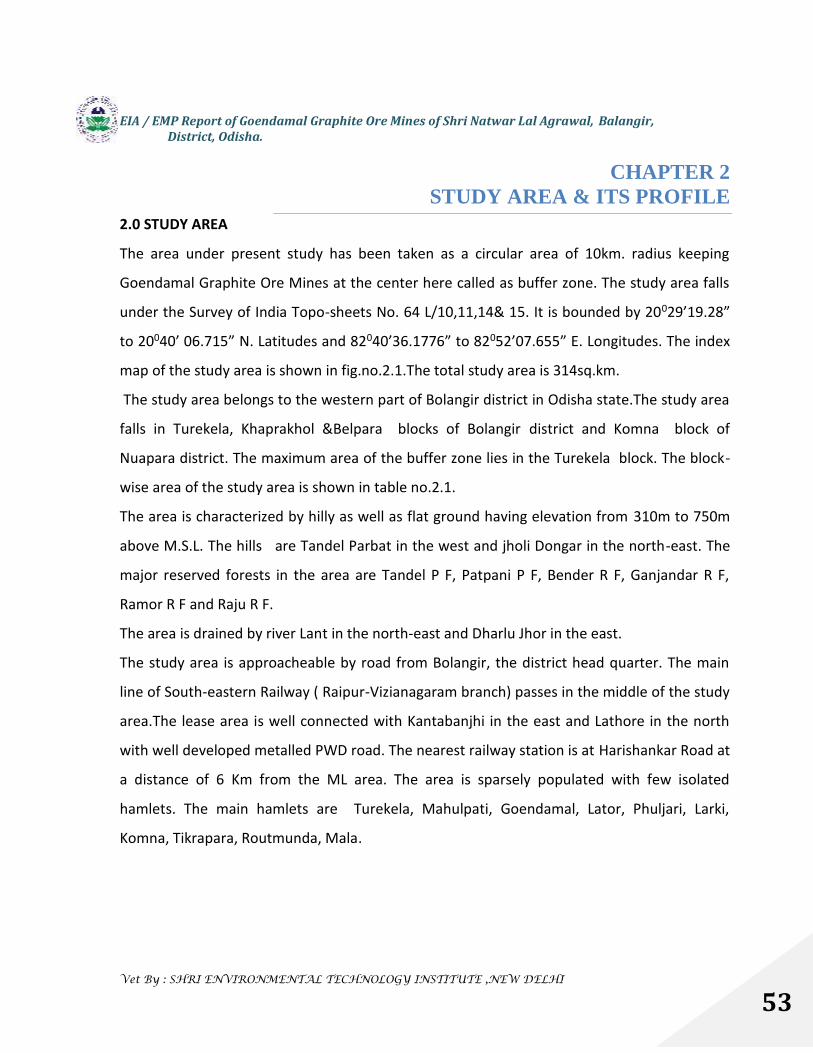
EIA / EMP Report of Goendamal Graphite Ore Mines of Shri Natwar Lal Agrawal, Balangir,District, Odisha.
Vet By : SHRI ENVIRONMENTAL TECHNOLOGY INSTITUTE ,NEW DELHI
53
CHAPTER 2STUDY AREA & ITS PROFILE
2.0 STUDY AREA
The area under present study has been taken as a circular area of 10km. radius keeping
Goendamal Graphite Ore Mines at the center here called as buffer zone. The study area falls
under the Survey of India Topo-sheets No. 64 L/10,11,14& 15. It is bounded by 20029’19.28”
to 20040’ 06.715” N. Latitudes and 82040’36.1776” to 82052’07.655” E. Longitudes. The index
map of the study area is shown in fig.no.2.1.The total study area is 314sq.km.
The study area belongs to the western part of Bolangir district in Odisha state.The study area
falls in Turekela, Khaprakhol &Belpara blocks of Bolangir district and Komna block of
Nuapara district. The maximum area of the buffer zone lies in the Turekela block. The block-
wise area of the study area is shown in table no.2.1.
The area is characterized by hilly as well as flat ground having elevation from 310m to 750m
above M.S.L. The hills are Tandel Parbat in the west and jholi Dongar in the north-east. The
major reserved forests in the area are Tandel P F, Patpani P F, Bender R F, Ganjandar R F,
Ramor R F and Raju R F.
The area is drained by river Lant in the north-east and Dharlu Jhor in the east.
The study area is approacheable by road from Bolangir, the district head quarter. The main
line of South-eastern Railway ( Raipur-Vizianagaram branch) passes in the middle of the study
area.The lease area is well connected with Kantabanjhi in the east and Lathore in the north
with well developed metalled PWD road. The nearest railway station is at Harishankar Road at
a distance of 6 Km from the ML area. The area is sparsely populated with few isolated
hamlets. The main hamlets are Turekela, Mahulpati, Goendamal, Lator, Phuljari, Larki,
Komna, Tikrapara, Routmunda, Mala.

EIA / EMP Report of Goendamal Graphite Ore Mines of Shri Natwar Lal Agrawal, Balangir,District, Odisha.
Vet By : SHRI ENVIRONMENTAL TECHNOLOGY INSTITUTE ,NEW DELHI
54
Fig.2.1 Sketch Map of the Area
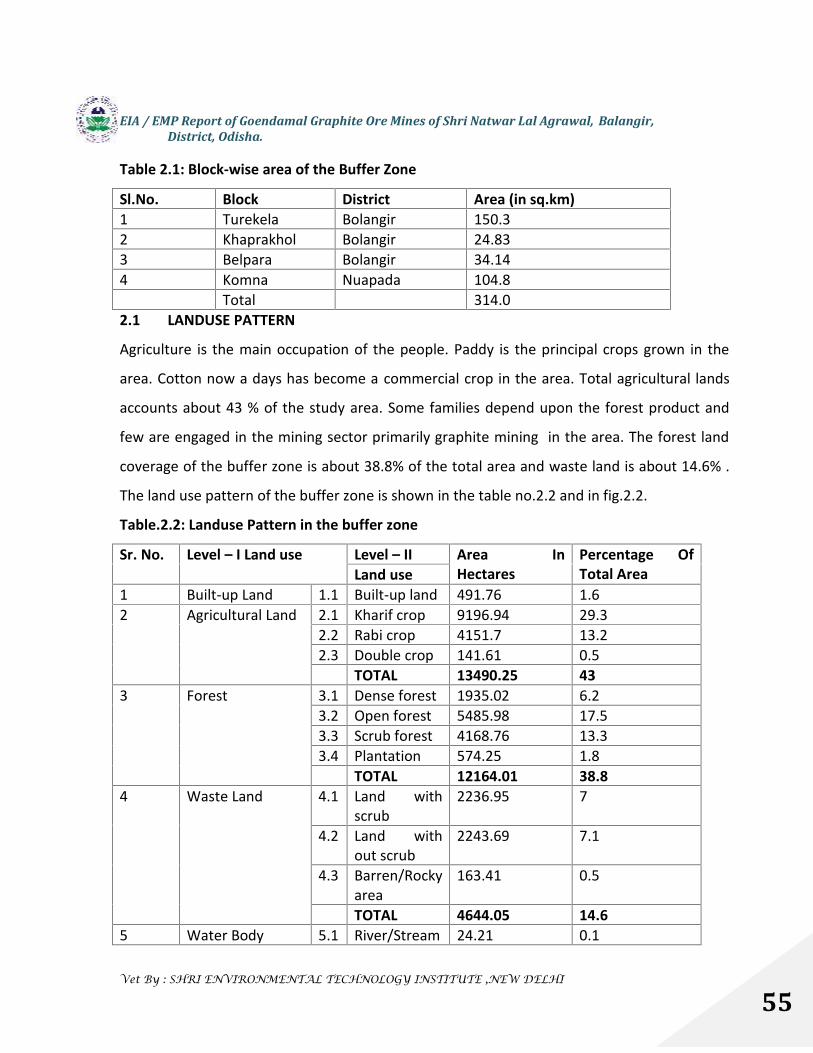
EIA / EMP Report of Goendamal Graphite Ore Mines of Shri Natwar Lal Agrawal, Balangir,District, Odisha.
Vet By : SHRI ENVIRONMENTAL TECHNOLOGY INSTITUTE ,NEW DELHI
55
Table 2.1: Block-wise area of the Buffer Zone
Sl.No. Block District Area (in sq.km)1 Turekela Bolangir 150.32 Khaprakhol Bolangir 24.833 Belpara Bolangir 34.144 Komna Nuapada 104.8
Total 314.02.1 LANDUSE PATTERN
Agriculture is the main occupation of the people. Paddy is the principal crops grown in the
area. Cotton now a days has become a commercial crop in the area. Total agricultural lands
accounts about 43 % of the study area. Some families depend upon the forest product and
few are engaged in the mining sector primarily graphite mining in the area. The forest land
coverage of the buffer zone is about 38.8% of the total area and waste land is about 14.6% .
The land use pattern of the buffer zone is shown in the table no.2.2 and in fig.2.2.
Table.2.2: Landuse Pattern in the buffer zone
Sr. No. Level – I Land use Level – II Area InHectares
Percentage OfTotal AreaLand use
1 Built-up Land 1.1 Built-up land 491.76 1.62 Agricultural Land 2.1 Kharif crop 9196.94 29.3
2.2 Rabi crop 4151.7 13.22.3 Double crop 141.61 0.5
TOTAL 13490.25 433 Forest 3.1 Dense forest 1935.02 6.2
3.2 Open forest 5485.98 17.53.3 Scrub forest 4168.76 13.33.4 Plantation 574.25 1.8
TOTAL 12164.01 38.84 Waste Land 4.1 Land with
scrub2236.95 7
4.2 Land without scrub
2243.69 7.1
4.3 Barren/Rockyarea
163.41 0.5
TOTAL 4644.05 14.65 Water Body 5.1 River/Stream 24.21 0.1

EIA / EMP Report of Goendamal Graphite Ore Mines of Shri Natwar Lal Agrawal, Balangir,District, Odisha.
Vet By : SHRI ENVIRONMENTAL TECHNOLOGY INSTITUTE ,NEW DELHI
56
5.2 Lake/ Tank/Reservoir
516.54 1.6
6 Others 6.1 Quarry/mining area
84.7 0.3
TOTAL 31415.51 1002.2 SOCIOECONOMIC PROFILE OF THE STUDY AREA
Socio-economic survey in the study area has been carried out to assess the status of
demographic pattern, cropping pattern and general amenities available based on the Census
2001, secondary information available with different government agencies and survey. To
study the socio economic status of the population within the buffer zone around the project
is being taken into account. The buffer zone includes the villages around the 10 km radius of
the project area. There are around 50 habitations present within the buffer zone of the study
area. The details of the village status, demographic profile and socio economic status of the
people within the project area and study area are given in the table 2.3 & 2.4.
Table 2.3 :Demographic pattern of the study area
Particulars Within the project site Within 1 km from theproject boundary
Population Nil 574No. of villages Nil 1Number of householdsVillage-wise
Nil 147
Table 2.4 : Populations & Occupational PatternSl.No.
Demographic Feature Study area Share in TotalPopulation (%)
Core Zone Buffer Zone1 Number of Villages Nil 50 --2 Total area in hectare Nil 63.771 --3 Total No. of households Nil 8859 --
4 Total population Nil 37635 --5 Total male population Nil 18996 50.476 Total female population Nil 18639 49.527 Density of population
(persons per sq.km)Nil 209 --
8 Sex ratio (No. of females Nil 981 --
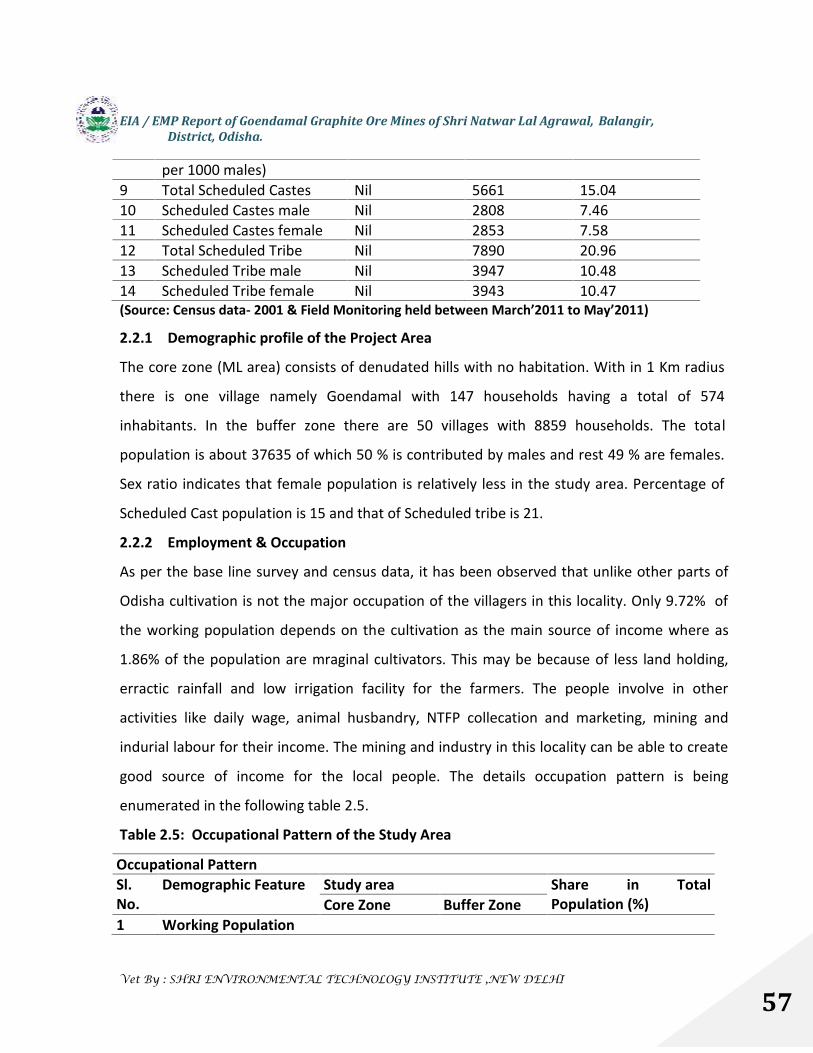
EIA / EMP Report of Goendamal Graphite Ore Mines of Shri Natwar Lal Agrawal, Balangir,District, Odisha.
Vet By : SHRI ENVIRONMENTAL TECHNOLOGY INSTITUTE ,NEW DELHI
57
per 1000 males)9 Total Scheduled Castes Nil 5661 15.0410 Scheduled Castes male Nil 2808 7.4611 Scheduled Castes female Nil 2853 7.5812 Total Scheduled Tribe Nil 7890 20.9613 Scheduled Tribe male Nil 3947 10.4814 Scheduled Tribe female Nil 3943 10.47(Source: Census data- 2001 & Field Monitoring held between March’2011 to May’2011)
2.2.1 Demographic profile of the Project Area
The core zone (ML area) consists of denudated hills with no habitation. With in 1 Km radius
there is one village namely Goendamal with 147 households having a total of 574
inhabitants. In the buffer zone there are 50 villages with 8859 households. The total
population is about 37635 of which 50 % is contributed by males and rest 49 % are females.
Sex ratio indicates that female population is relatively less in the study area. Percentage of
Scheduled Cast population is 15 and that of Scheduled tribe is 21.
2.2.2 Employment & Occupation
As per the base line survey and census data, it has been observed that unlike other parts of
Odisha cultivation is not the major occupation of the villagers in this locality. Only 9.72% of
the working population depends on the cultivation as the main source of income where as
1.86% of the population are mraginal cultivators. This may be because of less land holding,
erractic rainfall and low irrigation facility for the farmers. The people involve in other
activities like daily wage, animal husbandry, NTFP collecation and marketing, mining and
indurial labour for their income. The mining and industry in this locality can be able to create
good source of income for the local people. The details occupation pattern is being
enumerated in the following table 2.5.
Table 2.5: Occupational Pattern of the Study Area
Occupational PatternSl.No.
Demographic Feature Study area Share in TotalPopulation (%)Core Zone Buffer Zone
1 Working Population
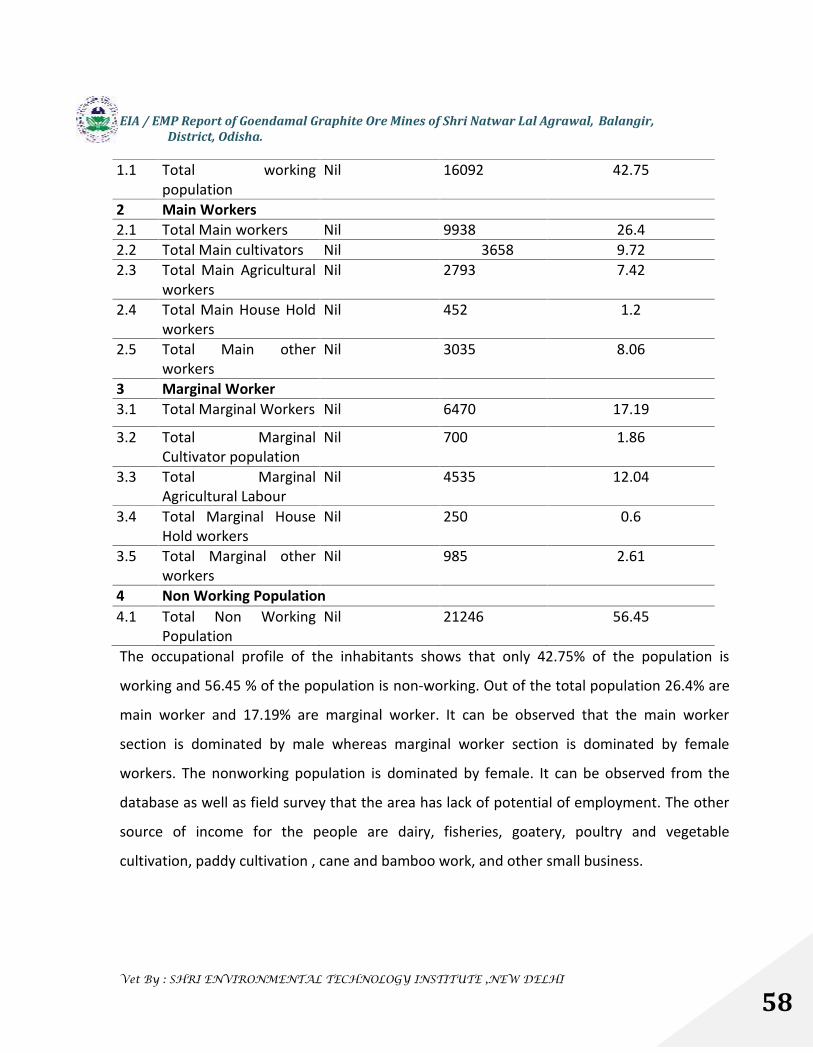
EIA / EMP Report of Goendamal Graphite Ore Mines of Shri Natwar Lal Agrawal, Balangir,District, Odisha.
Vet By : SHRI ENVIRONMENTAL TECHNOLOGY INSTITUTE ,NEW DELHI
58
1.1 Total workingpopulation
Nil 16092 42.75
2 Main Workers2.1 Total Main workers Nil 9938 26.42.2 Total Main cultivators Nil 3658 9.722.3 Total Main Agricultural
workersNil 2793 7.42
2.4 Total Main House Holdworkers
Nil 452 1.2
2.5 Total Main otherworkers
Nil 3035 8.06
3 Marginal Worker3.1 Total Marginal Workers Nil 6470 17.19
3.2 Total MarginalCultivator population
Nil 700 1.86
3.3 Total MarginalAgricultural Labour
Nil 4535 12.04
3.4 Total Marginal HouseHold workers
Nil 250 0.6
3.5 Total Marginal otherworkers
Nil 985 2.61
4 Non Working Population4.1 Total Non Working
PopulationNil 21246 56.45
The occupational profile of the inhabitants shows that only 42.75% of the population is
working and 56.45 % of the population is non-working. Out of the total population 26.4% are
main worker and 17.19% are marginal worker. It can be observed that the main worker
section is dominated by male whereas marginal worker section is dominated by female
workers. The nonworking population is dominated by female. It can be observed from the
database as well as field survey that the area has lack of potential of employment. The other
source of income for the people are dairy, fisheries, goatery, poultry and vegetable
cultivation, paddy cultivation , cane and bamboo work, and other small business.
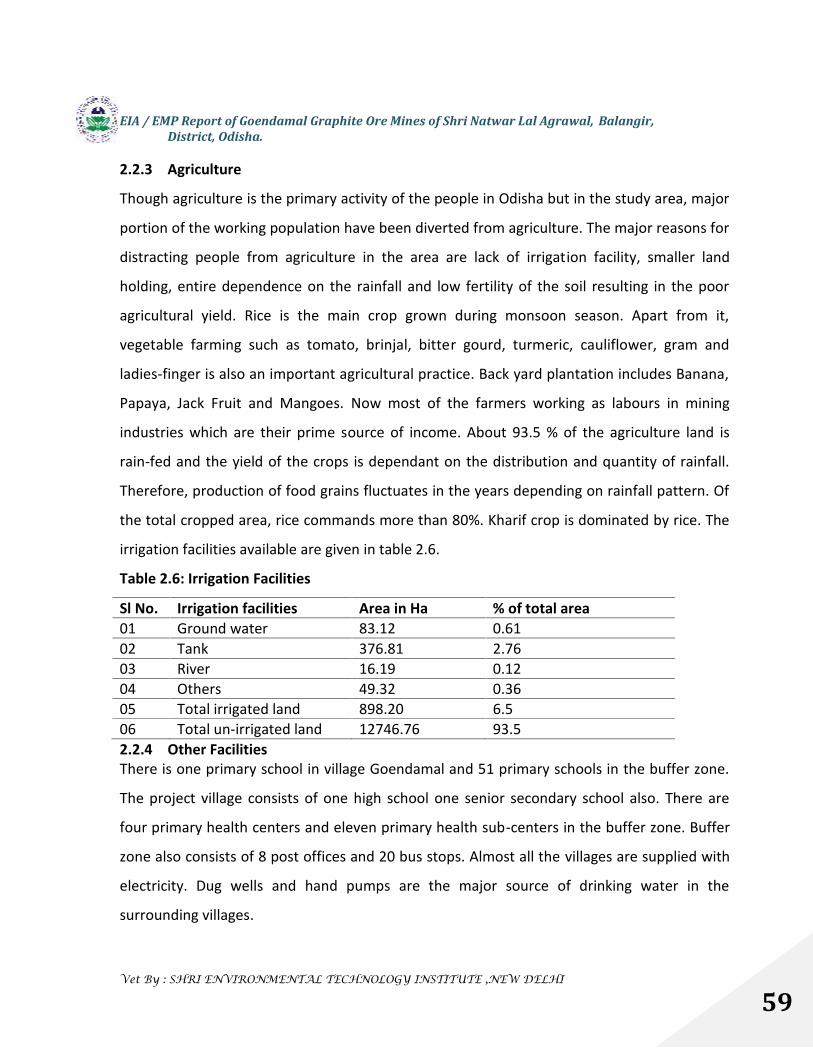
EIA / EMP Report of Goendamal Graphite Ore Mines of Shri Natwar Lal Agrawal, Balangir,District, Odisha.
Vet By : SHRI ENVIRONMENTAL TECHNOLOGY INSTITUTE ,NEW DELHI
59
2.2.3 Agriculture
Though agriculture is the primary activity of the people in Odisha but in the study area, major
portion of the working population have been diverted from agriculture. The major reasons for
distracting people from agriculture in the area are lack of irrigation facility, smaller land
holding, entire dependence on the rainfall and low fertility of the soil resulting in the poor
agricultural yield. Rice is the main crop grown during monsoon season. Apart from it,
vegetable farming such as tomato, brinjal, bitter gourd, turmeric, cauliflower, gram and
ladies-finger is also an important agricultural practice. Back yard plantation includes Banana,
Papaya, Jack Fruit and Mangoes. Now most of the farmers working as labours in mining
industries which are their prime source of income. About 93.5 % of the agriculture land is
rain-fed and the yield of the crops is dependant on the distribution and quantity of rainfall.
Therefore, production of food grains fluctuates in the years depending on rainfall pattern. Of
the total cropped area, rice commands more than 80%. Kharif crop is dominated by rice. The
irrigation facilities available are given in table 2.6.
Table 2.6: Irrigation Facilities
Sl No. Irrigation facilities Area in Ha % of total area01 Ground water 83.12 0.6102 Tank 376.81 2.7603 River 16.19 0.1204 Others 49.32 0.3605 Total irrigated land 898.20 6.506 Total un-irrigated land 12746.76 93.52.2.4 Other FacilitiesThere is one primary school in village Goendamal and 51 primary schools in the buffer zone.
The project village consists of one high school one senior secondary school also. There are
four primary health centers and eleven primary health sub-centers in the buffer zone. Buffer
zone also consists of 8 post offices and 20 bus stops. Almost all the villages are supplied with
electricity. Dug wells and hand pumps are the major source of drinking water in the
surrounding villages.

EIA / EMP Report of Goendamal Graphite Ore Mines of Shri Natwar Lal Agrawal, Balangir,District, Odisha.
Vet By : SHRI ENVIRONMENTAL TECHNOLOGY INSTITUTE ,NEW DELHI
60
Fig.2.2: Land use map
EIA / EMP Report of Goendamal Graphite Ore Mines of Shri Natwar Lal Agrawal, Balangir,District, Odisha.
Vet By : SHRI ENVIRONMENTAL TECHNOLOGY INSTITUTE ,NEW DELHI
61
CHAPTER 3CLIMATE
The study area experiences a tropical climate with a hot and dry summer and pleasant winter
intervened by south-west monsoon season. The summer season extends from March to
middle of June followed by rainy season from mid-June to mid-October. The winter season
extends from November till the end of February.
3.1 TEMPERATURE
The temperature in the study area starts rising from March to May, which is the hottest
month of the year with mean daily maximum temperature 43oC. However in 2005 June was
the hottest month with a maximum temperature of 48oC. With the advent of monsoon,
temperature starts reducing and the winter season starts from November. December is the
coldest month of the year with mean daily maximum temperature of about 27oC and the
temperature coming down to a minimum of about 6oC.
3.2 HUMIDITY AND WIND
Humidity of the air is generally high during south-west monsoon period and low during winter
months. The relative humidity varies from 26% to 84% throughout the year. The mean
monthly potential evapo-transpiration value ranges from 4mm in December to 470mm in
May.
Wind is generally light to moderate. Wind velocity increases during summer and south-west
monsoon months. The mean annual wind speed is 3.3km/hr.
3.3 RAINFALL
The south-west monsoon is the principal source of precipitation in the study area. The
average annual rainfall of the study area is 1193 mm (2004-2012). About 80% of the total
rainfall is received during the period from June to September. Droughts are quite common in
the study area. The average number of rainy days in a year with rainfall of 2.5mm or more is
about 67.

EIA / EMP Report of Goendamal Graphite Ore Mines of Shri Natwar Lal Agrawal, Balangir,District, Odisha.
Vet By : SHRI ENVIRONMENTAL TECHNOLOGY INSTITUTE ,NEW DELHI
62
Fig 3.1: Av.Monthly Rainfall in Turekela Block, Bolangir District
0
50
100
150
200
250
300
350
400
J F M A M J J A S O N D
month
Rai
nfal
l in
mm
Fig 3.2: Annual Rainfall in Turekela Block, Bolangir District
0
200
400
600
800
1000
1200
1400
1600
1800
2004 2005 2006 2007 2008 2009 2010 2011 2012
Year
Rain
fall
in
mm
Table.3.1: Monthly Rainfall in Turekela Block, Bolangir District, Odisha
Month/Year
J F M A M J J A S O N D TOTAL
2004 0 0 0 0 0 215 216.8 248.4 99.1 67 0 0 846.32005 66 9 0 0 0 147 320 93.2 233.3 0 0 0 868.52006 0 0 39 0 42.6 62 428.1 460.2 118 0 0 0 1149.92007 0 5 0 6 0 130.5 258 231.4 296.3 2.5 0 0 929.72008 0 4 0 4 0 175 223 445 411 7 0 0 12692009 0 0 0 0 5 81 716 610.3 92 4.5 34 0 1542.82010 35.2 0 0 0 34.5 73.3 627.1 290 243.5 64 6 53 1426.62011 13 16.5 0 43 27 186.4 101 272 319.6 0 0 0 978.52012 0 0 0 0 0 88 223 205 251 50 13 0 830Av. 12.69 3.83 4.33 5.89 12.12 128.69 345.89 317.28 229.31 21.67 5.89 5.89 1093.48
EIA / EMP Report of Goendamal Graphite Ore Mines of Shri Natwar Lal Agrawal, Balangir,District, Odisha.
Vet By : SHRI ENVIRONMENTAL TECHNOLOGY INSTITUTE ,NEW DELHI
63
CHAPTER 4HYDRO-GEOMORPHOLOGY
4.0 GEO MORPHOLOGICAL FEATURESGeomorphic features of an area control the occurrence and movement of ground water.Satellite remote sensing is being widely used for assessment of natural resources due to itssynoptic coverage. A hydro-geomorphological map of 10km radius buffer zone of the projectsite has been prepared through interpretation of remote sensing data along with field groundchecking. The map shows presence of the following hydro-geomorphic units.Structural HillThese are linear to arcuate hills showing definite trend lines. These are associated withfolding, faulting. Around 25% of the study area is covered with structural hills mostly in south-western part of the area in patches in the east and north. The average elevation of the hillranges varies in between 300 and 750 mamsl. The hills are comprises of granite gneisses andkhondalite of the Eastern Ghat Super Group of. High surface elevation with moderate to steepslope and nature of rock surface facilitate fast surface runoff and possibility of rainfallinfiltration is poor. From ground water resources potential view, these are have poorresource.Denudational HillThis is formed due to differential erosion and weathering so that a more resistant formationor intrusion stand as mountains or hills. These are commonly seen on the south-eastern partof the study area.Residual HillsThese are residual masses left out after prolonged weathering and denudation. In the studyarea these occur as few patches in the south. They are less dissected and non-oriented.Linear RidgeThese are linear, narrow with high relief. The trend of the ridge is in NE-SW direction. Thereoccur as small patches in the eastern part of the study area. Ground water potential of thesearea is poor.PedimentsThis is the landform characterized by gently slopping smooth surface of erosional bedrockbetween hill and plain with thin cover of soil. They occur in the north of the study area.PediplainThese are the coalescence of several pediments marked by a large area with varying lithologywith low relief. The unit occurs as largest area in the buffer zone occupying around 30% of thetotal area. Ground water potential is moderate to good.
EIA / EMP Report of Goendamal Graphite Ore Mines of Shri Natwar Lal Agrawal, Balangir,District, Odisha.
Vet By : SHRI ENVIRONMENTAL TECHNOLOGY INSTITUTE ,NEW DELHI
64
Valley FillThese constitute colluvial deposits of varying lithology. These are in fact broad depressionsbetween mountains normally filled with colluvial deposits,The geomorphic units are shown in fig.no.4.1.4.1 DRAINAGEThe drainage pattern of the area is controlled by underlying geological formation andstructural features such as surface elevation, strike, folds, faults and lineaments. There aretwo major streams in the area i.e. Lant nadi and Dharlu Jhor. The Lant nadi flows in the south-east to north-east. The nadi gets its maximum flow from the central region. The Dharlu jhorflows east ward. It gets its maximum discharge from the eastern region.The drainage lines exhibits in the buffer area are in subdendritic to subparallel pattern.Though the streams and rivers in the area are controlled by the lithology and structure, slopeplays an important role in controlling the direction of flow. The drainage density variesthroughout the area with high diversity in the hilly region and low drainage density in theplains. Some of the streams are perennial in nature. But the lower order channels areephemeral.The drainage in the area is shown in fig.no.4.2
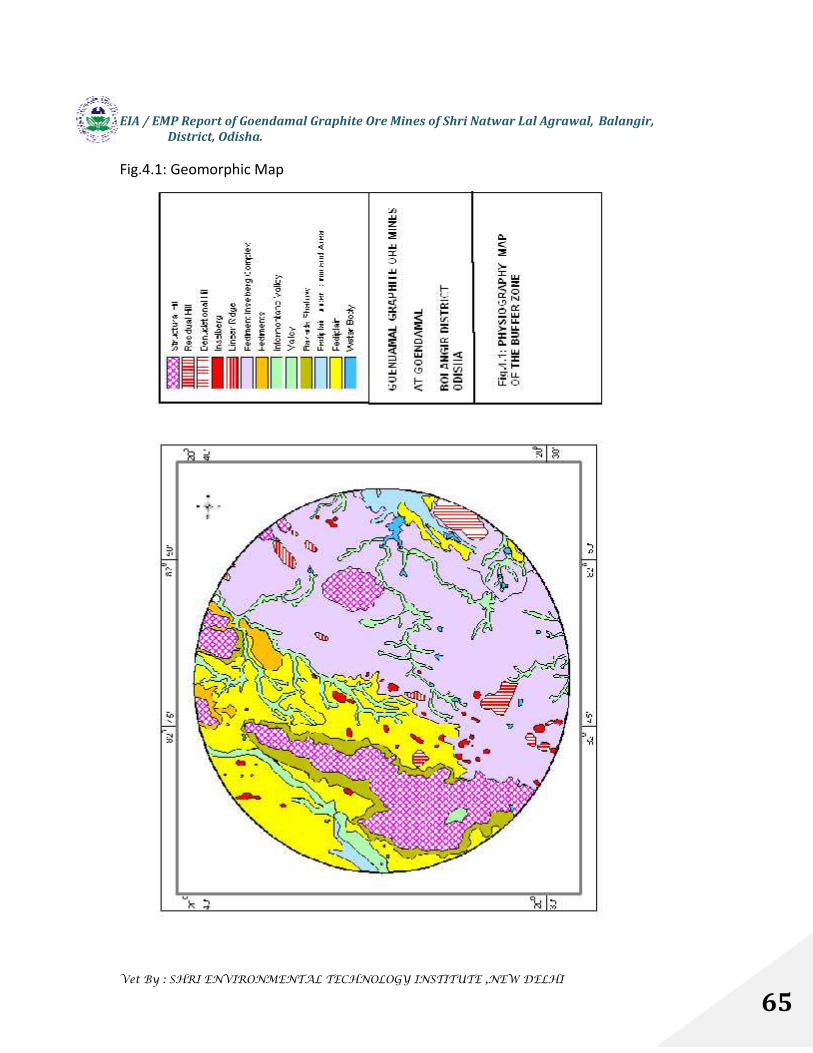
EIA / EMP Report of Goendamal Graphite Ore Mines of Shri Natwar Lal Agrawal, Balangir,District, Odisha.
Vet By : SHRI ENVIRONMENTAL TECHNOLOGY INSTITUTE ,NEW DELHI
65
Fig.4.1: Geomorphic Map
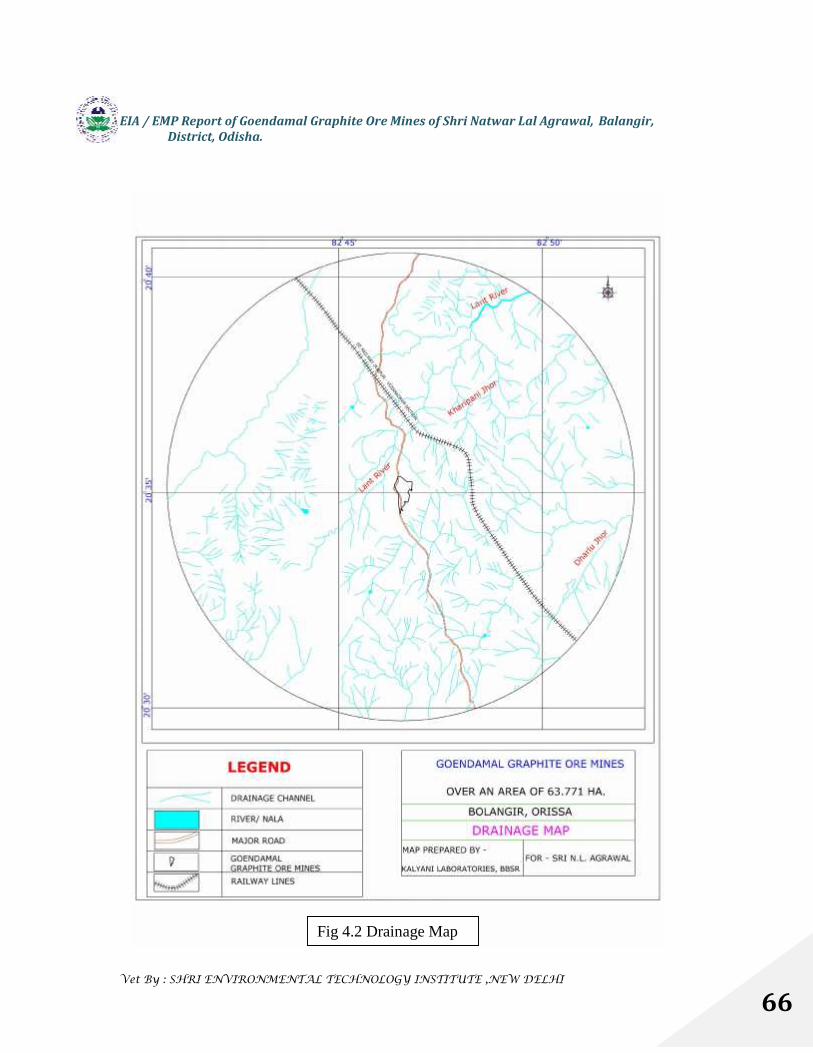
EIA / EMP Report of Goendamal Graphite Ore Mines of Shri Natwar Lal Agrawal, Balangir,District, Odisha.
Vet By : SHRI ENVIRONMENTAL TECHNOLOGY INSTITUTE ,NEW DELHI
66
Fig 4.2 Drainage Map
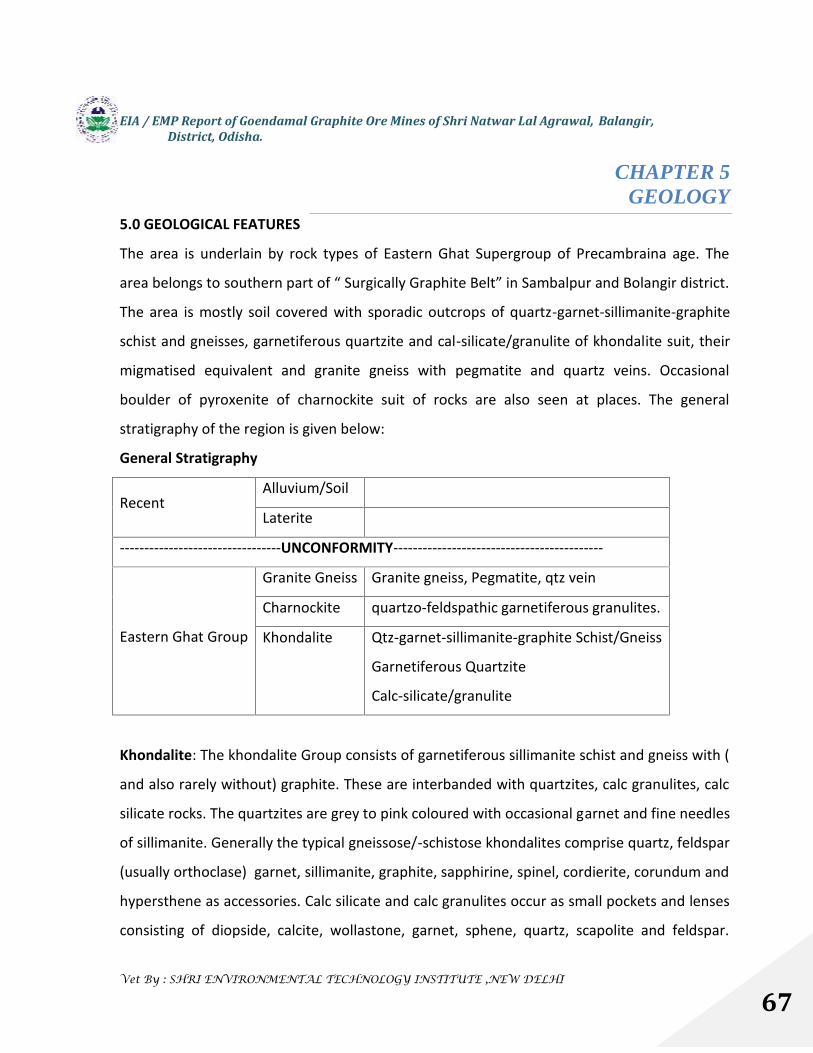
EIA / EMP Report of Goendamal Graphite Ore Mines of Shri Natwar Lal Agrawal, Balangir,District, Odisha.
Vet By : SHRI ENVIRONMENTAL TECHNOLOGY INSTITUTE ,NEW DELHI
67
CHAPTER 5GEOLOGY
5.0 GEOLOGICAL FEATURES
The area is underlain by rock types of Eastern Ghat Supergroup of Precambraina age. The
area belongs to southern part of “ Surgically Graphite Belt” in Sambalpur and Bolangir district.
The area is mostly soil covered with sporadic outcrops of quartz-garnet-sillimanite-graphite
schist and gneisses, garnetiferous quartzite and cal-silicate/granulite of khondalite suit, their
migmatised equivalent and granite gneiss with pegmatite and quartz veins. Occasional
boulder of pyroxenite of charnockite suit of rocks are also seen at places. The general
stratigraphy of the region is given below:
General Stratigraphy
RecentAlluvium/Soil
Laterite
---------------------------------UNCONFORMITY-------------------------------------------
Eastern Ghat Group
Granite Gneiss Granite gneiss, Pegmatite, qtz vein
Charnockite quartzo-feldspathic garnetiferous granulites.
Khondalite Qtz-garnet-sillimanite-graphite Schist/Gneiss
Garnetiferous Quartzite
Calc-silicate/granulite
Khondalite: The khondalite Group consists of garnetiferous sillimanite schist and gneiss with (
and also rarely without) graphite. These are interbanded with quartzites, calc granulites, calc
silicate rocks. The quartzites are grey to pink coloured with occasional garnet and fine needles
of sillimanite. Generally the typical gneissose/-schistose khondalites comprise quartz, feldspar
(usually orthoclase) garnet, sillimanite, graphite, sapphirine, spinel, cordierite, corundum and
hypersthene as accessories. Calc silicate and calc granulites occur as small pockets and lenses
consisting of diopside, calcite, wollastone, garnet, sphene, quartz, scapolite and feldspar.

EIA / EMP Report of Goendamal Graphite Ore Mines of Shri Natwar Lal Agrawal, Balangir,District, Odisha.
Vet By : SHRI ENVIRONMENTAL TECHNOLOGY INSTITUTE ,NEW DELHI
68
These calc rocks are characterized by ribbed weathering with grooves and furrows. The
leptynites including the granite gneiss occur usually as bands along the contact regions of
khondalites with Charnockites and granite gneiss. Leptynites are foliated quartz-feldspar –
garnet rocks with occasional biotite and minor hypersthene with drawn out streaks of quartz
typical of leptynite.. It is felt by some workers that Charnockites are migmatized into
leptynites along well developed bands, streaks and lenses.
Charnockite Group
The charnockite Group is represented by acid/intermediate and basic varieties with rare
exceptions of ultrabasic type. Acid and intermediate types are ubiquitous in occurrence with
considerable variation in the mineralogical variation and form hill ranges aligned parallel to
the foliation of khondalites and also occur as small mounds and hillocks within the gneissic
country. These are generally hypersthene bearing quartzo-feldspathic garnetiferous
granulites. The basic Charnockites or pyroxene granulites are less common and occur as
bands, streaks and lenses of various dimensions conformably with the khondalites. At many
places this basic variety occurs also as inclusions in acid/intermediate variety. Previously, it
was thought that these Charnockites represent the original mafic igneous rocks occurring
either as sills or flows, metamorphosed into mafic granulites along with the surrounding
sediments as evidenced from swerving of foliations of the khondalites around them, ophitic
to subophitic texture, bouldery nature and prismatic fracturing. But diverse opinion was also
put forward regarding this origin.
Granite Gneisses
Granite gneisses vary from syntectonic medium grained, grey granite gneiss, migmatite,
augen gneiss to porphyroblastic gneiss. The gneissic variety is rich in biotite and essentially
contains garnet and show effect of contact metamorphism with khondalites with formation of
spinel and corundum at the contact. The porphyroblastic type is rather limited in occurrence.
Discordant and concordant bodies of pegmatite and vein quartz traverse the gneissic country
.

EIA / EMP Report of Goendamal Graphite Ore Mines of Shri Natwar Lal Agrawal, Balangir,District, Odisha.
Vet By : SHRI ENVIRONMENTAL TECHNOLOGY INSTITUTE ,NEW DELHI
69
5.1 RECENT
The quaternary formations include laterite and alluvium. Laterites occur as capping over the
khondalite suites in the hill ranges and also over the granites and granite gneisses in the
valleys and pediment areas. The alluvium comprises sand silt and clay occurs in the close
vicinity of the major drainage channels. A thin sheet of laterites ranging in thickness to a
maximum of about 1.5m is observed in sporadic patches. These are porous and hence aid
percolation to ground water.
5.2 LOCAL GEOLOGY
On the basis of trial pits it is inferred that there are three nos. of narrow bands of khondalite
schist sand-witched between khondalite migmatite. The overall trend of this schist is N300 S
and dip is around 160 in the direction of S600E.
Graphite occurs as disseminated flakes or as segregated veins or pockets in the schist. All
along the strike continuity of the schist, the graphite concentration varies owing to its nature
of occurrence and it is at places concentrated enough to become economically viable for
exploitation. Studies reveal the local litho stratigraphy as follows:
- Soil
- Laterite
- Pegmatite/Quartz Veins
- Khondalite Migmatite
- Graphite bearing feldspathic schist (khondalite)

EIA / EMP Report of Goendamal Graphite Ore Mines of Shri Natwar Lal Agrawal, Balangir,District, Odisha.
Vet By : SHRI ENVIRONMENTAL TECHNOLOGY INSTITUTE ,NEW DELHI
70
Fig.5.1: Geology Map

EIA / EMP Report of Goendamal Graphite Ore Mines of Shri Natwar Lal Agrawal, Balangir,District, Odisha.
Vet By : SHRI ENVIRONMENTAL TECHNOLOGY INSTITUTE ,NEW DELHI
71
CHAPTER 6
AQUIFER SYSTEM
6.0 HYDROGEOLOGY
The study area is underlain by varied rock types with wide variation in hydrogeological
characteristics. Depending upon the characteristics the area is classified broadly into two
hydrogeological units.
Consolidated formations
Unconsolidated formations
6.1 CONSOLIDATED FORMATIONS
Rock types of Eastern Ghat Super Group constitute the consolidated formations. These rocks
are devoid of primary porosity and are usually very hard and compact in nature. The
secondary porosity in the consolidated formations developed as a result of weathering which
is limited to few meters from surface. Secondary porosity also developed in the form of
fracturing due to major and minor tectonic movement. The fractures form the conduits for
movement of groundwater as also act as reservoir of groundwater. This fractured and jointed
rocks when interconnected form potential aquifers, which sustain limited to moderate yield.
Groundwater occurs under water table conditions in the weathered residuum while it occurs
under semi-confined to confined conditions in the fractured and jointed rocks. The
hydrogeological properties of individual rock types are described as below:
6.1.1 Khondalite
Khondalites are represented by quartz-garnet-sillimanite ±graphite schist and gneiss with calc
silicate and garnet as occasional occurrences. These rocks are well foliated and have
developed good to moderate weathering. The thickness of weathering varies from 5 to 25
meters. This weathering layer is a good repository of ground water resources. Ground water
development is possible by tapping zones down to 12 meters by means of dug wells. Ground
water also occurs in deep fractures. One to two sets of saturated fractures are encountered in
EIA / EMP Report of Goendamal Graphite Ore Mines of Shri Natwar Lal Agrawal, Balangir,District, Odisha.
Vet By : SHRI ENVIRONMENTAL TECHNOLOGY INSTITUTE ,NEW DELHI
72
between 50 to 150m depth. The yield of borewells tapping these fractures varies from 0.3 to
5 lps.
6.1.2 Charnockites
These formations are of very much-restricted occurrences in the study area. Due to paucity of
joints and fractures, the thickness of weathering in these formations is limited to 10m. The
depth of open well varies in the range between 5 to 10m. The average yield of dug wells
ranges between 5 to 10 m3/day. The discharge of borewells tapping deeper saturated
fractures within depth range of 150m ranges from negligible to 2 lps. Due to the compact
nature and less weathering, ground water prospect in charnockite is not good.
6.1.3 Granite gneissesAs shallow aquifer: Ground water occurs in pheratic condition. The thickness of the
weathered zone is generally more in topographic lows and undulating plains than in the high
land areas. The weathered residuum ranging in depth from 3.25 to 9.85m below ground level
constitute the shallow aquifer zone. On weathering these rocks produce sandy granular
material and their water holding and transmitting capacity depends on the percentage of
kaolin present. The weathered zone forms the main repository of ground water and aids in
circulation of ground water through interconnected fractures and fissures to deeper fracture
zones.
As deeper aquifer: These rocks have well-developed joints and fractures which constitute the
deeper aquifer zone. Ground water occurs in semi-confined to confined condition. There are
generally two to four sets of fracture zone within 160m depth below ground level. The
discharge of the wells within 160m bgl depth is negligible to 25 lps. This variation in yield
depends on topographic setting, proximity to the major lineaments, thickness of weathered
residuum and number of saturated and interconnected fractures encountered.
6.2 UNCONSOLIDATED FORMATIONSAlluvium: Recent alluvium occurs as thin discontinuous patches along prominent drainage
channels. The thickness of the alluvial deposits varies from 5 to 10m and form potential
shallow aquifers. The specific capacity of the dug wells varies from 336 to 446 lpm/m draw
down. These sustain development of ground water through open wells.

EIA / EMP Report of Goendamal Graphite Ore Mines of Shri Natwar Lal Agrawal, Balangir,District, Odisha.
Vet By : SHRI ENVIRONMENTAL TECHNOLOGY INSTITUTE ,NEW DELHI
73
Laterite: Laterites occur as capping over the older formations and are tapped through dug
wells. However they do not form good aquifer. But due to their porous nature, they allow
higher percolation of atmospheric precipitation into ground water.
EIA / EMP Report of Goendamal Graphite Ore Mines of Shri Natwar Lal Agrawal, Balangir,District, Odisha.
Vet By : SHRI ENVIRONMENTAL TECHNOLOGY INSTITUTE ,NEW DELHI
74
CHAPTER 7
WATER LEVEL REGIME
A total 14 nos. of observation wells were established in the study area. The water level of the
wells were monitored during the pre & post-monsoon 2012. The location and details of the
wells are given in the table no.7.1 and 7.2 and shown in fig.no.7.1.
7.1 PRE-MONSOON, 2012 DEPTH TO WATER LEVEL.The pre-monsoon depth to water level varies in the range between 5.10m.bgl and
9.028m.bgl. Maximum water level was observed at Ramod which was 9.02m.bgl. The depth
to water level contour map was prepared and shown in fig. 7.2. The map depicts that waterlevel in major part of the area lies between 5 and 7mBGL. Water level is shallow in the north,
west and south-western part of the area which is in between 5 and 6m and deep in the east
and south-east which lies between 6 to 9m BGL.7.2 POST-MONSOON , 2010 DEPTH TO WATER LEVELThe post-monsoon depth to water level varies in the range between 2.33m.bgl and 6.68m.bgl.
Maximum water level was observed at Ramod which was 6.68m.bgl. The depth to water levelcontour map was prepared and shown in fig.7.3. The map depicts that water level is shallow
in the north, west and south-wesern part of the area which lies between 3.0mbgl and
4.0m.bgl. Water level is deep (5.0-6.0mbgl) in the east part of the area.7.3 WATER LEVEL FLUCTUATION (PRE TO POST-MONSOON)All the observation wells show rise in water level during post-monsoon period. The rise in
water level is in the range of 0.8m. to 4.42m. Maximum rise in water level was observed at
Goendamal which was 4.42m. Fluctuation contour map was prepared and shown infig.no.7.4.The map depicts that central part of the study area show maximum rise in water
level in the range between 3 to 4m.
7.4 WATER TABLE ELEVATIONWater table elevation map has been prepared and shown in fig no.7.5. The map depicts that
water table elevation varies from 350m to 300mamsl. Water table is at higher elevation in the
south central part and ground water flow direction from south-central to south-east, northand north-west direction.
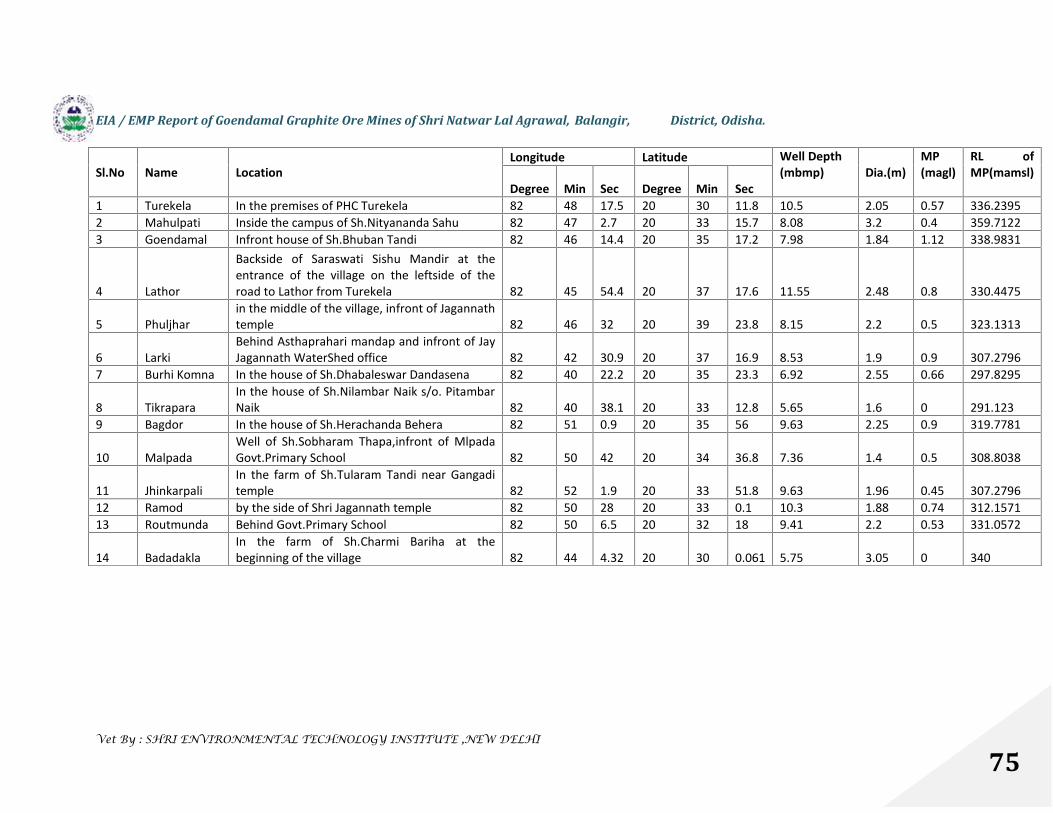
EIA / EMP Report of Goendamal Graphite Ore Mines of Shri Natwar Lal Agrawal, Balangir, District, Odisha.
Vet By : SHRI ENVIRONMENTAL TECHNOLOGY INSTITUTE ,NEW DELHI
75
Sl.No Name LocationLongitude Latitude Well Depth
(mbmp) Dia.(m)MP(magl)
RL ofMP(mamsl)
Degree Min Sec Degree Min Sec1 Turekela In the premises of PHC Turekela 82 48 17.5 20 30 11.8 10.5 2.05 0.57 336.23952 Mahulpati Inside the campus of Sh.Nityananda Sahu 82 47 2.7 20 33 15.7 8.08 3.2 0.4 359.71223 Goendamal Infront house of Sh.Bhuban Tandi 82 46 14.4 20 35 17.2 7.98 1.84 1.12 338.9831
4 Lathor
Backside of Saraswati Sishu Mandir at theentrance of the village on the leftside of theroad to Lathor from Turekela 82 45 54.4 20 37 17.6 11.55 2.48 0.8 330.4475
5 Phuljharin the middle of the village, infront of Jagannathtemple 82 46 32 20 39 23.8 8.15 2.2 0.5 323.1313
6 LarkiBehind Asthaprahari mandap and infront of JayJagannath WaterShed office 82 42 30.9 20 37 16.9 8.53 1.9 0.9 307.2796
7 Burhi Komna In the house of Sh.Dhabaleswar Dandasena 82 40 22.2 20 35 23.3 6.92 2.55 0.66 297.8295
8 TikraparaIn the house of Sh.Nilambar Naik s/o. PitambarNaik 82 40 38.1 20 33 12.8 5.65 1.6 0 291.123
9 Bagdor In the house of Sh.Herachanda Behera 82 51 0.9 20 35 56 9.63 2.25 0.9 319.7781
10 MalpadaWell of Sh.Sobharam Thapa,infront of MlpadaGovt.Primary School 82 50 42 20 34 36.8 7.36 1.4 0.5 308.8038
11 JhinkarpaliIn the farm of Sh.Tularam Tandi near Gangaditemple 82 52 1.9 20 33 51.8 9.63 1.96 0.45 307.2796
12 Ramod by the side of Shri Jagannath temple 82 50 28 20 33 0.1 10.3 1.88 0.74 312.157113 Routmunda Behind Govt.Primary School 82 50 6.5 20 32 18 9.41 2.2 0.53 331.0572
14 BadadaklaIn the farm of Sh.Charmi Bariha at thebeginning of the village 82 44 4.32 20 30 0.061 5.75 3.05 0 340
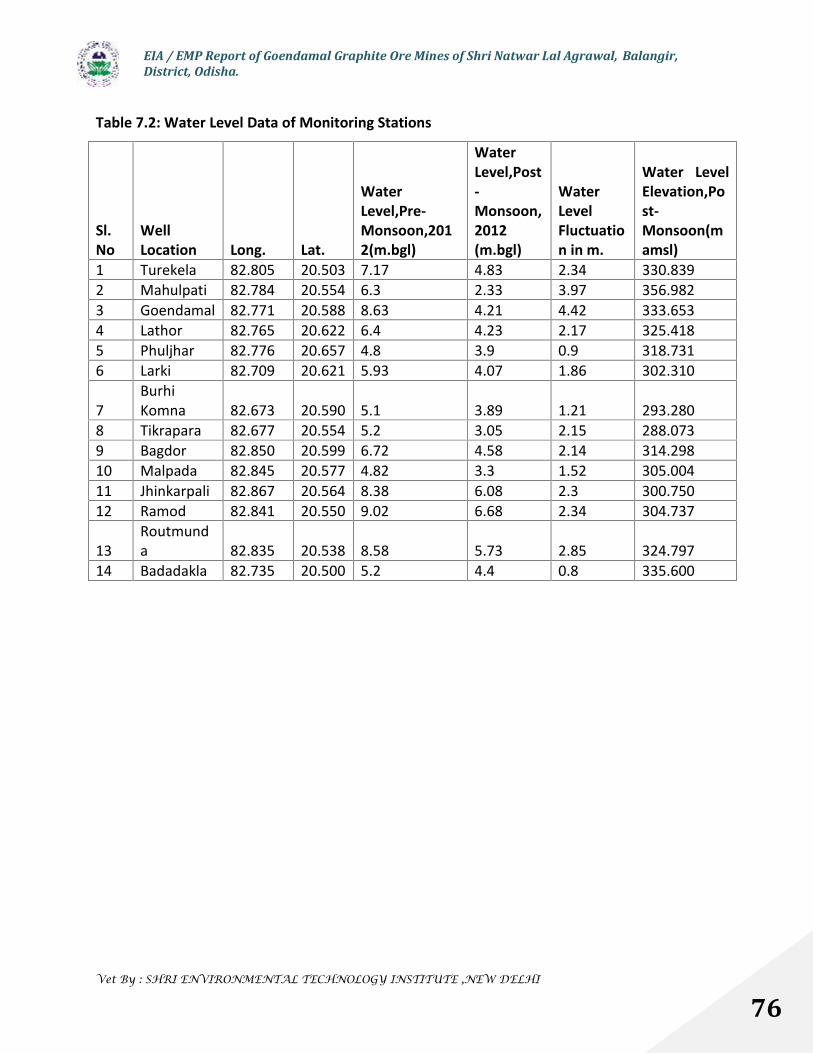
EIA / EMP Report of Goendamal Graphite Ore Mines of Shri Natwar Lal Agrawal, Balangir,District, Odisha.
Vet By : SHRI ENVIRONMENTAL TECHNOLOGY INSTITUTE ,NEW DELHI
76
Table 7.2: Water Level Data of Monitoring Stations
Sl.No
WellLocation Long. Lat.
WaterLevel,Pre-Monsoon,2012(m.bgl)
WaterLevel,Post-Monsoon,2012(m.bgl)
WaterLevelFluctuation in m.
Water LevelElevation,Post-Monsoon(mamsl)
1 Turekela 82.805 20.503 7.17 4.83 2.34 330.8392 Mahulpati 82.784 20.554 6.3 2.33 3.97 356.9823 Goendamal 82.771 20.588 8.63 4.21 4.42 333.6534 Lathor 82.765 20.622 6.4 4.23 2.17 325.4185 Phuljhar 82.776 20.657 4.8 3.9 0.9 318.7316 Larki 82.709 20.621 5.93 4.07 1.86 302.310
7BurhiKomna 82.673 20.590 5.1 3.89 1.21 293.280
8 Tikrapara 82.677 20.554 5.2 3.05 2.15 288.0739 Bagdor 82.850 20.599 6.72 4.58 2.14 314.29810 Malpada 82.845 20.577 4.82 3.3 1.52 305.00411 Jhinkarpali 82.867 20.564 8.38 6.08 2.3 300.75012 Ramod 82.841 20.550 9.02 6.68 2.34 304.737
13Routmunda 82.835 20.538 8.58 5.73 2.85 324.797
14 Badadakla 82.735 20.500 5.2 4.4 0.8 335.600
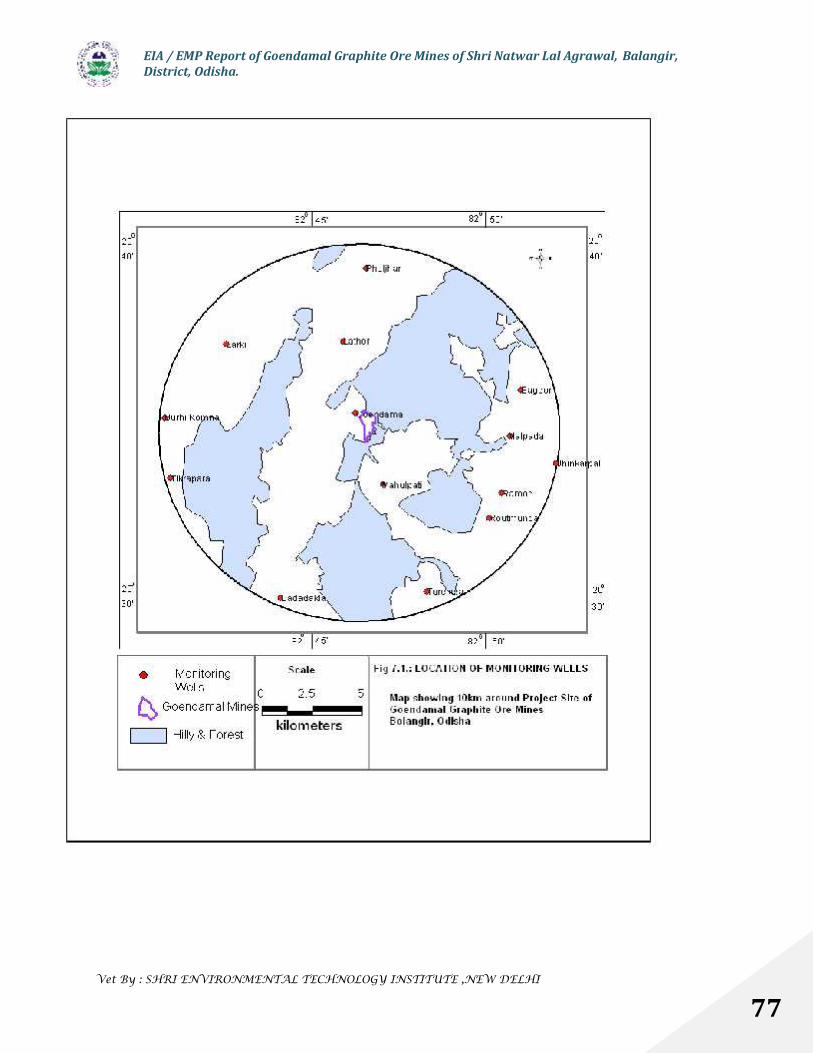
EIA / EMP Report of Goendamal Graphite Ore Mines of Shri Natwar Lal Agrawal, Balangir,District, Odisha.
Vet By : SHRI ENVIRONMENTAL TECHNOLOGY INSTITUTE ,NEW DELHI
77
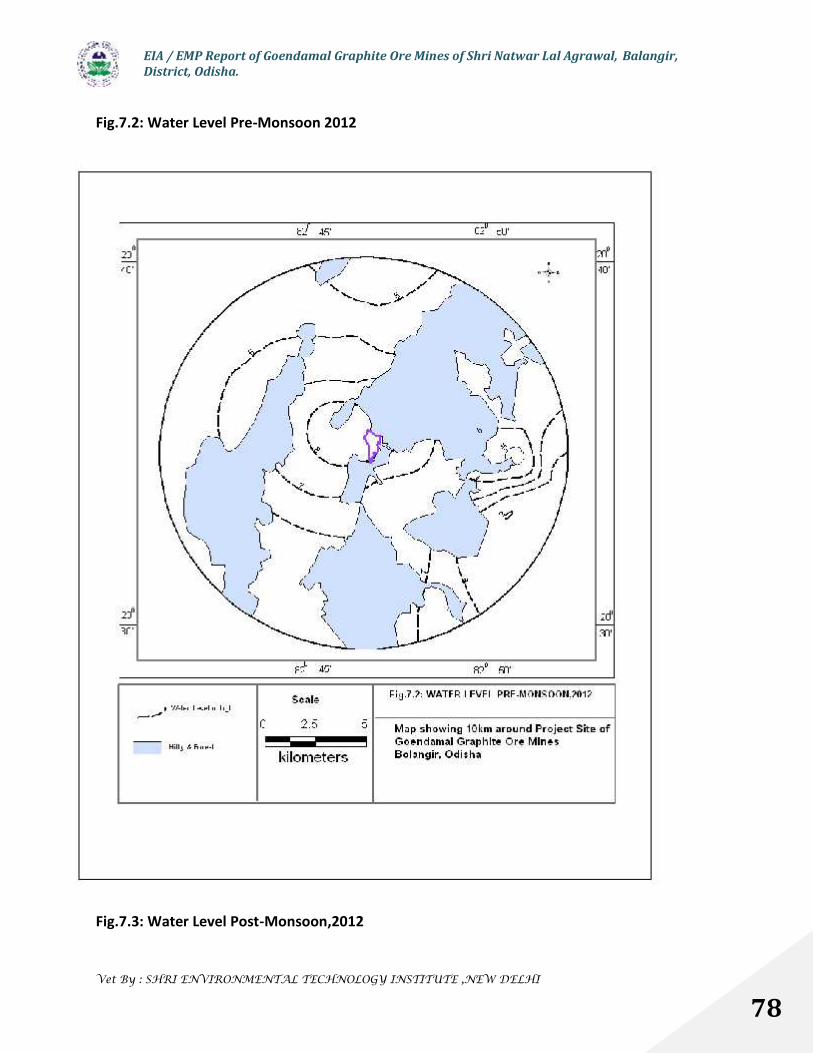
EIA / EMP Report of Goendamal Graphite Ore Mines of Shri Natwar Lal Agrawal, Balangir,District, Odisha.
Vet By : SHRI ENVIRONMENTAL TECHNOLOGY INSTITUTE ,NEW DELHI
78
Fig.7.2: Water Level Pre-Monsoon 2012
Fig.7.3: Water Level Post-Monsoon,2012
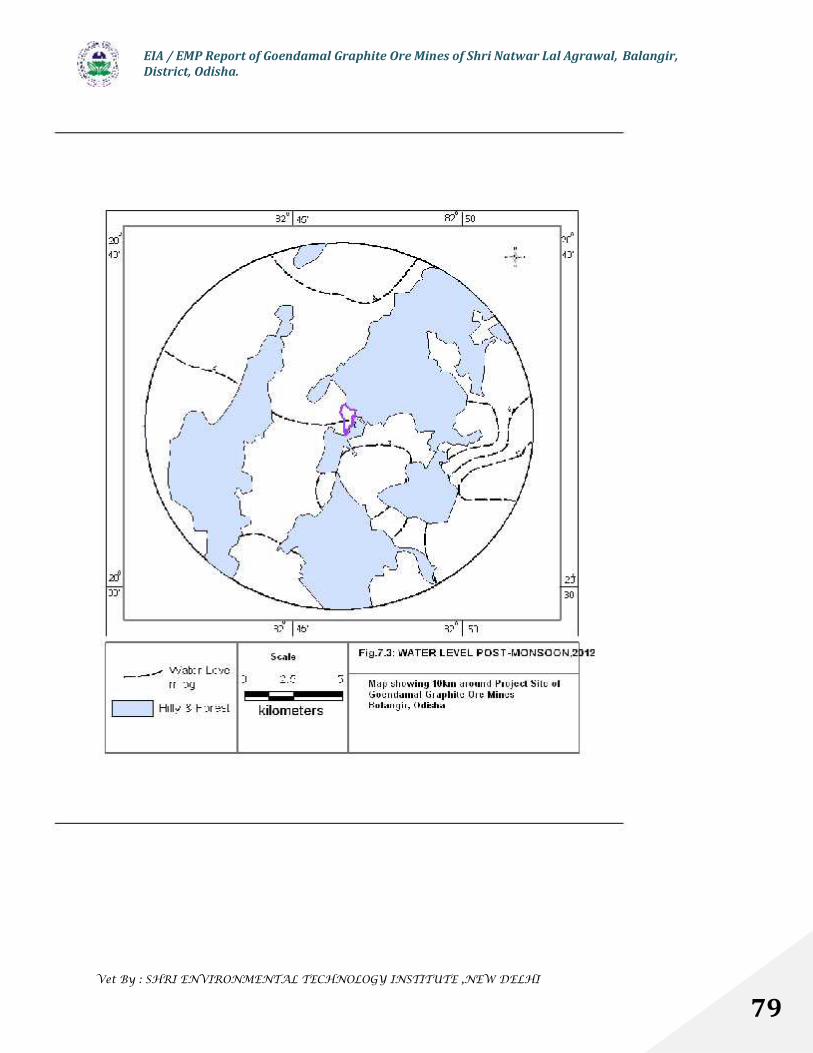
EIA / EMP Report of Goendamal Graphite Ore Mines of Shri Natwar Lal Agrawal, Balangir,District, Odisha.
Vet By : SHRI ENVIRONMENTAL TECHNOLOGY INSTITUTE ,NEW DELHI
79
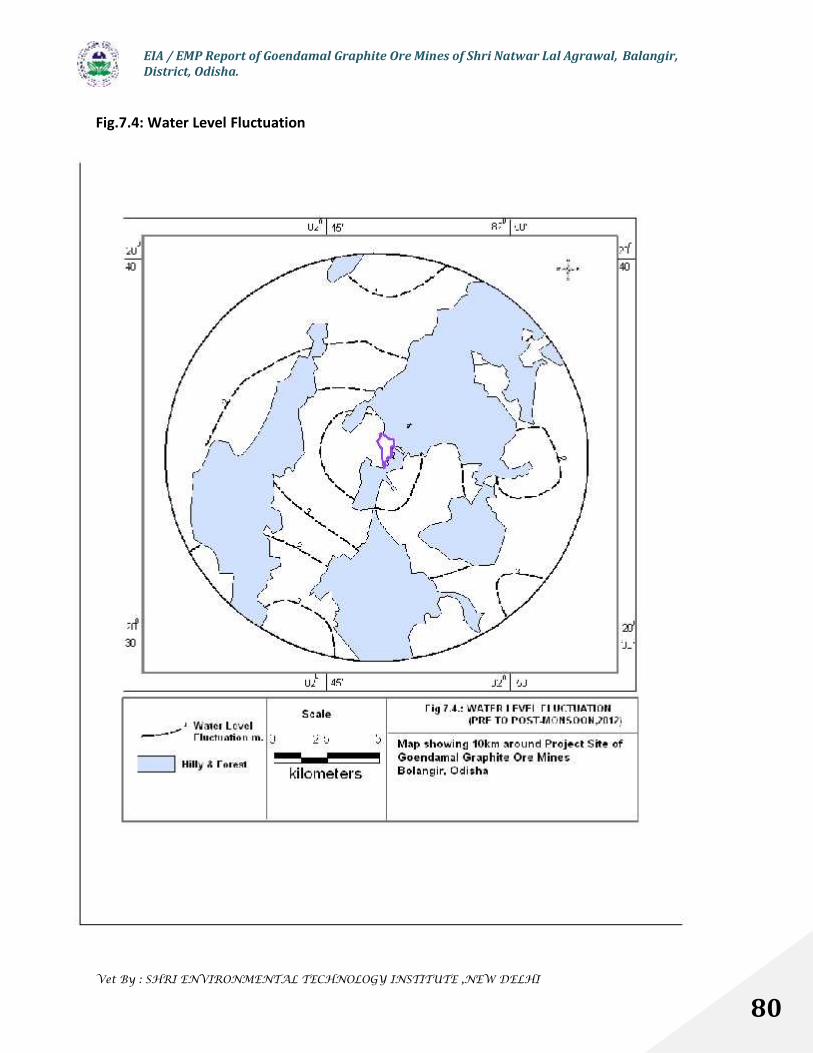
EIA / EMP Report of Goendamal Graphite Ore Mines of Shri Natwar Lal Agrawal, Balangir,District, Odisha.
Vet By : SHRI ENVIRONMENTAL TECHNOLOGY INSTITUTE ,NEW DELHI
80
Fig.7.4: Water Level Fluctuation
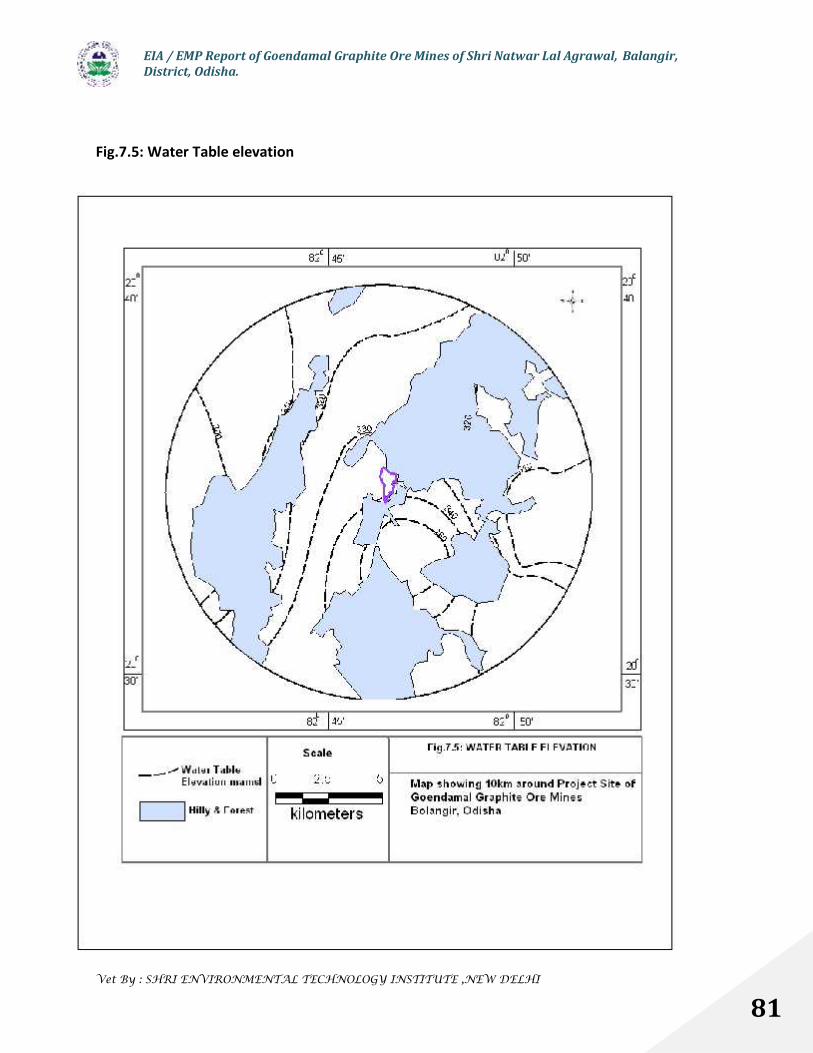
EIA / EMP Report of Goendamal Graphite Ore Mines of Shri Natwar Lal Agrawal, Balangir,District, Odisha.
Vet By : SHRI ENVIRONMENTAL TECHNOLOGY INSTITUTE ,NEW DELHI
81
Fig.7.5: Water Table elevation
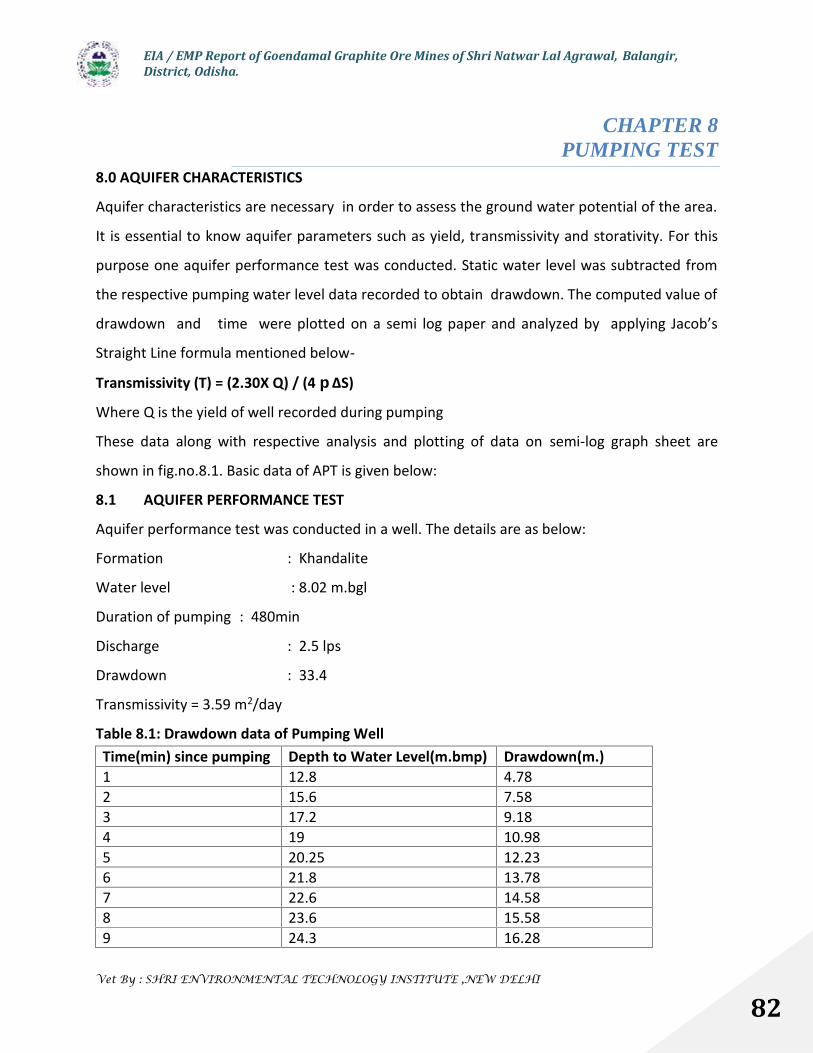
EIA / EMP Report of Goendamal Graphite Ore Mines of Shri Natwar Lal Agrawal, Balangir,District, Odisha.
Vet By : SHRI ENVIRONMENTAL TECHNOLOGY INSTITUTE ,NEW DELHI
82
CHAPTER 8PUMPING TEST
8.0 AQUIFER CHARACTERISTICS
Aquifer characteristics are necessary in order to assess the ground water potential of the area.
It is essential to know aquifer parameters such as yield, transmissivity and storativity. For this
purpose one aquifer performance test was conducted. Static water level was subtracted from
the respective pumping water level data recorded to obtain drawdown. The computed value of
drawdown and time were plotted on a semi log paper and analyzed by applying Jacob’s
Straight Line formula mentioned below-
Transmissivity (T) = (2.30X Q) / (4 ∆S)
Where Q is the yield of well recorded during pumping
These data along with respective analysis and plotting of data on semi-log graph sheet are
shown in fig.no.8.1. Basic data of APT is given below:
8.1 AQUIFER PERFORMANCE TEST
Aquifer performance test was conducted in a well. The details are as below:
Formation : Khandalite
Water level : 8.02 m.bgl
Duration of pumping : 480min
Discharge : 2.5 lps
Drawdown : 33.4
Transmissivity = 3.59 m2/day
Table 8.1: Drawdown data of Pumping WellTime(min) since pumping Depth to Water Level(m.bmp) Drawdown(m.)1 12.8 4.782 15.6 7.583 17.2 9.184 19 10.985 20.25 12.236 21.8 13.787 22.6 14.588 23.6 15.589 24.3 16.28
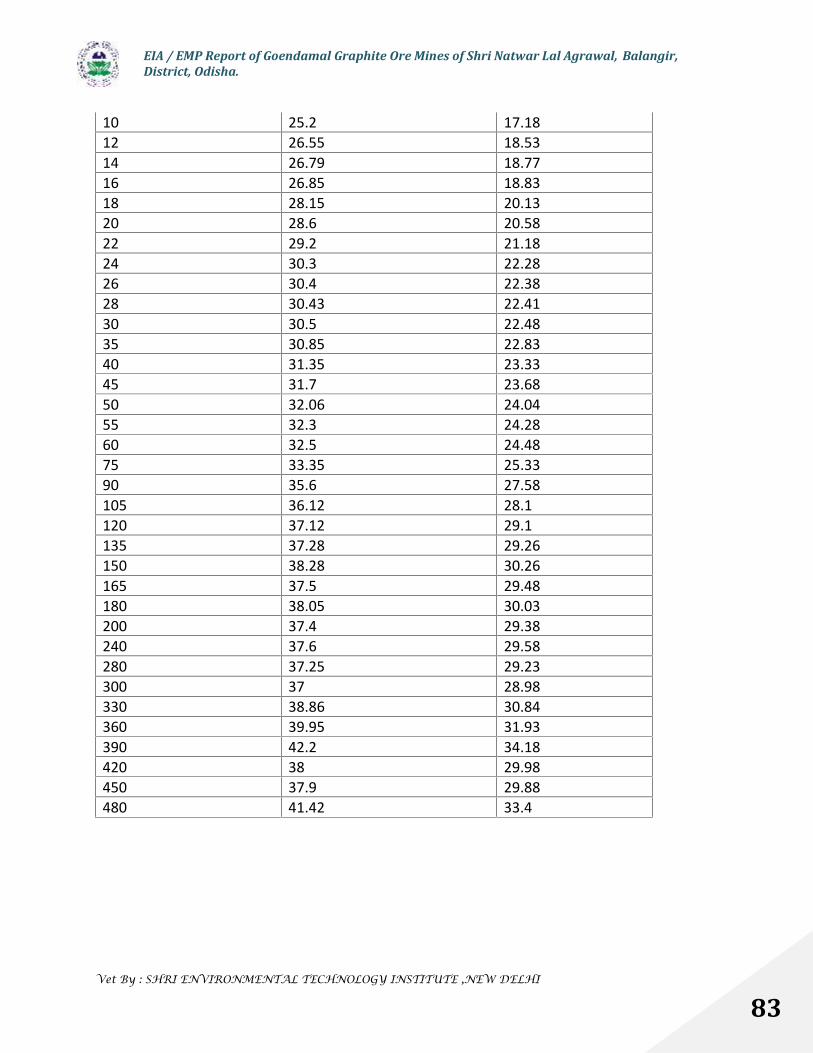
EIA / EMP Report of Goendamal Graphite Ore Mines of Shri Natwar Lal Agrawal, Balangir,District, Odisha.
Vet By : SHRI ENVIRONMENTAL TECHNOLOGY INSTITUTE ,NEW DELHI
83
10 25.2 17.1812 26.55 18.5314 26.79 18.7716 26.85 18.8318 28.15 20.1320 28.6 20.5822 29.2 21.1824 30.3 22.2826 30.4 22.3828 30.43 22.4130 30.5 22.4835 30.85 22.8340 31.35 23.3345 31.7 23.6850 32.06 24.0455 32.3 24.2860 32.5 24.4875 33.35 25.3390 35.6 27.58105 36.12 28.1120 37.12 29.1135 37.28 29.26150 38.28 30.26165 37.5 29.48180 38.05 30.03200 37.4 29.38240 37.6 29.58280 37.25 29.23300 37 28.98330 38.86 30.84360 39.95 31.93390 42.2 34.18420 38 29.98450 37.9 29.88480 41.42 33.4
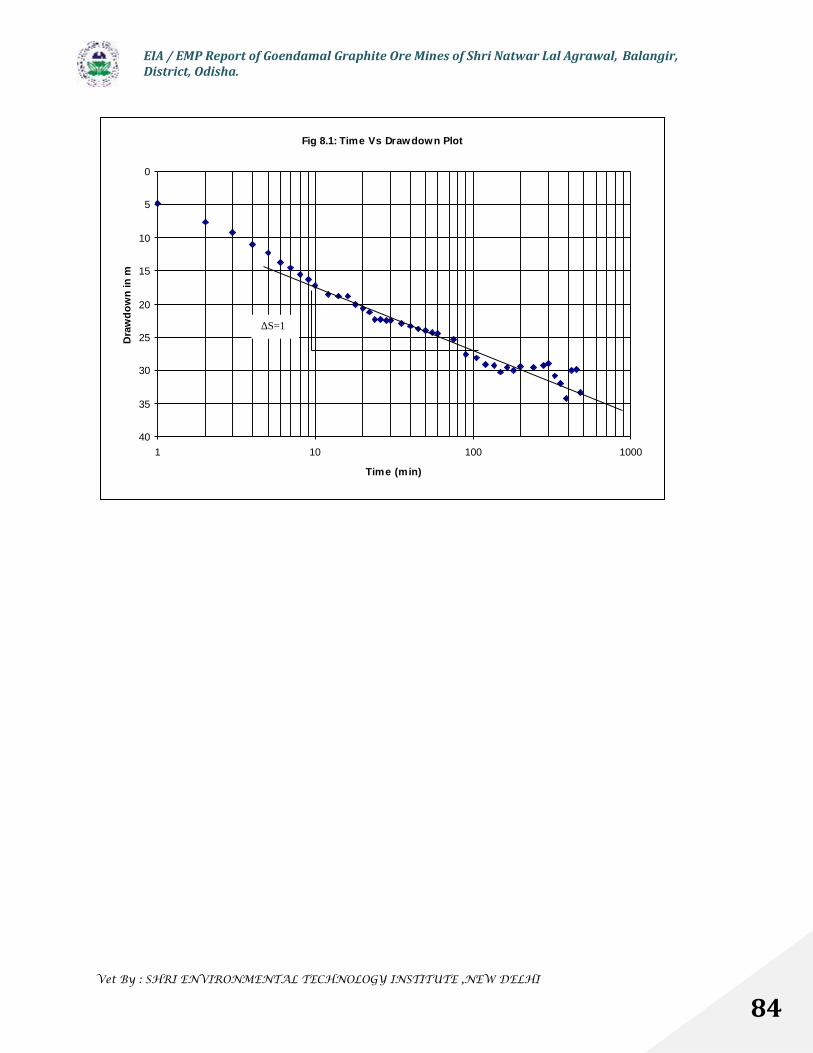
EIA / EMP Report of Goendamal Graphite Ore Mines of Shri Natwar Lal Agrawal, Balangir,District, Odisha.
Vet By : SHRI ENVIRONMENTAL TECHNOLOGY INSTITUTE ,NEW DELHI
84
Fig 8.1: Time Vs Drawdown Plot
0
5
10
15
20
25
30
35
401 10 100 1000
Time (min)
Dra
wdo
wn
in m
ΔS=11
EIA / EMP Report of Goendamal Graphite Ore Mines of Shri Natwar Lal Agrawal, Balangir,District, Odisha.
Vet By : SHRI ENVIRONMENTAL TECHNOLOGY INSTITUTE ,NEW DELHI
85
CHAPTER 9
MINING DEWATERING
9.0 MINE DRAINAGE
De-watering in Open Cast Mining Pits of Goendamal Graphite Mines
The Goendamal Graphite Ore Mines spreads over an area of 63.771 hectares (157.58 acres) of
land. The surface elevation of mining lease area varies between 326m.amsl and 348m.amsl.
Presently mining is proposed to be carried out in one Quarry (pits) such as Quarry No.5 only.
Water Table elevation ( based on the water level data of dug wells tapping phreatic aquifer &
measured during post-monsoon,2012) surrounding the Mines varies in between 340 and
330m,amsl. The ground water flow direction is from south to north. The elevation map is
shown in fig.9.1. This is a regional water table elevation map. But to get a precise picture of
ground water intersection the piezometric head of the piezometer in the premises of the
mining lease area has been taken in to consideration.
Fig.9.1: Water Table Elevation, Post-Monsoon, 2012 Surrounding Mines (m.amsl)

EIA / EMP Report of Goendamal Graphite Ore Mines of Shri Natwar Lal Agrawal, Balangir,District, Odisha.
Vet By : SHRI ENVIRONMENTAL TECHNOLOGY INSTITUTE ,NEW DELHI
86
Piezometric head measured in the piezometer established in the mining lease area (in the
premises of the site office) is as below:
Month Head in m.amsl
May, 2012 324
August, 2012 330.75
Nov, 2012 331.61
The present pit bottoms of Quarry-5 stands at 331m.amsl and the ultimate Pit bottom at the
end of the mining plan is 322.5. Hence mining activities will intersect water table during
monsoon and upto few months after monsoon. The intersection also depends upon the
progressive pit bottom.
The groundwater level must be pulled down to create dry conditions in the mining area so that
the generally low strength aquifer sequence material can be safely excavated. Mine dewatering
is usually undertaken for a variety of geo-technical (material strength considerations), mining
and safety reasons also.
Water Flow Direction
EIA / EMP Report of Goendamal Graphite Ore Mines of Shri Natwar Lal Agrawal, Balangir,District, Odisha.
Vet By : SHRI ENVIRONMENTAL TECHNOLOGY INSTITUTE ,NEW DELHI
87
The main objective is to find out the total volume of ground water which needs to be
removed from the Pits for safe mining operations.
9.1 GROUND WATER INTERSECTION
The groundwater inflow to a mining excavation is mainly a consequence of the interaction of
groundwater system, hydrogeological characteristics of the rock mass and the mining
geometry. The water inflow regime is determined by the incision of one or more aquifers by the
mining exaction and the relative hydrogeological characteristics of the various aquifers.
The groundwater inflow in the vicinity of mining excavation can be estimated by one of the
following techniques.
Equivalent flow approach
Two-dimensional flow equations
Numerical techniques incorporating the Finite Element method, Finite Difference
Method or the Boundary Element Method
The groundwater inflow equations use both linear flow as well as non-linear flow conditions.
The effect of turbulence results in the reduction of inflow quantities because of the energy loss
in the turbulent flow. The method outlines the two-dimensional flow technique of estimating
ground water to surface excavations using both steady state and transient state equations for
unconfined and confined aquifers. This approach provides a simple method of predicting first
order estimates of ground water inflow to mining excavations and provides a factor of safety by
slight over-estimating the inflow.
The complexity of the relationship between aquifer type, aquifer characteristics, flow regime
and mining excavation often complicates mine water inflow prediction. The flow regime
depends on the type of conducting medium. In an unconsolidated sedimentary sequence where
groundwater movement is through inter-granular pore-spaces, flow is essentially linear. On the
other hand, in a rock sequence in which it is the secondary processes like fracturing and faulting
that provide the conducting medium, flow is predominantly non-linear. Surface mining
excavation serves as a natural groundwater discharge point. Near the excavation, there is
invariably, a vertical component of flow and high hydraulic gradient which often leads to
turbulent flow and negates analysis by Darcy’s Law. Non-linear flow equations are therefore
EIA / EMP Report of Goendamal Graphite Ore Mines of Shri Natwar Lal Agrawal, Balangir,District, Odisha.
Vet By : SHRI ENVIRONMENTAL TECHNOLOGY INSTITUTE ,NEW DELHI
88
valid. The rate of flow is generally computed from equations which relate the hydraulic head
loss in and flow of groundwater through the porous geological strata. Prior knowledge of
aquifer hydraulic characteristics and pit geometry is necessary. The aquifer parameters are
obtained from detailed hydrogeological investigations of the mine site and pit geometry from
the mine plan.
The analytical approaches for estimating groundwater inflow to surface mining excavations are
based on drawdown theory.
9.1.1 Equivalent Well Approach
This approach assumes that dewatering of the surface mine is carried out by use of an
imaginary pumping-out borehole ( fully penetrating the entire saturated thickness of the
aquifer) from which water is pumped out at a uniform discharge rate in order to lower the
piezometric level of the aquifer to below the mining horizon at the mine boundary. Input
parameters for equations developed in this approach are aquifer characteristics (Transmissivity,
Permeability, Storage-Coefficient and Leakage Factor) and mine geometry. Normally the mine
excavation is envisaged as large diameter well. Where the mine has the shape of a square or
rectangular as is the case in most strip mine, than, an equivalent radius for the well is calculated
using the equation given by (Mansur and Kaufman,1962).
2 ½
r = [ - ] ( Y.W)
π
Where Y= length of the mine, m
W=width of the mine, m
r= equivalent radius, m
Dudley (1972) discussed various methods of approximating a mine model to an equivalent
cylindrical well and estimating input parameters for the equivalent well model. The notations
used in the equations in this approach are defined as follows:
D= drawdown (m)= (H-h)
H= original height of water table or piezometric surface above mine level (m)
h= piezometric head at a specific point in time (m)
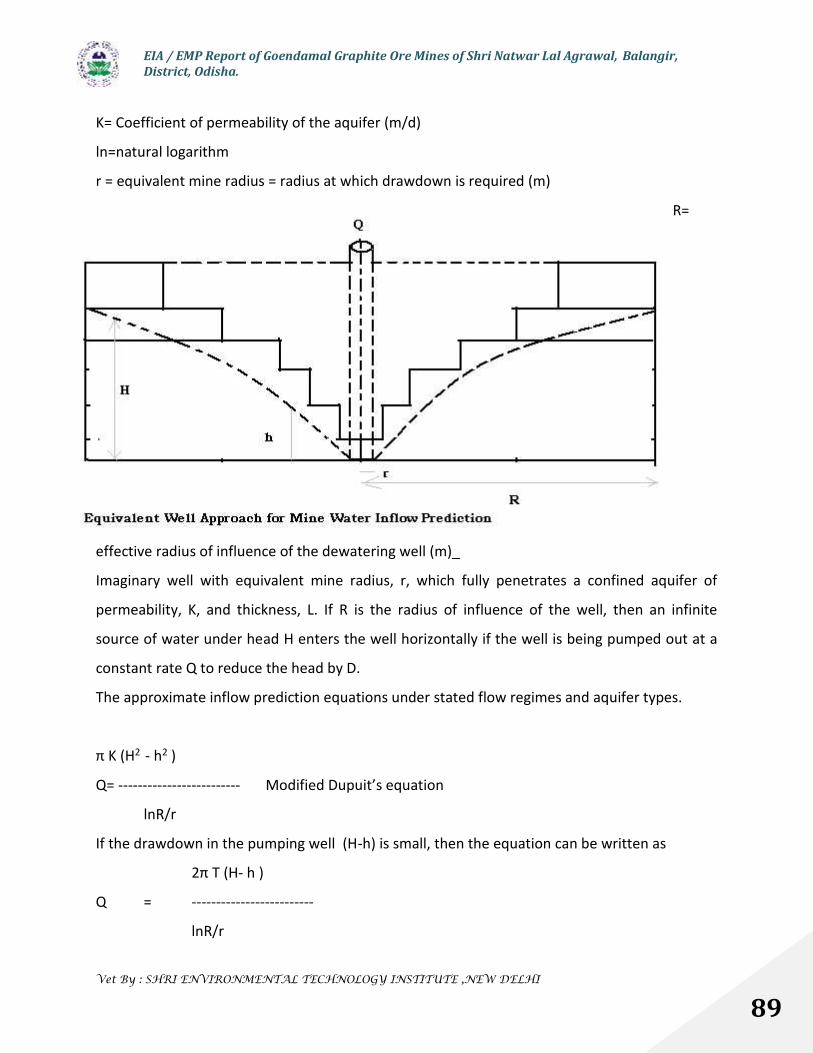
EIA / EMP Report of Goendamal Graphite Ore Mines of Shri Natwar Lal Agrawal, Balangir,District, Odisha.
Vet By : SHRI ENVIRONMENTAL TECHNOLOGY INSTITUTE ,NEW DELHI
89
K= Coefficient of permeability of the aquifer (m/d)
ln=natural logarithm
r = equivalent mine radius = radius at which drawdown is required (m)
R=
effective radius of influence of the dewatering well (m)_
Imaginary well with equivalent mine radius, r, which fully penetrates a confined aquifer of
permeability, K, and thickness, L. If R is the radius of influence of the well, then an infinite
source of water under head H enters the well horizontally if the well is being pumped out at a
constant rate Q to reduce the head by D.
The approximate inflow prediction equations under stated flow regimes and aquifer types.
π K (H2 - h2 )
Q= ------------------------- Modified Dupuit’s equation
lnR/r
If the drawdown in the pumping well (H-h) is small, then the equation can be written as
2π T (H- h )
Q = -------------------------
lnR/r
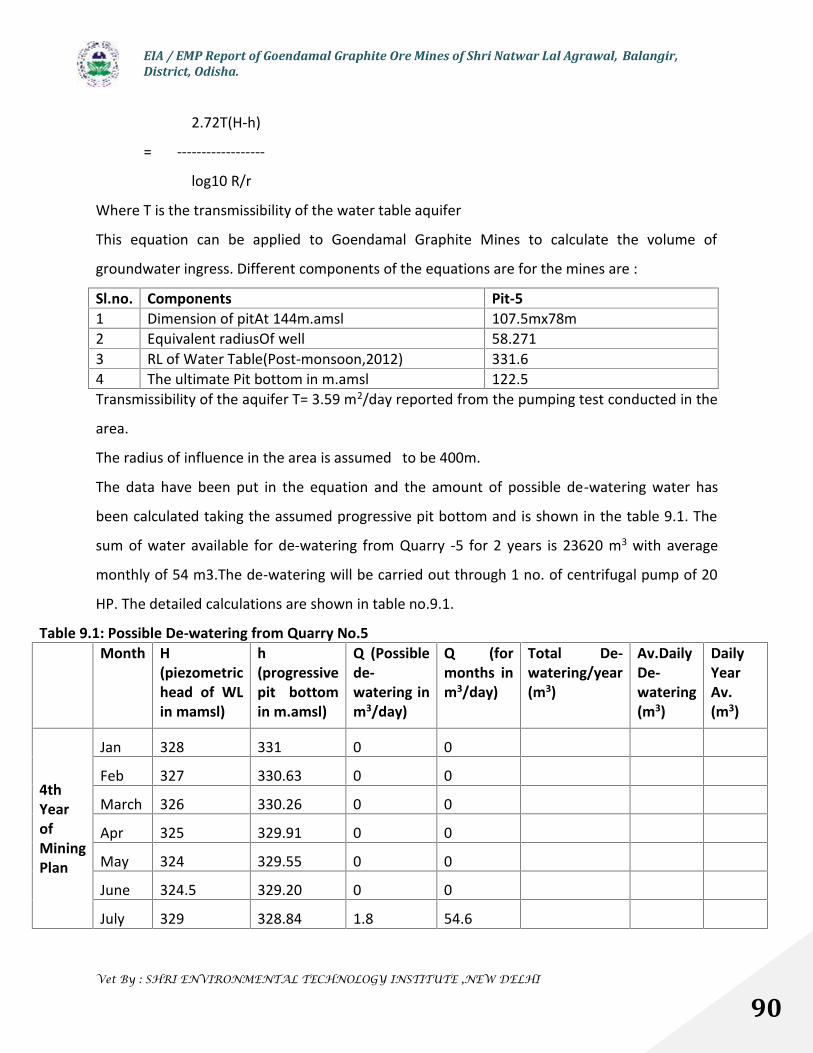
EIA / EMP Report of Goendamal Graphite Ore Mines of Shri Natwar Lal Agrawal, Balangir,District, Odisha.
Vet By : SHRI ENVIRONMENTAL TECHNOLOGY INSTITUTE ,NEW DELHI
90
2.72T(H-h)
= ------------------
log10 R/r
Where T is the transmissibility of the water table aquifer
This equation can be applied to Goendamal Graphite Mines to calculate the volume of
groundwater ingress. Different components of the equations are for the mines are :
Sl.no. Components Pit-51 Dimension of pitAt 144m.amsl 107.5mx78m2 Equivalent radiusOf well 58.2713 RL of Water Table(Post-monsoon,2012) 331.64 The ultimate Pit bottom in m.amsl 122.5Transmissibility of the aquifer T= 3.59 m2/day reported from the pumping test conducted in the
area.
The radius of influence in the area is assumed to be 400m.
The data have been put in the equation and the amount of possible de-watering water has
been calculated taking the assumed progressive pit bottom and is shown in the table 9.1. The
sum of water available for de-watering from Quarry -5 for 2 years is 23620 m3 with average
monthly of 54 m3.The de-watering will be carried out through 1 no. of centrifugal pump of 20
HP. The detailed calculations are shown in table no.9.1.
Table 9.1: Possible De-watering from Quarry No.5Month H
(piezometrichead of WLin mamsl)
h(progressivepit bottomin m.amsl)
Q (Possiblede-watering inm3/day)
Q (formonths inm3/day)
Total De-watering/year(m3)
Av.DailyDe-watering(m3)
DailyYearAv.(m3)
4thYearofMiningPlan
Jan 328 331 0 0
Feb 327 330.63 0 0
March 326 330.26 0 0
Apr 325 329.91 0 0
May 324 329.55 0 0
June 324.5 329.20 0 0
July 329 328.84 1.8 54.6
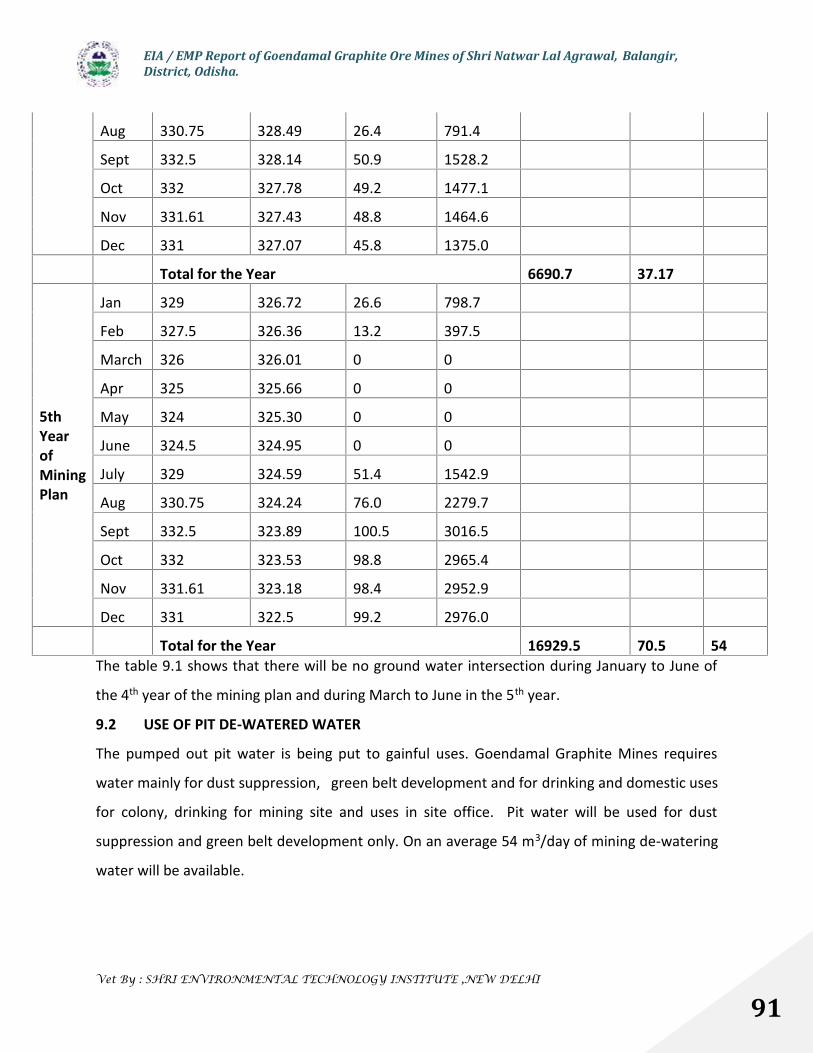
EIA / EMP Report of Goendamal Graphite Ore Mines of Shri Natwar Lal Agrawal, Balangir,District, Odisha.
Vet By : SHRI ENVIRONMENTAL TECHNOLOGY INSTITUTE ,NEW DELHI
91
Aug 330.75 328.49 26.4 791.4
Sept 332.5 328.14 50.9 1528.2
Oct 332 327.78 49.2 1477.1
Nov 331.61 327.43 48.8 1464.6
Dec 331 327.07 45.8 1375.0
Total for the Year 6690.7 37.17
5thYearofMiningPlan
Jan 329 326.72 26.6 798.7
Feb 327.5 326.36 13.2 397.5
March 326 326.01 0 0
Apr 325 325.66 0 0
May 324 325.30 0 0
June 324.5 324.95 0 0
July 329 324.59 51.4 1542.9
Aug 330.75 324.24 76.0 2279.7
Sept 332.5 323.89 100.5 3016.5
Oct 332 323.53 98.8 2965.4
Nov 331.61 323.18 98.4 2952.9
Dec 331 322.5 99.2 2976.0
Total for the Year 16929.5 70.5 54The table 9.1 shows that there will be no ground water intersection during January to June of
the 4th year of the mining plan and during March to June in the 5th year.
9.2 USE OF PIT DE-WATERED WATER
The pumped out pit water is being put to gainful uses. Goendamal Graphite Mines requires
water mainly for dust suppression, green belt development and for drinking and domestic uses
for colony, drinking for mining site and uses in site office. Pit water will be used for dust
suppression and green belt development only. On an average 54 m3/day of mining de-watering
water will be available.

EIA / EMP Report of Goendamal Graphite Ore Mines of Shri Natwar Lal Agrawal, Balangir,District, Odisha.
Vet By : SHRI ENVIRONMENTAL TECHNOLOGY INSTITUTE ,NEW DELHI
92
The amount of water required for dust suppression will be 20 m3/day and for green belt
development it will be around 10 m3/day. The balance water of 24 m3/dat will either be stored
for use for the above purposes during non dewatering period or will be used for agriculture.

EIA / EMP Report of Goendamal Graphite Ore Mines of Shri Natwar Lal Agrawal, Balangir,District, Odisha.
Vet By : SHRI ENVIRONMENTAL TECHNOLOGY INSTITUTE ,NEW DELHI
93
CHAPTER 10GROUND WATER QUALITY
10.0 CHEMICAL QUALITY OF GROUND WATER
In order to assess the chemical quality of ground water in the buffer zone,
ninenos.ofwatersampleswerecollected and analyzed. The table 10.1 shows the quality of
ground water in the area.
A perusal of the table no.10.1 indicates, the distribution of various constituents vary greatly in
the area. Concentrations of the above parameters are well within the permissible limits as per
the BIS standards.
pH of ground water samples varies from 6.7 to 7.3 indicating slightly acidic nature of the water.
The maximum permissible limit for pH as prescribed by B.I.S (1991) in drinking water supply is
6.50 to 8.50. The ground water has pH values within prescribed limits and suitable for drinking
purposes.
The results of chemical analysis of ground water samples indicate that there is less variation in
conductivity in the area. The EC value of ground water varies between 220 and 375 micro-
mhos/cm at 250c. The range of electrical conductivity values shows that the ground water of
the area is fresh.
The major sources of chloride in ground water are from rainwater, evaporite deposits and
seepage from sewage and industrial effluents containing common salt. The chloride
concentration in ground water varies from 30 to 55 mg/l indicating the quality of water within
this aquifer is portable.
The main sources of nitrate in ground water are atmospheric precipitation, geological deposits,
industrial wastes, sewage and animal wastes and agricultural sources. The nitrate concentration
in shallow ground water has been recorded from 2.5 to 4.6mg/l. The nitrate concentration in
ground water in the area is well within the permissible limit of 100mg/l as prescribed by
BIS,1991.
The fluoride concentration in the area lies between 0.03 to 0.08mg/l. The fluoride
concentration is within the permissible limit as prescribed by BIS, 1991.
The ground water samples of the area show that water is fit for drinking as well as for domestic
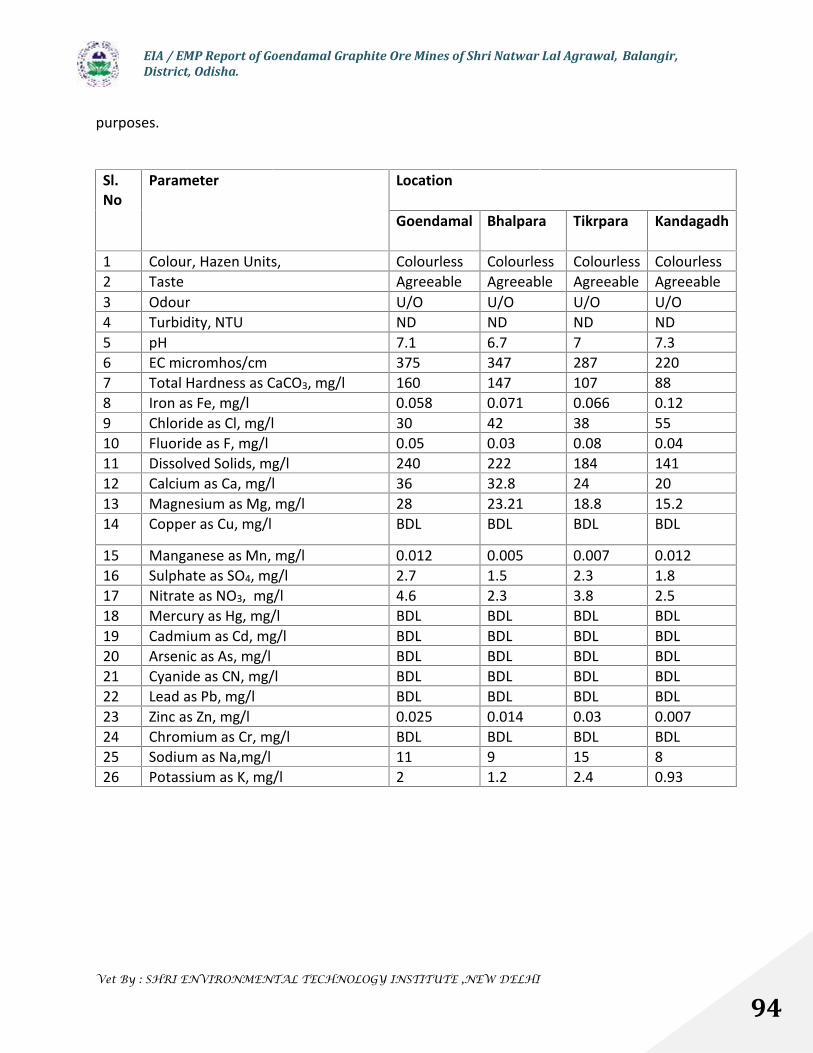
EIA / EMP Report of Goendamal Graphite Ore Mines of Shri Natwar Lal Agrawal, Balangir,District, Odisha.
Vet By : SHRI ENVIRONMENTAL TECHNOLOGY INSTITUTE ,NEW DELHI
94
purposes.
Sl.No
Parameter Location
Goendamal Bhalpara Tikrpara Kandagadh
1 Colour, Hazen Units, Colourless Colourless Colourless Colourless2 Taste Agreeable Agreeable Agreeable Agreeable3 Odour U/O U/O U/O U/O4 Turbidity, NTU ND ND ND ND5 pH 7.1 6.7 7 7.36 EC micromhos/cm 375 347 287 2207 Total Hardness as CaCO3, mg/l 160 147 107 888 Iron as Fe, mg/l 0.058 0.071 0.066 0.129 Chloride as Cl, mg/l 30 42 38 5510 Fluoride as F, mg/l 0.05 0.03 0.08 0.0411 Dissolved Solids, mg/l 240 222 184 14112 Calcium as Ca, mg/l 36 32.8 24 2013 Magnesium as Mg, mg/l 28 23.21 18.8 15.214 Copper as Cu, mg/l BDL BDL BDL BDL
15 Manganese as Mn, mg/l 0.012 0.005 0.007 0.01216 Sulphate as SO4, mg/l 2.7 1.5 2.3 1.817 Nitrate as NO3, mg/l 4.6 2.3 3.8 2.518 Mercury as Hg, mg/l BDL BDL BDL BDL19 Cadmium as Cd, mg/l BDL BDL BDL BDL20 Arsenic as As, mg/l BDL BDL BDL BDL21 Cyanide as CN, mg/l BDL BDL BDL BDL22 Lead as Pb, mg/l BDL BDL BDL BDL23 Zinc as Zn, mg/l 0.025 0.014 0.03 0.00724 Chromium as Cr, mg/l BDL BDL BDL BDL25 Sodium as Na,mg/l 11 9 15 826 Potassium as K, mg/l 2 1.2 2.4 0.93
EIA / EMP Report of Goendamal Graphite Ore Mines of Shri Natwar Lal Agrawal, Balangir,District, Odisha.
Vet By : SHRI ENVIRONMENTAL TECHNOLOGY INSTITUTE ,NEW DELHI
95
CHAPTER 11DYNAMIC GROUND WATER RESOURCES
Rainfall is the principal source of ground water recharge in the study are/buffer zone. For
estimation of ground water resources and stage of ground water development in the buffer
zone, GEC (Ground Water Resource Estimation Committee, 1997) norms have been adopted
and are described below.
11.1 GROUND WATER RECHARGE
a) Monsoon Ground Water Recharge
I) Based on Rainfall Infiltration Method
Total Area : 314 sq.km
Area suitable for recharge : 295sq.km
Average Rainfall : 1534.5 mm
Infiltration factor : 12%
Annual Recharge : 54.30 MCM
II) Based on Water Table Fluctuation Method
Area suitable for recharge : 295 sq.km
Mean water level fluctuation : 3.5m
Specific yield : 4%
Maximum Ground Water Recharge : 41.3 MCM
The ground water resource estimated by Water table fluctuation method is less. Therefore as
per the norms of GEC, it is to be adopted.
b) Recharge through other sources
Recharge through other sources primarily constitutes recharge through surface water irrigation.
Return recharge from surface water irrigation is estimated to be 30% of the applied water for
irrigation. As per the district irrigation department, about 898 ha. Of land is irrigated in the
study area. If the gross irrigation requirement is taken as 50 cm/ha, total applied water will
work out to be 449 Ham. The return seepage will be 30% of 449 Ham i.e. 134 ham or 1.34
MCM.
EIA / EMP Report of Goendamal Graphite Ore Mines of Shri Natwar Lal Agrawal, Balangir,District, Odisha.
Vet By : SHRI ENVIRONMENTAL TECHNOLOGY INSTITUTE ,NEW DELHI
96
c) Hence annual ground water resources will be
41.3 MCM+1.34 MCM
=42.64 MCM
11.2 GROUND WATER DRAFT
Ground water is mainly used for domestic, irrigation and industrial need. To estimate the
ground water use, Census data of 2001 have been used for population and irrigated area.
Draft for Drinking Use
Population using groundwater as drinking water : 37635
Per Capita : 70 lit/day
Annual Ground Water Use : 0.00263 MCM
Irrigation Use
About 83 ha of land is being irrigated through ground water. Considering 50 cm/ha of ground
water use, total ground water need for irrigation works out to be 0.415 MCM.
Industrial Use
Several industries are in the process of being set up in the study area. The industrial use can be
taken to be about 3 MCM
Total Ground Water Utilization
0.002MCM+ 0.415 MCM+3 MCM
= 3.417 MCM
Ground Water Balance
Annual Resources =42.64 MCM
Annual Utilisation =3.417 MCM
Balance GW=39.223 MCM
11.3 STAGE OF GROUND WATER DEVELOPMENT
The stage of ground water development in an area is taken as the ratio of Gross annual draft for
all uses to the total utilizable ground water resource or net annual ground water availability
Thus the stage of ground water development ( in %) in the buffer zone is
EIA / EMP Report of Goendamal Graphite Ore Mines of Shri Natwar Lal Agrawal, Balangir,District, Odisha.
Vet By : SHRI ENVIRONMENTAL TECHNOLOGY INSTITUTE ,NEW DELHI
97
Net Ground Water Draft
= ----------------------------- X 100
Net Ground Water Availability
= (3.417/42.64 )X 100
= 8.01 %
The unit of assessment as per GEC norms are categorized for ground water development based
on two criteria.
i. Stage of Development
ii. Long term trend of pre & post monsoon water level
Since the buffer zone represents an area where stage of development is 8.01 % and there is no
long term decline of pre & post monsoon water level , the area is categorized as safe.
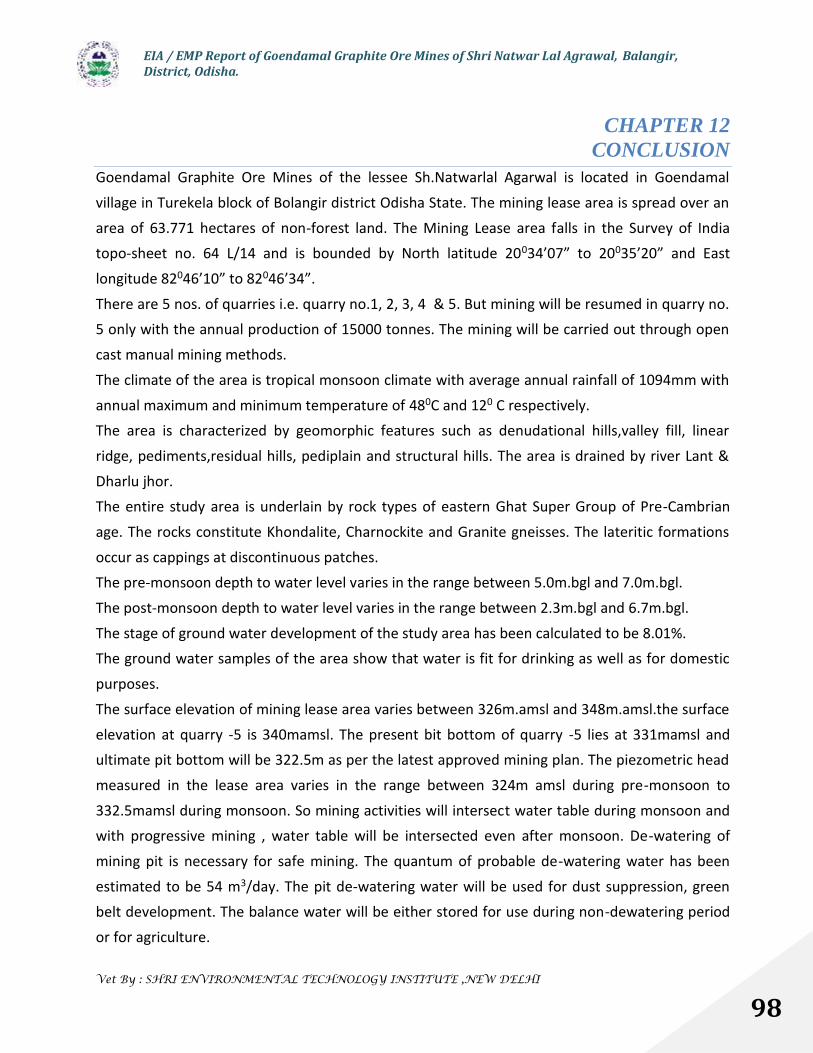
EIA / EMP Report of Goendamal Graphite Ore Mines of Shri Natwar Lal Agrawal, Balangir,District, Odisha.
Vet By : SHRI ENVIRONMENTAL TECHNOLOGY INSTITUTE ,NEW DELHI
98
CHAPTER 12CONCLUSION
Goendamal Graphite Ore Mines of the lessee Sh.Natwarlal Agarwal is located in Goendamal
village in Turekela block of Bolangir district Odisha State. The mining lease area is spread over an
area of 63.771 hectares of non-forest land. The Mining Lease area falls in the Survey of Indiatopo-sheet no. 64 L/14 and is bounded by North latitude 20034’07” to 20035’20” and East
longitude 82046’10” to 82046’34”.
There are 5 nos. of quarries i.e. quarry no.1, 2, 3, 4 & 5. But mining will be resumed in quarry no.5 only with the annual production of 15000 tonnes. The mining will be carried out through open
cast manual mining methods.
The climate of the area is tropical monsoon climate with average annual rainfall of 1094mm with
annual maximum and minimum temperature of 480C and 120 C respectively.The area is characterized by geomorphic features such as denudational hills,valley fill, linear
ridge, pediments,residual hills, pediplain and structural hills. The area is drained by river Lant &
Dharlu jhor.The entire study area is underlain by rock types of eastern Ghat Super Group of Pre-Cambrian
age. The rocks constitute Khondalite, Charnockite and Granite gneisses. The lateritic formations
occur as cappings at discontinuous patches.The pre-monsoon depth to water level varies in the range between 5.0m.bgl and 7.0m.bgl.
The post-monsoon depth to water level varies in the range between 2.3m.bgl and 6.7m.bgl.
The stage of ground water development of the study area has been calculated to be 8.01%.The ground water samples of the area show that water is fit for drinking as well as for domestic
purposes.
The surface elevation of mining lease area varies between 326m.amsl and 348m.amsl.the surface
elevation at quarry -5 is 340mamsl. The present bit bottom of quarry -5 lies at 331mamsl andultimate pit bottom will be 322.5m as per the latest approved mining plan. The piezometric head
measured in the lease area varies in the range between 324m amsl during pre-monsoon to
332.5mamsl during monsoon. So mining activities will intersect water table during monsoon andwith progressive mining , water table will be intersected even after monsoon. De-watering of
mining pit is necessary for safe mining. The quantum of probable de-watering water has been
estimated to be 54 m3/day. The pit de-watering water will be used for dust suppression, greenbelt development. The balance water will be either stored for use during non-dewatering period
or for agriculture.
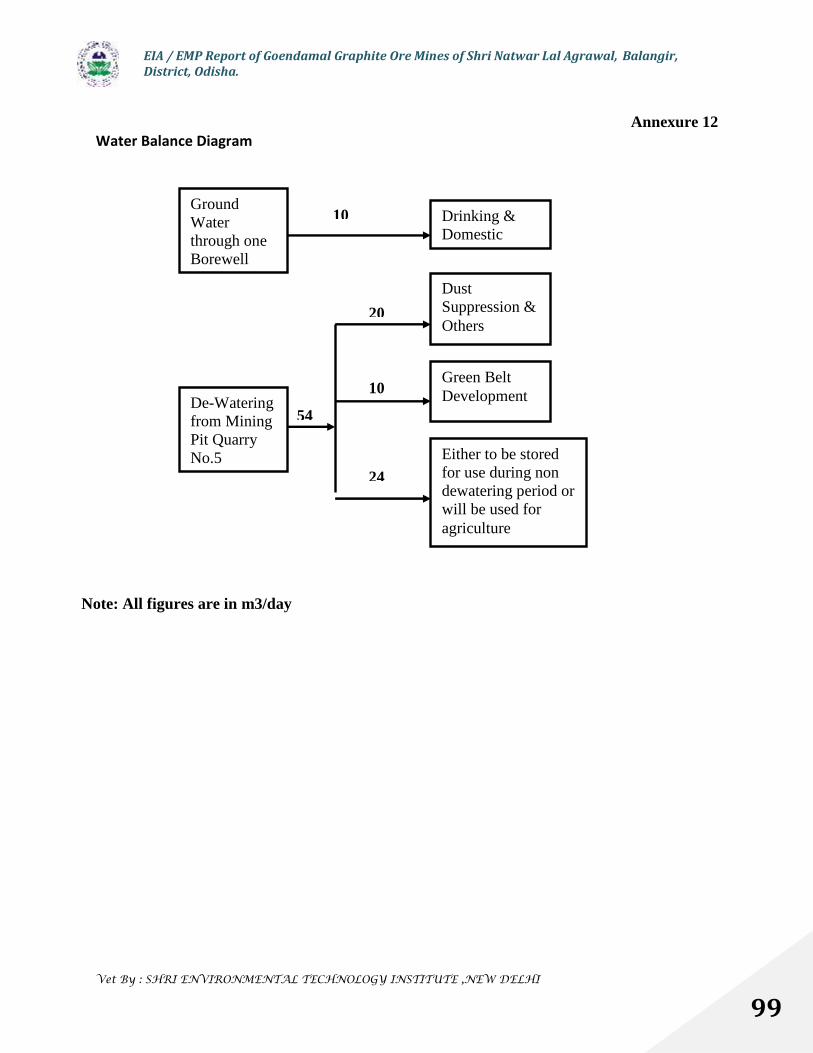
EIA / EMP Report of Goendamal Graphite Ore Mines of Shri Natwar Lal Agrawal, Balangir,District, Odisha.
Vet By : SHRI ENVIRONMENTAL TECHNOLOGY INSTITUTE ,NEW DELHI
99
Annexure 12Water Balance Diagram
GroundWaterthrough oneBorewell
Drinking &Domestic
De-Wateringfrom MiningPit QuarryNo.5
DustSuppression &Others
Green BeltDevelopment
Either to be storedfor use during nondewatering period orwill be used foragriculture
10
54
20
10
24
Note: All figures are in m3/day
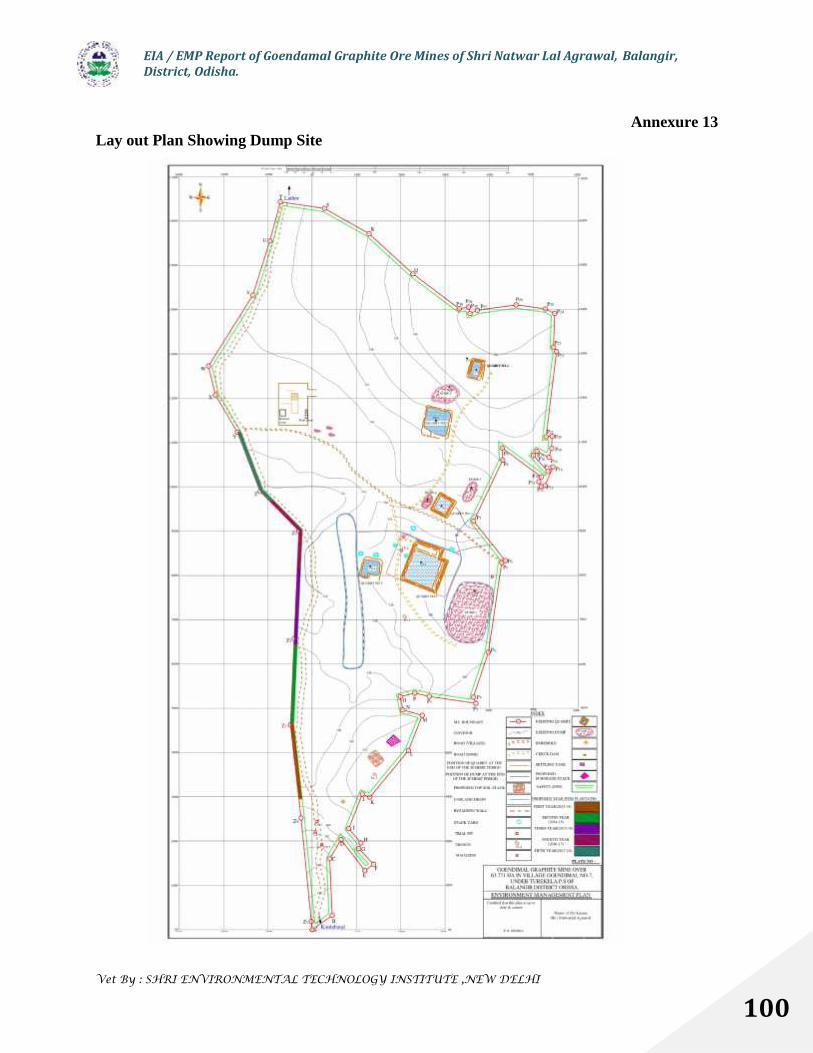
EIA / EMP Report of Goendamal Graphite Ore Mines of Shri Natwar Lal Agrawal, Balangir,District, Odisha.
Vet By : SHRI ENVIRONMENTAL TECHNOLOGY INSTITUTE ,NEW DELHI
100
Annexure 13Lay out Plan Showing Dump Site

EIA / EMP Report of Goendamal Graphite Ore Mines of Shri Natwar Lal Agrawal, Balangir,District, Odisha.
Vet By : SHRI ENVIRONMENTAL TECHNOLOGY INSTITUTE ,NEW DELHI
101
Annexure 14VILL_NAME AREA T_HH T_P T_M T_F SC_P SC_M SC_F ST_P ST_MTurekela 587 386 1725 866 859 220 110 110 380 189Larki 598 313 1316 680 636 180 81 99 165 88Dhamanasar 132 78 383 196 187 48 26 22 88 46Dholmandal 390 137 592 295 297 36 15 21 344 171`Nagphena 245 93 362 172 190 56 28 28 247 112Rautmunda 215 78 308 153 155 60 34 26 40 21Ramod 665 212 750 350 400 112 50 62 181 84Mahulpati 1009 370 1243 615 628 35 19 16 566 278Bahabal 616 208 826 414 412 119 59 60 247 124Gaibahal 340 140 626 308 318 85 46 39 15 10Salepara 316 95 413 200 213 92 44 48 50 23Bahalpadar 444 299 1316 647 669 204 106 98 31 13Bariali 349 99 425 200 225 14 6 8 355 168Kushpali 376 150 672 335 337 105 56 49 289 146Dangarpara 78 36 147 67 80 0 0 0 41 18Kandagad 159 101 490 267 223 197 108 89 0 0Kumbhekela 123 81 298 156 142 8 4 4 16 9Salebhata 890 755 3528 1779 1749 665 326 339 230 106Kalibhana 295 172 806 411 395 81 42 39 195 99Nuapali 302 64 308 160 148 8 5 3 44 22Lohrapali 89 49 190 92 98 89 44 45 86 40Tikarapara 376 454 1800 905 895 243 125 118 126 65Thudibahal 532 151 526 247 279 116 51 65 273 131Debriamunda 200 98 362 183 179 145 71 74 215 111Larki 598 313 1316 680 636 180 81 99 165 88Malpara 171 69 292 154 138 21 11 10 173 88Kendubhata 293 98 422 197 225 81 37 44 62 29Malpara 280 128 485 238 247 81 42 39 137 69Lathor 816 807 4061 2074 1987 458 233 225 330 170Pagania 230 115 533 262 271 131 61 70 37 20Samalaisar 166 138 547 269 278 31 11 20 36 16Ganrai 324 278 1178 589 589 227 116 111 110 58Thakpara 234 99 362 180 182 47 21 26 4 2Mahanilaha 313 88 331 176 155 49 26 23 30 18Malpara 211 98 587 363 224 66 39 27 410 263Jhankaripali 319 145 518 277 241 130 66 64 142 70Dudukamal 268 46 256 161 95 34 18 16 136 78Barahmal 743 176 723 356 367 215 108 107 219 102Bagdor 560 117 453 226 227 38 19 19 83 36Pipalbahal 275 201 877 443 434 21 11 10 96 49Talbhata 149 41 170 83 87 20 8 12 76 39Chandrapur 314 119 469 241 228 54 28 26 216 109Bendra 455 282 1286 671 615 257 129 128 106 48Jamchuan 265 155 587 300 287 100 49 51 154 78Phuljhar 320 84 296 139 157 39 18 21 161 72Jhalialiti 208 75 280 130 150 52 21 31 187 88Jalpankel 143 180 725 360 365 216 107 109 38 14Kandeichhapar 187 113 406 197 209 56 29 27 164 76Sangurjibhata 324 128 489 240 249 85 37 48 307 153Gaindimal 474 147 574 292 282 54 26 28 87 40
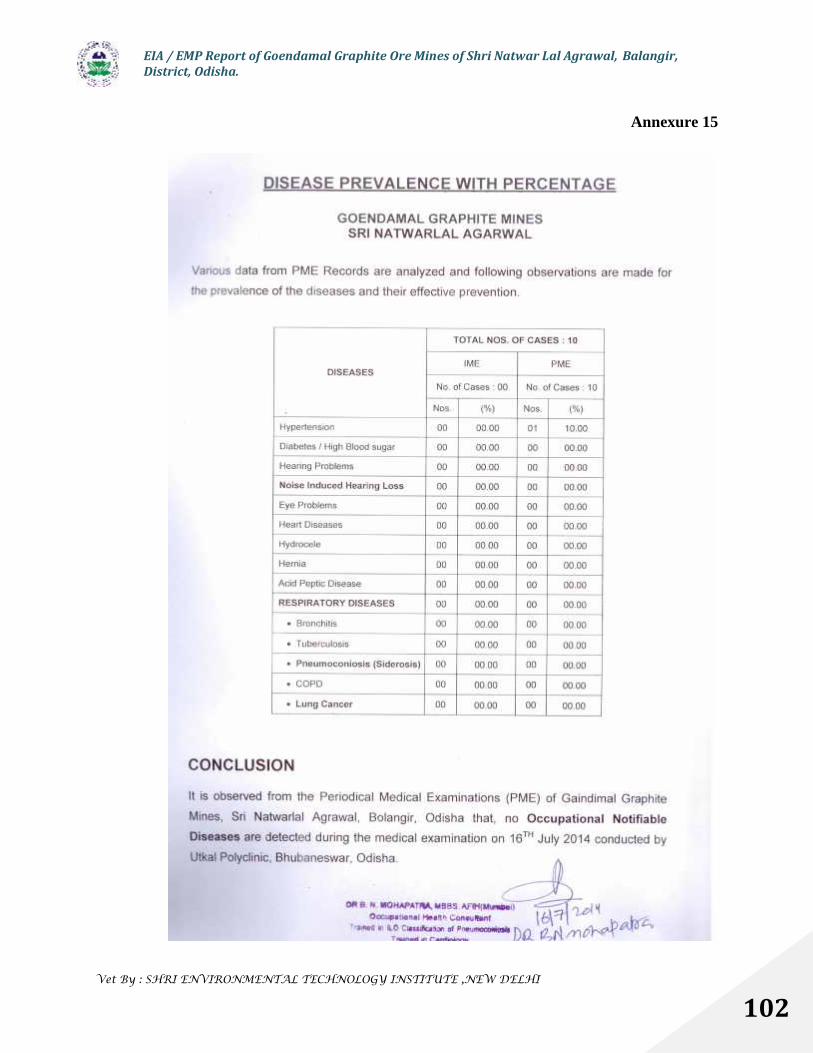
EIA / EMP Report of Goendamal Graphite Ore Mines of Shri Natwar Lal Agrawal, Balangir,District, Odisha.
Vet By : SHRI ENVIRONMENTAL TECHNOLOGY INSTITUTE ,NEW DELHI
102
Annexure 15
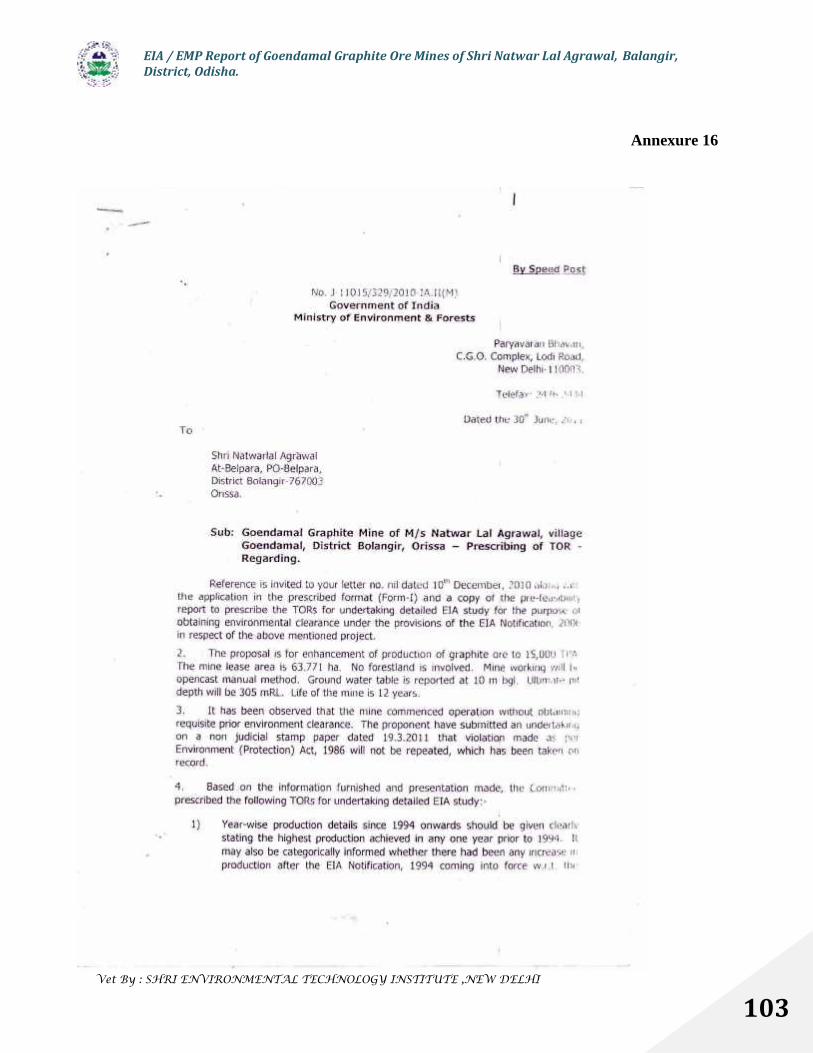
EIA / EMP Report of Goendamal Graphite Ore Mines of Shri Natwar Lal Agrawal, Balangir,District, Odisha.
Vet By : SHRI ENVIRONMENTAL TECHNOLOGY INSTITUTE ,NEW DELHI
103
Annexure 16
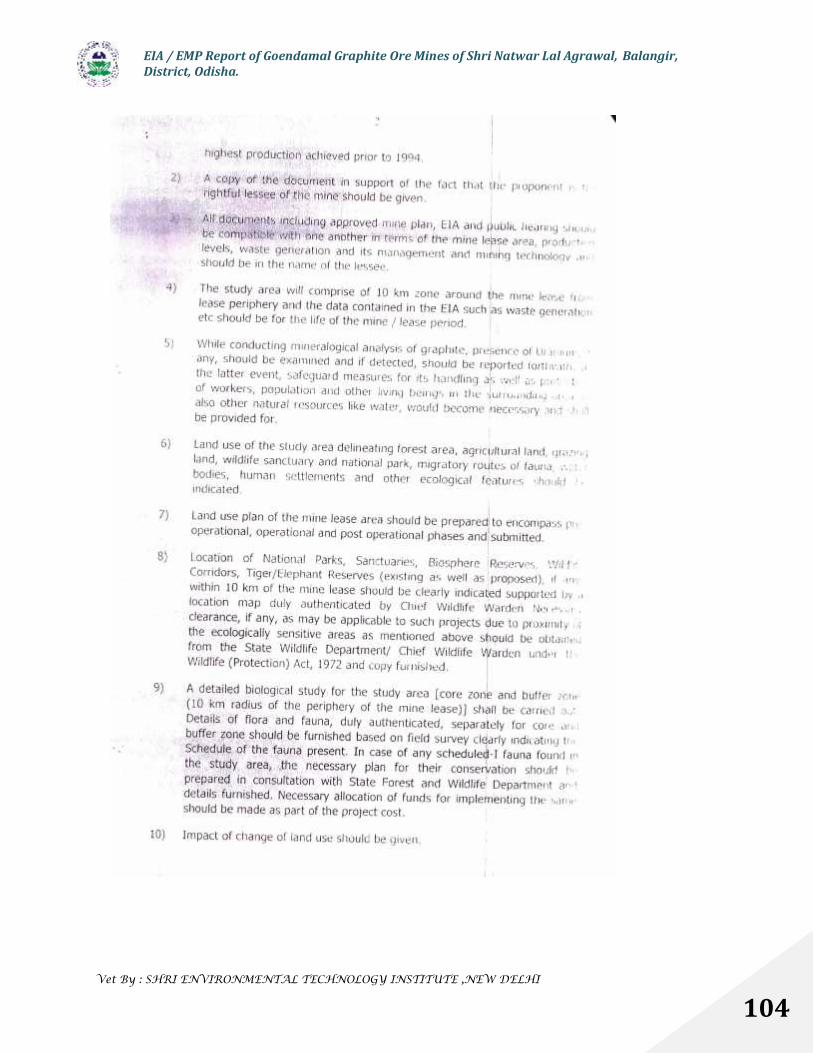
EIA / EMP Report of Goendamal Graphite Ore Mines of Shri Natwar Lal Agrawal, Balangir,District, Odisha.
Vet By : SHRI ENVIRONMENTAL TECHNOLOGY INSTITUTE ,NEW DELHI
104
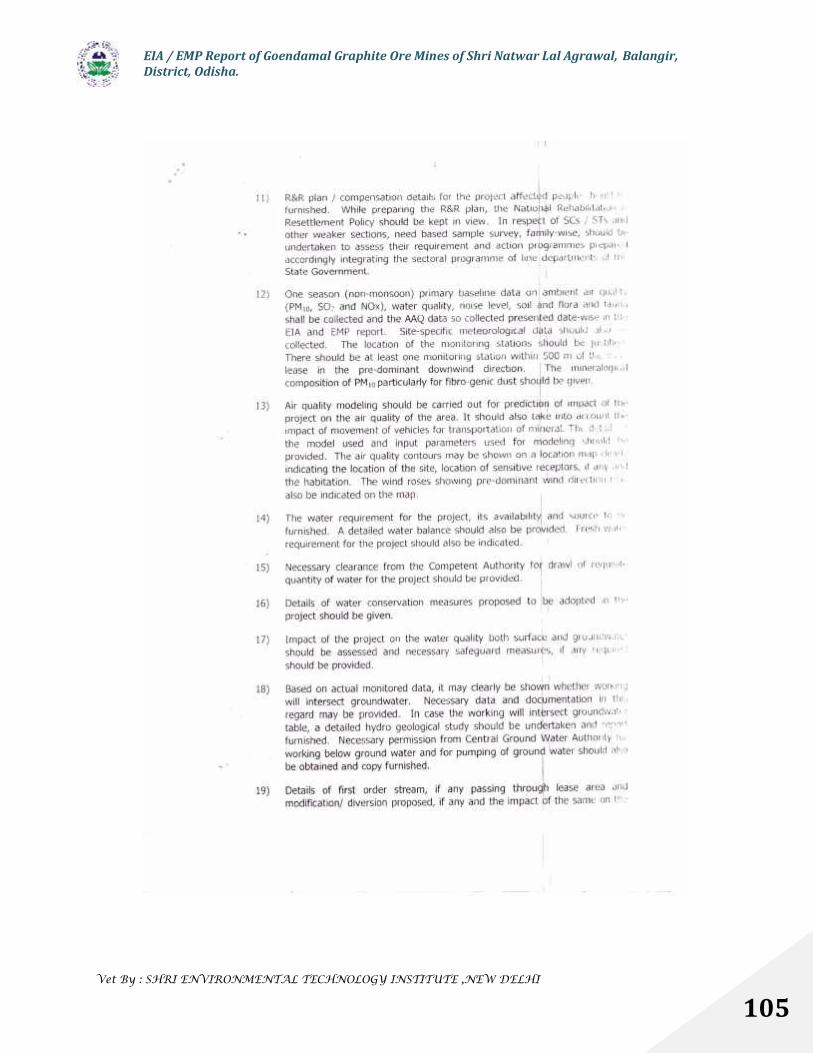
EIA / EMP Report of Goendamal Graphite Ore Mines of Shri Natwar Lal Agrawal, Balangir,District, Odisha.
Vet By : SHRI ENVIRONMENTAL TECHNOLOGY INSTITUTE ,NEW DELHI
105
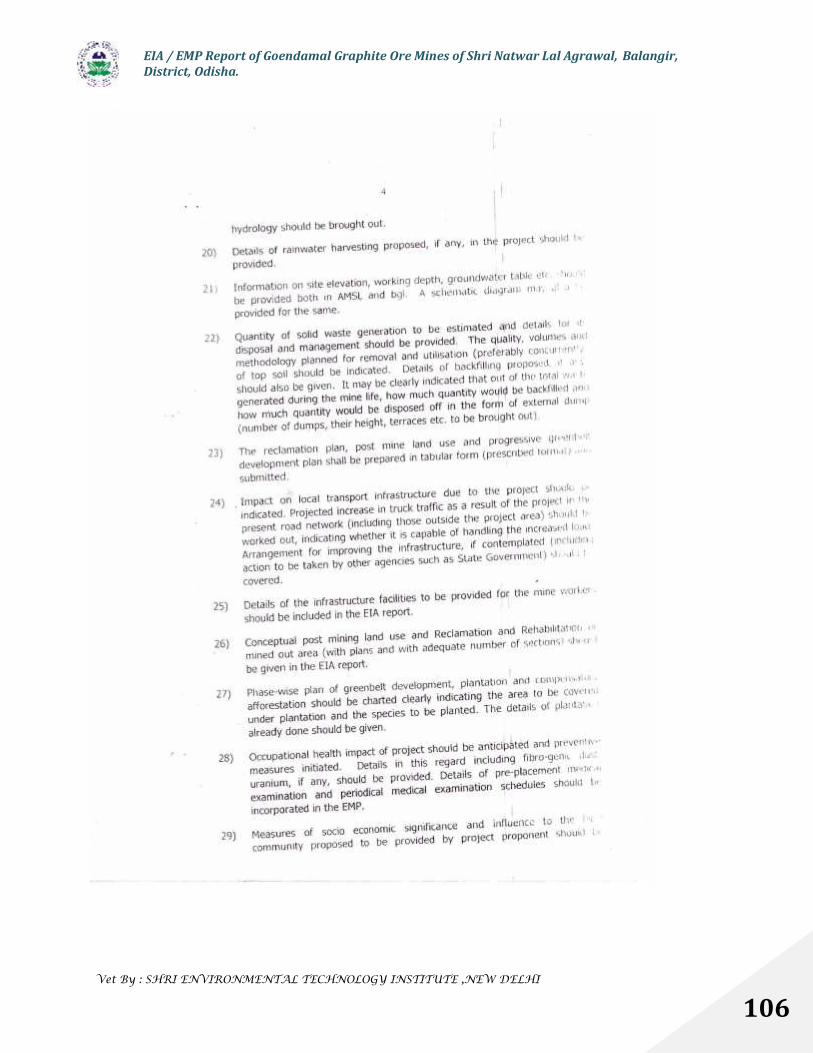
EIA / EMP Report of Goendamal Graphite Ore Mines of Shri Natwar Lal Agrawal, Balangir,District, Odisha.
Vet By : SHRI ENVIRONMENTAL TECHNOLOGY INSTITUTE ,NEW DELHI
106
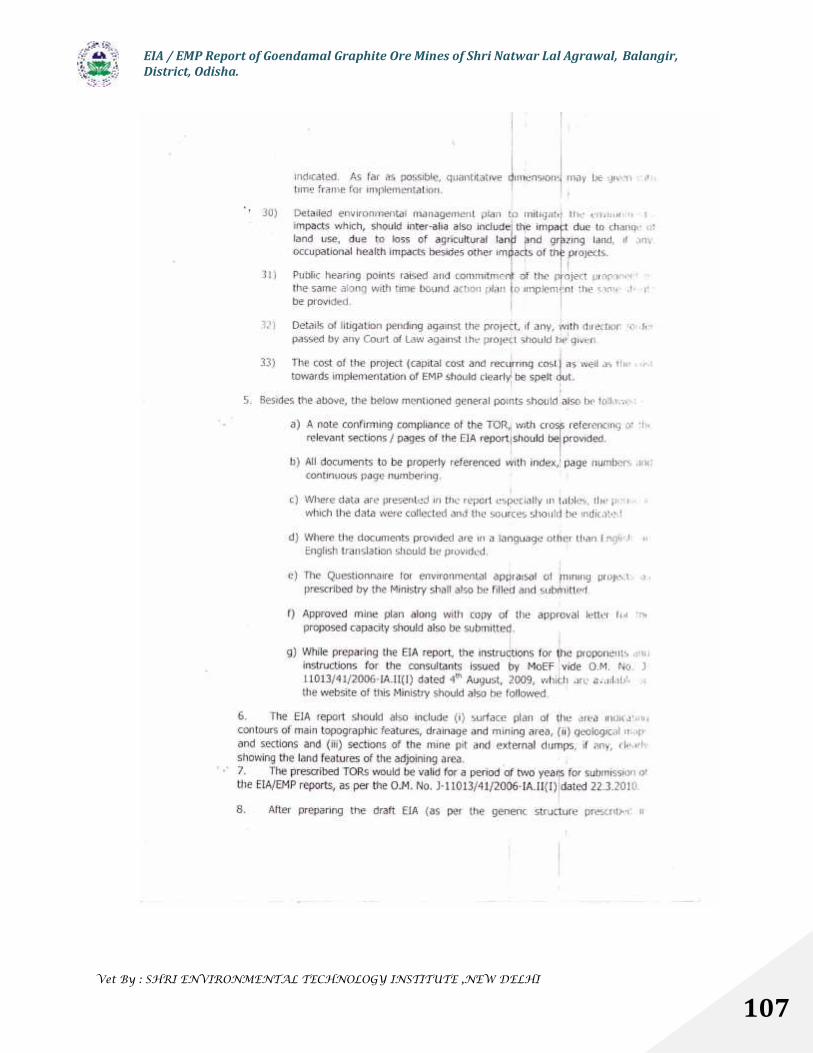
EIA / EMP Report of Goendamal Graphite Ore Mines of Shri Natwar Lal Agrawal, Balangir,District, Odisha.
Vet By : SHRI ENVIRONMENTAL TECHNOLOGY INSTITUTE ,NEW DELHI
107
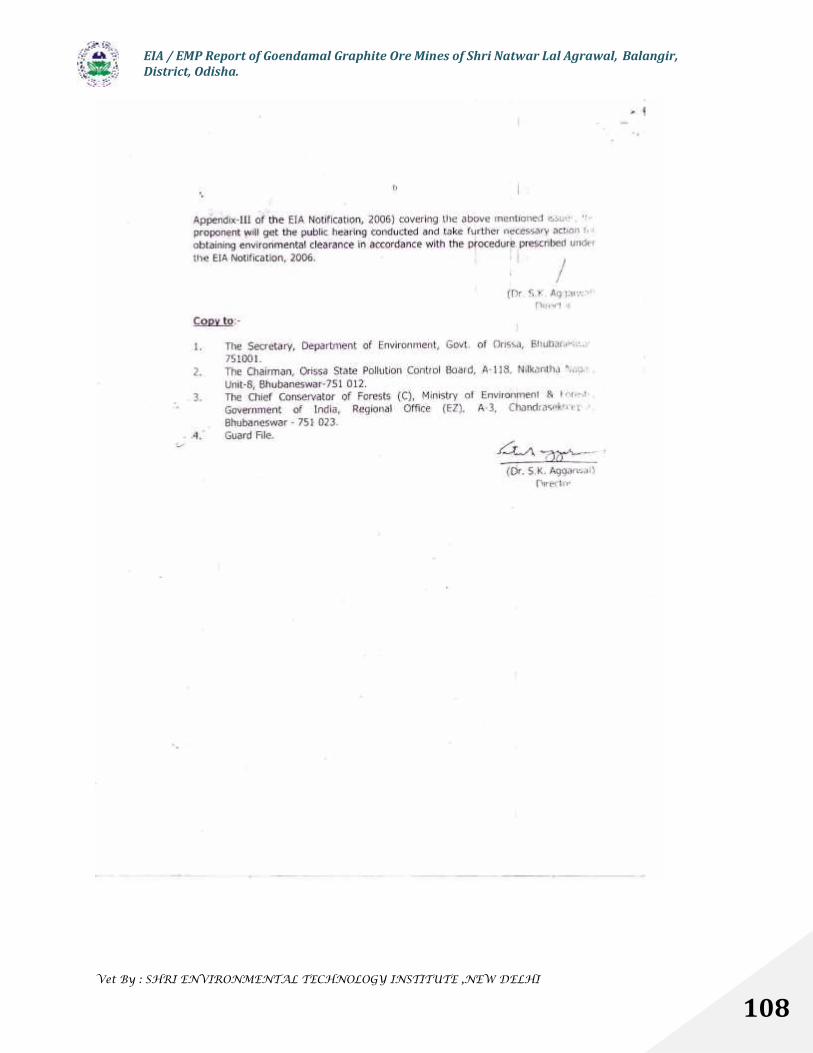
EIA / EMP Report of Goendamal Graphite Ore Mines of Shri Natwar Lal Agrawal, Balangir,District, Odisha.
Vet By : SHRI ENVIRONMENTAL TECHNOLOGY INSTITUTE ,NEW DELHI
108
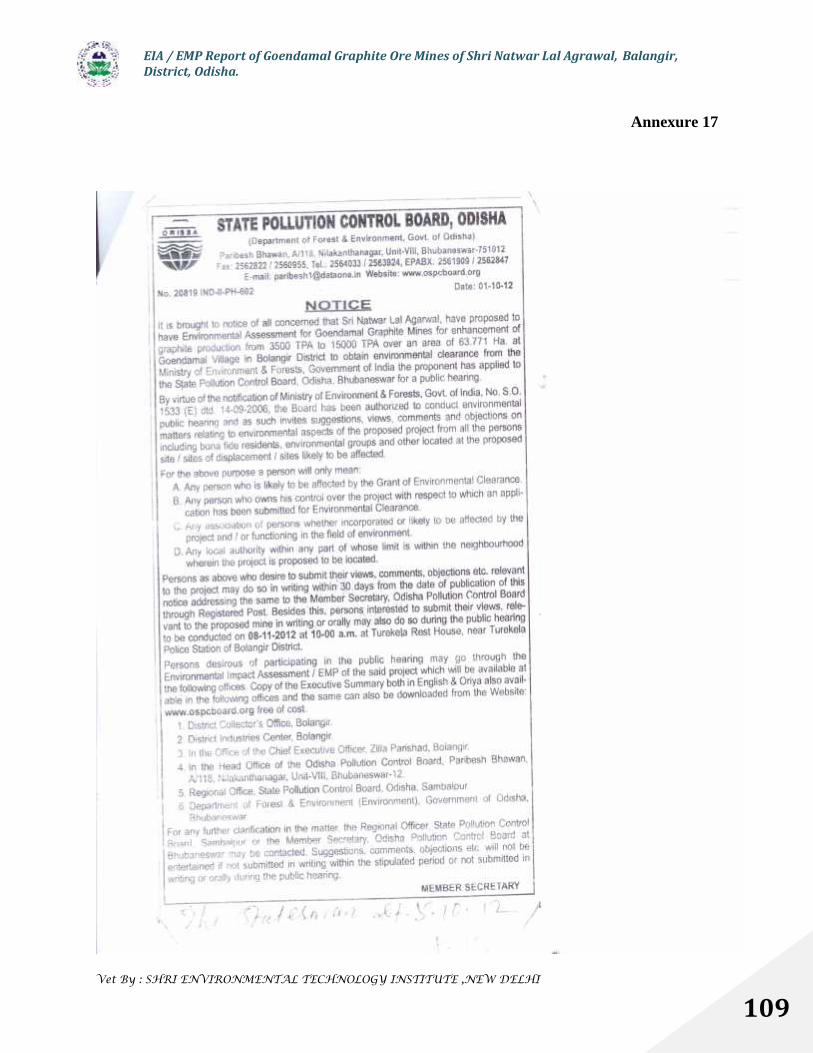
EIA / EMP Report of Goendamal Graphite Ore Mines of Shri Natwar Lal Agrawal, Balangir,District, Odisha.
Vet By : SHRI ENVIRONMENTAL TECHNOLOGY INSTITUTE ,NEW DELHI
109
Annexure 17
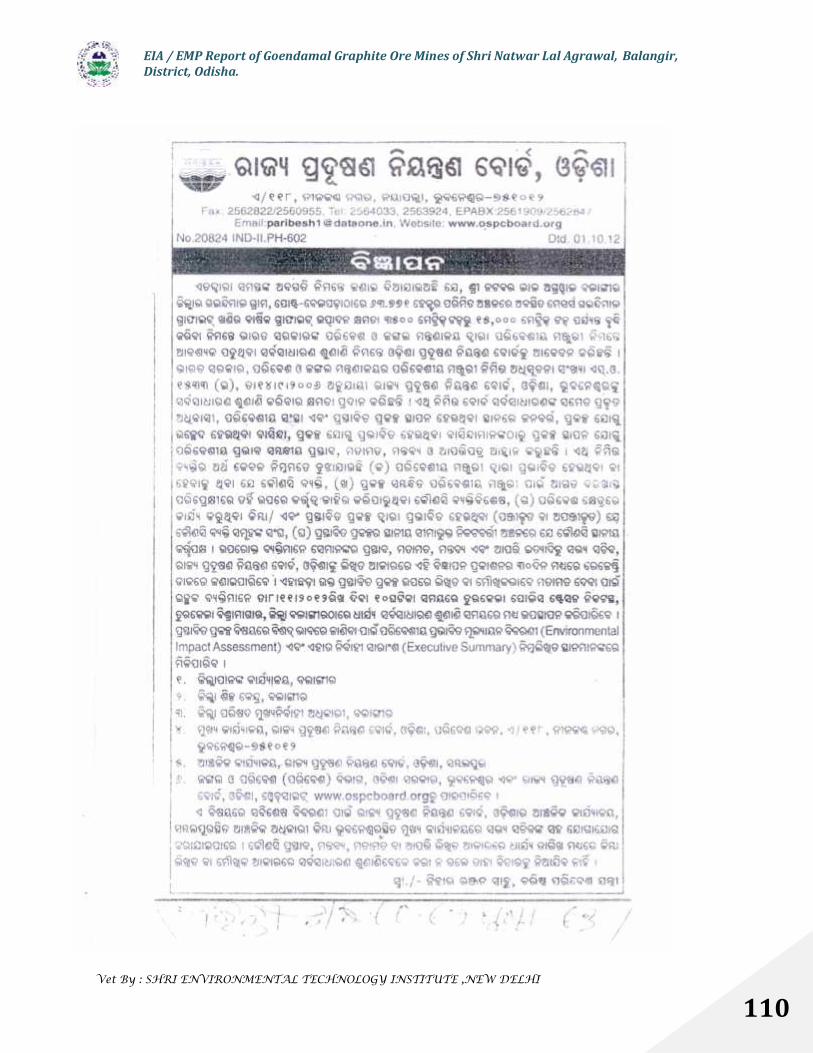
EIA / EMP Report of Goendamal Graphite Ore Mines of Shri Natwar Lal Agrawal, Balangir,District, Odisha.
Vet By : SHRI ENVIRONMENTAL TECHNOLOGY INSTITUTE ,NEW DELHI
110
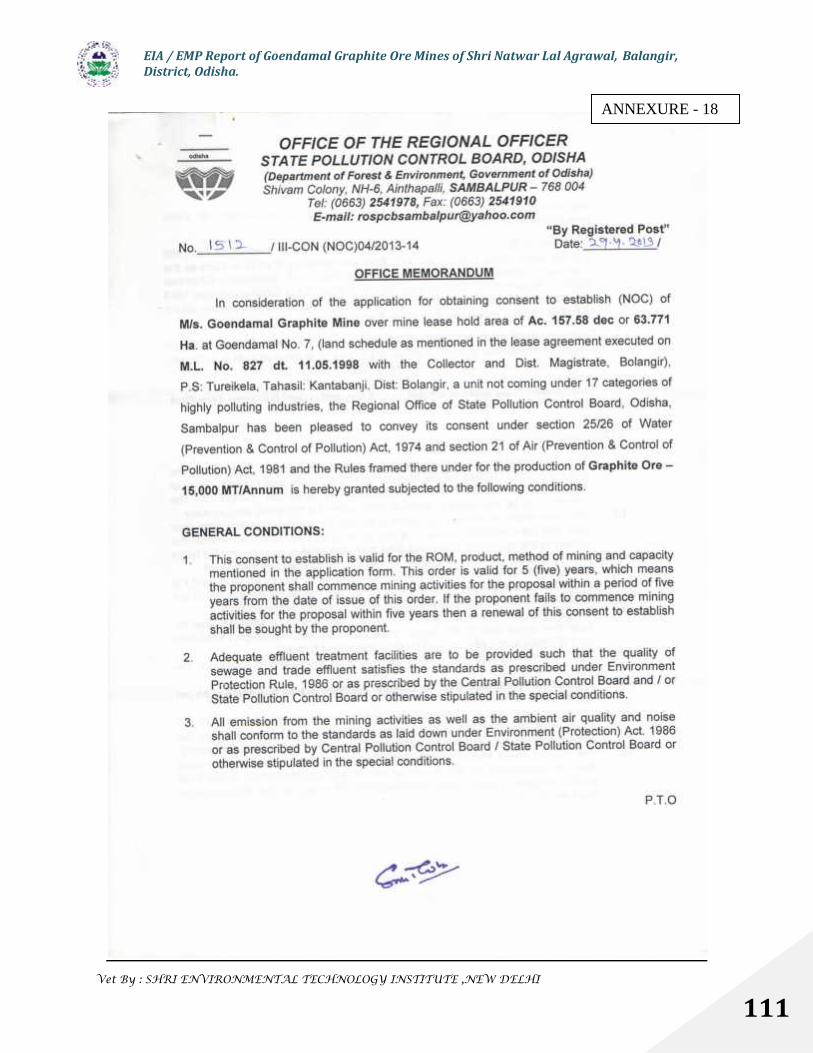
EIA / EMP Report of Goendamal Graphite Ore Mines of Shri Natwar Lal Agrawal, Balangir,District, Odisha.
Vet By : SHRI ENVIRONMENTAL TECHNOLOGY INSTITUTE ,NEW DELHI
111
ANNEXURE - 18
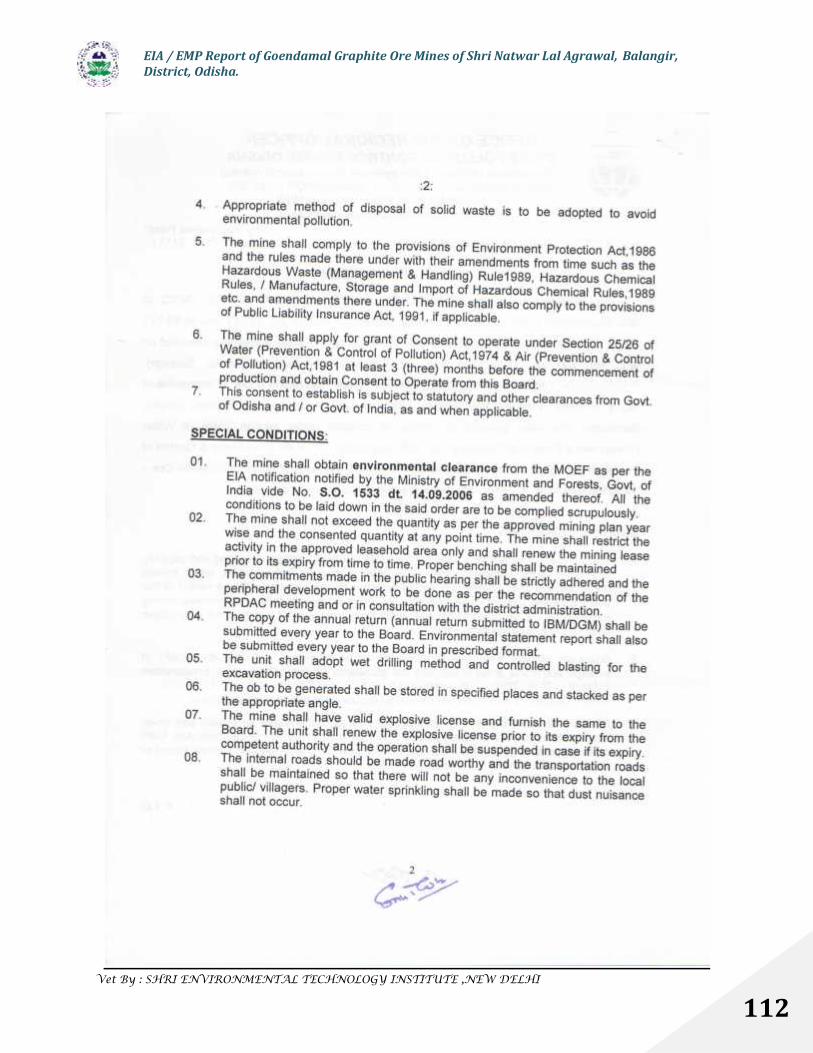
EIA / EMP Report of Goendamal Graphite Ore Mines of Shri Natwar Lal Agrawal, Balangir,District, Odisha.
Vet By : SHRI ENVIRONMENTAL TECHNOLOGY INSTITUTE ,NEW DELHI
112
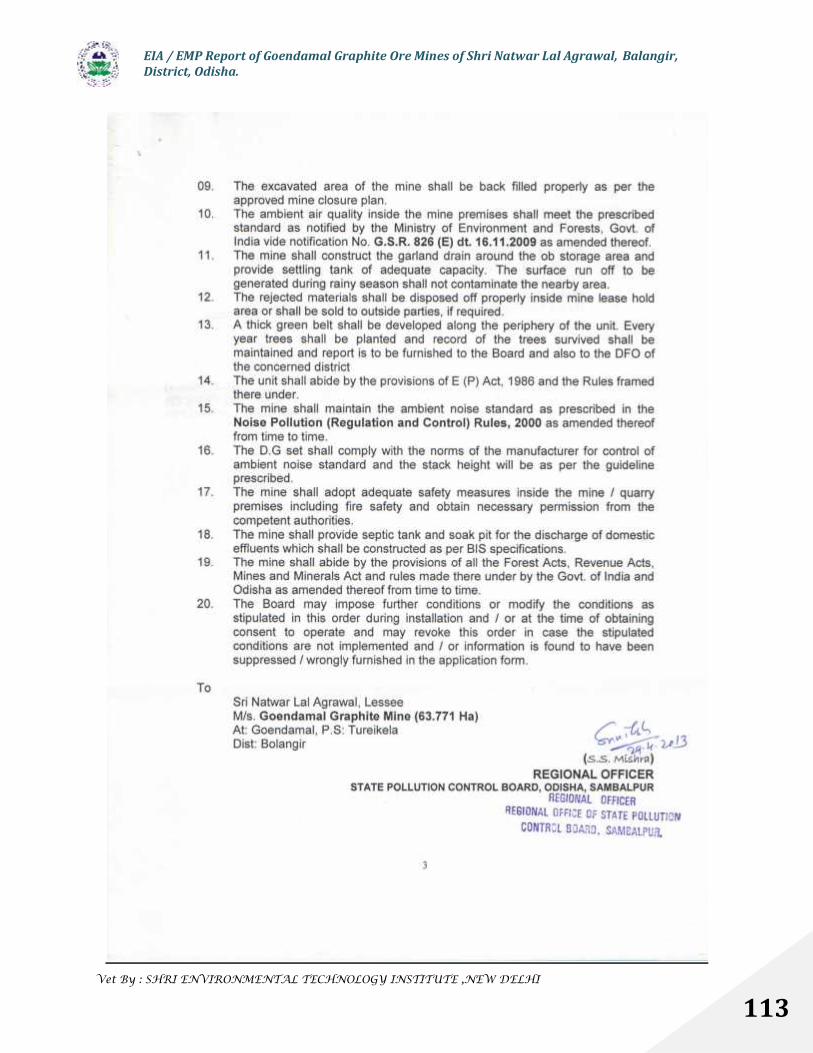
EIA / EMP Report of Goendamal Graphite Ore Mines of Shri Natwar Lal Agrawal, Balangir,District, Odisha.
Vet By : SHRI ENVIRONMENTAL TECHNOLOGY INSTITUTE ,NEW DELHI
113
EIA / EMP Report of Goendamal Graphite Ore Mines of Shri Natwar Lal Agrawal, Balangir,District, Odisha.
Vet By : SHRI ENVIRONMENTAL TECHNOLOGY INSTITUTE ,NEW DELHI
114

EIA / EMP Report of Goendamal Graphite Ore Mines of Shri Natwar Lal Agrawal, Balangir,District, Odisha.
Vet By : SHRI ENVIRONMENTAL TECHNOLOGY INSTITUTE ,NEW DELHI
115
ANNEXURE - 19
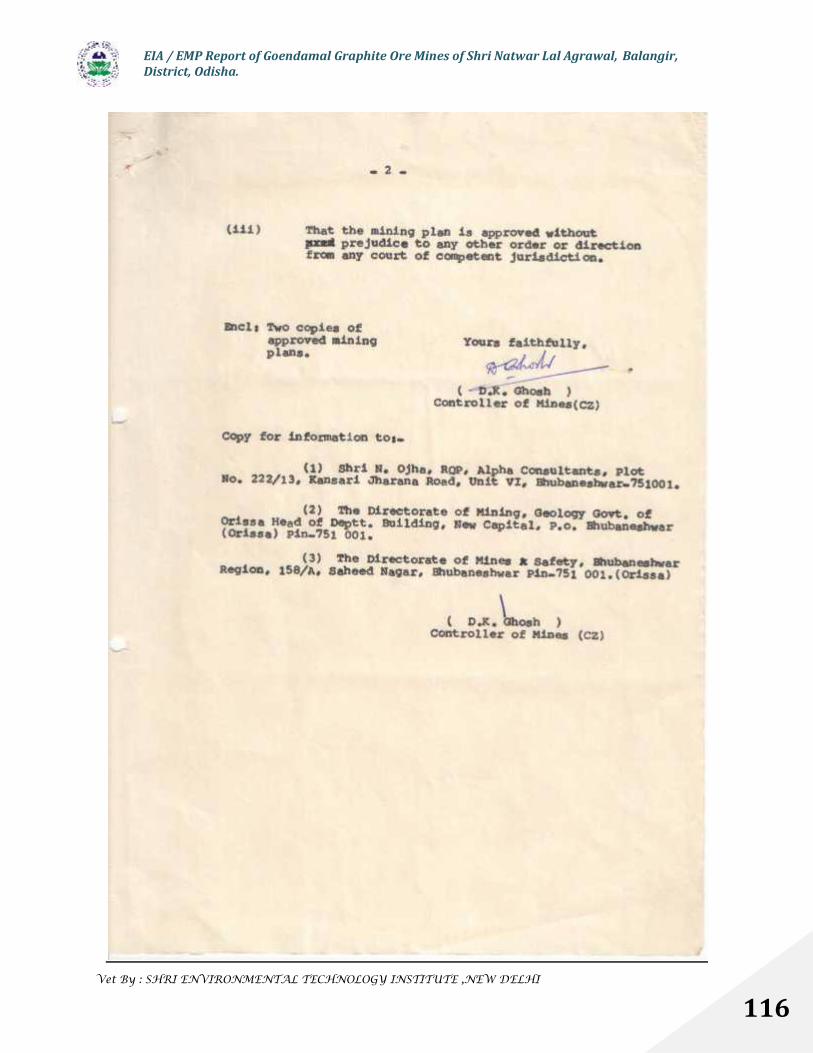
EIA / EMP Report of Goendamal Graphite Ore Mines of Shri Natwar Lal Agrawal, Balangir,District, Odisha.
Vet By : SHRI ENVIRONMENTAL TECHNOLOGY INSTITUTE ,NEW DELHI
116
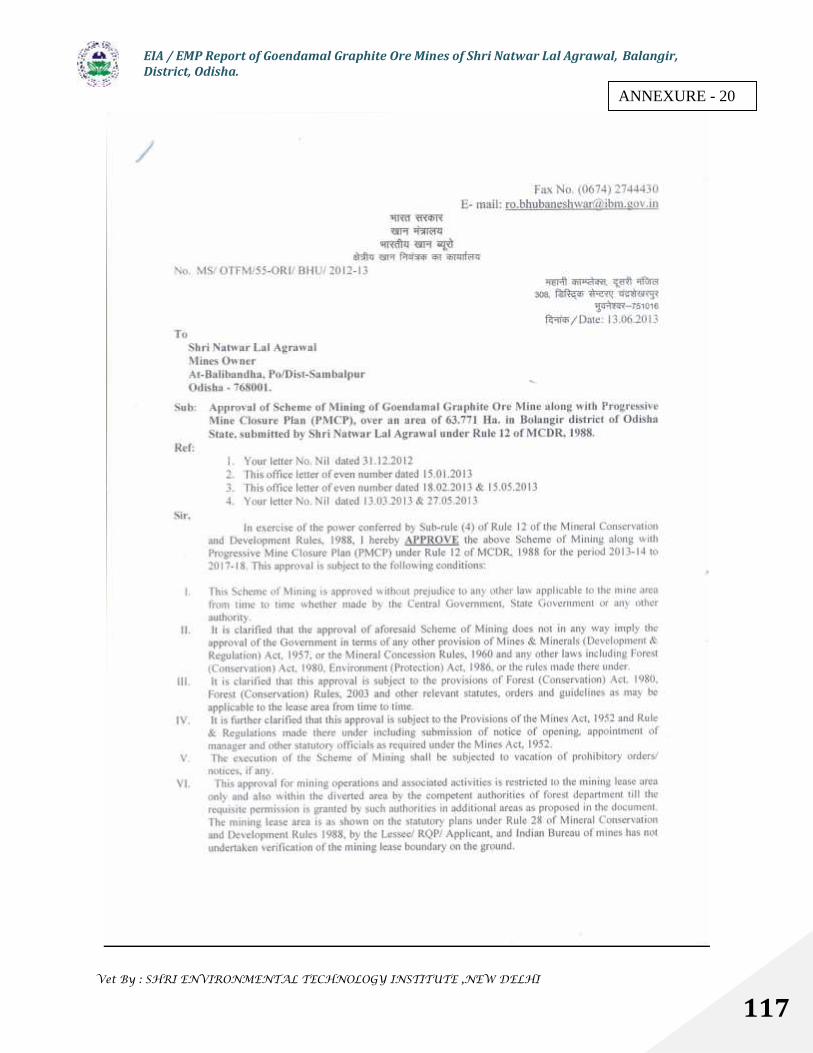
EIA / EMP Report of Goendamal Graphite Ore Mines of Shri Natwar Lal Agrawal, Balangir,District, Odisha.
Vet By : SHRI ENVIRONMENTAL TECHNOLOGY INSTITUTE ,NEW DELHI
117
ANNEXURE - 20
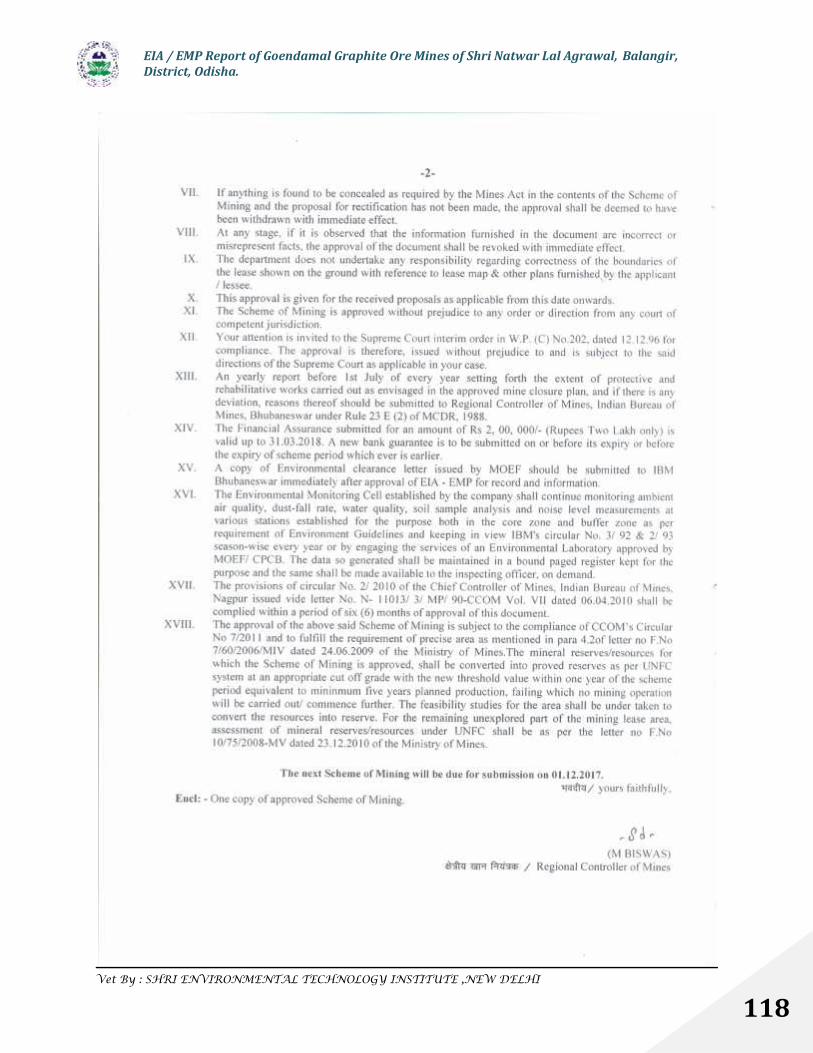
EIA / EMP Report of Goendamal Graphite Ore Mines of Shri Natwar Lal Agrawal, Balangir,District, Odisha.
Vet By : SHRI ENVIRONMENTAL TECHNOLOGY INSTITUTE ,NEW DELHI
118
EIA / EMP Report of Goendamal Graphite Ore Mines of Shri Natwar Lal Agrawal, Balangir,District, Odisha.
Vet By : SHRI ENVIRONMENTAL TECHNOLOGY INSTITUTE ,NEW DELHI
119
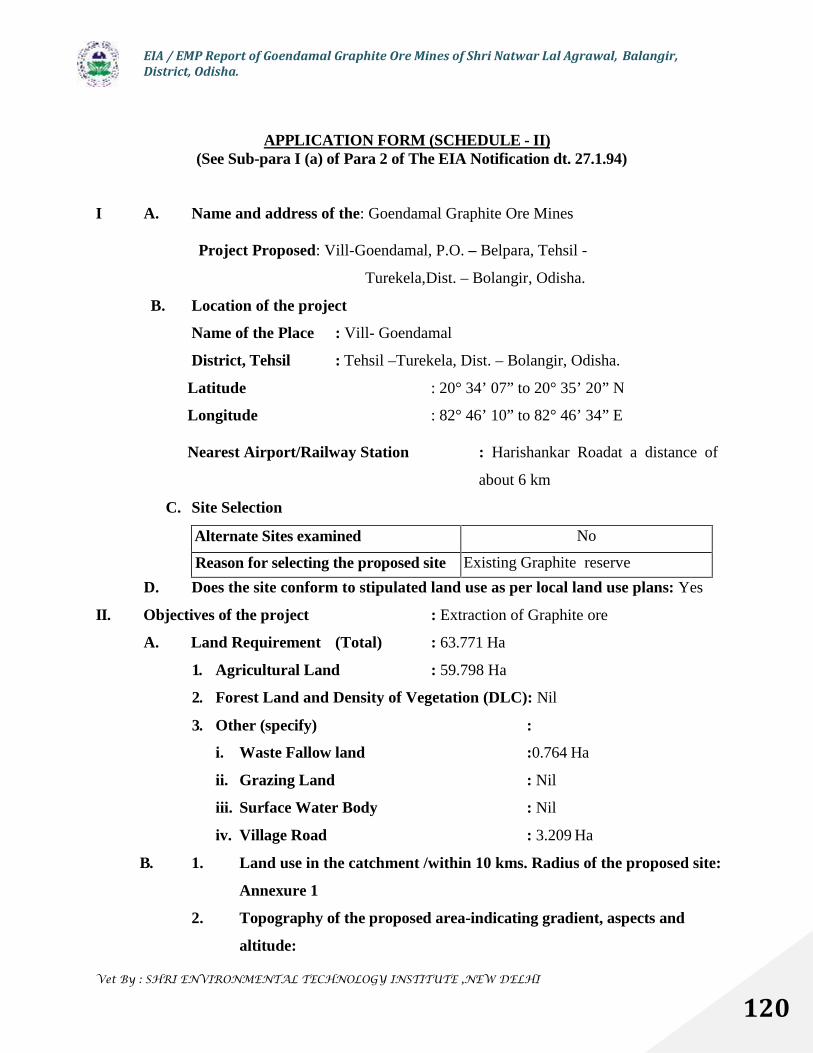
EIA / EMP Report of Goendamal Graphite Ore Mines of Shri Natwar Lal Agrawal, Balangir,District, Odisha.
Vet By : SHRI ENVIRONMENTAL TECHNOLOGY INSTITUTE ,NEW DELHI
120
APPLICATION FORM (SCHEDULE - II)(See Sub-para I (a) of Para 2 of The EIA Notification dt. 27.1.94)
I A. Name and address of the: Goendamal Graphite Ore Mines
Project Proposed: Vill-Goendamal, P.O. – Belpara, Tehsil -
Turekela,Dist. – Bolangir, Odisha.
B. Location of the project
Name of the Place : Vill- Goendamal
District, Tehsil : Tehsil –Turekela, Dist. – Bolangir, Odisha.
Latitude : 20° 34’ 07” to 20° 35’ 20” N
Longitude : 82° 46’ 10” to 82° 46’ 34” E
Nearest Airport/Railway Station : Harishankar Roadat a distance of
about 6 km
C. Site Selection
Alternate Sites examined No
Reason for selecting the proposed site Existing Graphite reserve
D. Does the site conform to stipulated land use as per local land use plans: Yes
II. Objectives of the project : Extraction of Graphite ore
A. Land Requirement (Total) : 63.771 Ha
1. Agricultural Land : 59.798 Ha
2. Forest Land and Density of Vegetation (DLC): Nil
3. Other (specify) :
i. Waste Fallow land :0.764 Ha
ii. Grazing Land : Nil
iii. Surface Water Body : Nil
iv. Village Road : 3.209 Ha
B. 1. Land use in the catchment /within 10 kms. Radius of the proposed site:
Annexure 1
2. Topography of the proposed area-indicating gradient, aspects and
altitude:
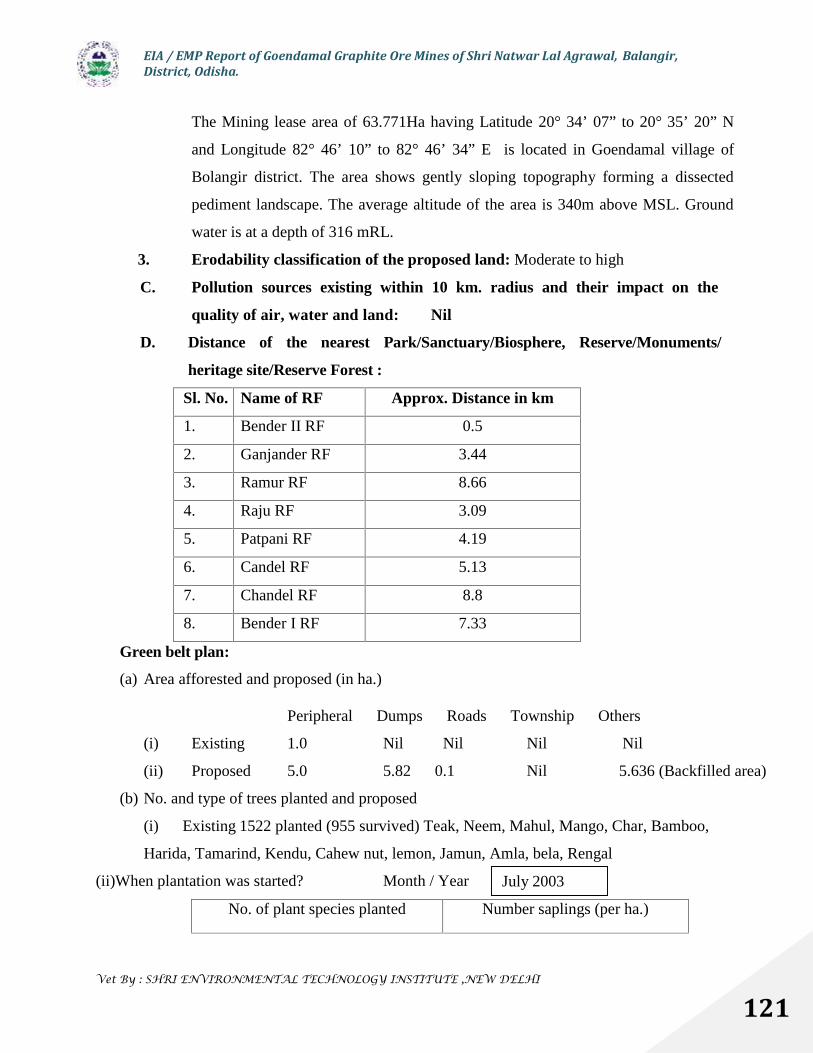
EIA / EMP Report of Goendamal Graphite Ore Mines of Shri Natwar Lal Agrawal, Balangir,District, Odisha.
Vet By : SHRI ENVIRONMENTAL TECHNOLOGY INSTITUTE ,NEW DELHI
121
The Mining lease area of 63.771Ha having Latitude 20° 34’ 07” to 20° 35’ 20” N
and Longitude 82° 46’ 10” to 82° 46’ 34” E is located in Goendamal village of
Bolangir district. The area shows gently sloping topography forming a dissected
pediment landscape. The average altitude of the area is 340m above MSL. Ground
water is at a depth of 316 mRL.
3. Erodability classification of the proposed land: Moderate to high
C. Pollution sources existing within 10 km. radius and their impact on the
quality of air, water and land: Nil
D. Distance of the nearest Park/Sanctuary/Biosphere, Reserve/Monuments/
heritage site/Reserve Forest :
Sl. No. Name of RF Approx. Distance in km
1. Bender II RF 0.5
2. Ganjander RF 3.44
3. Ramur RF 8.66
4. Raju RF 3.09
5. Patpani RF 4.19
6. Candel RF 5.13
7. Chandel RF 8.8
8. Bender I RF 7.33
Green belt plan:
(a) Area afforested and proposed (in ha.)
Peripheral Dumps Roads Township Others
(i) Existing 1.0 Nil Nil Nil Nil
(ii) Proposed 5.0 5.82 0.1 Nil 5.636 (Backfilled area)
(b) No. and type of trees planted and proposed
(i) Existing 1522 planted (955 survived) Teak, Neem, Mahul, Mango, Char, Bamboo,
Harida, Tamarind, Kendu, Cahew nut, lemon, Jamun, Amla, bela, Rengal
(ii)When plantation was started? Month / Year
No. of plant species planted Number saplings (per ha.)
July 2003
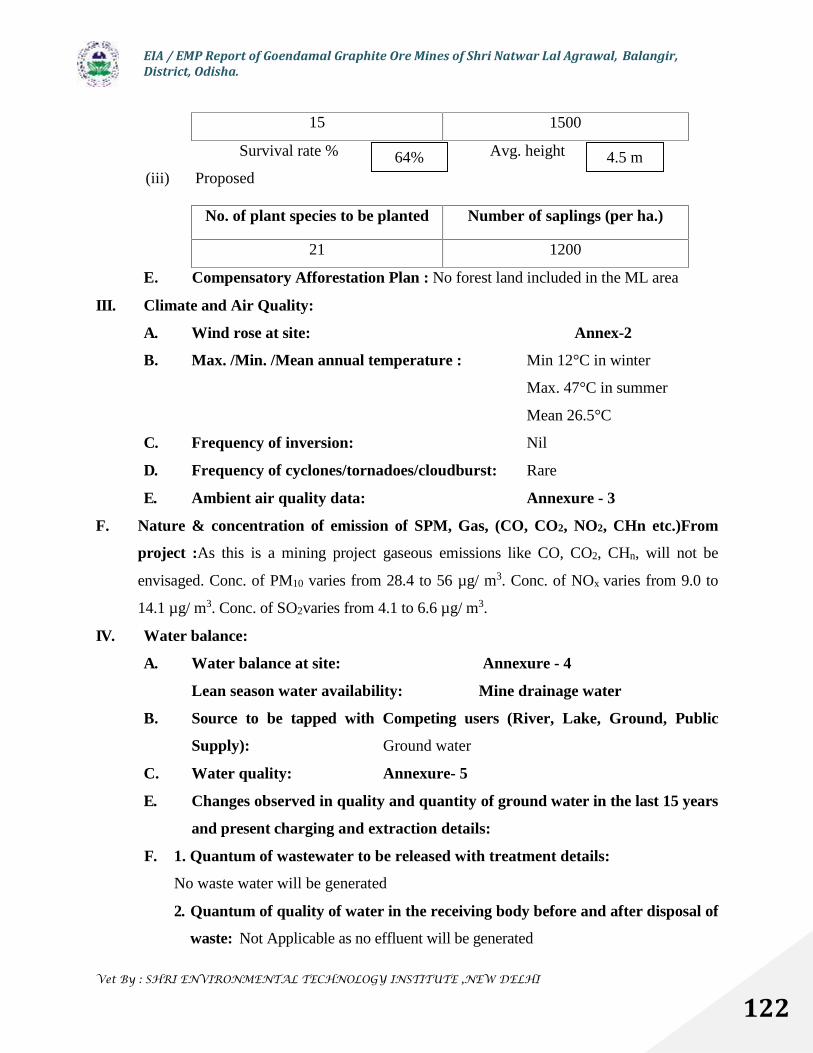
EIA / EMP Report of Goendamal Graphite Ore Mines of Shri Natwar Lal Agrawal, Balangir,District, Odisha.
Vet By : SHRI ENVIRONMENTAL TECHNOLOGY INSTITUTE ,NEW DELHI
122
15 1500
Survival rate % Avg. height
(iii) Proposed
No. of plant species to be planted Number of saplings (per ha.)
21 1200
E. Compensatory Afforestation Plan : No forest land included in the ML area
III. Climate and Air Quality:
A. Wind rose at site: Annex-2
B. Max. /Min. /Mean annual temperature : Min 12°C in winter
Max. 47°C in summer
Mean 26.5°C
C. Frequency of inversion: Nil
D. Frequency of cyclones/tornadoes/cloudburst: Rare
E. Ambient air quality data: Annexure - 3
F. Nature & concentration of emission of SPM, Gas, (CO, CO2, NO2, CHn etc.)From
project :As this is a mining project gaseous emissions like CO, CO2, CHn, will not be
envisaged. Conc. of PM10 varies from 28.4 to 56 µg/ m3. Conc. of NOx varies from 9.0 to
14.1 µg/ m3. Conc. of SO2varies from 4.1 to 6.6 µg/ m3.
IV. Water balance:
A. Water balance at site: Annexure - 4
Lean season water availability: Mine drainage water
B. Source to be tapped with Competing users (River, Lake, Ground, Public
Supply): Ground water
C. Water quality: Annexure- 5
E. Changes observed in quality and quantity of ground water in the last 15 years
and present charging and extraction details:
F. 1. Quantum of wastewater to be released with treatment details:
No waste water will be generated
2. Quantum of quality of water in the receiving body before and after disposal of
waste: Not Applicable as no effluent will be generated
4.5 m64%
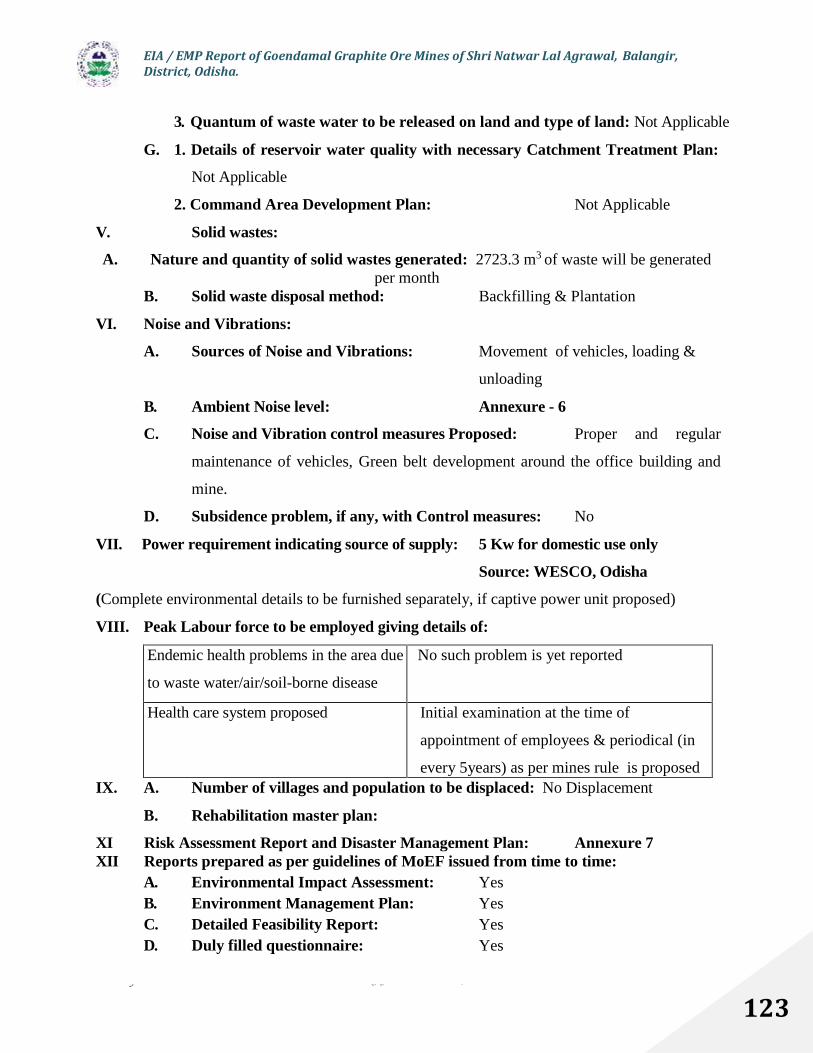
EIA / EMP Report of Goendamal Graphite Ore Mines of Shri Natwar Lal Agrawal, Balangir,District, Odisha.
Vet By : SHRI ENVIRONMENTAL TECHNOLOGY INSTITUTE ,NEW DELHI
123
3. Quantum of waste water to be released on land and type of land: Not Applicable
G. 1. Details of reservoir water quality with necessary Catchment Treatment Plan:
Not Applicable
2. Command Area Development Plan: Not Applicable
V. Solid wastes:
A. Nature and quantity of solid wastes generated: 2723.3 m3 of waste will be generatedper month
B. Solid waste disposal method: Backfilling & Plantation
VI. Noise and Vibrations:
A. Sources of Noise and Vibrations: Movement of vehicles, loading &
unloading
B. Ambient Noise level: Annexure - 6
C. Noise and Vibration control measures Proposed: Proper and regular
maintenance of vehicles, Green belt development around the office building and
mine.
D. Subsidence problem, if any, with Control measures: No
VII. Power requirement indicating source of supply: 5 Kw for domestic use only
Source: WESCO, Odisha
(Complete environmental details to be furnished separately, if captive power unit proposed)
VIII. Peak Labour force to be employed giving details of:
Endemic health problems in the area due
to waste water/air/soil-borne disease
No such problem is yet reported
Health care system proposed Initial examination at the time of
appointment of employees & periodical (in
every 5years) as per mines rule is proposedIX. A. Number of villages and population to be displaced: No Displacement
B. Rehabilitation master plan:
XI Risk Assessment Report and Disaster Management Plan: Annexure 7XII Reports prepared as per guidelines of MoEF issued from time to time:
A. Environmental Impact Assessment: YesB. Environment Management Plan: YesC. Detailed Feasibility Report: YesD. Duly filled questionnaire: Yes
EIA / EMP Report of Goendamal Graphite Ore Mines of Shri Natwar Lal Agrawal, Balangir,District, Odisha.
Vet By : SHRI ENVIRONMENTAL TECHNOLOGY INSTITUTE ,NEW DELHI
124
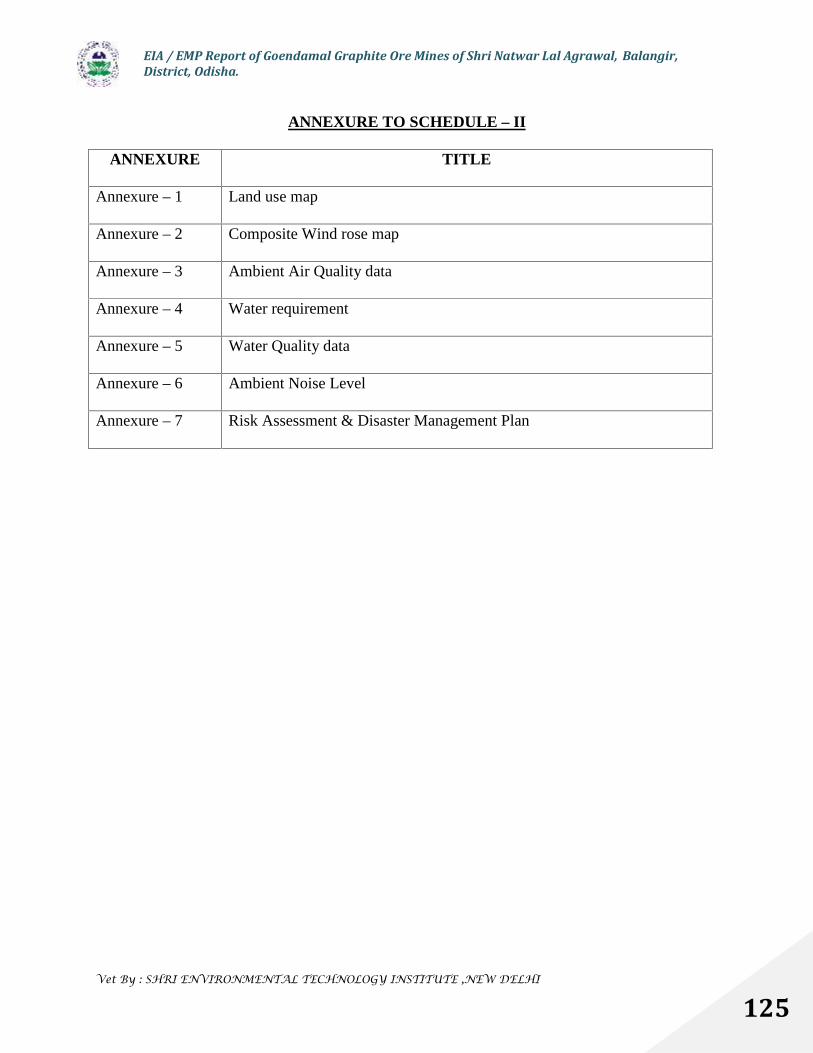
EIA / EMP Report of Goendamal Graphite Ore Mines of Shri Natwar Lal Agrawal, Balangir,District, Odisha.
Vet By : SHRI ENVIRONMENTAL TECHNOLOGY INSTITUTE ,NEW DELHI
125
ANNEXURE TO SCHEDULE – II
ANNEXURE TITLE
Annexure – 1 Land use map
Annexure – 2 Composite Wind rose map
Annexure – 3 Ambient Air Quality data
Annexure – 4 Water requirement
Annexure – 5 Water Quality data
Annexure – 6 Ambient Noise Level
Annexure – 7 Risk Assessment & Disaster Management Plan
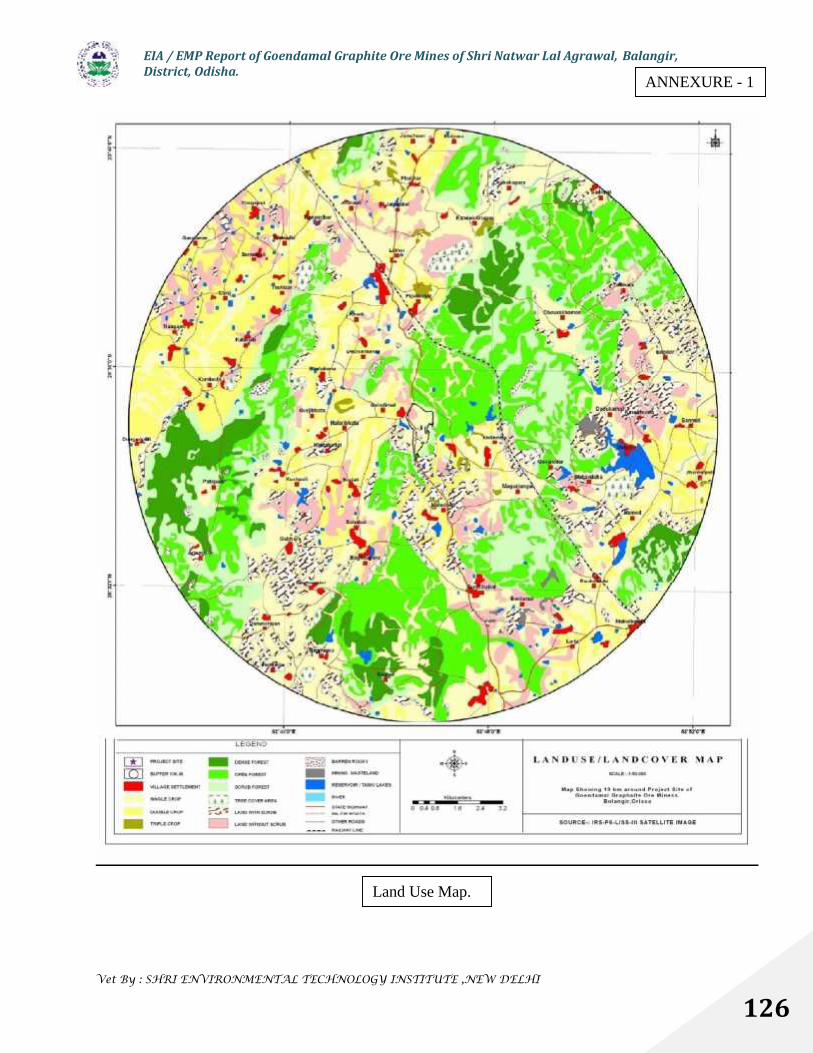
EIA / EMP Report of Goendamal Graphite Ore Mines of Shri Natwar Lal Agrawal, Balangir,District, Odisha.
Vet By : SHRI ENVIRONMENTAL TECHNOLOGY INSTITUTE ,NEW DELHI
126
Land Use Map.
ANNEXURE - 1
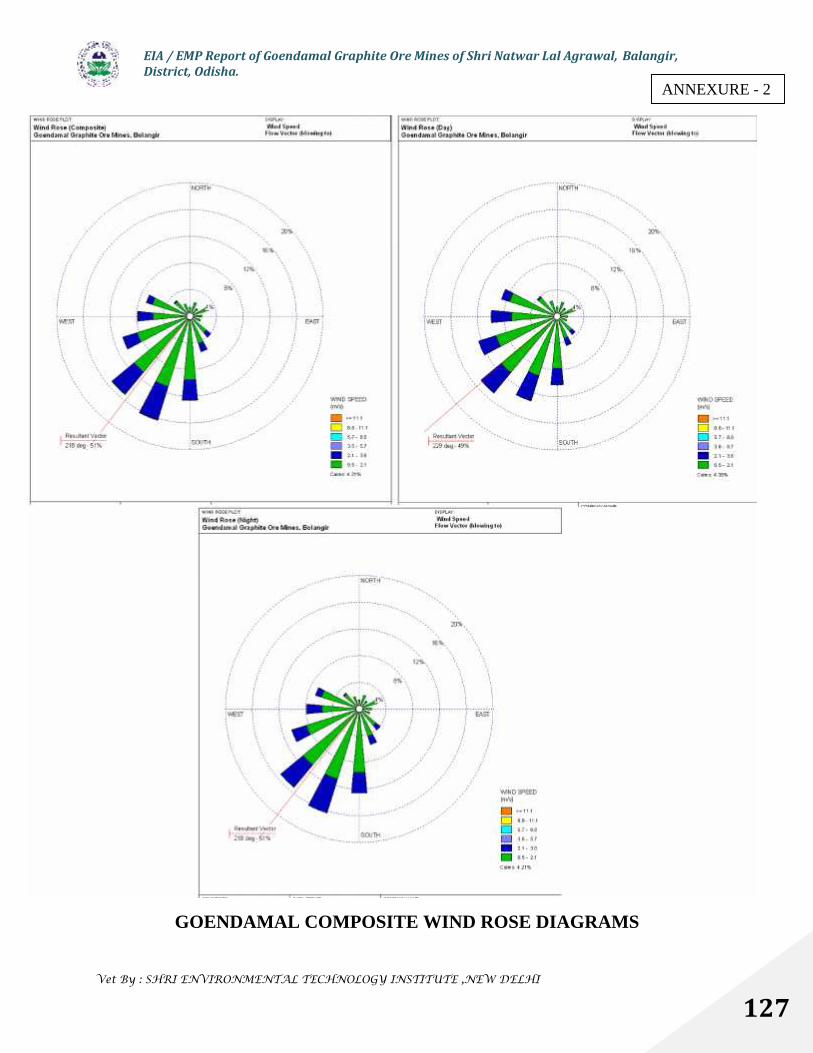
EIA / EMP Report of Goendamal Graphite Ore Mines of Shri Natwar Lal Agrawal, Balangir,District, Odisha.
Vet By : SHRI ENVIRONMENTAL TECHNOLOGY INSTITUTE ,NEW DELHI
127
GOENDAMAL COMPOSITE WIND ROSE DIAGRAMS
ANNEXURE - 2
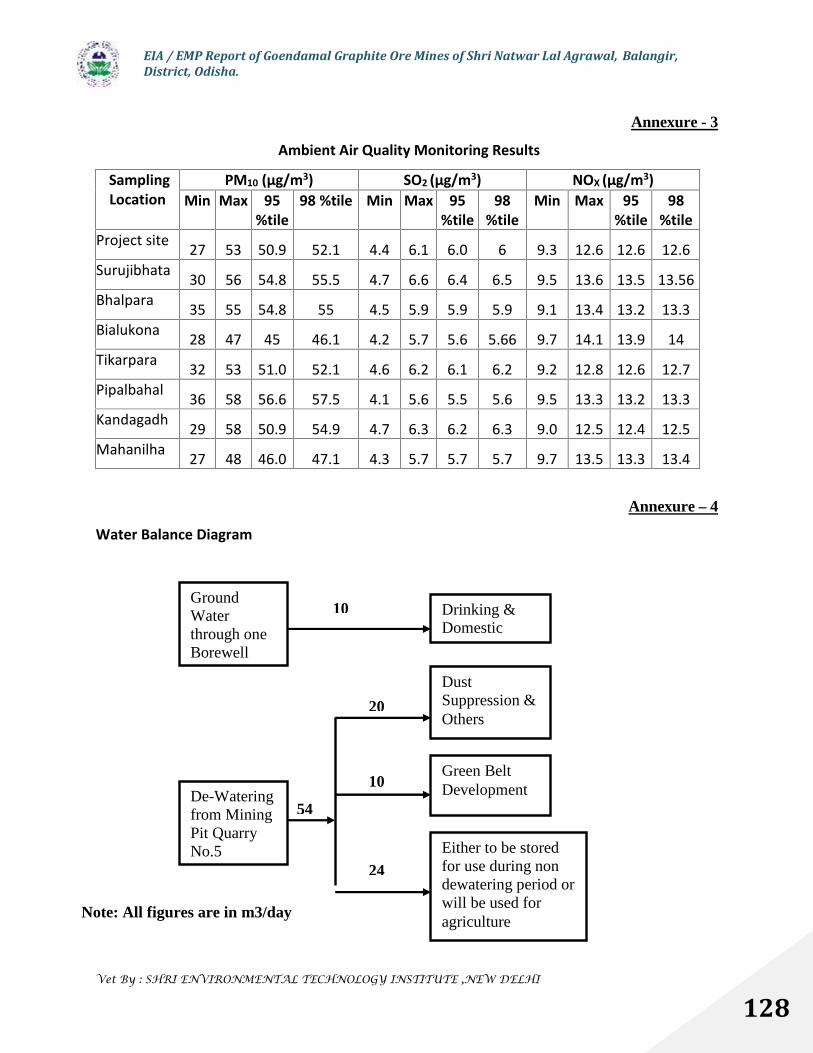
EIA / EMP Report of Goendamal Graphite Ore Mines of Shri Natwar Lal Agrawal, Balangir,District, Odisha.
Vet By : SHRI ENVIRONMENTAL TECHNOLOGY INSTITUTE ,NEW DELHI
128
Annexure - 3
Ambient Air Quality Monitoring Results
SamplingLocation
PM10 (µg/m3) SO2 (µg/m3) NOX (µg/m3)Min Max 95
%tile98 %tile Min Max 95
%tile98
%tileMin Max 95
%tile98
%tileProject site 27 53 50.9 52.1 4.4 6.1 6.0 6 9.3 12.6 12.6 12.6Surujibhata 30 56 54.8 55.5 4.7 6.6 6.4 6.5 9.5 13.6 13.5 13.56Bhalpara 35 55 54.8 55 4.5 5.9 5.9 5.9 9.1 13.4 13.2 13.3Bialukona 28 47 45 46.1 4.2 5.7 5.6 5.66 9.7 14.1 13.9 14Tikarpara 32 53 51.0 52.1 4.6 6.2 6.1 6.2 9.2 12.8 12.6 12.7Pipalbahal 36 58 56.6 57.5 4.1 5.6 5.5 5.6 9.5 13.3 13.2 13.3Kandagadh 29 58 50.9 54.9 4.7 6.3 6.2 6.3 9.0 12.5 12.4 12.5Mahanilha 27 48 46.0 47.1 4.3 5.7 5.7 5.7 9.7 13.5 13.3 13.4
Annexure – 4
Water Balance Diagram
GroundWaterthrough oneBorewell
Drinking &Domestic
De-Wateringfrom MiningPit QuarryNo.5
DustSuppression &Others
Green BeltDevelopment
Either to be storedfor use during nondewatering period orwill be used foragriculture
10
54
20
10
24
Note: All figures are in m3/day
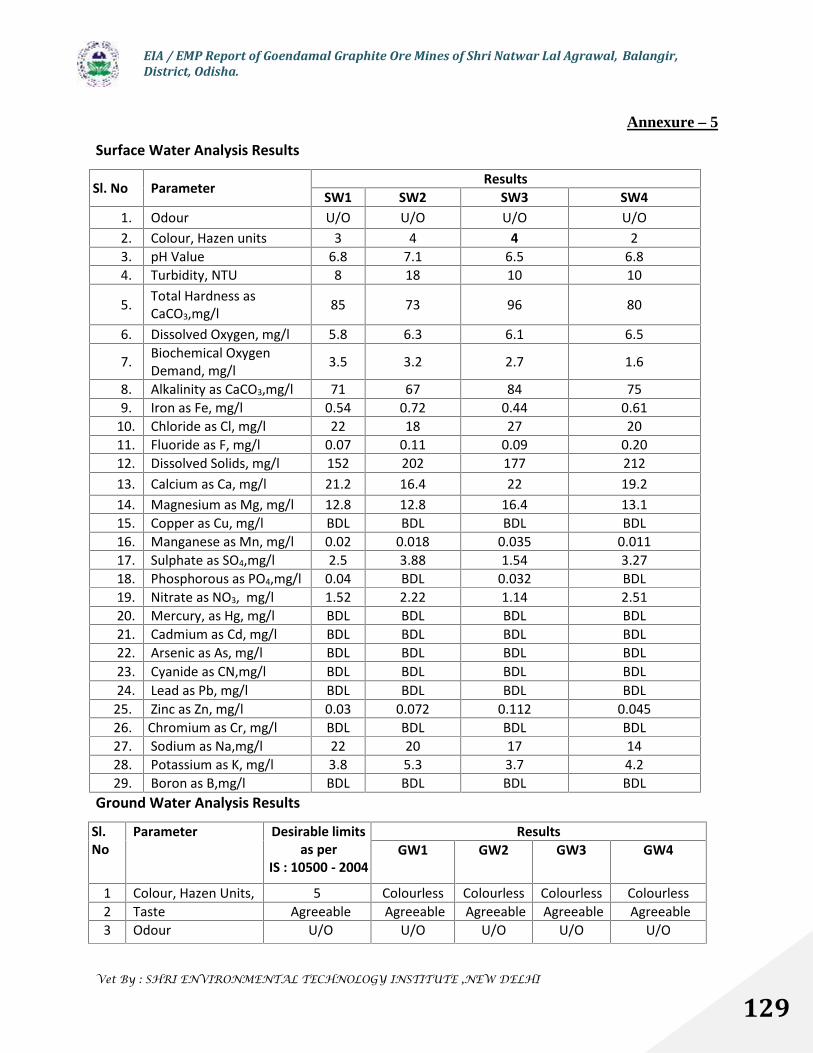
EIA / EMP Report of Goendamal Graphite Ore Mines of Shri Natwar Lal Agrawal, Balangir,District, Odisha.
Vet By : SHRI ENVIRONMENTAL TECHNOLOGY INSTITUTE ,NEW DELHI
129
Annexure – 5
Surface Water Analysis Results
Sl. No Parameter ResultsSW1 SW2 SW3 SW4
1. Odour U/O U/O U/O U/O2. Colour, Hazen units 3 4 4 23. pH Value 6.8 7.1 6.5 6.84. Turbidity, NTU 8 18 10 10
5. Total Hardness asCaCO3,mg/l 85 73 96 80
6. Dissolved Oxygen, mg/l 5.8 6.3 6.1 6.5
7. Biochemical OxygenDemand, mg/l 3.5 3.2 2.7 1.6
8. Alkalinity as CaCO3,mg/l 71 67 84 759. Iron as Fe, mg/l 0.54 0.72 0.44 0.61
10. Chloride as Cl, mg/l 22 18 27 2011. Fluoride as F, mg/l 0.07 0.11 0.09 0.2012. Dissolved Solids, mg/l 152 202 177 21213. Calcium as Ca, mg/l 21.2 16.4 22 19.214. Magnesium as Mg, mg/l 12.8 12.8 16.4 13.115. Copper as Cu, mg/l BDL BDL BDL BDL16. Manganese as Mn, mg/l 0.02 0.018 0.035 0.01117. Sulphate as SO4,mg/l 2.5 3.88 1.54 3.2718. Phosphorous as PO4,mg/l 0.04 BDL 0.032 BDL19. Nitrate as NO3, mg/l 1.52 2.22 1.14 2.5120. Mercury, as Hg, mg/l BDL BDL BDL BDL21. Cadmium as Cd, mg/l BDL BDL BDL BDL22. Arsenic as As, mg/l BDL BDL BDL BDL23. Cyanide as CN,mg/l BDL BDL BDL BDL24. Lead as Pb, mg/l BDL BDL BDL BDL
25. Zinc as Zn, mg/l 0.03 0.072 0.112 0.04526. Chromium as Cr, mg/l BDL BDL BDL BDL27. Sodium as Na,mg/l 22 20 17 1428. Potassium as K, mg/l 3.8 5.3 3.7 4.229. Boron as B,mg/l BDL BDL BDL BDL
Ground Water Analysis Results
Sl.No
Parameter Desirable limitsas per
IS : 10500 - 2004
ResultsGW1 GW2 GW3 GW4
1 Colour, Hazen Units, 5 Colourless Colourless Colourless Colourless2 Taste Agreeable Agreeable Agreeable Agreeable Agreeable3 Odour U/O U/O U/O U/O U/O
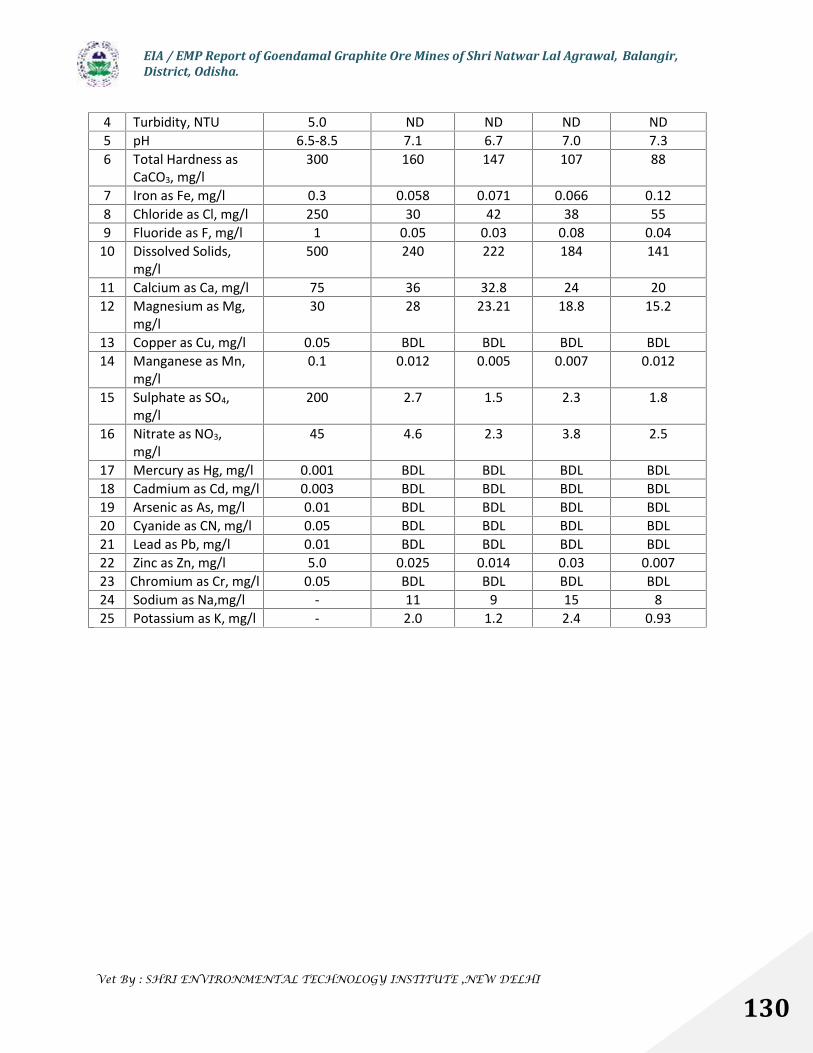
EIA / EMP Report of Goendamal Graphite Ore Mines of Shri Natwar Lal Agrawal, Balangir,District, Odisha.
Vet By : SHRI ENVIRONMENTAL TECHNOLOGY INSTITUTE ,NEW DELHI
130
4 Turbidity, NTU 5.0 ND ND ND ND5 pH 6.5-8.5 7.1 6.7 7.0 7.36 Total Hardness as
CaCO3, mg/l300 160 147 107 88
7 Iron as Fe, mg/l 0.3 0.058 0.071 0.066 0.128 Chloride as Cl, mg/l 250 30 42 38 559 Fluoride as F, mg/l 1 0.05 0.03 0.08 0.04
10 Dissolved Solids,mg/l
500 240 222 184 141
11 Calcium as Ca, mg/l 75 36 32.8 24 2012 Magnesium as Mg,
mg/l30 28 23.21 18.8 15.2
13 Copper as Cu, mg/l 0.05 BDL BDL BDL BDL14 Manganese as Mn,
mg/l0.1 0.012 0.005 0.007 0.012
15 Sulphate as SO4,mg/l
200 2.7 1.5 2.3 1.8
16 Nitrate as NO3,mg/l
45 4.6 2.3 3.8 2.5
17 Mercury as Hg, mg/l 0.001 BDL BDL BDL BDL18 Cadmium as Cd, mg/l 0.003 BDL BDL BDL BDL19 Arsenic as As, mg/l 0.01 BDL BDL BDL BDL20 Cyanide as CN, mg/l 0.05 BDL BDL BDL BDL21 Lead as Pb, mg/l 0.01 BDL BDL BDL BDL22 Zinc as Zn, mg/l 5.0 0.025 0.014 0.03 0.00723 Chromium as Cr, mg/l 0.05 BDL BDL BDL BDL24 Sodium as Na,mg/l - 11 9 15 825 Potassium as K, mg/l - 2.0 1.2 2.4 0.93
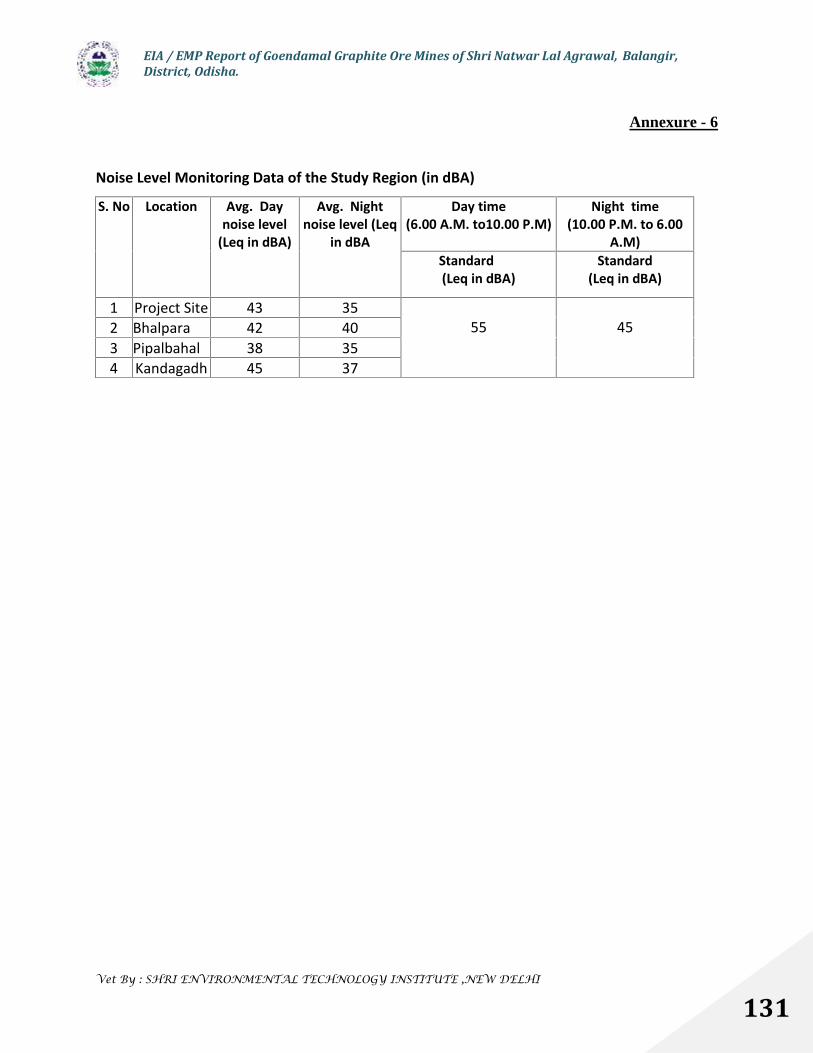
EIA / EMP Report of Goendamal Graphite Ore Mines of Shri Natwar Lal Agrawal, Balangir,District, Odisha.
Vet By : SHRI ENVIRONMENTAL TECHNOLOGY INSTITUTE ,NEW DELHI
131
Annexure - 6
Noise Level Monitoring Data of the Study Region (in dBA)
S. No Location Avg. Daynoise level
(Leq in dBA)
Avg. Nightnoise level (Leq
in dBA
Day time(6.00 A.M. to10.00 P.M)
Night time(10.00 P.M. to 6.00
A.M)Standard(Leq in dBA)
Standard(Leq in dBA)
1 Project Site 43 3555 452 Bhalpara 42 40
3 Pipalbahal 38 354 Kandagadh 45 37

EIA / EMP Report of Goendamal Graphite Ore Mines of Shri Natwar Lal Agrawal, Balangir,District, Odisha.
Vet By : SHRI ENVIRONMENTAL TECHNOLOGY INSTITUTE ,NEW DELHI
132
Annexure - 7
Risk Assessment and Disaster Management Plan
Risk is the probability of the harm or likelihood of harmful occurrence being released
and its severity. Environmental risk is a measure of the potential threats to the environment,
life and property and which is more likely to happen in the mining activities. All the type of
developmental activities like mining, industries, developmental projects may face certain type
of hazards which can disrupt the normal activities abruptly and lead to disaster like fires,
inundation, failure of machinery, explosion. A risk assessment has been carried out and the
disaster management plan formulated with an aim of taking precautionary measures to control
the hazard propagation and avert disaster and to take such action after the disaster, which
limits the damage to the minimum.
Objectives
The objectives of environmental risk assessment are governed by the following, which
excludes natural calamities:
a) To identify the potential hazardous areas so that necessary design safety measures can
be adopted to minimize the probability of accidental events.
b) To identify the potential areas of environmental disaster which can be prevented by
proper design of the installations and its controlled operation.
c) To manage the emergency situation or a disastrous event, if any, from the mining
operation.
The major hazards related to the mining activities are as follows:
Open cast bench slope failure
Accident due to fall of quarry sides
Accident due to machineries
Accident due to explosives
Electrical hazards
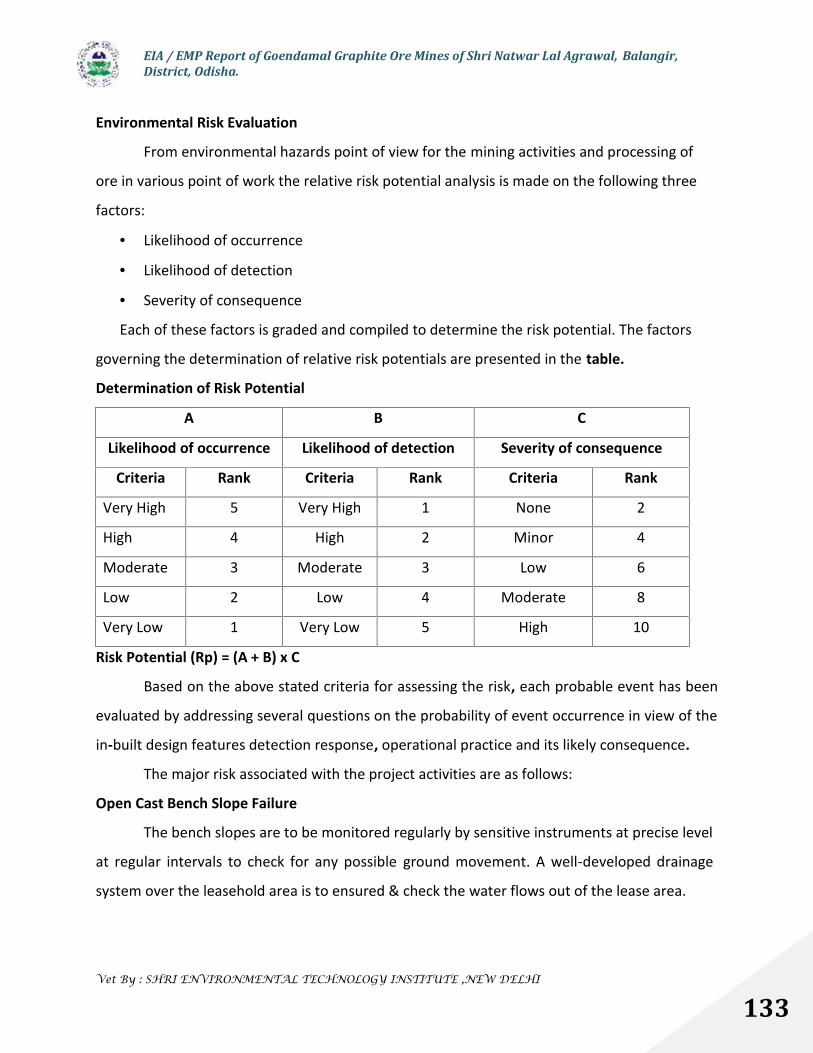
EIA / EMP Report of Goendamal Graphite Ore Mines of Shri Natwar Lal Agrawal, Balangir,District, Odisha.
Vet By : SHRI ENVIRONMENTAL TECHNOLOGY INSTITUTE ,NEW DELHI
133
Environmental Risk Evaluation
From environmental hazards point of view for the mining activities and processing of
ore in various point of work the relative risk potential analysis is made on the following three
factors:
Likelihood of occurrence
Likelihood of detection
Severity of consequence
Each of these factors is graded and compiled to determine the risk potential. The factors
governing the determination of relative risk potentials are presented in the table.
Determination of Risk Potential
A B C
Likelihood of occurrence Likelihood of detection Severity of consequence
Criteria Rank Criteria Rank Criteria Rank
Very High 5 Very High 1 None 2
High 4 High 2 Minor 4
Moderate 3 Moderate 3 Low 6
Low 2 Low 4 Moderate 8
Very Low 1 Very Low 5 High 10
Risk Potential (Rp) = (A + B) x C
Based on the above stated criteria for assessing the risk, each probable event has been
evaluated by addressing several questions on the probability of event occurrence in view of the
in-built design features detection response, operational practice and its likely consequence.
The major risk associated with the project activities are as follows:
Open Cast Bench Slope Failure
The bench slopes are to be monitored regularly by sensitive instruments at precise level
at regular intervals to check for any possible ground movement. A well-developed drainage
system over the leasehold area is to ensured & check the water flows out of the lease area.
EIA / EMP Report of Goendamal Graphite Ore Mines of Shri Natwar Lal Agrawal, Balangir,District, Odisha.
Vet By : SHRI ENVIRONMENTAL TECHNOLOGY INSTITUTE ,NEW DELHI
134
Probable Reasons of Accident
Accidents Due To Fall of Sides
Failure to make and keep the quarry sides secure by proper benching, sloping and
keeping benches of adequate height and width.
Undercutting so as to cause dangerous covering.
Inadequate nos. of competent persons for carrying out statutory inspections.
Lack of supervision.
Accidents Due To Transportation Machinery (Shovels, Trucks And Dumpers) During reversal operation
Unauthorized driving of vehicles (mostly by helpers)
Unauthorized riding of vehicles
Attempt to ride moving vehicles
Overloading
Driving vehicles in a intoxicated stage
Vehicles moving in steep gradient or on benches of inadequate width
Other Than Transportation Machinery
Use of sub standard equipments
Attempt to clean moving parts of machinery
Non-provision or removal of guards from moving parts of machinery
Accidents Due To Use of Explosives
Fly rock throw due to blasting
Inadvertent handling of explosives
Miscellaneous
Electrical hazards
Small scale fires
Disaster Management Plan
To address the probable risk associate with the project activities and to minimize the
risk in different stage the disaster management plan has been framed by the project
EIA / EMP Report of Goendamal Graphite Ore Mines of Shri Natwar Lal Agrawal, Balangir,District, Odisha.
Vet By : SHRI ENVIRONMENTAL TECHNOLOGY INSTITUTE ,NEW DELHI
135
implementing agency. The following precautionary measures shall be taken to prevent any kind
of disaster in the mining operations:
Top edge of opencast workings shall be kept properly fenced off to prevent failing
down of man and animals.
At the final stage, the workings shall be fenced with masonry wall (of not less that
0.13m thick and 1.2m high with a parapet top).
The sides of excavation and the height and width of benches shall be properly
maintained as per mining regulations.
Quarrying shall be done from top downwards. No overhand will be allowed.
Special attention and requisite precautions shall be taken while working in areas of
geological weakness like existence of slip, fault.
Regular dressing of bench sides to ensure safety of workers employed with in 5m of
working face.
Provision of safety belt or rope while persons are at work at the quarry sides or
benches from where there are chances of falling down for more than 1.8m.
Spoil banks not to be retained by artificial means at an angle of repose in excess of its
natural angle.
Drafting and implementation of preventive maintenance schedule for various kinds of
machinery deployed in opencast workings.
Provision of maintenance of properly laid haul roads with parapet wall fencing or
guards and road signs at strategic points.
Precautions against danger while traversing dumpers, excavators. by installing audio-
visual alarms and appointment of spotters.
Transportation of ore within mine workings by vehicles under the direction, supervision
and control of Mine Management only.
Proper maintenance of vehicles and weekly examination by an engineer and daily
examination by a competent person.
Training and retraining (at specified interval) of the machinery operators.
Use of controlled blasting techniques. 500m-radius danger zone to be followed strictly.
EIA / EMP Report of Goendamal Graphite Ore Mines of Shri Natwar Lal Agrawal, Balangir,District, Odisha.
Vet By : SHRI ENVIRONMENTAL TECHNOLOGY INSTITUTE ,NEW DELHI
136
Provision of blasting shelters – properly constructed and maintained.
Blasting danger zone will be identified and indicated to the concerned mine people and
nearby locality to avoid inadvertent trespassing
Whistle will be blown an the time of blasting not to enter into the blasting danger zone
A guard will be employed to prevent pilferage or theft and to keep the explosive in safe
and secure
Adequate maintenance of electrical equipments.
Adequate illumination after daylight.