Environmental Impact Assessment - ADB
82
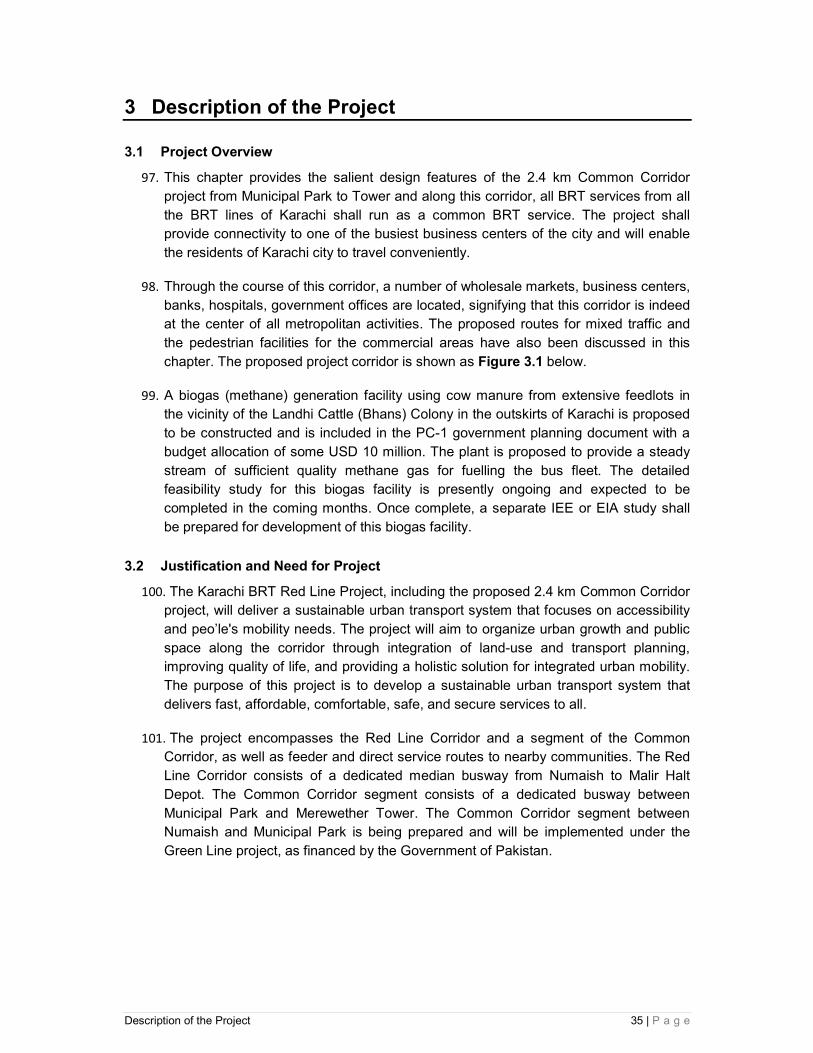
Environmental Impact Assessment Project No. 47279-002 July 2019 PAK: Karachi Bus Rapid Transit Red Line Project Supplementary Part I Prepared by Transport and Mass Transit Department, Government of Sindh for the Asian Development Bank. This is an updated version of the draft originally posted in March 2019 available on https://www.adb.org/projects/47279-002/main#project-documents.
Transcript of Environmental Impact Assessment - ADB

Environmental Impact Assessment
Project No. 47279-002 July 2019
PAK: Karachi Bus Rapid Transit Red Line Project
Supplementary Part I
Prepared by Transport and Mass Transit Department, Government of Sindh for the Asian Development Bank. This is an updated version of the draft originally posted in March 2019 available on https://www.adb.org/projects/47279-002/main#project-documents.

NOTE
(i) In this report, "$" refers to United States dollars unless otherwise stated. This environmental impact assessment is a document of the borrower. The views expressed herein do not necessarily represent those of ADB's Board of Directors, Management, or staff, and may be preliminary in nature. Your attention is directed to the “terms of use” section on ADB’s website. In preparing any country program or strategy, financing any project, or by making any designation of or reference to a particular territory or geographic area in this document, the Asian Development Bank does not intend to make any judgments as to the legal or other status of any territory or area.
CURRENCY EQUIVALENTS
As of 8th July 2019 Currency Unit – Pak Rupees (Pak Rs.) Pak Rs 1.00 = $ 0.00625 US$1.00 = Pak Rs. 160
Acronyms
ADB Asian Development Bank
BRT Bus Rapid Transit
DoF Department of Forests
EA Environmental Assessment
EARF Environment Assessment Review Framework
EAAC Environmental Assessment Advisory Committee
EPA Environmental Protection Agency
EIA Environment Impact Assessment
EMP Environmental Management Plan
EA Executing Agency
GoS
GOP
IA
Government of Sindh
Government of Pakistan
Implementing Agency
IEE Initial Environmental Examination
KCCI
km
Karachi Chambers of Commerce and Industry
Kilometer
tpd Tonnes per day
LAA Land Acquisition Act (of 1984)
LARP Land Acquisition and Resettlement Plan
Leq Equivalent sound pressure level
NEQS National Environmental Quality Standards
NGO Non Governmental Organization
O&M Operation & Maintenance
PMU
PC
PAP
Project Management Unit
Public consultation
Project Affected Person
PEPAct Pakistan Environment Protection Act 1997
RP
PFS
SBCA
SC
SPS
SEPA
TMTD
Resettlement Plan
Pre-Feasibility Study
Sindh Building Control Authority
Steering Committee
Safeguard Policy Statement
Sindh Environmental Protection Agency
Transport and Mass Transit Department

Content Details
S/No. Version Date Summary of Revisions made
1 1 28-2-19 First Draft of Supplementary EIA report
2 2 24-3-19 Second Draft of Supplementary EIA report
3 3 8-7-19 Third Draft of Supplementary EIA report

Table of Content
1 Introduction .............................................................................................. 22
1.1 Project Background .............................................................................................. 22
1.2 Project Objective ................................................................................................... 22
1.3 Environmental Category of the Project .............................................................. 23
1.4 Methodology of EIA Study ................................................................................... 23
1.5 Proponent of Project ............................................................................................. 24
1.6 Structure of the Report ......................................................................................... 24
1.7 Further Additions & Updating of EIA study ....................................................... 25
2 Policy and Legal Framework .................................................................. 27
2.1 General ................................................................................................................... 27
2.2 ADB’s Public Communication Policy 2011 ........................................................ 27
2.3 ADB’s Accountability Mechanism Policy 2012 .................................................. 27
2.4 Interaction with Other Agencies .......................................................................... 27
2.5 Provincial EPAs ..................................................................................................... 27
2.6 Provincial Departments of Forests and Wildlife ................................................ 28
2.7 Provincial Governments ....................................................................................... 28
2.8 Comparison of International and Local Environmental Legislations ............. 28
3 Description of the Project ....................................................................... 35
3.1 Project Overview ................................................................................................... 35
3.2 Justification and Need for Project ....................................................................... 35
3.3 BRT Vehicle Fleet .................................................................................................. 37
3.4 Proposed BRT Route – Municipal Park to Tower .............................................. 38
3.5 Biogas Plant Development ................................................................................... 48
3.6 Project Construction Schedule ........................................................................... 48
3.7 Construction Camps and Work Force ................................................................ 48
3.8 Machinery Requirement ....................................................................................... 49
3.9 Project Operation Phase ...................................................................................... 49
4 Description of Environment .................................................................... 57
4.1 General ................................................................................................................... 57
4.2 History of M.A Jinnah Road ................................................................................. 57
4.3 Major Historic Buildings along Project Corridor of M.A Jinnah road ............. 57
4.4 Declared ‘National Heritage Buildings’ ............................................................... 59
4.5 Sensitive Receptor Mapping along Project Corridor ........................................ 60
Table of Content 4 | P a g e
4.6 Ambient Monitoring of Air quality, Noise and Vibration Levels ...................... 72
4.7 Vibration ................................................................................................................. 72
4.8 Noise ....................................................................................................................... 72
4.9 Air Quality .............................................................................................................. 77
4.10 Climate Vulnerability of Project ..................................................................... 80
5 Analysis of Alternatives .......................................................................... 81
5.1 Overview ................................................................................................................. 81
5.2 ‘No Project’ Option ................................................................................................ 81
5.3 Rationale for selected Common Corridor Alignment along M.A Jinnah Road 81
5.3.1 Alternative route options ................................................................................ 81
6 Potential Environmental Impacts and Mitigation Measures ................ 84
6.1 Design/Pre-Construction Phase .......................................................................... 84
6.1.1 Structural Assessment of ‘National Heritage’ and Historic buildings ............ 84
6.1.2 Relocation of Utilities ...................................................................................... 84
6.1.3 Identification of Locations for Labor Camps and ancillary facilities ............... 85
6.1.4 Development of Traffic Management Plan .................................................... 86
6.2 Construction Phase .............................................................................................. 87
6.2.1 Vibration Impacts on ‘National Heritage’ & Historic buildings ....................... 92
6.2.2 Traffic Management ....................................................................................... 98
6.2.3 Air Quality ..................................................................................................... 100
6.2.4 Noise Levels ................................................................................................. 102
6.2.5 Community Health and Safety ..................................................................... 109
6.2.6 Impact on Parking Spaces ........................................................................... 110
6.2.7 Worker Health and Safety ............................................................................ 110
6.2.8 Loss of Access along the Project Corridor ................................................... 111
6.2.9 Impact on Vendors ....................................................................................... 111
6.2.10 Impact of Underpass development .............................................................. 112
6.2.11 Water Resources .......................................................................................... 114
6.2.12 Camp & Batching plant effluent ................................................................... 114
6.2.13 Soil Erosion and Sedimentation ................................................................... 115
6.2.14 Soil Contamination ....................................................................................... 115
6.2.15 Drainage and Storm Water Run-off ............................................................. 115
6.2.16 Hazardous and Non-Hazardous Waste Management ................................. 116
6.2.17 Historical/Archaeological Sites ..................................................................... 116
6.2.18 Vegetation and Wildlife Loss ........................................................................ 117
6.2.19 Employment Conflicts ................................................................................... 117

6.2.20 Communicable Diseases ............................................................................. 118
6.2.21 Land Use and Aesthetics ............................................................................. 118
6.2.22 Natural and Man made Hazards .................................................................. 118
6.3 Operation Phase .................................................................................................. 119
6.3.1 Air Quality ..................................................................................................... 121
6.3.2 Noise Levels ................................................................................................. 136
6.3.3 Solid Waste disposal .................................................................................... 150
6.3.4 Adaptability of General Public to Driving Conditions ................................... 150
6.3.5 Socioeconomic ............................................................................................. 150
6.3.6 Impact on Livelihood of existing transport workers...................................... 151
6.4 Cumulative Impacts ............................................................................................ 152
6.5 Indirect and Induced Impacts ............................................................................ 152
7 Environmental Management and Monitoring Plan ............................. 153
7.1 Introduction .......................................................................................................... 153
7.2 Environmental Management Plan (EMP) .......................................................... 153
7.3 Objectives of EMP ............................................................................................... 153
7.4 Environmental Management/Monitoring and Reporting ................................ 154
7.5 Monitoring Parameters ....................................................................................... 154
7.6 Environmental Training ...................................................................................... 154
7.6.1 Capacity Building and Training .................................................................... 154
7.7 Environmental Management Costs ................................................................... 160
8 Public Consultation and Information Disclosure................................ 198
8.1 Introduction .......................................................................................................... 198
8.2 Objective of Consultations ................................................................................. 198
8.3 Identification of Main Stakeholders .................................................................. 199
8.4 Approach for Public Consultation..................................................................... 199
8.5 Consultations ....................................................................................................... 200
8.6 Key Discussion points ........................................................................................ 200
8.7 Key Concerns Raised during April’19 & May’19 Consultations .................... 213
8.8 Consultations with Women ................................................................................ 214
8.9 Public Hearing to obtain NoC from SEPA ........................................................ 214
9 Grievance Redress Mechanism ............................................................ 215
9.1 General ................................................................................................................. 215
10 Conclusions and Recommendations .................................................. 216
11 References ............................................................................................. 218
Table of Content 6 | P a g e
ANNEXURES
Annexure A Rapid Environmental Assessment Checklist
Annexure B NEQS Guidelines
Annexure C Photographs of Landmarks along Project Corridor
Annexure D Photographs of Project Area Settings
Annexure E Photographs of Public Consultations
Annexure F List of Participants of Public Consultations
Annexure G Photographs of Ambient Air Quality, Noise and
Vibration Monitoring
Annexure H Methodology for Air Quality, Noise and Vibration
Monitoring
Annexure I Results of Air Quality, Noise and Vibration Monitoring
Annexure J Traffic Management Plan
Annexure K Occupational Health and Safety Plan
Annexure L Emergency Response Plan
Annexure M Archaeological ‘Chance Find’ Procedure
Annexure N Scope of Work for Structural Assessment of National
Heritage Buildings
Annexure O ToRs of Third Party Monitor
Annexure P Certifications of SUPARCO Laboratory
Annexure Q Sample Air Dispersion Model output files
Annexure R ‘BREEZE ROADS’ Air Dispersion software Information
Annexure S ‘Sound PLAN’ noise modeling software information
Annexure T List of Displaced Persons

List of Figures
Figure 1.1: Key Map of Proposed Project ................................................................. 26
Figure 3.1: Proposed 2.4 km Common Corridor Alignment – BRT Red Line ........... 36
Figure 3.2: Proposed BRT Rotary at Municipal Park with split station CC-05 .......... 40
Figure 3.3: BRT Split Station CC-06......................................................................... 41
Figure 3.4: BRT Split Station CC-07......................................................................... 42
Figure 3.5: Proposed Underpass for BRT buses with parking facility for mixed traffic
vehicles .................................................................................................................... 43
Figure 3.6: BRT station CC-08 with single connection and bollards ......................... 44
Figure 3.7: BRT station CC-08A with single connection and bollards ...................... 45
Figure 3.8: BRT staging facility at Tower, with turnaround point .............................. 46
Figure 3.9: Ramp for mixed traffic underpass coming from I.I Chundrigarh Road .... 47
Figure 3.10: Segmentation of Project Corridor for On-street Parking solutions ........ 51
Figure 3.11: Daily On-Street Parking by Segment ................................................... 52
Figure 3.12: Daily On-Street Parking by Time of Day............................................... 53
Figure 3.13: Variation of Land Use along M.A Jinnah Road ..................................... 54
Figure 3.14: Off-street parking lots in CBD ............................................................... 55
Figure 3.15: Parking lots as identified by ADB ......................................................... 56
Figure 4.1: Cluster 1 of Declared National Heritage Buildings ................................. 60
Figure 4.2: National Heritage Buildings in Cluster ‘1’ (Part 1 of 2) ........................... 61
Figure 4.3: National Heritage Buildings in Cluster ‘1’ (Part 2 of 2) ........................... 61
Figure 4.4: Cluster 2 of Declared National Heritage Buildings ................................. 62
Figure 4.5: National Heritage Buildings in Cluster ‘2’ (Part 1 of 2) ........................... 62
Figure 4.6: National Heritage Buildings in Cluster ‘2’ (Part 2 of 2) ........................... 63
Figure 4.7: Cluster 3 of Declared National Heritage Buildings ................................. 64
Figure 4.8: National Heritage Buildings in Cluster ‘3’ ............................................... 64
Figure 4.9: Key Receptors in Project Corridor (Sheet 1 of 3) ................................... 66

List of Figures 8 | P a g e
Figure 4.10: Key Receptors in Project Corridor (Sheet 2 of 3) ................................. 67
Figure 4.11: Key Receptors in Project Area (Sheet 3 of 3) ....................................... 68
Figure 4.12: Land Use in Project Area (Sheet 1 of 3) ............................................... 69
Figure 4.13: Land Use in Project Area (Sheet 2 of 3) ............................................... 70
Figure 4.14: Land Use in Project Area (Sheet 3 of 3) ............................................... 71
Figure 4.15: Monitoring Location for Ambient Air Quality, Noise and Vibration Levels
(Sheet 1 of 3) ........................................................................................................... 74
Figure 4.16: Monitoring Location for Ambient Air Quality, Noise and Vibration Levels
(Sheet 2 of 3) ........................................................................................................... 75
Figure 4.17: Monitoring Location for Ambient Air Quality, Noise and Vibration Levels
(Sheet 3 of 3) ........................................................................................................... 76
Figure 6.1: Isopleths plot of CO (1st highest) for 1-hrly averaged for Diesel fuel .... 126
Figure 6.2: Isopleths plot of CO (1st highest) for 1-hrly averaged for CNG fuel ...... 127
Figure 6.3: Isopleths plot of CO (1st highest) for 8-hrly averaged for Diesel fuel .... 128
Figure 6.4: Isopleths plot of CO (1st highest) for 8-hrly averaged for CNG fuel ...... 129
Figure 6.5: Isopleths plot of PM (1st highest) for 1-hrly averaged for Diesel fuel .... 130
Figure 6.6: Isopleths plot of PM (1st highest) for 1-hrly averaged for CNG fuel ...... 131
Figure 6.7: Isopleths plot of PM (1st highest) for 24-hrly averaged for Diesel fuel .. 132
Figure 6.8: Isopleths plot of PM (1st highest) for 24-hrly averaged for CNG fuel .... 133
Figure 6.9: Isopleths plot of NOx (1st highest) for 1-hrly averaged for Diesel fuel .. 134
Figure 6.10: Isopleths plot of NOx (1st highest) for 1-hrly averaged for CNG fuel .. 135
LIST OF TABLES
Table 4.1: Ambient Vibration Monitoring Results (24 hrs) at three locations along
Project Corridor on M.A. Jinnah Road ...................................................................... 72
Table 4.2: Ambient Noise Monitoring Results (24 hrs) at three locations along Project
Corridor on M.A. Jinnah Road .................................................................................. 73
Table 4.3: Ambient Air Quality Monitoring Results (24 hrs) at three locations along
Project Corridor on M.A. Jinnah Road ...................................................................... 78
Table 4.4: Comparison of ambient air quality results versus applicable Air Quality
standards ................................................................................................................. 79
Table 5.1: Public Transport Vehicles during morning peak hours ............................ 82
Table 5.2: Public Transport Vehicles during morning peak hours ............................ 82
Table 6.1: Screening of Possible Impacts during Construction Phase ..................... 87
Table 6.2: Vibration Source Levels for Construction Equipment .............................. 93
Table 6.3: Vibration Levels (mm/s) at different distances ......................................... 94
Table 6.4: Vibration Levels (mm/s) at buildings close to Piling ................................. 95
Table 6.5: Vibration Levels at Heritage Buildings from different Construction
Activities ................................................................................................................... 96
Table 6.12: Averaged Predicted Concentration of CO, PM10 and NOx for
Diesel .................................................................................................................... 123
Table 6.13: Averaged Predicted Concentration of CO, PM10 and NOx for
CNG Fuel .............................................................................................................. 123
Table 6.14: Traffic Volumes from Napier Road to Campbell Street ........................ 138
Table 6.15: Traffic Volumes from Campbell Street to Kutchery Road .................... 139
Table 6.16: Traffic Volumes from Baba-e-Urdu/Mission Road to Hospital Road .... 139
Table 6.17: Traffic Volumes from Hospital Road to Burnes Road .......................... 140
Table 6.18: Receptor Locations for the Noise Analysis .......................................... 140
Table 6.19: Predicted Noise Levels ........................................................................ 143
Table 7.1: Pre-Construction Monitoring Requirements........................................... 155
Table 7.2: Construction Phase Monitoring Requirements ...................................... 156
LIST OF TABLES 10 | P a g e
Table 7.3: Operation Phase Monitoring Requirements........................................... 158
Table 7.4: Capacity Development and Training Programme .................................. 160
Table 7.5: Annual Cost Estimates for ‘Pre-Construction Phase’ Environmental
Monitoring .............................................................................................................. 161
Table 7.6: Annual Cost Estimates for ‘Construction Phase’ Environmental Monitoring
............................................................................................................................... 161
Table 7.7: Annual Cost Estimates for ‘Operation Phase’ Environmental Monitoring
............................................................................................................................... 161
Table 7.8: Estimated Costs for EMP Implementation ............................................. 162
Table 7.9: Environmental Management and Monitoring Plan ................................. 163
Table 8.1: Summary of Public Consultations during March’19 ............................... 202
Table 8.2: Summary of Public Consultations during April’19 & May’19 .................. 211

EXECUTIVE SUMMARY
Project Overview
1. This supplementary EIA study has been prepared for the 2.4 km stretch of the
common corridor from Municipal Park to Merewether tower which is located in a
historic part of Karachi city with fifteen buildings declared as ‘National Heritage’ by the
Sindh Building Control Authority (SBCA) lying along the proposed project corridor on
M.A Jinnah road. A map of the project area is provided as Figure ES-1.
Project Need
2. The development of the proposed BRT project is of high significance considering the
urgent need for improving the urban transport landscape in Karachi and particularly
along M.A Jinnah road. This project is expected to contribute towards improved
logistical efficiency and convenience along M.A. Jinnah road and result in improved
avenues for trade and commerce. The economic and social development in the
project area will pave the way for uplift of this entire area of Karachi through
generation of economic opportunities and increased investor interest.
3. The BRT project can be used as an opportunity to restructure the entire public
transport industry in Karachi city. With the BRT implemented, the government will
have more bargaining power to reform the public transport in Karachi city. BRT could
be used as an opportunity to bring professional bus operating companies to run in
Karachi and show the best practice model to the existing operators.
4. Many positive impacts on the environment are expected from the proposed BRT
project due to the use of a cleaner and more fuel efficient fleet being used in the BRT
as well as reduction in vehicular exhaust emissions due to reduction in kilometers
travelled by private vehicles.
5. There are also a number of economic benefits associated with the proposed BRT
project due to the time savings of both the public transport and private vehicle
passengers. Also, since there is no formal bus industry as yet in the city, the BRT will
open up more formal employment associated with the BRT such as security guards,
bus drivers, mechanics etc.
6. In comparison to rail based mass transit system, BRT offers flexibility and is easy to
expand. Dedicated BRT lanes can increase bus travel speed significantly. But most
importantly, with BRT, buses can operate inside and outside the BRT corridor,
allowing rapid citywide coverage.
Study Methodology
7. Primary and secondary data has been collected and used to assess the
environmental impacts of the Project. Detailed baseline monitoring to assess potential
impacts on air quality, noise and vibration levels has been conducted and presented
in this study. This EIA report highlights all potential environmental impacts associated
with the Project and recommends mitigation measures. Any environmental impacts
LIST OF TABLES 12 | P a g e
associated with the project need to be properly mitigated, through the existing
institutional arrangements described in this report.
8. The significance of impacts from the proposed project were then assessed and for
those impacts requiring mitigation, suitable measures were proposed to reduce
impacts to within acceptable limits as per local and international applicable
regulations. A detailed environmental management and monitoring plan was
developed to ensure compliance to the proposed measures during the project
development.
Public Consultation Process
9. Considering the historical significance of this project corridor and keeping in view the
particular sensitivities and associated uncertainty and mistrust amongst the business
community due to the ongoing anti-encroachment drive across Karachi city, including
the M.A Jinnah road, the stakeholder consultation process was challenging. However,
extensive consultations have been conducted and the findings of these consultations
have been presented in this supplementary EIA study.
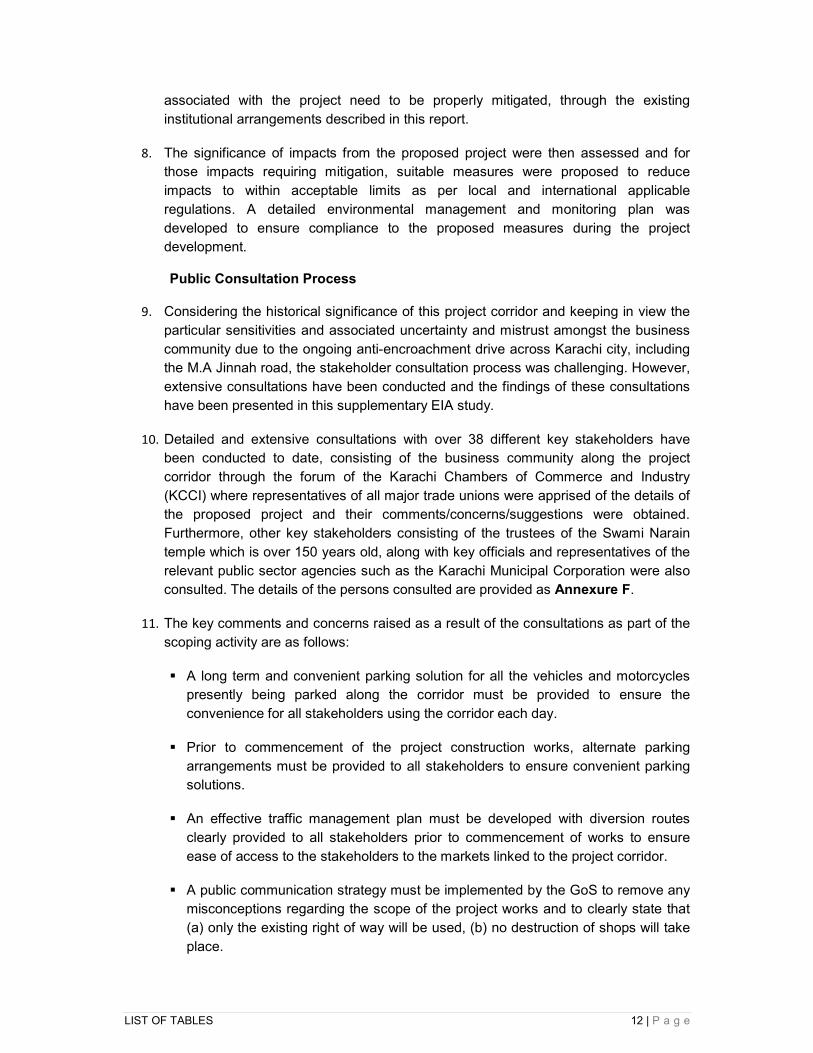
10. Detailed and extensive consultations with over 38 different key stakeholders have
been conducted to date, consisting of the business community along the project
corridor through the forum of the Karachi Chambers of Commerce and Industry
(KCCI) where representatives of all major trade unions were apprised of the details of
the proposed project and their comments/concerns/suggestions were obtained.
Furthermore, other key stakeholders consisting of the trustees of the Swami Narain
temple which is over 150 years old, along with key officials and representatives of the
relevant public sector agencies such as the Karachi Municipal Corporation were also
consulted. The details of the persons consulted are provided as Annexure F.
11. The key comments and concerns raised as a result of the consultations as part of the
scoping activity are as follows:
A long term and convenient parking solution for all the vehicles and motorcycles
presently being parked along the corridor must be provided to ensure the
convenience for all stakeholders using the corridor each day.
Prior to commencement of the project construction works, alternate parking
arrangements must be provided to all stakeholders to ensure convenient parking
solutions.
An effective traffic management plan must be developed with diversion routes
clearly provided to all stakeholders prior to commencement of works to ensure
ease of access to the stakeholders to the markets linked to the project corridor.
A public communication strategy must be implemented by the GoS to remove any
misconceptions regarding the scope of the project works and to clearly state that
(a) only the existing right of way will be used, (b) no destruction of shops will take
place.

Timings for the construction works must be agreed beforehand with the local businesses to
enable them to bring their goods into the corridor each day without any hindrance.
Multiple contractors should be engaged to ensure work is completed faster.
Institutional strengthening will be critical to the success of the project since otherwise the
project will not be sustainable.
Analysis of Alternatives
12. The ‘No Project’ alternative was considered which is not a viable option since the
millions of people using public transport in Karachi city each day would not benefit
from a sustainable, more efficient, more economical and safer transport system and
would continue to suffer congestion and traffic accident risks in the city.
13. A number of different route options were considered keeping in view a mix of
technical, economical and environmental aspects to ensure the finalized route of the
project would be the most favorable amongst the possible route alignment options.
14. The Central Business District (CBD) of Karachi begins from Gurumandir. Muhammad
Ali (M. A.) Jinnah Road is the most important road feeding the CBD all across up to
Karachi Port at Kemari. The road feeds almost all land uses in the CBD and plays a
vital role in traffic circulation and in feeding areas within and outside the CBD. It is due
to this reason that all major existing public transport routes coming from all over the
city enter M. A. Jinnah road and use it as the major road for serving the CBD.
15. Based on a detailed analysis of the volume of public transport vehicles and
passengers reaching the M.A Jinnah road on a daily basis, it is clear that the selection
of this project corridor for the proposed BRT corridor is justified.
Potential Major Impacts
Traffic Management
16. The traffic management plan shall be prepared by the Contractor and approved by the
GoS and ADB prior to commencement of the project construction activity. The main
objectives of the plan shall be to maximize the safety of the workforce and the
travelling public while keeping the traffic flowing as freely as possible.
Disruption to Utilities
17. The project will require demolishing and relocating some of the structures within the
ROW such as water supply pipes, drainage structures, power and communication
cables. Temporary suspension of services (planned or accidental) can affect the
economy, industries, businesses and residents’ daily lives.
18. All required mitigation measures shall be implemented such as planning of activities
through coordination with relevant line departments to minimize impacts on utilities at
LIST OF TABLES 14 | P a g e
work sites along the project corridor, advance notices to communities to enable them
to prepare for utility outages etc.
Historical/Archaeological sites
19. The Muhammad Ali Jinnah road, a.k.a MA Jinnah road, was known originally as
Bunder (or Bandar) road, meaning ‘Port road’. It is one of the city’s oldest and most
important road, running through the city to the docks. It was later renamed in honor of
the founder of the nation, Muhammad Ali Jinnah. There are a number of landmarks
located along this historic road, including the Merewether Clock Tower, Karachi
Municipal Corporation Building, City Court, Denso Hall and Library, Khaliq Dina Hall
and Shri Swaminarayan Mandir (Temple).
20. The Sindh Building Control Authority (SBCA) has listed a total of 426 buildings
declared as ‘National Heritage Buildings’ across Karachi city1. A careful review of this
list has revealed that forty-two buildings are located on the M.A. Jinnah road. It should
be mentioned that the Khaliq Dina Public Hall and Library is also listed as a ‘National
Monument’ for Sindh province.2
21. Field surveys were able to reveal that fifteen ‘national heritage’ buildings are located
on the 2.4 km stretch of the BRT Common Corridor. Although it is quite challenging to
identify all the forty two national heritage buildings listed on the M.A Jinnah road since
this information is not easily available, however in case any other buildings from the
SBCA list are found to be lying within the corridor, they shall be added to the updated
version of the supplementary EIA report.
22. During the construction phase of the project, it shall be ensured that required
mitigation measures are in place to protect all sensitive receptors located along the
corridor through efficient and effective implementation of the Environment
Management Plan (EMP), particularly relating to protection of the national heritage
and historical buildings from high vibration levels during the construction works.
23. The vibration levels from the use of the construction equipment and vehicles will be
closely monitored to ensure typical peak particle velocities remain within allowable
limits and do not exceed the 3 mm/s limit, in which case major structural damage such
as cracking or shifting of foundations or bearing walls can take place.
Ambient Monitoring (Air Quality, Noise and Vibration Levels)
24. The EPA certified and well reputed laboratory, SUPARCO, was engaged to conduct ambient
monitoring for air quality, noise and vibration levels at three locations along the proposed
project common corridor which were as follows:
Location 1: Opposite Services Hospital (near Jama Cloth)
1 https://antiquities.sindhculture.gov.pk/index.php/publication/reports/karachi-heritage-building-re-survey-
project/309-sindh-building-control-authority-heritage-buildings 2 Pak EPA-Government of Pakistan (Oct 1997), Guidelines for Sensitive and Critical Areas
Location 2: Denso Hall
Location 3: Next to cluster of historical buildings (near Memon mosque)
25. These three locations have been strategically selected keeping in view their high level
of sensitivity since the ‘Location 1’ is opposite the Services hospital while the ‘Location
2’ lies opposite a national heritage building (Denso Hall). The ‘Location 3’ was
selected since it is situated between a cluster of historic buildings. Furthermore, these
three locations are spread across the 2.4 km common corridor and thus are
considered to be representative of the ambient air quality, noise and vibration levels in
the project corridor.
Air Quality
26. The potential impacts on air quality have been assessed for both the construction and
operation phases of the project. The major impacts expected during the construction
phase of the project are due to dust emissions resulting from vehicular movement,
emissions from construction machinery, use of generators and construction vehicles.
These impacts will be mitigated through employing of best practices such as water
sprinkling, tuning and maintenance of construction equipment and vehicles, covering
of materials susceptible to dust formation during transportation etc.
27. Detailed air quality monitoring at different points along the corridor has been
conducted and the results have been presented in this EIA report. Based on the
monitoring results, it has been observed that SO2, PM2.5 and PM10 are exceeding the
permissible limits, which indicates that the airshed is already quite degraded. Thus, all
possible efforts will need to be made during the construction phase through adoption
of best practices to minimize any further worsening of the pollutant concentrations in
the airshed of the project area.
28. The modeling estimated that the predicted ambient concentrations of CO are 10.7756
mg/m3 and 10.782 mg/m3 for diesel and CNG fuel respectively, which are exceeding
the limit of SEQS (5 mg/m3 for 8-hrs averaged) for CO in ambient air. However, the
predicted incremental concentrations of CO are 0.0006 mg/m3 & 0.007 mg/m3 for
diesel and CNG fuel respectively, that depicts no significant impact. Similarly,
modeled predicted ambient concentrations of PM10 are 142.509 ug/m3 and 142.5008
ug/m3 for diesel and CNG fuel respectively, which are well within the limit of SEQS
(150 ug/m3 for 24-hr averaged) for PM10 in ambient air but exceeded as per
prescribed limit of WHO guideline for ambient air (50 ug/m3 for 24-hr averaged).
29. Similarly, contributions of predicted incremental concentrations for PM as PM10 for
diesel and CNG fuel are minimal i.e 0.009 ug/m3 and 0.0008 ug/m3 for diesel and
CNG fuel respectively. NOx as NO2 predicted incremental concentrations for 1 hr
average period are 6.909 and 12.068 ug/m3 for diesel and CNG fuel respectively and
would have no significant impact on the environment due to project activity during the
operational phase.

LIST OF TABLES 16 | P a g e
30. Finally, current ambient air concentration (background concentration) for the pollutant
CO is very high and exceeded the limit of SEQS. Similarly, PM10 background
concentration is also exceeding the applicable limit as given in the WHO guidelines for
ambient air while the predicted incremental concentrations for pollutants CO, PM and
NOx have minimal pollutant contribution to the environment.
31. This modeling study depicts that the emissions of CO, PM and NOx from the
proposed BRT buses during operational phase would have insignificant impacts on
ambient air pollutant levels along the proposed corridor under study.
Noise impacts
Construction Noise
32. Based on the ambient monitoring, the noise levels have been observed to be
considerably exceeding the permissible levels. Thus, it will need to be ensured as part
of the mitigation measures that during the construction works, at no time must the
noise levels be permitted to exceed 3 dB from the ambient noise levels as per IFC
guidelines.
33. In addition, the calculation procedures outlined in the US Federal Highway
Administration Construction Noise Handbook have been used to determine average
construction noise levels for various construction phases to assess noise quality
impacts during the construction phase of the project.
34. Precise information on the type, quantity, location and utilization of plant and
equipment to be used during the construction phase is not available at this stage and
will be dependent on the working methods of the selected contractor(s). However,
preliminary calculations have been conducted to provide a general magnitude of the
noise levels during various construction phases.
35. The noise impact assessment was performed by identifying noise levels at certain
distances from the construction activities. Some noise sensitive receptors are located
at the second floor or higher floors of the buildings next to the construction activities.
Calculations need to be finalized by the contractor when the construction work
schedule details and equipment types are determined.
36. As measured, existing average noise levels along the project corridor during daytime
is 85 dB, in accordance to the IFC guidelines, the noise limit will be 88 dB. Results of
the calculations indicate that during certain construction activities, produced worst
case average hourly noise levels would be higher than 88 dB. However, duration of
the anticipated noisy construction activities would be short and during daytime.
Therefore, residences may not object to the noise, especially when they will be
directly benefited, especially at the portion where there will be no more nixed traffic.
Operational noise levels would drop substantially after the completion of the project
where there will be no mixed traffic.

Operation Noise
37. A computer noise model was developed using Sound PLAN software to predict traffic
noise levels and analyze possible noise impacts.
38. Traffic volume is one of the main input items for conducting traffic noise study.
Besides traffic volumes, types of the vehicle are also important. Existing traffic counts
were conducted at several locations along the project corridor. All the counts started
at 7 am but some ended at 8 pm and others at 9 pm. No nighttime counts were
conducted for the project.
39. According to the project traffic specialist, the future mixed traffic volumes will be
almost the same as the existing traffic volumes. However, some of the traffic
movements may be different because a portion of the corridor will be blocked off to
the mixed traffic and will be dedicated to the buses only.
40. Buses will be operating for 16 hours a day between 6 am and 10 pm. It is assumed
the head way of one bus every 40 seconds during peak hours and one bus every 90
seconds during non-peak hours.
41. Results of the analysis indicate that there would be drop of almost 20 dB in the
daytime traffic noise levels for the areas where there will be only BRT buses. This is a
substantial reduction in the noise levels. There would be almost no traffic noise during
the night hours where roadway is dedicated to the BRT buses only when there would
no buses.
42. Predicted future peak hour average noise levels for the area where there would be
BRT and mixed traffic are in high 70s to low 80s in comparison to the measured
existing noise levels which are in mid 80s. Predictions include only traffic noise and do
not consider honking or other noise sources in the area which may have been
captured during the existing background noise measurements. Some rickshaws
remove their mufflers to improve the efficiency and increase the power, as a result
those rickshaws make more noise than the others. Effects of the removal of the
muffler cannot be included in the model while it would have been captured during the
noise measurements.
43. Since BRT bus only noise is in mid to high 60s, it would not increase the overall mixed
traffic noise, which is approximately 20 dB higher. Based on the laws of physics, when
a noise source is more than 10 dB lower than another noise source, the noise source
with lower level would not contribute to the total noise level.
44. In conclusion, as a result of implementing BRT project, traffic noise levels would be
substantially reduced for the half of the corridor where there would be no mixed traffic
and would not increase the total traffic noise in the areas where there will BRT buses
along with mixed traffic. Therefore, no traffic noise impacts are anticipated as a result
of the proposed BRT project.

LIST OF TABLES 18 | P a g e
Vibration impacts
45. The vibration levels have been monitored at three representative locations along the
project corridor. Vibration measurements were conducted using Extech model 407860
Vibration meter. A metal plate of 5 by 5 cm size was glued to the sidewalk and then
the accelerometer was attached to the metal plate using its magnetic base.
Measurements were conducted at 30 sec intervals for a total of 15 minutes at each
site and then the measured values were averaged. The vibration levels recorded will
serve as the baseline and will be critical during the construction works to monitor the
increments in the vibration levels to ensure no damage to the numerous historical
buildings along the corridor take place. The vibration levels varied from 1.54 mm/s
near Memon Masjid to 1.89 mm/s near Denso Hall.
46. The major source of vibration would be the impact piling that would produce six times
more vibration that allowable limit of 6.35 mm/s for the historic buildings at 7.5 meters
from the source. Vibration levels would drop to 6.35 mm/s limit at approximately 39
meters from the source. In accordance to the latest project layout drawings, closest
buildings to the impact piling would be at 8 meters. Historic buildings H.B. 12, H.B 13,
and H.B 14: Denso Hall and Library are within close vicinity of the impact piling
activities. Due to this reason, impact-piling driving shall be strictly forbidden
along the entire corridor.
47. Measured vibration levels indicated that some of these historic buildings presently are
exposed to vibration levels of up to 3.6 mm/s with no obvious signs of damage.
However, in average, they are exposed to PPV of less than 2 mm/s.
48. Vibratory roller used for dirt compacting is another major source of vibration as it
produces 6.35 mm/s vibration level up to 6.5 meters from the source. Most first row
buildings are located within approximately 2 m of where the vibratory roller could be
operating. When the vibratory roller is at the closet point to the buildings, the first-row
buildings located at 2 meters away could be exposed to vibration levels (PPV) of up to
22.8 mm/s. Roller needs to travel at certain distances back and forth to compact the
dirt; therefore, no other activities can occur where the vibratory roller is operating.
49. Large bulldozers, trucks, and drilling can also produce 6.35 mm/s vibration levels up
to distance of 3 meters. Other sources of vibration would be trucks going over bumpy
areas in the construction zone and drilling. These equipment items may be operating
next to each other where nearby buildings could be exposed to slightly higher
cumulative vibration levels.
50. Calculated peak vibration levels would be higher than the 6.35 mm/s limit during
certain construction activities. Impact pile driving is the activity that could be of
concern as it may generate vibration levels way over the limit of 6.35 mm/s and thus it
shall be strictly forbidden. As soil testing has not been conducted till now to determine
the soil vibration transferability characteristics for different parts of the project,
minimum impact distance would be the same throughout the project corridor. These
distances should be finalized when the testing is done during the final design or
before start of the construction activities.
51. Another reason why impact pilling shall not be permitted is because if it was allowed
for construction of the underpass, then people residing at approximately 26 meters
from the impact pile driving would have been annoyed due to the vibration.
Furthermore, at such distances, noise levels generated by impact piling would have
created noise impacts that would have overshadowed even the vibration impacts.
52. Results of calculations indicate that vibration levels from a vibratory roller would not
cause annoyance at residences located more than 7 meters from an operating roller.
Other construction activities typically are not a cause of vibration annoyance.
53. The expected vibration levels from the construction works are expected to be
manageable and the implementation of proposed mitigation measures and monitoring
of the vibration levels during the construction works will ensure no significant impacts
due to vibration take place.
Land Acquisition & Resettlement
54. The proposed project works shall be conducted along the existing RoW with no land
acquisition and/or resettlement required to be conducted along this corridor.
Cumulative Impacts
55. No other infrastructure works are planned to be conducted along the proposed project
corridor while the BRT project works shall be conducted. Thus, no cumulative impacts
are expected.
Indirect and Induced Impacts
56. The potential impact of development along the project corridor of M.A Jinnah road in
Karachi city has been examined, which indicated that the existing and planned
infrastructure such as water supply, wastewater collection and treatment, municipal
solid waste collection and disposal would be adequate to accommodate any potential
population intake as a result of the proposed project development. Thus, negative
indirect and induced impacts from this project are not expected.
Institutional Arrangements
57. During the construction phase, the overall responsibility for the implementation and
monitoring of the EMP rests with the Project Director (PD). The PD through
assistance from the Supervision Consultant’s Environmental staff and the
Environment team of TMTD, will supervise the implementation of the proposed
mitigation measures and monitor the implementation progress in the field. Monthly
environmental monitoring data/reports will be incorporated in the project
implementation progress reports to be shared with ADB and such monthly reports will
be consolidated into bi-annual monitoring reports and submitted to ADB for review
and clearance. Upon clearance, all such reports will be uploaded on the TMTD and
ADB websites.
LIST OF TABLES 20 | P a g e
Conclusion & Recommendations
58. An action plan with clear roles and responsibilities of stakeholders has been provided
in the report. The TMTD, Contractors and the Construction Supervision Consultant
are the major stakeholders responsible for the action plan. The action plan must be
implemented prior to commencement of construction work.
59. Mitigation will be assured by a program of environmental monitoring conducted during
construction and operation to ensure that all measures in the EMP are implemented
and to determine whether the environment is protected as intended. This will include
observations on and off-site, document checks, and interviews with workers and
beneficiaries, and any requirements for remedial action will be reported. The engaging
of external environmental monitoring consultants for ensuring efficient and effective
implementation of the mitigation measures is also under consideration.
60. Therefore, the proposed BRT development is likely to cause certain significant
adverse impacts, mostly during the construction phase, that shall be mitigated through
necessary measures. The potential adverse impacts that are associated with design,
construction, and operation can be mitigated to standard levels without difficulty
through proper engineering design and the incorporation or application of
recommended mitigation measures and procedures. Based on the findings of this EIA
study, the classification of the Project as Category ‘A’ is confirmed. It is concluded that
the proposed project should proceed, with appropriate mitigation measures and
monitoring programs identified in the EIA.
61. As a result of this EIA study, it has been determined that any adverse or harmful
impacts shall be effectively mitigated through implementation of necessary measures
and through regular monitoring. The project falls under the Category ‘A’ of ADB's
Guidelines and thus an EIA has been prepared for the proposed project.

Figure ES-1: Project Area Map
Introduction 22 | P a g e
1 Introduction
1.1 Project Background
62. The Project was first identified under the Karachi Transportation Improvement Plan
(KTIP) a Japan International Cooperation Agency (JICA) funded planning study
covering the whole of the metropolitan area. The Red Line, one of 6 identified in the
KTIP, was developed in its preparatory stage in 2014-15 under Asian Development
Bank (ADB) funding, as one of two preferred Bus Rapid Transit (BRT) routes for initial
development.
63. A preparatory level Initial Environmental Examination (IEE) was prepared at that time,
which was followed in 2018 by the preparation of a detailed Environmental Impact
Assessment (EIA) study for the Red Line Corridor, extending over 24.2 km from
Numaish to Malir Halt Depot. The review of this EIA study is presently ongoing by
SEPA and the No-objection Certificate (NOC) is still pending.
64. In addition to the 24.2 km Red Line Corridor, the ADB has agreed to finance an
additional corridor of 2.4 km from Municipal Park to Merewether Tower. Thus, this
supplementary EIA study has been prepared in order to meet both national and ADB’s
safeguards requirements.
65. The scope of this additional financing by ADB shall consist of restructuring the 2.4 km
of the common BRT corridor with the objective to address parking and encroachment
issues, improve the surrounding walking environment, share public space equitably
between pedestrians, public transport and private modes, and provide a more
pleasant and beautiful urban environment.
66. This supplementary EIA study report presents the screening of potential
environmental impacts of the proposed project and contains the mitigation measures
in order to eliminate or reduce the negative impacts to an acceptable level, describes
the institutional requirements and provides an environmental management plan.
The project area map of the proposed project is provided as Figure 1.1 below.
1.2 Project Objective
67. The Mass Transit Corridors were proposed by JICA in their report, the Karachi
Transportation Improvement Project (KTIP, 2012) based on the demand forecasts. In
the JICA study, future growth projections of cars and motorcycles indicated that traffic
volumes will soon outpace available road space. Thus, the current transport system
will result in increased congestion and longer travel times, as well as worsening air
quality.
68. The project was initiated considering the following objectives:
To develop a sustainable urban transport system in Karachi through the delivery of a BRT corridor focusing on accessibility and people’s mobility,

reliability, and rapid journey times;
To deliver a financially-sustainable corridor that does not require long-term operational subsidies;
To provide a holistic solution for integrated urban mobility by offering full connectivity to the Green Line and other future BRT and MRT corridors, and by providing modern pedestrian and bicycle facilities;
To remove constraints to sustainable economic growth by resolving the problems of road congestion, safety, and deteriorating air quality along the Red Line corridor;
To achieve economic and social equity by providing an affordable, safe, secure, and accessible service, especially for women, students, lower-income residents, and persons with disabilities;
To introduce high-technology components to Karachi’s transport system: i) bio-methane hybrid BRT vehicles that dramatically reduce emissions, noise, and operational costs; ii) biogas production as a fuel source from agricultural waste; and, iii) intelligent transportation systems (real-time information displays for customers, operational control center, fleet management system, and automatic fare system);
To improve public space along the selected corridor through integration of land use and transport planning (transit-oriented development); and
To elevate quality of life and make Karachi a more pleasant city.
1.3 Environmental Category of the Project
69. According to ADB’s Safeguard Policy Statement (SPS) 2009, a Rapid Environmental
Assessment (REA) Checklist was prepared (Annexure-A). The Pakistan
Environmental Protection Agency’s “Guidelines for the Preparation and Review of
Environmental Reports (2000)” were also consulted. Based on the initial findings, it
was ascertained that certain adverse environmental impacts are expected due to
development of the proposed 2.4 km BRT Common Corridor project, and thus the
subject project is considered environmentally “A” category. Therefore, an EIA has
been conducted.
1.4 Methodology of EIA Study
The following methodology was employed for this EIA:
70. Since this is a supplementary EIA report, thus all efforts have been made to avoid
repetition and duplication of data already contained in the EIA study for the Red Line
by referring to the relevant sections of the existing EIA study throughout this report.
71. Available secondary data was reviewed from the existing IEE report prepared during
the PPTA stage in 2016, the EIA report for the Red Line, revised PC-1 document, EIA
report for the Green Line and any other documents found to be relevant to the
environmental assessment of this BRT common corridor.
72. Field visits were undertaken consisting of preliminary scoping through surveys and
assessment activities along with primary data collection such as ambient monitoring
Introduction 24 | P a g e
(air quality, noise and vibration levels) and stakeholder consultations to establish the
potential impacts and categorization of activities and the Rapid Environmental
Assessment (REA) was completed. The key receptors and stakeholders within the
project area (50 meters on either side of the project alignment) were identified.
73. Since this 2.4 km of Common Corridor is historically extremely rich and contains
fifteen buildings declared by the Sindh Building Control Authority (SBCA) as ‘National
Heritage’, thus these buildings were mapped as sensitive receptors along with other
sensitive receptors such as hospitals, schools and residences located along this
Common Corridor.
74. This project corridor contains a large number of key stakeholders and complex socio-
political dynamics, making the consultative quite challenging and sensitive in nature.
Detailed and extensive stakeholder consultations have been conducted with key
stakeholders such as local businesses, government and local government bodies etc.
in line with the ADB requirements.
75. The significance of impacts from the proposed project were then assessed and for
those impacts requiring mitigation, suitable measures were proposed to reduce
impacts to within acceptable limits as per local and international applicable
regulations.
76. A detailed environmental management and monitoring plan was developed to ensure
compliance to the proposed measures during the project development.
1.5 Proponent of Project
77. The Transport and Mass Transit Department (TMTD), Government of Sindh (GoS) is
the proponent of the Project and all planning and execution activities will be
accomplished through a designated Project Director (PD).
1.6 Structure of the Report
78. The EIA report contains eleven chapters as follows:
Introduction
Policy and Legal Framework
Description of the Project
Description of Environment
Analysis of Alternatives
Assessment of Environmental Impacts and Mitigation Measures
Institutional Requirements Environmental Management Plan
Public Consultation

Grievance Redress Mechanism
Findings, Recommendations and Conclusions
References
1.7 Further Additions & Updating of EIA study
79. It should be mentioned that this version of the report shall be further updated as the
detailed design is completed and any other details of the proposed project become
available over the coming weeks and months. These revisions shall be incorporated
into any subsequent updated versions of this supplementary EIA report.

Introduction 26 | P a g e
Figure 1.1: Key Map of Proposed Project
Policy and Legal Framework 27 | P a g e
2 Policy and Legal Framework
2.1 General
80. Please refer to Chapter 2 ‘Policy, Legal and Administrative Framework’, Page 9 of the
EIA report3 for the complete description of the policy and legal framework applicable to
the project.
81. However, certain regulations specific to ADB have not been presented in the earlier
EIA report4 and have been presented below in this supplementary EIA report.
2.2 ADB’s Public Communication Policy 2011
82. The PCP aims to enhance stakeholders’ trust in and ability to engage with ADB, and
thereby increase the development impact of ADB operations. The policy promotes
transparency, accountability, and participatory development. It establishes the
disclosure requirements for documents ADB produces or requires to be produced.
2.3 ADB’s Accountability Mechanism Policy 2012
83. The objectives of the Accountability Mechanism is providing an independent and
effective forum for people adversely affected by ADB-assisted projects to voice their
concerns and seek solutions to their problems, and to request compliance review of
the alleged noncompliance by ADB with its operational policies and procedures that
may have caused, or is likely to cause, them direct and material harm. The
Accountability Mechanism a “last resort” mechanism.
2.4 Interaction with Other Agencies
84. The Transport & Mass Transit Department (TMTD), GoS is responsible for ensuring
that the project complies with the laws and regulations controlling the environmental
concerns of the bus rapid transit (BRT) construction and operation and that all
preconstruction requisites, such as permits and clearances are met. This section
describes the nature of the relationship between the TMTD and concerned
departments.
2.5 Provincial EPAs
85. TMTD will be responsible for providing the complete environmental documentation
required by the SEPA and remain committed to the approved project design. No
deviation is permitted during project implementation without prior and explicit
permission of the SEPA.
3 https://www.adb.org/projects/documents/pak-47279-002-eia 4 https://www.adb.org/projects/documents/pak-47279-002-eia
Policy and Legal Framework 28 | P a g e
2.6 Provincial Departments of Forests and Wildlife
86. No uprooting or clearing of trees is expected for the proposed project. However, any
removed trees or vegetation under private ownership will be compensated as per
provision that in case of disruption to vegetation or trees, the project contractor will be
responsible for acquiring a ‘No-Objection Certificate’ (NOC) from the concerned forest
department. The application for an NOC will need to be endorsed by the TMTD.
2.7 Provincial Governments
87. The TMTD and its contractors must ensure that the project meets the criteria of
provincial/district governments as related to the establishment of construction camps
and plants, and the safe disposal of wastewater, solid waste, and toxic materials.
TMTD will coordinate and monitor environment related issues.
2.8 Comparison of International and Local Environmental Legislations
88. The ADB SPS requires application of pollution prevention and control technologies
and practices consistent with international good practice, as reflected in internationally
recognized standards. The SPS states that when host country regulations differ from
these standards, the EA will achieve whichever is more stringent.
89. In order to select the most stringent standards applicable, a mix of local (NEQS) and
international (IFC) regulations have been selected. The IFC Environmental, Health,
and Safety (EHS) Guidelines, General EHS Guidelines: Environmental, Noise
Management has noise level guidelines for daytime and nighttime, which are
applicable. Considering the high baseline noise levels along the project corridor, it
shall be ensured that the increase in noise levels is minimized as far as possible.
Also, project related noise levels along the project corridor are not allowed to increase
the existing levels by 3 dB or more. Furthermore, it shall be ensured that all necessary
noise mitigation measures are implemented to minimize the noise levels in the project
area.
90. The Table 2.1 presents IFC workplace noise standards that are applicable to the
construction workers. It should also be noted that IFC EHS guidelines advise that
where existing ambient noise levels already exceed thresholds, the Project should not
result in an increase of more than 3 dB over existing ambient noise at the nearest
receptor location off-site.
91. Since measured existing background noise levels along the project alignment in
average are 85 dB during the daytime and 79 dB during the nighttime, per IFC
guidelines, noise limits could be set at 3 dB above these existing background levels.
Therefore, average hourly daytime limit could be 88 dB and nighttime limit could be 82
dB.
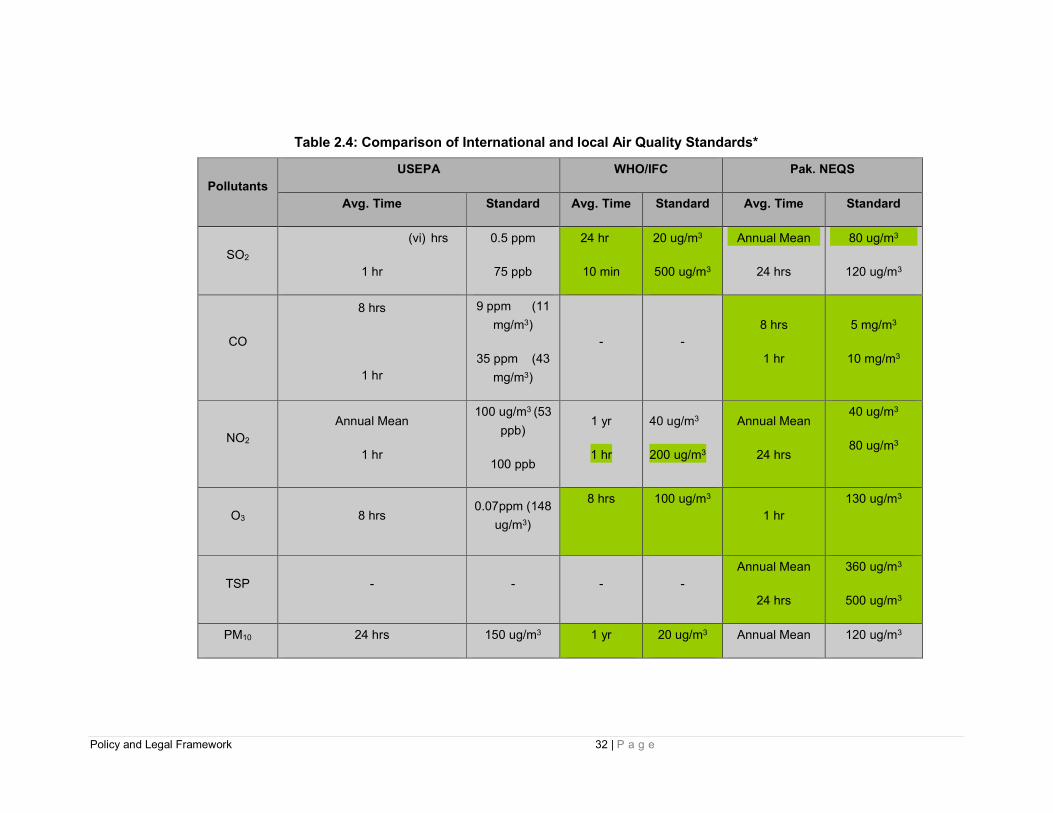
92. A comparison of applicable local and international guidelines for ambient air quality
has been provided in Table 2.4 below. In the case of most pollutants, the NEQS
standards for ambient air quality are more stringent in comparison to USEPA and
Policy and Legal Framework 29 | P a g e
WHO/IFC standards. The applicable and most stringent parameters for each
respective pollutant are highlighted in green.
93. Similar to the standards for air quality, the comparison of noise standards provided in
Table 2.5 clearly shows that NEQS standards for noise are more stringent in
comparison to the IFC standards. The only exception is the daytime noise level
standard for Industrial areas where the IFC standard is more stringent (70 dB(A)) in
comparison to NEQS (75 dB(A)) and so for this particular parameter, the IFC standard
will be used. Apart from this one exception, the NEQS standards have been used for
the proposed BRT project.
94. As far as regulations regarding other environmental parameters are concerned such
as acceptable effluent disposal parameters, the local regulations i.e. NEQS take
precedence over any other international regulations such as IFC.
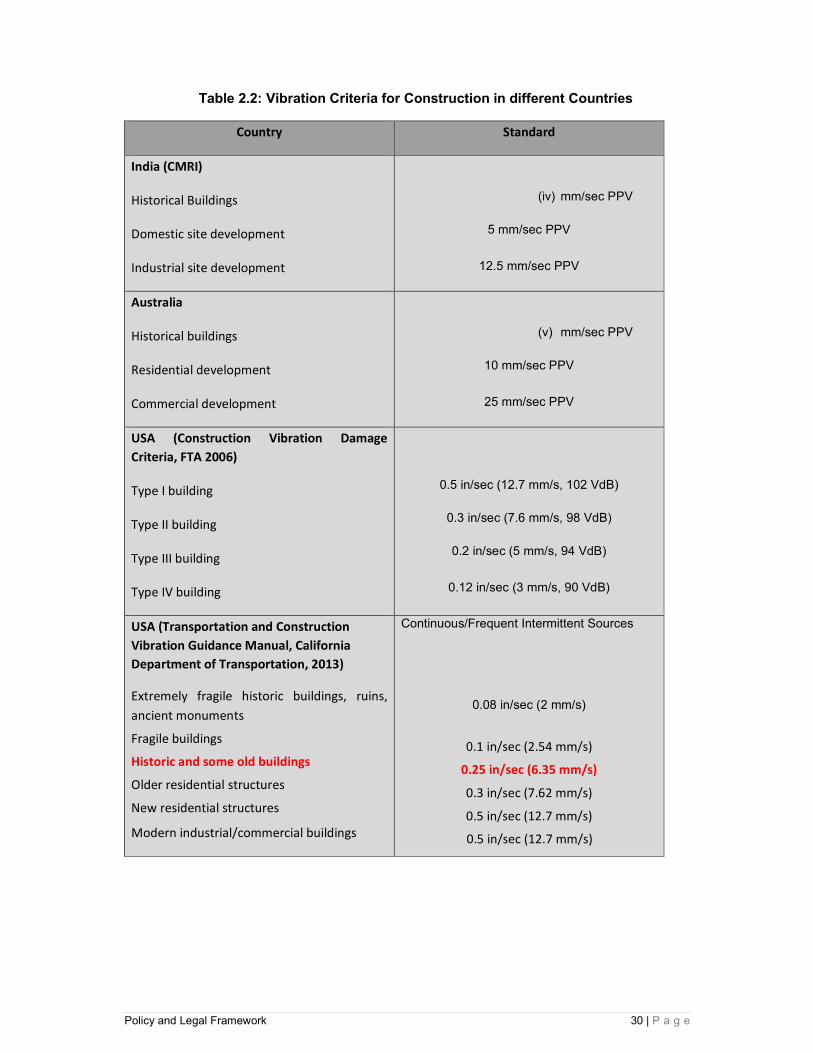
95. No standards for vibration exist in Pakistan and IFC also does not have specific
vibration impact guidance. Over the years, numerous vibration criteria and standards
have been suggested by researchers, organizations, and governmental agencies. The
Table 2.2 provides the vibration criteria for construction in different countries. Most
countries use peak particle velocity (PPV) for evaluating vibration impacts at different
types of buildings. The Transportation and Construction Vibration Guidance Manual
developed by the California Department of Transportation; USA, is considered the most
comprehensive review of the worldwide vibration criteria. According to that document, the
most appropriate criteria for the Continuous/Frequent Intermittent Sources, which
represent typical construction activities, for the historic and some old buildings is 6.35
mm/s (0.25 in/sec). Therefore, it is recommended to use 6.35 mm/s limit for this
project. However, wherever existing background levels are already higher than the
limit in an area, then the vibration limits for that particular area must be established
based on the results of the measurements. During the construction activities, vibration
levels shall be monitored to ensure they do not exceed the international vibration
standards for historical buildings.
96. Vibration due to the construction activities can also cause annoyance in addition to the possible structural damages. The Table 2.3 below shows human response to transient vibration such as construction vibration. Typically transit and intermediated vibration levels below 6 mm/s would not cause annoyance.
Table 2.1: IFC Work Environment Noise limits
Type of Work, workplace IFC General EHS Guidelines
Heavy Industry (no demand for oral communication) 85 Equivalent level Leq,8h
Light industry (decreasing demand for oral communication)
50-65 Equivalent level Leq,8h
Policy and Legal Framework 30 | P a g e
Table 2.2: Vibration Criteria for Construction in different Countries
Country Standard
India (CMRI)
Historical Buildings
Domestic site development
Industrial site development
(iv) mm/sec PPV
5 mm/sec PPV
12.5 mm/sec PPV
Australia
Historical buildings
Residential development
Commercial development
(v) mm/sec PPV
10 mm/sec PPV
25 mm/sec PPV
USA (Construction Vibration Damage
Criteria, FTA 2006)
Type I building
Type II building
Type III building
Type IV building
0.5 in/sec (12.7 mm/s, 102 VdB)
0.3 in/sec (7.6 mm/s, 98 VdB)
0.2 in/sec (5 mm/s, 94 VdB)
0.12 in/sec (3 mm/s, 90 VdB)
USA (Transportation and Construction
Vibration Guidance Manual, California
Department of Transportation, 2013)
Extremely fragile historic buildings, ruins,
ancient monuments
Fragile buildings
Historic and some old buildings
Older residential structures
New residential structures
Modern industrial/commercial buildings
Continuous/Frequent Intermittent Sources
0.08 in/sec (2 mm/s)
0.1 in/sec (2.54 mm/s)
0.25 in/sec (6.35 mm/s)
0.3 in/sec (7.62 mm/s)
0.5 in/sec (12.7 mm/s)
0.5 in/sec (12.7 mm/s)

Policy and Legal Framework 31 | P a g e
Table 2.3 Human annoyance criteria due to vibration
PPV (mm/s) Human Response
51 Severe
23 Strongly perceptible
6 Distinctly perceptible
0.9 Barely perceptible
Source: Transportation and Construction Vibration Guidance Manual, Caltrans, Sep 2013
Policy and Legal Framework 32 | P a g e
Table 2.4: Comparison of International and local Air Quality Standards*
Pollutants
USEPA WHO/IFC Pak. NEQS
Avg. Time Standard Avg. Time Standard Avg. Time Standard
SO2
(vi) hrs
1 hr
0.5 ppm
75 ppb
24 hr
10 min
20 ug/m3
500 ug/m3
Annual Mean
24 hrs
80 ug/m3
120 ug/m3
CO
8 hrs
1 hr
9 ppm (11
mg/m3)
35 ppm (43
mg/m3)
- -
8 hrs
1 hr
5 mg/m3
10 mg/m3
NO2
Annual Mean
1 hr
100 ug/m3 (53
ppb)
100 ppb
1 yr
1 hr
40 ug/m3
200 ug/m3
Annual Mean
24 hrs
40 ug/m3
80 ug/m3
O3 8 hrs 0.07ppm (148
ug/m3)
8 hrs
100 ug/m3
1 hr
130 ug/m3
TSP - - - -
Annual Mean
24 hrs
360 ug/m3
500 ug/m3
PM10 24 hrs 150 ug/m3 1 yr 20 ug/m3 Annual Mean 120 ug/m3
Policy and Legal Framework 33 | P a g e
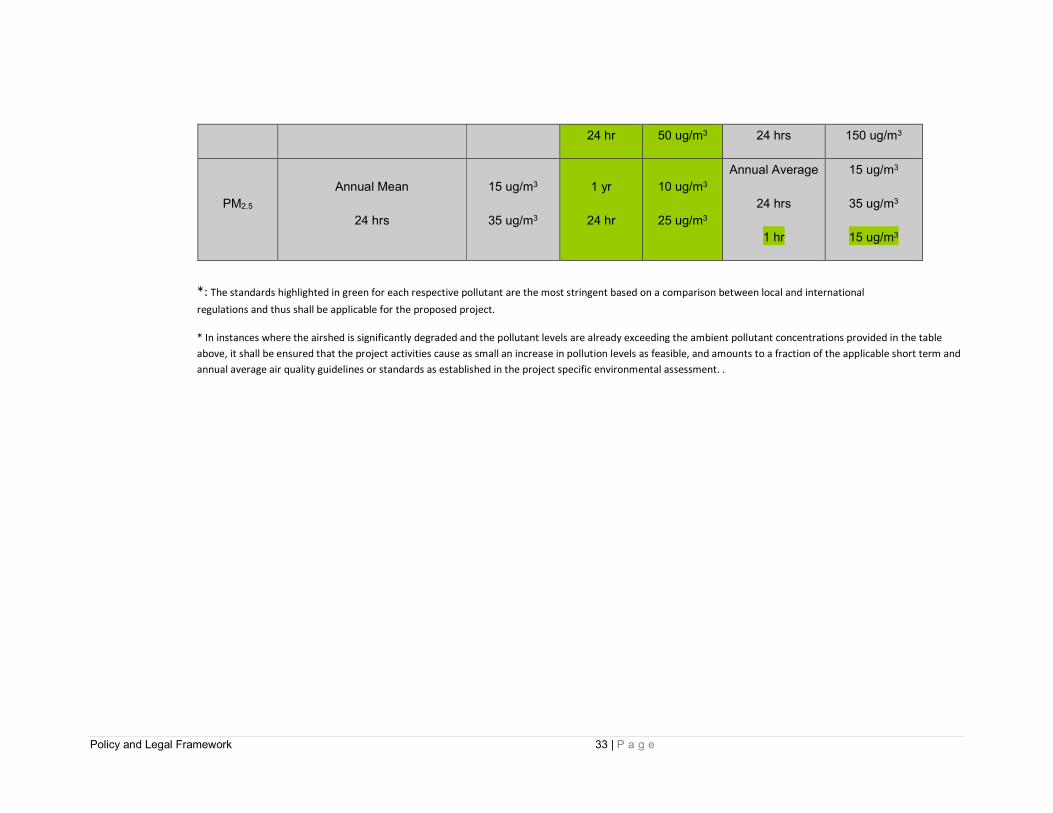
*: The standards highlighted in green for each respective pollutant are the most stringent based on a comparison between local and international
regulations and thus shall be applicable for the proposed project.
* In instances where the airshed is significantly degraded and the pollutant levels are already exceeding the ambient pollutant concentrations provided in the table
above, it shall be ensured that the project activities cause as small an increase in pollution levels as feasible, and amounts to a fraction of the applicable short term and
annual average air quality guidelines or standards as established in the project specific environmental assessment. .
24 hr 50 ug/m3 24 hrs 150 ug/m3
PM2.5
Annual Mean
24 hrs
15 ug/m3
35 ug/m3
1 yr
24 hr
10 ug/m3
25 ug/m3
Annual Average
24 hrs
1 hr
15 ug/m3
35 ug/m3
15 ug/m3

Policy and Legal Framework 34 | P a g e
Table 2.5: Comparison of International and Local Noise Standards
*: The standards highlighted in green for each respective Area/Zone are the most stringent based on a comparison between local and international regulations and thus shall be
applicable for the proposed project.
* In instances where baseline noise levels are already exceeding the standards above, it will need to be ensured that the project activities do not cause an increment of more than 3
dB(A) from the baseline noise levels.
Category of Area/Zone
Limit in dB(A) Leq
NEQS WHO/IFC
Day Time
06:00 – 22:00
Night Time
22:00-06:00
Day Time
07:00 – 22:00
Night Time
22:00-07:00
Residential area (A) 55 45 55 45
Commercial area (B) 65 55 70 70
Industrial area I 75 65 70 70
Silence zone (D) 50 45 55 45
Description of the Project 35 | P a g e
3 Description of the Project
3.1 Project Overview
97. This chapter provides the salient design features of the 2.4 km Common Corridor
project from Municipal Park to Tower and along this corridor, all BRT services from all
the BRT lines of Karachi shall run as a common BRT service. The project shall
provide connectivity to one of the busiest business centers of the city and will enable
the residents of Karachi city to travel conveniently.
98. Through the course of this corridor, a number of wholesale markets, business centers,
banks, hospitals, government offices are located, signifying that this corridor is indeed
at the center of all metropolitan activities. The proposed routes for mixed traffic and
the pedestrian facilities for the commercial areas have also been discussed in this
chapter. The proposed project corridor is shown as Figure 3.1 below.
99. A biogas (methane) generation facility using cow manure from extensive feedlots in
the vicinity of the Landhi Cattle (Bhans) Colony in the outskirts of Karachi is proposed
to be constructed and is included in the PC-1 government planning document with a
budget allocation of some USD 10 million. The plant is proposed to provide a steady
stream of sufficient quality methane gas for fuelling the bus fleet. The detailed
feasibility study for this biogas facility is presently ongoing and expected to be
completed in the coming months. Once complete, a separate IEE or EIA study shall
be prepared for development of this biogas facility.
3.2 Justification and Need for Project
100. The Karachi BRT Red Line Project, including the proposed 2.4 km Common Corridor
project, will deliver a sustainable urban transport system that focuses on accessibility
and peo’le's mobility needs. The project will aim to organize urban growth and public
space along the corridor through integration of land-use and transport planning,
improving quality of life, and providing a holistic solution for integrated urban mobility.
The purpose of this project is to develop a sustainable urban transport system that
delivers fast, affordable, comfortable, safe, and secure services to all.
101. The project encompasses the Red Line Corridor and a segment of the Common
Corridor, as well as feeder and direct service routes to nearby communities. The Red
Line Corridor consists of a dedicated median busway from Numaish to Malir Halt
Depot. The Common Corridor segment consists of a dedicated busway between
Municipal Park and Merewether Tower. The Common Corridor segment between
Numaish and Municipal Park is being prepared and will be implemented under the
Green Line project, as financed by the Government of Pakistan.

Description of the Project 36 | P a g e
Figure 3.1: Proposed 2.4 km Common Corridor Alignment – BRT Red Line

Description of the Project 37 | P a g e
102. Although there are many reasons to justify the need for this BRT project, however the
main objective of implementing the proposed project is passenger time savings. BRT
lanes can increase the bus travel speed and it should be built on a corridor where
many public transport users travel and endure delays.
103. The proposed BRT project is expected to mitigate congestion for car users,
especially in areas where buses block entire roads to pick up passengers, which can
occur practically anywhere in Karachi city. A BRT system generally gives priority to
public transport passengers, but can also greatly improve conditions for mixed traffic
by solving the congestion problem caused by stopping buses.
104. BRT is an effective way to use space to move people in the city. One BRT lane of 3.5
meters can move up to 10,000 passengers per hour in one direction, whereas 3 car
lanes of 10 meters width can only move a total of 4,500 to 6,000 people per hour in
one direction.
105. The BRT project can be used as an opportunity to restructure the entire public
transport industry. With the BRT implemented, the government will have more
bargaining power to reform the public transport in Karachi. BRT could be used as an
opportunity to bring professional bus operating companies to run in Karachi and show
the best practice model to the existing operators.
106. A positive impact on the environment is expected from the proposed BRT project due
to the use of a cleaner and more fuel efficient fleet being used in the BRT as well as
reduction in vehicular exhaust emissions due to reduction in kilometers travelled by
private vehicles.
107. There are also a number of economic benefits associated with the proposed BRT
project due to the time savings of both the public transport and private vehicle
passengers. Also, since there is no formal bus industry as yet in the city, the BRT will
open up more formal employment associated with the BRT such as security guards,
bus drivers, mechanics etc.
108. In comparison to rail based mass transit system, BRT offers flexibility and is easy to
expand. Dedicated BRT lanes can increase bus travel speed significantly. But most
importantly, with BRT, buses can operate inside and outside the BRT corridor,
allowing rapid citywide coverage.
3.3 BRT Vehicle Fleet
109. The BRT vehicle fleet for the Red Line project consists of three different lengths of
low-emission buses that are tailored to meet the passenger demand levels and the
physical constraints of the routes. The vehicle body shape will feature a modern
aerodynamic design for fuel efficiency.
110. Compressed natural gas (CN–) - conventional hybrid electric (batteries charged
through regenerative braking) has been selected as the technology for BRT vehicles,
based on (i) a multi-criteria analysis, including mostly environmental and financial
Description of the Project 38 | P a g e
considerations; and (ii) detailed financial modeling of the BRT system, including
various fuel options. The input fuel shall be bio-methane, produced from cattle
manure. This technology enables the system to operate with a net operational cash
flow and be financially sustainable without the need for operational subsidy.
111. The positive net cash flow of the CNG-hybrid option is also contingent on the public
financing of the vehicles, which is the basis for the decision to include the rolling stock
under the project scope.
112. The incremental cost from basic Euro II diesel technology to the low-emission (Euro
V) CNG-hybrid technology will be financed by the GCF through concessional loan.
3.4 Proposed BRT Route – Municipal Park to Tower
113. The Red Line is proposed to connect with the Green Line, currently under
construction, at Numaish station for seamless and connected operation, rather than
forcing customer transfers through a terminal interchange. The Red Line services will
then continue on the shared common corridor from Numaish station until Merewether
Tower.
114. This 2.4 km segment of the BRT Common Corridor serves some of the highly visited
places of Karachi, including:
Jama Cloth
Services Hospital Karachi
Dow Medical College
Civil Hospital
KMC Office
City Court
Denso Hall
State Bank of Pakistan
115. At Municipal Park, an ‘at grade’ rotary for the BRT buses has been proposed as
shown in Figure 3.2 below. It shall also serve as an intersection for the mixed traffic to
enable smooth cross movement of the vehicles. Signals for both the BRT buses and
mixed traffic have been proposed at this location. A BRT service (coming from
Shahrah-e-Liaquat) shall also enter the BRT Common Corridor at Municipal park and
exit from Muhammad Bin Qasim road and from here up till Jama Cloth market, the
BRT will be routed on the right side of M.A.Jinnah road.
116. The stations CC-05, CC-06, CC-07 will be split stations without any connections as
shown in Figures 3.2 to 3.4 below. The platforms shall have a width of 3.5m and a
length of 25m. The absence of connections is attributed to the constricted width of the
right-of-way. All stations shall have ‘at grade’ pedestrian accesses with pelican signals
in order to enable cross movement of the pedestrians from both sides of the road.
Description of the Project 39 | P a g e
Direct access to hospitals, banks, police station and significant government offices
and courts are provided with traffic management plans on roads connecting the
M.A.Jinnah road from both sides.
117. From Jama cloth to City Court, 3 mixed traffic lanes of 2.8m width each, (heading to
Tower), have been maintained on the right side of M.A.Jinnah road. Ahead of Jama
Cloth market, the BRT corridor shall shift to the left side of the road. There shall be
parking facilities for the mixed traffic vehicles at KMC building and City Court as
shown in Figure 3.5 below. In order to provide this parking facility, a BRT underpass
between Campbell Street and Napier road has been proposed. Beyond Napier road,
only the BRT service shall continue whereas the mixed traffic shall either proceed to
the Marriot road or take a left turn towards Napier road. The stations CC-08 and CC-
08A shall have 4 platforms of width 3 meters and length 25 meters, joined by a single
connection only, with a length of 32 meters as shown in Figures 3.6 and 3.7 below.
118. Soft BRT is planned between Bolton Market and Tower, as this reach is proposed to
serve the BRT buses and non-motorized traffic only. Soft isolation of BRT lanes shall
be provided through the provision of bollards on both sides, thus allowing pedestrians
to cross BRT lanes in this reach as shown in Figures 3.6 and 3.7 below.
119. Approaching Tower, there shall be an underpass for the mixed traffic coming along I.I
Chundrigarh road as shown in Figures 3.8 and 3.9 below. The BRT shall remain ‘at
grade,’ however, a rotary has been proposed at Tower, which shall serve as a
turnaround point for the BRT buses to head back to Numaish. Staging facilities on
both sides of the corridor have been planned too as shown in Figure 3.8 below.
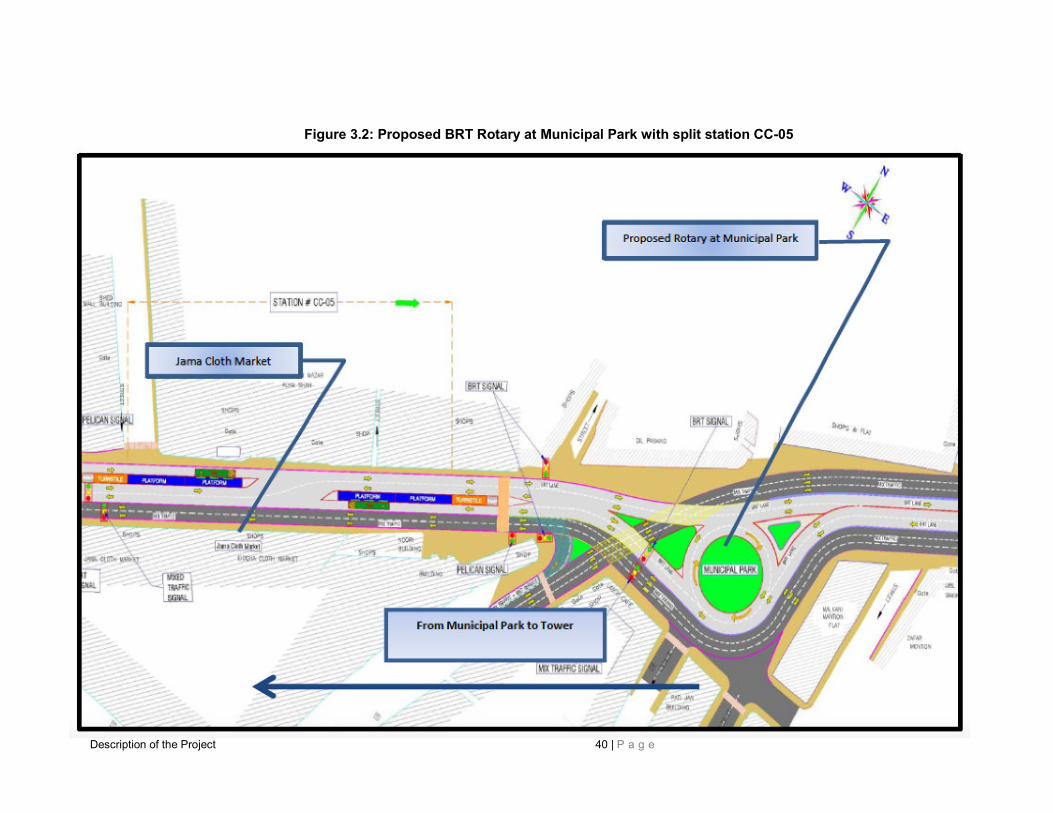
Description of the Project 40 | P a g e
Figure 3.2: Proposed BRT Rotary at Municipal Park with split station CC-05
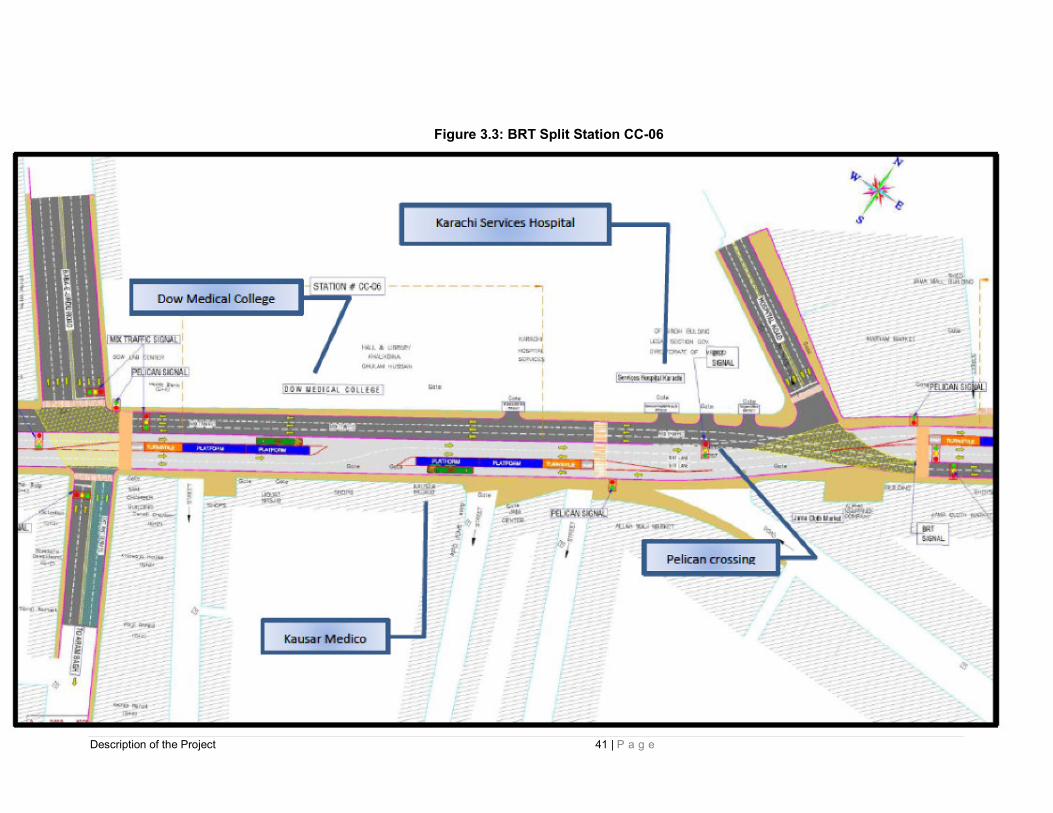
Description of the Project 41 | P a g e
Figure 3.3: BRT Split Station CC-06
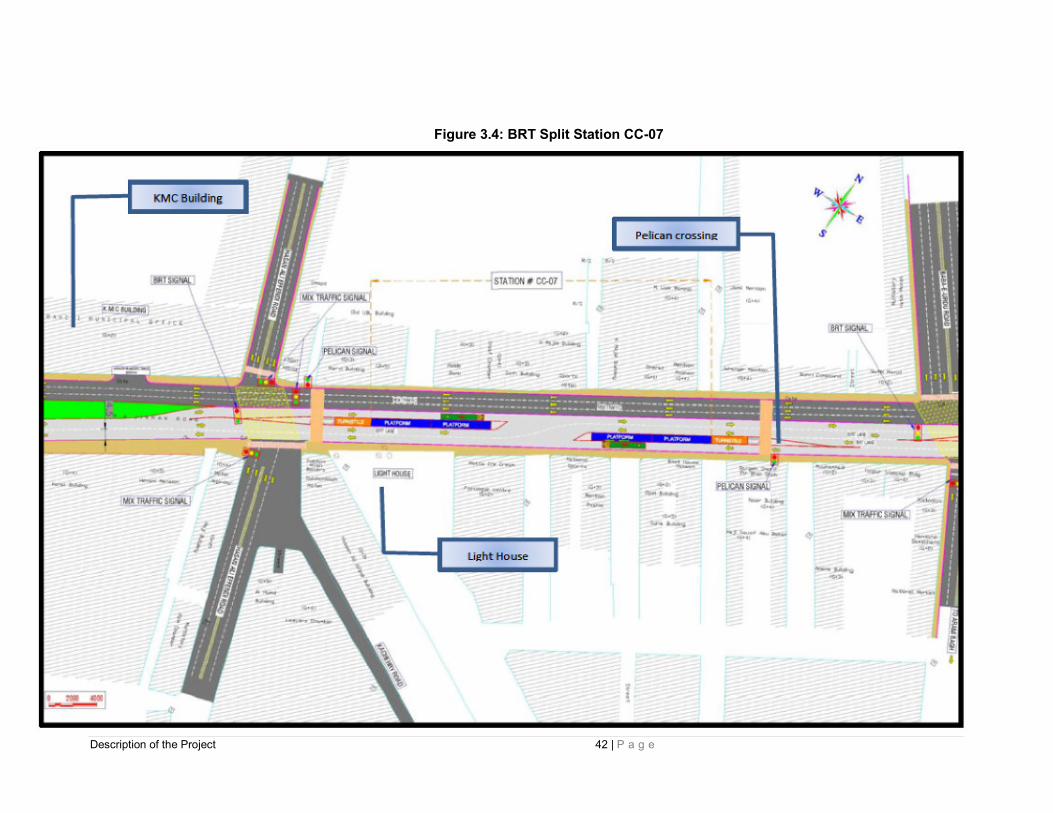
Description of the Project 42 | P a g e
Figure 3.4: BRT Split Station CC-07
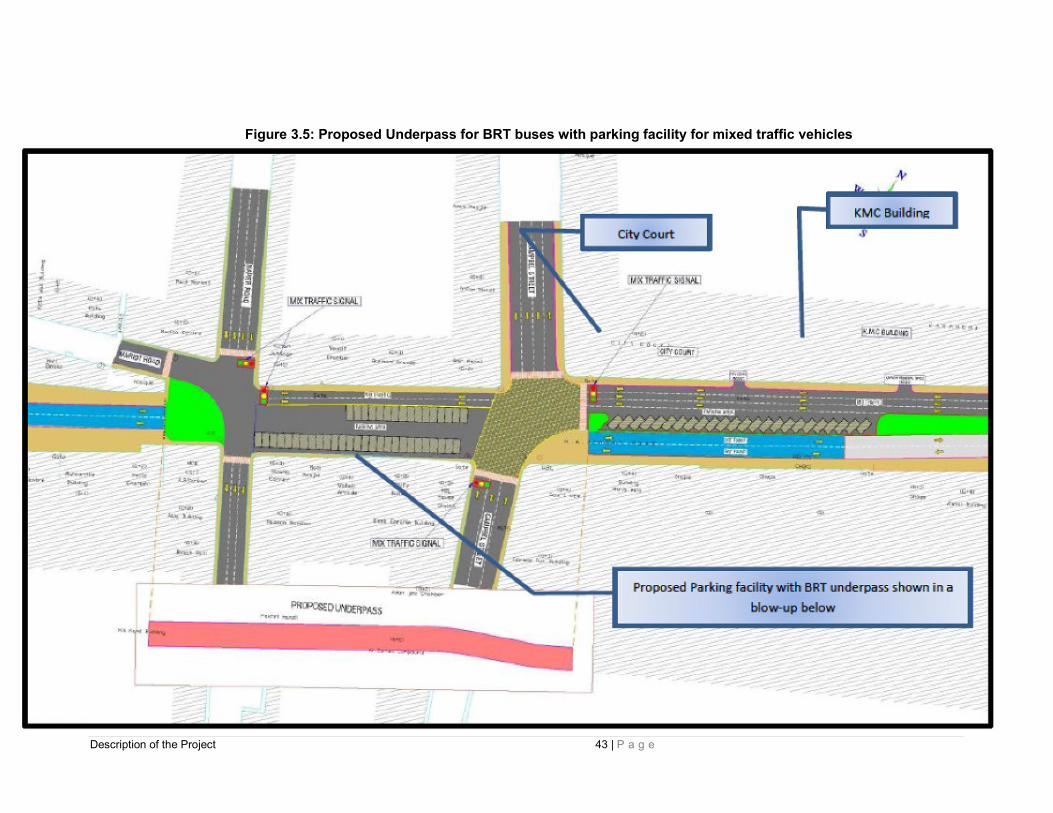
Description of the Project 43 | P a g e
Figure 3.5: Proposed Underpass for BRT buses with parking facility for mixed traffic vehicles

Description of the Project 44 | P a g e
Figure 3.6: BRT station CC-08 with single connection and bollards

Description of the Project 45 | P a g e
Figure 3.7: BRT station CC-08A with single connection and bollards

Description of the Project 46 | P a g e
Figure 3.8: BRT staging facility at Tower, with turnaround point
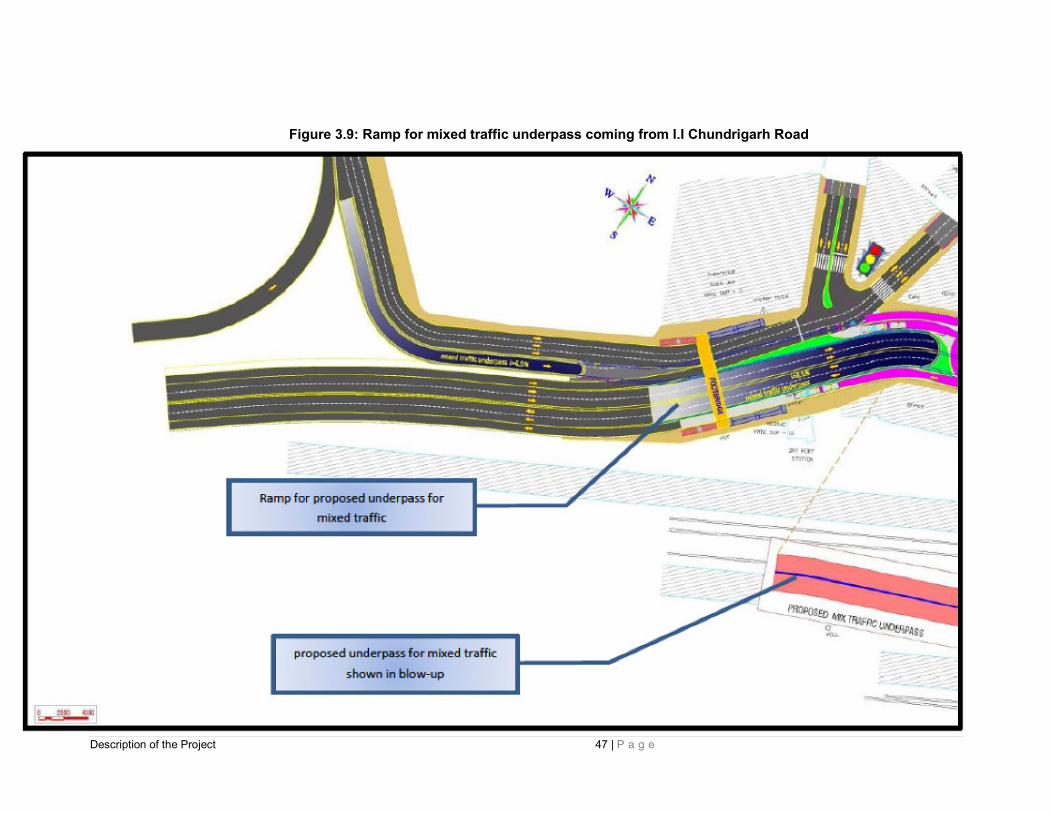
Description of the Project 47 | P a g e
Figure 3.9: Ramp for mixed traffic underpass coming from I.I Chundrigarh Road

Description of the Project 48 | P a g e
3.5 Biogas Plant Development
120. Currently, over 3,200 tons of cattle waste is produced on a daily basis at farms in the
Cattle Colony area of Karachi and this waste is then discarded into Karachi Bay. To
wash the waste into the Bay, about 50,000 cubic meters of freshwater is lost. The
resulting impact of this process is catastrophic, both to the local ecology and the
global environment due to the resulting oxygen depletion, which causes a negative
impact. Methane is a greenhouse gas that is 30 times more powerful in its global
warming impact than carbon dioxide. With the Red Line project, part of the waste
(exact quantities to be determined during detailed feasibility study) will be converted
into bio-methane, which will be the fuel source for BRT vehicles. By eliminating
current methane emissions, the project is effectively a zero-emission win for the
environment.
121. The biogas plant to convert the waste into bio-methane will be funded under the
project by the GCF through a highly concessional loan. This enhances further the
project financial viability by ensuring the stability and reducing the cost of fuel, one of
the system’s main operational costs.
122. The biogas plant will be implemented through a Design-Build-Operate (DBO)
contract managed by Trans Karachi. The Request for Proposal and the draft contract
are currently being prepared through ADB’s Clean Energy Fund (additional grant),
including all necessary due diligences.
123. As already mentioned above in Section 3.1, once the project feasibility study has
been completed, an IEE or EIA study shall be prepared as per the national and ADB’s
safeguard requirements and the required approvals shall be obtained prior to
commencement of construction of the proposed biogas plant.
3.6 Project Construction Schedule
124. The project construction phase is expected to last for a total of 12 months with the
activity expected to commence in the third quarter of 2019 and completed by the third
quarter of 2020.
3.7 Construction Camps and Work Force
125. The construction activity has to span over approximately twelve months. There shall
be a number of contracts for a variety of works. The selected Contractor shall have
the option to select suitable site(s) located near the project sites to establish his labor
camps. If private land is selected, the contractor shall enter into contract with the
private owner.
126. Since the work is quite scattered in nature with a large number of sites along the
project corridor, the project construction will be divided into three packages (3
reaches). The work bases shall be setup by the contractor in consultation with the
engineering teams. Essential for the work bases is easy approach, availability of a
suitable place for temporary storage of material and availability of water for

Description of the Project 49 | P a g e
construction in the vicinity. Presence of shade from trees close to the work bases can
add to the comfort of the labor while taking rest during the hot season.
127. The location of storage materials and camps will be critical. Since the project
contractor(s) will be responsible for identifying the suitable locations for storage and
labor camps from the private sector, thus there will need to be clear guidelines for this
process, which will need to be closely monitored by the implementing agency. As far
as possible, the project design team shall be assigned the task to identify the suitable
location(s) for storage of materials since inappropriate storage of materials may result
disruption of the traffic movement.
3.8 Machinery Requirement
128. For storing materials, stocking equipment and parking machinery and vehicles, the
Contractor shall require open and accessible sites close to the labor camps. The
Contractor, at his own expense, but keeping in view his contractual obligations to
honor the NEQS regarding level of pollution, shall make the arrangements.
3.9 Project Operation Phase
129. An operational design and business model (ODBM) has been prepared by the design
consultants (Exponent Engineers, Karachi) engaged by TMTD for removal of on street
parking along M.A Jinnah road and adjoining areas during the operation of the
proposed BRT project.
130. The consultants have separated the project corridor into sixteen segments for on
street parking between Sir Agha Khan III road and Tower as shown in Figure 3.10
below. This quantification and strategizing to address parking issues shall result in
improved traffic flow and improvement of the BRT along this corridor.
131. The surveys conducted to assess parking dynamics have shown that on-street
parking reaches peak demand between 13:00 to 15:00 hours. Once the peak
motorcycle demand reaches 2,873, the parking demand for cars reaches 1,233.
132. The average segmental parking demand is 2,500 for motorcycles and 600 for cars.
There are only two segments for motorcycles and four segments for cars having
parking need exceeding this average as shown in Figures 3.11 and 3.12 below.
133. The variation of land use along M.A Jinnah road, results in various segments
reaching peak in different hours of the day for On-street parking. The On-street
parking demand for motorcycles reaches peak between 13:00 and 15:00 hours and
the same for cars peak parking demand reaches peak at 14:00-15:00 hours.
134. The variation of land use along M.A Jinnah road, results in various segments
reaching peak in different hours of the day for On-street parking. The On-street
parking demand for motorcycles reaches peak between 13:00 and 15:00 hours and
the same for cars peak parking demand reaches peak at 14:00-15:00 hours as shown
in Figure 3.13 below.

Description of the Project 50 | P a g e
135. The ADB study identified 41 off-street parking lots in CBD. This creates an
opportunity to remove on-street vehicles and put them in these off-street lots as
shown in Figure 3.14 below.
136. The parking lots identified as a result of the ADB study are shown in Figure 3.15
below.
137. Thus, there is sufficient space to accommodate all the vehicles and motor cycles
presently being parked on the streets to be relocated to off-street parking.

Description of the Project 51 | P a g e
Figure 3.10: Segmentation of Project Corridor for On-street Parking solutions
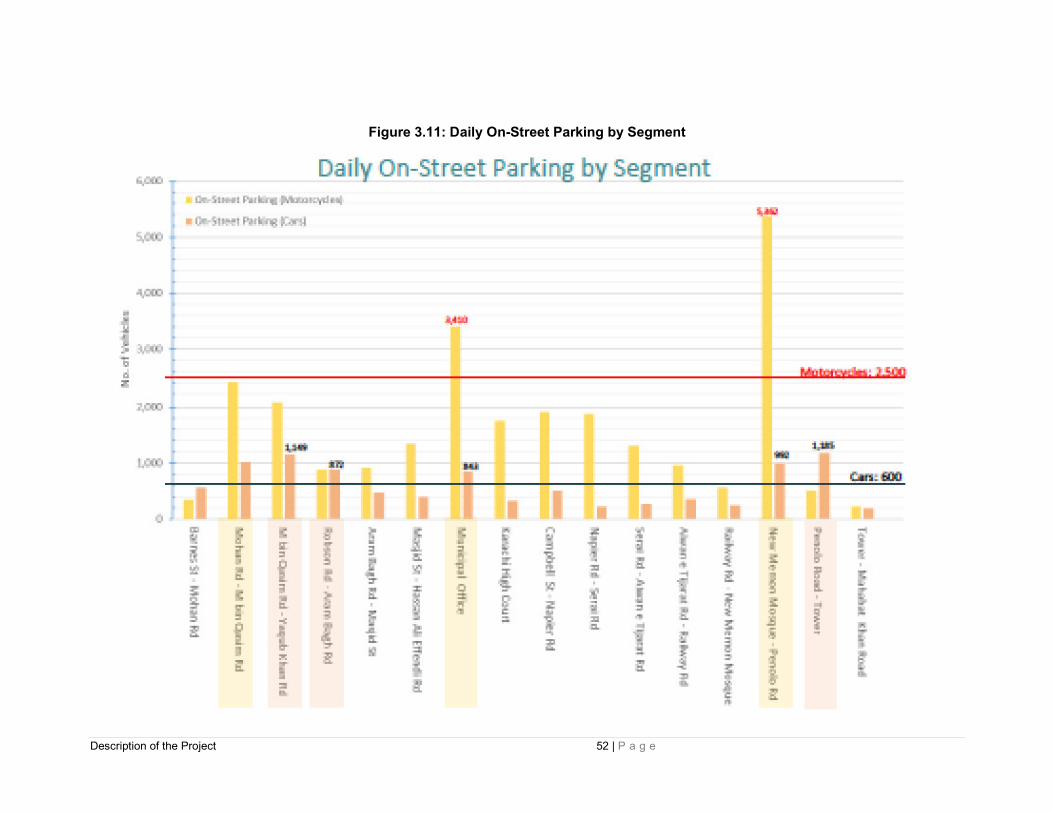
Description of the Project 52 | P a g e
Figure 3.11: Daily On-Street Parking by Segment

Description of the Project 53 | P a g e
Figure 3.12: Daily On-Street Parking by Time of Day
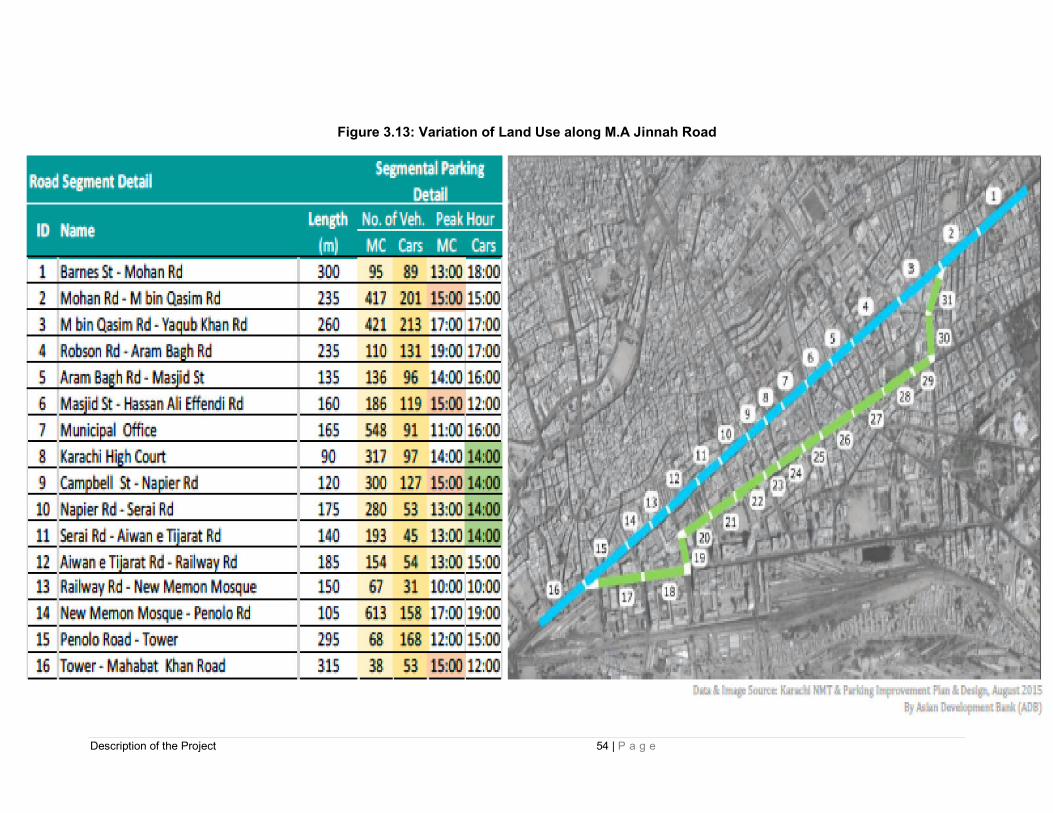
Description of the Project 54 | P a g e
Figure 3.13: Variation of Land Use along M.A Jinnah Road

Description of the Project 55 | P a g e
Figure 3.14: Off-street parking lots in CBD

Description of the Project 56 | P a g e
Figure 3.15: Parking lots as identified by ADB

Description of Environment 57 | P a g e
4 Description of Environment
4.1 General
138. Please refer to Chapter 5 ‘Description of the Environment’, Page 73 of the EIA report5
for the complete description of the baseline conditions in Karachi city, Sindh province
of Pakistan.
139. Please find below description of the project corridor along with primary baseline
information on air quality, noise and vibration levels specific to the proposed common
corridor. Detailed primary data collection through monitoring of air quality, noise and
vibration levels has been conducted at three locations along the common corridor and
these findings have been presented in this supplementary EIA document.
4.2 History of M.A Jinnah Road
140. The Muhammad Ali Jinnah road, a.k.a MA Jinnah road, was known originally as
Bunder (or Bandar) road, meaning ‘Port road’. It is one of the city’s oldest and most
important road, running through the city to the docks. It was later renamed in honor of
the founder of the nation, Muhammad Ali Jinnah. There are a number of landmarks
located along this historic road, including the Merewether Clock Tower, Karachi
Municipal Corporation Building, City Court, Denso Hall and Library, Khaliq Dina Hall
and Shri Swaminarayan Mandir (Temple).
4.3 Major Historic Buildings along Project Corridor of M.A Jinnah road
Karachi Metropolitan Corporation (KMC) Building
141. It is a historic building whose foundation stone was laid in 1927 and its construction
was completed in 1930, and it was inaugurated in 1932.
142. In January 2007, the City District Government of Karachi celebrated the 75th
Anniversary of the building. The building went through a major renovation project,
which included repairing of the clock tower.
143. This building undergoes periodic maintenance and is presently in very good shape
and houses the offices of the Karachi Municipal Corporation (KMC).
Denso Hall
144. It is a library located at the corner of M.A Jinnah road and Murad Khan road in
Saddar town. It was constructed in 1886 as the first library for the natives of Karachi.
145. James Strachan was the architect of the project and the building was completed in
the year 1886. The architectural design is Venetian gothic. Gizri sandstone was used
in the construction. When the building was completed, it had one library and one
reading-room on the ground floor, and the main hall on the first floor. The main road
5 https://www.adb.org/projects/documents/pak-47279-002-eia

Description of Environment 58 | P a g e
facing side has balconies with sculpted balusters. The clock on the top was a gift from
Rao Sahib Ramdas Morarji.
146. In 2010, it was announced that the Heritage Foundation Pakistan, with financial
support from Karachi Electric Supply Corporation, will restore Denso Hall as
a Heritage site.6
147. This building is well maintained by the KMC and is presently in use.
Shri Swaminarayan Mandir (Temple)
148. It is a Hindu temple that belongs to the Nar Narayan Dev Gadi of the Swaminarayan
Sampraday and is the only Swaminarayan temple in Pakistan. The temple is notable
for its size and frontage, over 32,306 square yards (27,012 m2) on the M. A. Jinnah
Road . The temple celebrated its anniversary of 150 years in April 2004. It is believed
that not only Hindus but also adherents of Islam visit the temple, which adds to its
notability. There is a sacred cowshed within the premises of this temple. The temple is
located at the centre of a Hindu neighborhood in Karachi. The building that housed
a dharmshala (guest house) for visiting devotees has now been converted to the
office of the City District Government.7
149. This temple is well maintained by its trustees and undergoes regular maintenance
and is presently in use by the hindu community.
Khaliq Dina Hall
150. The original name of this historical building is Ghulam Hoosain Khalik dina Hall and
Library, written on the front of the sandstone building. It has a hall which is used for
various events and functions. A room is dedicated to a library and one room caters as
an office of a NGO. The rooms according to the agreement were put at the disposal of
the committee of the native General Library. The hall was 70 feet in length and 45 feet
broad. The height was 30 feet. The hall can seat 600-700 persons. The front portion
has an area of 525 by 325 feet.
151. Khalikdina Hall holds a historical significance as it was used in British India by the
British authorities in 1921 as a court to try Maulana Shaukat Ali and
Maulana Mohammad Ali Jouhar, leaders of the Khilafat movement.
152. Khaliqdina Hall was originally built in 1906. The building was named after Ghulam
Hussain Khaliqdina who gave a generous donation of Rupees 18,000 out of the total
cost of Rupees 33,000 to construct the sandstone building back then. Karachi
Municipal Corporation provided the remaining funding. The main hall can seat
approximately 600 persons.
6 https://en.wikipedia.org/wiki/Denso_Hall 7 https://en.wikipedia.org/wiki/Shri_Swaminarayan_Mandir,_Karachi

Description of Environment 59 | P a g e
153. Along with other historical buildings in Karachi, Khaliq Deena Hall was also neglected
for years. It was restored in 2002 by the Karachi Metropolitan Corporation at a cost of
Rupees 15 million. This building is now protected as one of the cultural heritage sites
in Sindh.
154. This building is well maintained by the KMC and is presently in use.
Merewether Clock Tower
155. This tower was raised by public subscription as a memorial for Sir William L.
Merewether, who served as Commissioner of Sindh from 1867 to 1877.8 Designed by
James Strachan, the Municipal Engineer, the foundation stone was laid by
the Governor of Bombay, Sir James Fergusson in 1884. It was constructed in 1886
and is now located at the intersection of M.A. Jinnah Road and I.I. Chundrigar Road. It
was formally opened to the public in 1892 by the Commissioner in Sind, Sir Evan
James.
156. The Tower stands on a base of 44 feet square and rises to a height of 102 feet.
Strachan designed the tower in the Gothic Revival style popular in Victorian England,
to evoke the architecture of Medieval England (11th to 15th century A.D.). The structure
is built in buff-colored Gizri stone and shows a heightened sensitivity to detailing and
emphasis on carving and decoration. The architecture takes the form of an Eleanor
cross.
157. This tower is well maintained and visually appears to be quite robust from a structural
perspective.
4.4 Declared ‘National Heritage Buildings’
158. The Sindh Building Control Authority (SBCA) has listed a total of 426 buildings
declared as ‘National Heritage Buildings’ across Karachi city9. A careful review of this
list has revealed that forty-two buildings are located on the M.A. Jinnah road. It should
be mentioned that the Khaliq Dina Public Hall and Library is also listed as a ‘National
Monument’ for Sindh province.10
159. Field surveys were able to reveal that fifteen ‘national heritage’ buildings are located
on the 2.4 km stretch of the BRT Common Corridor. These buildings are shown in the
following Figures 4.1 to 4.8 below. Although it is quite challenging to identify all the
forty two national heritage buildings listed on the M.A Jinnah road since this
information is not easily available, however in case any other buildings from the SBCA
list are found to be lying within the corridor, they shall be added to the updated version
of the supplementary EIA report.
8 https://en.wikipedia.org/wiki/Merewether_Clock_Tower 9 https://antiquities.sindhculture.gov.pk/index.php/publication/reports/karachi-heritage-building-re-survey-
project/309-sindh-building-control-authority-heritage-buildings 10 Pak EPA-Government of Pakistan (Oct 1997), Guidelines for Sensitive and Critical Areas

Description of Environment 60 | P a g e
4.5 Sensitive Receptor Mapping along Project Corridor
160. Based on the field surveys conducted along the project corridor during January’19,
February’19 and March’19, mapping of the sensitive receptors consisting of historic
buildings, hospitals, educational institutions, public offices, residences and places of
worship (mosques, temples etc.) have been identified. These receptors can be
observed in the Figures 4.9 to 4.11 below.
161. During the construction phase of the project, it shall be ensured that required
mitigation measures are in place to protect all sensitive receptors located along the
corridor through efficient and effective implementation of the Environment
Management Plan (EMP), particularly relating to protection of the national heritage
and historical buildings from high vibration levels during the construction works.
Figure 4.1: Cluster 1 of Declared National Heritage Buildings
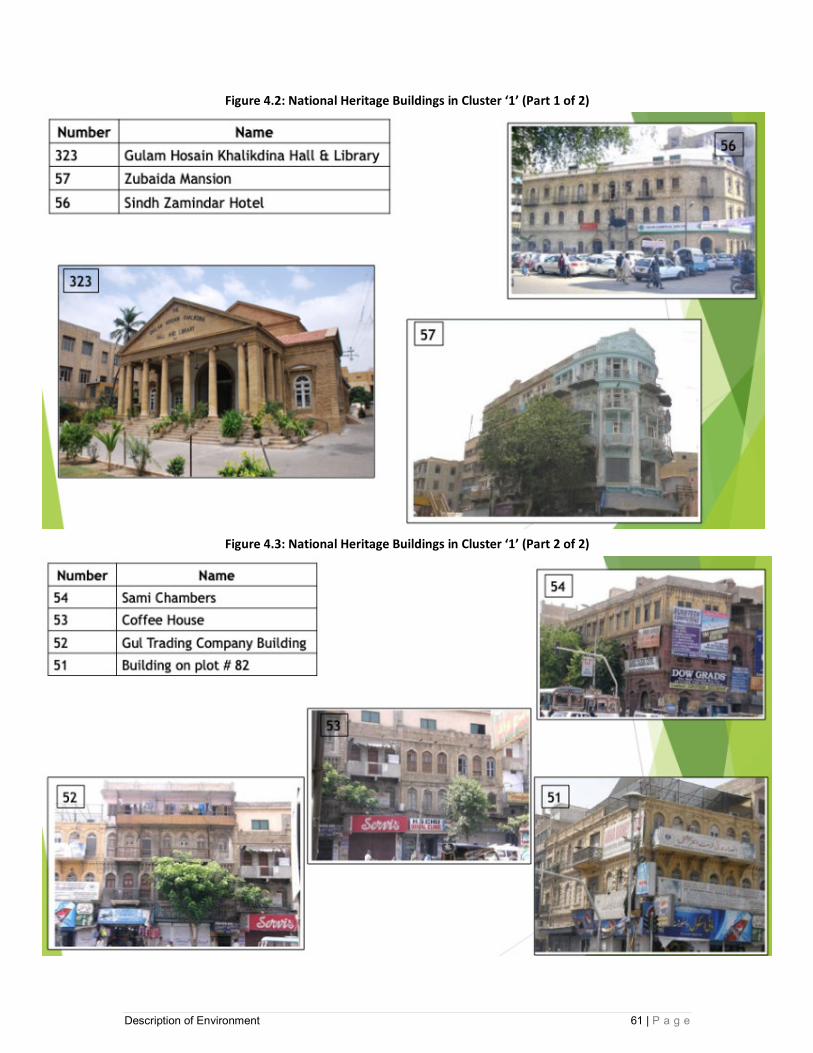
Description of Environment 61 | P a g e
Figure 4.2: National Heritage Buildings in Cluster ‘1’ (Part 1 of 2)
Figure 4.3: National Heritage Buildings in Cluster ‘1’ (Part 2 of 2)

Description of Environment 62 | P a g e
Figure 4.4: Cluster 2 of Declared National Heritage Buildings
Figure 4.5: National Heritage Buildings in Cluster ‘2’ (Part 1 of 2)
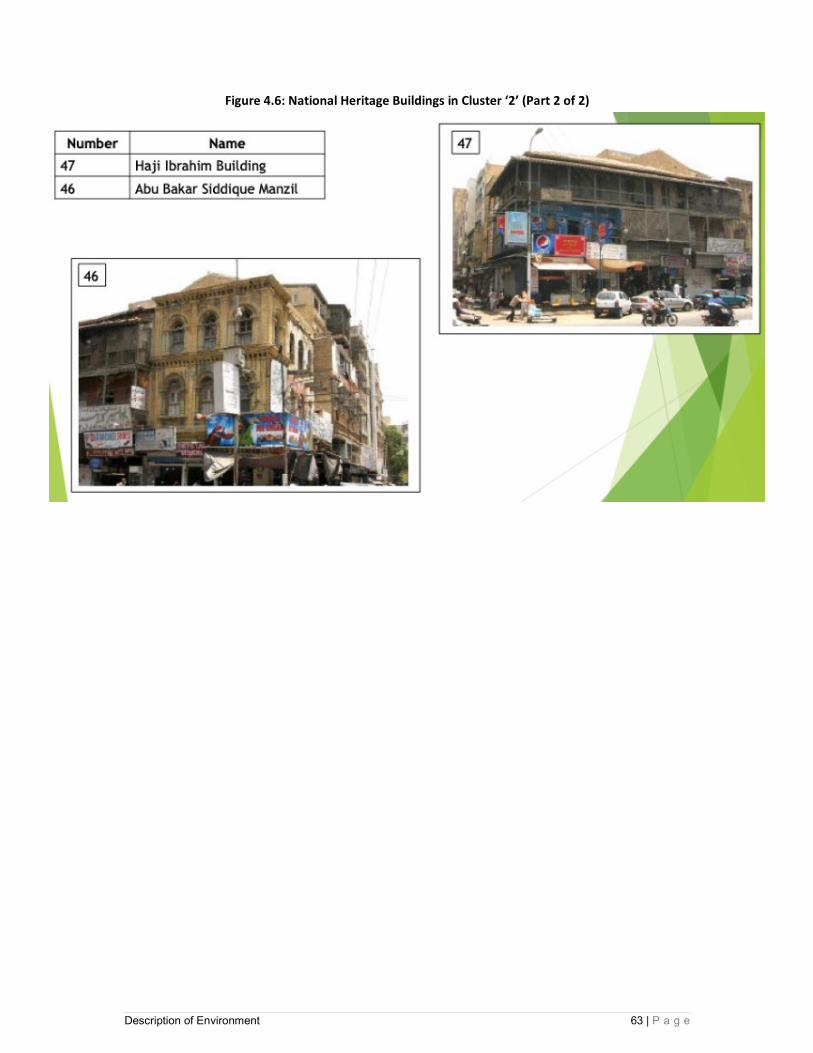
Description of Environment 63 | P a g e
Figure 4.6: National Heritage Buildings in Cluster ‘2’ (Part 2 of 2)

Description of Environment 64 | P a g e
Figure 4.7: Cluster 3 of Declared National Heritage Buildings
Figure 4.8: National Heritage Buildings in Cluster ‘3’
162. The maps of the land use along the proposed project corridor are also provided as
Figures 4.12 to 4.14 below. As it can be observed from the maps, there is a diverse
pattern of land use along the project corridor with a dominant presence of commercial
land use interspersed with historical landmarks, religious buildings, educational and
health care institutions, public buildings such as the City Courthouse and even police

Description of Environment 65 | P a g e
stations. It should be mentioned that there is a high concentration of residences in the
corridors adjacent to the proposed project corridor with the standard land use pattern
consisting of shops on the ground floor with residences on top of these
shops/commercial centers, thus ensuring that each building serves a dual purpose.
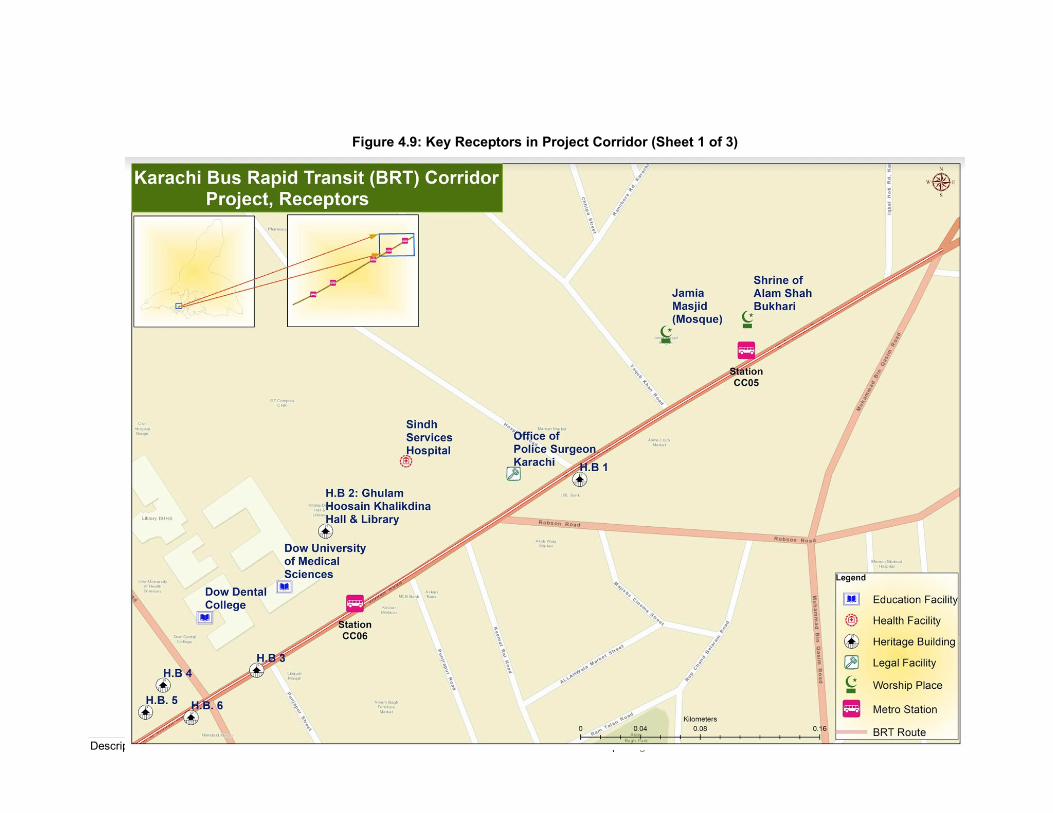
Description of Environment 66 | P a g e
Figure 4.9: Key Receptors in Project Corridor (Sheet 1 of 3)

Description of Environment 67 | P a g e
Figure 4.10: Key Receptors in Project Corridor (Sheet 2 of 3)
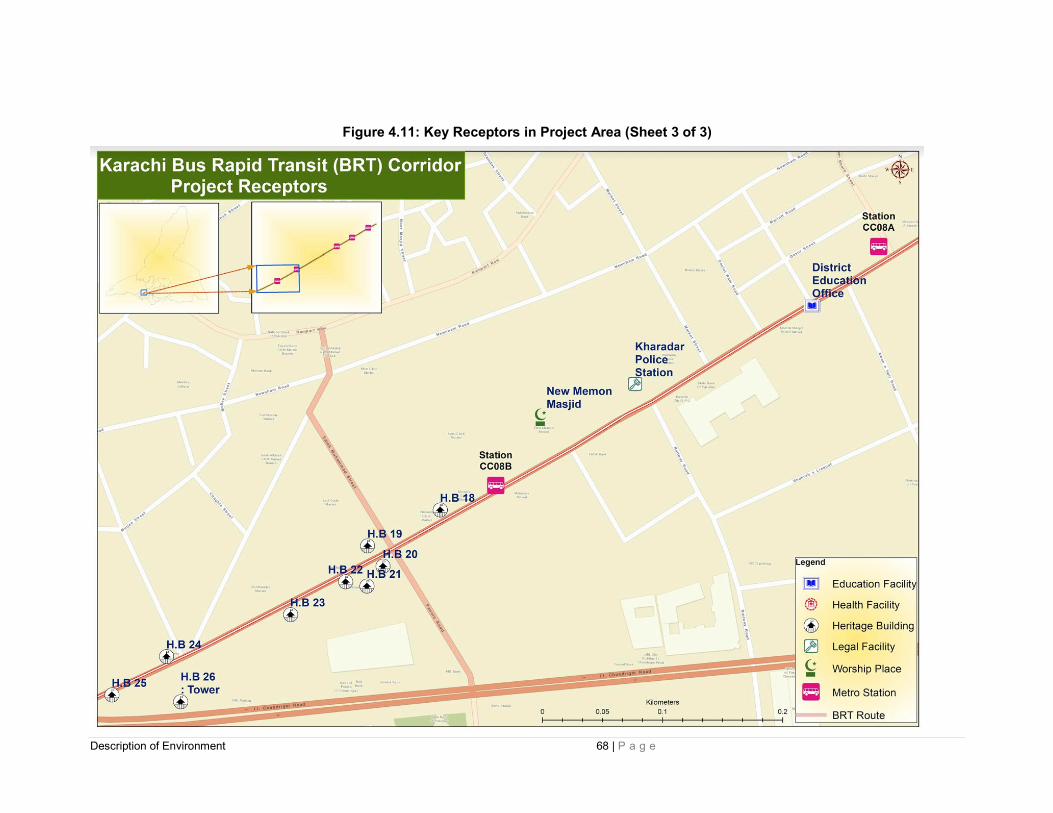
Description of Environment 68 | P a g e
Figure 4.11: Key Receptors in Project Area (Sheet 3 of 3)

Description of Environment 69 | P a g e
Figure 4.12: Land Use in Project Area (Sheet 1 of 3)

Description of Environment 70 | P a g e
Figure 4.13: Land Use in Project Area (Sheet 2 of 3)

Description of Environment 71 | P a g e
Figure 4.14: Land Use in Project Area (Sheet 3 of 3)

Description of Environment 72 | P a g e
4.6 Ambient Monitoring of Air quality, Noise and Vibration Levels
163. The EPA certified and well-reputed laboratory, SUPARCO, was engaged to conduct
ambient monitoring for air quality, noise and vibration levels at three locations along
the proposed project common corridor.
The locations selected for the monitoring activity are shown on the maps as Figures
4.9 to 4.11 below.
164. These three locations have been strategically selected keeping in view their high
level of sensitivity since the ‘Location 1’ is opposite the Services hospital while the
‘Location 2’ lies opposite a national heritage building (Denso Hall). The ‘Location 3’
was selected since it is situated between a cluster of historic buildings. Furthermore,
these three locations are spread across the 2.4 km common corridor and thus are
considered to be representative of the ambient air quality, noise and vibration levels in
the project corridor.
4.7 Vibration
165. The vibration levels have been monitored at three representative locations along the
project corridor. Vibration measurements were conducted using Extech model 407860
Vibration meter. A metal plate of 5 by 5 cm size was glued to the sidewalk and then
the accelerometer was attached to the metal plate using its magnetic base.
Measurements were conducted at 30 sec intervals for a total of 15 minutes at each
site and then the measured values were averaged. The Table 4.1 below presents the
measured vibration levels at each site. The measured vibration levels are typical of
next to a busy city street.
Table 4.1: Ambient Vibration Monitoring Results (24 hrs) at three locations along
Project Corridor on M.A. Jinnah Road
Monitoring Location Vibration Reading Results
(Average) PPV, mm/s
M.A Jinnah Road- Jama Cloth 1.85
M.A Jinnah Road- Denso Hall 1.89
M.A Jinnah Road- Near Memon Masjid 1.54
Source: SUPARCO Monitoring Report, May 2019
4.8 Noise
166. Ambient noise monitoring11 has been conducted at the following three locations along
the proposed Common project corridor of M.A. Jinnah road:
11 SUPARCO Laboratory, March 2019.

Description of Environment 73 | P a g e
Location 1: Opposite Services Hospital (near Jama Cloth)
Location 2: Denso Hall
Location 3: Near Memon Masjid (Mosque)
The results of this monitoring activity are provided in Table 4.2 below. Since the
project corridor is extremely diverse in terms of containing commercial
establishments, residential areas, public offices, hospitals, historical landmarks, thus
the regulations for noise for residential areas, commercial areas and silence zones
are all applicable. The baseline noise levels provided in the table below are quite high
at all three locations with the applicable regulations being exceeded.
167. Since the ambient noise levels have been observed to be exceeding the permissible
levels, thus it will need to be ensured as part of the mitigation measures that during
the construction works, at no time shall the noise levels be permitted to exceed 3 dB
from the ambient noise levels.
Table 4.2: Ambient Noise Monitoring Results (24 hrs) at three locations along Project
Corridor on M.A. Jinnah Road
Monitoring Location Parameter Noise Reading Results
Day Time Readings (0600 to 2200)
M.A Jinnah Road- Jama Cloth
dB(A) Leq*
85.6
M.A Jinnah Road- Denso Hall 84.7
M.A Jinnah Road- Near Memon Masjid 84.4
Night Time Readings (2200 to 0600)
M.A Jinnah Road- Jama Cloth
dB(A) Leq*
75.0
M.A Jinnah Road- Denso Hall 81.5
M.A Jinnah Road- Near Memon Masjid 79.8
Source: SUPARCO Monitoring Report, March 2019
*dB(A) Leq: Time weighted average level of sound in decibel on scale which is relatable to human hearing
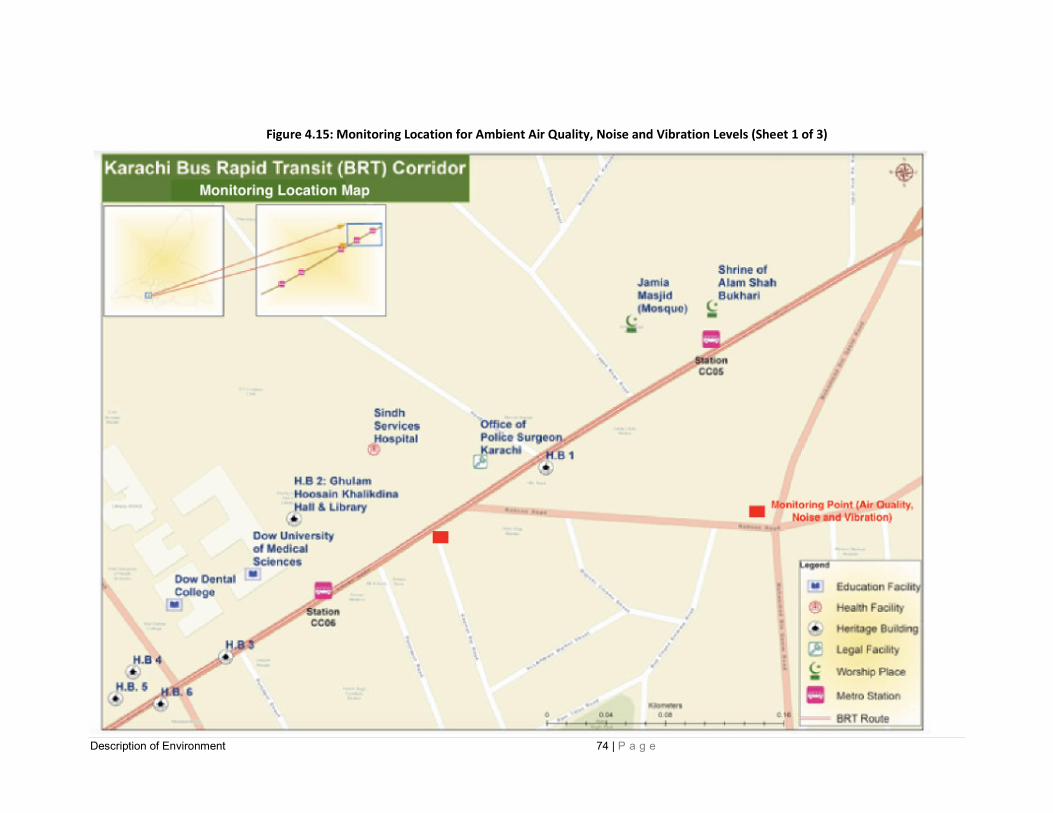
Description of Environment 74 | P a g e
Figure 4.15: Monitoring Location for Ambient Air Quality, Noise and Vibration Levels (Sheet 1 of 3)

Description of Environment 75 | P a g e
Figure 4.16: Monitoring Location for Ambient Air Quality, Noise and Vibration Levels (Sheet 2 of 3)

Description of Environment 76 | P a g e
Figure 4.17: Monitoring Location for Ambient Air Quality, Noise and Vibration Levels (Sheet 3 of 3)

Description of Environment 77 | P a g e
4.9 Air Quality
168. The major sources of air pollution in Karachi include motor vehicles, uncontrolled
burning of waste, increase in industries, different small scale businesses using
different dirty fuels etc.
169. Vehicle-generated air pollution is severe, with high concentrations of fine and
ultrafine particles in the air, which can cause respiratory problems among a large
number of Karachi’s urban residents. The number of diesel trucks and buses has
increased. International experience indicates that a major share of the emission load
from motor vehicles can be attributed to smoky diesel and two-stroke vehicles.
170. The main air pollutants in Karachi City are nitrogen oxides (NOx) sulphur dioxide
(SO2), particulate matter (PM10, PM with diameter of 10 microns or smaller and PM2.5,
i.e. PM 2.5 microns or smaller) and carbon monoxide (CO). Motor vehicles are the
major source of PM pollution. Most of the PM pollution (>80%) comes from diesel-run
vehicles.
171. Detailed 24 hourly ambient air quality monitoring at three different locations along the
proposed common corridor has been conducted and the results of this monitoring are
provided as Table 4.3 below. Furthermore, a comparison of these monitoring results
with the applicable air quality guidelines is also presented in Table 4.4 below. As can
be observed, SO2, PM2.5 and PM10 are already exceeding the permissible limits, which
indicates that the airshed is already quite degraded. Thus, all possible efforts will need
to be made during the construction phase through adoption of best practices to
minimize any further worsening of the pollutant concentrations in the airshed of the
project area.

Description of Environment 78 | P a g e
Table 4.3: Ambient Air Quality Monitoring Results (24 hrs) at three locations along Project Corridor on M.A. Jinnah Road
Monitoring Location Parameter
NO
(ug/m3)
NO2
(ug/m3)
CO
(ug/m3)
SO2
(ug/m3)
O3
(ug/m3)
PM2.5
(ug/m3)
PM10
(ug/m3)
SPM
(ug/m3)
M.A Jinnah Road-
Jama Cloth
Min 2.2 39.2 3.7 29.1 1.3
49.7
115.8
324
Max 78.0 92.5 16.9 33.7 14.5
Average 30.8 59.4 8.8 31.0 6.4
M.A Jinnah Road-
Denso Hall
Min 8.5 44.6 3.4 26.2 7.7
73.5
142.5
356.4
Max 127.7 92.2 6.7 39.2 21.2
Average 60.2 64.1 4.6 30.2 12.6
M.A Jinnah Road-
Near Memon Masjid
Min 7.2 37.6 0.4 21.5 5.8
57.6 85.3 357.5 Max 106.7 81.9 8.8 41.8 17.9
Average 54.9 55.0 2.9 30.6 11.8
Source: SUPARCO Monitoring Report, March 2019

Description of Environment 79 | P a g e
Table 4.4: Comparison of ambient air quality results versus applicable Air Quality standards
Monitoring Location Parameter
NO
(ug/m3)
NO2
(ug/m3)
CO
(ug/m3)
SO2
(ug/m3)
O3
(ug/m3)
PM2.5
(ug/m3)
PM10
(ug/m3)
SPM
(ug/m3)
Applicable Guideline
(ug/m3) for 24 hrs - 80 - 20 - 25 50 500
M.A Jinnah Road-
Jama Cloth
Min 2.2 39.2 3.7 29.1 1.3
49.7
115.8
324
Max 78.0 92.5 16.9 33.7 14.5
Average 30.8 59.4 8.8 31.0 6.4
M.A Jinnah Road-
Denso Hall
Min 8.5 44.6 3.4 26.2 7.7
73.5
142.5
356.4
Max 127.7 92.2 6.7 39.2 21.2
Average 60.2 64.1 4.6 30.2 12.6
M.A Jinnah Road-
Near Memon Masjid
Min 7.2 37.6 0.4 21.5 5.8
57.6 85.3 357.5 Max 106.7 81.9 8.8 41.8 17.9
Average 54.9 55.0 2.9 30.6 11.8
‘Exceeding’ applicable guidelines for acceptable pollutant levels
‘Within’ applicable guidelines for acceptable pollutant levels

Description of Environment 80 | P a g e
4.10 Climate Vulnerability of Project
172. Flash flooding is quite common in Karachi city. Pakistan’s regional flooding in 2010
left one-fifth of the country’s land area submerged. Flooding of Karachi on 1 Sept
2017 left 16 dead. These and other similar events seem not to be addressed in a
statistical fashion in the literature, though causative factors are mentioned including
blocking of drainage channels through land encroachment by both wealthy and poor
inhabitants.
173. Karachi city has an arid climate with low rainfall which is highly variable, with
torrential rain taking place from time to time and bringing with it heavy rainfall within a
short duration, leading to an intensification of the surface runoff. This is because the
rate of water percolation into soil is lower than the amount of rain water falling on the
surface. Heavy showers take place in the city either due to the effects of tropical
storms usually in June, which rarely affect coastal areas but bring heavy showers for
short periods and cause flooding.
174. The heavy monsoon rain mostly occurs in July and August and is the main cause of
flooding in the city. However, its re-ccurrence is estimated to occur at about 3 to 5-
year intervals. Flood affected areas of the city and areas susceptible to flooding
include the old city areas such as Kharadar, Mithadar, Bunder Road, Ram-swami and
Arambagh.12
12 Mott Macdonald Pakistan, (2018), EIA study for Karachi BRT – Red Line