R. H. Weber, Sr. P.E. The Aerospace Corporation (310) 336-5715

ENVIRONMENTAL CORPORATION
Source Sampling for Particulate Emissions
H&B Batch-Mix Baghouse 1 Permit No. 1192-006
FRED WEBER, INC. PEVELY, MISSOURI
August 19, 1993
red Weber, Inc.
Vice ~&ident RAMCON Environmental Corporation
RAMCON BUILDING, 6707 FLETCHER CREEK COVE, MEMPHIS, TENNESSEE 38133 TELEPHONE 800/458-4567 IN TENNESSEE 901/387-0500 FAX 901/387-0400

I Fred Weber, tnc. RL C ~ \ ~ E D vg!!!!/ii COMPLETE CONSTRUCTION SERVICES
a*
Mr. Randy Raymond Chief, New Source Review Missouri Department of Natural Resources Air Pollution Control Program P.O. Box 176 Jefferson City, MO 65 102
RE: Permit # 1 192-006 Facility I.D. #.III
Dear Mr. Raymond,
We received your letter dated November 9, 1992 for our Permit to Construct. Per your instructions, a Bag House was installed on our plant. We have not operated the plant at full production because the business demand has not been that great.
Therefore, we respecthlly request permission to extend the performance test until the start of our 1993 season, which we anticipate to start April 1, 1993. The plant will be shut down during the winter of 1992 and 1993.
Your approval will be appreciated
Sincerely,
FRED WEBER, INC. Materials Division
David L. Poe Vice President, Asphalt Operations
2320 CREVE COEUR MILL ROAD, P.O. BOX 2501, MARYLAND HEIGHTS. MISSOURI 63043-8501

JOHN ASHCROFT Governor
RON KUCERA Acting Director
STATE OF MlSSOUFU DEPARTMENT OF NATURAL RESOURCES
DMSION OF ENVIRONMENTAL QUALITY P.O. Box 176 Jefferson City, MO 65 102
December 16. 1992
Mr. David Poe Fred Weber, Inc./~aterials Div. 2320 Creve Coeur Mill Road P.O. Box 2501 Maryland Heights, MO 63043
Dear Mr. Poe:
In answer to your request to delay emission testing of the asphalt plant constructed under authority of Permit #1192-006, due to the seasonal nature of the business we will allow the required testing to be delayed until the start-up of production in the spring of 1993.
Please arrange a test date with Mr. Doug Elley (314-751-4817) of this program no later than April 1, 1993.
Sincerely,
AIR POLLUTION CONTROL PROGRAM
&3* Steve Feeler Compliance Unit Chief

Source Sampling Observation Reporr Sheet (Particulates)
company E~~ WS~SIZ . Wc. Ref. No. Source 1.D. &. DNR /&PC/ '&w;t a// 92-00 G Person in Charge of Test 7 0 ~ ~ Y &OOG
Obsetver a o o t r ELL OY Run Number Obselved
Date $#G 8. 199 3 Time Test Observed
THlS REPORT SHEET IS AN EVALUATION OF SAMPLING PROCEDURES CONDUCTED AT THE ABOVE MENTIONED SITE. THlS EVALUATION COVERS ONLY GENERAL ITEMS OBVIOUS TO THE OBSERVER. THlS DOES NOT IN ANY WAY IMPLY THATALL TEST PROCEDURES ARE ACCURATE, EVEN THOUGH THE FIELD PROCEDURE MAYBE ACCEPTABLE, THIS REPORTAPPLIES ONLY TO THE TESTS ACTUALLY OBSERVED.
PRELIMINARY DETERMINATIONS
Sampling Location bK - Number of sample points 30 - Velocity traverse - Method of moisture
determination
SAMPLING TRAIN ',
Basic Probe Design N o d e Condition OKL
Pitot Condition Filter - Correct amount H,O and
Silica Gel in impingers - TRAIN BREAK-DOWN
Leak Check: Pretest (Specify ) OK - Posttest (Speci3/ ) fii/ecl
Probe tip orientation Filter heated to minimum
bk
temperature OiL, Time sampled each point z mih. Accurately monitored train .
temperatures Ih*' Initial readings
Probe moved so as not to lose material rub -
Probe washed and brushed - Acceptable container to
store washinas Y- - Reagent grade acetone used - Blank of solutions taken - Train re-set acce~tablv
- Readings recorded if shut CAL18RA TION DATA
down Final readings recorded
alc - Proper calibration data
Gas analysis (speciq ) - available on site b PROCESS INFORMATION
A m l~tneaLclRe Engineer Present (Name: Pretest Aqreement/Protocol
1 -
observer K Copy to Obsetver; original to Team Leader (to be submitted with Test Report)

* Fred Weber, -..'...- Inc. -,-
COMPLETE CONSTRUCTlON SERVlCES (314) 344-0070
Vice President
- CERTIFIED MAIL
July 7, 1993
Mr. Doug Elley Missouri Department of Natural Resources Division of Environmental Quality P. 0. Box 176 Jefferson City, MO 65 102
RE: Fred Weber, Inc. Trautman Plant Particulate Emission Test C3 C:
Dear Mr. Elley,
Please find enclosed two copies of the Particulate Emissions Test of the Fred Weber, Inc. Trautman Asphalt Plant performed on June 9, 1993. The test results indicate the average grain loading exceeds the standards set by the State of Missouri. The results state hrther that the opacity test did not meet requirements, but review of the permit to construct shows the facility to be well under the maximum percent opacity allowed.
We shall make a thorough examination of the baghouse including black light testing and all related air pollution control components. Since the results indicate our facility to be slightly over the compliance level, we would like to schedule another stack test at your earliest convenience.
Please call me when you have reviewed the report to discuss the matter hrther.
Sincerely, FRED WEBER, INC. Materials Division
David L. Poe Vice President Asphalt Operations
enclosures
2320 CREVE COEUR MILL ROAD. P.O. BOX 2501, MARYLAND HEIGHTS, MISSOURI 63043-8501

F i Weber. hc. 7 1 1 COMPLETE CONSTRUCTION SERVICES (31 4) 344-0070
September 2,1993
Mr. Peter Yronwode Air Pollution Control Program Missouri Department of Natural Resources Division of Environmental Quality 205 Jefferson Jefferson City, Missouri 65102
Dear Mr. Yronwode:
Enclosed please find two copies of the report on the particulate emissions test conducted by RAMCON ~nvironmental Corporation on August 19, 1993 at Fred Weber, 1nc.I~ Trautman Asphalt Plant.
If you have any questions regarding this matter please contact me at (314) 344-0070.
Sincerely,
FRED WEBER, INC. Materials Division *(* Do glas K. Weible
r ~nvironmental Engineer
dkw
2320 CREVE COEUR MILL ROAD. P 0 . BOX 2501. MARYLAND HEIGHTS. MISSOURI 63043-8501

STATE OF MISSOCRI
DEPARTMENT OF NATURAL RESOURCES JIEIcTORANDUhl
DATE: September 13, 1993
TO: Jefferson County File, SLRO
FROM: Peter Yronwode f / SUBJECT : Fred Weber, Inc. asphalt plant test
Permit # 1192-006
RAMCON tested this facility on June 9, 1993 near Peveley. Doug Elley observed serious deviations from correct test procedures, and emissions exceeded NSPS limits. After modifications to the fan and baghouse repairs, the source was retested on August 19. Emissions measured at the second test averaged 0.0121 grlDSCF and opacity was reported to be less than 5%. The plant was found at the time of the test to be in compliance with permit # 1192-006 and Federal NSPS standards of 0.040 grlDSCF and 20% opacity. Production rate averaged 150 tons /hour. The maximum production rate permitted at this facility shall be within 10% of 150 Tlhr. Baghouse pressure drop during the test averaged 2 inches of water. No more than 90,000 tons of asphalt may be produced at this facility during any calendar year,
STATE OF .MISSOURI 1.. I i: l . i l l . i l i l l ' t C.', , I I).,! \<I \ ' 111111 I)ll~.,li 1
DEPARTMENT OF NATURAL. RESOURCES
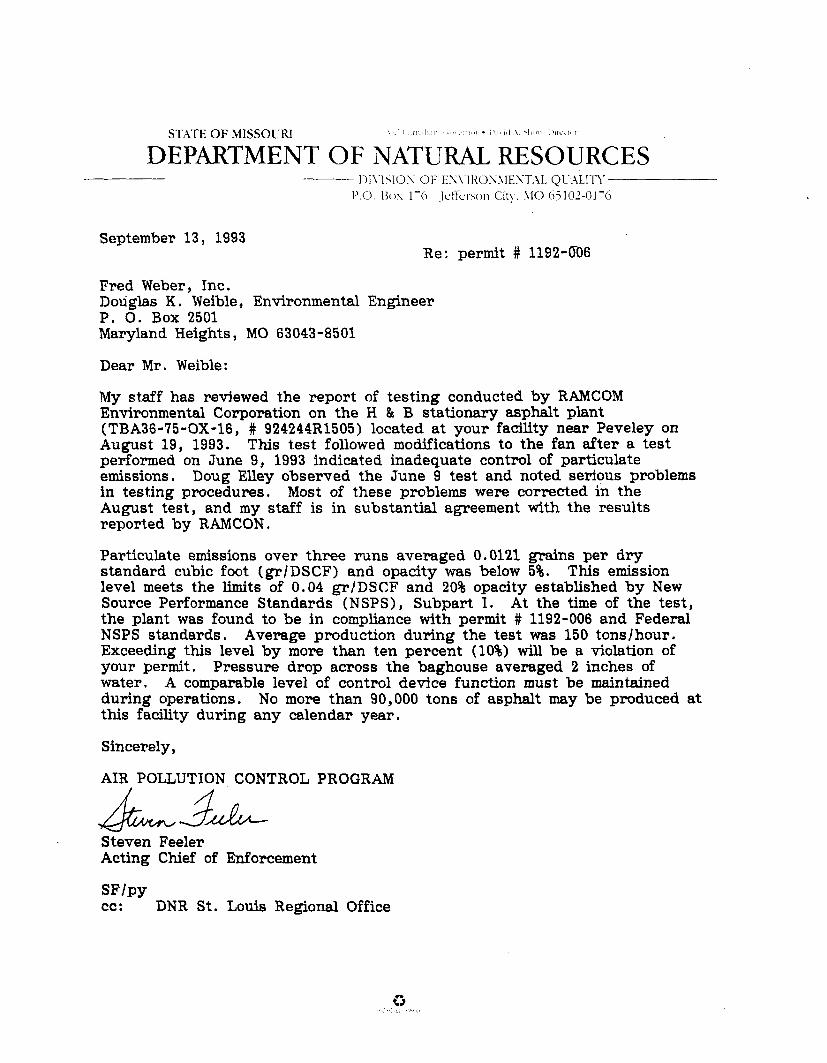
September 13, 1993 Re: permit # 1192-DO6
Fred Weber, Inc. Dotiglas K . Weible , Environmental Engineer P. 0. Box 2501 Maryland Heights, MO 63043-8501
Dear M r . Weible:
My staff has reviewed the report of testing conducted by RAMCOM Environmental Corporation on the H & B stationary asphalt plant (TBA36-75-OX-16, # 924244R1505) located at your facility near Peveley on August 19, 1993. This test followed modifications to the fan after a test performed on June 9, 1993 indicated inadequate control of particulate emissions. Doug Elley observed the June 9 test and noted serious problems in testing procedures. Most of these problems were corrected in the August test, and my staff is in substantial agreement with the results reported by RAMCON.
Particulate emissions over three runs averaged 0.0121 grains per dry standard cubic foot (grlDSCF) and opacity was below 5%. This emission level meets the limits of 0.04 gr/DSCF and 20% opacity established by New Source Performance Standards (NSPS) , Subpart I. At the time of the test, the plant was found to be in compliance with permit # 1192-006 and Federal NSPS standards. Average production during the test was 150 tonslhour. Exceeding this level by more than ten percent (10%) will be a violation of your permit. Pressure drop across the baghouse averaged 2 inches of water. A comparable level of control device function must be maintained during operations. No more than 90,000 tons of asphalt may be produced at this facility during any calendar year.
Sincerely,
AIR POUUTION CONTROL PROGRAM
Steven Feeler Acting Chief of Enforcement
SF~PY cc: DNR St. Louis Regional Office
ENVIRONMENTAL CORPORATION
August 26, 1993
Mr. Doug Weible Fred Weber, Inc. 2320 Creve Couer Mi l l Road Maryland Heights, Missouri 63043
RE: Particulate Emissions Test: August 19, 1993
Dear Mr. Weible:
Enclosed you wi l l find four (4) copies of our report on the particulate emissions test we conducted pursuant to permit no. 1192-006 at your asphalt plant located in Pevely, Missouri. Based on our test results, the average grain loading of the three test runs do pass both the EPA New Source Performance Standards and those set by the State of Missouri. Therefore, the plant i s operating in compliance with both Federal and State standards.
You wil l want to sign the report covers and send two copies to:
Mr. Peter Ironwood Air Pollution Control Program Missouri Department of Natural Resources Division of Environmental Quality 205 Jefferson Jefferson City, Missouri 65 102
You wi l l need to keep one copy of the report at the plant.
We certainly have enjoyed working with you. Please let us know if we can be of further assistance.
Sincerely,
~ i l l i h h Joseph Sewell, II Vice President
WJSi i:wpc Enclosures
RAMCON BUILDING, 6707 FLETCHER CREEK COVE, MEMPHIS, TENNESSEE 38133 TELEPHONE 800/458-4567 IN TENNESSEE 9011387-0500 FAX 901/387-0400

TABLE OF CONTENTS
SECTION A: 1. INTRODUCTION
2. TEST RESULTS 3. TEST PROCEDURES
SECTION B: THE SOURCE
SECTION C: EQUIPMENT USED
SECTION D: LABORATORY PROCEDURES AND RESULTS
SECTION E: CALCULATIONS
SECTION F: FIELD DATA
SECTION C: CALIBRATIONS
SECTION H: RAMCON PERSONNEL
SECTION I: VISIBLE EMISSIONS

SECTION A:
1. INTRODUCTION 2. TEST RESULTS
3. TEST PROCEDURES
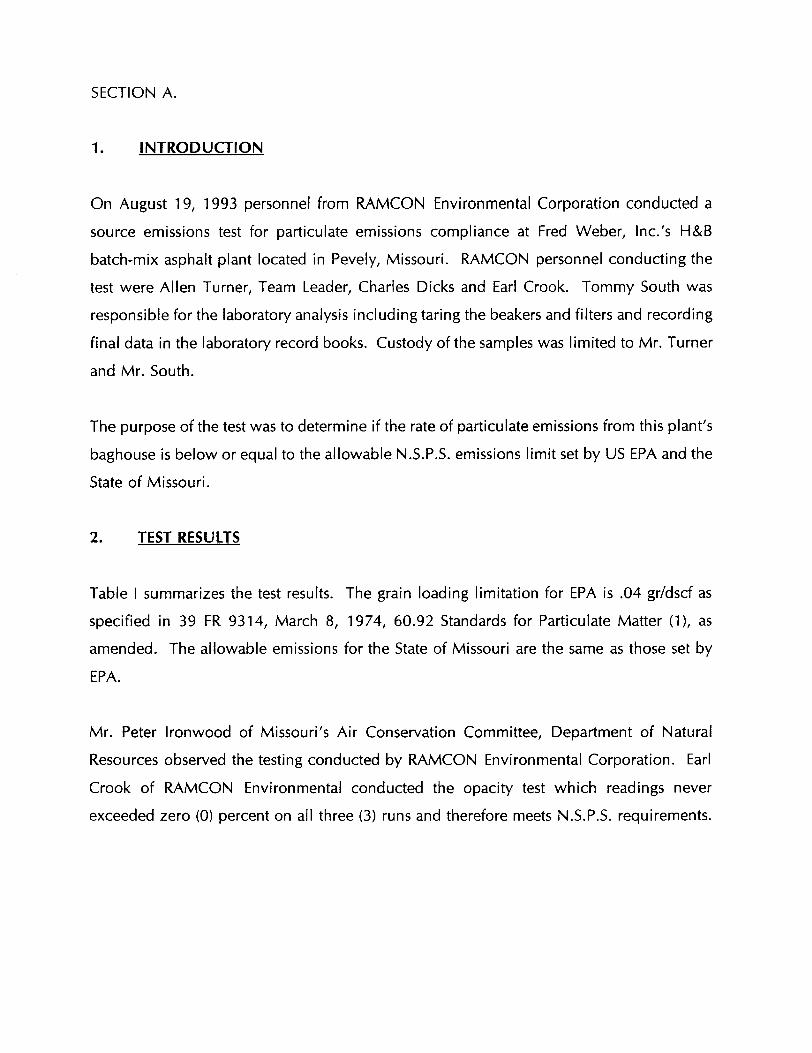
SECTION A.
1. INTRODUCTION
On August 19, 1993 personnel from RAMCON Environmental Corporation conducted a
source emissions test for particulate emissions compliance at Fred Weber, Inc.'s H&B
batch-mix asphalt plant located in Pevely, Missouri. RAMCON personnel conducting the
test were Allen Turner, Team Leader, Charles Dicks and Earl Crook. Tommy South was
responsible for the laboratory analysis including taring the beakers and filters and recording
final data in the laboratory record books. Custody of the samples was limited to Mr. Turner
and Mr. South.
The purpose of the test was to determine if the rate of particulate emissions from this plant's
baghouse is below or equal to the allowable N.S.P.S. emissions limit set by US EPA and the
State of Missouri.
2. TEST RESULTS
Table I summarizes the test results. The grain loading limitation for EPA is .04 gr/dscf as
specified in 39 FR 9314, March 8, 1974, 60.92 Standards for Particulate Matter ( I ) , as
amended. The allowable emissions for the State of Missouri are the same as those set by
EPA.
Mr. Peter Ironwood of Missouri's Air Conservation Committee, Department of Natural
Resources observed the testing conducted by RAMCON Environmental Corporation. Earl
Crook of RAMCON Environmental conducted the opacity test which readings never
exceeded zero (0) percent on all three (3) runs and therefore meets N.S.P.S. requirements.

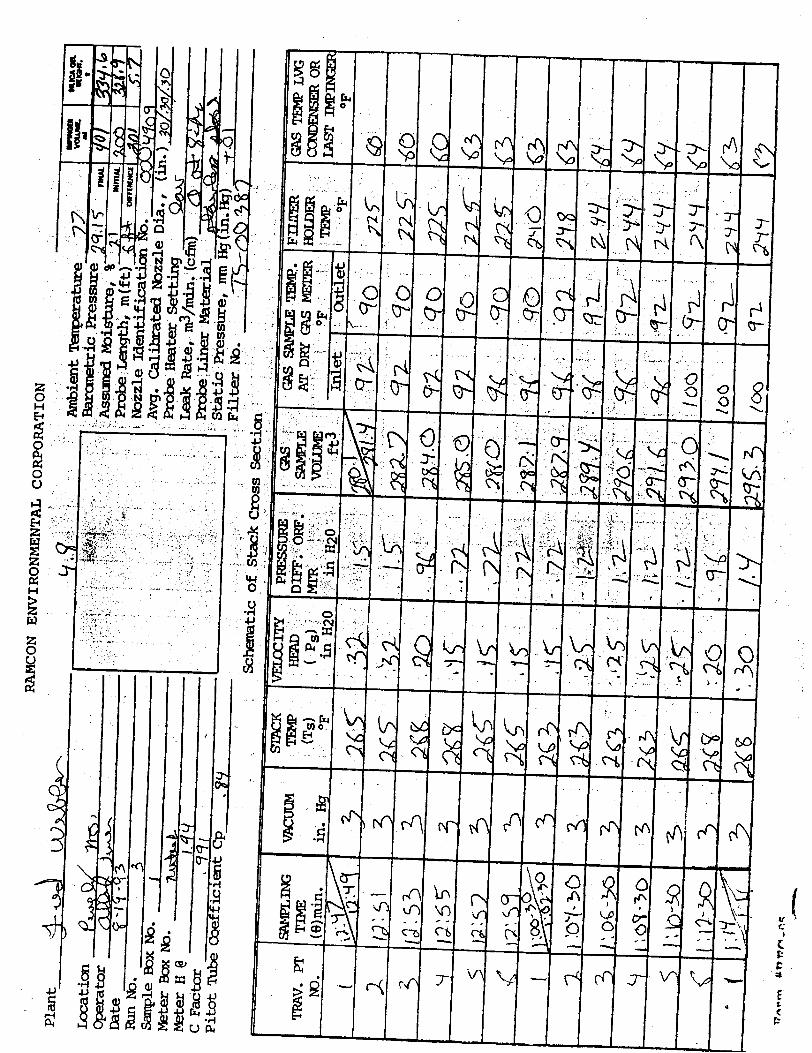
NUMBER OF POINTS PIME ( m i n u t e s /point ) :,EAK KATE ( f t 3 j m i n ) :TACK DIAMETER [ i n ) BAR PRESS [ l n H 9 ) STATTC PRESS ( i n 1120) PARTIC COLLECTED (mg) IHPINGEH H 2 0 (ml) F,ITbICA GEL H20 ( 4 )
POTNT NIJMBER
STACK TEMP ( T s ) 265 265 768 268 .?S5 7 h5 - r 7 i-bd
L ~ J
" 51
363 , ?
'5 r>J
268 2 6s 27 3 37 '3 ?7 ; L 1'4
y7.4 265 268 36a 2 F>7 269 269 2 58 268 268 2 68 2 68 ? 68
VELOCITY PRESS
( ~ P s ) 0 . 3 2 0 . 3 2 0.20 0 . 1 5 0 .15 0. Ic, G.11; '3.25 C = ? 5
r ZCJ 3.25 3 30 9 . 3 0 0 .25 3 . ;! 5 0 .15 L .>a n. 73 C\ ., . 2 0 0 .20 0 . 3 0 0 . 4 4 0.47 0 . 4 0 0 . 3 0 0 . 3 0 0 . 2 0 0 . 2 0 9 . 4 5 0 . 4 5
O R I F I C E PRESS
( dN) 1 . 5 0 1 . 5 0 0 . 9 6 0 . 7 2 0 . .! 2 i; . 7 ? n 71 -4. r . 1 . 2 0
- 7 0 i . 2 0 1.20 g.qh
? - 4 0 1 .10 1.20 0 . 7 2 1.60 3.50 0 . 3 6 0 . 9 6 3 40 2 . 1 0 2 . 3 0 1 . 9 0 1 . 4 0 1 .40 C.96 9.96 2 . 2 b 2.70
AVS 2 6 7 . 8 0 .287 1.372
STACK GAS NOL WEIGHT, WET STACK VELOCITY ( f t / s e c ) STAND VOL SAMPLED ( s t d f t 3 ) I V t G rGAS METER TEMP (deg F) PFRC:ENT MOISTURE ( % I 3 ~ 3 STACK now RATE [DSCYM)
I SOKTNETTC VARIATION ( % ) PARTT C . EMISSION RATE j 1 b/hr ) PKK?'1 CULATE CONC ( ~ ~ ~ D S C F ) PARTIC CONC @ 7% 02 (gr/DSCT'j FUEL F FACTOR DRY (Fd) IQUNIJS PER MILLION BTU
1. . . % . ! . I L... :: :a :-~L'-L!. ~I-,p.'.d:.l- ,p~-dl l t
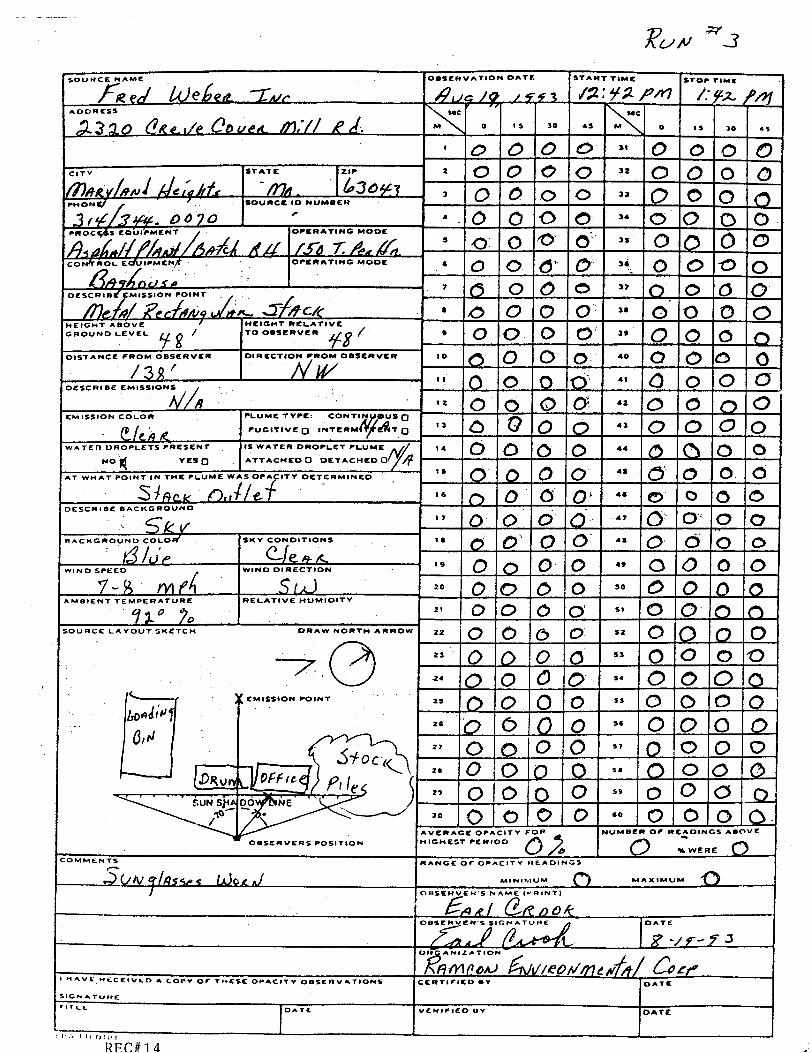
DATE: 2/13/33 RUN NO : 3
PERCENT OXYGEN PERCENT CARBON DIOXIDE PERCENT CARBON MONOXIDE PTTOT COEFFICIENT ( C p ) NOZZLE DIAMETER ( i n ) INITIAL METER VClL ( f t 3 ) FINAL METER VOL ( f t 3 ) METER CORR FACT (Ym)
METER TEMP INLET OUTLET
(?"mi) 92 9 0 92 9 0 92 90 9 2 9 0 9 b YO 36 90 96 '32 9 G 9 2 St G 2 9 6 n -b
JL.
100 3% i 0 0 92 100 92 200 9 2 1 0 0 3 2 100 92 100 9 3 I on 9 4 1 0 0 94 i 00 34 I 0 0 94 100 94 1 0 0 9 4 3 00 q4 ? 00 9 4 100 9 4 3 0 0 9 4 100 94 100 9 4 3 00 9 4
STACK VEL '
f t j s e c 39 .2 3 9 . 2 31.1 26 .9 2 G . 8 25 .8 26.8 3 4 . 6 3 4 . G 3 4 . 6 3 4 . 6 31.1 3 8 . 0 3 4 . 9 3 4 . 3 2 7 . 0 4 3 . 0 59.2 3 1 . 0 3 1 . 1 38.0 4 6 . 1 4 7 . 6 43 .9 3 8 . 0 3 8 . 0 3'1.1 31.1 4 6 . 6 i36.6
I I K M
'FACTOR" d ~ s j d ~
4 . 6 9 4 .69 4 .80 4 . 8 0 4 . 8 0 4 . 8 0 4 . 8 0 4 .80 4 . 8 0 4 . 8 0 4 .80 4 . 8 0 4 .67 4 . 8 0 4 . 8 0 4.80 4 .74 4 . 8 6 4 . 8 0 4 . 8 0 4 - 6 7 4.77 4 .89 4 . 7 5 4.67 4.67 4 . 8 0 4 . 8 0 4 . 8 9 4 . 8 9
mLOCITY PRESS SQRT
( dPs) - . 5 0 . 5 6 6 0 . 5 6 6 0 .447 0 . 3 8 7 0.387 0 .387 0 .387 0 .500 0 .500 0 .500 0 . 5 0 0 0 . 4 4 7 0 . 5 4 8 0 .500 3 . 5 0 0 0 . 3 8 7 0 .616 0 .849 0.447 0 .447 0 . 5 4 8 0.663 0 .686 0 .632 0 . 5 4 8 0 . 5 4 8 0.447 0.447 0 . 6 7 1 0 .671
AVG ABS STACK TEMP (deg R) 7 2 7 . 8 AVG ABS METER TEMP j deg R ) 5 5 5 . 3 METERLEAKAGERATE f f t 3 / m i n ) 0 . 0 0 0 SAMPLE VOL LEAK CORR'D ( f t 3 ) 3 8 . 9 5 AVG ARS STACK PRESS ( i n H g ) 29.1507 VOL I420 I N METER GAS (SCF) 9.73 H20 VAPOR I N GAS (vo l f r a c ) 0 .2134 NOZZLE AREA ( f t 2 ) 0 .00049 STACK AREA ( f t 2 ) 13 .303 STACK GAS MOL WEIGHT, DRY 29 .07

NAME: b'l-ed iveber A s p h a l t 3CATTON : ?&el ey , :.iO
r-t-r( . L ~ T UKST: H Sr 'd batch acp21al t p l a n t
TEST DATE: 8 / 3 4 / 9 3 RUN NO: 2
f:UMBER OF POINTS TIME ( n i n u t e s / p o i n t ) LEAK RATE ( f t 3 / m i n ) STACK DIAMETER ( i n ) BAR PRESS ( i n IIg) STATIC PRESS ( i n H 2 0 ) PARTIC COLIBECTED (q) IMPINGER H20 (ml> S l L I C A GEL H20 ( 4 )
POINT NUMBER
1 3 3
4 5 6 7 8 9
1.0 i 1 i 2 ; 3 14 : 5 1. G 17 i ii ' 9 2 0 2 1 2; ? 3 2 4 :? 5 2 6 2 .I 1: 8 33 30
STACK TEMP
( T s ) 27 0 270 27 1 27 2 2 6 8 2 6 8
263 263 260 263 263 2 64 265 2 65 265 2 68 265 q r ,- LC>:>
265 265 2-7 2 27;? 2 72 272 77'1 270 270 27 1 2'7'
VELOCITY PRESS ( d P s ) 3 . 2 5 0 . 2 5 0 . 2 5 0 . 3 0 0 . 5 6 0 .90 0 . 2 0 0 .20 0 .15 0 . 4 3 0 . 4 3 0.55 0 . 1 8 C . 1 5 0 .20 0.2C 0 . 3 5 0.55 0 . 1 5 0 . 1 5 i). 1 5 0 . 1 5 0 . 3 8 3 .25 9 . 2 5 0 .30 0 .25 0 . 1 5 0.15 9 .15
O R I F I C E PRESS
( dH) I .20 1 . 2 0 1 . 2 0 1 . 4 0 2 . 7 0 2 .90 0 . 9 6 0 . 9 6 0 .72 2 . 1 0 2 . 1 0 2 .60 0 . 8 6 0 .72 0 . 9 6 0 . 3 6 1 . 7 0 2.60 0 . 7 2 0 .72 0 .72 0 . 7 2 0 . 9 6 1 . 2 0 1 . 2 0 1 . 4 0 1 . 2 0 0 . 7 2 0 .72 0 .72
?ERCENT OXYGEN PERCENT CARBON DIOXIDE PERCENT CARBON MONOXIDE P I T O T COEFFICIENT (Q) NOZZIB DIAMETER ( i n ) I N I T I A L METER VOL ( f t 3 ) FINAL METER VOI, ( f t 3 ) 1-TER CORR FACT (Ym)
METER TEMP I N L E T OUTLET
( m i ) (m) 9 3 8 5 93 8 5 9 3 8 6 9 3 8 6 9 3 87 9 5 87 9 5 87 9 5 88 9 5 88 9 5 88 9 5 88 95 8 9 9 5 89 9 5 9 0 9 5 9 0 9 5 9 0 9 5 3 0 95 9 0 33 90 93 9 0 9 3 90 94 9 0 94 90 34 9 0 34 9 0 94 30 94 90 94 9 0 94 3 0 94 90
STACK VEL
f t /sec 34 .7 34 .7 3 4 . 8 3 8 . 1 5 i . 9 6 2 . 1 31 .0 30 .9 2 6 . 8 4 5 . 3 45 .4 51.3 29.4 2 5 . 8 31 .0 31 .0 4 1 . 1 51 .4 2 6 . 8 2 6 . 8 2 6 . 8 27 .0 3 9 . 5 3 4 . 3 =.4 .8 38 .2 34 .7 26 .9 3 6 . 9 26 .9
IIKII
"FACTOR" dPs/dH
4 . 8 0 4 . 8 0 4 . 8 0 5.67 4 .82 3 . 6 2 4 .80 4 . 8 0 4 .80 4 . 8 8 4 . 8 8 4 . 7 3 4 . 7 8 4 .80 4 . 8 0 4 . 8 0 4 . 8 6 4 . 7 3 4 . 8 0 4 . 8 0 4 . 8 0 4 . 8 0 4 . 7 8 4 .80 4 . 8 0 4 .67 1 . 6 0 4 . 8 0 4 . 8 0 4 .80
VELOCITY PRESS SQRT
j d ~ s ) ~ . 5 0 .500 0.500 0. SO0 0 . 5 4 8 0 .748 0.894 0 .447 3.447 0.387 0 .656 0 .656 0 .742 0.424 0.387 0.447 0.447 0.592 0 .742 0 .387 0 .387 0 .387 0.387 0 .424 0 .500 3.500 0 .548 0 .500 0.387 0.387 0.387
AVG 267 .6 0 .276 1 . 2 9 1 94 .17 8 8 . 7 7 35 .261 0 .435
STACK GAS MOL WEIGHT, WET STACK VELOCITY ( f t / s e c ) STAND VOL SAMPLED ( s t d f t 3 ) AVG GAS METER TEMP (deg F ) PERCENT MOISTURE ( % I STD STACK FLOW RATE (DSCFM)
I S S K I N E T I C VARIATION ( % > TARTIC. EMISSION RATE (I.b/hr) PARTICULATE CONC ( g r / D S C F ) PARTIC CONC @ 7% 02 ( g r / D S C F ) FUEL F FACTOR DRY ( F d ) POUNCS PER MILLION BTU
AVG ABS STACK TEMP (deg R ) AVG ABS METER TEMP (deg H ) METER LEAKAGE RATE ( f t 3 / m i n ) SAMPLE VOL LEAK CORR'D (ft3) AVG ABS STACK PRESS ( i n H g ) VOL H 2 0 I N METER GAS ( S C F ) H20 VAPOR I N GAS ( v o l frac) NOZZLE AREA ( f t 2 ) STACK AREA ( f t 2 ) STACK GAS MOL WEIGHT, DRY
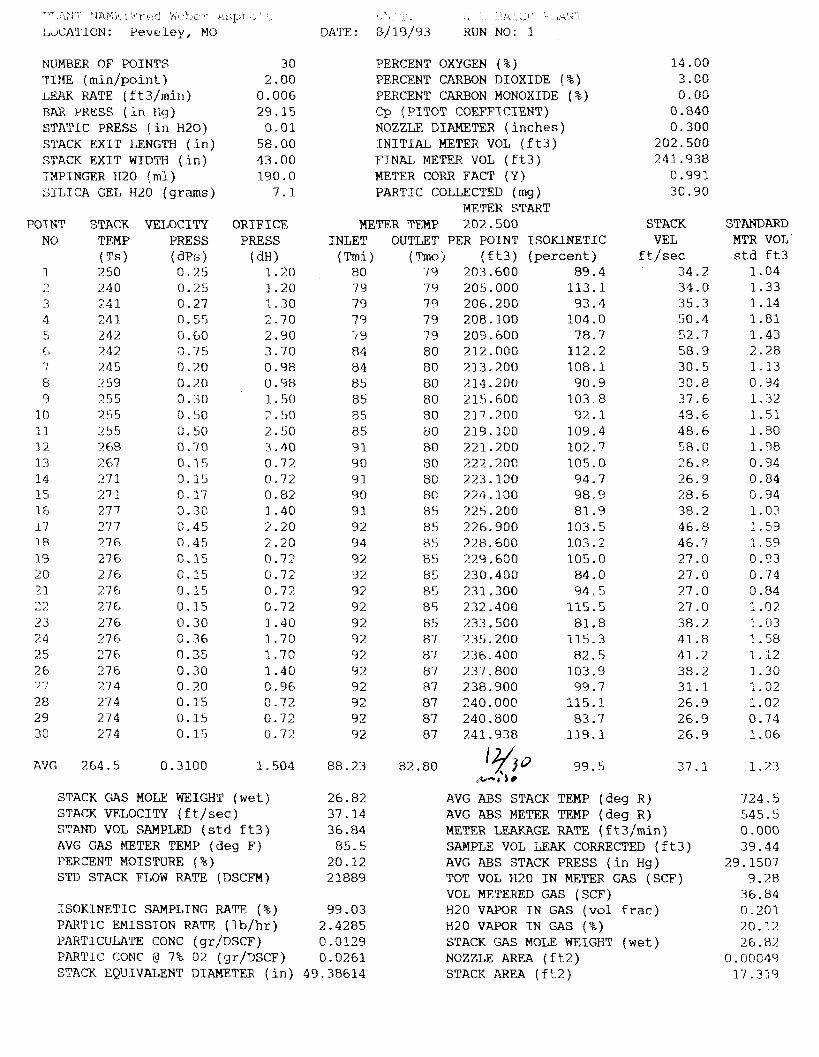
-'?,:;;; Y ;JT!Jl]~: : 133~-&>r] l v ~ i l , . l , ~ r. ;!.> & , b \ . . ,- , , . . - . .. . . .. ." L"".; :\ ' '.' ..., ;-,.l.<'l.
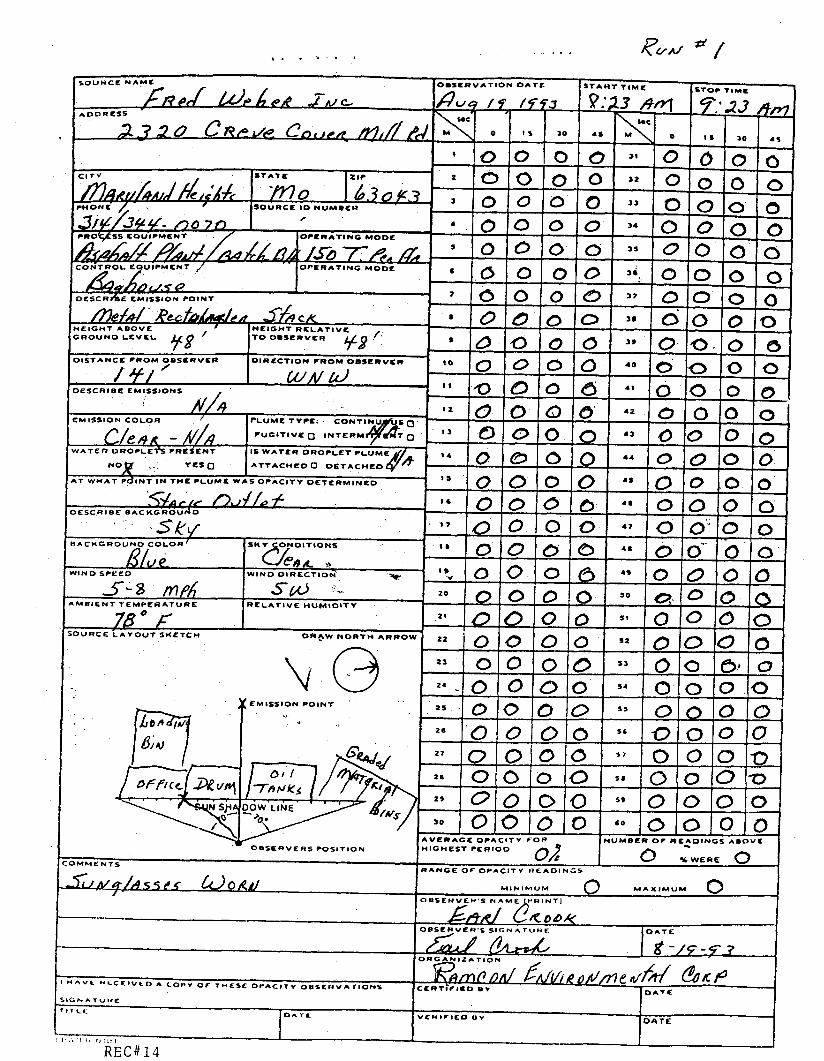
I,u~:AT:LON : Peve l e y , MO DATE : 8/19/93 RUN NO: 1
NUMBER OF P O I N T S 3 0 TINE ( m i n / p o i n t ) 2 .00 LEAK KATE ( f t3/rnin) 0.006 BAR PRESS ( i n Kg) 29.15 S T A T I C P R E S S ( i n H 2 0 ) 0 .01 STACK E X I T 1,ENGTH ( i n ) 58.00 STACK E X I T WIDTH ( i n ) 43.00 YMPTNGER H20 ( m l ) 190.0 S I L I C A GEL H20 (grams) 7 . 1
POTNT STACK VFXDCITY NO TEMP PRESS
( T s ( dPh) 1 250 0 . 2 5 ? 240 0.25 3 ;4 1 0.27 4 714 1 0 . sr> 5 242 0 .60 C> 242 3 .75 1 245 0.20 8 259 0 .20 9 255 3 .30
10 255 0 .SO 11 255 0.50 12 7 68 0 .70 13 2 67 0 . 1 5 14 2.1 1 3 .15 1 5 27 1 0.17 15 777 3 .30 1 I 277 0 .45 -I R 376 0 45 19 27 6 0 .15 Z 0 2 16 0 .15 11 77 5 0 .15 -> ? L - 276 0 .15 23 2.76 0 .30 3 4 77 f> 3 . 3 6 25 276 0 .35 26 276 0.30 77 774 0.20 2 8 27 4 0 .15 2 9 214 0.15 3 0 274 0 . 1 5
ATJG 264.5 0.3100
O R I F I C E PRESS
( d H ) 1 . 2 0 1 .20 1 .30 2 -70 2.90 3 .70 0 .98 0 . 9 8 3 .50 ? .50 2.50 7 . 4 0 0 .72 0.72 0.82 1 .40 2.20 2 .20 9.77 11.72 0.7? 0.72 1 .40 1 .70 1 . 7 0 1 .40 0.96 0.72. 0.72 0.72
STACK GAS MOLE WEIGHT ( w e t ) STACK VELOCITY ( f t / s e c ) STAND VOL SAMPLED ( s t d f t 3 ) AVG GAS METER TEMP (deg F) PERCENT MOISTURE ( %) STD STACK FLOW RATE (DSCFM)
I S O K I N E T I C SAMPI,ING RATE ( %) PARTIC EMISSION RATE ( l b / h r ) PARTICULATE CONC ( ~ ~ / D s c F ) PARTIC CONC 9 7% 02 ( g r / D s ~ F ) STACK EQUIVALENT DIAMETER ( i n )
PERCENT OXYGEN ( % j 14 .03 PERCENT CARBON DIOXIDE ( % ) 3.00 PERCENT CARBON MONOXIDE ( % ) 0 . OD C p ( P I T O T COEFFICIENT) 0.840 NOZZLE DIAMETER ( i n c h e s ) 0.300 I N I T I A L METER VOL ( f t 3 ) 202.500 F I N A L METER VOL ( f t 3 ) 241.938 METER CORR FACT ( Y ) 0.991 PARTIC COLLECTED (mg) 30.90
METER START METER TEMP 202.500 STACK
INLET OUTLET PER POINT I S O K I N E T I C VEL
(mi) (Mj ( f t 3 ) ( p e r c e n t ) f t / s e c 80 79 203.600 89.4 34.2 7 9 79 205.000 113.1 34.0 7 9 79 206.250 93.4 35.3 7 9 7'3 208.100 104.0 50.4 '1 53 '79 209.600 78.7 52.7 84 80 212.000 112.2 58 .9 84 80 213.200 108.1 30.5 8 5 80 214.200 9 0 . 9 30.8 8 5 80 215.600 103 .8 37 .6 8 5 30 217.200 9 2 . 1 4 8 . 6 85 30 219.100 109.4 4 8 . 6 9 1 80 221.200 103.7 58 .0 90 80 222.200 105 .0 2 6 . 8 9 1 80 223.100 94.7 26.9 9 0 80 224.100 98.9 28 .6 9 I 85 225.200 81 .9 38.2 9 2 85 226.900 103.5 4 6 . 8 94 85 228.600 303.2 46.7 9 2 8 5 229.600 105.0 27 . O '3 2 85 230.400 84.0 27.0 92 Br, ?11.300 94.5 27.0 92 85 232.400 115.5 27 . O 9 2 85 233.500 81 .8 38.2 92 87 735.200 115.3 41.8 92 87 236.400 8 2 . 5 41.2 92 87 237.800 103.9 38.2 92 87 238.900 99 .7 3 1 . 1 9 2 87 240.00C 115.1 26.9 92 87 240.800 83. '7 26.9 9 2 87 741.938 1'19.1 26.9
AVG ABS STACK TEMP (deg R ) AVG ABS METER 'IXMP ( deg R ) METER LEAKAGE RATE, ( f t 3 j m i n ) SAMPLE VOL LEAK CORRECTED ( f t 3 ) AVG A S S STACK PRESS ( i n H g ) TOT VOL H20 I N METER GAS ( S C F ) VOL METERED GAS ( S C F ) 820 VAPOR I N GAS (vol f r a c ) H20 VAPOR I N GAS ( % ) STACK GAS MOLE WEIGHT (wet) NOZZ,LE ARFA ( f t 2 ) STACK AREA ( f t 2 )
STANDARD MTR VOL s t d f t 3
1 .04 1 .33 1 .14 1.81 1 .43 2 .28 1 .13 0.34 1 .32 1 . 5 1 1 . 8 0 1 . 3 8 0.34 0 .84 3.94 1 . 0 3 l .59 1.59 0.93 0:74 0 .84 1 .02 1 .03 1 .58 1 .12 1 .30 I . 02 1 .02 0.74 1 .06

SUMMARY OF TEST RESULTS
TABLE I
August 19, 1993
On the basis of these test results, the average grain loading of the three test runs is below
the .04 gr/DSCF allowable emissions limitation set by EPA and the State of Missouri.
Therefore, the plant i s operating in compliance with State and Federal standards.
3. TEST PROCEDURES
(a) Method Used: Method 5 source sampling was conducted in accordance with
requirements of the U.S. Environmental Protection Agency as set forth in 39 FR 9314,
March 8, 1974, 60.93, as amended.
(b) Problems Encountered: No problems were encountered that affected testing.
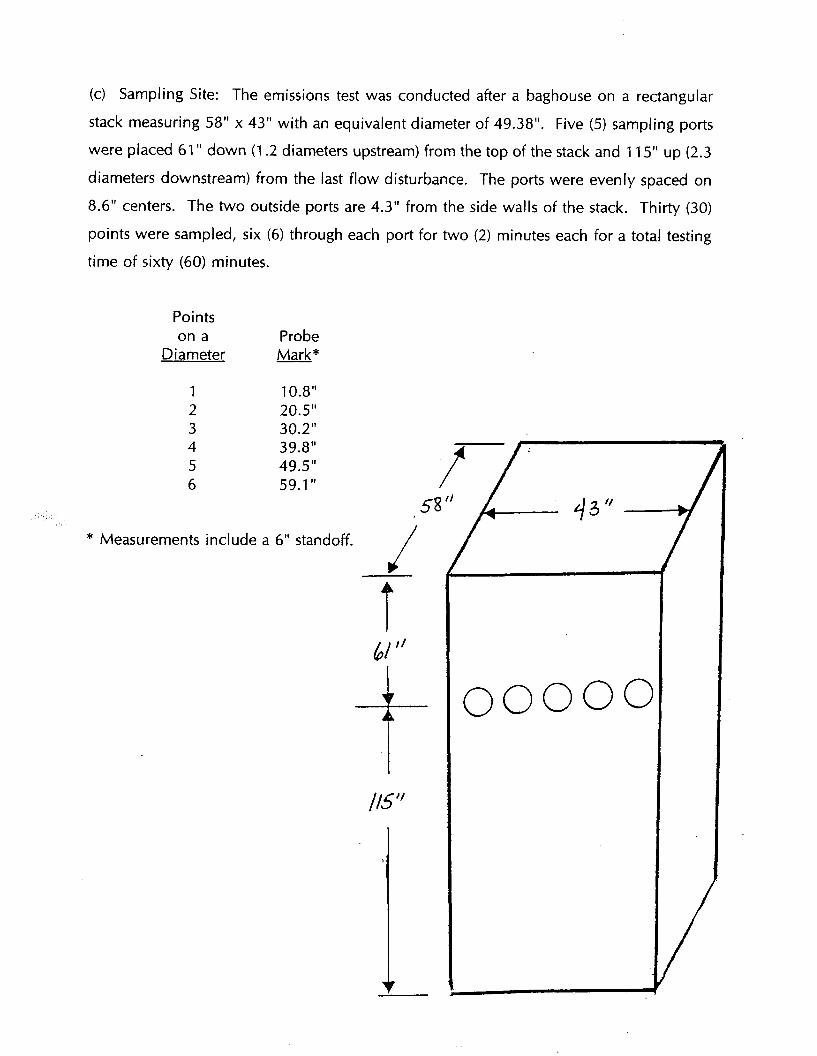
(c) Sampling Site: The emissions test was conducted after a baghouse on a rectangular
stack measuring 58" x 43" with an equivalent diameter of 49.38". Five (5) sampling ports
were placed 61 " down (1.2 diameters upstream) from the top of the stack and 1 15" up (2.3
diameters downstream) from the last flow disturbance. The ports were evenly spaced on
8.6" centers. The two outside ports are 4.3" from the side walls of the stack. Thirty (30)
points were sampled, six (6) through each port for two (2) minutes each for a total testing
time of sixty (60) minutes.
Points on a Probe
Diameter Mark*
* Measurements include a 6" standoff.

SECTION B:
THE SOURCE
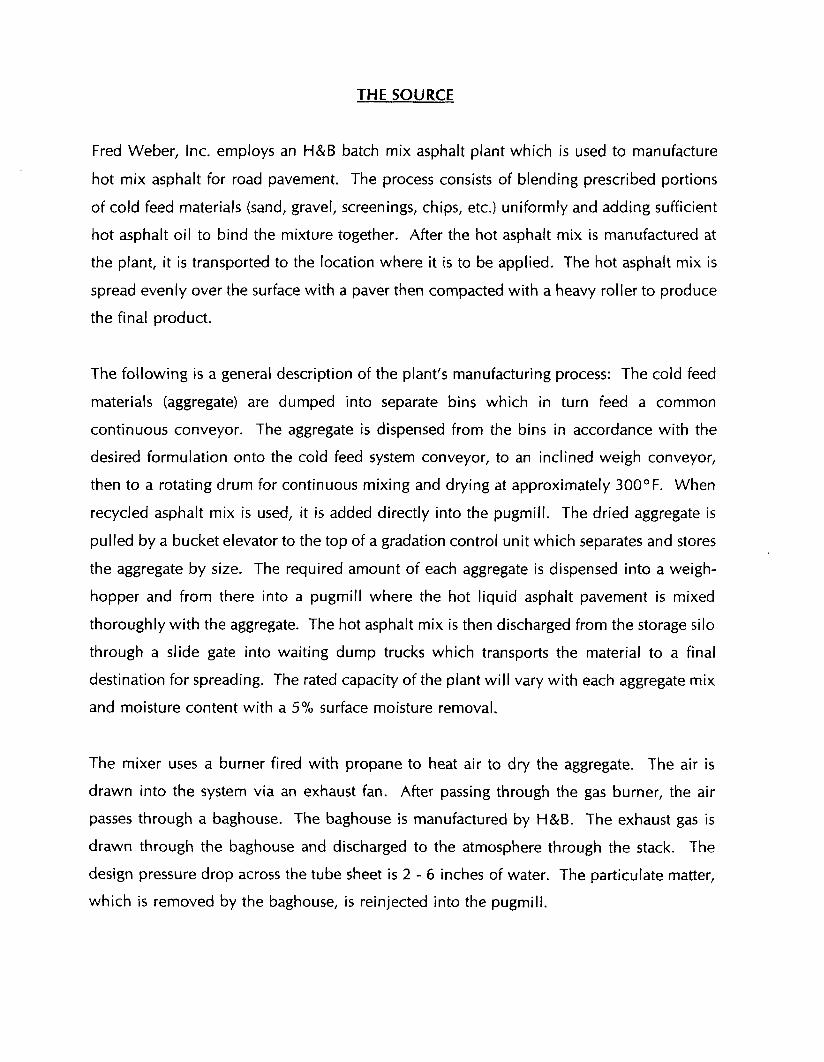
THE SOURCE
Fred Weber, Inc. employs an H&B batch mix asphalt plant which is used to manufacture
hot mix asphalt for road pavement. The process consists of blending prescribed portions
of cold feed materials (sand, gravel, screenings, chips, etc.) uniformly and adding sufficient
hot asphalt oil to bind the mixture together. After the hot asphalt mix is manufactured at
the plant, it i s transported to the location where it i s to be applied. The hot asphalt mix is
spread evenly over the surface with a paver then compacted with a heavy roller to produce
the final product.
The following is a general description of the plant's manufacturing process: The cold feed
materials (aggregate) are dumped into separate bins which in turn feed a common
continuous conveyor. The aggregate is dispensed from the bins in accordance with the
desired formulation onto the cold feed system conveyor, to an inclined weigh conveyor,
then to a rotating drum for continuous mixing and drying at approximately 300°F. When
recycled asphalt mix is used, it is added directly into the pugmill. The dried aggregate is
pulled by a bucket elevator to the top of a gradation control unit which separates and stores
the aggregate by size. The required amount of each aggregate is dispensed into a weigh-
hopper and from there into a pugmill where the hot liquid asphalt pavement is mixed
thoroughly with the aggregate. The hot asphalt mix is then discharged from the storage silo
through a slide gate into waiting dump trucks which transports the material to a final
destination for spreading. The rated capacity of the plant will vary with each aggregate mix
and moisture content with a 5% surface moisture removal.
The mixer uses a burner fired with propane to heat air to dry the aggregate. The air i s
drawn into the system via an exhaust fan. After passing through the gas burner, the air
passes through a baghouse. The baghouse is manufactured by H&B. The exhaust gas is
drawn through the baghouse and discharged to the atmosphere through the stack. The
design pressure drop across the tube sheet is 2 - 6 inches of water. The particulate matter,
which is removed by the baghouse, is reinjected into the pugmill.
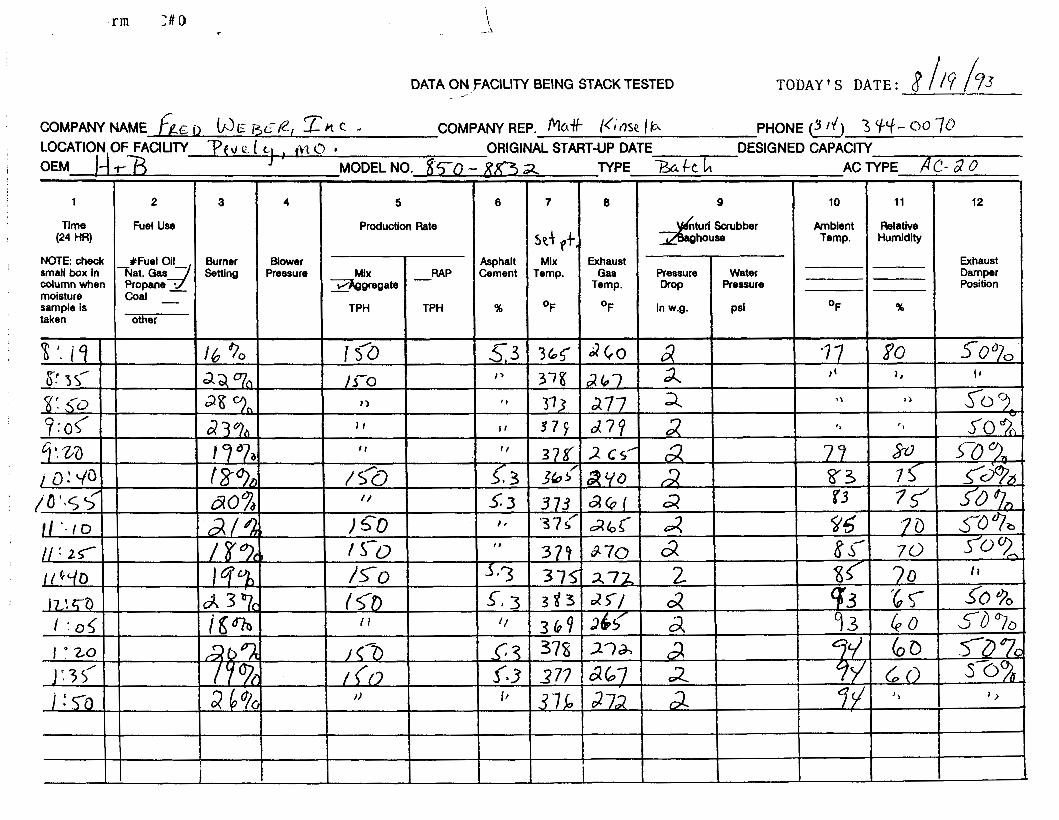
DATA ON FACILITY BEING STACK TESTED ,
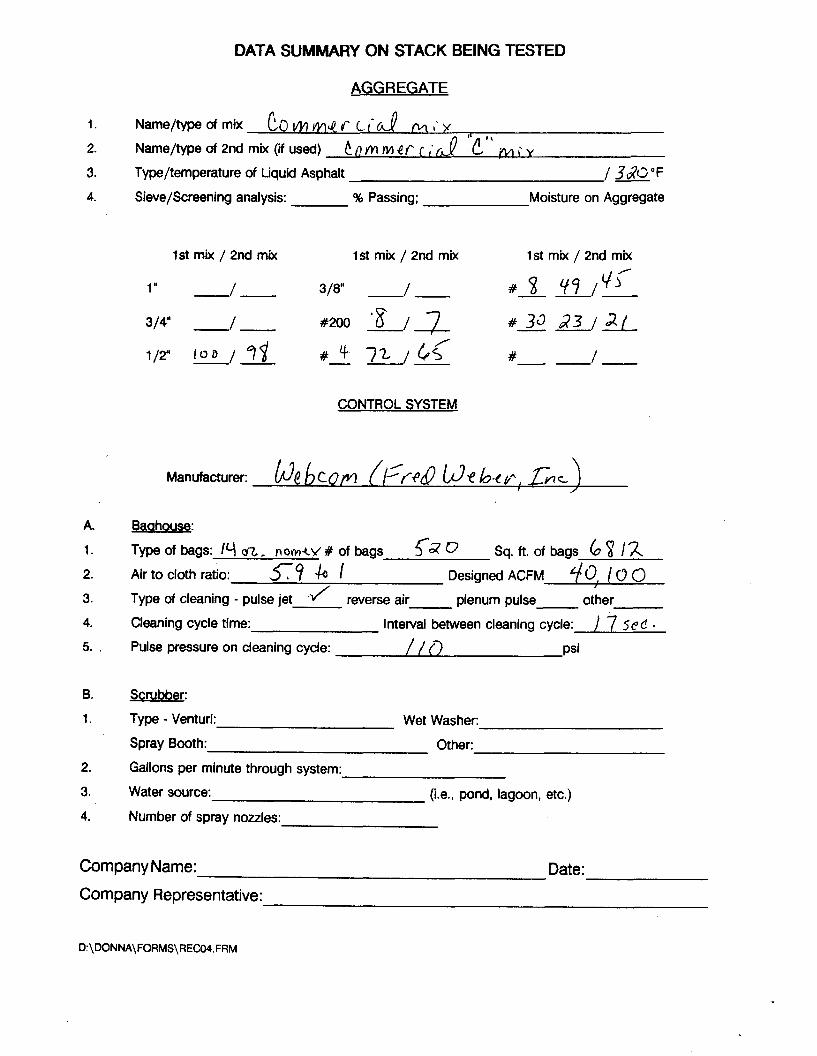
DATA SUMMARY ON STACK BEING TESTED
AGGREGATE
1. Name/typeofmix ~ o ~ ~ ~ c c ( ~ ~ ; y
2. Name/typed2ndmix(iiused) tDvn~erC;(J l ~ " ~ i ~
3. Type/temperature of Liquid Asphalt / 32'0°F 4. Sieve/Screening analysis: % Passing; Moisture on Aggregate
1st mix / 2nd mix 1 st mix / 2nd mix 1st mix / 2nd mix
CONTROL SYSTEM
1. Type of bags: iV a. norn*y + of bags gz 0 ~ q . fi. of bags 6 S I2 2. Air to cloth ratio: c? I .' Designed ACFM q, 0 0 3. Type of cleaning - pulse jet reverse air plenum pulse other
4. Cleaning cycle time: Interval between cleaning cycle: 1 7 Se C . 5. . Pulse pressure on cleaning cycle: / / (7 psi
B. Scrubber:
1. Type - Venturi: Wet Washer:
Spray Booth: Other:
2. Gallons per minute through system:
3. Water source: (i.e., pond, lagoon, etc.)
4. Number of spray nozzles:
Company Name: Date:
Company Representative:
SECTION C:
EQUIPMENT USED
EQUIPMENT USED
Equipment used to conduct the particulate emissions test was:
A. A Lear Siegler PM-100 stack sampler with appropriate auxiliary equipment and
glassware (with train set up according to the schematic on the next page).
6. An Airguide Instruments Model 211-6 (uncorrected) aneroid barometer for
checking the barometric pressure.
C. Weston dial thermometers to check meter temperatures or an Analogic Model
2572 Digital Thermocouple to check stack temperatures.
D. A Hays 621 Analyzer to measure the oxygen, carbon dioxide and carbon monoxide
content of the stack gases or, for non-combustion sources, a Bacharach Instrument
Company Fyrite for gas analysis.
E. Schleicher and Schuell Type 1-HV filters with a porosity of .03 microns.
F. Reagent- or ACS-grade acetone with a residue of I .001.
REC #0001-M5
SECTION D:
LABORATORY PROCEDURES AND RESULTS
LABORATORY PROCEDURES FOR PARTICULATE SAMPLING
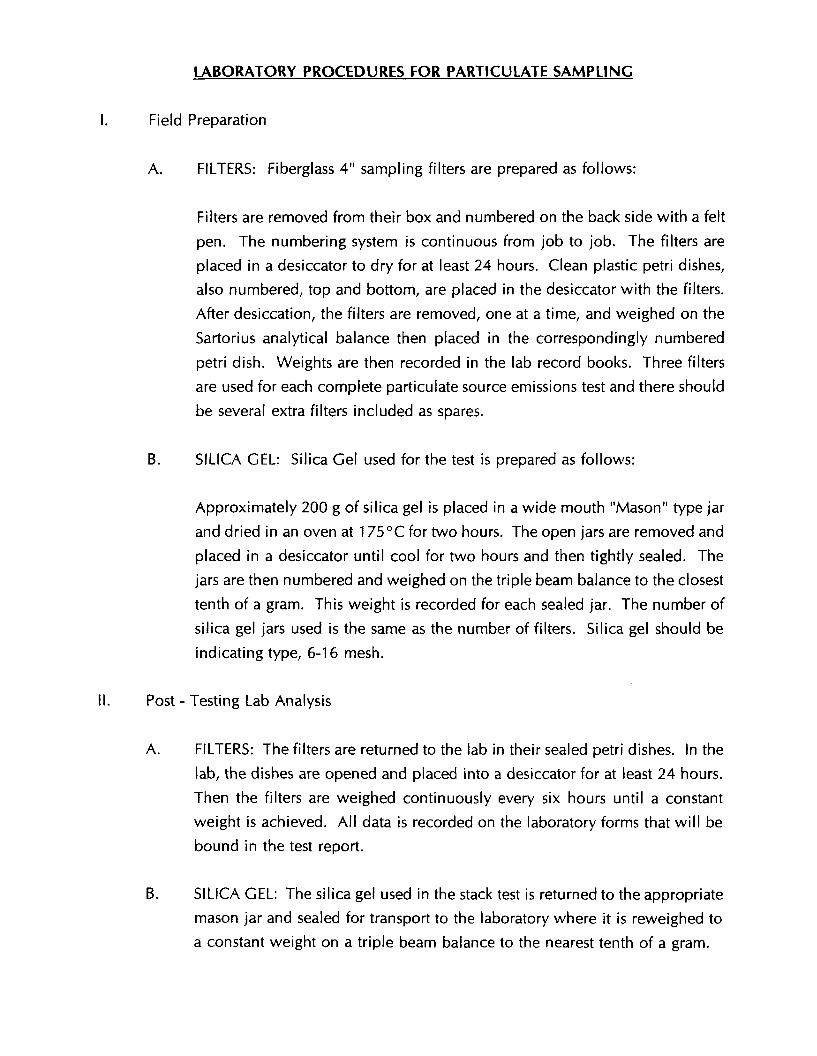
I. Field Preparation
A. FILTERS: Fiberglass 4" sampling filters are prepared as follows:
Filters are removed from their box and numbered on the back side with a felt
pen. The numbering system is continuous from job to job. The filters are
placed in a desiccator to dry for at least 24 hours. Clean plastic petri dishes,
also numbered, top and bottom, are placed in the desiccator with the filters.
After desiccation, the filters are removed, one at a time, and weighed on the
Sartorius analytical balance then placed in the correspondingly numbered
petri dish. Weights are then recorded in the lab record books. Three filters
are used for each complete particulate source emissions test and there should
be several extra filters included as spares.
B. SILICA GEL: Silica Gel used for the test is prepared as follows:
Approximately 200 g of silica gel is placed in a wide mouth "Mason" type jar
and dried in an oven at 175OC for two hours. The open jars are removed and
placed in a desiccator until cool for two hours and then tightly sealed. The
jars are then numbered and weighed on the triple beam balance to the closest
tenth of a gram. This weight is recorded for each sealed jar. The number of
silica gel jars used is the same as the number of filters. Silica gel should be
indicating type, 6-1 6 mesh.
11. Post - Testing Lab Analysis
A. FILTERS: The filters are returned to the lab in their sealed petri dishes. In the
lab, the dishes are opened and placed into a desiccator for at least 24 hours.
Then the filters are weighed continuously every six hours until a constant
weight is achieved. All data is recorded on the laboratory forms that wil l be
bound in the test report.
B. SILICA GEL: The silica gel used in the stack test is returned to the appropriate
mason jar and sealed for transport to the laboratory where it is reweighed to
a constant weight on a triple beam balance to the nearest tenth of a gram.

C. PROBE RINSINGS: In all tests where a probe washout analysis i s necessary,
this i s accomplished in accordance with procedures specified in "EPA
Reference Method 5". These samples are returned to the lab in sealed mason
jars for analysis. The front half of the filter holder is washed in accordance
with the same procedures and included with the probe wash. Reagent or ACS
grade acetone is used as the solvent. The backhalf of the filter holder is
washed with deionized water into the impinger catch for appropriate analysis.
D. IMPINGER CATCH: In some testing cases, the liquid collected in the
impingers must be analyzed for solid content. This involves a similar
procedure to the probe wash solids determination, except that the liquid is
deionized water.
E. ACETONE: A blank analysis of acetone is conducted from the one gallon
glass container used in the field preparation. This acetone was used in the
field for rinsing the probe, nozzle, and top half of the filter holder. A blank
analysis is performed prior to testing on all new containers of acetone
received from the manufacturer to insure that the quality of the acetone used
wil l be exceed the .001 O/O residual purity standard.
SPECIAL NOTE
When sampling sources high in moisture content, (such as asphalt plants) the filter
paper sometimes sticks to the filter holder. When removing the filter, i t may tear.
In order to maintain control of any small pieces of filter paper which may be easily
lost, they are washed with acetone into the probe washing. This makes the filter
weight light (sometimes negative) and the probe wash correspondingly heavier. this
laboratory procedure is taught by EPA in the "Quality Assurance for Source Emissions
Workshop" at Research Triangle Park and is approved by EPA.
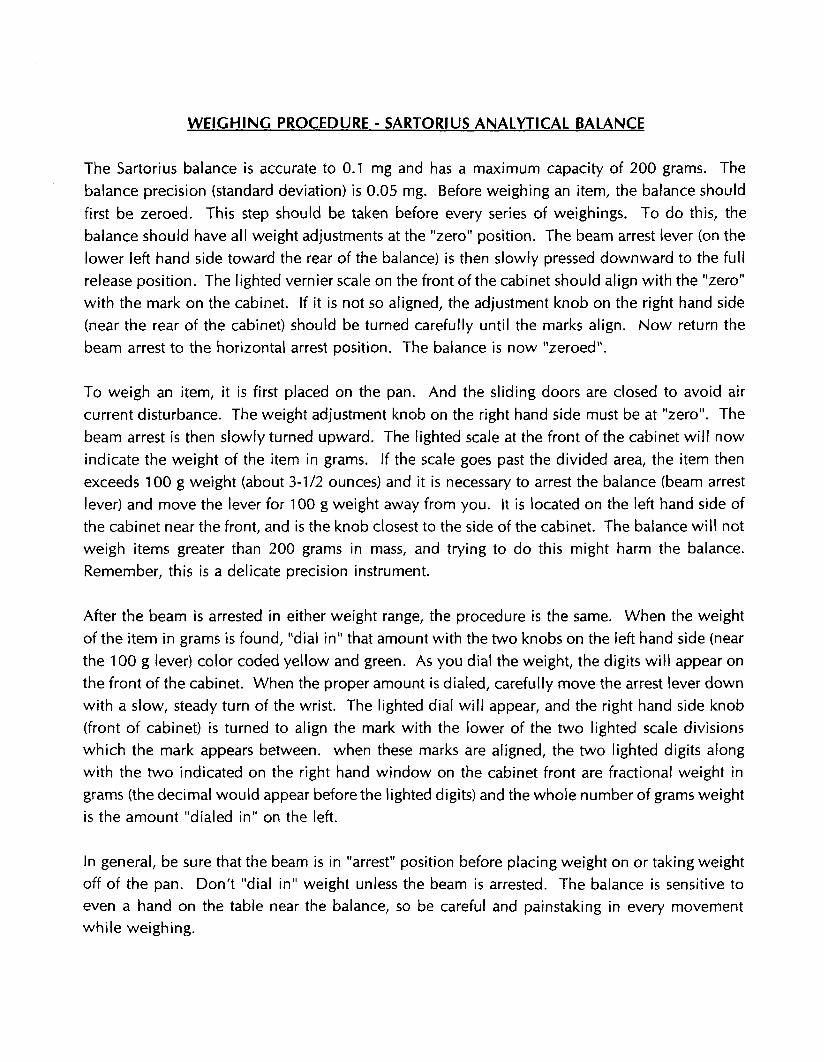
WEIGHING PROCEDURE - SARTORIUS ANALYTICAL BALANCE
The Sartorius balance is accurate to 0.1 mg and has a maximum capacity of 200 grams. The
balance precision (standard deviation) is 0.05 mg. Before weighing an item, the balance should
first be zeroed. This step should be taken before every series of weighings. To do this, the
balance should have all weight adjustments at the "zero" position. The beam arrest lever (on the
lower left hand side toward the rear of the balance) i s then slowly pressed downward to the full
release position. The lighted vernier scale on the front of the cabinet should align with the "zero"
with the mark on the cabinet. If it is not so aligned, the adjustment knob on the right hand side
(near the rear of the cabinet) should be turned carefully until the marks align. Now return the
beam arrest to the horizontal arrest position. The balance is now "zeroed".
To weigh an item, it is first placed on the pan. And the sliding doors are closed to avoid air
current disturbance. The weight adjustment knob on the right hand side must be at "zero". The
beam arrest i s then slowly turned upward. The lighted scale at the front of the cabinet wi l l now
indicate the weight of the item in grams. If the scale goes past the divided area, the item then
exceeds 100 g weight (about 3-112 ounces) and it i s necessary to arrest the balance (beam arrest
lever) and move the lever for 100 g weight away from you. It is located on the left hand side of
the cabinet near the front, and is the knob closest to the side of the cabinet. The balance wi l l not
weigh items greater than 200 grams in mass, and trying to do this might harm the balance.
Remember, this is a delicate precision instrument.
After the beam is arrested in either weight range, the procedure is the same. When the weight
of the item in grams i s found, "dial in" that amount with the two knobs on the left hand side (near
the 100 g lever) color coded yellow and green. As you dial the weight, the digits wil l appear on
the front of the cabinet. When the proper amount i s dialed, carefully move the arrest lever down
with a slow, steady turn of the wrist. The lighted dial will appear, and the right hand side knob
(front of cabinet) is turned to align the mark with the lower of the two lighted scale divisions
which the mark appears between. when these marks are aligned, the two lighted digits along
with the two indicated on the right hand window on the cabinet front are fractional weight in
grams (the decimal would appear before the lighted digits) and the whole number of grams weight
is the amount "dialed in" on the left.
In general, be sure that the beam is in "arrest" position before placing weight on or taking weight
off of the pan. Don't "dial in" weight unless the beam is arrested. The balance is sensitive to even a hand on the table near the balance, so be careful and painstaking in every movement while weighing.

SAMPLE ANALYllCAL DATA FORM
Company Name Gecl k)c b b cv Sample Location Relative Humidrty in Lab - Blank Volume pa) 10 0 , ml Density of Acetone (pa) .7b 3~ ,, ..:
Date/Time wt. blank $ 13 b +'be 4 Gross wt. / 0 & , 0 / 9 2- g
oatemme wt. blank 8/%q DO+ ~ r o s s wt. /ao. 019/ 9 Ave. Gross wt. /6O.W9& g
Tare wt. /do. 0 / 9 / 9
Weight of blank (m,) , 0 o 0 / 9 Acetone blank residue concentration (C3 : (C,) = (m,) / 0/,) (pa) = ( , o m o ~ f mg/g>
Acetone Blank Wt. : W. = C. Vaw D. = ( . b 0 0601 )( ,7857 1 - . - ( ooo3
Acetone rinse vdume (V,) ml
Datepime of wt. 6p e8;e :r0* + Grmwt .
Datepime of wt. 8 Grosswt- g
~verase~rosswt. g
Tarewt. g
Less Acetone blank wt. DIV,) g
Weight of particulate in acetone rinse (ma) g
Fllter Numbers #
Datepime of wt. 23 88:0~+ omss wt. g
Datemme of wt Gross wt. g
Average Gross wt. g
are wt. g
NOTE: In no case should a blank residue greater than 0.01 mg/g (or 0.001% of the blank weight) be ,
subtracted from the sample weight.
Run # 1 ~ O O
~ , / 6 $ & 9 2 5 / 6 + 6 7 2 ~ (69, 6923 /,$4fbL53
,6003
.0a68
Weight of particulate on filter (mf) a Weight of particulate in acetone rinse (ma) g
Total weight of particulate (m,) a
Remarks: t' V I
Signature of Analyst ,&n&, Signature of Reviewer
Run # 7
Yo0 1 5 z 9 b 7 0 /$5.?4&5 / 5 ~ . 9 b & g 155, 9371
, b 0 0 3
. O % ? #
x100.?83 ,
$850 I 58 y8
Y 9 , 5 8 2 4
/J 00 307 /
5865 I 5 8 6 3 S 6 $
, 5 8 ~ 3
- . O O ~ /
O b b 8 ,0307
Run # 3 1
+do / S S I * Z O . 155.1615 155. /b) 18 r S . ~ d a V ,So03
,017 /
7 . 0 0 38P . s&\ 7 . S 81 7 , 12 18
a 5 7 9/
,001-7 , o M Y .03 a /
0 0 2 0
0 1 9 .02 i 1

SECTION E:
CALCULATIONS
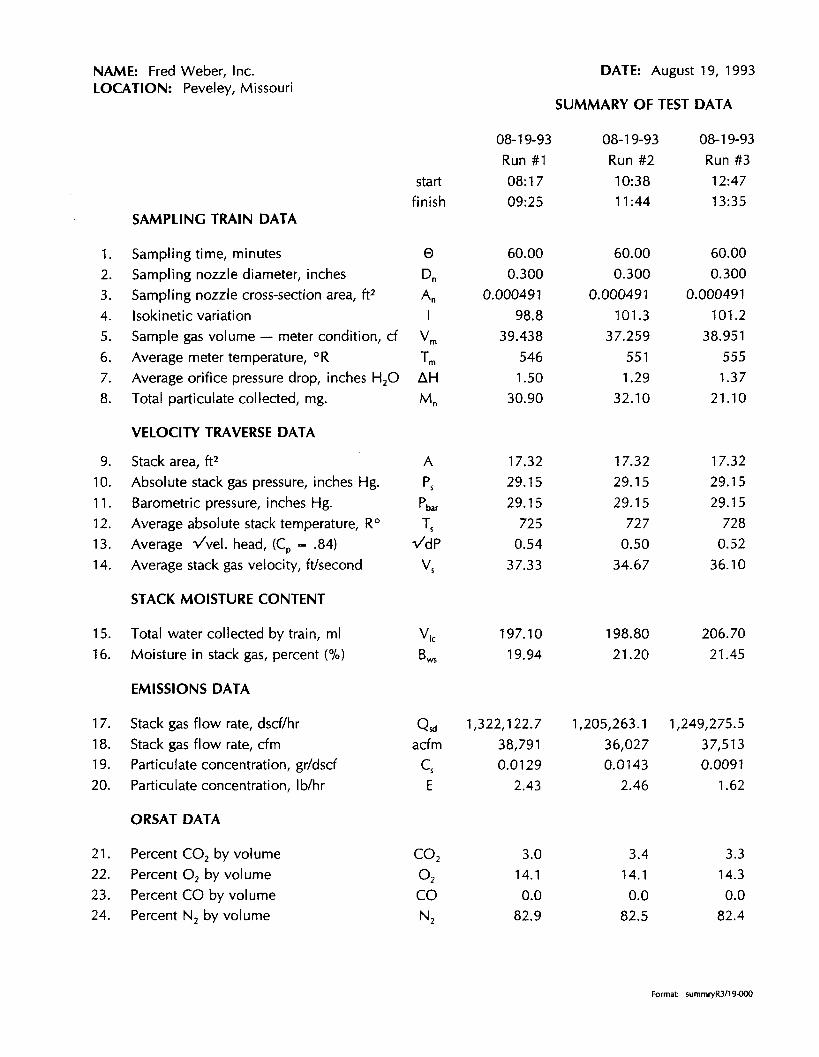
DATE: August 19, 1993 NAME: Fred Weber, Inc. LOCATION: Peveley, Missouri
SUMMARY OF TEST DATA
08-1 9-93 08-1 9-93 08-1 9-93
Run #1 Run #2 Run #3
start 08: 1 7 10:38 12:47 finish 09:25 1 1 :44 13:35
SAMPLING TRAIN DATA
Sampling time, minutes
Sampling nozzle diameter, inches
Sampling nozzle cross-section area, ft2
Isokinetic variation
Sample gas volume - meter condition, cf Average meter temperature, R Average orifice pressure drop, inches H 2 0
Total particulate collected, mg.
VELOCITY TRAVERSE DATA
Stack area, ft2 Absolute stack gas pressure, inches Hg.
Barometric pressure, inches Hg.
Average absolute stack temperature, R0 Average dvel. head, (C, = .84)
Average stack gas velocity, ftlsecond
STACK MOISTURE CONTENT
Total water collected by train, ml
Moisture in stack gas, percent (%)
EMISSIONS DATA
Stack gas flow rate, dsd/hr
Stack gas flow rate, cfm
Particulate concentration, grldsd
Particulate concentration, Iblhr
ORSAT DATA
Percent CO, by volume
Percent 0, by vol ume
Percent CO by volume
Percent N2 by volume
Q, 1,322,122.7 1,205,263.1 1,249,275.5
acf m 38,79 1 36,027 37,513
CS 0.01 29 0.0143 0.0091
E 2.43 2.46 1.62
Format: summryR3I19OYJ
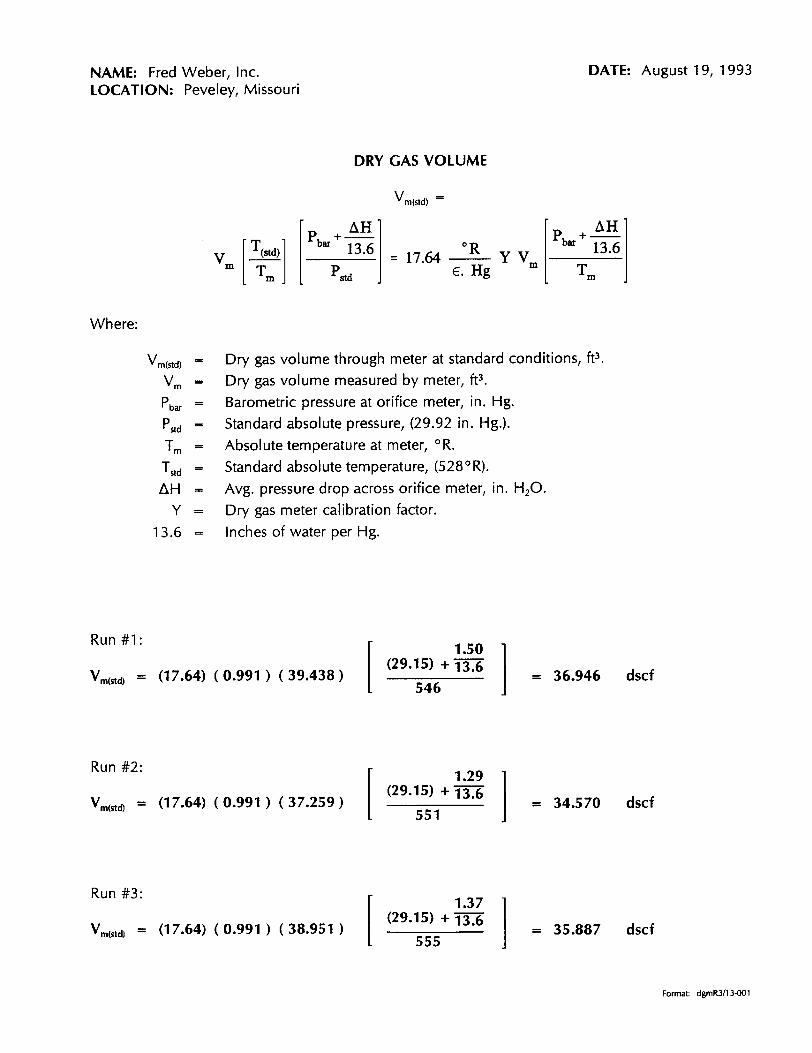
NAME: Fred Weber, Inc. LOCATION: Peveley, Missouri
DRY GAS VOLUME
Vrn(std) =
Where:
DATE: August 19, 1993
Dry gas volume through meter at standard conditions, ft3.
Dry gas volume measured by meter, ft3. Barometric pressure at orifice meter, in. Hg.
Standard absolute pressure, (29.92 in. Hg.).
Absolute temperature at meter, OR.
Standard absolute temperature, (528OR).
Avg. pressure drop across orifice meter, in. H,O. Dry gas meter calibration factor.
Inches of water per Hg.
Run #1:
V,,,, = (1 7.64) ( 0.991 ) ( 39.438 )
Run #2:
- (17.64) (0.991 ) (37.259) Vm(sta -
Run #3:
V,,s,a = (1 7.64) ( 0.991 ) ( 38.951 )
dscf
dscf
dscf
Format: dgmR3113401

NAME: Fred Weber, Inc. LOCATION: Peveley, Missouri
DATE: August 19, 1993
TOTAL CONTAMINANTS BY WEIGHT: GRAIN LOADING
Particulate Concentration: C: grldscf
Where:
C: = Concentration of particulate matter in stack gas, dry basis, corrected to standard conditions, grldscf.
M, = Total amount of particulate matter collected, mg.
V,,,,, = Dry gas volume through meter at standard conditions, cu. ft.
Run #1:
Run #2:
32.10 = [ 0*0154 5 ] [ 34.570 ] = 0.0143 grldscf
Run #3:
Format: csR3103004

NAME: Fred Weber, Inc. LOCATION: Peveley, Missouri
DATE: August 19, 1993
DRY MOLECULAR WEIGHT
M, = 0.44 ( % CO,) + 0.32 ( % 0,) + 0.28 (% CO + %N,)
Where:
Dry molecular weight, Ibllb-mole.
Percent carbon dioxide by volume, dry basis.
Percent oxygen by volume, dry basis.
Percent nitrogen by volume, dry basis.
Percent carbon monoxide by volume, dry basis.
Ratio of 0, to N, in air, vlv.
Molecular weight of N, or CO, divided by 100.
Molecular weight of 0, divided by 100.
Molecular weight of CO, divided by 100.
Run #I:
Md = 0.44 (3.0%) + 0.32 (14.1%) + 0.28 ( .0O01o + 82.9'10) = 29.04 Ib Ib-mble
Run #2:
I b Md = 0.44 (3.4%) + 0.32 (14.1%) + 0.28 ( .OO0h + 82.5%) = 29.11 -6
Run #3:
I b M, = 0.44 (3.3%) + 0.32 (14.3%) + 0.28 ( .00% + 82.4%) = 29.10
Format: mdR3113-002

NAME: Fred Weber, Inc. LOCATION: Peveley, Missouri
WATER VAPOR CONDENSED
DATE: August 19, 1993
Where:
Conversion factor, ft3/ml.
Conversion factor, ft3/g. Volume of water vapor condensed (std. cond.), ml. Volume of water vapor collected in silica gel (standard conditions), ml. Final volume of impinger contents less initial volume, ml.
Final weight of silica gel less initial weight, g. Density of water, 0.002201 Iblml.
Ideal gas constant, 2 1.85 in.Hg. (cu.ft./lb-mole)(O R).
Molecular weight of water vapor, 18.0 Ibllb-mole.
Absolute temperature at standard conditions, 528OR.
Absolute pressure at standard conditions, 29.92 inches Hg.
Run #1:
VWc,,, = (0.04707) ( 190.00 ) = 8.9 cu. ft - (0.04715) ( 7.10 ) = 0.3 CU. f t Vwsg~std) -
Run #2:
- (0.04707) ( 192.00) = 9.0 CU. ft VWC(*d) - - (0.04715) ( 6.80 ) = 0.3 cu. ft Vwsg(std) -
Run #3:
- (0.04707) ( 201.00 ) = 9.5 cu. ft Vwc(std) - "wzg(std) = (0.04715) ( 5.70 ) = 0.3 CU. ft
Format: vaporR3/24001

NAME: Fred Weber, Inc. LOCATION: Peveley, Missouri
MOISTURE CONTENT OF STACK CASES
DATE: August 19, 1993
Where:
Bw, = Proportion of water vapor, by volume, in the gas stream.
V, = Dry gas volume measured by dry gas meter, dcf.
Vwc,,, = Volume of water vapor condensed, corrected to standard conditions, scf.
Vwsg,,, = Volume of water vapor collected in silica gel corrected to std. cond., scf.
Run #1:
Run #2:
Run #3:
Format: bwsR3119-001

NAME: Fred Weber, Inc. LOCATION: Peveley, Missouri
MOLECULAR WEIGHT OF STACK GASES
DATE: August 19, 1993
M, = M, (1 - B,) + 18 (B,)
Where:
M, = Molecular weight of stack gas, wet basis (Ib./lb.-mole).
M, = Molecular weight of stack gas, dry basis (Ib./lb.-mole).
Run #1:
Ib M, = 29.04 ( 1 - 0.1994 ) + 18 ( 0.1994 ) = 26.84 we
Run #2:
I b M, = 29.11 (1 -0 .2120) + 18 (0.2120) = 26.75 m a e
Run #3:
I b M, = 29.10 ( 1 - 0.2145 ) + 18 ( 0.2145 ) = 26.72 ~h
Format: msR3113-002

NAME: Fred Weber, Inc. LOCATION: Peveley, Missouri
STACK GAS VELOCITY
Where:
v, =
K, =
C, =
AP =
Pbar =
P, =
P, =
pstd =
t, =
T, =
M, =
Run #1:
Average velocity of gas stream in stack, Wsec. 85.49 Wsec [(glg-mole) - (mm Hg)/(OK)(mm H,O]" Pitot tube coefficient, dimensionless. Velocity head of stack gas, in. H20.
Barometric pressure at measurement site, in. Hg. Stack static pressure, in. Hg.
Absolute stack gas pressure, in. Hg. = Pb,, + P, Standard absolute pressure, 29.92 in. Hg.
Stack temperature, F. Absolute stack temperature, OR. = 460 + t,. Molecular weight of stack gas, wet basis, Ib/lb-mole.
DATE: August 19, 1993
V = (85.49) (0.84) ( 0.54 ) 725 (29.15) (26.84)
= 37.33 ft/sec
Run #2:
Run #3:
Format: vsR3119-903
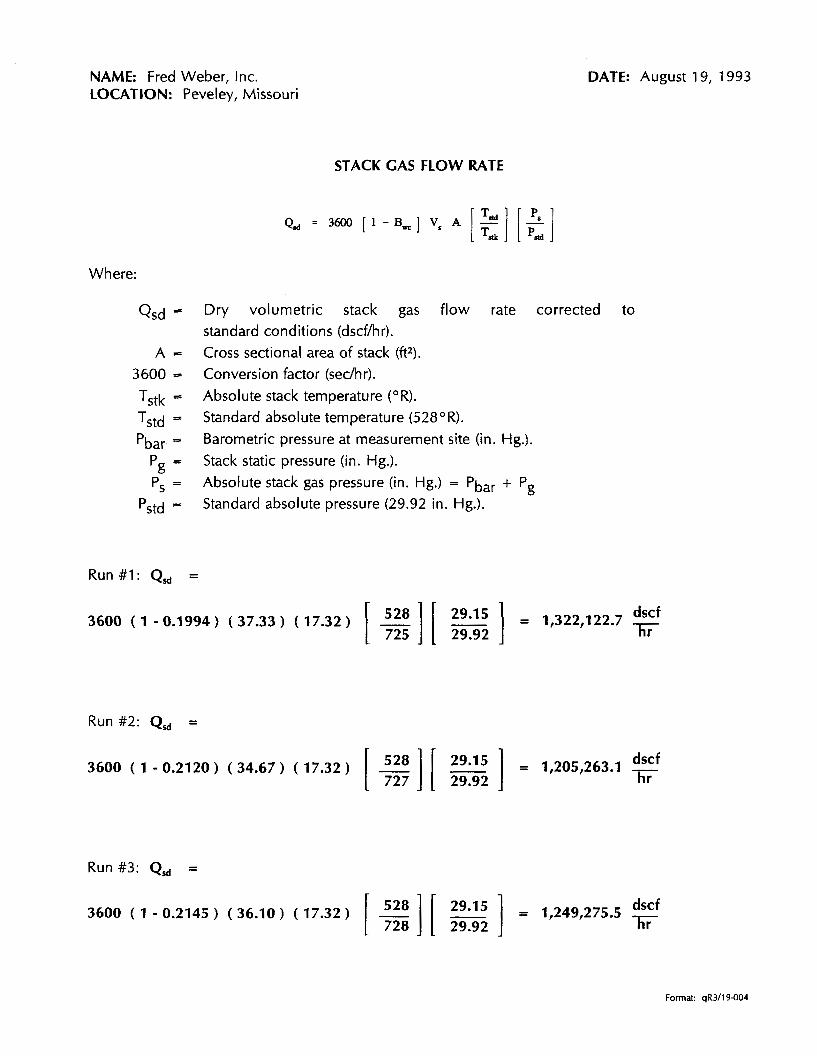
NAME: Fred Weber, Inc. LOCATION: Peveley, Missouri
STACK GAS FLOW RATE
DATE: August 19, 1993
Where:
Dry volumetric stack gas flow rate corrected to standard conditions (dscflhr).
Cross sectional area of stack (ftz). Conversion factor (sedhr).
Absolute stack temperature (OR).
Standard absolute temperature (528 " R).
Barometric pressure at measurement site (in. Hg.).
Stack static pressure (in. Hg.).
Absolute stack gas pressure (in. Hg.) = Pbar + Pg Standard absolute pressure (29.92 in. Hg.).
Run #1: Q, =
3600 ( 1 - 0.1994 ) ( 37.33 ) ( 17.32 ) [ ] [ : ] = 1,322,122.7 dscf hr
Run #2: Q, =
3600 ( 1 - 0.21 20 ) ( 34.67 ) ( 17.32 ) [ ] [ ] = 1,205~263.1 - dscf hr
Run #3: Q,, =
3600 ( 1 - 0.2145 ) ( 36.10 ) ( 17.32 ) [ ] [ : ] = 1,249?275.5 dscf hr
Format: aR3119-004
NAME: Fred Weber, Inc. LOCATION: Peveley, Missouri
DATE: August 19, 1993
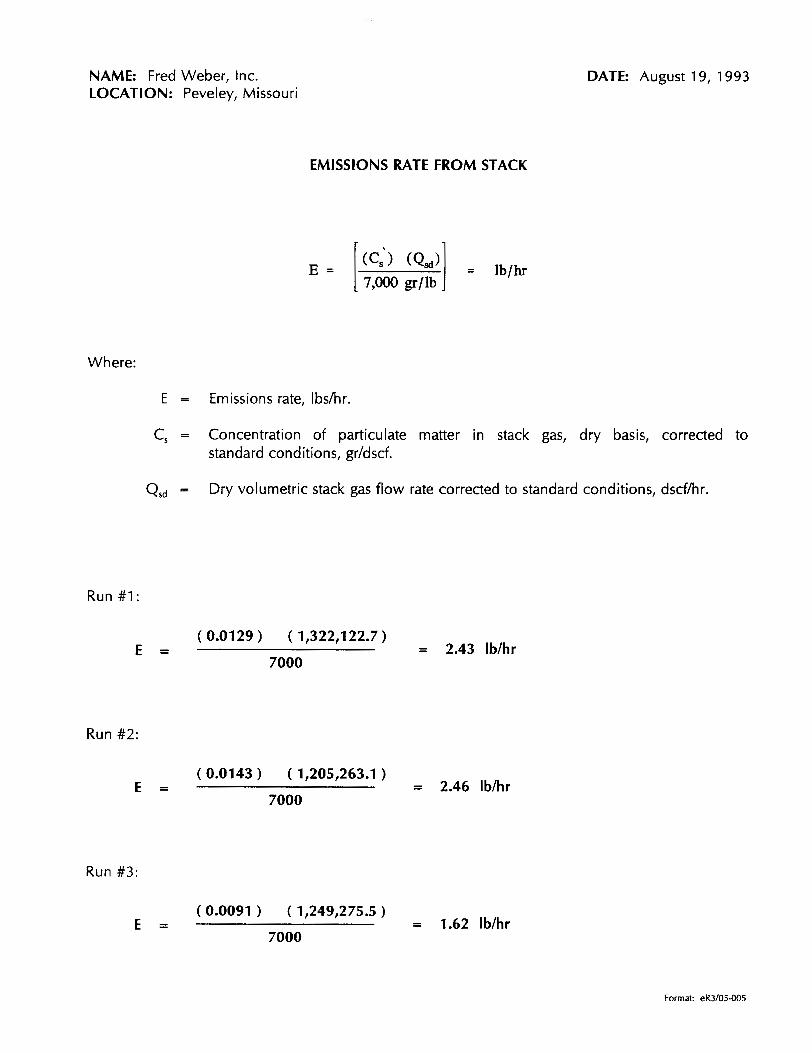
EMISSIONS RATE FROM STACK
Where:
E = Emissions rate, Ibshr.
C, = Concentration of particulate matter in stack gas, dry basis, corrected to standard conditions, grldscf.
Q,, = Dry volumetric stack gas flow rate corrected to standard conditions, dscflhr.
Run #I :
( 0.0129 ) ( 1,322,122.7 ) E = = 2.43 Iblhr
7000
Run #2:
Run #3:
( 0.0091 ) ( 1,249,275.5 ) E = = 1.62 Iblhr
7000
Format: eR3105-005

NAME: Fred Weber, Inc. LOCATION: Peveley, Missouri
ISOKINETIC VARIATION
DATE: August 19, 1993
Where: I =
100 =
T, =
0.002669 =
Vic Tm =
'bar " A H =
13.6 =
60 =
8 =
v, =
ps =
A, =
y. =
Percent isokinetic sampling. Conversion to percent. Absolute average stack gas temperature, O R. Conversion factor, Hg - ft3Iml - OR. Total volume of liquid collected in impingers and silica gel, ml. Absolute average dry gas meter temperature, O R. Barometric pressure at sampling site, in. Hg. Average pressure differential across the orifice meter, in. H,O. Specific gravity of mercury. Conversion seconds to minutes. Total sampling time, minutes. Stack gas velocity, Wsec. Absolute stack gas pressure, in. Hg. Cross sectional area of nozzle, ft2. Calibration factor.
Run #1: (0.002669) (1 97.1 0) + (0.991) (39.438)
I = (100) (725) 546 60 ( 60.00 ) ( 37.33 ) ( 29.15 ) ( 0.000491 )
Run #2:
(0.002669) (1 98.80) + (0.991) (37.259) 551 ' = 0°) (727) 60 ( 60.00 ) ( 34.67 ) ( 29.1 5 ) ( 0.000491 )
Run #3:
Format: iR3/09-001
SECTION F:
FIELD DATA


1 (A ) 9,- Company Name
F - 1 9 - 9 3 Date
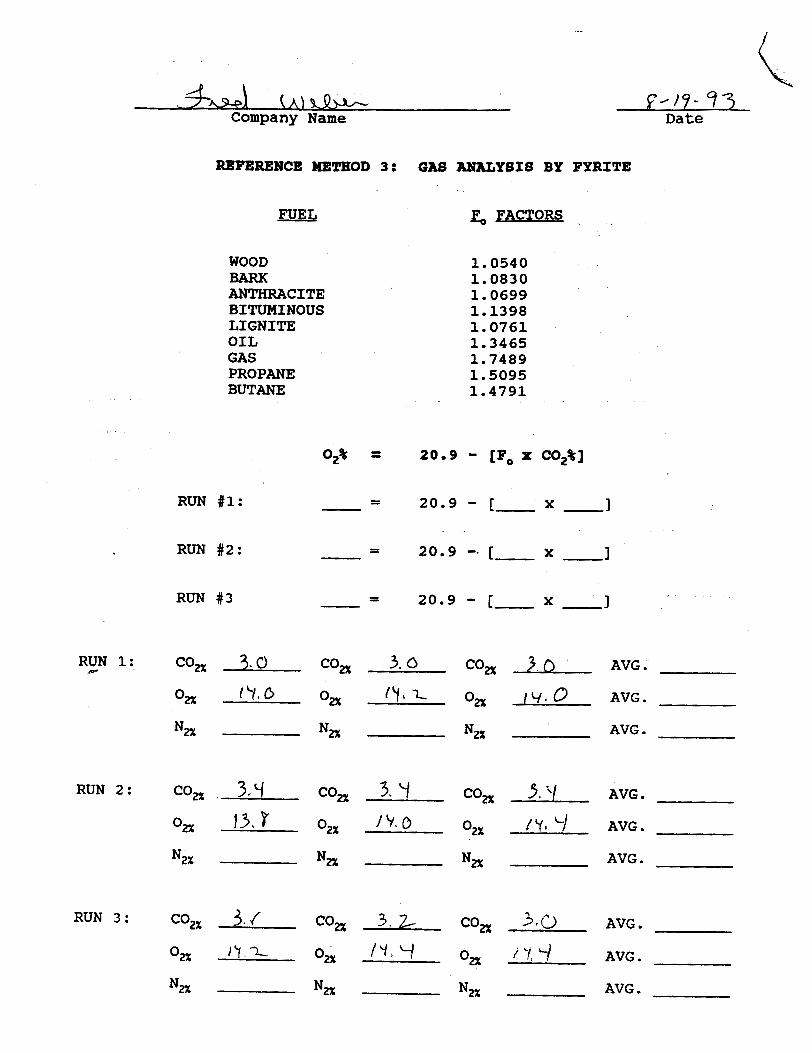
REFERENCE METHOD 3: GAS LWALYSIS BY FYRITE
ma! --o F FACTORS
WOOD BARK ANTHRACITE BITUMINOUS LIGNITE OIL GAS PROPANE BUTANE
RUN #1:
RUN #2:
RUN # 3 - - - 20.9 - X 1- I
RUN 1: m. con -3Q.- coa 3. 0 Co, 3 . 0 AVG.
O2% (4 .0 O2% (w- 0, I V . 0 AVG . N2% Nm Nz% AVG .
RUN 2: corr 3 3 CO, 3. ‘1 CO, 5. '/ AVG.
*2% j3. r ('2% /p. 0 O2x I AVG.
Na N, N2% AVG .
RUN 3: AVG . AVG . AVG .
SECTION G:
CALI BRATION

TYPE S PITOT TUBE INSPECTION DATA FORM
' [
P i t o t tube assembly l e v e l ? d Yes
P i t o t tube openings damaged? - yes (explain ~f below)
a1 = \;3 " (<1O0) , a2 = B a g ' ( < l o 0 ) , p1 = _ D . ~ ' O ( < 5 O ) ,
. b2 = I.% O ( < s o )
Y = 2-C\ O , e = 1.7 O , A = ,Cj? cm ( i n . )
z = A s i n y = -. . o < c m ( i n . ) ; (0.32 cm (<1/8 i n . ) ,
w = A s i n e = cm ( i n . ) ; c.08 c m (<1/32 i n . )
9 Y c m ( i n . ) pb . Y q c m ( i n . )
Comments :
Cal ibra t ion requi red? Yes
~ u a l i t y Assurance Handbook.M2-1.7

TYPE S PITOT TUBE INSPECTION DATA FORM
' f p i t o t tube assembly l e v e l ? 1/ yes no
P i t o t tube openings damaged? - yes (explain below) no
= 7 .3 o l o o er2 = . q ( < l o o ) t 8, = Lr- 0 ( < s o ) t
$2 = I . C d o ( < s o )
z = A s i n y = - O< Cm ( i n . ) ; C0.32 cm (cl/8 i n . ) ,
w = A s i n 0 = - Ot Cm ( i n . ) ; <.08 cm (<l /32 i n . )
P ~ ' '17 cm ( i n . ) Pb . 9 9 cm ( i n . )
D t = .5y cm ( i n . )
Comments :
I-
Cal ibra t ion required? yes ,-/no
~ u a l i t y A s s u r a n c e Handbook M2-1.7
h W C O N ENVIROWENTAL CORPORATION
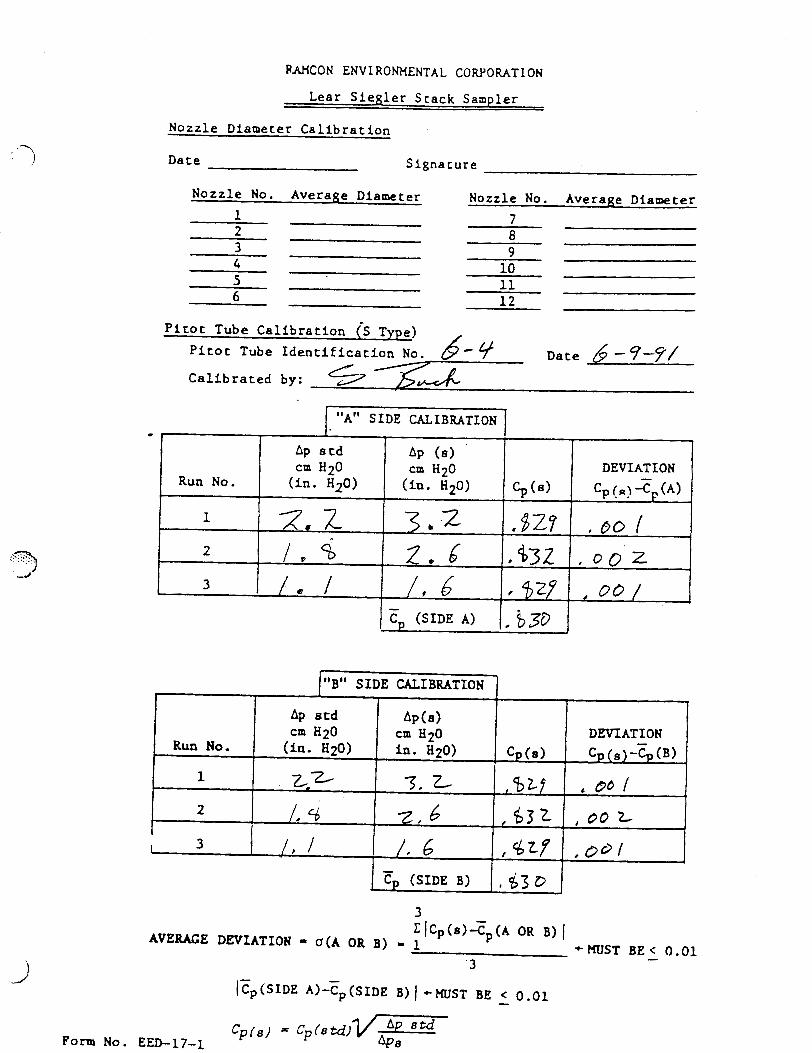
Lear S i e g l e r S t a c k Sampler
Nozz le Diamete r C a l i b r a t i o n
D a t e S i g n a t u r e
N o z z l e No. Average Diameter Nozzle No. Average Diamete r 1 2
7
3 8
4 9
5 1 0
6 11 1 2
P i t o t Tube C a l i b r a t i o n (S Type)
P i t o t T u b e I d e n t i f i c a t i o n H o . 8-Y ate&-?-?/ C a l i b r a t e d by: r
3 r ( c p ( . ) % ( ~ OR B) I
AVERAGE DEVIATION - .(A OR 8) - 1 +MUST BE< 0 .01 -
' 3
"A" SIDE CALIBRATION
"0" SIDE CALIBRATION
1 F,., (sme A) 1. b3D
*
cp ( 8 )
.E? .$32
, $27
Run No.
1
2
L 3
CP (8)
,%Lf
, 6 3 2
, $ Z P
DEVIATION
Cp (R) 3 (A)
. D O I . 00 , 0 4 /
&
Run No.
I
2
3
- c, (SIDE 8) 1 , $3 0
Ap std cm Hz0 (in. H2O)
2.l
/. %
/, /
DEVIATION
Cp (s) -Cp - (B) 00 /
, o o r
,OW -
A P ~ ) cm Hz0 in. H2O)
3. 2-
2 . 6 /. 6
*
/, 6 I
Ap 8 t d cm Hz0
( i n . H20)
, Z 1
@ /
AP (8) cm Hz0
( i n . H20)
3 -2 b
2.6
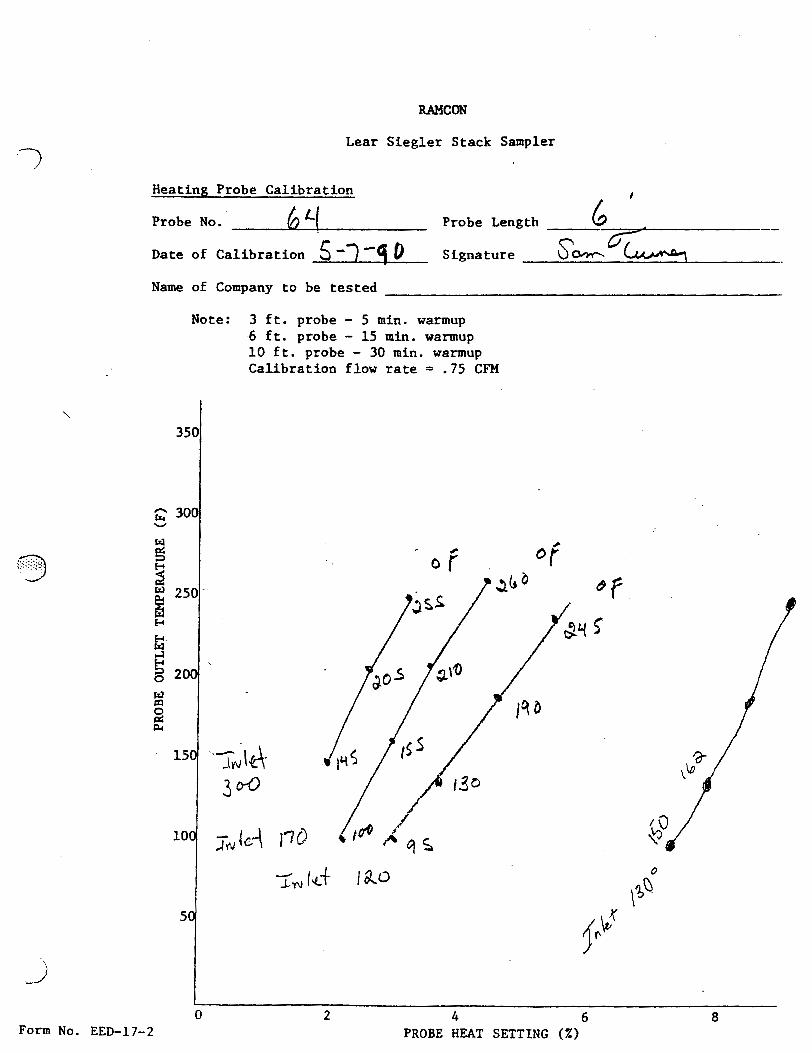
RAMCON
Lear Siegler Stack Sampler
Heating Probe Calibration 1
6 ' Probe No, L Probe Length
Date of Calibration 5 -7 -q 0 Signature skw-- - - -
Name of Company to be tested
Note: 3 f t . probe - 5 min. warmup 6 f t . probe - 15 min. warmup 10 f t . probe - 30 min. warmup Calibration flow rate = . 7 5 CFM

STACK TEMPERATURE SENSOR CALIBRATION DATA FORM
S- 5 - 90 Date Thermocouple number
Ambient temperature &a OC Barometric pressure 29, gg in. Hg Calibrator f k, Reference : mercury-in-glass I/
other
Reference I source a
n%:: 1 specify) Reference thermometer temperature,
OC
Thermocouple potentiometer temperature,
OC
Temperature difference , b
e of calibration system used.
ref temp, OC + 273) - (test thermom temp, OC + 273)] ref temp, OC + 273 100<1.5%. -
Quality Assurance Handbook M5-2.5

'-L
L : a
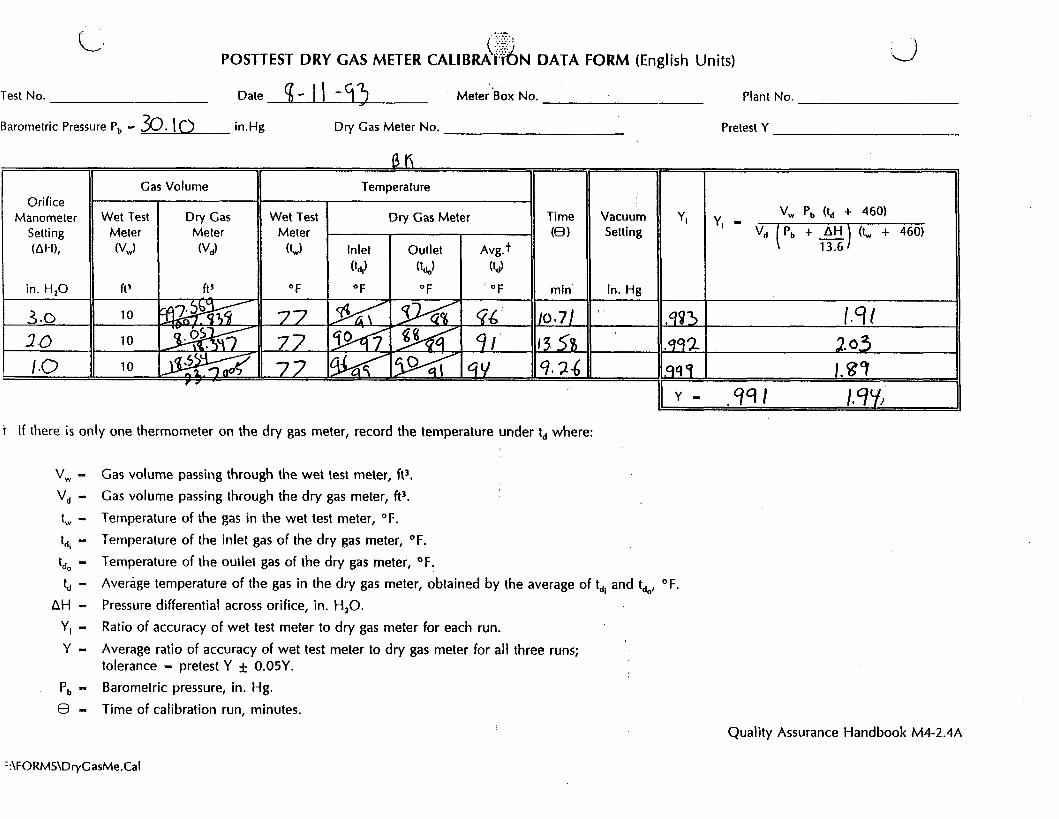
POSTTEST DRY GAS METER C A L I ~ ~ ~ T I O N DATA FORM (English Units) 3 Test No. a 8 - 2 0 - 4 3 Meter Box No. ( I Plant No.
~ q , q Y in.Hg 1 I
Barometric Pressure Pb - Dry Gas Meter No. Pretest Y
t If there i s only one thermometer on the dry gas meter, record the temperature under td where:
Gas volume passing through the wet test meter, ft3.
Gas volume passing through the dry gas meter, ft3.
Temperature of the gas in the wet test meter, O F .
Temperature of the inlet gas of the dry gas meter, O F .
Temperature of the outlet gas of the dry gas meter, O F .
Average temperature of the gas in the dry gas meter, obtained by the average of td, and tdo, O F .
Pressure differential across orifice, in. H,O.
Ratio of accuracy of wet test meter to dry gas meter for each run.
Average ratio of accuracy of wet test meter to dry gas meter for all three runs; tolerance - pretest Y * 0.05Y. . ,
Barometric pressure, in. Hg.
Time of calibration run, minutes.
Quality Assurance Handbook M4-2.4A
L, -. .- ....
(;,;%:: ! POSTTEST DRY GAS METER C A L I B R A ~ ~ N DATA FORM (English Units)
3
Test No. Date - Meter 'BOX No. - Plant No.
Barometric Pressure P, - 30. 10 in.Hg Dry Gas Meter No. Pretest Y
t I f there i s only one thermometer on the dry gas meter, record the temperature under t, where:
Gas volume passing through the wet test meter, ft3.
Gas volume passing through the dry gas meter, ft3.
Temperature of the gas in the wet test meter, O F .
Temperature of the inlet gas of the dry gas meter, O F .
Temperature of the outlet gas of the dry gas meter, O F .
Average temperature of the gas in the dry gas meter, obtained by the average of td, and tdo, O F .
Pressure differential across orifice, in. H,O. Ratio of accuracy of wet test meter to dry gas meter for each run.
Average ratio of accuracy of wet test meter to dry gas meter for all three runs; tolerance - pretest Y f 0.05Y.
P, - Barometric pressure, in. Hg.
9 - Time of calibration run, minutes.
Quality Assurance Handbook M4-2.4A

SECTION H:
RAMCON PERSONNEL

Name: Mr. Sumner Buck Title: President
Qualifications: Mr. Buck is a graduate of the University of Mississippi with graduate studies at
Memphis State University and State Technical Institute of Memphis. He is a graduate of the EPA
450 "Source Sampling for Particulate Pollutant's" course and the 474 "Continuous Emissions
Monitoring" courses outlined by EPA at Research Triangle Park, N.C. He has been directly
involved in conducting and supervising air emission testing for over 15 years. He has personally
conducted over 400 air emission tests. He currently sponsors and directs visual emission
certification schools for US EPA Method 9.
Proiect Duties: Mr. Buck is responsible for the overall supervision of each testing project. This
includes the correspondence to the State Regulatory Agency and the plant personnel regarding
scheduling, testing requirements, etc. He will assist in supervision of the project preparation for
each team involved and the overall organization between the testing crew($ and facility.
Name: Mr. Joe Sewell Title: Vice President
Qualifications: Mr. Sewell is currently serving as the Vice President of RAMCON Environmental
Corporation. Mr. Sewell i s a graduate of Christian Brothers University in Memphis, Tennessee
where he obtained a Bachelor of Science degree in Chemical Engineering. He has conducted and
supervised air emissions testing projects ranging a broad spectrum of facility process categories.
His accomplishments include the development of the instrumental branch of emissions testing
utilizing continuous emission monitors and gas chromatography. Mr. Sewell performs a major
role in the upgrading of testing capabilities and professional quality that RAMCON Environmental
Corporation offers.
Proiect Duties: Mr. Sewell provides staff engineering and project administration to ensure the
integrity of the requested services. He serves as the primary contact person for RAMCON
Environmental Corporation handling all correspondence between the facility personnel involved
in the project and respective state agency representative(s). He provides project leadership to

RAMCON Environmental Corporation field supervisors and managers involved in the testing
project.
Name: Mr. Ray Jenkins Title: Source Sampling Director -
Qualifications: Mr. Jenkins is serving as the Source Sampling Director for RAMCON
Environmental Corporation. He was promoted to this leadership position after gaining a
significant amount of experience in conducting and providing field supervision of a variety of air
testing projects. Mr. Jenkins has personally conducted and/or supervised all of the prevalent EPA
approved procedures with expertise in the instrumental analyzer procedures. He graduated from
Memphis State University obtaining a Bachelor of Science degree in Biology. He is also currently
certified to conduct US EPA Reference Method 9 for the visual determination of emission opacity.
Pro-iect Duties: Mr. Jenkins provides project leadership to the Team Leaders and Field
Technicians. He ensures the test crew(s) involved in the test project will be properly informed
to his respective duties and responsibilities during the testing process. Mr. Jenkins also serves as
the Quality Assurance/Quality Control Coordinator and provides guidance in QAIQC to each
Team Leader with regard to sample integrity.
Name: Mr. Tommy South Title: Laboratory Technician
Qualifications: Mr. South is currently serving as Laboratory Technician. He is proficient in
conducting many analysis procedures such as front and back-half particulate analysis, titrations,
extractions, etc.
Proiect Duties: Mr. South conducts the laboratory analysis on the particulate samples. He is also
responsible for accepting the remaining field samples from the Field Sample Bank Manager and
performing inspection as to integrity. He documents the transfer on the chain of custody forms
and distributed the subcontracted samples to the respective laboratories.

Name: Mr. Allen Turner Title: Team Leader
Qualifications: Mr. Turner has been employed with RAMCON Environmental Corporation for
five years. Altogether, he has sampled approximately 300 stacks of all types. Mr. Turner became
qualified for a Team Leader in 1988 and has served as such since that time. He is a current V.E.
reader and continues his studies at State Technical Institute in Memphis, Tennessee. Mr. Turner
has extensive experience in EPA Methods 1-9.
Proiect Duties: Mr. Turner i s responsible for isokinetic sampling procedures, including but not
limited to, Method 5 for particulate, multi-metals, PAH, calibration and cleaning of necessary
equipment for his testing. His duties on-site include assembling the sample train, leak checking
the system, operation of the train and recording the test data on the field data forms.

SECTION I:
VISIBLE EMISSIONS

EMISSION COtNT
EMISSION POINT
R F C # l A