Environmental benefits of bike sharing: a big data-based ...
23
1 Environmental benefits of bike sharing: a big data-based analysis Yongping Zhang 1 , Zhifu Mi 2, * , † 1. The Bartlett Centre for Advanced Spatial Analysis, University College London, 90 Tottenham Court Road, London W1T 4TJ, UK 2. The Bartlett School of Construction and Project Management, University College London, 1-19 Torrington Place, London WC1E 7HB, UK Abstract: Bike sharing is a new form of transport and is becoming increasingly popular in cities around the world. This study aims to quantitatively estimate the environmental benefits of bike sharing. Using big data techniques, we estimate the impacts of bike sharing on energy use and carbon dioxide (CO2) and nitrogen oxide (NOX) emissions in Shanghai from a spatiotemporal perspective. In 2016, bike sharing in Shanghai saved 8,358 tonnes of petrol and decreased CO2 and NOX emissions by 25,240 and 64 tonnes, respectively. From a spatial perspective, environmental benefits are much higher in more developed districts in Shanghai where population density is usually higher. From a temporal perspective, there are obvious morning and evening peaks of the environmental benefits of bike sharing, and evening peaks are higher than morning peaks. Bike sharing has great potential to reduce energy consumption and emissions based on its rapid development. Keywords: bike sharing, sharing economy, energy consumption, carbon emissions, air pollution, big data * Corresponding author at: The Bartlett School of Construction and Project Management, University College London, 1-19 Torrington Place, London WC1E 7HB, UK E-mail addresses: [email protected] (Z. Mi) † Yongping Zhang and Zhifu Mi contributed equally to this work.
Transcript of Environmental benefits of bike sharing: a big data-based ...

1
Environmental benefits of bike sharing: a big data-based analysis
Yongping Zhang1, Zhifu Mi2,*,†
1. The Bartlett Centre for Advanced Spatial Analysis, University College London, 90
Tottenham Court Road, London W1T 4TJ, UK
2. The Bartlett School of Construction and Project Management, University College
London, 1-19 Torrington Place, London WC1E 7HB, UK
Abstract: Bike sharing is a new form of transport and is becoming increasingly popular
in cities around the world. This study aims to quantitatively estimate the environmental
benefits of bike sharing. Using big data techniques, we estimate the impacts of bike
sharing on energy use and carbon dioxide (CO2) and nitrogen oxide (NOX) emissions
in Shanghai from a spatiotemporal perspective. In 2016, bike sharing in Shanghai saved
8,358 tonnes of petrol and decreased CO2 and NOX emissions by 25,240 and 64 tonnes,
respectively. From a spatial perspective, environmental benefits are much higher in
more developed districts in Shanghai where population density is usually higher. From
a temporal perspective, there are obvious morning and evening peaks of the
environmental benefits of bike sharing, and evening peaks are higher than morning
peaks. Bike sharing has great potential to reduce energy consumption and emissions
based on its rapid development.
Keywords: bike sharing, sharing economy, energy consumption, carbon emissions, air
pollution, big data
* Corresponding author at: The Bartlett School of Construction and Project Management,
University College London, 1-19 Torrington Place, London WC1E 7HB, UK
E-mail addresses: [email protected] (Z. Mi)
† Yongping Zhang and Zhifu Mi contributed equally to this work.

2
1. Introduction
Although bike sharing is a relatively new form of transport in urban areas, it has become
increasingly popular in towns and cities around the world in recent years (O’Brien et
al., 2014). Bike sharing is an oriented production service system (PSS) where
ownership of the bike is retained by the provider, who sells the functions of the bike,
via modified distribution and payment systems (Annarelli et al., 2016; Mont, 2002;
Piscicelli et al., 2015). This popularity can be mainly explained by the fact that bike-
sharing programmes are associated with various social, environmental, and economic
benefits, such as a decrease in carbon dioxide (CO2) emissions, a reduction in various
diseases (e.g., diabetes and obesity), and a decline in traffic congestion and noise
pollution through the provision of alternatives to auto-commuting and an increase in
public transit use (Caulfield et al., 2017; Martens, 2007; Mont, 2004).
The existing bike-sharing literature can be mainly grouped into two domains (Médard
de Chardon and Caruso, 2015). The first domain includes mathematical models that
focus on rebalancing. For example, taking London's Barclays Cycle Hire programme
as a study case, Pfrommer et al. (2014) considered the efficient operation of shared
mobility systems via the combination of intelligent routing decisions for staff-based
vehicle redistribution and real-time price incentives for customers. Forma et al. (2015)
proposed a 3-step mathematical programming-based heuristic method for the static
repositioning problem. In addition, Pal and Zhang (2017) presented a novel mixed
integer linear programme for solving real-life large-scale static rebalancing problems.
The studies in the second domain include those that characterise bike sharing through
various analyses. For example, Wood et al. (2011) visualised the dynamics of London’s
bike-sharing scheme using flow maps, and Zaltz Austwick et al. (2013) employed

3
visualisation, descriptive statistics and spatial and network analysis tools to explore
usage in five cities around the world. Beecham et al. (2014) proposed a new technique
for classifying commuting behaviours that involves various spatial analysis algorithms
and visual analytics techniques. In addition, Caulfield et al. (2017) examined usage
patterns of a bike-sharing programme in Cork, a medium-sized city in Ireland. This
research provides insights into the dynamics of a relatively small bike-sharing scheme
and presents results on how bike sharing has offered citizens a new transport alternative.
Some researchers have a particular interest in understanding the factors that affect bike
sharing (such as the built environment, weather, and socio-economic demographics)
(Bachand-Marleau et al., 2012; El-Assi et al., 2017; Faghih-Imani et al., 2014). Most
of the existing studies focus on the analysis of an individual city, such as London (the
UK) (Ogilvie and Goodman, 2012; Pfrommer et al., 2014; Wood et al., 2011),
Washington DC (the United States) (Buck et al., 2013; Buehler, 2012), Toronto and
Montreal (Canada) (Fuller et al., 2011; Habib et al., 2014), and Hangzhou and
Zhongshan (China) (Chen et al., 2017; Shaheen et al., 2011; Zhang et al., 2017).
However, some studies have performed a comparative analysis of the bike-sharing
systems in different cities. These comparisons are based on numerous aspects, such as
the number of subscribers/stations/bikes, modal share changes, connectivity, and flows
(O’Brien et al., 2014; Zaltz Austwick et al., 2013; Zhang et al., 2015).
However, despite acknowledgement that bike sharing results in various environmental
benefits, no studies have directly estimated the environmental benefits of bike sharing.
A key contribution of this paper, therefore, is to fill this research gap using a big data
technique to quantitatively estimate the impacts of bike sharing on energy savings and
emission reductions.
Since the introduction of the first bike-sharing programme in the 1960s, bike-sharing
4
service has evolved quickly over a half century (DeMaio, 2009; El-Assi et al., 2017;
Shaheen et al., 2013). We are now facing a new generation of bike sharing, referred to
as the dockless (or station-less) bike-sharing service, which is currently emerging in
China and expanding around the world. Before the existence of the dockless bike-
sharing service, bikes needed to be docked at stations, whereas in this emerging service,
bikes can be unlocked and paid for using a smartphone and can be picked up and left
any authorised parking area at users’ convenience. The first such service was launched
in June 2015 by the start-up company ofo. According to the Research Report on Bike-
sharing Employment (The Centre for Sharing Economy, 2017), released in September
2017 by China’s National Information Centre, the company now has approximately 8
million yellow-framed bikes in more than 170 cities in 9 countries. It has approximately
25 million orders per day and now has 3 billion cumulative orders. The Research Report
also shows that at present, there are approximately 16 million dockless bikes in China
and 50 million orders per day. In addition, the rapid development of this dockless bike-
sharing service has created 100,000 new jobs in China. In particular, 70,000 new jobs
were created in the first half of 2017. Because this bike-sharing service is very new, we
could only find one existing study: Bao et al. (2017) proposed a data-driven approach
to develop bike lane construction plans based on bike trip data, provided by Mobike,
ofo’s main competitor and the world’s largest dockless bike-sharing company.
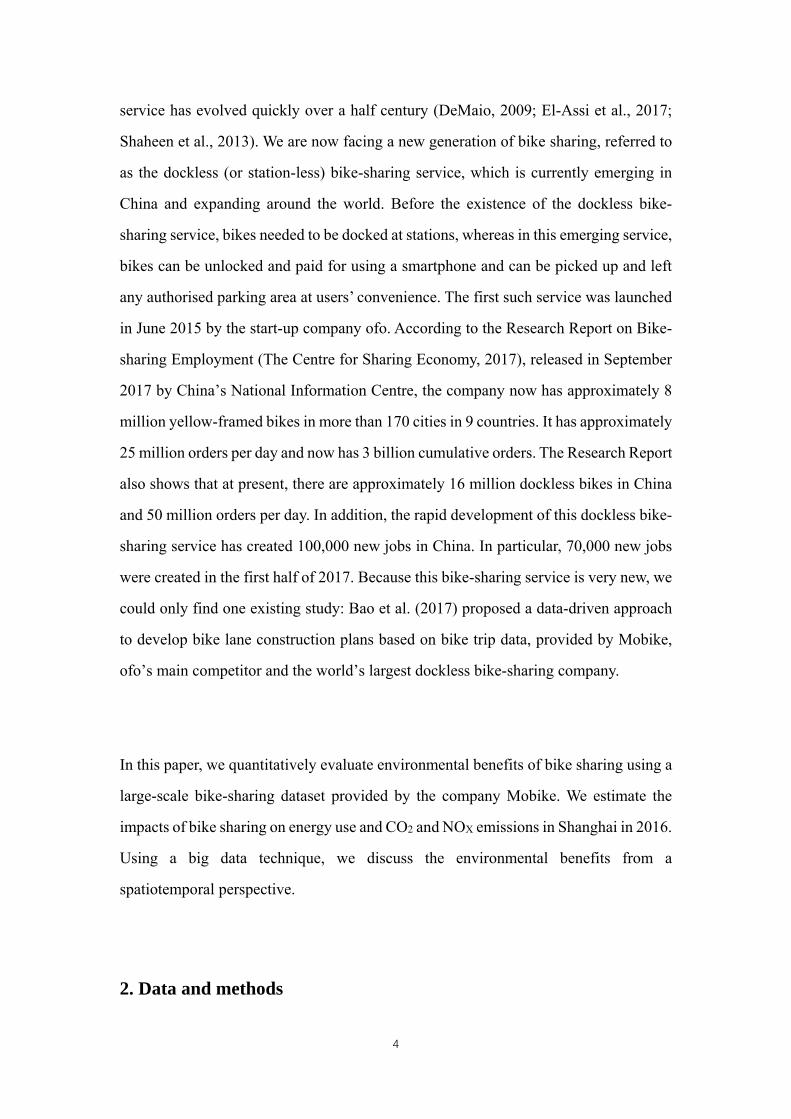
In this paper, we quantitatively evaluate environmental benefits of bike sharing using a
large-scale bike-sharing dataset provided by the company Mobike. We estimate the
impacts of bike sharing on energy use and CO2 and NOX emissions in Shanghai in 2016.
Using a big data technique, we discuss the environmental benefits from a
spatiotemporal perspective.
2. Data and methods

5
2.1 Study area and data
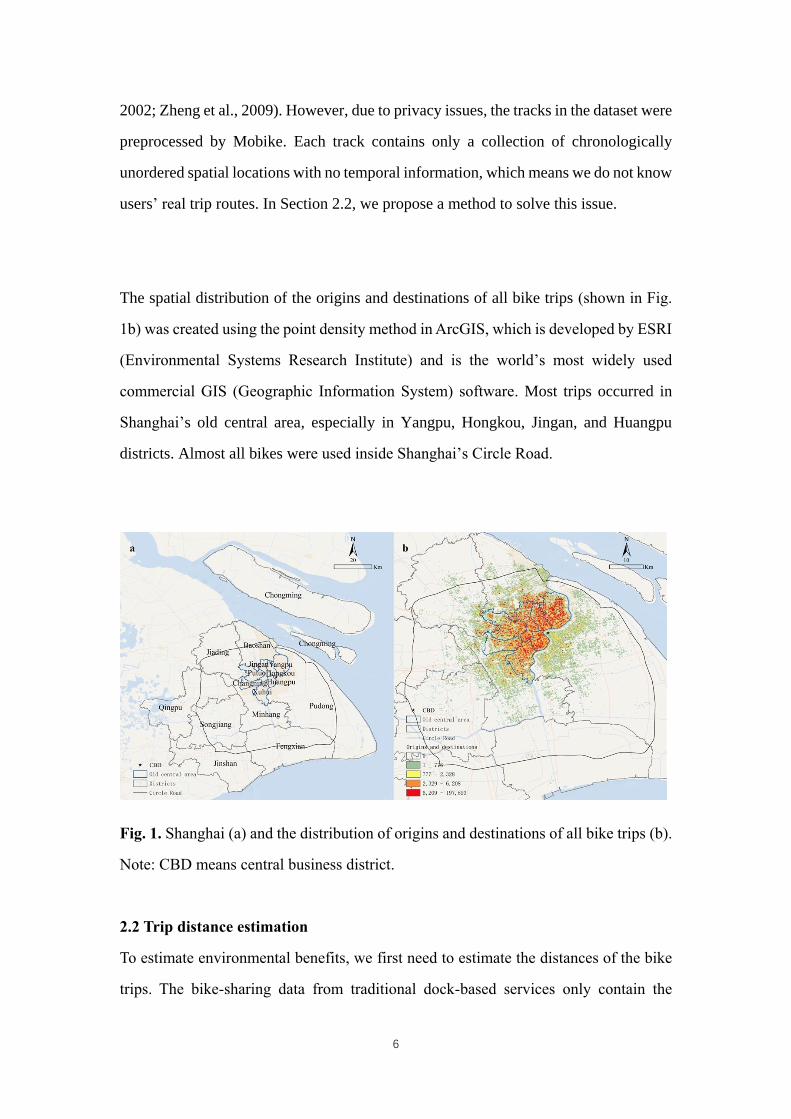
With an area of 6,341 km2 and a population of 24.26 million, Shanghai is one of the
largest cities in the world and China’s economic centre (Fig. 1a). Shanghai’s GDP in
2016 was 2.8 trillion Yuan, accounting for 3.6% of China’s total GDP (National Bureau
of Statistics, 2017). Huangpu, Putuo, Hongkou, Jingan, Changning, Yangpu, and Xuhui
districts are regarded as old central area among Shanghai’s sixteen districts. Lujiazui,
Shanghai’s CBD (central business district), is located in Pudong New District and
adjacent to old central area. Shanghai’s Circle Road is a high-speed road surrounding
the most part of Shanghai City (excluding Chongming district). As of July 2017,
Shanghai had 1.5 million dockless bikes, making it the largest bike-sharing market in
the world (Xinmin Evening News, 2017).
The data used here were obtained from Mobike, which provides ‘a bike-sharing service
to fulfil urban short trips - anytime, to any authorised parking destination - by
combining innovation and today’s IoT (Internet of Things) technology’ (Mobike, 2017).
As of March 2017, Mobike had more than 4 million red-framed bikes in nearly 80 cities
worldwide. The company receives approximately 20 million orders per day, accounting
for 56.56% of the total market, making it the largest dockless bike-sharing company in
the world (Sohu Financial, 2017). The dataset, provided by Mobike, contains
approximately 56.62% of total trip orders in August 2016. In it, there were 1,023,603
orders made by 306,936 users for 17,688 bikes. Each order contains the basic trip
information, namely, the order identification (ID), user ID, bike ID, start time, the
longitude and latitude of the origin, end time, the longitude and latitude of the
destination(s), and track. Each attribute is a column in the dataset. The attribute track
contains the longitudes and latitudes of locations between the start and end locations.
For an N-location track, the format of the column track is ‘longitude1, latitude1#
longitude2, latitude2#.... longitudeN, latitudeN#’. It should be noted that all bikes are
GPS tracked. Therefore, a bike trip can be regarded as a collection of chronologically
ordered GPS points, for example, p1 → p2 → ··· → pn, where each point consists of a
geospatial coordinate set and a time stamp such as p = (x, y, t) (Hornsby and Egenhofer,
6
2002; Zheng et al., 2009). However, due to privacy issues, the tracks in the dataset were
preprocessed by Mobike. Each track contains only a collection of chronologically
unordered spatial locations with no temporal information, which means we do not know
users’ real trip routes. In Section 2.2, we propose a method to solve this issue.
The spatial distribution of the origins and destinations of all bike trips (shown in Fig.
1b) was created using the point density method in ArcGIS, which is developed by ESRI
(Environmental Systems Research Institute) and is the world’s most widely used
commercial GIS (Geographic Information System) software. Most trips occurred in
Shanghai’s old central area, especially in Yangpu, Hongkou, Jingan, and Huangpu
districts. Almost all bikes were used inside Shanghai’s Circle Road.
Fig. 1. Shanghai (a) and the distribution of origins and destinations of all bike trips (b).
Note: CBD means central business district.
2.2 Trip distance estimation
To estimate environmental benefits, we first need to estimate the distances of the bike
trips. The bike-sharing data from traditional dock-based services only contain the

7
longitudes and latitudes of the origin and destination stations. Consequently, the trips
have to be represented as a straight line between the origins and destinations, and the
trip distances are calculated using a Euclidean distance between the origins and
destinations. Considering the bike-sharing data used here also contain the spatial
information of the origin and destination locations, we can also calculate the trip
distance using a Euclidean distance between the origin and destination. However, this
calculation method will underestimate the trip distance. To estimate travel distance
more accurately, we propose a method to estimate the trip distances by utilising the
track information in our dataset.
Assume a chronologically unordered trip 𝑇𝑢 can be represented using a collection of
chronologically unordered 𝑛 locations {𝑙1, 𝑙2, … , 𝑙𝑛 }. 𝑙1 and 𝑙𝑛 are the trip’s origin
and destination, respectively. 𝑙𝑖 (1<i<n) is the spatial location between 𝑙1 and 𝑙𝑛 for
trip 𝑇𝑢. The following method is used to retrieve chronologically ordered trip 𝑇𝑂 from
trip 𝑇𝑢. 𝑇𝑂 is initially set as {}.
1. Append 𝑙1 to 𝑇𝑂, remove 𝑙1 from 𝑇𝑢, and set 𝑙 = 𝑙1;
2. Find 𝑙′s closest location 𝑙𝑐 from 𝑇𝑢;
3. Append 𝑙𝑐 to 𝑇𝑂 and remove 𝑙𝑐 from 𝑇𝑢;
4. If 𝑙𝑐 = 𝑙𝑛, 𝑇𝑂 is the final chronologically ordered trip; however, if 𝑙𝑐 ≠ 𝑙𝑛, set
𝑙 = 𝑙𝑐, and repeat Steps 2-4.
After retrieving the chronologically ordered trip, we can easily calculate its distance by
summing all the distances between the various locations.
2.3 Estimation of vehicle fuels and emissions
We assess the overall energy consumption and environmental impacts associated with
all stages of fuels (Mi et al., 2017b; Yu et al., 2017). The cycle of vehicle fuels can be
divided into two stages: well-to-tank and tank-to-wheels. In this study, we consider
exploitation and distribution for the former stage and combustion for the latter stage.

8
We set a threshold to calculate the number of vehicle kilometres travelled (VKT) and
corresponding fuels saved by bike sharing. If the distance is larger than the threshold,
people prefer to take a taxi; otherwise, people opt for the alternative, i.e., walking. The
energy consumption of a vehicle is calculated as
0, if
=, if
e t
d u
N d pd u
(1)
where N is the energy consumption of the vehicle, d is the distance travelled (unit:
km), p is petrol consumption per unit of distance travelled (unit: L/km), is
density of petrol (unit: kg/L), and u is the threshold. e is the efficiency of petrol
exploitation, and t is the efficiency of petrol transport. The efficiencies of petrol
exploitation and transportation are set as 87% and 95%, respectively (Yu et al., 2017).
Emissions generated from vehicle fuels can be divided into exhaust emissions, such as
CO2, CO, NOX, PM2.5, and PM10, and evaporative emissions, such as hydrocarbon (HC).
In this study, we focus on CO2 and NOX. Emissions generated by vehicle fuel
consumption are calculated as
0, if
if i
i
d uE
d p f d u
(2)
where iE represents emissions from vehicle fuel consumption, and
if represents
emission factors associated with vehicle driving for different types of emissions
(including CO2 and NOX).
In this study, the threshold (u ) was set as 1 km, which means that travel orders with
trip distances longer than 1 km were considered to estimate energy saving and
corresponding emission reduction. The samples used in this study cover a one-month
period in August 2016 for one bike-sharing company (i.e., Mobike). To calculate the
total environmental benefits of bike sharing in Shanghai in 2016, the estimation results
were divided by the sample ratio (i.e., 56.62%), divided by the market shares of the
9
company (i.e., 56.56%), and multiplied by the number of months (i.e., 12). Notably,
Section 3.1 is based on the original sample, i.e., for one month and one company, while
Section 3.2 is based on the processed result that represents environmental benefits for
one year and for all bike-sharing companies.
2.4 Carbon emission inventory construction
We used the Intergovernmental Panel on Climate Change (IPCC) approach (Mi et al.,
2017b) to construct carbon emission inventory at sectoral level for Shanghai city. The
CO2 emissions from fossil fuel use are calculated by
C Y N H O (3)
where C are the CO2 emissions from fossil fuel, Y is the fossil fuel consumption
(in physical unit), N is the net calorific value that represents heat released when unit
fossil fuel is combusting, H is the carbon content that represents CO2 emit when unit
heat is released, and O is the oxygenation that represents oxidization rate of fossil
fuel combustion. The values of net calorific value, carbon content, and oxygenation can
be obtained from Mi et al. (2016).
3. Results and discussion
3.1 Estimated bike trips
After retrieving the chronologically ordered trips, we calculated the distances of all trips.
We deleted those with a distance longer than 50 km or a time duration longer than 10
hours. After this process of data cleaning, we obtained 1,023,529 trips. The estimated
average trip distance was 2.4 km, with a standard deviation of 2.2 km. The total distance
of all bike trips was 2.4 million km. The average travel time was 16.8 minutes, with a
standard deviation of 18.5 minutes. The travel time for all bike trips was equivalent to
32.7 years.
The spatial distribution of all bike trips (shown in Fig. 2) was created using the line
density method in ArcGIS. Some roads with higher densities of bike trips were clearly
observed in the old central area, especially in Yangpu, Hongkou, and Jingan districts.
Considering the high demand of bike usage on these roads, transport planners should

10
give a higher priority in designing them as planned bicycle routes. Fig. 3 shows the
temporal distributions of bike trips using trip start time. The weekdays show a typical
commuting pattern: a higher number of bike trips during peak commuting times
(between 7 and 8 AM and between 17:00 and 18:00 PM). This result can be explained
by the fact that many commuters prefer to use Mobike as a solution for the ‘last mile
problem’. During weekdays, a small peak was observed at 12 noon, which might be
caused by some workers who ride bikes to eating locations near their workplaces. The
evening peak time varied more than the morning peak time, indicating that bike users
have a more flexible time for the end of their daily work. In regard to the weekend
temporal pattern, there is a lower probability distribution of bike trips during peak
commuting times but a higher probability distribution in the evening. This result is
related to more bike trips associated with leisure-related excursions on the weekends,
such as physical exercise or going to parks and shopping malls.
Fig. 2. Spatial distribution of all bike trips.
Note: CBD means central business district.

11
Fig. 3. Temporal distributions of bike trips using trip start time.
3.2 Environmental benefits of bike sharing
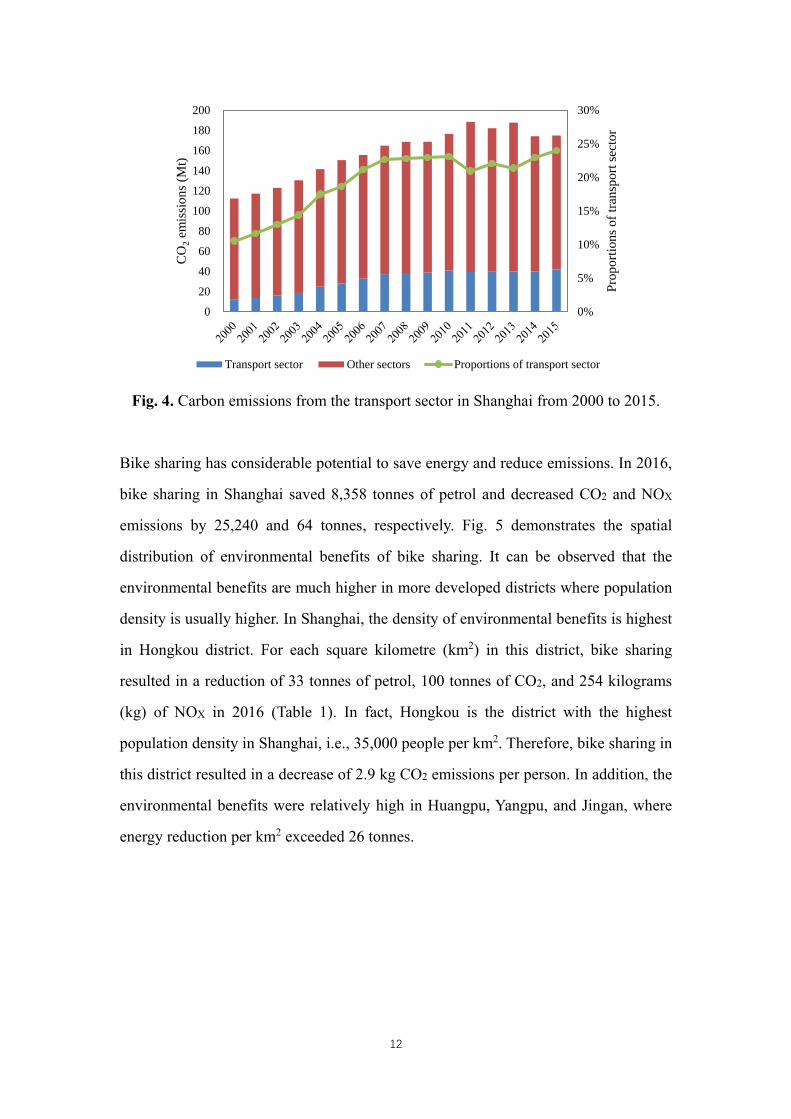
The transport sector contributes substantially to energy consumption and emissions,
especially in developed districts (Mi et al., 2017a, 2017c). As a result of rapid economic
growth and increased consumption, the contribution of the transport sector to total
emissions in Shanghai increased rapidly during the past decades. In 2000, Shanghai’s
transport sector emitted 12 million tonnes (Mt) of CO2 emissions, which accounted for
11% of total emissions. In 2015, CO2 emissions from the transport sector increased to
42 Mt, which accounted for 24% of total emissions (Fig. 4). In 2015, the transport sector
in Shanghai consumed 20% of gasoline, 36% of diesel oil, 96% of fuel oil, and almost
all kerosene.
0
2
4
6
8
10
12
14
0 1 2 3 4 5 6 7 8 9 10 11 12 13 14 15 16 17 18 19 20 21 22 23
Sh
ares
of
trip
s (%
)
Hours across a day
Monday
Tuesday
Wednesday
Thursday
Friday
Saturday
Sunday
12
Fig. 4. Carbon emissions from the transport sector in Shanghai from 2000 to 2015.
Bike sharing has considerable potential to save energy and reduce emissions. In 2016,
bike sharing in Shanghai saved 8,358 tonnes of petrol and decreased CO2 and NOX
emissions by 25,240 and 64 tonnes, respectively. Fig. 5 demonstrates the spatial
distribution of environmental benefits of bike sharing. It can be observed that the
environmental benefits are much higher in more developed districts where population
density is usually higher. In Shanghai, the density of environmental benefits is highest
in Hongkou district. For each square kilometre (km2) in this district, bike sharing
resulted in a reduction of 33 tonnes of petrol, 100 tonnes of CO2, and 254 kilograms
(kg) of NOX in 2016 (Table 1). In fact, Hongkou is the district with the highest
population density in Shanghai, i.e., 35,000 people per km2. Therefore, bike sharing in
this district resulted in a decrease of 2.9 kg CO2 emissions per person. In addition, the
environmental benefits were relatively high in Huangpu, Yangpu, and Jingan, where
energy reduction per km2 exceeded 26 tonnes.
0%
5%
10%
15%
20%
25%
30%
0
20
40
60
80
100
120
140
160
180
200
Pro
po
rtio
ns
of
tran
spo
rt s
ecto
r
CO
2em
issi
on
s (M
t)
Transport sector Other sectors Proportions of transport sector

13
Fig. 5. Spatial distribution of environmental benefits of bike sharing. Sub-figure a, b, and c demonstrate the spatial distribution of energy saving
and CO2 and NOX emission reductions, respectively.
Note: CBD means central business district.

14
Table 1 Environmental benefits of bike sharing in administrative districts in Shanghai.
No. District Area
(km2)
Fuel
(t)
CO2
(t)
NOX
(t)
Fuel per unit area
(kg/km2)
CO2 per unit area
(kg/km2)
NOX per unit area
(kg/km2)
1 Baoshan 301 733 2214 5.6 2433 7348 19
2 Changning 37 409 1236 3.1 10995 33205 84
3 Chongming 1357 0 0 0 0 0 0
4 Fengxian 721 1 3 0 1 4 0
5 Hongkou 23 774 2339 5.9 33087 99921 254
6 Huangpu 20 566 1709 4.3 27609 83379 212
7 Jiading 463 296 893 2.3 638 1928 5
8 Jingan 37 956 2888 7.3 26006 78539 200
9 Jinshan 595 0 0 0 0 0 0
10 Minhang 373 486 1469 3.7 1305 3942 10
11 Pudong 1397 623 1882 4.8 446 1347 3
12 Putuo 55 906 2737 7.0 16330 49317 125
13 Qingpu 668 21 63 0.2 31 94 0
14 Songjiang 605 42 128 0.3 70 212 1
15 Xuhui 55 964 2912 7.4 17478 52784 134
16 Yangpu 61 1579 4769 12.1 26078 78756 200 Shanghai city 6769 8358 25240 64 1235 3729 9

15
From a temporal perspective, there are obvious morning and evening peaks of the
environmental benefits of bike sharing. Fig. 6 demonstrates the temporal distributions
of the reductions in fuel, CO2, and NOX due to bike sharing over a 24-hour period in
Shanghai. It can be observed that the environmental benefits are highest at
approximately 18:00 PM. At this time, bike sharing saved 956 tonnes of petrol and
decreased CO2 and NOX emissions in Shanghai by 2,888 and 7,341 kg tonnes,
respectively. The other peak of environmental benefits was observed at approximately
8:00 AM. This temporal distribution is different from that of car sharing, where morning
peaks are reported to be higher than evening peaks (Yu et al., 2017).
Fig. 6. Temporal distributions of the environmental benefits of bike sharing. The unit
for fuel and CO2 is tonne (t), while the unit for NOX is kilogram (kg).
4. Conclusions and policy implications
We used a big data technique to estimate the environmental benefits of bike sharing in
Shanghai City from spatial and temporal perspectives. Bike sharing in Shanghai saved
8,358 tonnes of petrol and decreased CO2 and NOX emissions by 25,240 and 64 tonnes,
respectively, in 2016. From a spatial perspective, environmental benefits were much
higher in more developed districts in Shanghai where population density is usually

16
higher. The density of environmental benefits was highest in Hongkou district, which
has the highest population density in Shanghai City. From a temporal perspective, there
were obvious morning and evening peaks of the environmental benefits of bike sharing.
The greatest environmental benefits occurred at approximately 18:00 PM followed by
8:00 AM. The findings of this study will be useful for urban transport management,
especially for the transformation of low-carbon transport patterns.
The transport sector contributes substantially to energy consumption and emissions.
The contributions of the transport sector increase with economic development and
lifestyle changes. A sharing economy, such as bike or car sharing, is a potential way to
reduce energy use and emissions in the transport sector. Bike-sharing programmes can
promote the use of bicycles in cities, which has been demonstrated in numerous studies.
As a result, other modes of transport (e.g., private car, taxi, and bus) can be partially
replaced by bicycles, especially for the ‘last mile problem’. Bike sharing is developing
rapidly in many cities worldwide. In China, the use of shared dockless bikes in 2017 is
expected to be approximately threefold higher than that in 2016. Accordingly, bike
sharing will produce more environmental benefits by reducing energy use and
emissions in the transport sector. Besides in China, Currently the dockless bike-sharing
has also emerged in other countries, such as the United Kingdom, Singapore and Japan.
Our study is able to provide a good reference to the implementation of the dockless
bike-sharing service in these countries.
Although this study provides innovative and quantitative estimations of the
environmental benefits of bike sharing, there are several limitations. First, due to the
privacy issue, the bike-sharing data we obtained were preprocessed by Mobike. Each
trip only contained a collection of chronologically unordered spatial locations with no
temporal information. Consequently, we could not accurately retrieve a user’s real
travel route from his/her trip information. In the future, we will attempt to obtain the
original GPS-tracked trip data. Based on this dataset, more accurate trips can be
retrieved by referring to the work of Zheng et al. (2008). Second, there are uncertainties
17
in estimating the environmental benefits of a whole city using data from only one bike-
sharing company (i.e., Mobike in this study). We calculated the total environmental
benefits under the assumption that the environmental benefits correspond to the number
of bikes, i.e., the company, location, and weather were ignored. A more accurate
estimation will be carried out when the related data become available. Third, it will be
meaningful to discuss the relationships between environmental impacts and other socio-
economic factors, such as population, education and prices. These discussions may
make the paper more comprehensive and get more useful policy implications.
References
Annarelli, A., Battistella, C., Nonino, F., 2016. Product service system: A
conceptual framework from a systematic review. J. Clean. Prod. 139,
1011–1032. doi:10.1016/J.JCLEPRO.2016.08.061
Bachand-Marleau, J., Lee, B., El-Geneidy, A., 2012. Better Understanding
of Factors Influencing Likelihood of Using Shared Bicycle Systems
and Frequency of Use. Transp. Res. Rec. J. Transp. Res. Board 2314,
66–71. doi:10.3141/2314-09
Bao, J., He, T., Ruan, S., Li, Y., Zheng, Y., 2017. Planning Bike Lanes based
on Sharing-Bikes’ Trajectories, in: Proceedings of the 23rd ACM
SIGKDD International Conference on Knowledge Discovery and Data
Mining - KDD ’17. ACM Press, New York, New York, USA, pp.
1377–1386. doi:10.1145/3097983.3098056
Beecham, R., Wood, J., Bowerman, A., 2014. Studying commuting

18
behaviours using collaborative visual analytics. Comput. Environ.
Urban Syst. 47, 5–15. doi:10.1016/j.compenvurbsys.2013.10.007
Buck, D., Buehler, R., Happ, P., Rawls, B., Chung, P., Borecki, N., 2013.
Are Bikeshare Users Different from Regular Cyclists? Transp. Res.
Rec. J. Transp. Res. Board 2387, 112–119. doi:10.3141/2387-13
Buehler, R., 2012. Determinants of bicycle commuting in the Washington,
DC region: The role of bicycle parking, cyclist showers, and free car
parking at work. Transp. Res. Part D Transp. Environ. 17, 525–531.
doi:10.1016/j.trd.2012.06.003
Caulfield, B., O’Mahony, M., Brazil, W., Weldon, P., 2017. Examining
usage patterns of a bike-sharing scheme in a medium sized city. Transp.
Res. Part A Policy Pract. 100, 152–161. doi:10.1016/j.tra.2017.04.023
Chen, M., Wang, D., Sun, Y., Liu, C., Bai, Z., 2017. Service Evaluation of
Public Bicycle Scheme from a User Perspective. Transp. Res. Rec. J.
Transp. Res. Board 2634, 28–34. doi:10.3141/2634-04
DeMaio, P., 2009. Bike-sharing: History, impacts, models of provision, and
future. J. Public Transp. 12, 41–56. doi:10.1016/0965-8564(93)90040-
R
El-Assi, W., Salah Mahmoud, M., Nurul Habib, K., 2017. Effects of built
environment and weather on bike sharing demand: a station level
analysis of commercial bike sharing in Toronto. Transportation (Amst).
44, 589–613. doi:10.1007/s11116-015-9669-z

19
Faghih-Imani, A., Eluru, N., El-Geneidy, A.M., Rabbat, M., Haq, U., 2014.
How land-use and urban form impact bicycle flows: Evidence from
the bicycle-sharing system (BIXI) in Montreal. J. Transp. Geogr. 41,
306–314. doi:10.1016/j.jtrangeo.2014.01.013
Forma, I.A., Raviv, T., Tzur, M., 2015. A 3-step math heuristic for the static
repositioning problem in bike-sharing systems. Transp. Res. Part B
Methodol. 71, 230–247. doi:10.1016/j.trb.2014.10.003
Fuller, D., Gauvin, L., Kestens, Y., Daniel, M., Fournier, M., Morency, P.,
Drouin, L., 2011. Use of a new public bicycle share program in
Montreal, Canada. Am. J. Prev. Med. 41, 80–83.
doi:10.1016/j.amepre.2011.03.002
Habib, K.N., Mann, J., Mahmoud, M., Weiss, A., 2014. Synopsis of bicycle
demand in the City of Toronto: Investigating the effects of perception,
consciousness and comfortability on the purpose of biking and bike
ownership. Transp. Res. Part A Policy Pract. 70, 67–80.
doi:10.1016/j.tra.2014.09.012
Hornsby, K., Egenhofer, M.J., 2002. Modeling Moving Objects over
Multiple Granularities. Ann. Math. Artif. Intell. 36, 177–194.
Martens, K., 2007. Promoting bike-and-ride: The Dutch experience.
Transp. Res. Part A Policy Pract. 41, 326–338.
doi:10.1016/J.TRA.2006.09.010
Médard de Chardon, C., Caruso, G., 2015. Estimating bike-share trips
20
using station level data. Transp. Res. Part B Methodol. 78, 260–279.
doi:10.1016/j.trb.2015.05.003
Mi, Z., Meng, J., Guan, D., Shan, Y., Liu, Z., Wang, Y., Feng, K., Wei, Y.-
M., 2017a. Pattern changes in determinants of Chinese emissions.
Environ. Res. Lett. 12, 74003. doi:10.1088/1748-9326/aa69cf
Mi, Z., Meng, J., Guan, D., Shan, Y., Song, M., Wei, Y.-M., Liu, Z.,
Hubacek, K., 2017b. Chinese CO2 emission flows have reversed since
the global financial crisis. Nat. Commun. 8, 1712.
doi:10.1038/s41467-017-01820-w
Mi, Z., Wei, Y.M., Wang, B., Meng, J., Liu, Z., Shan, Y., Liu, J., Guan, D.,
2017c. Socioeconomic impact assessment of China’s CO2 emissions
peak prior to 2030. J. Clean. Prod. 142, 2227–2236.
doi:10.1016/j.jclepro.2016.11.055
Mi, Z., Zhang, Y., Guan, D., Shan, Y., Liu, Z., Cong, R., Yuan, X.C., Wei,
Y.M., 2016. Consumption-based emission accounting for Chinese
cities. Appl. Energy 184, 1073–1081.
doi:10.1016/j.apenergy.2016.06.094
Mobike, 2017. About Mobike. Rrl: https://mobike.com/uk/about.
Mont, O., 2004. Institutionalisation of sustainable consumption patterns
based on shared use. Ecol. Econ. 50, 135–153.
doi:10.1016/J.ECOLECON.2004.03.030
Mont, O.., 2002. Clarifying the concept of product–service system. J.
21
Clean. Prod. 10, 237–245. doi:10.1016/S0959-6526(01)00039-7
National Bureau of Statistics, 2017. China Statistical Yearbook 2017.
China Statistics Press, Beijing.
O’Brien, O., Cheshire, J., Batty, M., 2014. Mining bicycle sharing data for
generating insights into sustainable transport systems. J. Transp. Geogr.
34, 262–273. doi:10.1016/j.jtrangeo.2013.06.007
Ogilvie, F., Goodman, A., 2012. Inequalities in usage of a public bicycle
sharing scheme: Socio-demographic predictors of uptake and usage of
the London (UK) cycle hire scheme. Prev. Med. (Baltim). 55, 40–45.
doi:10.1016/j.ypmed.2012.05.002
Pal, A., Zhang, Y., 2017. Free-floating bike sharing: Solving real-life large-
scale static rebalancing problems. Transp. Res. Part C Emerg. Technol.
80, 92–116. doi:10.1016/j.trc.2017.03.016
Pfrommer, J., Warrington, J., Schildbach, G., Morari, M., 2014. Dynamic
Vehicle Redistribution and Online Price Incentives in Shared Mobility
Systems. IEEE Trans. Intell. Transp. Syst. 15, 1567–1578.
doi:10.1109/TITS.2014.2303986
Piscicelli, L., Cooper, T., Fisher, T., 2015. The role of values in
collaborative consumption: insights from a product-service system for
lending and borrowing in the UK. J. Clean. Prod. 97, 21–29.
doi:10.1016/J.JCLEPRO.2014.07.032
Shaheen, S., Cohen, A., Martin, E., 2013. Public Bikesharing in North
22
America. Transp. Res. Rec. J. Transp. Res. Board 2387, 83–92.
doi:10.3141/2387-10
Shaheen, S., Zhang, H., Martin, E., Guzman, S., 2011. China’s Hangzhou
Public Bicycle. Transp. Res. Rec. J. Transp. Res. Board 2247, 33–41.
doi:10.3141/2247-05
Sohu Financial, 2017. The market share of Mobike is approaching 60%.
url: http://business.sohu.com/20170517/n493354558.shtml.
The Centre for Sharing Economy, 2017. The Research Report on Bike-
sharing Employment.
Wood, J., Slingsby, A., Dykes, J., 2011. Visualizing the dynamics of
London’s bicycle hire scheme. Cartogr. Int. J. Geogr. Inf.
Geovisualization 46, 239–251. doi:10.3138/carto.46.4.239
Xinmin Evening News, 2017. 1.5 millions: Shanghai is facing a rapid
increase of sharing bikes. Xinmin Evening News.
Yu, B., Ma, Y., Xue, M., Tang, B., Wang, B., Yan, J., Wei, Y.M., 2017.
Environmental benefits from ridesharing: A case of Beijing. Appl.
Energy 191, 141–152. doi:10.1016/j.apenergy.2017.01.052
Zaltz Austwick, M., O’Brien, O., Strano, E., Viana, M., 2013. The
Structure of Spatial Networks and Communities in Bicycle Sharing
Systems. PLoS One 8, e74685. doi:10.1371/journal.pone.0074685
Zhang, L., Zhang, J., Duan, Z.Y., Bryde, D., 2015. Sustainable bike-sharing
systems: Characteristics and commonalities across cases in urban
23
China. J. Clean. Prod. 97, 124–133. doi:10.1016/j.jclepro.2014.04.006
Zhang, Y., Thomas, T., Brussel, M., van Maarseveen, M., 2017. Exploring
the impact of built environment factors on the use of public bikes at
bike stations: Case study in Zhongshan, China. J. Transp. Geogr. 58,
59–70. doi:10.1016/j.jtrangeo.2016.11.014
Zheng, Y., Li, Q., Chen, Y., Xie, X., Ma, W.-Y., 2008. Understanding
mobility based on GPS data, in: Proceedings of the 10th International
Conference on Ubiquitous Computing. ACM, pp. 312–321.
Zheng, Y., Zhang, L., Xie, X., Ma, W.-Y., 2009. Mining interesting
locations and travel sequences from GPS trajectories, in: Proceedings
of the 18th International Conference on World Wide Web - WWW ’09.
ACM Press, New York, New York, USA, p. 791.
doi:10.1145/1526709.1526816