ENVIRONMENTAL ASSESSMENT WORKSHEET I … · ASSESSMENT WORKSHEET I-694/ I-494/ I-94 INTERCHANGE ......
56
ENVIRONMENTAL ASSESSMENT WORKSHEET I-694/ I-494/ I-94 INTERCHANGE IMPROVEMENTS MnDOT proposes an unbonded concrete overlay on I-694 from 10th Street to I-94, I- 494 from Tamarack Road to I-94, replacement of I-94 bridges, and reconstruction of all the loops in the interchange. The roadway needs to be reconstructed to improve mobility and capacity, pavement condition and road safety. This document is available in alternative formats upon request. Please contact Ryan Coddington at 651- 234-7611 or [email protected] April 2018
Transcript of ENVIRONMENTAL ASSESSMENT WORKSHEET I … · ASSESSMENT WORKSHEET I-694/ I-494/ I-94 INTERCHANGE ......

ENVIRONMENTAL ASSESSMENT
WORKSHEET I-694/ I-494/ I-94 INTERCHANGE
IMPROVEMENTS
MnDOT proposes an unbonded concrete overlay on I-694 from 10th Street to I-94, I-494 from Tamarack Road to I-94, replacement of I-94 bridges, and reconstruction of all the loops in the interchange. The roadway needs to be reconstructed to improve
mobility and capacity, pavement condition and road safety.
This document is available in alternative formats upon request. Please contact Ryan Coddington at 651- 234-7611 or [email protected]
April 2018


Contents Environmental Assessment Worksheet ................................................................................. 1
EAW Items 1-4 ..............................................................................................................................1 Project title: SP 8286-81 (I-694/I-494/I-94) Pavement Improvements, Bridge Replacement, Auxiliary Lane Addition, and Interchange Ramp Reconstruction .............................................................................................. 1 Proposer: RGU: ......................................................................................................................................... 1 Reason for EAW Preparation: (check one) ........................................................................................................ 1
EAW Item 5 ..................................................................................................................................2 Project Location: ................................................................................................................................................. 2
EAW Item 6 ..................................................................................................................................2 Project Description: ............................................................................................................................................ 2
EAW Item 7 ................................................................................................................................ 12 Cover types: Estimate the acreage of the site with each of the following cover types before and after development: ................................................................................................................................................... 12
EAW Item 8 ............................................................................................................................... 12 Permits and approvals required: ...................................................................................................................... 12
EAW Item 9 ................................................................................................................................ 14 Land use:........................................................................................................................................................... 14
EAW Item 10 – ........................................................................................................................... 17 Geology, soils and topography/land forms: ..................................................................................................... 17
EAW Item 11 .............................................................................................................................. 19 Water resources: .............................................................................................................................................. 19
EAW Item 12 .............................................................................................................................. 27 Contamination/Hazardous Materials/Wastes: ................................................................................................. 27
EAW Item 13 .............................................................................................................................. 30 Fish, wildlife, plant communities, and sensitive ecological resources (rare features): .................................... 30
EAW Item 14 .............................................................................................................................. 32 Historic properties: ........................................................................................................................................... 32
EAW Item 15 .............................................................................................................................. 32 Visual: ............................................................................................................................................................... 32
EAW Item 16 .............................................................................................................................. 33 Air: .................................................................................................................................................................... 33
EAW Item 17 .............................................................................................................................. 36 Noise ................................................................................................................................................................. 36 Construction Noise ........................................................................................................................................... 36 Traffic Noise Analysis ........................................................................................................................................ 37
EAW Item 18 .............................................................................................................................. 40 Transportation .................................................................................................................................................. 40
EAW Item 19 .............................................................................................................................. 44 Cumulative potential effects: ........................................................................................................................... 44
EAW Item 20 .............................................................................................................................. 48
Other potential environmental effects: ........................................................................................................... 48
RGU CERTIFICATION ...................................................................................................................49

S P : 8 2 8 6 - 8 1 I 4 9 4 / 6 9 4 / 9 4 E A W A P R I L 2 0 1 8
Environmental Assessment Worksheet This Environmental Assessment Worksheet (EAW) form and EAW Guidelines are available at the Environmental Quality Board’s website at: http://www.eqb.state.mn.us/EnvRevGuidanceDocuments.htm. The EAW form provides information about a project that may have the potential for significant environmental effects. The EAW Guidelines provide additional detail and resources for completing the EAW form.
Cumulative potential effects can either be addressed under each applicable EAW Item, or can be addresses collectively under EAW Item 19.
Note to reviewers: Comments must be submitted to the RGU during the 30-day comment period following notice of the EAW in the EQB Monitor. Comments should address the accuracy and completeness of information, potential impacts that warrant further investigation and the need for an EIS.
EAW Items 1-4 Project title: SP 8286-81 (I-694/I-494/I-94) Pavement Improvements, Bridge Replacement, Auxiliary Lane Addition, and Interchange Ramp Reconstruction
Proposer: RGU:
Ryan Coddington Rick Dalton 1500 County Road B2 1500 County Road B2 Roseville, MN 55113 Roseville, MN 55113 Office: 651-234-7714 Office: 651-234-7677 [email protected] [email protected]
Reason for EAW Preparation: (check one)
Required: Discretionary: EIS Scoping Citizen petition Mandatory EAW RGU discretion
Proposer initiated If EAW or EIS is mandatory, give EQB rule category subpart number(s) and name(s): 4410.4300 subp 22 Highway Projects, (B): Construction of additional travel lanes on an existing road for a length of one or more miles.
1 | P a g e
S P : 8 2 8 6 - 8 1 I 4 9 4 / 6 9 4 / 9 4 E A W A P R I L 2 0 1 8
EAW Item 5 Project Location:
County: Washington County
City/Township: Oakdale and Woodbury
PLS Location (Section, Township, Range):
Section: Township: Range:
5 28 21
32 29 21
Watershed (81 major watershed scale): Major Watershed 20 (Mississippi River – Twin Cities), Minor Watershed – Battle Creek (HUC 12 = 070102060804). Ramsey-Washington Metro Watershed District
GPS Coordinates: N/A
Tax Parcel Number: N/A
EAW Item 6 Project Description: a. Provide the brief project summary to be
published in the EQB Monitor, (approximately 50 words).
MnDOT proposes an unbonded concrete overlay on I-694 from 10th Street south to I-94, I-494 from Tamarack Road north to I-94, replacement of I-94 bridges, replacement of all the interchange loops, and reconfiguration of ramps to eastbound I-94.
2 | P a g e
S P : 8 2 8 6 - 8 1 I 4 9 4 / 6 9 4 / 9 4 E A W A P R I L 2 0 1 8
b. Give a complete description of the proposed project and related new construction, including infrastructure needs. If the project is an expansion include a description of the existing facility. Emphasize: 1) construction, operation methods and features that will cause physical manipulation of the environment or will produce wastes, 2) modifications to existing equipment or industrial processes, 3) significant demolition, removal or remodeling of existing structures, and 4) timing and duration of construction activities.
Pro pos ed p ro j ec t an d re l a te d n ew co ns t r uc t io n :
The proposed project includes the interchange of three interstate freeways located in Washington County along I-694 from the 10th Street Interchange south to I-94 and along I-494 from the Tamarack Road Interchange north to I-94, a total distance of about 1.9 miles. The project area is depicted in Figures A-1 and A-2 in Appendix A. The proposed project also includes replacement of two bridges and replacement of all of the loops within the I-694/ I-494/ I-94 Interchange. The existing I-694/ I-494 freeway from the 10th Street Interchange to the Tamarack Road Interchange accommodates 2 through lanes in each direction. See Figures A-3 through A-6 in Appendix A for project layout and aerial imagery.
I-694 serves as a major northern bypass of the Twin Cities metro area. I-494 serves as a major southern bypass of the Twin Cities metro area. I-94, locally an east-west route, connects Wisconsin with Minnesota and the downtown areas of St. Paul and Minneapolis. All interstate freeways in the project area are classified as Principal Arterials.
The proposed project is in the early stages of final design. The project includes the following elements (See Figures A-3 through A-6 in Appendix A for project layout and aerial imagery):
Accommodate three (3) through lanes and one (1) auxiliary lane on southbound I-494 between the Tamarack Road Interchange and the I-694/ I-494/ I-94 Interchange.
Accommodate three (3) through lanes and one (1) auxiliary lane on northbound I-494 between the Tamarack Road Interchange and the I-694/ I-494/ I-94 Interchange.
Accommodate two (2) through lanes and one (1) auxiliary lane on northbound I-694 between the I-694/ I-494/ I-94 Interchange and the 10th Street Interchange.
Accommodate two (2) through lanes and one (1) auxiliary lane on southbound I-694 between the 10th Street Interchange and I-694/ I-494/ I-94 Interchange.
Replace southbound bridge over I-94 (Bridge #82831) and northbound bridge over I-94 (Bridge #82832) including widening and elevating both bridge decks.
Accommodate buffer lanes on I-494 and I-694 within the I-94 Interchange to improve mobility and safety of merge and weave maneuvers while navigating the interchange loops.
Reconstruct the southwest loop of the I-694/ I-494/ I-94 Interchange to make the radius of curvature more consistent and improve safety.
3 | P a g e

S P : 8 2 8 6 - 8 1 I 4 9 4 / 6 9 4 / 9 4 E A W A P R I L 2 0 1 8
Improve pavement condition and extend pavement life with an unbonded concrete overlay and full depth reclamation for the majority of the I-494/ I-694 roadway segment between the 10th Street Interchange and the Tamarack Road Interchange.
1. The portion of the project that proposes constructing a new auxiliary lane will consist of removing the existing shoulder pavement and/or topsoil, excavating material from under proposed pavement widening areas, placing and compacting material for new roadway embankments. It is anticipated that the material excavated on the project will be re-used for overlay, aggregate or embankment purposes where appropriate and in accordance with best management practices established in MnDOT’s Standard Specifications for Construction. Similar construction activities and management practices will occur with the reconfiguration of the southwest I-694/ I-494/ I-94 interchange loop.
2. This project does not modify equipment or industrial processes.
3. The proposed project includes the replacement of two bridges; the northbound and southbound I-494/I-694, respectively, bridges #82832 and #82831.
4. The project letting is planned for September 28, 2018. Construction is expected to begin in March 2019 and end in November 2019.
In order to maintain traffic operations during construction, traffic staging will be accomplished with several proposed cross-overs, turn-arounds and detours for local, northbound through traffic and southbound through traffic. In general, temporary preparatory earthwork for southbound bridge and turn arounds would be accomplished from November 2018 through April 2019. Southbound bridgework and pavement work would be completed within the period from March 2019 to November 2019. From November 2019 through April 2020, construction would be closed for the winter season and traffic would flow normally. Between April 2020 and November 2020, northbound bridgework and pavement work would be completed. Local ramp pavement work would be completed between April 2021 and June 2021.
c. Project magnitude:
Table 1: Project Magnitude Total Project Acreage 63.58 acres Linear project length 1.9 miles Number and type of residential units N/A Commercial building area (in square feet) N/A Industrial building area (in square feet) N/A Institutional building area (in square feet) N/A Other uses – specify (in square feet) N/A Structure height(s) N/A
4 | P a g e

S P : 8 2 8 6 - 8 1 I 4 9 4 / 6 9 4 / 9 4 E A W A P R I L 2 0 1 8
d. Explain the project purpose; if the project will be carried out by a governmental unit, explain the need for the project and identify its beneficiaries.
The needs of the project area are described in detail in this section and are focused on bridge condition, mobility and pavement condition.
The purpose of the project is to address deficiencies of Bridge #82831 and #82832 with respect to bridge service life and current and forecast mobility issues. Also addressed with this project are mobility and safety issues on I-694 and I-494 between interchanges and merging and weaving issues within project area interchanges. The project purpose also is to address geometric issues on the southwest loop of the I-694/I-494/I-94 interchange which have been a factor in a high incidence of truck roll over crashes. Pavement condition on I-694, I-494 and portions of interchanges will be addressed in order to extend the roadway service life and improve mobility and the driver experience.
The beneficiaries of this project will be the driving and commuting public, emergency services, and commercial facilities which rely on efficient delivery of truck-transported goods and services.
Br idg e Co nd i t i o n
Two bridges within the project area (northbound and southbound over I-94), both are of a 4-span steel girder design, are nearing the end of their design life. State and Federal rating guideline systems have been developed to aid in the inspection of concrete superstructures. The two major rating guideline systems currently in use are the FHWA's Recording and Coding Guide for the Structural Inventory and Appraisal of the Nation's Bridges used for the National Bridge Inventory (NBI) and the AASHTO Guide Manual for Bridge Element Inspection for element level condition state assessment. Methods of bridge assessment are briefly summarized below followed by assessment data for project area bridges.
The NBI is one tool for identifying deficiencies, however this rating is a general overall condition of the bridge and is typically not used for specific localized problems that a bridge could have. Component condition rating codes used in the NBI range from 9 to 0, where 9 is the best rating possible and 0 is the worst. When the NBI condition rating of the deck, superstructure or substructure is 5 or less MnDOT begins the process to determine whether a re-deck or complete bridge replacement is the best cost effective investment. The NBI ratings for Bridges # 82832 and #82831 are summarized in Table 3.
Table 2: Bridges #82832 and 828321 Condition Ratings Bridge
ID Location Year Built Bridge Type NBI Condition Rating
82832 I-694 northbound over I-94
1966 4-span CSTL Beam Span with a reinforced concrete deck
Deck: 4 Substructure: 5 Chan: N Culv: N
5 | P a g e

S P : 8 2 8 6 - 8 1 I 4 9 4 / 6 9 4 / 9 4 E A W A P R I L 2 0 1 8
Bridge ID Location Year Built Bridge Type NBI Condition
Rating 82831 I-694
southbound over I-94
1966 4-span CSTL Beam Span with a reinforced concrete deck
Deck: 4 Substructure: 5 Chan: N Culv: N
Table Notes: *The following general component condition rating guidelines (obtained from the 1995 edition of the FHWA Coding Guide) are to be used in the evaluation of the deck (Item 58), superstructure (Item 59), and substructure (Item 60): Code Description 9 EXCELLENT CONDITION 8 VERY GOOD CONDITION ‐ no problems noted. 7 GOOD CONDITION ‐ some minor problems. 6 SATISFACTORY CONDITION ‐ structural elements show some minor deterioration. 5 FAIR CONDITION ‐ all primary structural elements are sound but may have minor section loss, cracking, spalling, or scour. 4 POOR CONDITION ‐ advanced section loss, deterioration, spalling, or scour. 3 SERIOUS CONDITION ‐ loss of section, deterioration, spalling, or scour have seriously affected primary structural components. Local failures are possible. Fatigue cracks in steel or shear cracks in concrete may be present. 2 CRITICAL CONDITION ‐ advanced deterioration of primary structural elements. Fatigue cracks in steel or shear cracks in concrete may be present or scour may have removed substructure support. Unless closely monitored it may be necessary to close the bridge until corrective action is taken. 1 “IMMINENT” FAILURE CONDITION ‐ major deterioration or section loss present in critical structural components, or obvious vertical or horizontal movement affecting structure stability. Bridge is closed to traffic but corrective action may put bridge back in light service. 0 FAILED CONDITION ‐ out of service; beyond corrective action. The component condition rating guidelines presented above are general in nature and can be applied to all bridge components and material types.
The Bridge Replacement and Improvement Management (BRIM) process was developed by MnDOT to prioritize and plan bridge improvements and replacement and incorporate risk assessment. A component of BRIM is the Bridge Planning Index (BPI) which assesses condition of the deck, superstructure, substructure, age, traffic volume and other factors. Based on these factors the BPI ranges from 0 (highest priority) to 100 (lowest priority) for improvement or replacement.
Bridge No. 82832 (I-694 northbound over 94):
Built in 1966, this bridge is 52 years old. The bridge is a two-lane bridge with four spans. The Bridge is a Continuous Steel (CSTL) Beam Span with a reinforced concrete deck. The total length of the structure is 270.4 feet, with a main span length of 90.9 feet. The Cast-In-Place (C-I-P) concrete deck is 49.3 feet in length.
The bridge deck was replaced in 1984. The bridge shows signs of deterioration and is nearing the end of its designed life. When inspected the BPI Rank was 27 (relatively high priority for improvement or replacement), the Deck NBI rating was five, a fair condition, with spalled concrete and exposed rebar. Experience with similar structures that have epoxy coated reinforcing in the top mat and black or uncoated reinforcing in the bottom mat has shown that once deterioration starts, it progresses quickly in the underside of concrete decks.
Bridge No. 82831 (I-694 southbound over 94):
6 | P a g e

S P : 8 2 8 6 - 8 1 I 4 9 4 / 6 9 4 / 9 4 E A W A P R I L 2 0 1 8
Built in 1966, the bridge is 52 years old. The bridge is a two-lane bridge with four spans. The Bridge is a CSTL Beam Span with a reinforced concrete deck. The total length of the structure is 270.4 feet, with a main span length of 90.9 feet. The C-I-P concrete deck is 49.3 feet in width.
The bridge deck was replaced in 1984. The bridge shows signs of deterioration and is nearing the end of its design life. When inspected the BPI Rank was 30 (relatively high priority for improvement or replacement), the Deck NBI rating was 5, a fair condition, with spalled concrete and exposed rebar. Experience with similar structures that have epoxy-coated reinforcing in the top mat and black or uncoated reinforcing in the bottom mat has shown that once deterioration starts, it progresses quickly in the underside of concrete decks.
Address High Incidence of Rollover Crashes On the southbound I-694 to eastboundI-94 loop:
The design of the southbound I-694 to eastbound I-94 loop is such that there have been several truck rollover crashes on the loop. The southwest loop ramp has on average roughly two truck rollover crashes a year over a 20 year period1. The rollovers on the loop can be attributed to heavy truck volumes, excessive speeds and a ramp that has several curve radius changes.
Mobility and Capacity:
I-694, I-494 and I-94 are heavily traveled interstates within the project limits. The primary freight route is on I-694 north around the Twin Cities.
The traffic volumes are such that according to MnDOT’s Metropolitan Freeway System 2016 Congestion Report2, segments of all three interstates experience traffic congestion during either the peak morning or peak afternoon periods within the project limits.
Table 4 below, summarizes metro traffic congestion for the three interstates in 2016 (existing condition).
Table 3: 2016 Metro Freeway Congestion within Project Limits
Location Morning 5:00-10:00AM
Afternoon 2:00-7:00PM
I-694 (southbound) <1 hour No recurring congestion I-694 (northbound) No recurring congestion 1-2 hours I-94 (eastbound) No recurring congestion <1 hour
1 Crash data derive from the MnDOT Oracle Business Intelligence Tool for Crash Data and the MnDOT Crash Data Toolkit.
2 MnDOT’s Metropolitan Freeway System 2016 Congestion Report (published May 2017), viewed on 01/17/2018. Congestion is defined as traffic flowing at speeds less than or equal to 45 miles per hour. This definition does not include delays that may occur at speeds greater than 45 miles per hour. The 45 miles per hour speed limit was selected since it is the speed where “shock waves” can propagate. These conditions also pose higher risks of crashes. Although shock waves can occur above 45 MPH there is a distinct difference in traffic flow above and below the 45 miles per hour limit.
7 | P a g e

S P : 8 2 8 6 - 8 1 I 4 9 4 / 6 9 4 / 9 4 E A W A P R I L 2 0 1 8
Location Morning 5:00-10:00AM
Afternoon 2:00-7:00PM
I-94 (westbound) No recurring congestion No recurring congestion I-494 (southbound) No recurring congestion <1 hour I-494 (northbound) No recurring congestion <1 hour
Table 5, below, summarizes traffic volumes on the three highways in 2016 (existing condition) and the traffic volumes forecast to year 2040 applicable to the No Build alternative and the Preferred Alternative.
Table 4: 2016 Existing and Forecast Traffic Volumes within Project Limits Location Existing (2016) AADT Forecast (2040) AADT
I-694 92,800 113,170 I-94 92,300-113,930 122,700-153,930 I-494 101,400 123,080
Table notes: 1. AADT is average annual daily traffic. 2. The 2016 traffic volumes taken from CORSIM Traffic Operations Analysis. See Appendix C – Traffic Operations Analysis for
additional information. 3. 2040 AADT traffic volumes are based on annual growth rate of 0.81%/year. 4. AADT includes combined traffic volumes in both directions.
Freeway traffic volume models (CORSIM, version 6.3) for the a.m. peak period were constructed for year 2016 existing conditions and forecast to 2040 (some analyses forecast to 2030) for the subject project area.3 The following Exhibit 2 illustrates the modeling limits which consist of the following segments:
I-94: White Bear Avenue to just west of Lake Elmo Avenue North
I-494/I-694: Carver Road (I-494) to Stillwater Road/ Boulevard (I-694)
3 Upon request to the Project Manager: Draft Memorandum I-94/I-494/I-694 Interchange Modeling and Interstate Access Request S.P. 8286-81 Submittal of Existing Conditions Calibrated Model, SRF Consulting Group, Memo Dated February, 2017 (SRF No. 010710168) and Final Memorandum dated January 2018
8 | P a g e

S P : 8 2 8 6 - 8 1 I 4 9 4 / 6 9 4 / 9 4 E A W A P R I L 2 0 1 8
Figure 1: CORSIM Traffic Modeling Limits
This CORSIM microsimulation model was created to better understand the existing (2016) and future (some analyses forecast to 2030 and others to 2040) traffic operation problems along I-94/I-694/I-494. Operation conditions are commonly measured as Level of Service (LOS) and Average Annual Daily Traffic (AADT). LOS is a grading system ranging from A to F, which describes the range of congestion on the freeway. The LOS for freeway segments is based on vehicle density, measured in vehicles per lane per hour. An overall LOS is also provided which is an average of all subject lanes. Freeways maintain higher speeds at lower densities (e.g., LOS A to C). As densities increase to LOS E and F, speeds decrease and fluctuate greatly.
Table 6 summarizes LOS results of the existing (No-Build Alternative 2016) CORSIM modeling for northbound and southbound I-494/ I-694.
9 | P a g e

S P : 8 2 8 6 - 8 1 I 4 9 4 / 6 9 4 / 9 4 E A W A P R I L 2 0 1 8
Table 5: No-Build Existing (2016) and Forecast (2030) Level of Service (LOS) Roadway Segment Existing (2016) AM
Peak Hour Forecast (2030) No-Build
AM Peak Hour
Eastbound I-94 Ruth Street to McKnight Road B B
McKnight Road to Century Avenue B B Century Avenue to I-494/I-694 Interchange
A A
I-494/I-694 Interchange to Radio Drive
B B
Radio Drive to Woodbury Drive B B
Westbound I-94 Woodbury Drive to Radio Drive E F
Radio Drive to I-494/I-694 Interchange
C C
I-494/I-694 Interchange to Century Avenue
C C
Century Avenue to McKnight Road C C McKnight Road to Ruth Street C D
Northbound I-494/I-694 Lake Road to Valley Creek Road B C
Valley Creek Road to Tamarack Road
B E
Tamarack Road to I-94 Interchange B F Loop-to-Loop Weave C D I-94 Interchange to 10th Street C C North of 10th Street D E
Southbound I-694/I-494 North of 10th Street C F
10th Street to I-94 Interchange F F Loop-to-Loop Weave E F I-94 Interchange to Tamarack Road C C Tamarack Road to Valley Creek B C Valley Creek Road to Lake Road B C
10 | P a g e

S P : 8 2 8 6 - 8 1 I 4 9 4 / 6 9 4 / 9 4 E A W A P R I L 2 0 1 8
The poor operations summarized in Table 6 and depicted in Figure 1 for westbound I-94 are caused by lack of capacity on the mainline along with merging issues at local access interchanges. The poor operations identified on southbound I-694 are caused by merging issues at local access interchanges and weaving issues at the system interchange.
The poor operations summarized in Table 6 and depicted in Figure 1 for eastbound I-94 are caused by merging issues at local access interchanges. Poor operations on northbound and southbound I-494/I-694 are caused by merging issues at local access interchanges and weaving issues at the system interchange.
The results of the existing conditions CORSIM models are consistent with current operations identified in MnDOT’s Metropolitan Freeway System 2016 Congestion Report (published May 2017).
Pavement Condition:
The roadway pavement on I-494 and I-694 between 10th Street and Tamarack was last re-surfaced in 2009/2010. The segment of I-694 (northbound and southbound) north of the central portion of the 10th Street Interchange (north of station marker ~755+24) was resurfaced with an unbonded concrete overlay in 2010 as part of SP 8286-64. The segment of I-494 (northbound) from the central portion of the Tamarack Road interchange south to the southern project terminus was resurfaced with an unbonded concrete overlay in 2009 under SP 8285-94 and SP 8285-93.
The section of I-694 from just south of 10th Street south to the I-694/ I-494/ I-94 interchange was constructed as a mill and overlay with bituminous in 2009 with anticipation of major work on the interchange in 2019. There were two unbonded concrete overlay projects on I-494 with SP 8285-94 and 8285-93 (2009) but these projects terminated at Tamarack Road, the pavement portion south of this terminus became a mill and overlay with anticipation of major work at the interchange.
MnDOT uses four indices for reporting pavement conditions. Each index describes a different aspect of pavement condition. MnDOT uses the indices to rank existing pavement sections and predict the need for future maintenance and rehabilitation. The proposed pavement work will improve the ride quality and extend the life of the driving surface.
11 | P a g e

S P : 8 2 8 6 - 8 1 I 4 9 4 / 6 9 4 / 9 4 E A W A P R I L 2 0 1 8
e. Are future stages of this development including development on any other property planned or likely to happen? ☐ Yes ☒ No
If yes, briefly describe future stages, relationship to present project, timeline and plans for environmental review.
f. Is this project a subsequent stage of an earlier project? ☐ Yes ☒ No
If yes, briefly describe the past development, timeline and any past environmental review.
EAW Item 7 Cover types: Estimate the acreage of the site with each of the following cover types before and after development:
Table 6: Cover Types
Cover Type Before Acres
After Acres
Wetlands 1.68 1.49 Wetland Ditches (Army Corps and/ or WCA 1
jurisdictional) 0.14 0.08
Deep water/streams 0.00 0.00 Wooded/forest 0.00 0.00 Brush/Grassland 0.00 0.00 Cropland 0.00 0.00 Lawn/landscaping 24.12 23.11 Impervious surface 37.36 38.66 Stormwater Pond 2 0.29 0.29 Other: Stormwater ditches 0.00 0.00 Totals 63.58 63.58
Table Notes: 1. Minnesota Wetland Conservation Act 2. Total stormwater pond acreage pre and post construction is 0.29 acres. Additional storm water treatment will be accomplished
through upland infiltration adjacent to two existing stormwater ponds within the project area. Earthwork will not occur within existing stormwater ponds. For purposes of this EAW, conversion of upland mowed areas within interchange loops to upland infiltration is not considered to be a cover type change.
EAW Item 8 Permits and approvals required: List all known local, state and federal permits, approvals, certifications and
financial assistance for the project. Include modifications of any existing permits, governmental review of plans and all direct and indirect forms of public financial assistance including bond guarantees, Tax Increment Financing and infrastructure. All
12 | P a g e

S P : 8 2 8 6 - 8 1 I 4 9 4 / 6 9 4 / 9 4 E A W A P R I L 2 0 1 8
of these final decisions are prohibited until all appropriate environmental review has been completed. See Rules, Chapter 4410.3100.
Table 7: Permits and Approvals
Unit of government Type of application
Current Status
To
be re
ques
ted
Req
uest
ed
Com
plet
ed
Federal FHWA Categorical Exclusion determination X MnDOT CRU on behalf of FHWA
Section 106 (Historic / Archeological) determination X
MnDOT OES on behalf of FHWA
Endangered Species Act Section 7 determination X
U.S. Corps of Engineers
Section 404 permit X
State MnDOT Environmental Assessment Worksheet
document X
Minnesota Pollution Control Agency
National Pollutant Discharge Elimination System (NPDES) - Construction Storm Water Phase II Permit MPCA 401 Certification
X
MnDOT Wetland Conservation Act - (Replacement Plan) X
Local Ramsey – Washington Metro Watershed District
Watershed District Permit X
13 | P a g e
S P : 8 2 8 6 - 8 1 I 4 9 4 / 6 9 4 / 9 4 E A W A P R I L 2 0 1 8
EAW Item 9 Land use:
a . De sc r ib e :
i. Existing land use of the site as well as areas adjacent to and near the site, including parks, trails, prime or unique farmlands.
Existing Land Use
Land use adjacent to the northern portion of the project area (between the 10th Street Interchange and the I-694/ I-494/ I-94 Interchange) is a mixture of retail and other commercial, mixed use industrial, and smaller components of office, industrial and utility and mixed use commercial. Undeveloped land is present adjacent to the northwest quadrant of the I-694/ I-494/ I-94 interchange with small tracts scattered throughout the spaces between development. A small tract of single family residential (detached garages) is present adjacent to the northeast quadrant of the I-694/ I-494/ I-94 interchange.
Land use adjacent to the southern portion of the project area, from the main interchange south to the Tamarack Road Interchange, has a large component of undeveloped land and office, with smaller components of retail and other commercial, industrial / utility land and park/ recreational/ preserve land.
Land uses within and near the project area depicted in Figure A-7 (Appendix A).
Prime or Unique Farm Lands
There are no prime or unique farmlands in or adjacent to the project area.
Parks and Recreation Areas
The westernmost extension of The Tamarack Nature Preserve, operated by the City of Woodbury, is located between I-494 and Beilenberg Drive south of Tamarack Road.
Conclusions
The proposed project would not impact nor require any temporary easements associated with parks, preserves and recreational areas. No adverse effects are anticipated for the recreation and open space resources.
14 | P a g e
S P : 8 2 8 6 - 8 1 I 4 9 4 / 6 9 4 / 9 4 E A W A P R I L 2 0 1 8
ii. Plans. Describe planned land use as identified in comprehensive plan (if available) and any other applicable plan for land use, water, or resources management by a local, reg ional, state, or federal agency.
The proposed land use for the portion of the project area in Woodbury, projected to 2040, as described and depicted in the city comprehensive plan, is “Gateway” and “Places to Work”, nearly identical to the existing land use.
The proposed future land use for the portion of the project area in Oakdale (projected year undefined), as described and depicted in the city comprehensive plan is largely “Industrial/ Office”, “Office/ Limited Business” and “Commercial” with a smaller component of “Open Space”.
The Helmo Avenue North Residential Development is proposed to be located on the north side of I-94 and several hundred feet east of the main interchange, between Helmo Avenue North and Ideal Avenue North. The City of Oakdale is planning for development of this high density residential area on a 56.9-acre site with up to 810 units of multi-family residential units, 360,000 square feet of office and 50,000 square feet of retail.
The roadway improvements associated with the subject project are consistent with the future land use plans of the cities of Oakdale and Woodbury.
iii. Plans. Zoning, including special districts or overlays such as shoreland, floodplain, wild and scenic rivers, critical area, agricultural preserves, etc.
Zoning
The City of Woodbury (south of I-94) updated its zoning mapping in December, 2017. Areas adjacent to the Tamarack Road Interchange are zoned as “Gateway District”. The area adjacent to the southeast quadrant of the main interchange is zoned as “Office Park District”. The area adjacent to the southwest quadrant of the main interchange is zoned as “Business Campus District”.
The City of Oakdale, MN (north of I-94) updated its zoning mapping in November 2017. Areas near the 10th Street Interchange, east and west of I-694, are zoned as “Community Commercial”. Much of the land between the 10th Street Interchange and the main interchange, east and west of I-694, is zoned as “Industrial/ Office”. Areas adjacent to the northwest quadrant of the main interchange is zoned as “Gateway” as is a small portion of the land adjacent to the northeast quadrant of the main interchange. Most land adjacent to the northeast quadrant of the main interchange is zoned as “Planned Urban Development (PUD)”.
The proposed project would be considered an allowed use as an existing transportation corridor.
15 | P a g e

S P : 8 2 8 6 - 8 1 I 4 9 4 / 6 9 4 / 9 4 E A W A P R I L 2 0 1 8
Floodplains
Impacts to floodplains are regulated through several federal executive orders (E.O. 11988 and 13690), state law, local ordinances and watershed district rules. The Federal Emergency Management Agency (FEMA) has mapped several 100 Year floodplains near the project area on Flood Insurance Rate Maps (FIRM); specifically, panels 27163CO340E and 27163CO330E. Both FIRM panels are effective as of 2010. It should be noted that floodplain boundaries do change over time based on land use modifications and are periodically updated with hydraulic calculations. These mapped areas are generally located within the east side of the Tamarack Road Interchange, adjacent to the east side of I-494 and just north of the Tamarack Road Interchange, and adjacent to the northwest quadrant of the main interchange. Mapped floodplains in and near the project area are depicted on Figure A-8 (Appendix A).
It is not anticipated that the proposed roadway improvement would require any earthwork within mapped floodplains in the project area.
Shoreland Zones
Shoreland zones, often referred to as “Shoreland Overlay Zones”, are those areas that lie within 300 feet of rivers and streams or 1000 feet from the Ordinary High Water (OHW) mark of lake edges. There are no rivers, streams or unnumbered Public Watercourses within the project area. The lake nearest the project area is Battle Creek Lake, approximately 1,800 feet to the southwest of the project area. MnDOT concludes that the proposed roadway improvement activities would not be within shoreland overlay zones.
Other Zoning Related Resources
There are no other zoning-related resources within or adjacent to the project area.
b . D i sc uss t he p ro j ec t ’ s comp at ib i l i t y w i t h ne arb y la nd use s , zo n ing , an d p la ns l i s t ed in I t em 9 a a bo ve , co nce n t ra t i ng o n imp l i c a t io ns f o r env i r onm enta l e f f ec t s .
The proposed project is located all within MnDOT right of way. The existing land uses will remain with no anticipated changes due to the proposed project.
The land adjacent to the project area in the cities of Oakdale and Woodbury is generally zoned as business, commercial, industrial or high density residential. Further, Transit-Oriented Development (TOD) is being used to coordinate and guide proposed development and Bus Rapid Transit (BRT) routes. The proposed subject roadway improvements will enhance mobility for businesses and residents and are compatible with zoning in the cities of Oakdale and Woodbury.
16 | P a g e

S P : 8 2 8 6 - 8 1 I 4 9 4 / 6 9 4 / 9 4 E A W A P R I L 2 0 1 8
c . I d en t i f y mea sur es in co r po r a te d in t o t he p ro po se d p r o j ec t t o m i t i g a te a n y po t en t i a l i ncom pat i b i l i t y a s d is cu sse d in I t em 9 b a bo ve .
There are no incompatibilities of the subject roadway improvements with adjacent land uses and zoning.
EAW Item 10 – Geology, soils and topography/land forms: Describe the geology underlying the project area and identify and map any susceptible geologic features such as sinkholes, shallow
limestone formations, unconfined/shallow aquifers, or karst conditions. Discuss any limitations of these features for the project and any effects the project could have on these features. Identify any project designs or mitigation measures to address effects to geologic features.
a . Ge o log y –
The bedrock underlying a majority of the project area is Paleozoic aged limestone/dolostone (Platteville Formation) and shale (Glenwood Formation) from the Upper Ordovician period (See Appendix B for Geology correspondence). Far east and west extremes of the project area along I-94 may encounter Upper Ordovician aged Saint Peter sandstone or Decorah shale (See Figure B-1 in Appendix B). The depth of the bedrock is variable with 50 to 150 feet of overburden cover. Based on the Minnesota Karst Database , this project area has a low probability of surface karst feature development. There are no foreseeable limitations to the project due to bedrock/bedrock aquifer features at this stage of the preliminary site investigations.
The water table elevation in the project area, based on the Hydrogeology Plates produced for Washington County Geologic Atlas (MnDNR), is approximately 950+ feet above mean sea level (MSL). Since surface topography fluctuates within the project area, depths of the water table aquifer also fluctuate. Some of MnDOT’s historic borings from the late 1950’s and up show high water tables approximately 10 feet or less below ground surface within the cloverleaf I-694/I-494/I-94 interchange and at I-494 and Tamarack Road. Groundwater flow within the project area has a southeast flow direction. Water table elevations in the area will likely fluctuate on a seasonal and localized basis.
b . So i l s an d t o pog ra ph y
Describe the soils on the site, g iving NRCS (SCS) classifications and descriptions, including limitations of soils. Describe topography, any special site conditions relating to erosion potential, soil stability or other soils limitations, such as steep slopes, highly permeable soils. Provide estimated volume and acreage of soil excavation and/or grading. Discuss impacts from project activities (distinguish between construction and operational activities) related to soils and topography. Identify measures during and
17 | P a g e

S P : 8 2 8 6 - 8 1 I 4 9 4 / 6 9 4 / 9 4 E A W A P R I L 2 0 1 8
after project construction to address soil limitations including stabilization, soil corrections or other measures. Erosion/sedimentation control related to stormwater runoff should be addressed in response to Item 11.b.ii.
The soils within the project area are late Pleistocene aged glacial deposits from the Cromwell Formation of the Superior lobe (Washington County Geologic Atlas). The soils are predominately reddish-brown to brown till composed of gravelly loamy sand to gravelly sandy loam. Many of these soils may be capped with 1.5 to 6 feet of loess (a windblown silt). Younger, Holocene aged, soils in the area are predominately peat found in some post-glacial land surface depressions and silty clays/clayey silts found in modern lake basins, along lakeshores, and beneath wetland sediments (peat)(See Figure B-2 in Appendix B). According to Natural Resource Conservation Service (NRCS) soil units map (See Figure B-3 – Appendix B), soils in the project area are predominately sandy loam, silt loam, and udorthents (areas of cut and fill with some indications of wet substratum). Organic soils are present mostly along the edge of right-of-way. Some organics have been observed in scattered pockets in the roadway, but given the presence of ‘cut and fill’ soils throughout some of the project area, those organics may have been removed during previous construction activities. Potentially steep slopes/highly erodible soils (slopes that may exceed 12%) are illustrated in Figure B-4 (Appendix B). The native project area topography has mostly been altered by urban construction, with slopes ranging from 1 to 16 percent. Soil permeability across the project area is variable, from high permeable sands, gravels, and possible organic material to moderate permeability loam to clay loam till. Soil permeability is based on the 1990 Sensitivity of Ground-Water Systems to Pollution plate from the Washington County Geologic Atlas. New mapping (2016) is available, but the pollution sensitivity plate has yet to be published.
The total excavation quantity of the roadway improvement is estimated to be 313,665 cubic yards (cy). Of this total, approximately 226,109 cy are outside the existing roadway and 87,556 cy are inside the existing roadway. The total grading area is estimated to be 3.31 acres (ac) of which 2.31 ac are outside the existing roadway and 1.01 ac are inside the existing roadway area. Excavation quantities will likely be modified to some extent as final design progresses. The project area soils do not pose any unique situation for construction that will necessitate soil stabilization, soil correction, or other measures. The project excavation is not expected to exceed an offset of more than 25 feet from the roadway.
MnDOT’s construction contractor will follow erosion prevention and sediment control requirements in accordance with the NPDES permit, which includes both temporary and permanent erosion and sediment control plans as well as other Best Management practices (BMP’s) to protect the resource waters. The project will use BMPs contained in MnDOT's standard specifications, details, and special provisions, and the MnDNR’s recommendation to use ‘bio‐ netting’ or ‘natural netting’ types (category 3N or 4N), and specifically not allow plastic mesh netting (see MnDNR Correspondence in Appendix 2). These BMPs will be maintained and repaired as necessary throughout project construction.
18 | P a g e
S P : 8 2 8 6 - 8 1 I 4 9 4 / 6 9 4 / 9 4 E A W A P R I L 2 0 1 8
EAW Item 11 Water resources:
A. Desc r i be su r f ace wa te r an d g rou ndwa t e r f ea tu r es o n o r n ear t h e s i t e i n A . i . an d A . i i . be l o w.
i. Surface water - lakes, streams, wetlands, intermittent channels, and county/judicial ditches. Include any special designations such as public waters, trout stream/lake, wildlife lakes, migratory waterfowl feeding/resting lake, and outstanding resource value water. Include water quality impairments or special designations listed on the current MPCA 303d Impaired Waters List that are within 1 mile of the project. Include DNR Public Waters Inventory number(s), if any.
Four DNR Public Waters Wetlands are located adjacent to the project limits (Table 9). There are no un-numbered DNR Public Waters (lakes) or Unnumbered Public Watercourses in close vicinity of the project area. The nearest Public Water is Battle Creek Lake which lies about 1,800 feet to the southwest of the I-694/ I-494/ I-94 Interchange. There are no County Judicial Ditches in or near the subject project area. See Figure B-5 (Appendix B) depicting DNR Public Waters near the subject project area.
Table 8: Surface Waters within 1 mile of the I-694/I-494/I-94 Project Area
Surface Waters DNR Public Water Number
Un-named wetland 428W Un-named wetland 429W Un-named wetland 436W Un-named wetland 437W
Based on review of the Minnesota Pollution Control Agency (MPCA) Impaired Waters Viewer (IWAV) web-site4, there are three aquatic resources within a 1-mile buffer around the subject project area that either have recently been de-listed or are currently listed on the 303d List of Impaired Waters (draft 2018). These aquatic resources are summarized as follows:
Battle Creek Lake. Located south of I-94 and west of I-494. Battle Creek Lake has been de-listed as an impaired aquatic resource on the draft 2018 303d List. Previous affected designated uses included Aquatic Consumption (stressor Mercury in fish tissue) and Aquatic Life (stressor Chloride).
Battle Creek. Located south of I-94 and west of I-494. Battle Creek flows out of the west end of Battle Creek Lake, ultimately flowing to Pigs Eye Lake and the Mississippi River. Affected designated use, in the reach from the Battle Creek Lake outlet to Pig’s Eye Lake, is Aquatic Life with stressors of aquatic macroinvertebrate bioassessments, chloride and fish bioassessments.
4 See Minnesota Pollution Control Agency's Impaired Waters Viewer
19 | P a g e
S P : 8 2 8 6 - 8 1 I 4 9 4 / 6 9 4 / 9 4 E A W A P R I L 2 0 1 8
Tanners Lake. Located north of I-94 and west of I-694. Tanners Lake has been de-listed as an impaired aquatic resource on the draft 2018 303d List. Previous affected designated uses included Aquatic Consumption (stressor Mercury in fish tissue) and Aquatic Life (stressor Chloride).
Waters listed on the MPCA 303d List of Impaired Waters are subject to a non-degradation rule in that water quality can’t be made worse by a proposed action. Stormwater management within the subject project area will treat runoff appropriately and will not degrade the water quality of receiving water bodies.
ii. Groundwater – aquifers, springs, seeps. Include: 1) depth to groundwater; 2) if project is within a MDH wellhead protection area; 3) identification of any onsite and/or nearby wells, including unique numbers and well logs if available. If there are no wells known on site or nearby, explain the methodology used to determine this.
1. The bedrock aquifer consists of the Prairie Du Chien Group and Jordan sandstone aquifer. The bedrock aquifer can be found at an elevation of 875 feet to 850 feet above mean sea level (MSL). The water table elevation in the project area, based on the Hydrogeology Plates produced for Washington County Geologic Atlas (MnDNR), is approximately 950+ feet above MSL. Since surface topography fluctuates within the project area, depths of the water table aquifer also fluctuate. Some of MnDOT’s historic borings from the late 1950’s and up show high water tables approximately 10 feet or less below ground surface within the cloverleaf I-694/I-494/I-94 interchange and at I-494 and Tamarack Road. Groundwater flow within the project area has a southeast flow direction. Water table elevations in the area will likely fluctuate on a seasonal and localized basis.
Due to this fluctuation, piezometers have been installed throughout portions of the project area to inform where storm water management areas would function best. Some groundwater data show that water tables are 9-12 feet below the soil surface but other data show that groundwater is closer to the soil surface in other areas.
2. Several portions of the subject project area lie within MDH Well head Protection Areas, described as follows:
a. From the southernmost extent of the I-694/ I-494/ I-94 Interchange south to and including all of the Tamarack Road Interchange.
b. The easternmost extent of I-94 within the project area.
c. The northernmost extent of the 10th Street interchange.
3. The City of Woodbury municipal water supply is composed of seventeen (18) deep wells; most located a considerable distance to the southwest of the subject project area. The closest well (Well #433281 or Well #7) to the proposed roadway improvement is approximately 1 mile to the southwest of the Tamarack Road Interchange. One municipal well (Well #208420 or Well #1) is located about 1 mile to the southwest of the I-694/ I-
20 | P a g e

S P : 8 2 8 6 - 8 1 I 4 9 4 / 6 9 4 / 9 4 E A W A P R I L 2 0 1 8
494/ I-94 interchange near the west edge of Battle Creek Lake. Some of the municipal wells in the City of Oakdale lie within a Drinking Water Supply Management Area (DWSMA).
The City of Oakdale municipal water supply is composed of eight (8) deep wells that tap into the Jordan Aquifer; most are located a considerable distance to the north of the 10th Street Interchange. The municipal wells closest to the subject project area are Well #1 (about 1000 feet west of I-694 and just south of 10th Street) and Well #7 (approximately 2000 feet northwest of the 10th Street Interchange). All municipal wells on Oakdale lie within a Drinking Water Supply Management Area (DWSMA).
Based on review of the Minnesota Department of Health (MDH) Minnesota Well Index5
one well is close to the subject project area, described as follows. Well # 589227, a monitoring well, is located approximately 200 feet west of I-694 near the southern extent of the 10th Street Interchange. This well was drilled to a depth of 32 feet. Other wells located near the project area are more than 350 feet from proposed construction activities.
b . De sc r ib e e f f ec t s f rom p ro j ec t a c t i v i t i es on wa t e r r e so urce s a nd m ea sur es t o m in im i ze o r m i t i g a te t h e e f f ec t s i n I t em b . i . t h r oug h I t em b . i v . b e lo w.
1. Wastewater - For each of the following, describe the sources, quantities and composition of all sanitary, municipal/domestic and industrial wastewater produced or treated at the site.
Not Applicable
2. If the wastewater discharge is to a subsurface sewage treatment systems (SSTS), describe the system used, the design flow, and suitability of site conditions for such a system.
Not Applicable
3. If the wastewater discharge is to a subsurface sewage treatment systems (SSTS), describe the system used, the design flow, and suitability of site conditions for such a system.
Not Applicable
ii. Stormwater - Describe the quantity and quality of stormwater runoff at the site prior to and post construction. Include the routes and receiving water bodies for runoff from the site (major downstream water bodies as well as the immediate receiving waters). Discuss any environmental effects from stormwater discharges. Describe stormwater pollution prevention plans including temporary and permanent runoff controls and potential BMP site locations to manage or treat stormwater runoff. Identify specific erosion control,
5 See Minnesota Department of Health's Minnesota Well Index
21 | P a g e
S P : 8 2 8 6 - 8 1 I 4 9 4 / 6 9 4 / 9 4 E A W A P R I L 2 0 1 8
sedimentation control or stabilization measures to address soil limitations during and after project construction.
Pre and Post-Construction Runoff and Impervious
The proposed roadway improvements would introduce 1.3 acres of new impervious surface. Additional storm runoff management proposed to compensate for the additional impervious is infiltration in upland areas adjacent to existing storm ponds in the northwest and southwest loops in the I-694/ I-494/ I-94 interchange.
In general, existing and proposed storm water within the project area is directed to retention/ detention/ infiltration basins in several of the interchange loops. Overflow from the interchange loop stormwater management features is conveyed via culverts to drainages and ditches to the west of the project area. Receiving waterbodies include Battle Creek Lake and several isolated wetlands. Runoff into Battle Creek Lake ultimately flows into the Mississippi River. Runoff into isolated wetlands generally infiltrates.
The following describes pathways of storm water runoff in the project area by project segment:
The 10th Street/ I-694 Interchange Area and I-694 south to the I-694/494/94 Interchange Area
The section of I-694 from 10th Street to the I-94/I-694/I-494 Interchange is a rural drainage design with median and outside ditches that collect roadway drainage. Median centerline ditches collect roadway drainage and stormwater is directed across either northbound or southbound I-694 to the outside ditches by centerline culverts. The culverts were cleaned and extended as part of State Project # 8286-64 in 2009.
The I-694/494/94 Interchange Area
The I-694/494/94 interchange area is a combination of urban and rural drainage. Catch basins collect stormwater from the south ends of Bridge No. 82831 (I-694 southbound over 94) and Bridge No. 82832 (I-694 northbound over 94). The stormwater that is collected is discharged into the loop areas.
I-494
The section of I-494 from I-694/I-94/I-494 area to Tamarack Road is a rural drainage design with median and outside ditches that collect roadway drainage.
Existing stormwater management features are described as follows:
Existing Culvert. An east-west culvert crosses the north and southbound lanes and the median at approximately station marker 133. This culvert collects storm runoff from Ditch #16 on the east side of I-494 and conveys it to the west side of I-494 where it discharges into Wetland #15 (MnDNR Public Water Wetland 82043600W).
22 | P a g e
S P : 8 2 8 6 - 8 1 I 4 9 4 / 6 9 4 / 9 4 E A W A P R I L 2 0 1 8
Existing Culvert. An east-west culvert crosses the north and southbound lanes and the median at approximately station marker 128. This culvert collects storm runoff from Ditch #16/ Wetland #19 on the east side of I-494 and conveys it to the west side of I-494 where it discharges into Ditch #17 and ultimately into Wetland #15 (MnDNR Public Water Wetland 82043600W).
I-94
There is a highpoint approximately 0.48 miles east of the I-694/ I-494/ I-94 interchange and stormwater is directed back westward towards the I-694/ I-494/ I-94 interchange through a series of ditches, drop inlets and storm sewer pipe. This drainage area eventually discharges to MnDNR Public Water Wetland 82043600W just southwest of the southwest quadrant of the interchange.
Environmental Effects of Storm Runoff
Roadway storm runoff can potentially carry petroleum by-products such as oil, diesel and gasoline; and metals deriving from vehicle wear such as cadmium, chromium, copper, zinc, iron and nickel. De-iceing chemicals such as chloride and acetate and herbicides and fertilizers can also enter the storm runoff treatment stream6. Without proper treatment some of these water quality constituents can enter and degrade groundwater and surface water resources.
Details Concerning Stormwater Pollution Prevention Plan (SWPPP) and Best Management Practices (BMPs)
Two-celled stormwater treatment is proposed to treat existing impervious and an additional 1.3 acres of new impervious that would result from the proposed roadway improvement. Several stormwater ponds and storm runoff infiltration areas are currently in place throughout the project area. Additional infiltration is proposed in the northwest and southwest loops of the I-694/ I-494/ I-94 interchange. Storm runoff is proposed to flow into the infiltration areas (the first treatment cell) and allow sediments and pollutants to settle out of the water column and then overflow from the infiltration areas would be conveyed to the retention/ detention ponds (the second treatment cell). In general, the infiltration areas would be located where they could be cleaned out periodically to maintain their efficacy in settling out pollutants. Best Management Practices (BMPs) such as silt fences, jute mats, inlet control, and rapid re-vegetation would be implemented immediately post-construction to minimize potential sedimentation in receiving water bodies.
iii. Water appropriation - Describe if the project proposes to appropriate surface or groundwater (including dewatering). Describe the source, quantity, duration, use and purpose of the water use and if a DNR water appropriation permit is required. Describe any well abandonment. If connecting to an existing municipal water supply, identify the wells to be used as a water source and any effects on, or required expansion of, municipal water infrastructure. Discuss environmental effects from water appropriation, including an assessment of the water resources available for appropriation. Identify any
6 Transportation Research Board, 2005. “Assessing and Managing the Ecological Impacts of Paved Roads”.
23 | P a g e
S P : 8 2 8 6 - 8 1 I 4 9 4 / 6 9 4 / 9 4 E A W A P R I L 2 0 1 8
measures to avoid, minimize, or mitigate environmental effects from the water appropriation.
On August 30, 2017, The Minnesota District Court issued a court order that prohibits issuance of new water appropriation permits by the MnDNR within a 5-mile radius and potentially curtails or slows the permitting process within a 7-mile radius of White Bear Lake. The subject project area lies within the 7-mile radius of White Bear Lake. The court order was in response to over-appropriation of ground water resources resulting in low water levels in White Bear Lake. This includes groundwater dewatering greater than 10,000 gallons per day or 1 million gallons per year.
Dewatering extent will be minimized to the extent practicable by conducting relevant earthwork at a seasonal period when ground water tables are generally lower. More information will be become available as final design level of effort progresses.
iv. Surface Waters
a) Wetlands - Describe any anticipated physical effects or alterations to wetland features such as draining, filling , permanent inundation, dredging and vegetative removal. Discuss direct and indirect environmental effects from physical modification of wetlands, including the anticipated effects that any proposed wetland alterations may have to the host watershed. Identify measures to avoid (e.g ., available alternatives that were considered), minimize, or mitigate environmental effects to wetlands. Discuss whether any required compensatory wetland mitigation for unavoidable wetland impacts will occur in the same minor or major watershed, and identify those probable locations.
Potential Impacts
The proposed roadway improvement would impact a negligible acreage of wetlands and ditches that are jurisdictional by either the U.S. Army Corps of Engineers (Clean Water Act) or the Minnesota Wetland Conservation Act. Total wetland impacts are proposed to be 0.20 acres. Total impacts to jurisdictional ditches are proposed to be 0.12 acres. Figures A-9-1 to A-9-11 in Appendix A depict wetlands and ditches delineated in and near the project area. Figures A-10-1 through A-10-17 depict impacts to wetlands and ditches. Table 10 (Wetland Basins) and Table 11(Ditch Basins) summarize characteristics of each delineated water resource in and near the project area.
24 | P a g e

S P : 8 2 8 6 - 8 1 I 4 9 4 / 6 9 4 / 9 4 E A W A P R I L 2 0 1 8
Table 9: Wetland Basins
Basin Number
Section, Township,
Range
Wetland Circ. 39 Type / Existing Plant Community
Type(s) in Impact Area
Permitting Jurisdiction (COE, DNR,
WCA)
Basin Size
(acres)
Wetland Impact (acres)
5 32, T29N, R21W 2 / Fresh (wet) meadow WCA & COE 0.5193 0.0023 7 32, T29N, R21W 3 / Shallow marsh WCA & COE 2.5751 0.0108 13 32, T29N, R21W 3 / Shallow marsh WCA & COE 0.1242 0.0261 14 32, T29N, R21W 3 / Shallow marsh WCA & COE 0.8900 0.0310
15 (DNR 436W)
5, T28N, R21W 3 / Shallow marsh WCA & COE 26.5948 0.0137
19 5, T28N, R21W 5 / shallow open water WCA & COE 2.2402 0.1015 22a (DNR
437W) 5, T28N, R21W 1L / floodplain forest WCA & COE 0.1848 0.0112
22b 5, T28N, R21W 1L / floodplain forest WCA & COE 0.1562 0.0010 23b 5, T28N, R21W 2 / fresh (wet) meadow DNR & COE 0.3156 0.0024
TOTAL 0.2000
Table 10: Ditch Basins
Ditch Number
Section, Township,
Range
Wetland Circ. 39 Type / Existing Plant
Community Type(s) in Impact Area
Permitting Jurisdiction (COE, DNR,
WCA)
Basin Size (acres)
Wetland Impact (acres)
#4 32, T29N, R21W
2 / Fresh (wet) meadow COE 0.4785 0.0046
#12.1 5, T28N, R21W
3 / Shallow marsh COE 0.0208 0.0208
#13.1w 5, T28N, R21W
2 / Fresh (wet) meadow WCA & COE
0.0169 0.0106
#13.2 5, T28N, R21W
2 / Fresh (wet) meadow COE 0.0414 0.0224
#14 5, T28N, R21W
1 / seasonally flooded basin
COE 0.0275 0.0009
#15w 5, T28N, R21W
3 / Shallow marsh WCA & COE
0.0424 0.0074
25 | P a g e

S P : 8 2 8 6 - 8 1 I 4 9 4 / 6 9 4 / 9 4 E A W A P R I L 2 0 1 8
Ditch Number
Section, Township,
Range
Wetland Circ. 39 Type / Existing Plant
Community Type(s) in Impact Area
Permitting Jurisdiction (COE, DNR,
WCA)
Basin Size (acres)
Wetland Impact (acres)
#16.1 5, T28N, R21W
2 / Fresh (wet) meadow COE 0.01403 0.0084
#16.2w 5, T28N, R21W
2 / Fresh (wet) meadow WCA & COE
0.0184 0.0117
#17.1 5, T28N, R21W
2 / Fresh (wet) meadow COE 0.01941 0.0112
#18.2w 5, T28N, R21W
2 / Fresh (wet) meadow WCA & COE
0.0078 0.0024
#21 5, T28N, R21W
2 / Fresh (wet) meadow COE 0.0457 0.0186
#Ditch betweenW22a
and W22b
5, T28N, R21W
2 / Fresh (wet) meadow COE 0.0207 0.0017
TOTAL 0.1207
Sequencing: Measures to Avoid, Minimize and Mitigate
The project area lies entirely within the Ramsey-Washington Metro Watershed District. The Battle Creek Lake Sub-Watershed encompasses the vast majority of the project area, though a small area of the 10th Street Interchange lies within the Tanners Lake Sub-Watershed.
Avoidance Measures:
The No-Build Alternative would avoid all wetland impacts (except those due to routine maintenance), but would fail to meet the project purpose and need. It was therefore rejected from further consideration.
Figures A-9-1 through A-9-11 depict the many wetlands and stormwater ditches with wetland bottoms in and near the subject roadway improvement. Designing the project to avoid all wetland impacts was not possible due to the large number of surrounding wetlands.
Minimization Efforts:
Efforts were made to minimize impacts to areas outside of the existing footprint of the project. Side slopes were steepened to the extent practicable in areas near delineated wetlands and jurisdictional ditches to minimize the footprint of the project in sensitive areas. As roadway design proceeds, additional opportunities to minimize the project footprint, such as retaining walls are being considered. Additionally, BMPs are proposed such as silt fencing, jute mats, and rapid re-vegetation to minimize impacts to the water quality of the surrounding surface water resources.
26 | P a g e
S P : 8 2 8 6 - 8 1 I 4 9 4 / 6 9 4 / 9 4 E A W A P R I L 2 0 1 8
Mitigation:
Unavoidable impacts to wetland basins and ditch bottoms that are jurisdictional per the Minnesota Wetland Conservation Act (WCA) or the USACE (presented in Figures A-10-1 to A-10-17 in Appendix A) will be mitigated through debits from approved mitigation banks. Impacts within the project area are in Bank Service Area (BSA) 7. An attempt will be made to locate suitable approved wetland mitigation banking credits within BSA 7, in which the typical mitigation ratio would be 2 (mitigated) to 1 (impacted). Mitigation credits purchased outside BSA 7 would typically be mitigated at a 2.5 (mitigated) to 1 (impacted) ratio. Application for wetland permits will be made to the appropriate agencies with wetland jurisdiction. Wetland mitigation is an on-going development during early stages of project design, and therefore subject to change.
The specific wetland bank credits will be determined through consultation with the USACE and the Minnesota Board of Water and Soil Resources.
b) Other surface waters- Describe any anticipated physical effects or alterations to surface water features (lakes, streams, ponds, intermittent channels, county/judicial ditches) such as draining, filling , permanent inundation, dredging, diking, stream diversion, impoundment, aquatic plant removal and riparian alteration. Discuss direct and indirect environmental effects from physical modification of water features. Identify measures to avoid, minimize, or mitigate environmental effects to surface water features, including in-water Best Management Practices that are proposed to avoid or minimize turbidity/sedimentation while physically altering the water features. Discuss how the project will change the number or type of watercraft on any water body, including current and projected watercraft usage.
There are no other anticipated physical effects or alterations to other surface water features.
EAW Item 12 Contamination/Hazardous Materials/Wastes: a) Pre-project site conditions – Describe existing contamination or
potential environmental hazards on or in close proximity to the project site such as soil or ground water contamination, abandoned dumps, closed landfills, existing or abandoned storage tanks, and hazardous liquid or gas pipelines. Discuss any potential environmental effects from pre-project site conditions that would be caused or exacerbated by project construction and operation. Identify measures to avoid, minimize or mitigate adverse effects from existing contamination or potential environmental hazards. Include development of a Contingency Plan or Response Action Plan.
MnDOT’s Contaminated Materials Management Team (CMMT) reviewed the Minnesota Pollution Control Agency (MPCA) and Minnesota Department of Agriculture (MDA) databases to check for known contaminated sites in the project area. See correspondence in Appendix B. The databases searched included: leaking underground storage tank facilities, landfills, salvage yards, voluntary investigation and cleanup (VIC) sites, Superfund sites, dump
27 | P a g e
S P : 8 2 8 6 - 8 1 I 4 9 4 / 6 9 4 / 9 4 E A W A P R I L 2 0 1 8
sites, and agricultural spills and investigations. A review of these MPCA files is a component of a Phase I Environmental Site Assessment (Phase I ESA). A complete Phase I ESA includes at least two other components: research on historical land use and a site reconnaissance.
Based on the database reviews, three closed leaking underground storage tank sites are located within approximately 500 feet of the project area. Upon completion of a regulatory file review by CMMT staff, no concern to the proposed construction activity was identified.
Given the nature and location of the project area, this project has a medium risk of impacting potentially contaminated sites. The project includes excavation related to the replacement of the bridges and the reconstruction of ramps, storm water ponds, etc. The project is also located in a commercial/industrial area. These components increase the chances of encountering contaminants that may have originated from an off-site source and migrated into the right of way.
The proposed project includes acquisition of right of way.
Should any contamination be encountered during construction, a plan for properly handling and treating contaminated soil and/or groundwater in accordance with all applicable state and federal requirements will be used.
b) Project related generation/storage of solid wastes – Describe solid wastes generated/stored during construction and/or operation of the project. Indicate method of disposal. Discuss potential environmental effects from solid waste handling, storage and disposal. Identify measures to avoid, minimize or mitigate adverse effects from the generation/storage of solid waste including source reduction and recycling.
The disposal of solid waste generated by clearing the construction area is a common occurrence associated with road construction projects. During project construction, excavation of soil will need to occur within the construction limits. Design will consider selection of grade-lines and locations to minimize excess materials, and consideration will be given to using excess materials on the proposed project or other nearby projects. If the material is suitable, all clean fill is planned to be reused on-site for the construction of roadway embankments. Any excess soil materials that is not suitable for use on the project site will become the property of the contractor and will be disposed of in accordance with state and federal requirements in place at the time of project construction.
Excess materials and debris from this project such as concrete and bituminous pavement will be disposed of in accordance with MPCA Standard Specification for Construction, 2104.3D and Minnesota Rule 7035.2825. In particular, excess materials and debris will not be placed in wetlands or floodplains. Debris such as concrete and bituminous pavement, if not recycled or reused, must be disposed of in an MPCA permitted landfill.
If contaminated soils are encountered during construction, the response would be handled according to MPCA requirements.
28 | P a g e

S P : 8 2 8 6 - 8 1 I 4 9 4 / 6 9 4 / 9 4 E A W A P R I L 2 0 1 8
c) Project related use/storage of hazardous materials – Describe chemicals/hazardous materials used/stored during construction and/or operation of the project including method of storage. Indicate the number, location and size of any above or below ground tanks to store petroleum or other materials. Discuss potential environmental effects from accidental spill or release of hazardous materials. Identify measures to avoid, minimize or mitigate adverse effects from the use/storage of chemicals/hazardous materials including source reduction and recycling. Include development of a spill prevention plan.
Toxic or hazardous materials will not be used or stored at the construction site, except for fuel and lubricants as necessary for the construction equipment used on the project. Temporary storage tanks for petroleum products may be located in the project area for refueling equipment during roadway construction. Appropriate measures will be taken during construction to avoid spills that could contaminant groundwater or surface water in the project area. If a spill were to occur during construction, the Project Engineer and Minnesota Duty Officer will be contacted and appropriate action to remediate will be taken immediately in accordance with MPCA guidelines and regulations in place at the time of project construction. A spill kit will be kept near any storage tanks.
d) Project related generation/storage of hazardous wastes –Describe hazardous wastes generated/stored during construction and/or operation of the project. Indicate method of disposal. Discuss potential environmental effects from hazardous waste handling, storage, and disposal. Identify measures to avoid, minimize or mitigate adverse effects from the generation/storage of hazardous waste including source reduction and recycling.
No above or below-ground storage tanks are planned for permanent use in conjunction with this project.
Bridges #82831 and 82832 were assessed for the presence of regulated wastes (see Regulated Materials Management Team (RMMT) correspondence in Appendix B). The assessment revealed the presence of regulated materials on both bridges. Specifically, the bridge assessments revealed asbestos containing materials, lead gaskets, polychlorinated biphenyl (PCB) caulking and bituminous felt, treated wood, light-emitting diode (LED) lamps, PCB containing electronic components (transformers/electrical boxes and capacitors), and peeling paint. The Asbestos and Regulated Waste Assessment Report is not included in Appendix B; however, it is on file and available upon request.
The contractor will use #1701 and #2104 of the Special Provisions for the bridge demolitions and rehabilitations. An oversight contractor will be hired by RMMT staff for abatement of asbestos containing materials. The material will be removed by a MnDOT certified asbestos abatement contractor and disposed of at a MPCA permitted mixed municipal solid waste landfill or MPCA permitted industrial landfill. Lead gaskets will be separated out and sent to a lead scrap recycler. Documentation will be obtained showing the recycler received the lead gasket material. Caulking and bituminous felt containing PCBs will be separated out and disposed of at a MPCA permitted mixed municipal solid waste landfill or MPCA permitted industrial landfill. For removal of treated wood, 2104 of the Special Provisions will be used.
29 | P a g e

S P : 8 2 8 6 - 8 1 I 4 9 4 / 6 9 4 / 9 4 E A W A P R I L 2 0 1 8
Treated wood will be disposed of at a MPCA permitted mixed municipal solid waste landfill or MPCA permitted industrial landfill. Documentation will be obtained showing the landfill received the material. The LED lamps and PCB containing electronic components will be recycled with MnDOT’s approved regulated waste contractor, Green Lights Recycling. Documentation will be obtained showing the recycler received the material. MnDOT also has the option to reuse LED lamps and PCB containing electronic components on-site, which will be documented if they are reused on-site. The contractor will completely contain, collect, and appropriately dispose of peeling or loose paint during all phases of their work, as described at http://www.dot.state.mn.us/environment/buildingbridge/pdf/peeling-paint-mgmt.pdf. This includes the transport of materials for disposal. All documentation of proper management of regulated wastes will be archived and kept permanently in the MnDOT Office of Environmental Stewardship project file for future reference.
EAW Item 13 Fish, wildlife, plant communities, and sensitive ecological resources (rare features):
a. Describe fish and wildlife resources as well as habitats and vegetation on or in near the site.
Most of the project area has been previously disturbed by residential, commercial, and industrial development. The entire project limits have been previously disturbed by roadway construction. There is open space around and within the project area.
There are several Minnesota Department of Natural Resources (MnDNR) Public Waters in the project area (identified in blue on Figure B-5 in Appendix B), including; Unnamed basin #82042800W (near the northbound 10th Street off ramp), Unnamed basin #82042900W (at the southbound I-694 to westbound I-94 ramp), Unnamed basin #82043600W (at the eastbound I-94 to southbound I-494 ramp), and Unnamed basin #82043700W (part of the Tamarack Swamp complex at the Tamarack Rd interchange).
Wildlife in the project area is limited to those species that have adapted to live in developed areas. Fish habitat is present in Battle Creek Lake, located to the west of the project area, and south of I-94.
b. Describe rare features such as state-listed (endangered, threatened or special concern) species, native plant communities, Minnesota County Biological Survey Sites of Biodiversity Significance, and other sensitive ecological resources on or within close proximity to the site. Provide the license agreement number (LA-____) and/or correspondence number (ERDB _____________) from which the data were obtained and attach the Natural Heritage letter from the DNR. Indicate if any additional habitat or species survey work has been conducted within the site and describe the results.
MnDOT received correspondence from MnDNR via email on April 18, 2017 (see correspondence in Appendix 2). The National Heritage Information System (NHIS) database
30 | P a g e
S P : 8 2 8 6 - 8 1 I 4 9 4 / 6 9 4 / 9 4 E A W A P R I L 2 0 1 8
was reviewed by MnDNR using a one-mile query radius. An ERDB number was not provided; however, the MnDNR email and corresponding materials are provided in Appendix 2.
The query of the NHIS database to determine if any rare plant or animals species, native plant communities, or other significant natural features known to occur in the one-mile query radius identified that there are rare features present. MnDNR did not identify the species or their location on Figure B-5 in Appendix B to prevent inadvertent release of the location of specific listed or rare species contained in the NHIS.
The noted rare feature identified in the NHIS database query that may be impacted by the proposed project was the Tamarack Swamp at the Tamarack Road interchange. It was identified during the Minnesota County Biological Survey as a “Site of Biodiversity Significance”. It is presented in green on Figure B-5 in Appendix B.
MnDOT received correspondence from MnDOT’s Wildlife Ecologist regarding the Rusty Patched bumble bee (Bombus affinis) (RPBB) and the Northern Long-Eared bat (Myotis septentrionalis), and other federally listed threatened and endangered species on November 2, 2017 (see correspondence in Appendix 2). It was determined that there would be No Effect to Federally listed threatened and endangered species. While a very small portion of the project area is within RPBB High Potential Zone, the section in the project area is unsuitable habitat based on the vegetation present (dominated by non-native grasses).
c. Discuss how the identified fish, wildlife, plant communities, rare features and ecosystems may be affected by the project. Include a discussion on introduction and spread of invasive species from the project construction and operation. Separately discuss effects to known threatened and endangered species.
The proposed project is near Battle Creek Lake, Tamarack Swamp, and other MnDNR public waters. Concerns for these areas during construction include soil disturbances that could lead to excessive sedimentation, and incidental herbicide exposure from vegetation management. Concerns for these areas following construction activities include: competition from non-native plants, sod-forming grasses, introduction of weed seeds, or shading by encroaching shrubs that can lead to degradation of the sites, as well as hydrologic alterations to these areas.
d. Identify measures that will be taken to avoid, minimize, or mitigate adverse effects to fish, wildlife, plant communities, and sensitive ecological resources.
The Minnesota Pollution Control Agency (MPCA) National Pollutant Discharge Elimination System (NPDES) general permit for authorization to discharge stormwater associated with construction activities (permit MN R10001) recognizes the MnDNR “work in water restrictions” during specified fish migration and spawning time frames for areas adjacent to water. During the restriction period, all exposed soil areas that are within 200 feet of the water’s edge and drain to these waters must have erosion prevention stabilization activities initiated immediately after construction activity has ceased (and be completed within 24 hours). Natural netting will be utilized, where practical, per MnDOT Specs 3885 and 3897 for erosion control blankets (see MnDNR and FWS correspondence in Appendix B).
31 | P a g e

S P : 8 2 8 6 - 8 1 I 4 9 4 / 6 9 4 / 9 4 E A W A P R I L 2 0 1 8
MnDOT will have a Stormwater Pollution Prevention Plan (SWPPP) that will identify appropriate sediment containment and contaminant prevention measures to Battle Creek Lake, Tamarack Swamp, and other MnDNR public waters if necessary.
The project will install non-native seed mix on the insloped, medians, and boulevards. Native seed mixes will be planted on the ditch bottoms and backslopes. There may be unique sites that require unique seed mixes, such as infiltration basins, frequently mowed sites, etc. Roadside vegetation serves many functions that are critical to operating highway infrastructure, such as safety, drainage, erosion control, and stormwater treatment. Native vegetation provides additional benefits such as protecting and enhancing natural resources, support pollinator habitat, providing a sense of place, and enhancing visual quality.
Vehicles and construction activities, including the location of field offices, storage of equipment and other supplies will be prohibited within at least 25 feet outside the dripline of trees or other identified Area of Environmental Sensitivity to be preserved, in accordance with MnDOT spec 2572.3.
EAW Item 14 Historic properties: Describe any historic structures, archeological sites, and/or traditional cultural properties on or in close proximity to the site. Include: 1) historic designations, 2) known artifact areas, and 3) architectural features. Attach letter received from the State Historic Preservation Office (SHPO). Discuss any anticipated effects to historic properties during project construction and operation. Identify measures that will be taken to avoid, minimize, or mitigate adverse effects to historic properties.
Cultural Resources staff have reviewed the subject project and have determined that the segments of the interstate system that lie within the subject project area are not considered exceptional per established criteria described in the National Register of Historic Places and in the Interstate Highway Exemption issued through the Advisory Council of Historic Preservation. This Exemption relieves federal agencies from considering the vast majority of the Interstate Highway System as an historic resource under section 106 of the National Historic Preservation Act and Section 4(f) of the U.S. Department of Transportation Act. For this reason and also that the project does not include impacts to non-interstate related historic properties, no Section 106 review is needed for this project. See Appendix B – Agency Correspondence for letters from the Cultural Resources Unit.
EAW Item 15 Visual: Describe any scenic views or vistas on or near the project site. Describe any project related visual effects such as vapor plumes or g lare from intense lights. Discuss the
32 | P a g e

S P : 8 2 8 6 - 8 1 I 4 9 4 / 6 9 4 / 9 4 E A W A P R I L 2 0 1 8
potential visual effects from the project. Identify any measures to avoid, minimize, or mitigate visual effects.
The landscape in and near the subject project area is mostly fully built out, though there is some open land scattered throughout. Some of the open land is slated for residential development. The proposed roadway improvement would not substantially alter the vista from the perspective of the motorist or from the perspective of residents or commercial facilities near the project area. The deck elevation of the two bridges over I-94 would be elevated by less than 2 feet. There are not currently any noise walls in or immediately adjacent to the project area and there are none proposed as part of the roadway improvement. The existing and proposed lighting in the project area is LED. The spacing of the existing lightposts would be similar to the spacing of the proposed lightposts. Lightposts would be moved several feet from existing locations where the proposed footprint extends beyond the existing footprint. MnDOT concludes that there would be no visual impacts that would result from the proposed roadway improvement.
EAW Item 16 Air: a. Stationary source emissions - Describe the type, sources, quantities and compositions of any emissions from stationary sources such as boilers or exhaust stacks. Include any hazardous air pollutants, criteria pollutants, and any greenhouse gases. Discuss effects to air quality including any sensitive receptors, human health or applicable regulatory criteria. Include a discussion of any methods used
assess the project’s effect on air quality and the results of that assessment. Identify pollution control equipment and other measures that will be taken to avoid, minimize, or mitigate adverse effects from stationary source emissions.
Not Applicable
b. Vehicle emissions - Describe the effect of the project’s traffic generation on air emissions. Discuss the project’s vehicle-related emissions effect on air quality. Identify measures (e.g. traffic operational improvements, diesel idling minimization plan) that will be taken to minimize or mitigate vehicle-related emissions.
The following question format answers the EAW question above in relation to highway projects and summarizes the findings in the Air Quality Memorandum provided in Appendix C.
33 | P a g e
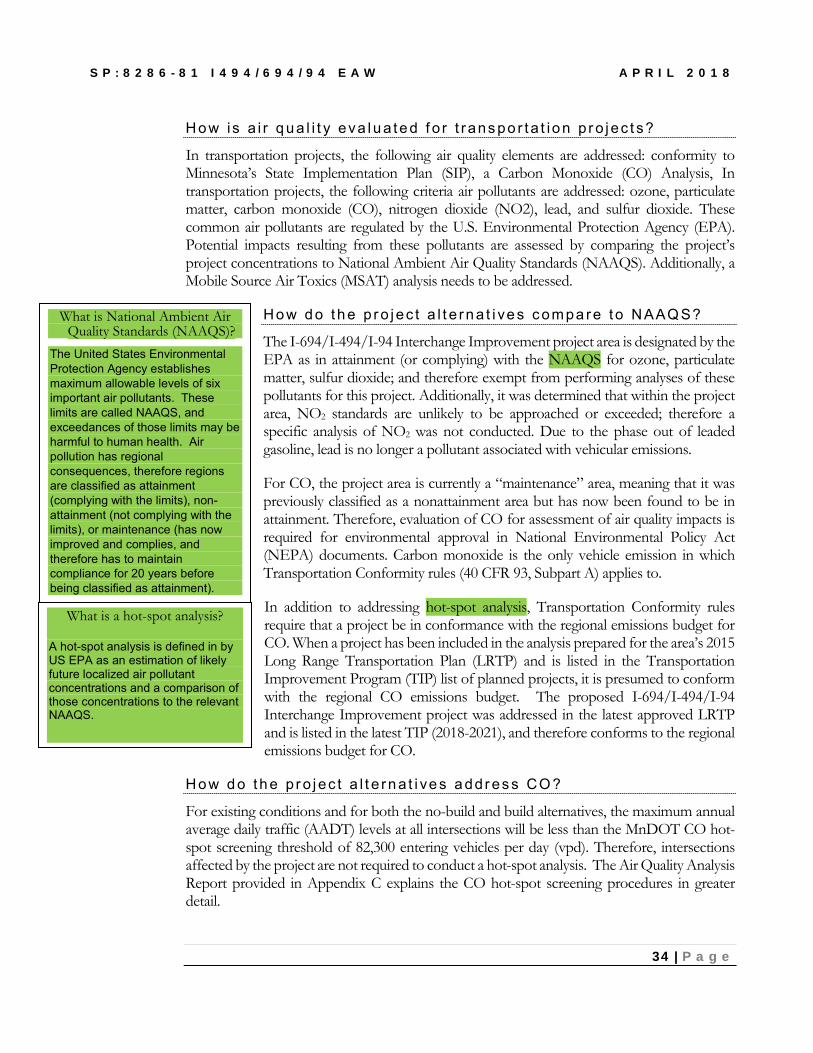
S P : 8 2 8 6 - 8 1 I 4 9 4 / 6 9 4 / 9 4 E A W A P R I L 2 0 1 8
Ho w is a i r q u a l i t y eva lu a te d f o r t r ans po r ta t io n p r o j ec t s?
In transportation projects, the following air quality elements are addressed: conformity to Minnesota’s State Implementation Plan (SIP), a Carbon Monoxide (CO) Analysis, In transportation projects, the following criteria air pollutants are addressed: ozone, particulate matter, carbon monoxide (CO), nitrogen dioxide (NO2), lead, and sulfur dioxide. These common air pollutants are regulated by the U.S. Environmental Protection Agency (EPA). Potential impacts resulting from these pollutants are assessed by comparing the project’s project concentrations to National Ambient Air Quality Standards (NAAQS). Additionally, a Mobile Source Air Toxics (MSAT) analysis needs to be addressed.
Ho w d o t h e p r o j ec t a l t e rn a t i ve s c ompa re t o NAAQ S? What is National Ambient Air Quality Standards (NAAQS)?
The United States Environmental Protection Agency establishes maximum allowable levels of six important air pollutants. These limits are called NAAQS, and exceedances of those limits may be harmful to human health. Air pollution has regional consequences, therefore regions are classified as attainment (complying with the limits), non-attainment (not complying with the limits), or maintenance (has now improved and complies, and therefore has to maintain compliance for 20 years before being classified as attainment).
What is a hot-spot analysis?
US EPA as an estimation of likely A hot-spot analysis is defined in by
future localized air pollutant concentrations and a comparison of
NAAQS. those concentrations to the relevant
The I-694/I-494/I-94 Interchange Improvement project area is designated by the EPA as in attainment (or complying) with the NAAQS for ozone, particulate matter, sulfur dioxide; and therefore exempt from performing analyses of these pollutants for this project. Additionally, it was determined that within the project area, NO2 standards are unlikely to be approached or exceeded; therefore a specific analysis of NO2 was not conducted. Due to the phase out of leaded gasoline, lead is no longer a pollutant associated with vehicular emissions.
For CO, the project area is currently a “maintenance” area, meaning that it was previously classified as a nonattainment area but has now been found to be in attainment. Therefore, evaluation of CO for assessment of air quality impacts is required for environmental approval in National Environmental Policy Act (NEPA) documents. Carbon monoxide is the only vehicle emission in which Transportation Conformity rules (40 CFR 93, Subpart A) applies to.
In addition to addressing hot-spot analysis, Transportation Conformity rules require that a project be in conformance with the regional emissions budget for CO. When a project has been included in the analysis prepared for the area’s 2015 Long Range Transportation Plan (LRTP) and is listed in the Transportation Improvement Program (TIP) list of planned projects, it is presumed to conform with the regional CO emissions budget. The proposed I-694/I-494/I-94 Interchange Improvement project was addressed in the latest approved LRTP and is listed in the latest TIP (2018-2021), and therefore conforms to the regional emissions budget for CO.
Ho w d o t h e p r o j ec t a l t e rn a t i ve s a ddr es s CO ?
For existing conditions and for both the no-build and build alternatives, the maximum annual average daily traffic (AADT) levels at all intersections will be less than the MnDOT CO hot-spot screening threshold of 82,300 entering vehicles per day (vpd). Therefore, intersections affected by the project are not required to conduct a hot-spot analysis. The Air Quality Analysis Report provided in Appendix C explains the CO hot-spot screening procedures in greater detail.
34 | P a g e

S P : 8 2 8 6 - 8 1 I 4 9 4 / 6 9 4 / 9 4 E A W A P R I L 2 0 1 8
On November 8, 2010, the EPA approved a limited maintenance plan request for the Twin Cities maintenance area. Under a limited maintenance plan, the EPA has determined that there is no requirement to project emissions over the maintenance period and that "an emission budget may be treated as essentially not constraining for the length of the maintenance period. The reason is that it is unreasonable to expect that our maintenance area will experience so much growth within this period that a violation of CO National Ambient Air Quality Standard (NAAQS) would result." (US EPA Limited Maintenance Plan Option for Nonclassifiable CO Nonattainment Areas, October 6, 1995) Therefore, no regional modeling analysis for the LRTPP and TIP is required; however, federally-funded and state- funded projects are still subject to "hot-spot" analysis requirements. The limited maintenance plan adopted in 2010 determines that the level of CO emissions and resulting ambient concentrations will continue to demonstrate attainment of the CO NAAQS.
Ho w d o t h e p r o j ec t a l t e rn a t i ve s a ddr es s MSAT?
Due to incomplete and unavailable information, it is not currently feasible to develop a project-level MSAT health impacts analyses; however, a qualitative assessment of regional MSAT impacts is possible. Refer to Appendix C for the full qualitative MSAT analysis relative to the project alternatives. In summary, when a highway is widened, the localized level of MSAT emissions for the Build Alternative could be higher relative to the No-build Alternative, but this could be offset due to increases in speeds and reductions in congestion (both of which are associated with lower MSAT emissions). Also, MSAT will be lower in other locations when traffic shifts away from them. However, on a regional basis, EPA's vehicle and fuel regulations, coupled with fleet turnover, will cause substantial reductions over time that, in most cases, will cause region-wide MSAT levels to be lower than those of today.
c. Dust and odors - Describe sources, characteristics, duration, quantities, and intensity of dust and odors generated during project construction and operation. (Fugitive dust may be discussed under item 16a). Discuss the effect of dust and odors in the vicinity of the project including nearby sensitive receptors and quality of life. Identify measures that will be taken to minimize or mitigate the effects of dust and odors.
Fugitive dust resulting from the construction phase of the proposed roadway improvement will be minimized to the extent practicable. Techniques such as frequent pavement sweeping and moistening the project area and associated staging areas as needed with water tankers. Pavement sweeping will remove most of the mud tracked onto driving surfaces by construction-related equipment and vehicles.
Fumes from idling equipment, vehicles and machinery in the construction or staging areas will be minimized to the extent practicable. Diesel and gas powered machinery will be turned off when possible during the construction phase; though often large diesel engines run cleaner and more efficiently when thoroughly warmed up. Any fuels or chemicals stored in staging areas
during the construction phase will be contained in a manner that would minimized potential odors.
35 | P a g e
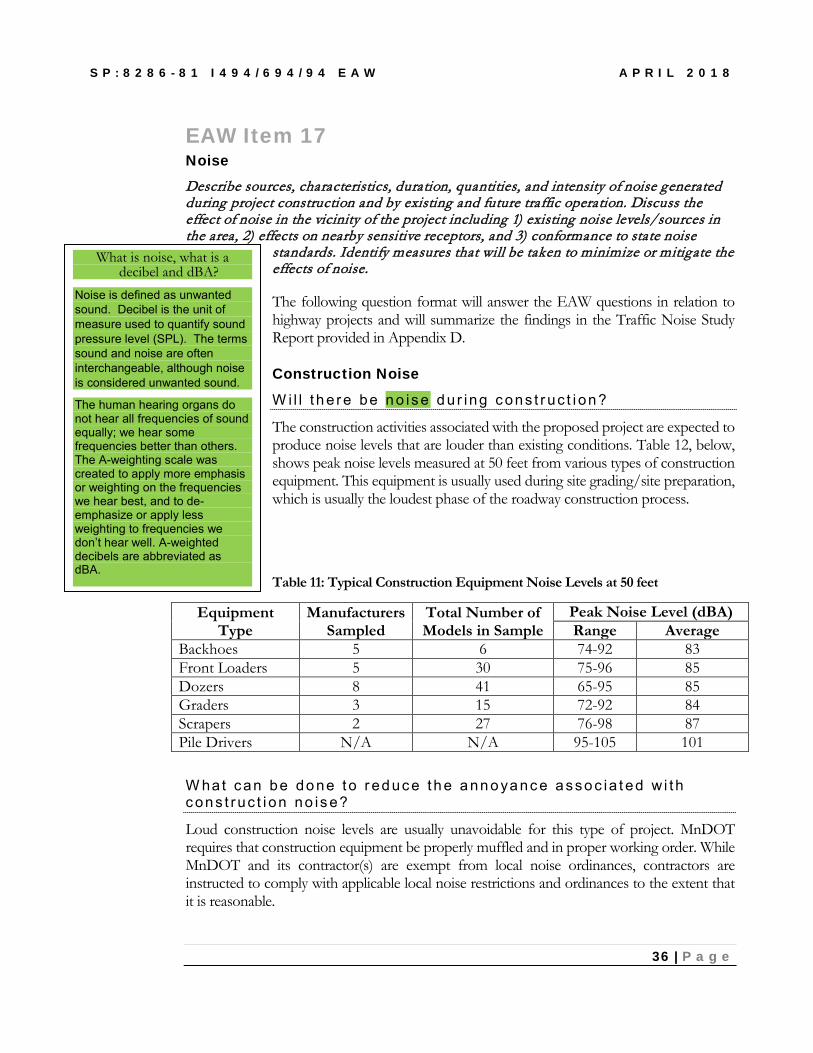
S P : 8 2 8 6 - 8 1 I 4 9 4 / 6 9 4 / 9 4 E A W A P R I L 2 0 1 8
What is noise, what is a decibel and dBA?
Noise is defined as unwanted sound. Decibel is the unit of measure used to quantify sound pressure level (SPL). The terms sound and noise are often interchangeable, although noise is considered unwanted sound.
The human hearing organs do not hear all frequencies of sound equally; we hear some frequencies better than others. The A-weighting scale was created to apply more emphasis or weighting on the frequencies we hear best, and to deemphasize or apply less weighting to frequencies we don’t hear well. A-weighted decibels are abbreviated as dBA.
EAW Item 17 Noise Describe sources, characteristics, duration, quantities, and intensity of noise generated during project construction and by existing and future traffic operation. Discuss the effect of noise in the vicinity of the project including 1) existing noise levels/sources in the area, 2) effects on nearby sensitive receptors, and 3) conformance to state noise
standards. Identify measures that will be taken to minimize or mitigate the effects of noise.
The following question format will answer the EAW questions in relation to highway projects and will summarize the findings in the Traffic Noise Study Report provided in Appendix D.
Construction Noise
W i l l t h e re be n o is e d u r ing c ons t r uc t i on ?
The construction activities associated with the proposed project are expected to produce noise levels that are louder than existing conditions. Table 12, below, shows peak noise levels measured at 50 feet from various types of construction equipment. This equipment is usually used during site grading/site preparation, which is usually the loudest phase of the roadway construction process.
Table 11: Typical Construction Equipment Noise Levels at 50 feet
Equipment Manufacturers Total Number of Peak Noise Level (dBA) Type Sampled Models in Sample Range Average
Backhoes 5 6 74-92 83 Front Loaders 5 30 75-96 85 Dozers 8 41 65-95 85 Graders 3 15 72-92 84 Scrapers 2 27 76-98 87 Pile Drivers N/A N/A 95-105 101
W hat can be do ne to r ed uc e t h e a nn o ya nc e a sso c ia t ed w i t h c on s t ruc t i on no is e?
Loud construction noise levels are usually unavoidable for this type of project. MnDOT requires that construction equipment be properly muffled and in proper working order. While MnDOT and its contractor(s) are exempt from local noise ordinances, contractors are instructed to comply with applicable local noise restrictions and ordinances to the extent that it is reasonable.
36 | P a g e
S P : 8 2 8 6 - 8 1 I 4 9 4 / 6 9 4 / 9 4 E A W A P R I L 2 0 1 8
Nighttime construction activities may sometimes be necessary to minimize traffic impacts and improve safety. However, in this project, construction activities would be limited to daytime hours as much as possible. This project would likely be under construction for two construction seasons. The staging of construction activities and the need for nighttime construction would be determined during the final design stage of the project. Communities that might be affected by construction noise will be notified in advance of any planned, unusually loud nighttime construction activities.
Construction activities that make loud impulsive noises, such as pavement sawing or jack hammering, will be unavoidable with construction of the proposed project. Pile-driving noise is associated with any bridge construction and sheet piling necessary for retaining wall construction. Pile-driving produces the highest peak noise levels, as shown in Table 12. Pile-driving would be prohibited during nighttime hours. The use of jack hammers and pavement sawing equipment would be prohibited during nighttime hours.
Traffic Noise Analysis
Tra f f i c No i se S tu d y Re por t
A noise analysis was completed for the I-694/I-494/I-94 bridge rehabilitation project. The following is a summary of the Traffic Noise Study Report. This report includes background information on noise, information regarding traffic noise regulations, and MPCA noise standards (See Appendix D, Tables 1-2: FHWA Noise Abatement Criteria), a discussion of the traffic noise analysis methodology, documentations of the potential traffic noise impacts associated with the proposed project, and an evaluation of noise abatement measures.
Ho w is t r a f f i c n o i se reg u la te d in M in nes o ta ?
The FHWA’s traffic noise regulation is described in 23 Code of Federal Regulations (CFR) Part 772 (Procedures for Abatement of Highway Traffic Noise and Construction Noise. 23 CFR 772 requires the identification of highway noise impacts and the evaluation of potential noise abatement measures, along with other considerations, in conjunction with the planning and design of a Federal-air highway project.
The MnDOT requirements for implementation of 23 CFR 772 are described in the MnDOT Noise Requirements for Type I Federal-aid Projects (effective July 10, 2017). The MnDOT Noise Requirements apply to all projects that receive Federal-aid funds or projects that are subject to FHWA guidance. For Type 1 projects (under the FHWA traffic noise definition), projects must follow procedures in the MnDOT Noise Requirements. In 2016, the Commissioners of the MPCA and MnDOT agreed that the traffic noise regulations and mitigation requirements from the FHWA are sufficient to determine reasonable mitigation measures for highway noise. By this agreement, existing and newly constructed segments of highway projects under MnDOT’s jurisdiction are statutorily exempt from Minnesota State Noise Standards (MN Rule 7030 ) if the project applies the FHWA traffic noise requirements.
Traffic noise impacts are determined based on land use activities and predicted worst hourly (Leq) noise levels under future conditions. The Federal Noise Abatement Criterion (Leq) are
37 | P a g e

S P : 8 2 8 6 - 8 1 I 4 9 4 / 6 9 4 / 9 4 E A W A P R I L 2 0 1 8
presented in Appendix D, Tables 1-2: FHWA Noise Abatement Criteria. The term receptor is used to refer to a specific location of frequent outdoor use (e.g., a home or a business). Traffic noise impacts are identified in two ways. First, receptor locations where noise levels are “approaching” or exceeding the criterion level, which must also be evaluated for noise abatement feasibility and reasonableness. In Minnesota “approaching” is defined as 1 dBA or less below the Federal Noise Abatement Criterion. Second, receptor locations where a “substantial increase” occurs when comparing future modeled noise levels to existing modeled noise levels. A “substantial increase” is defined as an increase of 5 dBA or greater from existing to future conditions.
Ho w a r e t r a f f i c no is e impa c ts de t e rm in ed ?
Traffic noise is evaluated by modeling the traffic noise levels during the hours of the day and/or night that have the loudest traffic. The traffic noise model uses existing and forecasted traffic volumes, as well as characteristics of the roadway and surrounding environment, to calculate traffic noise levels at representative receptor locations. Modeled traffic noise levels are then compared to Federal Noise Abatement Criterion. If modeled traffic noise levels are projected to exceed Federal Noise Abatement Criterion under the Build Alternative, then a traffic noise impact is identified and noise abatement measures (e.g., noise barriers) are considered.
Ho w was t r a f f i c n o is e e va lu a te d o n t h i s p ro j ec t?
Traffic noise levels were modeled for the existing (2016) conditions, the future (2040) No-Build Alternative, and the future (2040) Build Alternative using the FHWA Traffic Noise Model Version 2.5 (TNM 2.5). The model uses traffic volumes, speed, class of vehicle, and the typical characteristics of the roadway being analyzed (e.g., roadway horizontal and vertical alignment). The noise modeling assumed free-flow conditions through identified project limits as a worst-case scenario. Traffic noise levels were modeled at 49 representative receptor locations along the proposed I-694/I-494/I-94 project corridor. These modeled receptor locations represent residential, commercial, recreational, and industrial land uses.
W hat wer e t h e res u l t s o f t he t r a f f i c no is e a na l ys is?
The Traffic Noise Study Report found in Appendix D provides the detailed analysis for each receptor.
Table 13 below provides a summary of the noise level ranges and the number of receptors that exceed state noise level standards for existing (2016), future (2040) No-Build Alternative, and future (2040) Build Alternative. The worst hour Leq noise levels for the existing conditions varied between 55.5 dBA to 80.3 dBA, while the future (2040) No-Build Alternative varied between 56.3 dBA and 81.2 dBA and the future (2040) Build Alternative varied between 56.3 dBA and 81.2 dBA.
38 | P a g e
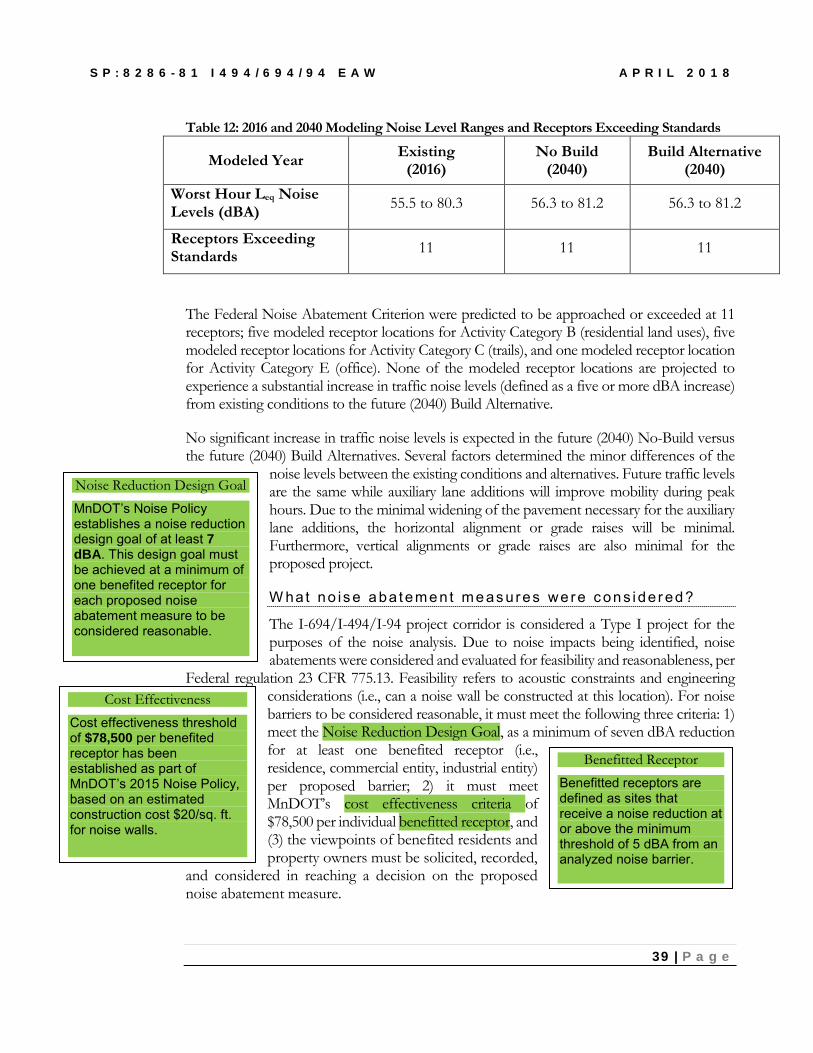
S P : 8 2 8 6 - 8 1 I 4 9 4 / 6 9 4 / 9 4 E A W A P R I L 2 0 1 8
Table 12: 2016 and 2040 Modeling Noise Level Ranges and Receptors Exceeding Standards
Modeled Year Existing (2016)
No Build (2040)
Build Alternative (2040)
Worst Hour Leq Noise Levels (dBA) 55.5 to 80.3 56.3 to 81.2 56.3 to 81.2
Receptors Exceeding Standards 11 11 11
The Federal Noise Abatement Criterion were predicted to be approached or exceeded at 11 receptors; five modeled receptor locations for Activity Category B (residential land uses), five modeled receptor locations for Activity Category C (trails), and one modeled receptor location for Activity Category E (office). None of the modeled receptor locations are projected to experience a substantial increase in traffic noise levels (defined as a five or more dBA increase) from existing conditions to the future (2040) Build Alternative.
No significant increase in traffic noise levels is expected in the future (2040) No-Build versus the future (2040) Build Alternatives. Several factors determined the minor differences of the
Noise Reduction Design Goal
MnDOT’s Noise Policy establishes a noise reduction design goal of at least 7 dBA. This design goal must be achieved at a minimum of one benefited receptor for each proposed noise abatement measure to be considered reasonable.
noise levels between the existing conditions and alternatives. Future traffic levels are the same while auxiliary lane additions will improve mobility during peak hours. Due to the minimal widening of the pavement necessary for the auxiliary lane additions, the horizontal alignment or grade raises will be minimal. Furthermore, vertical alignments or grade raises are also minimal for the proposed project.
W hat no is e a ba teme n t me as ures we re c on s ide r ed ?
The I-694/I-494/I-94 project corridor is considered a Type I project for the purposes of the noise analysis. Due to noise impacts being identified, noise abatements were considered and evaluated for feasibility and reasonableness, per
Cost Effectiveness
Cost effectiveness threshold of $78,500 per benefited receptor has been established as part of MnDOT’s 2015 Noise Policy, based on an estimated construction cost $20/sq. ft. for noise walls.
Federal regulation 23 CFR 775.13. Feasibility refers to acoustic constraints and engineering considerations (i.e., can a noise wall be constructed at this location). For noise barriers to be considered reasonable, it must meet the following three criteria: 1) meet the Noise Reduction Design Goal, as a minimum of seven dBA reduction for at least one benefited receptor (i.e., residence, commercial entity, industrial entity) per proposed barrier; 2) it must meet MnDOT’s cost effectiveness criteria of $78,500 per individual benefitted receptor, and (3) the viewpoints of benefited residents and property owners must be solicited, recorded,
and considered in reaching a decision on the proposed noise abatement measure.
Benefitted Receptor
Benefitted receptors are defined as sites that receive a noise reduction at or above the minimum threshold of 5 dBA from an analyzed noise barrier.
39 | P a g e

S P : 8 2 8 6 - 8 1 I 4 9 4 / 6 9 4 / 9 4 E A W A P R I L 2 0 1 8
Noise barriers were evaluated at two modeled receptor locations within the project area where traffic noise levels are predicted to approach or exceed FHWA noise abatement criteria under future (2040) Build Alternative conditions. The locations of the modeled noise barriers are presented in Exhibit 1.1 through 1.3 in Appendix D.
Two noise barriers were investigated to shield the impacts to receptors. Neither Noise Barrier Wall met MnDOT’s feasible nor reasonable criteria. Both Noise Barrier Walls did not achieve MnDOT’s noise reduction goal of seven dBA or higher for any of the receptor locations.
Noise Barrier Wall 1
Noise Barrier Wall 1 was investigated attempting to primarily shield the impacts to trail receptors, and also two nearby receptors from NSA 2. A wall with varying heights of 20 feet off stricture and 10 feet on structure at a total length of 1,430 feet was modeled. A portion of wall was modeled at a maximum height of 10 feet on Tamarack Road Bridge for a length of 262 feet, in concurrence with MnDOT’s established standard for existing bridges. Two trail receptors received a noise reduction above five dBA, but below the design goal of seven dBA. The wall did not achieve MnDOT’s noise reduction goal of seven dBA or higher at any of the receptor locations. Additional barrier heights were not analyzed due to the design goal not being met with the maximum barrier height. Noise Barrier Wall 1 was considered not reasonable and was not proposed.
Noise Barrier Wall 2
Noise Barrier Wall 2 was investigated to shield the impacts to two residential receptors, two commercial receptors, and one industrial receptor in NSA 3. A 20 foot wall at a total length of 1,105 feet was modeled. At the maximum height of 20 feet, five receptors received a 5 dBA noise reduction. No receptors achieved the noise reduction design goal of seven dBA or higher. Additional barrier heights were not analyzed due to the design goal not being met with the maximum barrier height. Noise Barrier Wall 2 was considered not reasonable and was not proposed.
EAW Item 18 Transportation a. Describe traffic-related aspects of project construction and operation. Include: 1) existing and proposed additional parking spaces, 2) estimated total average daily traffic generated, 3) estimated maximum peak hour traffic generated and time of occurrence, 4) indicate source of trip generation rates used in the estimates, and 5) availability of transit and/or other alternative transportation modes.
Sub-parts 1 through 4 of item 18a are not applicable to this proposed roadway improvement project.
Currently, Metro Transit operates line 219 which serves Maplewood, just west of the northern portion of the project area. Portions of the southern part of the project area are served by Metro Transit line 351 with express service to Woodbury and downtown St. Paul. The
40 | P a g e

S P : 8 2 8 6 - 8 1 I 4 9 4 / 6 9 4 / 9 4 E A W A P R I L 2 0 1 8
METRO Gold Line is a planned nine-mile Metro Transit dedicated Bus Rapid Transit (BRT) line that will connect St. Paul, to Woodbury and will generally follow I-94. A dedicated BRT bridge over I-94 is proposed to be located just east of the I-694/I-494/I-94 interchange.
b. Discuss the effect on traffic congestion on affected roads and describe any traffic improvements necessary. The analysis must discuss the project’s impact on the regional transportation system.
If the peak hour traffic generated exceeds 250 vehicles or the total daily trips exceeds 2,500, a traffic impact study must be prepared as part of the EAW. Use the format and procedures described in the Minnesota Department of Transportation’s Access Management Manual, Chapter 5 (available at: http://www.dot.state.mn.us/accessmanagement/resources.html) or a similar local guidance.
The proposed project is a transportation improvement project that has the purpose to improve the mobility of I-694/I-494/I-94 in the project area, which benefits the regional transportation system. The following Figure 2 and Figure 3 generated from the CORSIM microsimulation model demonstrates how the Level of Service (LOS)7 will improve in the forecast year 2030 for the proposed Build Alternative when compared to the 2030 No Build Alternative (the report and figures from the CORSIM microsimulation modeling are available upon request).
7 Level of Service is explained on page 4 under EAW Item 6.
41 | P a g e

S P : 8 2 8 6 - 8 1 I 4 9 4 / 6 9 4 / 9 4 E A W A P R I L 2 0 1 8
Figure 2: 2030 Northbound Alternative Comparison AM Peak Hour
42 | P a g e


S P : 8 2 8 6 - 8 1 I 4 9 4 / 6 9 4 / 9 4 E A W A P R I L 2 0 1 8
Figure 3: 2030 Southbound Alternative Comparison AM Peak Hour
43 | P a g e


S P : 8 2 8 6 - 8 1 I 4 9 4 / 6 9 4 / 9 4 E A W A P R I L 2 0 1 8
c. Discuss the effect on traffic congestion on affected roads and describe any traffic improvements necessary. The analysis must discuss the project’s impact on the regional transportation system.
See above answer to question b. The project is a transportation project in itself and as a result will not need supporting traffic improvements.
EAW Item 19 Cumulative potential effects: a. Describe the geographic scales and timeframes of the project related environmental effects that could combine with other environmental effects resulting in cumulative potential effects.
The time horizon of the cumulative effects analysis is the proposed service life of the roadway improvement; thus, approximately 2040.
The spatial scale of the cumulative effects analysis takes into account the importance of the I-694/ I-494/ I-94 interchange system as a truck route and general mobility for motorists around the Twin Cities metro area. For purposes of this EAW, the spatial limits of the cumulative effects analysis is bounded as described in the following:
on the north by the 10th Street/ I-694 Interchange,
on the south by the Tamarack Road/ I-494 Interchange,
on the west by the Century Avenue (Minnesota State Highway 120)/ I-94 interchange, and
on the east by the Inwood Avenue East/ Radio Drive / I-94 Interchange.
This spatial cumulative effects analysis boundary is located approximately within a 1 mile radius of the I-694/ I-494/ I-94 interchange. The western boundary of the analysis area is the Ramsey – Washington County line. Proposed infrastructure and developments within this spatial boundary have a reasonable chance of contributing to cumulative effects on a broad suite of social, environmental and economic issues. The cumulative effects analysis area and potential contributing projects are depicted on Figure A-11 (Appendix A).
b. Describe any reasonably foreseeable future projects (for which a basis of expectation has been laid) that may interact with environmental effects of the proposed project within the geographic scales and timeframes identified above.
For purposes of this EAW, a suite of transportation-related projects (MnDOT, county and city), commercial and residential projects are summarized that are reasonably foreseeable within the temporal and spatial boundaries of this analysis. Reasonably foreseeable projects are those large-scale infrastructure activities that are currently funded, supported through city zoning, or have been the topic of ongoing planning with city councils or other planning entities. Table 14
44 | P a g e

S P : 8 2 8 6 - 8 1 I 4 9 4 / 6 9 4 / 9 4 E A W A P R I L 2 0 1 8
summarizes present and future developments, within specified temporal and spatial bounds, that may contribute to potential cumulative effects to resources within the I-694/ I-494/ I-94 project area.
Table 13: Projects Potentially Contributing to Cumulative Effects8
Action Approximate Construction
Timing Summary of Action
Potential Applicable
Cumulative Effect I-694/ I-494/ I-94 Interchange and Approach Improvements
March 2019 – November 2020
See EAW Item 6. Land use, stormwater
The proposed Helmo Avenue North Residential Development
~2020-2021
Proposed to be located on the north side of I-94 and several hundred feet east of the I-694/ I-494/ I-94 Interchange, between Helmo Avenue North and Ideal Avenue North. The City of Oakdale is planning for development on a 56.9-acre site with up to 810
Land use, stormwater, groundwater appropriation
units of multi-family residential units, 360,000 square feet of office and 50,000 square feet of retail.
MN Hwy 120 from I-94 north to Woodland Drive (Maplewood)
March – September 2019
Upgrades to and optimization of signal timing
Potential net positive impact on traffic congestion and air quality
Various Zoning (cities of Oakdale and Woodbury)
NA
City of Woodbury near the Tamarack Road Interchange zoned as “Gateway” (Commercial). City of Oakdale near the 10th Street Interchange zoned as “Community Commercial”.
Land use, stormwater, groundwater appropriation
8 The Ramsey County Transportation Improvement Plan (2018-2022) was reviewed and it did not propose any road improvements within the cumulative effects analysis area.
45 | P a g e

S P : 8 2 8 6 - 8 1 I 4 9 4 / 6 9 4 / 9 4 E A W A P R I L 2 0 1 8
Action Approximate Construction
Timing Summary of Action
Potential Applicable
Cumulative Effect
Washington County Hwy 13 (Inwood Avenue/ Radio Drive) Pedestrian Bridge
~2020-2022 Pedestrian bridge over I-94 on Inwood Avenue/ Radio Drive.
Potential positive impact on pedestrian mobility, other impacts likely negligible
Gateway Corridor/ Gold Line BRT
Potentially operational by 2024
Metropolitan Council Bus Rapid Transit (BRT) and associated stations. Circulates between downtown St. Paul and Woodbury/ Oakdale.
Potential minor positive impacts on congestion and air quality
c. Discuss the nature of the cumulative potential effects and summarize any other available information relevant to determining whether there is potential for significant environmental effects due to these cumulative effects.
The following text summarizes social, environmental and economic issues relevant to the subject project area and discusses the degree to which nearby proposed infrastructure would impose net cumulative effects, positive or negative. See Table 15– Summary of Cumulative Impacts.
Table 14: Summary of Cumulative Impacts Social,
Environmental, Economic Issue
Cumulative Impacts Mitigation
Land Use Land use within the cumulative effects analysis area is nearly at full build-out. City zoning ordinances for Oakdale and Woodbury support high density residential, commercial and industrial development. Transportation improvements at the regional, state, county and city level are compatible with high density development.
The cities of Oakdale and Woodbury support transit-oriented development (TOD). Thus, proposed development and accommodations for easy vehicle, bike and pedestrian access to proposed BRT transit stations are work in harmony and are compliant with zoning ordinances.
Stormwater Most new infrastructure projects will likely have additional rehabilitated or new impervious surface. Thus, additional
Typically new infrastructure projects upgrade stormwater management to be more effective using updated Best Management
46 | P a g e
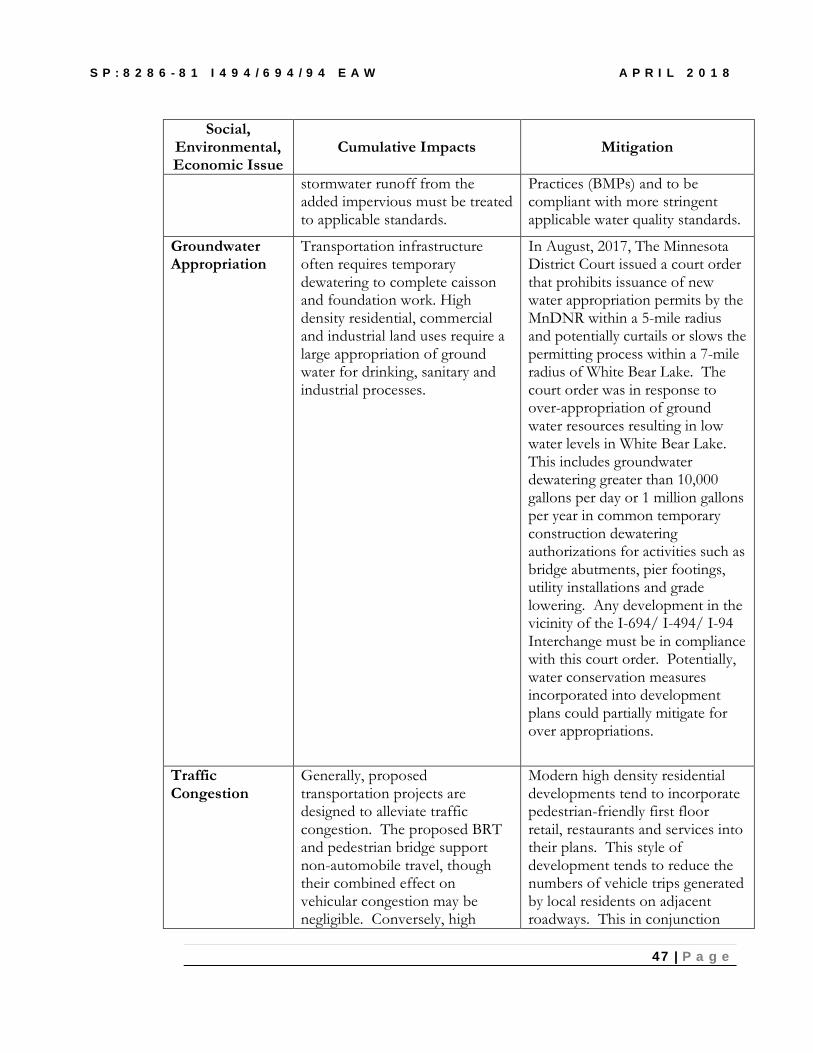
S P : 8 2 8 6 - 8 1 I 4 9 4 / 6 9 4 / 9 4 E A W A P R I L 2 0 1 8
Social, Environmental, Economic Issue
Cumulative Impacts Mitigation
stormwater runoff from the added impervious must be treated to applicable standards.
Practices (BMPs) and to be compliant with more stringent applicable water quality standards.
Groundwater Transportation infrastructure In August, 2017, The Minnesota Appropriation often requires temporary
dewatering to complete caisson and foundation work. High density residential, commercial and industrial land uses require a large appropriation of ground water for drinking, sanitary and industrial processes.
District Court issued a court order that prohibits issuance of new water appropriation permits by the MnDNR within a 5-mile radius and potentially curtails or slows the permitting process within a 7-mile radius of White Bear Lake. The court order was in response to over-appropriation of ground water resources resulting in low water levels in White Bear Lake. This includes groundwater dewatering greater than 10,000 gallons per day or 1 million gallons per year in common temporary construction dewatering authorizations for activities such as bridge abutments, pier footings, utility installations and grade lowering. Any development in the vicinity of the I-694/ I-494/ I-94 Interchange must be in compliance with this court order. Potentially, water conservation measures incorporated into development plans could partially mitigate for over appropriations.
Traffic Generally, proposed Modern high density residential Congestion transportation projects are
designed to alleviate traffic congestion. The proposed BRT and pedestrian bridge support non-automobile travel, though their combined effect on vehicular congestion may be negligible. Conversely, high
developments tend to incorporate pedestrian-friendly first floor retail, restaurants and services into their plans. This style of development tends to reduce the numbers of vehicle trips generated by local residents on adjacent roadways. This in conjunction
47 | P a g e


S P : 8 2 8 6 - 8 1 I 4 9 4 / 6 9 4 / 9 4 E A W A P R I L 2 0 1 8
Social, Environmental, Economic Issue
Cumulative Impacts Mitigation
density residential, industrial and commercial development generate roadway trips and contribute to roadway congestion.
with the proposed road improvements to enhance mobility and would tend to partially mitigate for potential increased congestion resulting from development.
Pedestrian Inwood Avenue/ Radio Drive The pedestrian and bike bridge Mobility crossing of I-94 does not
currently have adequate pedestrian and bike accommodations. Being an interstate roadway, the I-694/ I-494/ I-94 interchange does not currently nor is it proposed to accommodate pedestrians and bikes.
proposed next to Inwood Avenue/ Radio Drive will serve to alleviate current deficiencies with pedestrian/ bike mobility to connect the cities Woodbury and Oakdale across I-94.
Gateway Corridor/ Gold Line BRT
Potentially operational by 2024
Metropolitan Council Bus Rapid Transit (BRT) and associated stations. Circulates between downtown St. Paul and Woodbury/ Oakdale.
EAW Item 20 Other potential environmental effects: If the project may cause any additional environmental effects not addressed by items 1 to 19, describe the effects here, discuss the how the environment will be affected, and identify measures that will be taken to minimize and mitigate these effects.
There are no anticipated other potential environmental effects associated with this roadway improvement project.
48 | P a g e