Environmental assessment of Sweden-related LNG fleet in ...
28
No. C 369 January 2019 Environmental assessment of Sweden-related LNG fleet in the Baltic Sea and the North Sea Emissions to air and external costs Commissioned by the Swedish Gas Association Katarina Yaramenka, Erik Fridell, Stefan Åström
Transcript of Environmental assessment of Sweden-related LNG fleet in ...

No. C 369
January 2019
Environmental assessment of Sweden-related LNG fleet in the Baltic Sea and the North Sea
Emissions to air and external costs
Commissioned by the Swedish Gas Association
Katarina Yaramenka, Erik Fridell, Stefan Åström

Authors: Katarina Yaramenka, Erik Fridell, Stefan Åström Commissioned by: the Swedish Gas Association Report number: C 369 © IVL Swedish Environmental Research Institute 2019 IVL Swedish Environmental Research Institute Ltd., P.O Box 210 60, S-100 31 Stockholm, Sweden Phone +46-(0)10-788 65 00 // Fax +46-(0)10-788 65 90 // www.ivl.se This report has been reviewed and approved in accordance with IVL's audited and approved management system. .

Table of contents
Foreword ................................................................................................................................ 5
Summary ................................................................................................................................ 7
Sammanfattning..................................................................................................................... 7
1 Background ..................................................................................................................... 9
2 Emissions to air ............................................................................................................. 11
2.1 Input data and main assumptions ................................................................................................... 11 2.2 Emissions ......................................................................................................................................... 12
3 Environmental and health impacts and external costs ................................................ 15
Discussion and conclusions .................................................................................................. 19
References ........................................................................................................................... 23
Appendix 1. List of LNG vessels ............................................................................................ 25
Appendix 2. A short note on the method used in the calculations of external costs ......... 27
.

Report C 369 Environmental assessment of Sweden-related LNG fleet in the Baltic Sea and the North Sea – Emissions to air and external costs
4

Report C 369 Environmental assessment of Sweden-related LNG fleet in the Baltic Sea and the North Sea – Emissions to air and external costs
5
Foreword We are very thankful to all who have contributed to this study with valuable input data regarding technical parameters and navigation patterns of existing and ordered/constructed LNG vessels:
Mats Emanuelson (Destination Gotland), Henrik Källsson (Erik Thun), Clas Gustafsson (Furetank), Bas Luurtsema (Hanze University of Applied Science Groningen), Erik Zwijghuizen (MF Shipping Group), Daniel Backman (Sirius Shipping), Anders Hermansson (Tarbit Shipping), Dick Höglund, Fares Bergaoui (Terntank), Jan Thore Foss, Jonny Pettersson (UECC), Kari Granberg, Susanna Airola, Dennis Palin, Ulf Hagström (Viking Line), and Carl Fagergren (Wallenius Marine)

Report C 369 Environmental assessment of Sweden-related LNG fleet in the Baltic Sea and the North Sea – Emissions to air and external costs
6

Report C 369 Environmental assessment of Sweden-related LNG fleet in the Baltic Sea and the North Sea – Emissions to air and external costs
7
Summary The objective of this study is to provide estimates of emissions from the liquefied natural gas (LNG) fuelled ships related to Sweden, and to outline benefits for society through reduced external costs of air pollutants and greenhouse gases from fuel shift from marine gasoil (MGO) to LNG. The total societal benefits from the Sweden-related LNG fleet in 2017 are estimated at 17.4 million €2010. This estimate includes reduced health and climate impacts and reduced crop damage.
The largest contributor to the benefits is positive impact of emission reductions on population health. Lower emissions of primary particles (PM2.5), nitrogen oxides (NOx) and sulphur dioxide (SO2) from LNG vessels, compared to a reference fleet running on MGO, result in lower concentrations of primary and secondary PM2.5 and ground-level ozone, and subsequently reduced premature mortality. Differences in emissions of main air pollutants between the analysed LNG fleet of 12 ships and a reference MGO fleet in 2017 are calculated to 100 tonnes of SO2, 160 tonnes of PM2.5 and 3 200 tonnes of NOx. The reduced NOX emissions correspond to the emissions from 24 300 average heavy duty trucks with an average mileage on the Swedish roads during the same year. Emissions of greenhouse gases (CO2 equivalents) are modelled to be similar for the LNG fleet and the MGO fuelled reference fleet: emissions of CO2 equivalents from the MGO fleet are estimated to be 6 ktonnes higher in 2017.
Estimated emissions for 2022 are calculated assuming that present and already ordered LNG ships run mainly on LNG. The difference in emissions between these ships and reference ships fuelled with MGO is then significantly larger and constitutes 385 tonnes of SO2, 540 tonnes of PM2.5 and 11 200 tonnes of NOx. Emissions of greenhouse gases in 2022 are estimated at 640 ktonnes CO2 equivalents for the LNG fleet and 660 ktonnes CO2 equivalents for the MGO fleet.
Sammanfattning Syftet med denna studie är att uppskatta emissioner till luft från de Sverigerelaterade fartyg som drivs med förvätskad naturgas (LNG) samt samhällsnyttan genom minskade externa kostnader för luftföroreningar och klimatgaser vid övergång från gasolja (MGO) till LNG-drift. Den totala samhällsnyttan från den Sverigerelaterade LNG-flottan uppskattas till 17.4 miljoner €2010 år 2017. I denna uppskattning ingår hälsoeffekter, klimatpåverkan samt minskade skador på jordbruksgrödor.
Det största bidraget till den totala nyttan kommer från förbättrad folkhälsa till följd av minskade utsläpp. Jämfört med referensflottan som går på MGO har LNG-fartyg lägre utsläpp av primära partiklar (PM2.5), kväveoxider (NOx) och svaveldioxid (SO2), vilket ger lägre koncentrationer av sekundära PM2.5 och marknära ozon. Detta resulterar i lägre förtida dödlighet. För år 2017 uppskattas LNG-flottan ge lägre utsläpp med 100 ton SO2, 160 ton PM2.5 och 3 200 ton NOx jämfört med en motsvarande MGO-flotta. Skillnaden i utsläppen av NOx motsvarar utsläpp från 24 300 tunga lastbilar (en genomsnittlig tung lastbil som kör en genomsnittlig sträcka) på svenska vägar under samma år. Skillnaden i utsläppen av växthusgaser (CO2-ekvivalenter) är enligt beräkningarna ganska liten. LNG-flottan har, jämfört med en motsvarande MGO-flotta, 6 kiloton lägre utsläpp av CO2-ekvivalenter för 2017.
För 2022 års utsläppsberäkningar gjordes antagandet att både driftsatta och beställda LNG-fartyg kommer använda LNG som huvudbränsle. Detta antagande ger väsentligt högre emissionsskillnader mellan LNG-flottan och motsvarande MGO-fartyg. Den totala skillnaden uppskattas till 385 ton SO2, 540 ton PM2.5 och 11 200 ton NOx. Utsläpp av växthusgaser för år 2022 uppskattas till 640 kton CO2-ekvivalenter för LNG-flottan och 660 kton CO2-ekvivalenter för en motsvarande MGO-flotta.

Report C 369 Environmental assessment of Sweden-related LNG fleet in the Baltic Sea and the North Sea – Emissions to air and external costs
8
Report C 369 Environmental assessment of Sweden-related LNG fleet in the Baltic Sea and the North Sea – Emissions to air and external costs
9
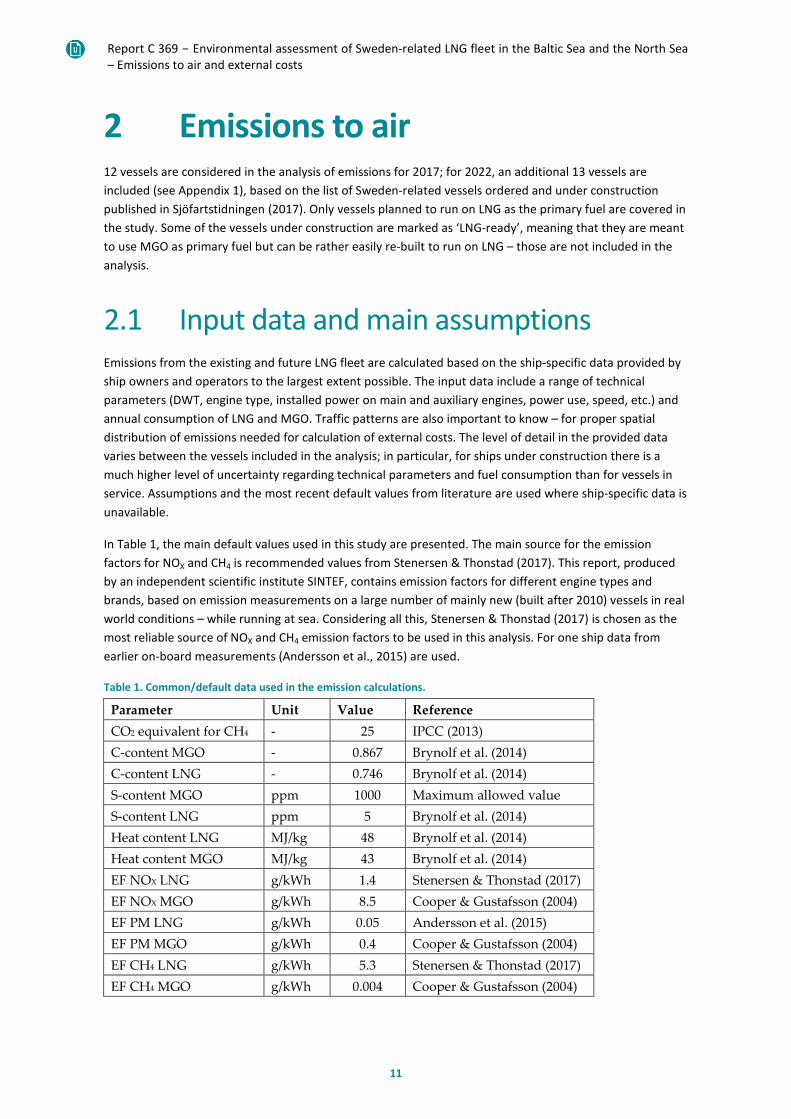
1 Background The world’s LNG (liquefied natural gas) fleet is constantly growing. According to estimates by Stenersen & Thonstad (2017) (Figure 1 below), the number of gas fuelled vessels was about 117 worldwide in the end of 2016. Many of the LNG vessels navigate in the Baltic Sea and the North Sea1 which are areas with strict sulphur regulations (sulphur emission control area – SECA), also designated as NOx emission control areas (NECA). Use of LNG as an alternative to MGO (marine gas oil) as marine fuel is one way to comply with these regulations, bringing additional benefits in the form of reduced emissions of particles and CO2 but, with present technology, increased methane emissions. Lower emissions from shipping result in lower impact on population health, as well as less damage to crops and materials.
Figure 1. Number of LNG ships in operation worldwide, as per December 2016 (Stenersen & Thonstad 2017).
The objective of this study is to provide estimates of emissions from the LNG vessel fleet related to Sweden, and to outline benefits for society through reduced external costs for air pollutants and greenhouse gases. External cost is a concept used by environmental economists to capture negative or positive impacts of consumption and production that are not included (compensated for) in the price of the goods or services produced. Costs for environmental degradation and human health impacts from air pollution are typical examples of external costs.
In the concept Sweden-related LNG vessel fleet we include vessels that are controlled from Swedish companies or frequently visit Sweden. Not all of the vessels are registered or flagged in Sweden – but common for all of them is that they spend most of their operating hours in waters close to Sweden and in Swedish ports. The complete list of vessels included in the analysis is provided in Appendix 1. Note that the list does not cover all LNG vessels operating in the Baltic Sea and the North Sea. Vessels with no explicit connection to Sweden – like those navigating close to Poland, the Netherlands, or Germany, and owned by non-Swedish companies – are not included although their lower emissions also have less negative effects on population health and environment in Europe.
1 Including the English Channel (throughout the report)

Report C 369 Environmental assessment of Sweden-related LNG fleet in the Baltic Sea and the North Sea – Emissions to air and external costs
10
If the growing trend shown in Figure 1 continues, much higher emission reductions can be expected in the future. The current report provides estimates for expected emission reductions from replacing MGO vessels with LNG vessels in 2022 – this is done by including in the emission calculation vessels currently ordered/under construction.
The differences in emissions and the related societal benefits are estimated by comparing emissions from LNG ships with emissions from so called reference ships – ships that LNG vessels (are supposed to) replace. In some cases it is difficult to point out a specific reference ship corresponding to a new-built LNG vessel. In this study, by reference ship we mean a vessel with the same technical and operational parameters as a considered LNG vessel, navigating in the same area – the only difference is that it is fuelled by MGO. In reality, there are other important changes happening upon fleet renewal: in particular, higher energy efficiency of new-builds compared to old vessels does often make a rather significant contribution to the total emission reductions. Since the objective of this study is to analyse the benefits from LNG compared to MGO, we do not take into account factors other than fuel change.
In this report we first present the calculated emission changes following the use of LNG ships instead of MGO ships and then the calculated difference in external costs following from these changes.
Report C 369 Environmental assessment of Sweden-related LNG fleet in the Baltic Sea and the North Sea – Emissions to air and external costs
11
2 Emissions to air 12 vessels are considered in the analysis of emissions for 2017; for 2022, an additional 13 vessels are included (see Appendix 1), based on the list of Sweden-related vessels ordered and under construction published in Sjöfartstidningen (2017). Only vessels planned to run on LNG as the primary fuel are covered in the study. Some of the vessels under construction are marked as ‘LNG-ready’, meaning that they are meant to use MGO as primary fuel but can be rather easily re-built to run on LNG – those are not included in the analysis.
2.1 Input data and main assumptions Emissions from the existing and future LNG fleet are calculated based on the ship-specific data provided by ship owners and operators to the largest extent possible. The input data include a range of technical parameters (DWT, engine type, installed power on main and auxiliary engines, power use, speed, etc.) and annual consumption of LNG and MGO. Traffic patterns are also important to know – for proper spatial distribution of emissions needed for calculation of external costs. The level of detail in the provided data varies between the vessels included in the analysis; in particular, for ships under construction there is a much higher level of uncertainty regarding technical parameters and fuel consumption than for vessels in service. Assumptions and the most recent default values from literature are used where ship-specific data is unavailable.
In Table 1, the main default values used in this study are presented. The main source for the emission factors for NOX and CH4 is recommended values from Stenersen & Thonstad (2017). This report, produced by an independent scientific institute SINTEF, contains emission factors for different engine types and brands, based on emission measurements on a large number of mainly new (built after 2010) vessels in real world conditions – while running at sea. Considering all this, Stenersen & Thonstad (2017) is chosen as the most reliable source of NOX and CH4 emission factors to be used in this analysis. For one ship data from earlier on-board measurements (Andersson et al., 2015) are used.
Table 1. Common/default data used in the emission calculations.
Parameter Unit Value Reference CO2 equivalent for CH4 - 25 IPCC (2013) C-content MGO - 0.867 Brynolf et al. (2014) C-content LNG - 0.746 Brynolf et al. (2014) S-content MGO ppm 1000 Maximum allowed value S-content LNG ppm 5 Brynolf et al. (2014) Heat content LNG MJ/kg 48 Brynolf et al. (2014) Heat content MGO MJ/kg 43 Brynolf et al. (2014) EF NOX LNG g/kWh 1.4 Stenersen & Thonstad (2017) EF NOX MGO g/kWh 8.5 Cooper & Gustafsson (2004) EF PM LNG g/kWh 0.05 Andersson et al. (2015) EF PM MGO g/kWh 0.4 Cooper & Gustafsson (2004) EF CH4 LNG g/kWh 5.3 Stenersen & Thonstad (2017) EF CH4 MGO g/kWh 0.004 Cooper & Gustafsson (2004)

Report C 369 Environmental assessment of Sweden-related LNG fleet in the Baltic Sea and the North Sea – Emissions to air and external costs
12
The fuel used during 2017 is reported by the respective ship owners. The total annual fuel consumption by the considered vessels is 44.1 ktonnes LNG and 22.3 ktonnes MGO in 2017. In 2022, 161.6 ktonnes LNG and 13.8 ktonnes MGO are assumed to be used by the LNG fuelled vessels included in the analysis.
Notably, in 2017 some LNG vessels consumed more MGO than LNG – the share of LNG in the total fuel consumption was in some cases as low as 5%. One of the possible reasons might be shortage of LNG available for bunkering in certain ports. In the scenario calculation of emissions in 2022, we assume that more developed bunkering infrastructure results in 95% of LNG in the annual fuel consumption in the gas engines2, leading to significantly higher benefits for health and environment compared to the reference ships than those estimated for 2017. This scenario thus illustrates the results when the ships use LNG to the full potential in 2022.
Since the aim of this study is to estimate the potential benefits from a shift from MGO to LNG, we deliberately do not consider other factors affecting emission reductions. One such factor is improved energy efficiency that can be expected if older ships are replaced by new ones. Emissions and emission differences presented below are estimated based exclusively on fuel shift-related changes and for each LNG ship the corresponding modelled MGO fuelled ship use the same amount of fuel, as heat content in the fuel.
2.2 Emissions The calculated emissions are presented in Table 2. Emissions of air pollutants are calculated to be significantly lower for an LNG fleet than for the reference fleet fuelled with MGO. As for greenhouse gases, methane emissions for certain LNG vessels are estimated to be higher than emissions from reference vessels. The overall climate effect is projected to be similar for the two cases for both 2017 and 2022.
Table 2. Emissions, LNG fleet vs. reference fleet (MGO).
Pollutant Emissions in 2017, tonnes Emissions in 2022, tonnes MGO LNG Difference MGO LNG Difference
SO2 145 45 100 415 30 385 NOx 4 200 1 000 3 200 12 900 1 700 11 200 PM2.5 200 40 160 600 60 540 GHG3 227 550 221 550 6 000 661 600 641 000 20 600
-CO2 227 500 191 600 35 900 661 400 520 800 140 600 -CH4 (as CO2 eq.) 50 29 950 -29 900 200 120 200 -120 000
The estimated distribution of air pollutant emissions in 2017 between the sea areas is shown in Table 3. A large share (over 50%) of the total emission difference is allocated to the Baltic Sea – this is mainly the effect of emission reductions due to the fuel shift of a large passenger ship operating exclusively in the Baltic Sea.
2 100% LNG is not achievable since MGO is used as pilot fuel, and not all auxiliary engines are designed to run on LNG
3 In CO2 equivalents, sum of CO2 and CH4

Report C 369 Environmental assessment of Sweden-related LNG fleet in the Baltic Sea and the North Sea – Emissions to air and external costs
13
Table 3. Emissions in different sea regions, 2017, LNG fleet vs reference fleet (MGO).
Pollutant Emissions in the Baltic Sea, tonnes Emissions in the North Sea, tonnes MGO LNG Difference MGO LNG Difference
SO2 85 22 63 60 23 37 NOx 2 600 600 2 000 1 600 400 1 200 PM2.5 120 20 100 80 20 60
The total calculated difference in NOx emissions between an LNG fleet and the reference fleet in 2017 amounts to 3 160 tonnes. This corresponds to the emissions of approximately 24 300 average heavy duty trucks on the Swedish roads during the same year4.
In 2022, the total difference in the main air pollutant emissions are estimated to become 3-4 times larger compared to the 2017 level. This is only partly the effect of more LNG ships in 2022: emission reduction due to the increased share of LNG in the fuel mix of the existing5 vessels is quite significant in the model. In particular, emissions of SO2 are estimated at 45 tonnes in 2017 and only 30 tonnes in 2022 (despite 13 new LNG vessels) – this is entirely due to the increased share of LNG among vessels that in 2017 use less LNG than what is the full potential. The same reasoning explains the difference in NOX emissions between the two cases. It should be noted that all the ships studied, both LNG ships and reference ships, are assumed to be keel laid before 2021 and therefore follows the Tier II NOX standard rather than Tier III which is implemented for new ships from 2021. In the model this has no effect on the LNG ships, which are assumed to comply with Tier III, but for the MGO fuelled ships Tier III levels would mean significantly lower NOX emissions.
4 NOx emissions from an average heavy truck (>3.5 tonnes) with an average mileage on Swedish roads in 2017 (0.13 tonnes NOx per year per vehicle) is calculated via the total emissions from heavy trucks (10.7 ktonnes) and the average number of heavy trucks on the roads (84 100 per day) during the same year. The data on emissions and vehicle number is obtained from the calculations of exhaust emissions performed with the model HBEFA 3.3 for the Swedish Transport Administration, for Sweden’s official climate reporting.
5 Built 2017 or earlier

Report C 369 Environmental assessment of Sweden-related LNG fleet in the Baltic Sea and the North Sea – Emissions to air and external costs
14

Report C 369 Environmental assessment of Sweden-related LNG fleet in the Baltic Sea and the North Sea – Emissions to air and external costs
15
3 Environmental and health impacts and external costs
To calculate external costs for the effects caused by air pollution emissions from ships we use the Impact Pathway Approach (see details in Appendix 2). Since the models used for the analysis are relatively coarse, and the environmental and human health impacts from air pollutants are seen only as a result of emissions much larger than from several ships we upscale the emissions from the individual ships. The impacts from air pollution can rarely be assigned to one single point source of emissions, but the burden sharing of total air pollution impacts can easily be distributed among the sources following their relative contribution to the total emissions. In other words, environmental and health impacts from the emissions of several ships are impossible to verify, but the environmental and health impacts from all the ships in the North and Baltic sea are verifiable, and a small group of ships’ contribution to this impact is proportional to its relative share of emissions. In this study we scaled up the calculated annual emissions with a factor 1000 prior to introducing the emissions into the models.
These different emissions for the sea regions cause differences in human health impacts. With the online6 version of the GAINS model (Amann, 2011) we calculate population weighted PM2.5 exposure and exposure to ground-level ozone (SOMO35 metric7) for each European country that would follow from the scenario-specific shipping emissions. The PM2.5 concentration in ambient air is caused by primary PM2.5 emissions, but it is also caused by emissions of NOX and SO2 since these form secondary PM2.5 during their residence time in the air. Ground-level ozone formation is directly affected by NOx concentrations.
Country-specific population-weighted PM2.5 and ground-level ozone exposures are then introduced to the Swedish version of the economic valuation tool ARP (Holland, 2013) for further calculation of health impacts and monetary valuation of the same. After having calculated the total monetised health impact in the scenarios, the values are scaled down by a factor 1000 in order to get an impact corresponding to the actual emissions from the considered ships. Furthermore, the economic valuation of health impacts was complemented with economic valuation of reduced GHG emissions and crop losses in the affected regions.
The health impact with highest monetary value is avoided mortality (fatality), which is valued by either estimating the Value of Statistical Life (VSL) or the Value Of Life Year lost (VOLY). The estimated economic value of these varies in the literature and between methods. The values can also differ between VOLY and VSL due to differences in how many life years that are assumed to be lost when a fatality occurs. We therefore include low, mid and high values in the results below. Low values implies that the valuation of avoided mortality is based on the median VOLY estimate from Desaigues (2011); mid values implies that we have used the median VSL estimate from Friedrich (2004) and Hurley (2005); high values implies that we have used the mean VSL value from OECD (2012). In relation to the interval used in the Cost-Benefit Analysis of Final Policy Scenarios for the EU Clean Air Package (Holland 2014a) (median VOLY to mean VSL), the mid values used in this study lie quite close to the middle of the interval used there.
Table 4 presents the values for VSL and VOLY used in the monetization of health impacts. The health impacts from air pollution are specified by the use of exposure-response functions, and in our analysis we
6 http://gains.iiasa.ac.at/gains/EUN/index.login?logout=1
7 The SOMO35 metric quantifies the yearly sum of the daily maximum 8-hour ozone concentrations exceeding a 35 ppb (70 µg/m3) threshold

Report C 369 Environmental assessment of Sweden-related LNG fleet in the Baltic Sea and the North Sea – Emissions to air and external costs
16
have used values from the WHO/EU Health Risks of air pollution in Europe (HRAPIE) project (WHO, 2013; Holland, 2014b; Heroux, 2015).
Table 4. Economic value of VOLY and VSL used in this analysis.
End point Impact Valuation (€2010)
Data source
Mortality from long term exposure (All ages) median VOLY
Life years lost 44 708 Desaigues, 2011
Mortality from long term exposure (All ages) median VOLY
Life years lost 64 491 Friedrich, 2004; Hurley, 2005
Mortality from long term exposure (All ages) mean VOLY
Life years lost 155 025 Friedrich, 2004; Hurley, 2005
Mortality from long term exposure (30yr +) deaths median VSL
Premature deaths 1 218 293 Friedrich, 2004; Hurley, 2005
Mortality from long term exposure (30yr +) deaths mean VSL
Premature deaths 2 481 294 Friedrich, 2004; Hurley, 2005
Mortality from long term exposure (30yr +) deaths mean VSL
Premature deaths 3 129 560 OECD, 2012
Infant Mortality (0-1yr) median VSL
Premature deaths 1 827 440 Friedrich, 2004; Hurley, 2005
Infant Mortality (0-1yr) mean VSL Premature deaths 3 721 941 Friedrich, 2004; Hurley, 2005
Infant Mortality (0-1yr) mean VSL Premature deaths 4 694 340 Friedrich, 2004; Hurley, 2005, OECD 2012
To avoid risk of double-counting health effects from PM2.5 and ground-level ozone, chronic mortality from ozone exposure is not included in the valuation, as it was done in the Cost-Benefit Analysis of Final Policy Scenarios for the EU Clean Air Package (Holland 2014a).
There are a number of additional health impacts from air pollution, such as bronchitis, cardio-vascular and pulmonary diseases, as well as restricted activity, but since the economic impact of these are smaller than the impact of avoided mortality they have been omitted from the table above.
In Table 5 we present the obtained valuation of the health impacts from the Sweden-related LNG fleet in 2017, compared to the fleet running on MGO. The total health benefits are estimated at 16.5 million €2010, from which about 5% is attributable to the population of Sweden.
Table 5. Calculated economic value of the reduced health impacts due to Sweden-related LNG fleet in 2017, thousands €2010.
Value Europe (all countries) Sweden Low 7 900 400 Mid 16 500 800 High 38 200 1 900
Crop damage is valued per tonne of NOX emissions from each sea region. NOX is one of the substances needed for the formation of ground-level ozone, which in turn causes damage to crops. The economic valuation of these damages is based on aggregate market prices for a number of crops. NOX emissions from the Baltic Sea are associated with crop damages corresponding to ~146 €2010 / tonne NOX, while NOX

Report C 369 Environmental assessment of Sweden-related LNG fleet in the Baltic Sea and the North Sea – Emissions to air and external costs
17
emissions from the North Sea are associated with crop damages corresponding to ~35 €2010 / tonne NOX (Holland, 2011). Furthermore, the use of LNG is associated with changes in GHG emissions8 that also have a monetary value. Using economic values from the EU ETS market and the Handbook on External Costs of Transport (Korzhenevych et al., 2014), a range of external costs of GHG can be estimated. The economic values analyzed for GHG are listed in Table 6.
Table 6. Economic values per tonne of GHG emissions (CO2 eq) used in this analysis.
Economic value of GHG Unit Source
Low 9.1 €2010/t CO2-eq Current (Febr. 2018) EU ETS market price9 converted to €2010
with GDP-deflator10
Mid 90 €2010/t CO2-eq
EC Update on Handbook on External Costs for Transport (Korzhenevych et al. 2014), central value
High 168 €2010/t CO2-eq
EC Update on Handbook on External Costs for Transport (Korzhenevych et al. 2014), high-end value
By using the same monetary values for human health and crop damage impacts as used by the European Commission, but updated to the €2010 exchange rate, significant monetary benefits referring to health impact improvements and reduced crop damages are found for all cases. When we add values for external costs of GHG emissions, the monetised effect is somewhat increased. This monetary benefit is a total of the benefits for all European countries affected by reduced emissions in the Baltic Sea and in the North Sea for a group of LNG ships considered. These values are understatements of the external costs associated with our cases since the actual ship routes are located in densely populated areas while the GAINS model results deliver results for a sea region average emission reduction outside the 12-mile zone11.
In Table 7 below we present the difference in external costs between the LNG fleet and the reference (MGO) fleet, using the emission data for individual ships. This difference in external costs is equal to benefits for the society from reduced emissions in the Baltic and the North Seas.
8 CO2 emissions from LNG ships are lower than from MGO ships; CH4 emissions might be higher (methane slip)
9 http://www.nasdaqomx.com/transactions/markets/commodities, as of 2018-02-23
10 http://ec.europa.eu/eurostat/tgm/table.do?tab=table&plugin=1&language=en&pcode=teina110
11 We allocate emissions from the Baltic Sea and the North Sea to the exclusive economic zones outside the 12-mile zone. This adaptation is necessary since the entire European 12-mile zone is modelled as one emitting region in the GAINS model. With this model, a scenario for the Baltic Sea and the North Sea would thus imply emission reductions along the coastline of the Mediterranean Sea, for example. To avoid this we imply that emission changes take place outside the territorial seas, which results in underestimation of the calculated health impacts and consequently the calculated monetary benefits.

Report C 369 Environmental assessment of Sweden-related LNG fleet in the Baltic Sea and the North Sea – Emissions to air and external costs
18
Table 7. Calculated annual economic values of reduced health impacts and crop losses associated with the Sweden-related LNG fleet (as compared to the reference fleet) in 2017 Difference in external costs (thousand €2010/year) LNG fleet vs reference fleet (MGO) Human Health, low 8 000
Human Health, mid 16 500
Human Health, high 38 200
CO2-eq, low 60
CO2-eq, mid 540
CO2-eq, high 1 000
Crop damage 330 Total, central (low-high) 17 400 (8 400 – 39 600)

Report C 369 Environmental assessment of Sweden-related LNG fleet in the Baltic Sea and the North Sea – Emissions to air and external costs
19
Discussion and conclusions This study estimates the reduced external costs (total societal benefits) from the Sweden-related LNG fleet in the Baltic Sea and the North Sea in 2017 to 17.4 million €2010 when comparing with ships using MGO. This estimate includes health impacts from PM2.5 and ground-level ozone, crop damage caused by air pollution, and climate impact from emitted GHG. Per vessel, it constitutes about 1.4 million €2010 in average.
Table 8 displays the calculated corresponding reductions in emissions from the LNG fleet compared to the reference fleet. The major part of the total emission reductions of air pollutants (over 50 %) takes place in the Baltic Sea.
Table 8. Reductions in emissions from the LNG fleet compared to the reference (MGO) fleet
Year SO2, t NOx, t PM2.5, t GHG, t CO2-eq
2017 100 3 200 160 6 000
2022 385 11 200 540 20 600
The largest contributor to the total benefits is positive impact of emission reductions on population health. Lower emissions of primary PM2.5, NOx and SO2 from LNG vessels result in lower concentrations of primary and secondary PM2.5 and ground-level ozone – and subsequently in reduced premature mortality. The total difference in NOx emissions in 2017 (3 200 tonnes) corresponds to the emissions of approximately 24 300 average heavy duty trucks with average mileage on the Swedish roads during the same year.
Emission differences between the LNG fleet and the reference MGO fleet are expected to be 2-3 times higher in 2022 than in 2017 – due to the introduction of 13 new LNG vessels related to Sweden, currently being under construction, and due to the modelled increased share of LNG use among existing vessels. An increased share of the LNG consumption in 2022 and the corresponding expected emission reductions would result in significantly higher societal benefits than the benefits estimated for 2017. However, since input data regarding technical parameters, emission factors and fuel consumption of the new vessels in 2022 are very preliminary, corresponding emission estimates and benefit estimates are more uncertain than estimates for the existing LNG fleet.
Using LNG as a fuel thus gives advantages when it comes to emissions of air pollutants in comparison with traditional marine fuels. When it comes to emissions of greenhouse gases the situation is more complex. The emission of CO2 will be lower when using LNG as a consequence of the lower carbon content in the fuel in relation to fuel oil. Methane slip from incomplete combustion of the gas has on the other hand been observed leading to that the impact on global warming is similar for the two alternatives. It should be noted that the emission factor for CH4 is rather uncertain and varies with engine design, brand, year of production and whether emissions are measured in real life conditions (at sea) or in a lab . We have mainly used data from Stenersen & Thonstad (2017) since this is a report with a large amount of data and a thorough analysis. The engine type high pressure two strike diesel shows significantly lower slip of CH4 and there are two ships with such engines in the considered fleet. On the other hand this engine type has higher NOX emissions compared with the other LNG engine types. Stenersen & Thonstad (2017) list several options to reduce CH4 emissions, including both engine design and end-of-pipe solutions, for instance combustion chamber design, optimization of the combustion process, or oxidation catalysts in the exhaust. Some of these solutions are already implemented on newer vessels, resulting in the lower measured CH4 emission factors presented in Stenersen & Thonstad (2017) than those used earlier, e.g. in MARINTEK (2010).
This study is focused on the emissions and impacts from the tank-to-propeller stage of a fuel life cycle. Taking into consideration other stages, such as well-to-tank (production and transportation), might result in different estimates of total environmental and health impacts of marine fuels. As an example, Figure 2

Report C 369 Environmental assessment of Sweden-related LNG fleet in the Baltic Sea and the North Sea – Emissions to air and external costs
20
below illustrates the results from the study by Bengtsson et al. (2012) focusing on the life cycle perspective. According to Bengtsson et al. (2012), LNG has lower negative climate impact12 than MGO – at both well-to-tank and tank-to-propeller stages.
Figure 2. Climate impact of different marine fuels, GWP100 (Bengtsson et al. 2012).
One of the possible ways to reduce the total climate impact of LNG is using a mixture of LNG and liquefied biogas – LBG. Being a renewable fuel, LBG results in lower negative climate impact (GWP) and is therefore considered as a more climate-friendly alternative to using pure LNG. This is also seen in the results of Bengtsson et al. (2012) (Figure 2 above) indicating much lower total climate impact of LBG compared to LNG. One of the main obstacles to large-scale use of LBG as marine fuel is its relatively high price.
The ascending LNG trend in the world is to a large extent a reply to the tightening legislative requirements for shipping – in particular in the considered area of the Baltic Sea and the North Sea. Currently, other main alternatives to comply with SECA requirements are MGO, SECA oil (low-sulphur heavy oil, often mixed with diesel fractions), methanol and end-of-pipe scrubbers. MGO or SECA oil are the easiest solutions for existing vessels since it does not require significant technical changes; however, for vessels build after 2021 additional NOx abatement technologies (e.g. SCR, EGR13) will be needed to comply with Tier III requirements. Methanol is still rather new as marine fuel and used predominantly in pilot projects. To use scrubbers is a viable option to comply with the sulphur regulations; scrubbers are currently used by a number of shipping companies. Scrubbers allow using relatively cheap high sulphur heavy fuel oil as the main fuel. However, scrubbers’ compatibility with SCR is still under discussion, as well as the impact of wash water on the marine environment. LNG fuelled vessels do cost more than conventional (MGO) vessels – but these additional costs are compensated by lower fuel price and simultaneous reduction of several harmful substances, including NOx to the levels required by Tier III. One drawback is, as mentioned, high methane emissions which sometimes overweigh climate benefits from reduced CO2 emissions.
Today all commercially available marine fuels are fossil fuels contributing to global warming through CO2 emissions, but the introduction of LNG as a marine fuel has led to decreased emissions of air pollutants and
12 Climate impact in GWP = global warming potential
13 SCR = selective catalytic reduction; EGR = exhaust gas recirculation

Report C 369 Environmental assessment of Sweden-related LNG fleet in the Baltic Sea and the North Sea – Emissions to air and external costs
21
in the future an introduction of biogas in these ships has the potential of reducing also emissions of green-house gases.
It should be noted that the calculated reduction in external costs from the Sweden-related LNG fleet in comparison with MGO fuelled ships are underestimated due to the following reasons:
• The GAINS methodology imply that emissions are evenly reduced in a sea area outside the 12 nautical mile zone, while in reality most ships operate close to the coast (as explained in Chapter 3);
• Not included in the calculations are energy efficiency improvements upon fleet renewal (a simplification mentioned in Chapter 2.1.); improved energy efficiency would result in lower fuel consumption and even larger emission difference than the difference resulting from the fuel shift alone;
• Included in the analysis for 2022 are only vessels already ordered and having IMO number. A reasonable assumption on the continued growing LNG trend would mean that more LNG vessels can be expected to be in operation by 2022.

Report C 369 Environmental assessment of Sweden-related LNG fleet in the Baltic Sea and the North Sea – Emissions to air and external costs
22

Report C 369 Environmental assessment of Sweden-related LNG fleet in the Baltic Sea and the North Sea – Emissions to air and external costs
23
References Amann, M., I. Bertok, J. Borken-Kleefeld, J. Cofala, C. Heyes, L. Höglund-Isaksson, Z. Klimont, B. Nguyen, M. Posch, P. Rafaj, R. Sandler, W. Schöpp, F. Wagner and W. Winiwarter (2011). "Cost-effective control of air quality and greenhouse gases in Europe: Modeling and policy applications." Environmental Modelling & Software 26: 1489-1501.
Anderson, M., Salo, K., Fridell, E., (2015). Particle- and gaseous emissions from a LNG powered ship, Environmental Science & Technology 49, pp. 12568-12575
Bengtsson, S., Fridell, E., Andersson, K., (2012). Environmental assessment of two pathways towards the use of biofuels in shipping, Energy Policy, May 2012, pp. 451-463
Brynolf, S., Fridell, E., Andersson, K., (2014). Environmental assessment of marine fuels: LNG, LBG, methanol and bio-methanol, Journal of Cleaner Production, 74, pp. 86-95
Cooper, D. and Gustafsson, T. (2004). Methodology for calculating emissions from ships: 1, Update of emission factors, Report series SMED and SMED&SLU Nr 4 2004 (http://www.smed.se/).
Desaigues, B., D. Ami, A. Bartczak, M. Braun-Kohlová, S. Chilton, M. Czajkowski, V. Farreras, A. Hunt, M. Hutchison, C. Jeanrenaud, P. Kaderjak, V. Máca, O. Markiewicz, A. Markowska, H. Metcalf, S. Navrud, J. S. Nielsen, R. Ortiz, S. Pellegrini, R. A., R. Riera, M. Scasny, M.-E. Stoeckel, R. Szántó and J. Urban (2011). "Economic valuation of air pollution mortality: A 9-country contingent valuation survey of value of a life year (VOLY)." Ecological Indicators.
Friedrich, R. (2004). New Elements for the Assessment of External Costs from Energy Technologies - New Ext.
Heroux, M. E., H. R. Anderson, R. Atkinson, B. Brunekreef, A. Cohen, F. Forastiere, F. Hurley, K. Katsouyanni, D. Krewski, M. Krzyzanowski, N. Kunzli, I. Mills, X. Querol, B. Ostro and H. Walton (2015). "Quantifying the health impacts of ambient air pollutants: recommendations of a WHO/Europe project." Int J Public Health 60(5): 619-627.
Holland, M., A. Wagner, F. Hurley, B. Miller and A. Hunt (2011). Cost Benefit Analysis for the Revision of the National Emissions Ceilings Directive: Policy Options for revisions to the Gothenburg Protocol to the UNECE Convention on Long-Range Transboundary Air Pollution.
Holland, M., S. Pye, G. Jones, A. Hunt and Markandya, A. (2013). The Alpha Benefit Assessment Model - EC4MACS Modelling Methodology.
Holland, M. (2014a). Cost-Benefit Analysis of Final Policy Scenarios for the EU Clean Air Package.
Holland, M. (2014b). Implementation of the HRAPIE Recommendations for European Air Pollution CBA work.
Hurley, F., A. Hunt, H. Cowie, M. Holland, B. Miller, S. Pye and P. Watkiss (2005). Methodology for the Cost-Benefit analysis for CAFE: Volume 2: Health Impact Assessment.
IPCC, 2013. Climate Change 2013: The Physical Science Basis. Contribution of Working Group I to the Fourth Assessment. Report of the Intergovernmental Panel on Climate Change., in: Stocker, T.F., Qin, D., Plattner, G.-K., Tignor, M., Allen, S.K., Boschung, J., Nauels, A., Xia, Y., Bex, V., Midgley, P.M. (Eds.), Cambridge University Press, Cambridge, United Kingdom and New York, NY, USA, p. 1535.
Report C 369 Environmental assessment of Sweden-related LNG fleet in the Baltic Sea and the North Sea – Emissions to air and external costs
24
Korzhenevych, A., Dehnen, N., Bröcker, J., Holtkamp, M., Meier, H., Gibson, G., Varma, A. and Cox, V. (2014). Update of the Handbook on External Costs of Transport, Final Report for the European Commission. MARINTEK (2010). Nielsen J.B., Stenersen D.: Emission factors for CH4, NOx, particulates and black carbon for domestic shipping in Norway, revision 1. MARINTEK report MT22 A10-199, 23.11.2010.
OECD (2012). Mortality Risk Valuation in Environment, Health and Transport Policies, OECD Publishing.
Sjöfartstidningen (2017). List of Sweden-related vessels under construction, 2017-04-04 (accessed 2018-02-20) http://www.sjofartstidningen.se/assets/2017/04/svenska_nybyggen_170404.pdf
Stenersen, D., Thonstad, O., 2017, GHG and NOx emissions from gas fuelled engines – mapping, verification, reduction technologies, SINTEF Ocean AS, report OC2017 F-108 from 2017-06-13
WHO, S. Henschel and G. Chan (2013). Health risks of air pollution in Europe - HRAPIE project, New emerging risks from air pollution - results from the survey of experts.

Report C 369 Environmental assessment of Sweden-related LNG fleet in the Baltic Sea and the North Sea – Emissions to air and external costs
25
Appendix 1. List of LNG vessels N IMO N Name /number Type Owner Operation in Built
Baltic Sea
North Sea
LNG vessels in 2017
1 9606900 Viking Grace Passenger/ Ro-Ro
Viking Line 100% 2013
2 9309239 Bit Viking Chemical/ products tanker
Tarbit 100% 2007
3 9301873 Fure West Chemical/ products tanker
Furetank 27% 73% 2006
4 9722390 Ternsund Chemical/ products tanker
Terntank 67% 33% 2016
5 9722405 Ternfjord Chemical/ products tanker
Terntank 100% 2016
6 9747974 Tern Sea Chemical/ products tanker
Terntank 100% 2016
7 9747986 Tern Ocean Chemical/ products tanker
Terntank 50% 50% 2017
8 9734264 Greenland Cement carrier JT Cement AS
70% 30% 2015
9 9771456 Ireland Cement carrier JT Cement AS
70% 30% 2016
10 9736377 Auto Energy Vehicles carrier UECC 61% 39% 2016 11 9736365 Auto Eco Vehicles carrier UECC 60% 40% 2016 12 9769128 Coralius LNG tanker Sirius 10% 90% 2017
Additional LNG vessels in 2022
13 9763655 Visborg Ropax Gotland 100% 2018 14 9783071 Thjelvar Ropax Gotland 100% 2018 15 9817157 FERUS SMIT 443 Chemical/
products tanker Erik Thun n.a. n.a. 2018
16 9817169 FERUS SMIT 444 Chemical/ products tanker
Erik Thun n.a. n.a. 2019
17 9817171 FERUS SMIT 451 Chemical/ products tanker
Erik Thun n.a. n.a. 2020
18 9817183 FERUS SMIT 452 Chemical/ products tanker
Erik Thun n.a. n.a. 2021
19 9827877 Xiamen XS1488A Passenger/ Ro-Ro
Viking Line 100% 2020
20 9739800 Fure Vinga Chemical/ products tanker
Furetank 36% 64% 2018
21 9739812 Ramanda Chemical/ products tanker
Älvtank 36% 64% 2018

Report C 369 Environmental assessment of Sweden-related LNG fleet in the Baltic Sea and the North Sea – Emissions to air and external costs
26
N IMO N Name /number Type Owner Operation in Built Baltic Sea
North Sea
22 9739824 AVIC DINGHENG AD0028
Chemical/ products tanker
Erik Thun 36% 64% 2018
23 9739836 AVIC DINGHENG AD0029
Chemical/ products tanker
Furetank 36% 64% 2019
24 9818278 AVIC DINGHENG AD0035
Chemical/ products tanker
Furetank 36% 64% 2019
25 9818280 AVIC DINGHENG AD0036
Chemical/ products tanker
Älvtank 36% 64% 2019
Report C 369 Environmental assessment of Sweden-related LNG fleet in the Baltic Sea and the North Sea – Emissions to air and external costs
27
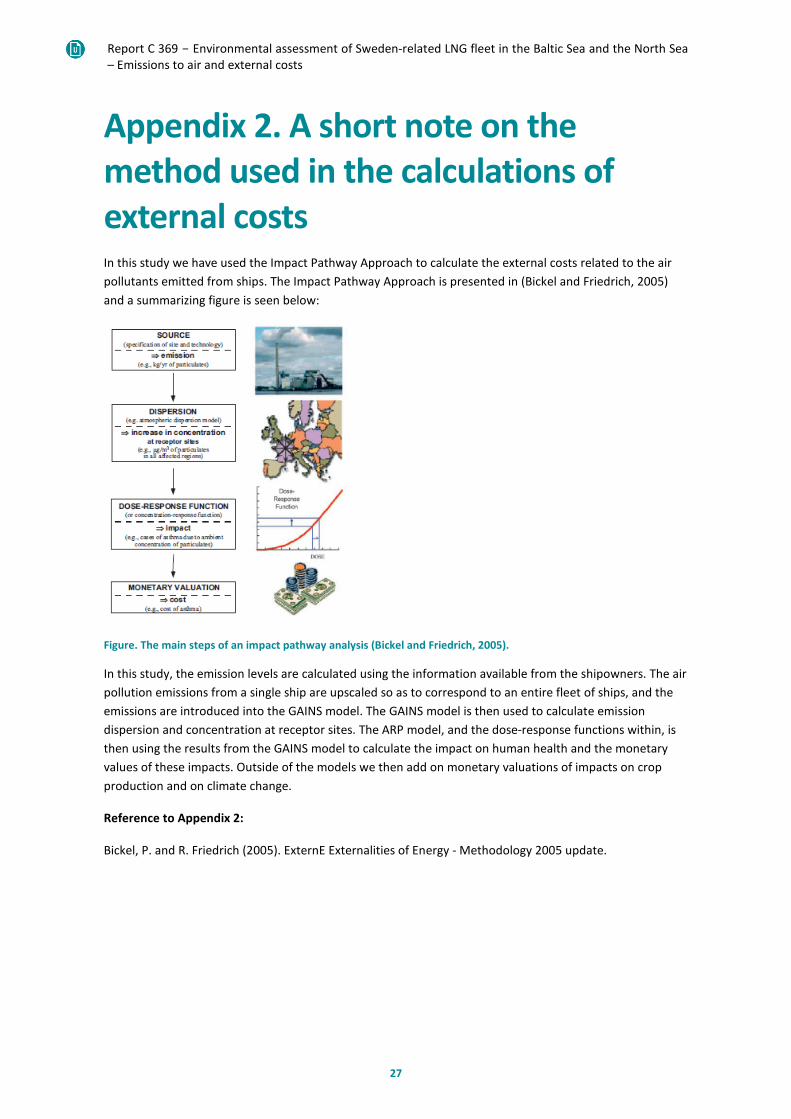
Appendix 2. A short note on the method used in the calculations of external costs In this study we have used the Impact Pathway Approach to calculate the external costs related to the air pollutants emitted from ships. The Impact Pathway Approach is presented in (Bickel and Friedrich, 2005) and a summarizing figure is seen below:
Figure. The main steps of an impact pathway analysis (Bickel and Friedrich, 2005).
In this study, the emission levels are calculated using the information available from the shipowners. The air pollution emissions from a single ship are upscaled so as to correspond to an entire fleet of ships, and the emissions are introduced into the GAINS model. The GAINS model is then used to calculate emission dispersion and concentration at receptor sites. The ARP model, and the dose-response functions within, is then using the results from the GAINS model to calculate the impact on human health and the monetary values of these impacts. Outside of the models we then add on monetary valuations of impacts on crop production and on climate change.
Reference to Appendix 2:
Bickel, P. and R. Friedrich (2005). ExternE Externalities of Energy - Methodology 2005 update.

IVL Swedish Environmental Research Institute Ltd. P.O. Box 210 60 // S-100 31 Stockholm // Sweden Phone +46-(0)10-7886500 // Fax +46-(0)10-7886590 // www.ivl.se