environmental affairs · 2018-06-12 · DEAT Department of Environmental Affairs and Tourism ......
36
environmental affairs Environmental Affairs Department: REPUBLIC OF SOUTH AFRICA OPPORTUNITIES FOR AND COSTS OF MITIGATION IN SOUTH AFRICAN ECONOMY
Transcript of environmental affairs · 2018-06-12 · DEAT Department of Environmental Affairs and Tourism ......
environmental affairs Environmental Affairs Department:
REPUBLIC OF SOUTH AFRICA
OPPORTUNITIES FOR AND COSTS OF MITIGATION IN SOUTH AFRICAN ECONOMY

Opportunities for and Costs of Mitigation in South African Economy
Andrew Marquard, Hilton Trollip and Harald Winkler
ENERGY RESEARCH CENTRE, University of Cape Town
2011
environmental affairs Environmental Affairs Department:
REPUBLIC OF SOUTH AFRICA
OPPORTUNITIES FOR AND COSTS OF
MITIGATION IN SOUTH AFRICAN ECONOMY
2
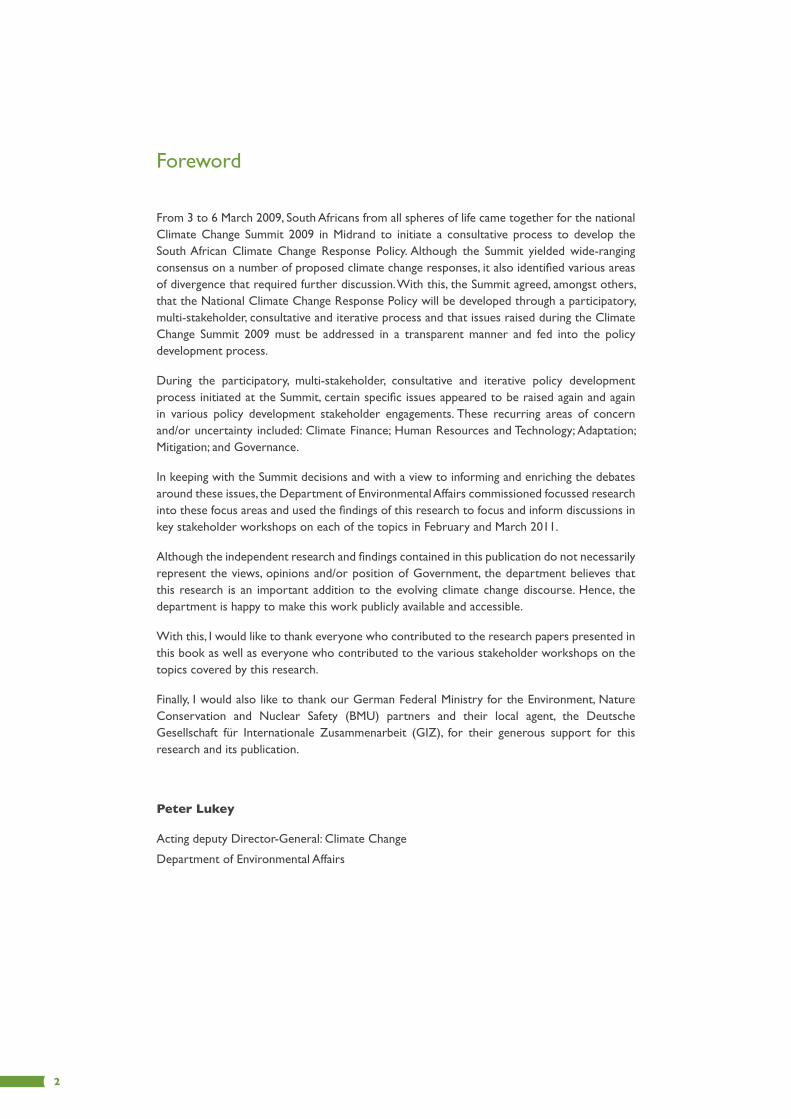
From 3 to 6 March 2009, South Africans from all spheres of life came together for the national Climate Change Summit 2009 in Midrand to initiate a consultative process to develop the South African Climate Change Response Policy. Although the Summit yielded wide-ranging consensus on a number of proposed climate change responses, it also identified various areas of divergence that required further discussion. With this, the Summit agreed, amongst others, that the National Climate Change Response Policy will be developed through a participatory, multi-stakeholder, consultative and iterative process and that issues raised during the Climate Change Summit 2009 must be addressed in a transparent manner and fed into the policy development process.
During the participatory, multi-stakeholder, consultative and iterative policy development process initiated at the Summit, certain specific issues appeared to be raised again and again in various policy development stakeholder engagements. These recurring areas of concern and/or uncertainty included: Climate Finance; Human Resources and Technology; Adaptation; Mitigation; and Governance.
In keeping with the Summit decisions and with a view to informing and enriching the debates around these issues, the Department of Environmental Affairs commissioned focussed research into these focus areas and used the findings of this research to focus and inform discussions in key stakeholder workshops on each of the topics in February and March 2011.
Although the independent research and findings contained in this publication do not necessarily represent the views, opinions and/or position of Government, the department believes that this research is an important addition to the evolving climate change discourse. Hence, the department is happy to make this work publicly available and accessible.
With this, I would like to thank everyone who contributed to the research papers presented in this book as well as everyone who contributed to the various stakeholder workshops on the topics covered by this research.
Finally, I would also like to thank our German Federal Ministry for the Environment, Nature Conservation and Nuclear Safety (BMU) partners and their local agent, the Deutsche Gesellschaft für Internationale Zusammenarbeit (GIZ), for their generous support for this research and its publication.
Peter Lukey
Acting deputy Director-General: Climate Change
Department of Environmental Affairs
Foreword

3
TABLE OF CONTENTS
ABBREVIATIONS .................................................................................................................................................................................. 5
SUMMARY ............................................................................................................................................................................................... 6
1 INTRODUCTION ........................................................................................................................ ................................................... 8
1.1 South Africa’s mitigation effort in an international context ........................................... ................................................ 8
1.2 Assessing the comparability of South Africa’s pledge ...................................................... ................................................ 11
2 SOUTH AFRICAN GHG EMISSIONS ....................................................................................... ................................................ 13
2.1 Historical emissions growth: 2000 - 2010 .......................................................................... ............................................... 13
2.2 Research on future emissions growth: 2010 - 2050 ........................................................ ................................................ 14
2.2.1 Sector baselines .............................................................................................................................................. .............. 16
2.2.2 Other baselines .............................................................................................................................................. ............... 18
3 MITIGATION ................................................................................................................................ ................................................... 19
3.1 Introduction ... ............................................... ...........................................................................................................................19
3.2 Classifying mitigation options for policy analysis .............................................................. ............................................... 19
3.2.1 Developing key indicators for comparing mitigation options .............................................................. ............... 20
3.2.2 Economic and industrial policy analysis .................................................................................................... .............. 22
3.3 Overview of mitigation potential by sector, and other approaches ............................. ............................................... 23
3.3.1 Energy ............................................................................................................................................................... ............... 23
3.3.2 Electricity supply ............................................................................................................................................ ............... 23
3.3.3 Energy efficiency for stationary applications ........................................................................................... ............... 25
3.3.4 Transport emissions ...................................................................................................................................... .............. 25
3.3.5 Other potential mitigation measures to achieve a national trajectory ............................................ ................ 26
3.4 Comparative analysis of mitigation measures to achieve a national trajectory ......... ............................................... 26
4 STRUCTURE AND APPROACH FOR IMPLEMENTATION ................................................................................................. 29
5 REFERENCES ............................................................................................................................... .................................................... 32

4
LIST OF FIGURES
Figure 1: Proposed long-term emissions trajectory for South Africa ....................................................................................... 10
Figure 2: Comparison of Mitigation Abatement Costs for commitments by countries in terms of
the Copenhagen Accord.. .................................................................................................................................................... 12
Figure 3: Emissions Sources and trends from 2000 to 2010 ...................................................................................................... 13
Figure 4: Emissions by fuel type 2000 - 2010 .................................................................................................................................. 13
Figure 5: Energy supply sector emissions 2000 – 2010 ................................................................................................................. 14
Figure 6: Projected sectoral emissions 2010-2050 ........................................................................................................................ 14
Figure 7: Projected sources of emissions by fuel 2010 - 2050 .................................................................................................... 15
Figure 8: Projected sectoral allocation of emissions 2010 - 2050 ............................................................................................. 15
Figure 9: Projected attribution of emissions from the industrial sector 2010 - 2050 ........................................................... 16
Figure 10: Selected electricity sector baselines: 2010 - 2028 ...................................................................................................... 16
Figure 11: LTMS baseline and LTMS baseline adjusted for different electricity sector baselines ........................................ 17
Figure 12: Historical and BAU emissions for South Africa .......................................................................................................... 18
Figure 13: GHG effects over time ..................................................................................................................................................... 20
Figure 14: Total mitigation impact of an energy efficiency programme with and without low-carbon supply options .. 22
Figure 15: Estimated scale of contribution of sectoral measures to a 2020 and 2025 mitigation target .......................... 28
Figure 16: Low carbon development planning cycle. ..................................................................................................................... 31
LIST OF TABLES
Table 1: Key indicators for assessing mitigation measures, and the analytical approach needed to develop these ......... 19
Table 2: Mitigation potential identified in the LTMS for different sectors ................................................................................ 25
Table 3: Summary of emissions savings based on transport mitigation measures for the short, medium and long term .. 26
Table 4: Mitigation measures ranked by impact in the short, medium and long term ........................................................... 27
TABLE OF CONTENTS

5
BAU Business as Usual
CCS Carbon Capture and Storage
CGE Computable General Equilibrium
CMP Meeting of the Parties on the Kyoto Protocol
CO2 Carbon Dioxide
COP Conference of the Parties
CTL Coal to Liquids
DEA Department of Environmental Affairs
DEAT Department of Environmental Affairs and Tourism
DPE Department of Public Enterprises
DSM Demand side management
GDP Gross Domestic Product
Gg Gigagrams
GHG Greenhouse gas
Gt Gigatonnes
GWC Growth without Constraints
GWh Gigawatt hours
HFC Hydrofluorocarbon
IDP Integrated Development Plan
IPE Industrial process emissions
IRP Integrated Resource Plan
LTMS Long Term Mitigation Scenarios
MAC Mitigation Abatement Cost Curve
Mt Megatonnes
MW Megawatt
MWh Megawatt hour
NEE Non-energy emissions
PPP Purchasing Power Parity
PV Photovoltaic
REWP Renewable Energy White Paper
RSA Republic of South Africa
SWH Solar water heating
TWh Terawatt hours
UNFCCC United Nations Framework Convention on Climate Change
USD US Dollars
Abbreviations

6
Summary
This report, prepared by the Energy Research Centre (ERC), provides an overview of issues pertaining to climate change mitigation relevant to South Africa, and highlights the threats and opportunities that climate mitigation presents for national development. The report emphasises that South Africa’s policy on climate mitigation needs to be made within the context of both its international commitments and its national development priorities. Further, it provides clarity on the mitigation options available and the enabling environment that can facilitate the implementation of the commitments made by the South African Presidency in 2009 to a “peak, plateau and decline” emissions trajectory for South Africa between 2010 and 2050. Finally, it outlines a process for a two-stage national mitigation strategy, which includes the immediate implementation of a number of flagship mitigation programmes and the establishment of a cyclical process, centred on a low carbon development plan.
The sections below provide an overview of what is contained in the main report.
International context
Internationally, there is widespread scientific and political consensus that global temperature rise should be kept below 2°C above pre-industrial levels. Climate change is a global problem. South Africa, in common with other countries, cannot limit or prevent climate change unilaterally, and needs to participate in the current international effort under the UNFCCC to co-operate on emissions reduction. South Africa’s contribution to the international effort to limit emissions should be compatible with a global effort to limit climate change to 2°C, in line with its international negotiating position, and should also not be an outlier in relation to the mitigation programmes of other developing countries. The analysis provided in this report indicates that South Africa’s commitment and its long-term trajectory is proportional to a 2°C global ambition and to the current commitments of other comparable developing countries, given that that commitment is conditional.
National context
Unchecked, anthropogenic climate change threatens to have a severe impact on South Africa’s economy, natural environment and people, and to derail development gains. South Africa thus needs to be part of the global mitigation effort. South Africa’s emissions are relatively high on a per capita basis for a developing country. Most emissions originate in the energy sector. This, coupled with significant
development challenges, requires that mitigation policies need to be compatible with a number of other key policy objectives.
South Africa’s emissions trajectory
South Africa’s long-term emissions trajectory is to aspire to peak in the 2020 - 2025 period at between 500 and 550 Mt Carbon Dioxide Equivalent (CO2-eq), to remain at that emissions level until 2035, and for emissions to decline to a range of between 200 and 400 Mt CO2-eq in 2050. This is referred to as the “peak, plateau and decline” emissions trajectory. Current emissions, based on the most recent inventory for the year 2000, and estimated for 2010, are between 520 and 540 Mt. An analysis of current and historical emissions reveals that most emissions have their source in the energy sector: electricity supply is consistently the largest source of emissions, followed by industry, transport and liquid fuels supply.
Mitigation options
Climate mitigation potentially poses threats to development and creates significant opportunities: on the one hand, some measures could be very costly, but on the other, mitigation programmes offer massive investment opportunities, the opportunity for the development of new industries, and many other potential co-benefits, if implemented effectively.
Matching individual emissions limitation measures with a national target is complex and subject to considerable uncertainty. This report assessed the mitigation impact of individual measures and their interaction with one another, as well as economy-wide measures such as carbon pricing. Individual measures will have costs and benefits. Some measures, such as energy efficiency, will lower the costs to the economy of energy supply, whereas others, such as a shift to a lower carbon electricity supply, will result in higher energy prices. Since climate mitigation needs to be viewed within the context of national development, measures should be evaluated in terms of their potential contribution to economic development and in particular, job creation.
Considerations for implementing mitigation options
A national co-ordination mechanism will be required to ensure that South Africa is able to limit its emissions in line with its long-term trajectory, and that mitigation programmes have the optimal benefits for national development. Mitigation will therefore need to be integrated
Summary

7
into national development and planning processes, and should create the basis for a different type of economy. An optimal combination of mitigation measures (including broader measures such as urban planning and industrial policy, and economy-wide measures such as a carbon tax) needs to be identified, that takes into consideration timing of implementation, the cost, the availability of climate finance, the economic impact, together with benefits or costs to national development. Since implementation will of necessity take place across a range of sectors and in a variety of different institutional contexts, the national co-ordinating mechanism will need to build on existing mechanisms and develop new mechanisms where necessary.
A proposed mitigation strategy
It is imperative that some climate mitigation actions begin immediately. Since setting up the required co-ordinating mechanism will take time, a two-stage strategy is proposed, namely:
1. The immediate implementation of a number of key flagship mitigation programmes; and
2. The establishment of a cyclical process, centred around a low carbon development plan”.
Key flagship mitigation programmes that have been identified through a process of analysis as being efficient, effective and which will have a decisive mitigation impact in the 2010 – 2020 period should be immediately implemented. These include renewable energy and energy efficiency initiatives. Mechanisms should be established to enhance these programmes. These “fast start” programmes should be specified in the White Paper.
The structure and process of the low carbon development plan should be articulated in the White Paper and will function as part of a cyclical process of planning/co-ordination and review. It will be based on the development and review of an low carbon development plan every two years, and the establishment of a monitoring and evaluation system that assesses national emissions and the effectiveness of specific measures, as well as identifies new mitigation opportunities.
The low carbon development plan process should be structured around an inter-departmental process, co-ordinated via a secretariat situated in the Department of Environment Affairs (DEA), which would report to the Interministerial Committee on Climate Change, with stakeholder involvement at critical stages.
Summary
7

8
1 Introduction
1. Introduction
The overarching context for South Africa’s climate change mitigation policy is national development, i.e. meeting national development challenges. Unchecked, climate change will threaten South Africa’s capacity to meet these challenges and undermine existing achievements. Climate mitigation will potentially pose both threats to development and create significant opportunities: on the one hand, some measures could be very costly, but on the other, mitigation programmes offer massive investment opportunities, the opportunity for the development of new industries, and many other potential co-benefits if implemented effectively.
There are two dimensions to South African climate mitigation policy. The first is an international dimension, in which South Africa participates in a global effort to limit Greenhouse Gas (GHG) emissions from all countries to a level that would not result in dangerous climate change. The second is a national dimension, in which South Africa faces significant development challenges, where mitigation policies need to be compatible with a number of other key policy objectives. This report attempts to synthesise current knowledge and information on both, with the aim of providing some clarity on what options are available to achieve the “peak, plateau and decline” trajectory outlined by the President at the 2009 Climate Summit (Department of Environmental Affairs and Tourism (DEAT), 2009b).
1.1 South Africa’s mitigation effort in an international contextOne of the key reasons for South Africa to play a proactive role in the process of developing an international framework for limiting anthropogenic climate change is the potential impact of climate change on South African society and its natural environment. Climate impacts will not be evenly distributed globally. South Africa is highly likely to suffer from changes in precipitation and increased extreme weather events, impacting negatively on aspects such as human health, and resulting in significant biodiversity loss. Climate change thus has the potential to negatively affect both the economy and the welfare of the country as a whole, and to slow or reverse key development gains1. In addition, the impacts of unchecked climate change globally will be severe, especially on small island states and
least-developed countries. Apart from South Africa’s roles and responsibilities as a global citizen, climate impacts will also affect its African neighbours severely, and will thus affect the regional economy.
South Africa’s GHG emissions are relatively high for a developing country, when measured either in terms of GHG intensity or on a per capita basis. South Africa ranks 68th out of 165 countries for GHG intensity (annual GHGs emitted/GDP (PPP2), ordered from most to least intense), and emitted 9 tons of GHGs per capita in 2005, compared to an average for Annex I countries of 14 tons, for non-Annex-I countries of 4.8 tons, and a world average of 6.7 tons3. While South Africa’s contribution to global emissions is relatively small (0.98% of global GHGs emitted in 2005), no country, not even a large emitter such as China or the USA, can prevent the threat of climate change through unilateral action on emissions. All countries need to act in together to reduce global emissions effectively and lower the risk of future climate impacts. South Africa cannot take unilateral action on climate mitigation in order to avoid climate damage.
This is the context for South Africa’s current involvement in the international negotiations process on a future climate change regime. South Africa is a signatory to the United Nations Framework Convention on Climate Change (UNFCCC), as well as the Kyoto Protocol. Articles 3 and 4 of the UNFCCC oblige Parties to take actions to mitigate climate change and Article 3.1 states that: “The Parties should protect the climate system for the benefit of present and future generations of humankind, on the basis of equity and in accordance with their common but differentiated responsibilities and respective capabilities.”
Furthermore, South Africa has associated itself with the Copenhagen Accord, and was a Party to the decisions of the sixteenth Conference of the Parties (COP16) under the auspices of the UNFCCC in Cancun in 2010. There is now widespread international consensus amongst countries on a long-term global goal for limiting climate change to maximum increase of 2°C compared with pre-industrial levels. This goal is contained in the Copenhagen Accord in Clause 1, where Parties agree that they “recognizing the scientific view that the increase in global temperature should be below 2 degrees Celsius”, and in Clause 12,
1 It is beyond the scope of this report to consider these in detail. However, there is widespread consensus in the literature that South Africa is already experiencing climate impacts as a result of anthropogenic GHG emissions, and that if global emissions are not curbed, future impacts will be severe. There is still significant uncertainty on the scale and cost of such impacts. For a more detailed discussion, see for example Midgley GF, et al. (2007).
2 “PPP” or Purchasing Power Parity is a metric enabling the comparison of GDPs based on the purchasing power of to a specified basket of goods in each country.
3 All data is derived from the World Resources Institute’s Climate Analysis Indicators Tool (cait.wri.org). All Kyoto gases, including those from land use change, are included.
9
they agree that a mid-term review will be conducted to determine whether a more ambitious global goal should be set. The decision at Cancun reaffirms this decision.
The physical implications of this vision have been widely explored by climate analysts. Given the uncertainties in the climate system, the impact of emissions over the next century can only be expressed in probabilistic terms. To this end, specific global emissions pathways4 can be modelled to determine what the temperature outcome is likely to be in the long term, and the characteristics of emissions pathways that have a reasonable chance of limiting increases in global temperature to a certain level. A succinct overview and analysis of this work is provided by Meinshausen et al. (2009), who conclude that both cumulative emissions over the next four decades, and the actual emissions level in 2050 are robust indicators of the probability of staying below 2°C. Even though cumulative emissions are what matter, not all emissions pathways are economically feasible, since the rate at which emissions will increase or decrease without economic catastrophe is limited. Subject a global temperature goal, the key conclusions of this analysis are that:
• Global emissions space is limited over the next century;
• If one country, or a group of countries, uses more emissions space, less will be available for other countries;
• Cumulative emissions up until 2050 determine the probability of the temperature outcome; and
• The actual emissions level in 2050 is important, while the actual emissions level in 2020 is less so.
Given the goal of keeping within the 2°C limit with a specific probability, the range within which cumulative global emissions needs to be maintained is well understood. By adhering to, and advocating this goal in its negotiating position, South Africa is effectively subscribing to this global limit. However, what is not clear at this point is: a) whether a global regime will emerge from the current negotiations process that will be capable of keeping emissions within this space; and b) if this is the case, how the regime will allocate emissions space between countries. Climate
change mitigation represents a prisoners’ dilemma-type commons problem5 : if some countries act and others do not, the countries that act will bear all the costs of action, but all countries will share the benefits. Currently, South Africa’s stance is that it anticipates and advocates a legally-binding climate regime which will be based on a shared vision of a global goal of limiting climate change to 2°C, plus an equitable approach to sharing the burden of mitigation, international support for adaptation to climate change, adequate climate finance, and technology.
Assuming that for normative or pragmatic reasons South Africa anticipates participating in the global effort to adhere to a 2°C pathway, the key question that needs to be addressed is what South Africa anticipates its equitable share of this effort will be. For the last fifteen years, climate policy analysts have proposed a wide variety of approaches for the operationalisation of Article 3.1 of the UNFCCC. These have been based on the assumption that a rule-based system would be agreed upon in the current negotiations under the auspices of the UNFCCC to determine each country’s level of effort, based on the Convention principles stated in Article 3 of “common but differentiated responsibilities and respective capabilities”, which could be interpreted as historical and/or current emissions (responsibilities) and wealth per capita, or more broadly, level of development (capability). A second and related question concerns who should bear the cost of mitigation. Article 4.3 of the UNFCCC states that developed country Parties will bear the “agreed full incremental costs” of mitigation actions of developing countries, and help developing countries meet the costs of adaptation (Article 4.4). In practice, it is unlikely that a rule-based system will be implemented in an international regime, because any specific set of rules benefit some countries and disadvantages others. However, criteria for burden-sharing play a valuable normative role in assessing the relative contribution of different countries. There are broadly two approaches to sharing mitigation effort:
1. Determining “effort” in relation to a baseline: i.e. how emissions would develop in the absence of any climate constraints; and
2. Determining what proportion of global carbon emissions each country will be allowed to emit.
4 An “emissions pathway” is the annual emissions of world as a whole, a country or a sector over a given time period.
5 The “Prisoner’s Dilemma” is a theoretical construct from Game Theory which demonstrates why two people (or states) might not cooperate with each other even if co-operation represents a mutually optimal solution. The so-called “Tragedy of the Commons” is that a shared and limited resource is likely to be depleted through overuse by multiple, rationally acting, self-maximising individuals (or states), to the long-term detriment of all.
1. Introduction

10
There are several politically significant indicators for emissions reduction in the international negotiations: emissions or reductions in 2020 and 2050, and cumulative emissions over the period to 2050. So far, attention has been focused on the relationship between Annex I and non-Annex I mitigation. As an outcome of the Copenhagen Accord, non-Annex I countries, including South Africa, for the first time tabled actions to curb emissions. South Africa’s formal submission to the UNFCCC in a letter dated 29th January 2010 (Republic of South Africa (RSA), 2010), proposes that South Africa’s emissions will deviate from a “Business as Usual” (BAU) emissions trajectory in 2020 and 2025:
“In accordance with the provisions of Article 12 paragraph 1(b) as well as Article 12 paragraph 4 and pursuant to the provisions of Article 4 paragraph 1 of the Convention, South Africa reiterates that it will take nationally appropriate mitigation action to enable a 34% deviation below the ‘Business As Usual’ emissions growth trajectory by 2020 and a 42% deviation below the ‘Business As Usual’ emissions growth trajectory by 2025. In accordance with Article 4.7 of the Convention, the extent to which this action will be implemented depends on the provision of financial resources, the transfer of technology and capacity building support by developed countries. Therefore, the above action requires the finalisation of an ambitious, fair, effective and binding multilateral agreement under the UNFCCC and its Kyoto Protocol at COP 16 and CMP
6 in Mexico to enable the delivery of this support. With financial, technology and capacity building support from the international community, this level of effort will enable South Africa’s green house gas emissions to peak between 2020 and 2025, plateau for approximately a decade and decline in absolute terms thereafter.”
More precisely, South Africa’s intention to deviate from an emissions baseline was expressed in a statement by the South African Presidency on the 6th December 2009 (See Figure 1) The baseline was referred to as the “current” baseline in the context of the Long-Term Mitigation Scenarios (LTMS) undertaken by the Department of Environmental Affairs and Tourism (DEAT, 2007). The baseline was not stated but has been widely assumed internationally to be the LTMS baseline (Winkler 2007) although it could have been reference to comparative baselines6. In 2020, baseline emissions are projected to be 760.5 Mt for 2020, and 901.5 Mt for 2025. The resultant deviations from baseline therefore imply a national emissions target of 501.9 Mt in 2020 and 522.9 Mt in 2025. South Africa’s long-term emissions reduction goal has not been stated. In the LTMS, the end point of a “required by science” scenario was proposed, consisting of a decline in emissions relative to 2003 levels of 30 - 40%, which implies a 2050 level of 267 - 314 Mt. This implies a range of emissions pathways, as portrayed in the figure below, assuming linear change in emissions levels, and a 2010 emissions level of 530 Mt7.
6 For example, see Höhne, Moltmann, and Hagemann (2010).
7 The emissions level in 2010 has been estimated in Section 2.1 and 2.2. The actual value will only be known after a proper assessment for the national inventory is conducted. It is not known what the uncertainty of this estimate is: based on emissions growth trends, an estimate of a range of 500 - 560 Mt is probably reasonably accurate.
Figure 1: Proposed long-term emissions trajectory for South Africa.
Abbreviation: CPh: Copenhagen Accord.
500
400
300
200
peak, plateau and decline - Cph targets
100
0
2013
600
2016
2019
2022
2025
2028
2031
2034
2037
2040
2043
2010
2046
2049
peak, plateau and decline - LTMS 550 peak
Mt
CO
-eq
2
1. Introduction

11
1.2 Assessing the comparability of South Africa’s pledge
South Africa’s pledge has been internationally hailed by some as a bold contribution towards avoiding climate change. Others, particularly those within the domestic policy debate, have seen it as an overzealous and premature commitment, which places the country ahead of other countries in its eagerness to reduce emissions. Critics fear that meeting this commitment will result in an unacceptable burden on the economy due to the cost of this magnitude of mitigation, and is out of proportion to what South Africa’s effort as a developing country should be at this stage. In other words, it raises the question of whether this commitment represents an equitable contribution to the international effort in comparison to other countries, and whether it is consistent with South Africa’s commitment to the international negotiating process and a 2°C outcome.
Comparison of mitigation effort is very complex and subject to many normative criteria. Studies that specifically model this question in detail down to country level are limited, since most literature to date has focused on the central question of Annex I vs. non-Annex I mitigation effort. However, there are three basic approaches that can be used to evaluate South Africa’s position:
3. An approach based on the cost of mitigation: i.e. How would the direct costs of mitigation (as a proportion of GDP) compare among countries with different national commitments?
4. An approach based on equity criteria: i.e. Given several commonly-used criteria in current burden-sharing debates based on the UNFCCC (which are proxies for capability and responsibility), how does South Africa’s commitment compare those of other countries?
5. An approach based on a 2°C pathway: i.e. How consistent is South Africa’s commitment with the country’s commitment to a 2°C pathway?
There are some issues that need to be clarified in order to make these comparisons. South Africa’s proposed national mitigation goal has two dimensions: i) the targets lodged with the UNFCCC, which specify implied emissions levels for 2020 and 2025; and ii) the “peak, plateau and decline” trajectory, which is referred to in South Africa’s submission to the UNFCCC, but does not constitute an international commitment. The National Climate Change Response Green Paper proposes that the “peak, plateau and decline” trajectory is defined in terms of the international commitment, which is conditional on finance, technology and capacity-building support. It is possible to assess the 2020 and 2025 commitment comparatively in terms of the cost of mitigation, and to compare the level of effort to those of other countries according to a set of equity criteria. However, is not possible to determine consistency with a long-term temperature target without a high degree of uncertainty, except for the observation that emissions in 2020 and 2025 will indicate a range of future possible paths and that a higher peak will render a lower 2050 goal far more difficult. However, the cumulative emissions goal (total emissions from 2010 to 2050) can be measured, in light of South Africa’s commitment to a 2°C target, by comparing the national goal to allocations to South Africa under various burden-sharing/carbon space-sharing approaches, which have been advocated and analysed in the international policy debate on burden-sharing.
International studies on the national costs of mitigation generally rely on Mitigation Abatement Cost curves (MAC curves), which correlate abatement cost to mitigation over a specific time period. Den Elzen et al. (2011) use the FAIR model to analyse the comparative cost to countries of commitments made in terms of the Copenhagen Accord, and report results in terms of percentage of GDP. Given that South Africa’s commitment is conditional, an assumption in the model is that 50% of the incremental cost of abatement is financed internationally via transfers from Annex I countries, which are included in the costs faced by Annex I countries, and constitute around 10% of the cost of abatement in these countries. A comparison is presented in Figure 2 on the next page.
1. Introduction

12
The Chinese and Indian commitments exclude domestic policies, which will result in an estimated additional 1.4 Gt CO2-equivalent (CO2-eq) reductions, which are not considered in the modelling. Although the use of international models such as FAIR is subject to many assumptions and uncertainties, the FAIR baseline and assumptions for South Africa have been compared to national models. Results indicate that, taking into account additional domestic effort by India and China, South Africa’s commitment is not an outlier in terms of direct economic cost when compared with other major developing economies and the Annex I countries reported in Figure 2. There is still an important case to be made in the international negotiations that Annex I countries should take on more ambitious mitigation targets.
In terms of equity, there are three points of comparison for South Africa’s mitigation strategy: its 2020 goal, its 2050 goal and most importantly the cumulative emissions allowance over the period 2010 to 2050. There are two methodological approaches to burden-sharing scenarios, namely:
1) Using a set of baselines for individual countries, and distributing the “global mitigation effort” amongst countries, which is then measured against the baseline for each country; and
2) Allocating the global emissions allowance itself.
Both approaches result in a carbon allowance for each country considered up to 2050. Results for South Africa range from 5 Gt (Kanitkar et al., 2010) to 15 Gt (Höhne and Moltmann, 2009) in currently available literature. Studies based on a per capita approach for allocating global carbon space available to 2050 under a 2°C scenario, and especially those that also take historical emissions into account, tend to lead to low allocations for South Africa. Studies that use the effort-sharing approach tend to lead to higher allocations, but have a high sensitivity to baselines or BAU emissions. Given the small number of studies with disaggregated numbers for South Africa, and the sensitivity to baselines, a range of 5 - 18 Gt is a reasonable representation of international effort-sharing approaches for South Africa. Our current proposed emissions allowance for this period is in the region of 19 Gt. Sensitivity to baselines for these studies implies that a higher baseline would give a range of 15 - 25 Gt. Despite the uncertainties in these modelling approaches and their sensitivity to key assumptions, given its conditionality, South Africa’s commitment is not an outlier.
Oceania
Ukraine
Russia
Japan
Europe
USA
Canada
South Africa
Korea
Indonesia
India
China
Brazil
Mexico
-1,00% -0,50% 0,00% 0,50% 1,00%
Low
High
Percentage of GDP
Figure 2: Comparison of Mitigation Abatement Costs for commitments by countries in terms of the Copenhagen Accord. Source: (den Elzen et al., 2011)
1. Introduction

13
2.1 Historical emissions growth: 2000 - 2010The most recent national GHG emissions inventory for South Africa was published in May 2009, and contained data on emissions for the year 2000. The inventory report identifies a number of significant problems with basic data (DEAT 2009a). Emissions from 2001 to 2010 have been
estimated by Jongikaya Witi and Hilton Trollip (unpublished) in an assessment that is on-going and is primarily based on energy-use data during this period (See Figures 3 - 5). In the absence of better data, the estimations give a useful picture of emissions sources and trends in the economy. Figure 3 depicts emissions from 2000 to 2010.
2 South African GHG Emissions
2. South African GHG Emissions
Figure 3: Emissions Sources and trends from 2000 to 2010 (NEE: non-energy emissions; IPE: Industrial process emissions; CTL: coal to liquid) (Source: Jongikaya Witi and Hilton Trollip, own analysis)
Figure 4: Emissions by fuel type 2000 - 2010 (Source: Jongikaya Witi and Hilton Trollip, own analysis)
0
100
2001
200
300
400
500
2002
2003
2004
2006
2007
2008
2000
2009
2010
2005
600
Mt
CO
-eq
2
NEE
IPE excl CTL
CTL
Electricity
Transport
Residential
Industry not including CTL
Agriculture
Commerce
0
100
2001
200
300
400
500
NEE
IPE excl CTL
Natural gas
Liguid fuels
Coal
2002
2003
2004
2006
2007
2008
2000
2009
2010
2005
600
Mt
CO
-eq
2
Figure 4 depicts emissions by fuel types for the period 2000 – 2010. Allocated to fuel types, coal is the overwhelming source of the country’s emissions.

14
Figure 5 depicts the emissions allocated to the different energy supply sectors. The 2004 spike in emissions is due to an anomaly in the South African energy balance for which there is no obvious explanation, while the 2009 dip in emissions was due to the recession.
2. South African GHG Emissions
Figure 5: Energy supply sector emissions 2000 – 2010. (Source: Jongikaya Witi and Hilton Trollip, own analysis)
0
100
2001
200
300
400
500
2002
2003
2004
2006
2007
2008
2000
2009
2010
2005
600
NEE
Engergy sector (not allocated)
Transport
Residential
Industry not including CTL
Commerce
Agriculture
Mt
CO
-eq
2
Figure 6: Projected sectoral emissions 2010-2050.
0
200
2020
Mt
CO
2 -
eq
400
600
800
1000
NEE
IPE excl CTL
CTL
Electricity
Transport
Residential
2030 2040 20502010
Industry
Agriculture
Commerce
1200
1400
1600
1800
2.2 Research on future emissions growth: 2010 - 2050
The LTMS provides the most comprehensive baseline and
associated modelling and analysis currently available for
South Africa, in the form of the Growth Without Constraints
(GWC) scenario. The GWC emissions pathway was based
on an economic growth rate proposed in the Accelerated and Shared Growth Initiative for South Africa (AsgiSA) and a population projection from the Actuarial Society of South Africa (ASSA) model, and a range of technology characteristics contained in the LTMS Technical Report (Winkler, 2007). Emissions from 2010 - 2050 per sector were projected and are represented in Figure 6 below.

15
0
200
2020
400
600
800
1000
NEE
IPE (coal)
Gas
Liquid fuel
Coal
2030 2040 20502010
1200
1400
1600
1800
Mt
CO
-eq
2
2. South African GHG Emissions
In common with the inventory, the biggest share of emissions are projected to come from the electricity sector, followed by industry energy use, transport, industrial process emissions and converting coal to liquid fuel (CTL). The source of these emis-sions is largely projected to be coal, as depicted in Figure 7 below.
Figure 7: Projected sources of emissions by fuel 2010 - 2050
Figure 8: Projected sectoral allocation of emissions 2010 - 2050
0
200
2020
400
600
800
1000
Transport
Residential
Industry
Commerce
Agriculture
2030 2040 20502010
1200
1400
1600
1800
Mt
CO
-eq
2
Since industrial process emissions (IPE) are also largely based on coal use, coal will be the basic source for over 75% of South Africa’s emissions. Emissions can be allocated by sector to capture demand for emissions from secondary sources (primarily through demand for electricity), by allo-cating electricity emissions by energy use, namely IPE to the industrial sector, non-energy emissions (NEE) (largely agri-culture and land use related) to the agriculture sector, and emissions from CTLs to the liquid fuels sector. These result
in a sectoral allocation depicted in Figure 8 below. Emissions will consistently be dominated by the industrial and trans-port sectors. Of these important sectors, transport emis-sions are projected to be dominated by direct emissions from the synthetic fuels process, which contributes around 40% of transport emissions for manufacture of synthetic fu-els. The remainder are projected to result from combustion of liquid fuels in vehicles.

16
Projections of the industrial sector’s emissions are depicted in Figure 9. Although there is projected to be a shift over time because of endogenous improvements in electrical energy efficiency, emissions resulting from electricity gen-
eration will continue to dominate industrial sector emis-sions. According to Figure 9, in 2010 and 2020, electricity use constitutes at least 50% of total emissions, followed by emissions from direct coal use, and IPEs.
200
250
300
350
400
450
2012
2014
2016
2018
2020
2022
2024
2026
2010
2028
LTMS
IRP 2009
IRP 2010
IRp 2009 no DSM
IRP 2010 no DSM
LTMS plus Mmamabula emissions
Mt
CO
-eq
2
Figure 10: Selected electricity sector baselines: 2010 - 2028
Figure 9: Projected attribution of emissions from the industrial sector 2010 - 2050
0
20%
2020
30%
40%
50%
60%
Gas
Liquid fuels
IPE
Coal
Electricity
2030 2040 20502010
70%
80%
90%
100%
10%
2.2.1 Sector BaselinesThe only sector for which there are alternative emissions baselines is the electricity sector, where two alternative emissions baselines are available from the integrated resource planning (IRP) process, one in 2009 (Department of Energy, 2010), which was not officially released, and one
in 2011 (Department of Energy, 2011), which has just been approved by Cabinet. The 2009 baseline is worth reporting, since it was used to update the electricity sector of the LTMS baseline, given that it was the only updated baseline available at the time. All baselines assume coal power would remain the dominant technology.
2. South African GHG Emissions

17
400
500
600
700
800
1000
2012
2014
2016
2018
2020
2022
2024
2026
2010
2028
LTMS BAU
LTMS 2009 IRP BAU
LTMS 2011 IRP BAU
900
Mt
CO
-eq
2
Figure 11: LTMS baseline and LTMS baseline adjusted for different electricity sector baselines
Figure 10 provides an overview of selected electricity sec-tor baselines for the period 2010 - 2028. There are several fluctuations in the 2010 value due to the recession, which reduced electricity demand significantly in 2009, before re-covering strongly in 2010. The IRP 2009 baseline did not foresee a significant growth of electricity demand from 2009 - 2010. The LTMS did not take the recession into ac-count and the 2011 IRP included the recovery in demand levels. Both IRPs included limited demand side management (DSM) measures, which were not included in the LTMS, and the LTMS included imports from Mmamabula in Botswana, the emissions of which were not included in its baseline.
In the IRPs, the capacity during this period was sourced from domestic coal power. The LTMS also assumed a slight diversification to nuclear, in line with Eskom policy at the time. The emissions projections are in a similar range, with the LTMS increasing more slowly than the other projections.
Figure 11 provides a projection for the entire economy, taking differences in the electricity sector baseline into account. If the LTMS baseline is adjusted for different electricity sector baselines, total national emissions are slightly higher towards the end of the period.
2. South African GHG Emissions

18
Figure 12: Historical and BAU emissions for South Africa (Source: Höhne, Moltmann, and Hagemann, 2010)
0
100
200
300
400
500
800
Business as Usual
1990 1995 2000 2005 2010 2015 2020
LTMS 2007, growth without constraints
LTMS 2007, current development plans
McKinsey Project Catalyst 2009
700
600
Moltmann et al.2009
Mt
CO
-eq
2
2.2.2 Other baselinesThere are no other published emissions projections available in South Africa; however, there are some other proposed baselines from international studies, which have been compared by Höhne, Moltmann, and Hagemann (2010) and are depicted in Figure 12.
All alternative baselines are lower. Some of the deviation can be explained through different assumptions for the GDP growth rate to 2020, or different assumptions con-
cerning “own action” (i.e. pursuing some mitigation options that are economically rational regardless of the goals of cli-mate policy). Another proviso for these results is that glob-al models of the sort that underpin these studies, are gener-ally based on highly-aggregated data, and in some instances South Africa has been decomposed from a regional model (usually with Africa as one region), which poses significant data problems. Key issues are therefore i) GDP growth as-sumptions; ii) what policies can be considered BAU; and iii) data uncertainty.
2. South African GHG Emissions

19
3.1 IntroductionThe aim of this part of the discussion is to: i) identify criteria and analytical processes for effective and appropriate mitigation measures; ii) to identify a process to reconcile individual actions and a national mitigation ambition; and iii) to identify what is known about potential mitigation measures available to South Africa. Finally, this report aims to identify a process for developing, implementing and monitoring a national mitigation strategy, and also identify a set of measures that can be immediately implemented.
3.2 Classifying mitigation options for policy analysis
Even through the impact on climate change of one ton-equivalent of emissions from different sources (given assumptions about global warming potentials) is identical, curtailment of emissions from different sources has very different costs and requirements. Mitigation options can be classified and assessed in terms of:
• Direct or indirect impact: some mitigation programmes (for instance, a wind power programme) have a direct and easily quantifiable impact on emissions, whereas others, such as a change in land use planning in cities, have an indirect impact, which is much harder to quantify;
• Scale: the overall emissions reduction impact of specific programmes or policies;
• Timing: when emissions reductions from a specific programme or policy will occur;
• Cost: the direct cost to the economy of implementing a mitigation programme or policy over time;
• Path dependency: the extent to which mitigation policies and plans depend on previously implemented polices and plans;
• Economic impact: the indirect economy-wide impact of implementing mitigation programmes or policies, including the impact of policies or programmes on economic growth, employment, household income and income distribution;
• Co-benefits: other benefits not directly related to mitigation resulting from implementation of mitigation programmes or policies;
• Supporting programmes: some mitigation pro-grammes or policies require other measures for im-plementation for success, for example a specific regu-latory environment; and
• Policy opportunities: for other types of programmes, for example, localisation of solar water heater production.
Mitigation options are conventionally compared in terms of scale and cost, using a MAC curve, which correlates the cost of mitigation (marginal cost per ton of GHG mitigated) to the total mitigated. However, from a national point of view, particularly in a national development context, other criteria may be just as important. Table 1 below lists the key indicators described above for assessing mitigation measures and the analytical approach required to develop. Timing of mitigation is not just a question of meeting a national emissions trajectory, but also a question of intergenerational equity; mitigation policy is required not only to commit the current government and other actors to dedicate resources to mitigation, but also to commit future generations to dedicate resources, and intergenerational trade-offs need to be made.
3 Mitigation
3. Mitigation
Table 1: Key indicators for assessing mitigation measures, and the analytical approach needed to develop these.
Key analysis tools Other supporting analyses
Scale Emissions model Economic model
Timing Emissions model Economic model
Cost Emissions model Sectoral policy analysis
Path dependency Emissions model Economic model
Economic impact Economic model Emissions model, Sectoral policy analysis
Co-benefits Emissions/economic model
Supporting programmes Economic model/policy analysis Emissions model
Policy opportunities Policy analysis Economic/emissions model

20
Figure 13: GHG effects over time (Source: Höhne, Jung, and Ward 2010)
3. Mitigation
Direct GHG impact
Indirect GHG impact
Short term Longterm
Feed-in tariff
Standard for buildings
Emission Trading system
Urban Planning
R&D
Time until reduction effects
Capacity building
Labeling
BRT
Figure 13 below plots the impact of mitigation on two axes: direct and indirect impact, and immediate vs. long-term impact.
Finally, mitigation actions, particularly actions of a structural nature such as town planning interventions and structural shifts in the economy, form part of a shift to a “low-carbon economy”, which can best be defined as a transition to a development path that has a very low emissions intensity.
3.2.1 Developing key indicators for comparing mitigation options
Based on the list of criteria outlined in Section 3.2 above, key approaches to developing indicators for mitigation policy analysis are outlined below. The authors distinguish several types of analysis, and outline the relevant methodologies, before providing an overview of existing research in these areas in South Africa.
3.2.1.1 A note on systemic effects
Many mitigation actions interact in a complex way, which is the reason for developing complex models of physical emissions and of the economy. The mitigation impact of several individual measures is therefore not necessary additive. For instance, the impact of an energy efficiency programme in the electricity sector will have a specific outcome for electricity demand, but its impact on emissions will depend on the GHG intensity of the electricity system, which itself would change over time if, for instance, a renewable energy programme were to be implemented. In such a situation, the marginal impact of saving 1 MWh of electricity would decline as additional low-carbon electricity supply is added to the electricity system. The combined

21
impact of this effect can only be assessed by modelling the entire energy system. At the same time, increasing electricity generation costs due to the introduction of renewable energy will result in a demand response from the economy. This will have a mitigation impact and decrease the requirement for new investment, but will also slow the transition to a low-carbon electricity system.
There are complex interactions between investment decisions for items with long lead-times and large-scale energy supply capacity additions, rapidly evolving costs of technologies and additional interactions between alternative investments on the demand and supply sides of energy systems. Appropriate information and analysis and planning methodologies are required where mitigation measures involve choices around large investments (e.g. large-scale power generation), which have lead times of more than ten years and life-spans of fifty years or more, and where issues of national economic development trajectory are involved.
3.2.1.2 Greenhouse gas emissions data: current and historical emissions
Emissions data provides the basis for analysis of mitigation opportunities in the economy, assists in developing trends for sectoral emissions as well as associated activity data (e.g. physical quantities, for instance tons of steel) and economic data (quantities of value, for instance the economic output of a sector) to understand drivers for emissions changes in the economy.
3.2.1.3 Baselines and scenario modelling
In modelling emissions from the energy and other systems, and in economy-wide models, analysis is based on an emissions trajectory (alternatively referred to as a reference case, baseline, or a BAU trajectory), with associated assumptions, which is calculated based on the assumption that no climate change policies apply. Mitigation cost and mitigation effort are measured against this counterfactual reference case. The 2000 inventory (Department of Environmental Affairs and Tourism (DEAT), 2009) provides a good initial basis for mitigation policy, coupled with the updated estimates currently being calculated by the Department of Environmental Affairs (DEA).
3.2.1.4 Modelling future emissions: mitigation opportunities and the direct costs of mitigation
Emissions have broadly three sources in South Africa: i) energy emissions, which constitute the overwhelming majority of emissions and include transport emissions; ii) industrial process emissions (IPEs); and iii) others which include emissions and sinks from land use, waste, and other non-energy emissions (NEEs). Modelling the evolution of future emissions from specific activities is complex due to the many interactions between emissions-causing systems in the economy. These are well captured using bottom-up technology and activity-based modelling systems, such as the systems used in the LTMS. Physical emissions are well modelled in these systems, which are also able to report the direct costs of specific developments, depending on the data available. For the supply sectors, relatively good data is available, but for the demand side, and for transport, especially for infrastructure, cost data is far more uncertain. What these modelling frameworks do not capture adequately are interactions in the economy, and particularly responses from the economy due to price changes. Assessing the costs of mitigation is done by discounting the incremental system costs (the difference between the costs of the reference case, and that of the mitigation case) to a specific base year, annualising the cost over the period studied, and dividing by the total GHGs mitigated. The LTMS and IRP modelling frameworks use models of this type. The importance of developing models of systemic interactions, as opposed to models of the impact of individual measures, can be illustrated by an example from the electricity sector. There are two key interventions for limiting emissions in the electricity sector: i) a shift to lower-carbon electricity sources, and ii) energy efficiency programmes which limit demand. As illustrated in Figure 14 for the IRP 2010 (Department of Energy, 2011), implementing both these programmes will have a significant impact on the total mitigation potential of both programmes, as well as on the cost of mitigation. Implementing a low-carbon electricity switch will reduce the marginal mitigation impact, and thus the overall mitigation impact of an energy efficiency programme.
3. Mitigation

22
This is simply because the average emissions per unit of energy produced by the electricity system drops in the low-carbon case. Thus, for each unit of electricity displaced by the energy efficiency programme, fewer emissions are avoided. On the other hand, cost and investment implica-tions are more complex: an energy efficiency programme will slow the rate at which new capacity will be required and so the level of investment in low-carbon supply options will be lower for longer. The overall economic impact of a combined programme is optimal from a mitigation point of view, but this can only be assessed using an electricity sys-tem model, where the economic and physical interactions of these two measures can be understood.
3.2.1.5 Modelling economy-wide interactions and responses
Economy-wide models have a different basis to the bottom-up models referred to in Section 3.2.1.4. Whereas bottom-up technology-based models deal in physical energy and emissions flows in the economy, and cost direct investment
in technology, fuel and operating costs only, economy-wide models deal in monetary flows in the economy using a Social Accounting Matrix. The broader impact on the economy of specific measures can be modelled via the representation of the relationship between different sectors of the economy. The LTMS used an economy-wide Computable General Equilibrium (CGE) model to assess the economic impact of specific policies modelled in the energy model, and the Treasury’s recent work on a potential carbon tax used a similar model to explore the impact of a tax on the economy.
3.2.2 Economic and industrial policy analysis
In order to develop an information base for economy-wide analyses of the impacts of mitigation policies, as well as the potential for new industrial activity and/or localisation, significant research into supply chains for key mitigation technologies is required, as well as the potential for the South African economy to supply key components now and in the future. Little of this work has been done to date.
Figure 14: Total mitigation impact of an energy efficiency programme with and without low-carbon supply options (EE: energy efficiency)
1
2
4
6
8
10
12
14
16
2012
2014
2016
2018
2020
2022
2024
2026
2010
2028
GHG savings from EE with low-carbon options
GHG savings from EE without low-carbon options
2030
Mt
CO
-eq
23. Mitigation

23
3.3 Overview of mitigation potential by sector, and other approaches
There are several types of measures that can result in mitigation. As mentioned in Section 3.2, there are direct measures whose mitigation potential can be quantified easily. Economy-wide measures, such as a carbon tax, are more difficult to quantify. Yet other measures, which have more broad objectives but have a potential mitigation impact (such as urban planning aimed at increasing urban density), are sometimes very complex to quantify, and very difficult or impossible to monitor in terms of impact.
What is currently known about potential mitigation measures will be summarised briefly below. Sectoral mitigation strategies will be considered first, followed by economy-wide measures.
3.3.1 Energy
The majority of South Africa’s emissions come from the energy sector, and mitigation measures for energy emission can take one of three forms: i interventions in energy supply to reduce emissions; ii) interventions to reduce energy demand; or iii) changes in economic structure to reduce energy demand.
3.3.2 Electricity supply
According to the 2000 GHG inventory (the latest year for which there are official GHG statistics) (DEAT, 2009a), electricity supply comprises the single biggest source of emissions, and emissions estimates to 2009 indicate that this has not changed significantly. According to the most current South African GHG inventory (DEAT, 2009) in 2000 the combustion of coal for electricity generation contributed 179,436 Gg CO2-eq. This included auto-producers, which account for about 4%. This is 38% of total South African GHG emissions of 461,178 Gg CO2-eq.
The most current credible emissions data for electricity supply (excluding auto-producers) is provided in IRP2010 (Department of Energy, 2011) where a figure for 237 Mt CO2 is given for 2010, a 33% increase on the 2000 figure above, which, including auto-producers, could be estimated to be an increase of 37% over the last ten years.
3.3.2.1 Emissions projections for the sector
There are two key factors that determine emissions growth in the electricity sector: demand growth and emissions intensity (measured in Mt per TWh). Demand growth is subject to significant uncertainty and depends on both GDP growth and the electricity intensity of the economy. The latter is affected by the extent to which energy efficiency programmes are successfully implemented and is outlined in Section 3.3.3 below.
Current development plans for the electricity sector include two new coal-fired power plants, which are scheduled to be commissioned between 2012 and 2017. In addition to these, a BAU trajectory for the sector, without climate or other coal-related environmental considerations, will consist of additional coal plants, since these are the most cost-effective way of meeting demand given current technology prices. Given that new coal plants are assumed to be supercritical plants, which have a higher efficiency than that of current coal plants, there will be a gradual decline in emissions intensity, but the emissions trajectory will remain high (see discussion in Section 2.2.1 above).
3.3.2.2 Overview of sector mitigation potential
Three comprehensive studies on mitigation potential in the electricity supply sector have been carried out, namely the LTMS (DEAT, 2007), the IRP 2010 (Department of Energy, 2010), and the modelling work which was done for the new Renewable Energy White Paper (REWP). The REWP results are not available in the public domain and will therefore not be reported on, although modelling for the REWP included the only economy-wide impact analysis. A number of other more focused studies have also been completed, including Marquard et al. (2008), and the South African Renewables Initiative study commissioned by the Departments of Trade and Industry (DTI) and Public Enterprises (DPE) (DTI 2010a; DTI 2010b).
Technology options for reducing emissions from the electricity supply sector include low-carbon technologies (e.g. wind, solar thermal, solar photovoltaic (PV), nuclear energy), fuel switching for some applications to net lower-carbon energy sources (e.g. to natural or liquid petroleum gas for heating, or to solar water heating), and carbon
3. Mitigation
24
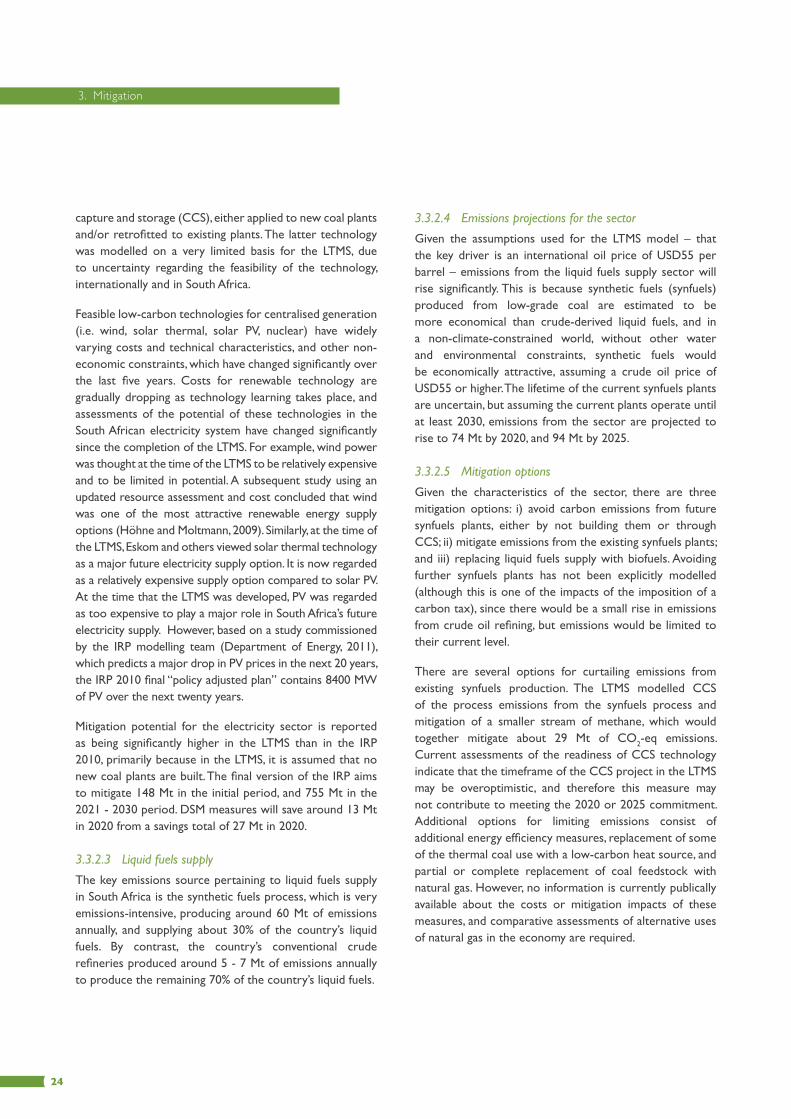
capture and storage (CCS), either applied to new coal plants and/or retrofitted to existing plants. The latter technology was modelled on a very limited basis for the LTMS, due to uncertainty regarding the feasibility of the technology, internationally and in South Africa.
Feasible low-carbon technologies for centralised generation (i.e. wind, solar thermal, solar PV, nuclear) have widely varying costs and technical characteristics, and other non-economic constraints, which have changed significantly over the last five years. Costs for renewable technology are gradually dropping as technology learning takes place, and assessments of the potential of these technologies in the South African electricity system have changed significantly since the completion of the LTMS. For example, wind power was thought at the time of the LTMS to be relatively expensive and to be limited in potential. A subsequent study using an updated resource assessment and cost concluded that wind was one of the most attractive renewable energy supply options (Höhne and Moltmann, 2009). Similarly, at the time of the LTMS, Eskom and others viewed solar thermal technology as a major future electricity supply option. It is now regarded as a relatively expensive supply option compared to solar PV. At the time that the LTMS was developed, PV was regarded as too expensive to play a major role in South Africa’s future electricity supply. However, based on a study commissioned by the IRP modelling team (Department of Energy, 2011), which predicts a major drop in PV prices in the next 20 years, the IRP 2010 final “policy adjusted plan” contains 8400 MW of PV over the next twenty years.
Mitigation potential for the electricity sector is reported as being significantly higher in the LTMS than in the IRP 2010, primarily because in the LTMS, it is assumed that no new coal plants are built. The final version of the IRP aims to mitigate 148 Mt in the initial period, and 755 Mt in the 2021 - 2030 period. DSM measures will save around 13 Mt in 2020 from a savings total of 27 Mt in 2020.
3.3.2.3 Liquid fuels supply
The key emissions source pertaining to liquid fuels supply in South Africa is the synthetic fuels process, which is very emissions-intensive, producing around 60 Mt of emissions annually, and supplying about 30% of the country’s liquid fuels. By contrast, the country’s conventional crude refineries produced around 5 - 7 Mt of emissions annually to produce the remaining 70% of the country’s liquid fuels.
3.3.2.4 Emissions projections for the sector
Given the assumptions used for the LTMS model – that the key driver is an international oil price of USD55 per barrel – emissions from the liquid fuels supply sector will rise significantly. This is because synthetic fuels (synfuels) produced from low-grade coal are estimated to be more economical than crude-derived liquid fuels, and in a non-climate-constrained world, without other water and environmental constraints, synthetic fuels would be economically attractive, assuming a crude oil price of USD55 or higher. The lifetime of the current synfuels plants are uncertain, but assuming the current plants operate until at least 2030, emissions from the sector are projected to rise to 74 Mt by 2020, and 94 Mt by 2025.
3.3.2.5 Mitigation options
Given the characteristics of the sector, there are three mitigation options: i) avoid carbon emissions from future synfuels plants, either by not building them or through CCS; ii) mitigate emissions from the existing synfuels plants; and iii) replacing liquid fuels supply with biofuels. Avoiding further synfuels plants has not been explicitly modelled (although this is one of the impacts of the imposition of a carbon tax), since there would be a small rise in emissions from crude oil refining, but emissions would be limited to their current level.
There are several options for curtailing emissions from existing synfuels production. The LTMS modelled CCS of the process emissions from the synfuels process and mitigation of a smaller stream of methane, which would together mitigate about 29 Mt of CO2-eq emissions. Current assessments of the readiness of CCS technology indicate that the timeframe of the CCS project in the LTMS may be overoptimistic, and therefore this measure may not contribute to meeting the 2020 or 2025 commitment. Additional options for limiting emissions consist of additional energy efficiency measures, replacement of some of the thermal coal use with a low-carbon heat source, and partial or complete replacement of coal feedstock with natural gas. However, no information is currently publically available about the costs or mitigation impacts of these measures, and comparative assessments of alternative uses of natural gas in the economy are required.
3. Mitigation
25
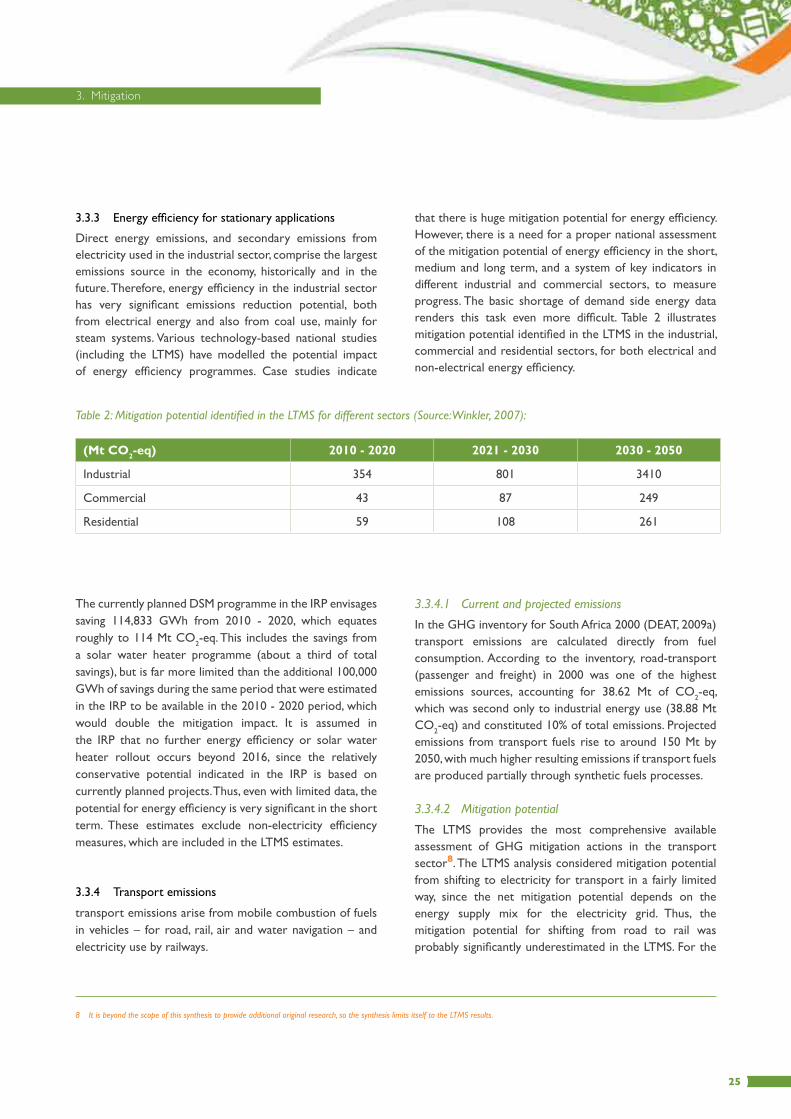
3.3.3 Energy efficiency for stationary applications
Direct energy emissions, and secondary emissions from electricity used in the industrial sector, comprise the largest emissions source in the economy, historically and in the future. Therefore, energy efficiency in the industrial sector has very significant emissions reduction potential, both from electrical energy and also from coal use, mainly for steam systems. Various technology-based national studies (including the LTMS) have modelled the potential impact of energy efficiency programmes. Case studies indicate
that there is huge mitigation potential for energy efficiency. However, there is a need for a proper national assessment of the mitigation potential of energy efficiency in the short, medium and long term, and a system of key indicators in different industrial and commercial sectors, to measure progress. The basic shortage of demand side energy data renders this task even more difficult. Table 2 illustrates mitigation potential identified in the LTMS in the industrial, commercial and residential sectors, for both electrical and non-electrical energy efficiency.
3. Mitigation
Table 2: Mitigation potential identified in the LTMS for different sectors (Source: Winkler, 2007):
(Mt CO2-eq) 2010 - 2020 2021 - 2030 2030 - 2050
Industrial 354 801 3410
Commercial 43 87 249
Residential 59 108 261
The currently planned DSM programme in the IRP envisages saving 114,833 GWh from 2010 - 2020, which equates roughly to 114 Mt CO2-eq. This includes the savings from a solar water heater programme (about a third of total savings), but is far more limited than the additional 100,000 GWh of savings during the same period that were estimated in the IRP to be available in the 2010 - 2020 period, which would double the mitigation impact. It is assumed in the IRP that no further energy efficiency or solar water heater rollout occurs beyond 2016, since the relatively conservative potential indicated in the IRP is based on currently planned projects. Thus, even with limited data, the potential for energy efficiency is very significant in the short term. These estimates exclude non-electricity efficiency measures, which are included in the LTMS estimates.
3.3.4 Transport emissions
transport emissions arise from mobile combustion of fuels in vehicles – for road, rail, air and water navigation – and electricity use by railways.
3.3.4.1 Current and projected emissions
In the GHG inventory for South Africa 2000 (DEAT, 2009a) transport emissions are calculated directly from fuel consumption. According to the inventory, road-transport (passenger and freight) in 2000 was one of the highest emissions sources, accounting for 38.62 Mt of CO2-eq, which was second only to industrial energy use (38.88 Mt CO2-eq) and constituted 10% of total emissions. Projected emissions from transport fuels rise to around 150 Mt by 2050, with much higher resulting emissions if transport fuels are produced partially through synthetic fuels processes.
3.3.4.2 Mitigation potential
The LTMS provides the most comprehensive available assessment of GHG mitigation actions in the transport sector8. The LTMS analysis considered mitigation potential from shifting to electricity for transport in a fairly limited way, since the net mitigation potential depends on the energy supply mix for the electricity grid. Thus, the mitigation potential for shifting from road to rail was probably significantly underestimated in the LTMS. For the
8 It is beyond the scope of this synthesis to provide additional original research, so the synthesis limits itself to the LTMS results.

26
same reason, more disaggregated analysis is necessary to analyse the mitigation potential of electric vehicles.
The three most promising transport mitigation options that were modelled in the LTMS were vehicle efficiency, transport modal shift for passenger transport, and a change in vehicle technology (i.e. to hybrid and electric vehicles). Table 3 provides a summary of emissions savings as a result of these transport mitigation measure for three timeframes.
Of these programmes the vehicle efficiency programme would be the simplest programme to implement, and would have significant positive benefits for the economy, in lower infrastructure investment, lower oil import costs and lower pollution impacts. Shifting to public transport is difficult to cost due to uncertainties on the cost of infrastructure, but would have other very significant sustainable development benefits. The mitigation potential for electric vehicles has probably been understated, and advances in battery
Table 3: Summary of emissions savings based on transport mitigation measures for the short, medium and long term
Mt CO2-eq 2010 - 2020 2021 - 2030 2030 - 2050
Efficient vehicles 15 87 656
Passenger transport modal shift 15 65 389
Electric Vehicles (coal electricity) 10 82 358
Hybrids 14 70 297
3. Mitigation
technology have resulted in significant cost reduction for this technology over the last five years. Hybrids are undoubtedly efficient but remain an expensive technology.
3.3.5 Other potential mitigation measuresnon-energy mitigation measures, primarily in agriculture, waste and land use have significant short-term potential, but there is significant uncertainty about the scope and potential for mitigation in these sectors. Modelling for the LTMS indicated that mitigation in these sectors could make a significant contribution to national mitigation in the 2010 - 2020 period, but more investigation is needed to understand the requirements for establishing programmes in these areas.
Relatively few mitigation opportunities, other than limited mitigation of hydrofluorocarbons (HFC’s) in existing aluminium smelters and methane from coal mining, were identified in limiting IPEs, other than CCS of the direct CO2 stream from the synfuels industry, which would mitigate 22 Mt CO2-eq per year, but which faces several technical challenges and is unlikely to occur until after 2020.
3.4 Comparative analysis of mitigation measures to achieve a national trajectory
As outlined in Section 3.2.1.1 above, the interaction of mitigation programmes is complex, and generally not additive. There are relatively simple interactions, for example between a low-carbon electricity programme and an energy efficiency programme, which result in lower total mitigation than the simple sum of the mitigation potential of each intervention calculated separated. However, there are more complex interactions between programmatic or economy-wide measures, such as industrial policy or a carbon tax, and individual measures, which are difficult to quantify, partly because the outcome of these kinds of measures is subject to significant uncertainty. Nevertheless, interactions can be modelled to a certain extent, and experience gained in the implementation and concomitant collection of appropriate data for indicators will improve our analytical ability to quantify the potential impact of a suite of measures.
The LTMS analysis, and the subsequent analysis based on the LTMS modelling that underpinned the national commitment

27
to the UNFCCC in the wake of the Copenhagen Accord, is the only analysis to date on a national level of the cumulative mitigation effect of a suite of measures to meet a specific target. The LTMS was not oriented to meeting a specific target or emissions trajectory, and mitigation options were compared based on the average mitigation over the entire
2003 - 2050 period. Mitigation potential in the LTMS study was estimated on an annual basis. It is therefore possible to rank mitigation measures by cumulative emissions savings in relation to BAU in the short, medium and long term, as illustrated in Table 4, below.
Table 4: Mitigation measures ranked by impact in the short, medium and long term - largest to smallest for each time period
2010 – 2020 2021 – 2030 2031 – 2040
Industrial energy efficiency Electricity supply options Electricity supply options
Electricity supply options Industrial energy efficiency Industrial energy efficiency
Land use - fire/savannah Synfuels CO2 CCS Improved vehicle efficiency
Waste management Land use - fire / savannah Synfuels CO2 CCS
Agriculture - enteric fermentation Waste management Passenger modal shift
Residential energy efficiency Residential efficiency Electric vehicles / Hybrids
Agriculture - reduced tillage Commercial efficiency Residential energy efficiency
SWH Improved vehicle efficiency Commercial energy efficiency
Commercial energy efficiency Electric vehicles Waste management
Synfuels methane reduction Afforestation SWH
Afforestation Agriculture - enteric fermentation Land use - fire / savannah
Biofuels SWH Cleaner coal
Improved vehicle efficiency Hybrids Agriculture - enteric fermentation
Passenger modal shift Passenger modal shift Biofuels
3. Mitigation

28
The key features of the ranking are that electricity supply sector savings rank consistently highly, but have lower savings in the short term than energy efficiency, as discussed in Section 3.3.3 above. Moreover, the short-term savings (up until to 2020) will be much lower without very significant additional cost being incurred nationally compared to BAU, on account of the commitment to build the Medupi and Kusile coal plants. The other notable feature of the table is the contribution of non-energy measures in agriculture, waste and land use change. Contributions to meeting the 2020 and 2025 emissions commitment are expressed in Figure 15 below in percentage deviation from BAU.
The figure gives an idea of the relative scale of contribu-tions of various measures to a 2020 and 2025 commitment. The graph reflects the technical potential of measures, and also contains an accounting error, which overestimates the potential of reductions in emissions from liquid fuel supply by about 1.5% deviation. A large proportion of the mitiga-tion in liquid fuel supply is derived from avoiding investing in further coal synthetic fuels plants, rather than from in-vestment in low-carbon energy sources. Therefore, the two key mitigation measures for meeting the commitment in the short, medium and long term are low-carbon electricity supply and energy efficiency.
Figure 15: Estimated scale of contribution of sectoral measures to a 2020 and 2025 mitigation target
5,0%
10,0%
2020 2025
15,0%
20,0%
25,0%
30,0%
35,0%
40,0%
45,0%
0,0%
Emission reductions in LULUCF
Improved agriculture
Waste minisation
Reducing industrial process emissions
Liquid fuel supply options
Advanced transport options
Sustainable transport development
Initial lower CO2 electricity supply
Enhanced lower CO2 electricity supply
Sustainable housing development
Improved efficiency in industry
Efficient commercial building and public buildings
3. Mitigation
The only comparable economy-wide analysis that has been undertaken is the analysis of the impact of the proposed carbon tax undertaken by the National Treasury, the results of which have not yet been made publically available. No systematic analysis has been undertaken of the mitigation impact of a change in the structure of the economy, as a result either of industrial policies or rising energy prices, although this is in fact the effect of putting a price on carbon, and is one of the outcomes of the carbon tax modelling.
A key problem in developing a series of programmes and policies to meet a national mitigation objective is that there is uncertainty attached to each measure. The key uncertainties concern implementation. Implementation problems of some measures such as electricity are relatively well known, although current deployment of renewable energy technologies still faces institutional hurdles, whereas implementation problems for other programmes, such as energy-efficient vehicles, are relatively unknown.

29
The key context for climate mitigation should be national development, informed by the necessity to avoid dangerous climate change, and South Africa’s concomitant commitment to the international effort to limit global emissions. A national emissions trajectory should be set, which is compatible with South Africa’s current commitment in terms of the Copenhagen Accord and informed by a methodical assessment of mitigation potential in the economy and its associated costs and benefits. Such a trajectory should peak between 2020 and 2025 between 500 - 550 Mt CO2-eq, remain stable until around 2035, and then decline to a 2050 level of 200 - 400 Mt CO2-eq. This aspiration should be stated as a foundation for South Africa’s mitigation policy framework. The national trajectory should be reviewed from time to time, as new technology and new sources of finance become available. Developments in the science of climate change and in the international climate change regime will also have to be taken into account in future reviews of the national trajectory.
Once a national emissions trajectory has been defined, the key policy challenges that need to be addressed in the National Climate Change Response White Paper are: i) how to distribute mitigation effort between different types of instruments, both in individual sectors as well as for economy-wide instruments such as carbon pricing; and ii) how to mitigate the risk of uneven implementation.
In addition, the policy approach will require a coordinating mechanism that will be able to house a multiplicity of new and existing approaches and mechanisms (which will all have quite different institutional and governance dynamics), in order to attain national mitigation goals. Since it is imperative that climate mitigation actions begin immediately, and since setting up the required mechanism will take time, a two-stage mechanism is proposed, namely:
1. The immediate implementation of a handful of key flagship mitigation programmes; and
2. The establishment of a low carbon development plan.
Key flagship mitigation programmes that have been identified through a process of analysis as being efficient, effective and which will have a decisive mitigation impact in the 2010 - 2020 period should be immediately implemented. These should be specified in the National Climate Change Response White Paper.
The Flagship Programmes identified include of the following:
1. A scaled-up renewable energy programme, based on the current renewable energy programme specified in IRP 2010 and informed by localisation potential. SARi would be a potential tool for implementation, with appropriate governance structures.
2. An aggressive energy efficiency programme in industry, building on the experience of Eskom’s DSM programme, also covering non-electricity energy efficiency. A structured programme is necessary, with appropriate initiatives, incentives and regulation, and a well-resourced information process.
3. Residential energy efficiency programme, consisting of two programmes, namely i) a programme consisting of appropriate initiatives, incentives and regulation, and ii) the National Sustainable Settlements Facility, an initiative under development for the provision of energy-efficient housing for poor households.
4. Expanded solar water heating (SWH) programme, which will have the 2030 goal of raising the level of penetration of SWH to eight million households, and to develop pilot programmes for commerce and industry.
5. A national efficient vehicles programme, to implement measures to improve the average efficiency of the South African vehicle fleet significantly by 2020.
6. Two government programmes for mitigation measures:
a. A building efficiency programme, which will carry out energy and emissions audits of all government buildings and facilities, develop comparable indicators and benchmarks, and make appropriate interventions. The programme should include some flagship programmes for key government buildings, including Parliament and key government buildings in Pretoria. Ambitious goals for energy efficiency should be set for all new government buildings.
b. A vehicle efficiency programme, which will aim to improve the efficiency of the government vehicle fleet significantly by 2020, and incentivise new efficient vehicle technologies such as electric vehicles by setting targets for acquisition of such vehicles.
4 Structure and Approach for Implementation
4. Structure and Approach for Implementation

30
7. Flagship public transport programme.
8. A pilot CCS plant to store the process emissions from the synfuels industry.
Other key programmes will be defined and implemented as an outcome of the first low carbon development plan to be completed by the end of 2012, which will also compile and contextualise current measures in implementation that have a mitigation impact. The low carbon development plan will be developed and reviewed every two years. It will involve a national analysis of mitigation options based on the national inventory system, monitoring, reporting and verification of measures in implementation, key mitigation indicators, supplementary research and analysis, and stakeholder submissions and involvement. It will include the development and review of a national programme that will meet the national emissions constraint. Sectoral plans will be developed in the following areas:
• Electricity supply
• Liquid fuels supply
• Mining and minerals processing
• Industry
• Buildings (residential and commercial)
• Transport
• Agriculture
• Forestry
• Waste
The structure and process of the low carbon development plan and its sectoral plans will be articulated in the White Paper and will function as part of a cyclical process as portrayed in Figure 16 below.
Since the implementation context of the sectoral plans will be quite diverse, a range of policies, programmes, measures and regulations will flow from each plan. Each plan would include a set of measurable indicators to track implemen-tation. Institutional contexts vary: for example, the elec-tricity sector has the IRP process, which is prescriptive, conducts a detailed analysis of the whole electricity sys-tem and is therefore an ideal mechanism for implementa-tion of large-scale renewable energy programmes. Others, such as the transport sector, have frameworks and policies but are not formally planned; measures could range from efficient vehicle programmes to inclusion of low-carbon planning in local authority Integrated Development Plans (IDPs). Each plan would involve a national conversation on effort-sharing between sectors, sectoral targets, as well as sectoral implementation.
The second part of the cycle would involve compilation of the emissions inventory, collection of relevant indicator data (defined by the sectoral plans), and monitoring, reporting and verification of implementation progress in each sector. International and national experience indicates that this iterative process will develop capacity and key methodologies and experience over a number of years, and that continuity is very important.
4. Structure and Approach for Implementation

31
Figure 16: Low carbon development planning cycle.
GHG and other data, monitoring, reporting and verification
Structure and process in white paper International climate regime
Content in white paper
Long-term national emissions trajectory
Initial ‘Flagship Programmes’ for key mitigation programmes which start now
Eco
no
my-w
ide
in
stru
me
nts
Low Carbon Development Plan, every two years
Sectoral mitigation plans and targets - electricity, transport, industry, buildings (households, commercial)
Existing / new implementation mechanisms - IRP, IEP, local authority IDP’s
Inventory - emissions and economic indicators
Monitoring, reporting, and verification - implementation indicators
Inte
rnat
iona
l fina
nce,
te
chno
logy
and
cap
acity
-
build
ing
Inte
rnat
iona
l re
port
ing
SA
Inte
rnat
iona
l co
mm
itmen
ts
4. Structure and Approach for Implementation

32
5. References
- Department of Energy. (2010). IRP 2010 Energy Forecast Revision 2 Report. Pretoria.
- Department of Energy (2011). Integrated Resource Plan for Electricity 2010-2030, Final Report. Pretoria
- Department of Environment Affairs and Tourism (DEAT). (2007). Long Term Mitigation Scenarios: Strategic Options for South Africa. [online] Available at: <http://www.envi-ronment.gov.za/HotIssues/2008/LTMS/A%20LTMS%20Scenarios%20for%20SA.pdf> [Accessed 19 August 2011]
- Department of Environment Affairs and Tourism (DEAT). (2009a). Greenhouse Gas Inventory for South Africa: 1990 - 2000. Pretoria.
- Department of Environmental Affairs and Tourism (DEAT) (2009b). South Africa’s Long Term Mitigation Scenarios: Process and Outcomes. Presentation at the Climate Change Summit 2009. [online] Available at: <http://www.ccsummit2009.co.za/Downloads/Media/Presentation_Joanne_Yawitch.pdf> [Accessed 19 August 2011]
- Department of Trade and Industry (DTI). (2010a). Un-locking South Africa’s Green Growth Potential. South African Renewables Initiative (SARi) Update briefing, December 2010. [online] Available at: <http://sarenew-ablesinitiative.files.wordpress.com/2011/02/sari-cancun-update-briefing-for-distribution.pdf>
- Department of Trade and Industry (DTI). (2010b). Un-locking South Africa’s Green Growth Potential. South African Renewables Initiative (SARi) Update briefing pre-sentation at COP16, December 2010. [online] Available at: <http://sarenewablesinitiative.wordpress.com/about/the-sari-approach/>
- den Elzen, M.G.J., Hof, A.F., Beltran, A.M., Grassi, G., Roelf-sema, M., van Ruijven, B., van Vliet, J., and van Vuuren, D.P. (2011). The Copenhagen Accord: abatement costs and carbon prices resulting from the submissions. Environ-mental Science & Policy 14, no. 1 (January): pp 28 - 39.
- Höhne, N., Jung, M., and Ward, M. (2010). Scaled-up miti-gation programmes: Presentation delivered at UNFCCC side event, Tianjin, 6 October 2010. Ecofys & GtripleC.
- Höhne, N., and Moltmann, S. (2009). Sharing the effort under a global carbon budget. Cologne, Germany.
- Höhne, N., Moltmann, S., and Hagemann, M. (2010). Emis-sion reduction proposals by emerging economies. Co-logne, Germany.
- Kanitkar, T., Jayaraman, T., D’souza, M., Sanwan, M., Purkay-astha, P., Talwar, R., and Raghunandan, D. (2010) TISS-DSF
EMISSIONS MODEL. Presentation at the Conference on ‘Global Carbon Budgets and Equity in Climate Change, TISS, 28-29 June 2010. Source: http://moef.nic.in/down-loads/others/TISS-DSF%20Emissions%20Model-TKanit-kar-28June2010.pdf
- Marquard, A, Merven, B and Tyler, E. (2008). Costing a 2020 target of 15% renewable electricity for South Af-rica. (With an appendix by Kilian Hagemann on South African wind resources.) Cape Town,
- Meinshausen, M., Meinshausen, N., Hare, W., Raper, S.C.B., Frieler, K., Knutti, R., Frame, D.J. and Allen, M.R. (2009). Greenhouse gas emission targets for limiting global warming to 2ºC. Nature Letters 265-279.
- Midgley G.F., Chapman, R., Mukheibir, P., Tadross, M., Hewitson, B., Wand, S., Schulze, R., Lumsden, T., Horan, M., Warburton, M., Kgope, B., Mantlana, B., Knowles, A., Abayomi, A., Ziervogel, G., Cullis R., and Theron, A. (2007) Impacts, vulnerability and adaptation in key South Afri-can sectors: An input into the Long Term Mitigation Sce-narios process, LTMS Input Report 5, Energy Research Centre, Cape Town.
- Republic of South Africa (RSA). (2006). Accelerated and Shared Growth Initiative for South Africa (AsgiSA,) [on-line] Available at: <http://www.info.gov.za/asgisa>
- Republic of South Africa (RSA). (2010). Letter to the Executive Secretary of the United Nations Framework Convention on Climate Change (UNFCCC) on South Africa’s nationally appropriate mitigation action under the Copenhagen Accord. [online] Available at: <unfccc.int/files/.../copenhagen_accord/.../southafricacphac-cord2_app2.pdf>
- South African Cabinet (2008), Media Release by Van Schalkwyk, M., Minister of Environmental Affairs and Tourism [online] Available at: < www.info.gov.za/speech-es/2008/08072816451001.htm>
- United Nations Framework Convention on Climate Change (UNFCCC).(1992). [online] Available at: <http://unfccc.int/resource/docs/convkp/conveng.pdf>
- United Nations Framework Convention on Climate Change (UNFCCC). (2009). The Copenhagen Accord (2/CP.15 [online] Available at: <http://unfccc.int/resource/docs/2009/cop15/eng/11a01.pdf>
- Winkler, H (Ed). (2007). Long Term Mitigation Scenarios: Technical Report, Prepared by the Energy Research Cen-tre for Department of Environment Affairs and Tourism, Pretoria, South Africa.
5 References


environmental affairs Environmental Affairs Department:
REPUBLIC OF SOUTH AFRICA
On behalf ofOn behalf of
315 Pretorius streetcnr Pretorius & van der Walt StreetsFedsure Forum BuildingNorth Tower2nd Floor (Departmental reception) or1st Floor (Departmental information center)Pretoria, 0001.
Postal AddressPrivate Bag X447Pretoria0001
www.environment.gov.za
S-0146 ww
w.stu
dio
112.co.za