Environment and energy 1. The - dst.dk fileconcentratoins of sulphur may cause greater acdificiatoin...
42
Environment and energy Environment and energy Environment and energy Environment and energy Environment and energy 1. 1. 1. 1. The The The The DPSIR DPSIR DPSIR DPSIR model model model model The environmental has been based on a so-called DPSIR model, which is a theoretical and internationally recognised model. This model comprises five elements: Driving forces, Pressure, State, Impact, and Response. The The The The DPSIR DPSIR DPSIR DPSIR model odel odel odel Driving Driving Driving Driving forces forces forces forces • Population Population Population Population • Production Production Production Production • Transport Transport Transport Transport • Consumption Consumption Consumption Consumption • etc. etc. etc. etc. Response Response Response Response • Duties Duties Duties Duties and and and and subsidies subsidies subsidies subsidies • Increased recycling Increased recycling Increased recycling Increased recycling • Research Research Research Research • Fishing quotas Fishing quotas Fishing quotas Fishing quotas • etc. etc. etc. etc. Pressure Pressure Pressure Pressure • Power plant emissions Power plant emissions Power plant emissions Power plant emissions • Emissions from Emissions from Emissions from Emissions from production production production production • Emissions from transport Emissions from transport Emissions from transport Emissions from transport • etc. etc. etc. etc. State State State State Current Current Current Current environmental state environmental state environmental state environmental state: • Air Air Air Air quality measuring quality measuring quality measuring quality measuring • Water quality measuring Water quality measuring Water quality measuring Water quality measuring • etc. etc. etc. etc. Impact Impact Impact Impact Identifiable Identifiable Identifiable Identifiable changes changes changes changes to: to: to: to: • Air Air Air Air quality quality quality quality • Acidification Acidification Acidification Acidification • Health Health Health Health • etc. etc. etc. etc. Driving forces Driving forces Driving forces Driving forces This model is based on the fact that the vast array of human activity in our society - the driving forces - may occasion environmental problems. For example, these driving forces may be the amount of energy produced. Driving forces are economic activities on which we all depend, but they do not provide any information on the state of the environment in themselves. Pressure Pressure Pressure Pressure Production in Denmark causes pressure on the environment in the form of emissions and discharges of large amounts of waste associated with this production. For example, electricity generation at a power station may involve the burning of coal, occasioning the release of carbon dioxide and other substances such as sulphur and nitrogen, and the task then is to identify and calculate such emissions. Carbon dioxide is a so-called greenhouse gas which is not dangerous in itself. However, as carbon dioxide quantities increase, this gas contributes to a gradual process of global heating, which may cause melting of the polar ice caps and changes in rainfall patterns. Fig Fig Fig Figure re re re 1 1 1 1
-
Upload
hoangkhuong -
Category
Documents
-
view
213 -
download
0
Transcript of Environment and energy 1. The - dst.dk fileconcentratoins of sulphur may cause greater acdificiatoin...

Environment and energy
Environment and energyEnvironment and energyEnvironment and energyEnvironment and energy
1. 1. 1. 1. The The The The DPSIRDPSIRDPSIRDPSIR modelmodelmodelmodelThe environmental has been based on a so-called DPSIR model, which is atheoretical and internationally recognised model. This model comprises fiveelements: Driving forces, Pressure, State, Impact, and Response.
The The The The DPSIRDPSIRDPSIRDPSIR mmmmodelodelodelodel
DrivingDrivingDrivingDriving forcesforcesforcesforces• PopulationPopulationPopulationPopulation• Production Production Production Production • TransportTransportTransportTransport• ConsumptionConsumptionConsumptionConsumption• etc.etc.etc.etc.
ResponseResponseResponseResponse• Duties Duties Duties Duties and and and and subsidiessubsidiessubsidiessubsidies• Increased recyclingIncreased recyclingIncreased recyclingIncreased recycling• ResearchResearchResearchResearch• Fishing quotasFishing quotasFishing quotasFishing quotas• etc.etc.etc.etc.
PressurePressurePressurePressure• Power plant emissionsPower plant emissionsPower plant emissionsPower plant emissions• Emissions from Emissions from Emissions from Emissions from productionproductionproductionproduction• Emissions from transport Emissions from transport Emissions from transport Emissions from transport • etc.etc.etc.etc.
StateStateStateStateCurrentCurrentCurrentCurrent environmental stateenvironmental stateenvironmental stateenvironmental state::::• Air Air Air Air quality measuringquality measuringquality measuringquality measuring• Water quality measuringWater quality measuringWater quality measuringWater quality measuring• etc.etc.etc.etc.
ImpactImpactImpactImpactIdentifiableIdentifiableIdentifiableIdentifiable changeschangeschangeschanges to:to:to:to:• AirAirAirAir qualityqualityqualityquality• AcidificationAcidificationAcidificationAcidification• HealthHealthHealthHealth• etc.etc.etc.etc.
Driving forcesDriving forcesDriving forcesDriving forcesThis model is based on the fact that the vast array of human activity in oursociety - the driving forces - may occasion environmental problems. Forexample, these driving forces may be the amount of energy produced. Drivingforces are economic activities on which we all depend, but they do not provideany information on the state of the environment in themselves.
PressurePressurePressurePressureProduction in Denmark causes pressure on the environment in the form ofemissions and discharges of large amounts of waste associated with thisproduction. For example, electricity generation at a power station may involvethe burning of coal, occasioning the release of carbon dioxide and othersubstances such as sulphur and nitrogen, and the task then is to identify andcalculate such emissions. Carbon dioxide is a so-called greenhouse gas whichis not dangerous in itself. However, as carbon dioxide quantities increase, thisgas contributes to a gradual process of global heating, which may causemelting of the polar ice caps and changes in rainfall patterns.
FigFigFigFiguuuurererere 1 1 1 1

Environment and energy
StateStateStateStateThus, human pressure on its surroundings and environment causes thisenvironment to slowly change its nature. As is the case with other types ofstatus supervision, regular measurement of the state of the environment iscarried out. In the example quoted above, carbon-dioxide emissionscontribute to a status report which shows greater carbon-dioxideconcentrations in the atmosphere.
ImpactImpactImpactImpactA given state will typically have an impact on the environment. In the power-station example, the impact of increased concentrations of carbon-dioxide gasin the atmosphere is an increase in global heating. Also, atmosphericconcentrations of sulphur may cause greater acidification of lakes due tosulphur oxides. Such environmental impacts may not necessarily beimmediately identifiable, but will be observed over a period of years in theform of changes to the state of the environment.
ResponseResponseResponseResponseIf the state of the environment is not acceptable, this constitutes anenvironmental problem. Such a problem will typically entail a response fromthe authorities. Responses may either be political (examples include bans onenvironmentally harm substances or the introduction of "green taxes andduties") or behavioural. It is also possible to promote desirable behaviour byproviding subsidies in support of alternative production methods andprocesses which are less harmful to the environment.
A response might also take the form of international agreements. As far ascarbon-dioxide emissions are concerned, the Danish response has entailed theintroduction of duties and international agreements. Also, the population mayreact by changing their behaviour as regards particular issues. Suchbehavioural changes may manifest themselves as deliberate product choicesbased on a positive or negative view of the relevant production methods orproduct contents. The phrase used to describe individuals who display suchbehaviour is "political consumers".
The five elements which comprise the DPSIR model are very different. Some ofthe elements are calculated as physical quantities, and some in monetaryvalues – i.e. quantitative measures. Other elements within the model concernthe agreements entered into - qualitative measures. As it is not possible tomeasure the five elements of the model by the same yardstick, the ways inwhich these five elements are addressed in the model will also differ.
Individual issues and themes from the model will be addressed below.

Environment and energy
2. 2. 2. 2. Air pollutionAir pollutionAir pollutionAir pollutionGreenhouse gases contribute to air pollutionGreenhouse gases contribute to air pollutionGreenhouse gases contribute to air pollutionGreenhouse gases contribute to air pollutionThe air and the environment are subjected to significant pressure from theburning of fossil fuels, which entails emissions of carbon dioxide and othersubstances such as sulphur and nitrogen. As was mentioned above, carbondioxide is a so-called greenhouse gas which is not dangerous in itself, butwhich, in greater quantities, will contribute to a gradual increase in averageglobal temperatures - global heating. Sulphur and nitrogen contribute togreater air acidity.
The most important greenhouse gases are carbon dioxide, methane andnitrogen oxides and a number of industrial gases such as chlorofluorocarbons(CFCs). Carbon dioxide accounts for 64 per cent of the global heating createdby humans, while methane accounts for 20 per cent, nitrogen oxides for 6 percent, and CFCs and related substances account for 10 per cent .
Denmark's emissions of carbon dioxide vary over the years, a fact which ispartly due to the net export of electricity. In the years where Denmark has alarge export of electricity, carbon-dioxide emissions increase as powergeneration increases. Efforts are being made to reduce carbon-dioxideemissions by replacing fossil fuels, such as coal, by natural gas and renewableenergy. Agriculture is the main source of methane and nitrogen-oxideemissions and discharges.
AcidificationAcidificationAcidificationAcidificationThe environment is also subjected to significant pressure from the increasedacidity of the air. Acidification occurs when emissions of nitrogen and sulphurfall with precipitation in the form of ammonia, nitrogen oxides and sulphurdioxides. Sulphur and nitrogen combine to form acidic chemical compoundswhich cause buildings to deteriorate and are harmful to plants and the aquaticenvironment. Acidification is calculated by means of Potential AcidificationEquivalents (PAEs), which is a common acidification unit for all acidifyingsubstances.
Acidification from Danish activitAcidification from Danish activitAcidification from Danish activitAcidification from Danish activitiesiesiesies 1990-1998 1990-1998 1990-1998 1990-1998
0000
5555
10101010
15151515
20202020
25252525
1990199019901990 1991199119911991 1992199219921992 1993199319931993 1994199419941994 1995199519951995 1996199619961996 1997199719971997 1998199819981998
NOxNOxNOxNOx
SO2SO2SO2SO2
NH3NH3NH3NH3
Thousand tons PAEThousand tons PAEThousand tons PAEThousand tons PAE
Source: DMU.
FigureFigureFigureFigure 2 2 2 2

Environment and energy
The acidifying substances come from agriculture, from energy conversionwithin the energy sector, and from the transport sector. In 1990, energyconversion was the largest contributor, accounting for 35 per cent of the totalDanish emissions. Agriculture accounted for 33 per cent and the transportsector for 23 per cent. These percentages have changed: in 1998, agricultureaccounted for the greater share of emissions, 44 per cent, while the other twosectors contributed 24 per cent each.
Acidifying substances are transboundary in nature. They are carried far andwide by the wind, and thus emissions from one country may fall and causeacidification of the environment in a different country. This means that part ofthe acidification potential from Danish activity contributes to acidification ofthe environment in a number of neighbouring countries, most of which aresituated to the east of Denmark. Similarly, the Danish environment is not justexposed to acidification from Danish emissions, but also exposed to foreignemissions brought to Denmark by the wind.
3. 3. 3. 3. Energy consumptionEnergy consumptionEnergy consumptionEnergy consumption
Energy consumptionEnergy consumptionEnergy consumptionEnergy consumptionEmissions from energy consumption are a significant cause of several of theenvironmental problems facing Denmark and the rest of the world. Thus, theenvironmental state in Denmark can be elucidated by means such as mappingthe current state and development of energy consumption in Denmark.
Gross energy consumption
0 0 0 0
200 200 200 200
400 400 400 400
600 600 600 600
800 800 800 800
1 0001 0001 0001 000
1 2001 2001 2001 200
1986198619861986 1987198719871987 1988198819881988 1989198919891989 1990199019901990 1991199119911991 1992199219921992 1993199319931993 1994199419941994 1995199519951995 1996199619961996 1997199719971997 1998199819981998 1999199919991999
PJPJPJPJ
Renewable energyRenewable energyRenewable energyRenewable energy
Coal and cokeCoal and cokeCoal and cokeCoal and coke
Natural gasNatural gasNatural gasNatural gas
OilOilOilOil
Own productionOwn productionOwn productionOwn production
Gross energy consumptionGross energy consumptionGross energy consumptionGross energy consumption
Since the early 1980s, Denmark has become steadily less dependent onimported oil and coal - thanks to the increased extraction of crude oil andnatural gas from the North Sea. Since 1997, Denmark has been self-sufficientas regards energy. Renewable energy has played a particularly important partas regards environmental issues, as an increase in the use of such energy cancause a reduction in carbon-dioxide emissions by replacing the use of fossilfuels such as coal and oil. Renewable energy sources include the carbon-dioxidefree types of energy such as wind power and solar power as well as carbon-dioxide neutral fuels such as hay and wood, which absorb carbon dioxide fromthe atmosphere during growth, only to release it again when burnt.
FigureFigureFigureFigure 3 3 3 3

Environment and energy
Gross energy consumption comprises the consumption of oil, natural gas, coal,and renewable energy. When calculating gross energy consumption,adjustments are made to take into account imports and exports of electricity.Gross energy consumption has shown an increase in the consumption of na-tural gas and renewable energy and a corresponding decrease in coalconsumption.
4. 4. 4. 4. AgricultureAgricultureAgricultureAgriculture
Use of fertiliserUse of fertiliserUse of fertiliserUse of fertiliserssssAgricultural production of animal and vegetable products involves the use ofmanure and fertilisers. This causes large quantities of nitrogen and smallquantities of phosphorus to be discharged into the soil. Some nitrogen andphosphorus is not received by plants and as a consequence is leached from thesoil, leading to a discharge of these substances into the ocean via thewatercourses. The adverse effects include undesirable algae growth, resultingin an undesirable environmental state.
The Aquatic Environment Action Plan II constitutes a response to this state.The leaching of nitrogen is to be reduced by measures such as extendingwetlands, organic farming, and sowing crops after harvesting to absorbnitrogen from the soil. Another measure concerns stricter "harmonyrequirements", i.e. stricter regulations to ensure greater balance between theamount of manure produced and the corresponding land farmed at individualfarms.
The proportion of organic farmland has increased significantly during recentyears. For example, the amount of land used for organic farming doubled from1994 to 1995 and again from 1997 to 1998. The amount of land used fororganic farming increased by 37 per cent from 1998 to 1999 and now covers60,232 hectares. Thus, organic farming accounted for 2.3 per cent of allDanish farmland in 1999.
Total Total Total Total areal extent of organic farmareal extent of organic farmareal extent of organic farmareal extent of organic farmssss
0000
20202020
40404040
60606060
80808080
100100100100
120120120120
140140140140
160160160160
1990199019901990 1991199119911991 1992199219921992 1993199319931993 1994199419941994 1995199519951995 1996199619961996 1997199719971997 1998199819981998 1999199919991999
Non-organic landNon-organic landNon-organic landNon-organic land
Land being convertedLand being convertedLand being convertedLand being converted
Organic farmlandOrganic farmlandOrganic farmlandOrganic farmland
Thousand hectaresThousand hectaresThousand hectaresThousand hectares
Source: the Plant Directorate. The areal extent includes forests.
FigureFigureFigureFigure 4 4 4 4NitrogenNitrogenNitrogenNitrogen i i i in manure andn manure andn manure andn manure andfertilisersfertilisersfertilisersfertilisers
200200200200
250250250250
300300300300
350350350350
400400400400
450450450450
90909090 92929292 94949494 96969696 98989898
FertilisersFertilisersFertilisersFertilisers
ManureManureManureManure
Thousand tonsThousand tonsThousand tonsThousand tons
FigureFigureFigureFigure 5 5 5 5

Environment and energy
PPPPesticidesesticidesesticidesesticidesPesticides are chemical products which are mainly used within agriculture tocombat weeds, fungi, and insects. Effective control of pests, weeds, and fungiin fields has had an indirect effect on the number of animals which feed oninsects. The effect might be fatal or entail a reduction in the reproductiveabilities of the relevant animals. Such harmful pressure on the environmententails a reduction in global biodiversity.
Pesticide sales to agriculturePesticide sales to agriculturePesticide sales to agriculturePesticide sales to agriculture
0 0 0 0
1 0001 0001 0001 000
2 0002 0002 0002 000
3 0003 0003 0003 000
4 0004 0004 0004 000
5 0005 0005 0005 000
6 0006 0006 0006 000
1989198919891989 1990199019901990 1991199119911991 1992199219921992 1993199319931993 1994199419941994 1995199519951995 1996199619961996 1997199719971997 1998199819981998 1999199919991999
InsecticidesInsecticidesInsecticidesInsecticides
FungicidesFungicidesFungicidesFungicides
Growth regulatorsGrowth regulatorsGrowth regulatorsGrowth regulators
HerbicidesHerbicidesHerbicidesHerbicides
Tons virksomt stofTons virksomt stofTons virksomt stofTons virksomt stof
Source: the Danish Environmental Protection Agency
Pesticides are divided into products which protect crops against weeds,herbicides, against fungus infection, fungicides, and against insects,insecticides. There are also products which shorten crops, growth regulators.
5. 5. 5. 5. Waste waterWaste waterWaste waterWaste waterEmissions ofEmissions ofEmissions ofEmissions of nitrogennitrogennitrogennitrogen and organic substancesand organic substancesand organic substancesand organic substancesThe majority of all buildings in Denmark are connected to sewers, and mostwaste water passes through municipal sewage-treatment plants before beingdischarged into lakes, watercourses, or the ocean.
Discharges from sewageDischarges from sewageDischarges from sewageDischarges from sewage----treatment plantstreatment plantstreatment plantstreatment plants
0000
5555
10101010
15151515
20202020
89898989 92929292 93939393 94949494 95959595 96969696 97979797 98989898
Nitrogen 1,000 t/yrNitrogen 1,000 t/yrNitrogen 1,000 t/yrNitrogen 1,000 t/yr
0000
10101010
20202020
30303030
40404040
89898989 92929292 93939393 94949494 95959595 96969696 97979797 98989898
Organic substances (B15) 1,000 t/yrOrganic substances (B15) 1,000 t/yrOrganic substances (B15) 1,000 t/yrOrganic substances (B15) 1,000 t/yr
0000
1111
2222
3333
4444
5555
89898989 92929292 93939393 94949494 95959595 96969696 97979797 98989898
Phosphorus 1,000 t/yrPhosphorus 1,000 t/yrPhosphorus 1,000 t/yrPhosphorus 1,000 t/yr
Source: the Danish Environmental Protection Agency
Discharges of nitrogen and organic substances from sewage-treatment plantsincreased from 1997 to 1998, whereas the discharges of phosphorus havefallen slightly. This development is due in part to the high rainfall in 1998.
Figur 6Figur 6Figur 6Figur 6
FigureFigureFigureFigure 7 7 7 7

Environment and energy
When rainfall goes up, water quantities in sewage-treatment plants also rise.This entails a reduction in the effectiveness of the measures to removenitrogen and organic substances, whereas the removal of phosphorus is notaffected.
Almost 90 per cent all Danish residential properties are connected to amunicipal sewerage system. In the sewers, waste water from households ismixed with industrial effluents and water from the special drains for rainwaterfrom roofs, roads, etc. A few enterprises have their own discharge pointsbecause of their distant location.
6. 6. 6. 6. WasteWasteWasteWasteWasteWasteWasteWasteApproximately 12.4 million tons of waste were produced in Denmark in 1998.This constituted a 3.4 per cent reduction compared to 1997. The amount ofwaste produced in 1997 corresponded to 1996 levels.
TotalTotalTotalTotal wastewastewastewaste quantities in quantities in quantities in quantities in DenmarkDenmarkDenmarkDenmark
0000
2222
4444
6666
8888
10101010
12121212
14141414
1994199419941994 1995199519951995 1996199619961996 1997199719971997 1998199819981998
Special managementSpecial managementSpecial managementSpecial management
LandfillingLandfillingLandfillingLandfilling
IncinerationIncinerationIncinerationIncineration
RecyclingRecyclingRecyclingRecycling
Million tonsMillion tonsMillion tonsMillion tons
Note: Improved data input is one of the causes of the significant increase up until 1996.
Source: the Danish Environmental Protection Agency
Of the 1998 figure of 12.4 million tons waste referred to above, approximately2.8 million tons were household waste. This corresponds to approximately 500kg per citizen. A large proportion of all household waste is collected ordeposited as general domestic waste. Other household waste is collected ordeposited as separated waste: paper waste, glass and glass containers, metal,organic waste, garden waste, bulky waste, and environmentally harmfulwaste.
As a response to the large quantities of waste, pilot projects have been initiatedfor recycling schemes for specific types of waste. Waste separation is aprerequisite for recycling and reusing waste. In 1998, 59 per cent of all wastewas recycled. This constitutes a slight reduction in comparison to 1997 levels;this is mainly due to the fact that less sludge from sewage-treatment plantswas used to fertilise farmland in 1998.
FigureFigureFigureFigure 8 8 8 8

Environment and energy
7. 7. 7. 7. Public-sector Public-sector Public-sector Public-sector rerereressssponseponseponseponse
Environmental Environmental Environmental Environmental taxes and energy taxestaxes and energy taxestaxes and energy taxestaxes and energy taxesDenmark's environmental policy involves an increasing use of environmentaltaxes and energy taxes. In 1998, the total revenue generated from these taxeswas DKK 31.7 billion, corresponding to 8.5 per cent of total revenues fromtaxes and duties. In 1998, revenues from energy taxes accounted for 72 percent all revenue from environmental taxes and energy taxes. In 1998, therevenues generated by environmental taxes came to DKK 8.9 billion. Revenuesfrom CO2 taxes, waste taxes, and water taxes constituted 78 per cent of thisfigure.
Environmental taxes and energy taxesEnvironmental taxes and energy taxesEnvironmental taxes and energy taxesEnvironmental taxes and energy taxes
0000
10101010
20202020
30303030
40404040
1995199519951995 1996199619961996 1997199719971997 1998199819981998 1999*1999*1999*1999*
Energy taxesEnergy taxesEnergy taxesEnergy taxes
Environmental taxesEnvironmental taxesEnvironmental taxesEnvironmental taxes
TotalTotalTotalTotal
DKK billionDKK billionDKK billionDKK billion
Note.: the statistics for 1999 are budget figures.
8. International8. International8. International8. International comparisons comparisons comparisons comparisons
Contaminant emissionsContaminant emissionsContaminant emissionsContaminant emissionsDenmark's rate of emission and discharge of various contaminants per capita isslightly higher that those found in the countries usually used for comparisons.In Denmark, carbon-dioxide emissions from energy conversion constitutes arelatively greater proportion of total carbon-dioxide emissions. This is partlydue to the composition of fuels used, where coal constitutes a relatively largeproportion.
Transport at world level constitutes a very significant factor as regards thedevelopment of carbon-dioxide emissions. The developed countries dominatein this connection, as the OECD countries are behind 70 per cent of the world'stotal carbon-dioxide emissions from transport.
FigureFigureFigureFigure 9 9 9 9

Statistical Yearbook 2000 Environment and energy
Table 1 Area, population and coastline 2000
Land and inlandwater area
km2
Population Density ofpopulation
Jutland and Islands in the sea(with official names)
Inline waterarea 1959
km2
Coastline1959
kmper km2 Number Area km2
DenmarkDenmarkDenmarkDenmark 43 095.8843 095.8843 095.8843 095.88 5 330 0205 330 0205 330 0205 330 020 123.7123.7123.7123.7 405 405 405 405 43 095.8843 095.8843 095.8843 095.881 700700700700 7 314 7 314 7 314 7 314
RegionsRegionsRegionsRegionsZealand 7 448.28 2 235 839 300.2 97 7 448.282 184 1 735Bornholm 588.53 44 337 75.3 9 588.53 3 141Lolland-Falster 1 795.34 114 688 63.9 45 1 795.343 24 587Funen 3 485.84 471 974 135.4 100 3 485.844 26 1 130The Islands, total 13 317.99 2 866 838 215.3 251 13 317.99 237 3 593Jutland 29 777.89 2 463 182 82.7 154 29 777.891.5 463 3 721
CountiesCountiesCountiesCountiesCopenhagen Municipality 88.25 495 699 5 617.0 2 0.236 3 92Frederiksberg Municipality 8.77 90 327 10 299.5 •••• •••• 0 •Copenhagen County 525.95 613 444 1 166.4 2 111.336 15 121Frederiksborg County 1 347.42 365 306 271.1 14 2.40 80 248Roskilde County 891.44 231 559 259.8 18 0.27 7 154West Zealand County 2 983.77 295 086 98.9 28 49.00 66 608Storstrøm County 3 398.02 259 106 76.3 77 2 049.09 36 1 099Bornholm County 588.53 44 337 75.3 9 588.53 3 141Funen County 3 485.84 471 974 135.4 100 3 485.84 27 1 130North Schleswig County 3 939.12 253 482 64.3 14 450.07 119 5677
Ribe County 3 131.61 224 345 71.6 4 64.83 23 207Vejle County 2 996.64 347 542 116.0 10 17.04 26 264Ringkøbing County 4 853.94 272 857 56.2 23 16.84 80 598Århus County 4 560.73 637 122 139.7 40 148.73 77 635Viborg County 4 122.48 233 681 56.7 15 392.49 90 646North Jutland County 6 173.37 494 153 80.0 46 127.96 48 804
Faroe IslandsFaroe IslandsFaroe IslandsFaroe Islands 1 398.851 398.851 398.851 398.85 45 75145 75145 75145 751 32.732.732.732.7 17 17 17 178 1 398.851 398.851 398.851 398.85 . . . 1 1171 1171 1171 1179
GreenlandGreenlandGreenlandGreenland 410 449.00410 449.00410 449.00410 449.0010 56 12456 12456 12456 124 0.10.10.10.1 . . . . . . . . . . . .
Note 1. The most southern point in Denmark is Gedserodde on Falster, 11°58’15” east, 54°33’35” north, the most northerly point is near Skagen 10°36’11” east,57°45’07” north, the most westerly point is Blåvandshuk 08°04’22” east, 55°33’36” north, and the most easterly point is Christiansø (Østerskær), 15°11’55” east,55°19’17” north. European Datum, 1950.Note 2. The basic measurements were carried out by the Geodætisk Institut between 1953-1959 on the topographical maps current at that time (1:20,000), cf. Dan-marks Areal (Statistiske Meddelelser 1968:4). Areas were transferred by Statistics Denmark in planimetric measurements to the current 4 cm maps (1:25.000).Note 3. Areas in column 1 include all areas within the contours of the country. Fjords and inlets which have free passage to the sea (e.g. Ringkøbing fjord), are notincluded in the figures.Note 4. The figures in columns 6 and 7 are from the 1959 planimetric measurements and they have not been transferred to more modern maps. In column 6, 4 lakesand 2 closed fjords, each of over 100 hectares (10 km2) are included: these are Arresø, Esrumsø, Mossø, Tissø, Saltbæk Vig and Stadil Fjord. There are 53 namedislands in the Danish lakes with a total area of 1.97 km2. The coastline is divided into counties according to the local authority allocation of 1 April 1970.Note 5. Named lakes, water courses, etc. in parishes which were divided into municipalities, each in its own county, on 1 April 1970 are included in that county withthe largest part of the parish.1 Including the Jutland peninsular of 23,874.21 km2. 2 Including the island of Zealand with 7,031.30 km2. 3 Including the islands of Lolland, 1,242.86 km2 and Falster513.76 km2. 4 Of this, the island of Funen accounts for 2,984.55 km2. 5 Including Vendsyssel-Thy, 4,685.72 km2. 6 All of the island of Amager is included under Copen-hagen Municipality with 95.34 km2. 7 The border with Germany was measured as 67.7 km. In length. 8 Inhabited islands. 9 Measured in 1955. 10 Only the part ofGreenland free of ice is included. The total area of Greenland is 2,166,086 km2, of which 85 pct. is covered by inland ice.
Source: National Survey and Cadastra.
Statistical Yearbook 2000 Environment and energy
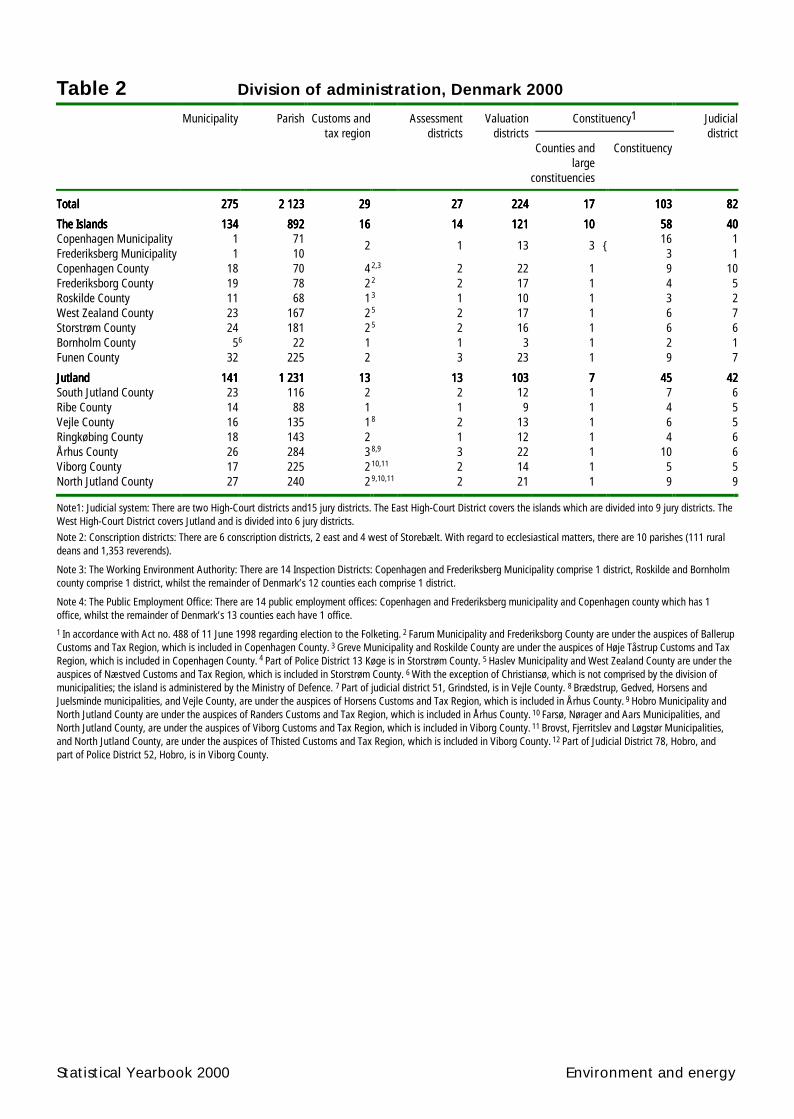
Table 2 Division of administration, Denmark 2000
Municipality Parish Customs andtax region
Assessmentdistricts
Valuationdistricts
Constituency1 Judicialdistrict
Counties andlarge
constituencies
Constituency
TotalTotalTotalTotal 275 275 275 275 2 1232 1232 1232 123 29292929 27 27 27 27 224 224 224 224 17 17 17 17 103 103 103 103 82 82 82 82
The IslandsThe IslandsThe IslandsThe Islands 134 134 134 134 892 892 892 892 16 16 16 16 14 14 14 14 121 121 121 121 10 10 10 10 58 58 58 58 40 40 40 40Copenhagen MunicipalityFrederiksberg Municipality
11
7110
2 1 13 3 { 163
11
Copenhagen County 18 70 42,3 2 22 1 9 10Frederiksborg County 19 78 22 2 17 1 4 5Roskilde County 11 68 13 1 10 1 3 2West Zealand County 23 167 25 2 17 1 6 7Storstrøm County 24 181 25 2 16 1 6 6Bornholm County 56 22 1 1 3 1 2 1Funen County 32 225 2 3 23 1 9 7
JutlandJutlandJutlandJutland 141 141 141 141 1 2311 2311 2311 231 13 13 13 13 13 13 13 13 103 103 103 103 7 7 7 7 45 45 45 45 42 42 42 42South Jutland County 23 116 2 2 12 1 7 6Ribe County 14 88 1 1 9 1 4 5Vejle County 16 135 18 2 13 1 6 5Ringkøbing County 18 143 2 1 12 1 4 6Århus County 26 284 38,9 3 22 1 10 6Viborg County 17 225 210,11 2 14 1 5 5North Jutland County 27 240 29,10,11 2 21 1 9 9
Note1: Judicial system: There are two High-Court districts and15 jury districts. The East High-Court District covers the islands which are divided into 9 jury districts. TheWest High-Court District covers Jutland and is divided into 6 jury districts.
Note 2: Conscription districts: There are 6 conscription districts, 2 east and 4 west of Storebælt. With regard to ecclesiastical matters, there are 10 parishes (111 ruraldeans and 1,353 reverends).
Note 3: The Working Environment Authority: There are 14 Inspection Districts: Copenhagen and Frederiksberg Municipality comprise 1 district, Roskilde and Bornholmcounty comprise 1 district, whilst the remainder of Denmark’s 12 counties each comprise 1 district.
Note 4: The Public Employment Office: There are 14 public employment offices: Copenhagen and Frederiksberg municipality and Copenhagen county which has 1office, whilst the remainder of Denmark’s 13 counties each have 1 office.
1 In accordance with Act no. 488 of 11 June 1998 regarding election to the Folketing. 2 Farum Municipality and Frederiksborg County are under the auspices of BallerupCustoms and Tax Region, which is included in Copenhagen County. 3 Greve Municipality and Roskilde County are under the auspices of Høje Tåstrup Customs and TaxRegion, which is included in Copenhagen County. 4 Part of Police District 13 Køge is in Storstrøm County. 5 Haslev Municipality and West Zealand County are under theauspices of Næstved Customs and Tax Region, which is included in Storstrøm County. 6 With the exception of Christiansø, which is not comprised by the division ofmunicipalities; the island is administered by the Ministry of Defence. 7 Part of judicial district 51, Grindsted, is in Vejle County. 8 Brædstrup, Gedved, Horsens andJuelsminde municipalities, and Vejle County, are under the auspices of Horsens Customs and Tax Region, which is included in Århus County. 9 Hobro Municipality andNorth Jutland County are under the auspices of Randers Customs and Tax Region, which is included in Århus County. 10 Farsø, Nørager and Aars Municipalities, andNorth Jutland County, are under the auspices of Viborg Customs and Tax Region, which is included in Viborg County. 11 Brovst, Fjerritslev and Løgstør Municipalities,and North Jutland County, are under the auspices of Thisted Customs and Tax Region, which is included in Viborg County. 12 Part of Judicial District 78, Hobro, andpart of Police District 52, Hobro, is in Viborg County.

Statistical Yearbook 2000 Environment and energy
Table 3 Area and population. Regions and inhabited islands 1999-2000
Muni-cipa-lity
Areain ha
Population Muni-cipa-lity
Areain ha
Population
code 1999 2000 code 1999 2000
Whole countryWhole countryWhole countryWhole country 4 309 5884 309 5884 309 5884 309 588 5 313 5775 313 5775 313 5775 313 577 5 330 0205 330 0205 330 0205 330 020 Funen and itsFunen and itsFunen and itsFunen and itsislandsislandsislandsislands 348 584348 584348 584348 584 471 732471 732471 732471 732 471 974471 974471 974471 974
Zealand and itsZealand and itsZealand and itsZealand and itsislandsislandsislandsislands 744 828744 828744 828744 828 2 223 8952 223 8952 223 8952 223 895 2 235 8392 235 8392 235 8392 235 839
Funen 298 455 439 229 439 608
431 Avernakø 586 124 115- Zealand 703 130 2 056 488 2 067 606 443 Birkholm 92 9 9331 Agersø 684 263 247 431 Bjørnø 150 36 40- Amager 9 534 153 479 154 207 421 Bågø 623 29 32365 Bogø 1 307 1 066 1 048 479 Drejø 426 78 81373 Enø 340 292 283 445 Fænø 394 3 3229 Eskilsø 139 4 1 479 Hjortø 90 16 17365 Farø 93 4 5 - Langeland 28 384 14 511 14 412373 Gavnø 575 28 26 431 Lyø 605 134 132331 Glænø 559 62 60 487 Siø 131 26 26221 Hesselø 71 2 2 479 Skarø 197 20 27361 Langø 127 6 8 431 Store Svelmø 27 1 1365 Lindholm 7 4 4 475 Strynø 488 213 208397 Masnedø 168 132 140 479 Thurø 753 3 627 3 682365 Møn 21 775 10 406 10 542 447 Tornø 21 1 1301 Nekselø 223 26 22 421 Torø 64 2 2365 Nyord 499 50 47 479 Tåsinge 6 979 6 200 6 184331 Omø 452 168 159 423 Æbelø 232 1 2315 Orø 1 502 1 017 1 007 - Ærø 8 807 7 472 7 392185 Saltholm 1 599 8 8 80 named islands 1 080 • •301 Sejerø 1 237 365 392101 Slotsholmen 21 22 21361 Tærø 175 3 4 JutlandJutlandJutlandJutland 2 977 7892 977 7892 977 7892 977 789 2 458 592 2 458 592 2 458 592 2 458 592 2 463 1822 463 1822 463 1822 463 182
75 named islands 611 •••• •••• - Jutland peninsular 2 387 421 2 062 521 2 067 637- Vendsyssel-Thy 468 572 307 955 307 745773 Agerø 385 33 32727 Alrø 751 179 177
Lolland, FalsterLolland, FalsterLolland, FalsterLolland, Falster - Als 31 222 51 620 51 526and their islandsand their islandsand their islandsand their islands 179 534179 534179 534179 534 114 829114 829114 829114 829 114 688114 688114 688114 688 707 Anholt 2 237 163 164
- Lolland 124 286 70 747 70 640 545 Barsø 266 19 26- Falster 51 376 43 199 43 171 851 Egholm 600 51 50363 Askø 282 62 55 615 Endelave 1 308 166 163381 Barneholm 10 2 2 563 Fanø 5 578 3 267 3 214379 Fejø 1 600 603 606 783 Fur 2 229 966 949379 Femø 1 138 184 182 813 Hirsholm 17 4 4363 Lilleø 86 17 18 619 Hjarnø 321 120 110379 Skalø 106 11 11 675 Jegindø 791 551 544379 Vejlø 37 2 2 529 Kalvø 18 15 12379 Vejrø 157 2 1 827 Livø 331 8 8
35 named islands 456 •••• •••• 825 Læsø 10 122 2 282 2 293571 Mandø 763 75 69773 Mors 36 331 23 001 22 957531 Rømø 12 886 788 771
Bornholm and itsBornholm and itsBornholm and itsBornholm and its 741 Samsø 11 206 4 318 4 233islandsislandsislandsislands 58 85358 85358 85358 853 44 52944 52944 52944 529 44 33744 33744 33744 337 503 Store Okseø 11 3 3
- Bornholm 58 813 44 426 44 238 727 Tunø 352 92 92411411
Christiansø1
Frederiksø1
254} 103 99
671515
VenøÅrø
646566
198197
188215
411 6 named islands 11 • • 129 named islands 2 859 • •

Statistical Yearbook 2000 Environment and energy
Note: Als includes the following municipalities: 501, 523, 535 plus 24,441 people in Sønderborg Municipality. - Amager includes the following municipalities: 155 and185 (excl. Saltholm) plus 102,060 people in Copenhagen Municipality. - Bornholm includes the following municipalities: 401, 403, 405, 407 and 409. - Falster includes
the following municipalities: 369 (excl. Toreby parish), 375, 391 and 395. - Langeland includes the following municipalities: 475 (excl. the island of Strynø), 481 and 487 (excl. the island of Siø). - Lolland includes the following municipalities: 355, 359, 363 (excl. the islands of Askø and Lilleø), Toreby parish in Nykøbing F.Municipality, 367, 371, 379 (excl. the islands of Fejø, Femø, Skalø, Vejlø and Vejrø, 381 (excl. Barneholm), 383 and 387.- Vendsyssel-Thy includes the followingmunicipalities: 675 (excl. the island of Jegindø), 765, 785, 787, 803, 805, 807, 811, 813 (excl. Hirsholm), 817, 819, 821, 829, 835, 839, 841, 847, 849 plus 37,420people in Aalborg Municipality, Aggersborg parish 555 people in Løgstør Municipality. - Ærø includes municipality 443 (excl. the island of Birkholm) and municipality493.
1 Not included in the division of municipalities, administered by the Ministry of Defence.

Statistical Yearbook 2000 Environment and Energy
Table 4 Area analysed by use 1965-1995
1965 1982 1995 1995
km2 pct.
Total areaTotal areaTotal areaTotal area 43 07043 07043 07043 070 43 08043 08043 08043 080 43 09543 09543 09543 095 100100100100
Urban areas, residential and industrial1 3 890 5 350 8 185 19Hedgerows, ditches, track roads, etc. 1 370 1 130 . . . . . .Cultivated land, market gardens and orchards 26 930 26 510 27 260 63Forests and plantations, incl. agricultural forests 4 720 5 010 4 450 10Meadows, marshland, etc. 3 250 2 460 1 170 3Mooreland, sand dunes and bogs 2 230 1 980 1 380 3Lakes and streams 680 640 650 2
Note. Figures are partly estimates and include some uncertainty.1 Urban areas, residential and industrial includes summer dwelling areas, roads, and spread residences.

Statistical Yearbook 2000 Environment and energy
Table 5 Preserved areas by date of preservation 1999
Preservedareasbeforeand incl.1990
Pre-served
in 1991-1995
Pre-served
in 1996
Pre-served
in 1997
Pre-served
in 1998
Pre-served
in 1999
Preservedareastotalup to1999
Preservedareas as
pct. ofthe total
area
km2
All DenmarkAll DenmarkAll DenmarkAll Denmark 1 8461 8461 8461 846 97979797 30303030 6666 3333 2222 1 9841 9841 9841 984 4.64.64.64.6
Copenhagen region1 285 14 11 4 1 0 315315315315 11.011.011.011.0Divided after 1997:- Copenhagen County . . . . . . . . . . . . - - ---- . . .. . .. . .. . .- Frederiksborg County . . . . . . . . . . . . 1 -0 0000 . . .. . .. . .. . .- Roskilde County . . . . . . . . . . . . 0 1 1111 . . .. . .. . .. . .West Zealand County 121 21 - 0 1 - 143143143143 4.84.84.84.8Storstrøm County 108 16 - - - 0 124124124124 3.73.73.73.7Bornholm County 36 - - 2 0 0 38383838 6.46.46.46.4Funen County 54 11 - - - - 65656565 1.91.91.91.9South Jutland County 92 4 0 - - 2 98989898 2.52.52.52.5Ribe County 111 2 - - - - 112112112112 3.63.63.63.6Vejle County 131 1 15 - - - 146146146146 4.94.94.94.9Ringkøbing County 181 1 0 0 0 - 183183183183 3.83.83.83.8Århus County 204 12 0 - - - 217217217217 4.84.84.84.8Viborg County 254 11 - - - - 265265265265 6.46.46.46.4North Jutland County 271 5 3 - 1 - 279279279279 4.54.54.54.5
Territorial watersTerritorial watersTerritorial watersTerritorial waters 1 3811 3811 3811 381 ---- 840840840840 105105105105 37373737 ---- 2 4522 4522 4522 452 . . .. . .. . .. . .
Note. Figures cover areas where preservation has been determined by the Fredningsnævn (preservation board) or theOverfredningsnævnet (head preservation board) (for territorial waters by statutory order).1 Up to and including 1997 the Copenhagen region included Copenhagen, Frederiksborg and Roskilde counties, as well asCopenhagen and Frederiksberg municipalities.
Source: National Forest and Nature Agency.

Statistical Yearbook 2000 Environment and Energy
Table 6 Denmark's largest lakes 1953-1989
Lake’s name Location 1953-59 1980-89 Lake’s name Location 1953-59 1980-89
km2 km2
Arresø Zealand 40.6 39.5 Skanderborg Lake East Jutland 8.6 8.0Stadil Fjord1 West Jutland 18.8 18.5 Julsø and Borre Lake East Jutland 7.6 7.8Esrum Lake Zealand 17.4 17.4 Tystrup-Bavelse Lake Zealand 7.5 7.4Mossø East Jutland 16.9 16.6 Sebber Sund1 North Jutland 6.0 . . .Saltbæk Vig1 Zealand 14.2 15.6 Tange Lake West Jutland 5.8 5.5Tissø Zealand 12.9 12.7 Lund Fjord1 North Jutland 6.8 5.4Furesø Zealand 9.4 9.3 V. Stadil Fjord1 West Jutland 5.6 4.0Søndersø Lolland 9.0 8.5
Note. 1953–59: Measurements were taken in the period 1953–59 on the basis of the Geodætisk Institut's scale 1:20000. The result s therefore refer to the year themaps were published, but with changes in later revisions. The year of publication spans from about 1900 to the 1950s. 1980–89: Areas are calculated on the basis ofthe latest edition of the Geodætisk Institut's 4 cm maps up to 1988–89. The measurement basis spans from revised older maps, wh ere the degree of revision is un-known, to modern photogrametric maps. Named lakes are lakes which are named on maps.1 Area of brackish water.
Source: The Ministry of Food, Agriculture and Fisheries, the Statens Planteavlsforsøg (a plant-growing research establishment), Afdeling for Arealdata og Kortlægning(area-data and mapping department).

Statistical Yearbook 2000 Environment and energy
Table 7 Meteorological conditions. Temperature and degree-days 1999
Jan. Feb. Mar. Apr. May Jun. Jul. Aug. Sep. Oct. Nov. Dec. All year
Maximum temperatureMaximum temperatureMaximum temperatureMaximum temperature1874-1999 Temp. 12.0 15.8 22.2 28.6 32.8 35.5 35.3 36.4 32.3 24.1 18.5 14.5 36.4Measured during the years 1999 1990 1990 1993 1892 1947 1941 1975 1906 1978 1968 1953 19751999 12.0 10.0 17.3 19.6 28.4 25.7 30.3 31.5 28.4 18.4 15.4 10.8 31.5
Average daily temperAverage daily temperAverage daily temperAverage daily temperaaaatureturetureture1
Normal (1961-1990) 2.0 2.2 4.9 9.6 15.0 18.7 19.8 20.0 16.4 12.1 7.0 3.7 10.91999 4.3 3.7 6.1 11.5 14.9 17.3 21.6 21.1 20.2 12.2 8.1 4.4 12.1
Mean temperatureMean temperatureMean temperatureMean temperatureNormal (1961-1990) - - 2.1 5.7 10.8 14.3 15.6 15.7 12.7 9.1 4.7 1.6 7.71999 2.3 1.0 3.7 7.7 10.8 13.6 17.3 16.6 16.2 9.4 5.5 2.3 8.9
Average nightly temperAverage nightly temperAverage nightly temperAverage nightly temperaaaa----tureturetureture2
Normal (1961-1990) - 2.9 - 2.8 - 0.8 2.1 6.5 9.9 11.5 11.3 9.1 6.1 2.3 - 0.7 4.31999 -0.1 -2.1 1.3 4.0 6.6 9.6 12.8 12.1 12.7 6.5 2.6 -0.4 5.5
Minimum temperatureMinimum temperatureMinimum temperatureMinimum temperature1874-1999 Temp. - 31.2 - 29.0 - 27.0 - 19.0 - 8.0 - 3.5 - 0.9 - 2.0 - 5.6 - 11.9 - 21.3 - 25.6 - 31.2Measured during the years 1982 1942 1888 1922 1900 1936 1903 1885 1886 1880 1973 1981 19821999 -12.6 -18.5 -8.6 -4.6 -3.6 1.0 5.0 3.7 1.2 -3.0 -7.2 -13.3 -18.5
Degree-daysDegree-daysDegree-daysDegree-daysNormal (1971-1990) 516 4733 452 339 186 . . . . . . . . . 136 251 361 461 3 1751999 455 448 412 280 193 . . . . . . . . . 35 237 343 453 2 855
Note. Daily measurements at a number of stations throughout the country - as a rule 40 stations - have been used as the basis for the monthly national averages in thetable. Annual values may take account of decimals which are not included in the monthly averages. Normals are averages for a number of years, as a rule 30, and theystate the expected figures for a day in January, February, etc.1 The average day temperature/night temperature is calculated from the highest/lowest daily temperatures at 30 stations. Mean temperature is calculated from 3 or 8daily observations. Degree days are used as a measurement for heating needs in the heating season (1 September – 31 May). Degre e days are shade-temperature daysand they are stated as averages for the whole country. The degree-days figure is the sum of the degree days for individual months. The size of the degree-days figureis converted to a percentage of the normal to give consumption in the individual heating season. 2 A maximum/minimum thermometer registers the highest/lowesttemperature in a day from all the about 150 stations. Absolute maximum/minimum in the years 1874-1999 are found by extracting the highest/lowest temperaturefrom the about 150 stationer (approx. 100 before 1960). Measured during the most recent year the temperature occurred. 3 28 days, 506 when there are 29 days inFebruary.
Source: Danish Meteorological Institute.

Statistical Yearbook 2000 Environment and energy
Table 8 Meteorological conditions. Precipitation, sunshine hours, etc. 1999
Jan. Feb. Mar. Apr. May Jun. Jul. Aug. Sep. Oct. Nov. Dec. Yeartotal
Precipitation in mm
Normal (1961-1990) 57 38 46 41 48 55 66 67 73 76 79 66 712All Denmark 78 54 85 39 45 121 56 87 86 86 33 137 905Cph Municipality,Frb.Municipality, Cph.County, Fr.borg County, andRoskilde County
61 40 57 40 49 95 26 127 36 44 18 108 701
West Zealand County 63 40 63 28 44 120 51 88 35 56 10 99 697Storstrøm County 69 38 70 24 51 91 53 79 29 52 19 105 680Bornholm County 55 45 51 60 51 72 54 82 45 59 54 127 755Funen County 77 48 85 27 48 95 56 88 46 55 19 117 761South Jutland County 91 74 105 36 41 108 56 88 108 101 40 172 1 020Ribe County 80 79 100 39 29 111 65 68 161 135 33 169 1 069Vejle County 91 54 96 34 41 119 55 78 102 93 31 153 947Ringkøbing County 81 71 87 51 32 137 64 74 112 119 56 174 1 058Aarhus County 55 44 85 38 48 140 49 109 74 74 23 104 843Viborg County 81 56 82 50 48 130 64 76 103 85 53 152 980North Jutland County 77 41 87 47 55 149 62 104 78 77 30 117 924
per cent
Relative humidity, all DenmarkRelative humidity, all DenmarkRelative humidity, all DenmarkRelative humidity, all Denmark1
Normal (1961-1990) 91 90 87 80 75 77 79 79 83 87 89 90 841999 92 90 90 84 80 85 81 82 86 88 90 92 87Cloud cover, all DenmarkCloud cover, all DenmarkCloud cover, all DenmarkCloud cover, all Denmark2
Normal (1961-1990) 79 73 69 63 60 59 62 59 63 70 74 77 671999 79 66 79 60 55 63 54 55 54 66 72 73 65
hours
Bright sunshine, all DeBright sunshine, all DeBright sunshine, all DeBright sunshine, all Dennnn----markmarkmarkmark3
Normal (1961-1990) 41 71 117 178 240 249 236 224 152 99 57 39 1 7011999 41 91 77 195 277 246 306 259 189 126 57 40 1 905
HPa
Mean air pressure (sea level)Mean air pressure (sea level)Mean air pressure (sea level)Mean air pressure (sea level)Aalborg 1007.7 1004.3 1010.1 1010.8 1016.6 1014.8 1015.2 1011.6 1011.4 1013.0 1016.0 998.5 1010.8Copenhagen Airport 1010.4 1005.9 1011.5 1011.9 1017.6 1016.4 1016.2 1012.1 1013.3 1014.6 1017.9 1001.3 1012.4
per cent
Wind incidenceWind incidenceWind incidenceWind incidence4 100 100 100 100 100 100 100 100 100 100 100 100 100North 7 8 4 9 9 5 8 6 3 7 9 10 7North-East 9 3 9 9 5 2 8 4 2 8 13 4 6East 9 2 14 13 23 7 12 15 24 13 4 3 12South-East 8 3 19 11 12 12 8 12 23 12 8 4 11South 21 11 23 11 8 17 9 9 20 10 23 20 15South-West 28 25 12 18 19 19 16 12 21 17 22 25 20West 13 31 12 19 15 24 26 24 6 25 16 25 20North-West 5 18 6 10 10 14 13 17 2 8 6 9 10Calm 1 < 1 1 < 1 1 1 < < 2 1 1
m/s
Mean wind forceMean wind forceMean wind forceMean wind force5
1999 6.2 6.0 5.5 5.8 5.1 4.7 4.4 4.4 5.1 6.1 5.8 7.0 5.5
Note. Precipitation is stated as the height the surface of water would rise if it could not run away or evaporate. The figures stated are national averages of approxi-mately 100 stations throughout the country. Totals for months and years are calculated taking account of decimals. Account is taken of area for the individual counties.See also note to the table on temperature and degree days. 'All Denmark' does not include Bornholm.Air pressure is the weight of a column of air with a cross-sectional area of 1 cm2 which rests on a horizontal plane. It is measured in hPa = hectopascals = millibar.1 Humidity states, in percent, the relationship between the actual water vapour in the air and the amount which would be necessary to saturate the air at the giventemperature. 2 Cloud cover is the percentage of the sky which is covered by clouds. 3 Sunshine hours (bright sunshine, i.e. 200 watt pr. m2) is registered throughout theday on a sunshine recorder. 4 Wind incidence from 10 coastal stations states the percentage distribution of the daily observations in the 8 wind directions and nowind.< means less than 0.5 %. 5 Mean wind force m/s from 10 coastal stations.
Source: Danish Meteorological Institute.

Statistical Yearbook 2000 Environment and energy
Table 9 Meteorological conditions. Daily information 1999
Jan. Feb. Mar. Apr. May Jun. Jul. Aug. Sep. Oct. Nov. Dec. Yeartotal
Number of days within a monthNumber of days within a monthNumber of days within a monthNumber of days within a monthall Denmarkall Denmarkall Denmarkall Denmark
Summer daysSummer daysSummer daysSummer days (max. >25°)Normal (1961-1990) - - - - 0.2 1.9 2.6 2.3 0.1 - - - 7.21999 - - - - 0.4 - 5.0 5.7 1.6 - - - 12.8
Ice days Ice days Ice days Ice days (max. <0°)Normal (1961-1990) 8.6 7.5 2.2 0.1 - - - - - - 0.6 4.0 23.01999 5.1 3.4 < - - - - - - - - 1.3 9.9
Frost days Frost days Frost days Frost days (min. <0°)Normal (1961-1990) 19.0 19.0 15.0 6.6 0.7 < - - 0.2 1.8 7.3 15.0 84.01999 11.8 16.1 7.0 2.1 0.5 - - - - 1.4 7.1 14.0 59.8
Days with fogDays with fogDays with fogDays with fogNormal (1961-1990) 10.0 9.3 9.2 7.5 5.1 2.6 2.6 3.2 4.3 7.0 5.7 7.0 74.01999 3.8 8.4 8.1 5.3 4.0 4.1 4.5 4.8 5.2 4.0 6.6 5.3 64.2
Precipitation days Precipitation days Precipitation days Precipitation days (R ³ 0.1 mm)Normal (1961-1990) 17 13 14 12 12 12 13 13 15 16 18 17 1711999 21.3 18.1 20.6 11.5 11.6 17.3 12.0 13.5 12.4 19.6 13.4 24.6 196.0
Heavy precipitation days Heavy precipitation days Heavy precipitation days Heavy precipitation days (R ³ 10mm)Normal (1961-1990) 1.1 0.5 0.7 0.7 1.1 1.5 1.8 1.8 2.0 2.2 2.0 1.6 17.01999 1.0 0.2 2.1 0.8 1.2 4.2 1.4 3.2 2.6 1.9 0.4 4.0 22.9
Days with snowDays with snowDays with snowDays with snowNormal (1961-1990) 7.6 6.4 5.3 2.6 0.2 - - - - 0.1 2.3 5.8 30.01999 4.5 6.8 3.8 0.9 - - - - - < 2.0 5.9 23.8
Windy days in pct.Windy days in pct.Windy days in pct.Windy days in pct.1999 7 10 4 6 2 2 1 2 2 8 9 15 6
Days with thunderDays with thunderDays with thunderDays with thunderNormal (1961-1990) 0.1 0.1 0.1 0.2 1.3 2.0 2.3 2.2 1.3 0.6 0.3 0.1 11.01999 < 0.5 - 0.2 0.8 2.3 2.8 3.1 2.9 1.0 0.2 0.5 14.3
Note. Summer days are days where the highest temperature is over 25° Celsius. Ice days are days where the highest temperature is under 0° Celsius. Frost days aredays where the lowest temperature is under 0° Celsius. Days with fog are days where fog is observed around the station. Precipitation days are days with precipitationof 0.1 mm or more. Heavy precipitation days are days with precipitation of 10 mm or more. Days with snow are days with snowfall of 0.1 mm or more measured aftermelting. Windy days have wind of more than 10.8 m/sec. Registered at coastal stations. Days with thunder are a national average of thunder days from individualstations. When the number of days is less than 10, a tenth is included.< means less than 0.1 but greater than 0.0. See also the note to the table on temperature and degree days.
Source: Danish Meteorological Institute.

Statistical Yearbook 2000 Environment and energy
Table 10 Air pollution in cities 1990-1999
1990 1991 1992 1993 1994 1995 1996 1997 1998 1999
µg/m3 sulphur dioxide
Copenhagen 19.3 18.1 14.1 11.5 8.7 9.0 7.0 4.6 4.3 4.0Ålborg 11.5 11.8 7.1 6.6 4.6 4.0 5.0 2.7 2.7 1.8Odense 9.1 11.0 6.9 6.5 4.3 3.8 4.9 2.6 2.1 1.7
µg/m3 nitrogen dioxide
Copenhagen 53.4 51.7 51.7 43.4 46.7 53.0 44.7 42.6 42.9 46.8Ålborg 36.3 40.4 37.8 38.0 36.1 37.4 37.6 33.6 34.2 40.1Odense 35.2 42.3 36.4 36.6 35.8 34.4 34.0 35.5 31.6 32.9
ng/m3 lead
Copenhagen 250.1 236.9 198.6 119.1 37.1 26.0 24.8 16.6 16.4 16.6Ålborg 292.4 262.7 212.0 140.1 44.7 31.4 18.6 13.9 13.0 12.5Odense 148.5 168.4 130.4 96.5 31.9 22.3 22.0 14.9 14.5 13.6
µg/m3 particulates
Copenhagen 73.6 77.4 73.6 69.6 64.7 61.1 65.3 46.8 45.5 47.2Ålborg 70.4 71.4 59.1 63.5 61.1 55.7 68.9 53.7 50.7 51.3Odense 61.2 66.6 59.8 62.1 55.6 53.2 62.7 61.4 45.6 46.6
Note. µg/ m3 corresponds to a millionth of a gram per cubic meter, while ng/m3 corresponds to a billionth of a gram per cubic meter.
Source: Danish National Environmental Research Institute.

Statistical Yearbook 1999 Environment and energy
Table 11 Ozone layer over Denmark 1980-1999
Jan. Feb. Mar. Apr. May Jun. Jul. Aug. Sept. Oct. Nov. Dec. All year
DU1
1980 354 357 396 417 403 376 367 327 300 308 302 323 3531985 375 383 392 395 371 366 339 311 296 265 300 321 3431990 310 344 361 380 356 351 340 317 294 274 297 308 3281995 321 357 372 358 350 324 311 294 297 269 277 307 3201999 342 382 399 376 370 347 332 325 283 293 278 314 345
1 The ozone layer in Dobson units (DU). This measurement states how many hundredths of a millimetre thick the ozone layer would be if it was collected on the surface of theearth.Source: Danish Meterological Institute.

Statistical Yearbook 2000 Environment and energy
Table 12 Emissions and depositions in Denmark 1997
Danish emissions transported to selected countries Depositions in Denmark from selected countries
Sulphur from SO2
Nitrogen from NOx
Nitrogenfrom NH4
Sulphur from SO2
Nitrogen from NOx
Nitrogen from NH4
tons
Denmark 7 300 3 700 21 800 7 300 3 700 21 800Sweden 5 700 7 200 6 800 400 800 700Norway 1 800 2 500 2 600 100 700 100Finland 900 1 600 1 000 0 100 0United Kingdom 400 800 500 4 400 5 800 1 300Germany 2 300 3 400 3 900 4 900 3 700 6 200Netherlands 100 200 200 500 1 600 1 100Belgium 100 100 100 900 800 400France 400 800 300 2 100 1 900 1 100Poland 2 400 4 200 3 000 2 800 1 000 800Czech Republic and Slovakia 400 700 500 900 400 300Former USSR, European part 5 400 9 800 4 900 800 500 100Sea areas 24 900 19 200 36 800 6 200 6 900 0Other 2 452 21 305 1 490 4 100 1 700 1 000
Note: Data for 1997 has been calculated using a new dispersion model.
Source: EMEP/the Norwegian Meteorological Office.

Statistical Yearbook 2000 Environment and energy
Table 13 Emissions from the transport sector 1998
CO2 NOx SO2 CO
thousand tons
TotalTotalTotalTotal 14 31114 31114 31114 311 96969696 6666 309309309309Road transport 11 204 77 2 306Railway transport 247 2 0 0Air transport 2 451 10 0 2Sea transport 409 7 3 1
per cent
TotalTotalTotalTotal 100100100100 100100100100 100100100100 100100100100Road transport 78 79 36 99Railway transport 2 2 2 0Air transport 17 11 4 1Sea transport 3 8 58 0
Source: Danish Meteorological Institute.

Statistical Yearbook 2000 Environment and energy
Table 14 Bathing water quality 1980-2000
Monitoring stations Acceptable waterquality
Unacceptable waterquality
Beach areas wherebathing is forbidden
1980 1 304 1 101 179 241985 1 374 1 017 288 691990 1 338 1 199 70 691991 1 307 1 216 54 371992 1 282 1 197 55 301993 1 282 1 226 33 231994 1 288 1 267 33 211995 1 301 1 281 52 201996 1 299 1 280 57 191997 1 310 1 293 18 171998 1 300 1 282 45 181999 1 300 1 283 30 172000 1 300 1 255 28 17
Source: Environmental Protection Agency and municipalities.

Statistical Yearbook 2000 Environment and energy
Table 15 Consumption of drinking water by counties 1996-1998
1996 1997 1998
m3 in mio.
All DenmarkAll DenmarkAll DenmarkAll Denmark 483.5483.5483.5483.5 464.8464.8464.8464.8 441.3441.3441.3441.3Copenhagen Municipality 36.2 35.7 35.7Frederiksberg Municipality 6.6 6.5 6.2Copenhagen County 46.6 45.5 43.9Frederiksborg County 28.7 27.8 25.5Roskilde County 18.1 17.3 16.2West Zealand County 29.9 28.8 29.1Storstrøm County 22.5 21.3 19.6Bornholm County 4.8 4.6 4.3Funen County 42.4 41.0 38.2South Jutland County 24.7 23.6 23.1Ribe County 24.5 22.7 21.6Vejle County 34.2 32.9 30.5Ringkøbing County 31.8 30.3 28.6Aarhus County 57.0 54.3 50.4Viborg County 26.0 25.0 23.1North Jutland County 49.6 47.5 45.4
Note. Water consumption of industry, agriculture and fish farming has not been included where recovery is based onseparate individual borings.

Statistical Yearbook 2000 Environment and energy
Table 16 Consumption of drinking water by purpose 1996-1998
1996 1997 1998
m3 in mio.
All DenmarkAll DenmarkAll DenmarkAll Denmark 483.5483.5483.5483.5 464.8464.8464.8464.8 441.3441.3441.3441.3Households 290.7 277.1 266.2Industry and institutions 150.5 147.0 142.6Losses, etc. 42.3 40.7 32.5
Note. Water consumption of industry, agriculture and fish farming has not been included where recovery is based onseparate individual borings.

Statistical Yearbook 2000 Environment and energy
Table 17 Waterworks by content of nitrates in drinking water 1998
Waterworks by content of nitrates per litre
0.0 - 4.9 mg 5.0 - 24.9 mg 25.0 - 49.9 mg - 50.0 mg
per cent
All DenmarkAll DenmarkAll DenmarkAll Denmark 76767676 15151515 7777 2222
Copenhagen County1 78 20 - 2Frederiksborg County 81 16 2 1Roskilde County 87 10 3 -West Zealand County 88 8 3 1Storstrøm County 81 17 2 0Bornholm County 77 18 5 -Funen County 84 12 3 1South Jutland County 81 15 3 1Ribe County 78 19 2 1Vejle County 85 10 4 1Ringkøbing County 82 11 6 1Aarhus County 68 17 11 4Viborg County 62 19 10 9North Jutland County 52 22 22 4
Note. The recommended limit value for nitrates in drinking water is 25 mg/l.1 Copenhagen County includes Copenhagen and Frederiksberg Municipalities.

Statistical Yearbook 2000 Environment and energy
Table 18 Recycling of paper and glassware packaging 1996-1998
1996 1997 1998
PaperPaperPaperPaper tons thousands
Consumption of paper in DenmarkConsumption of paper in DenmarkConsumption of paper in DenmarkConsumption of paper in Denmark1 1 2081 2081 2081 208 1 3491 3491 3491 349 1 3041 3041 3041 304Production of paper in Denmark 330 342 350Waste paper collected 537 607 656Waste paper used in production2 385 407 409
Glassware packagingGlassware packagingGlassware packagingGlassware packaging3
Consumption, totalConsumption, totalConsumption, totalConsumption, total 181181181181 190190190190 184184184184Collected, total 123 115 126Recycled4 105 108 118
1 Danish production + imports - exports of paper and card. 2 Waste paper added as raw material in Danish paper produc-tion where there is an estimated process waste of 15-20 pct. 3 Excl. bottles with deposits which replace glass consumptionof about 300,000 tons glass. 4 Of which 57,000 tons washed and refilled bottles and 52,000 tons broken glass for recyclingin 1998.
Source: Dansk Center for Affald og Genanvendelse (Danish centre for waste and recycling).

Statistical Yearbook 2000 Environment and energy
Table 19 Amount of waste analysed by type of waste and treatment 1998
Recycling Incineration Depositing Specialtreatment
Total
thousand tons
TotalTotalTotalTotal 7 3197 3197 3197 319 2 7482 7482 7482 748 2 2772 2772 2772 277 84848484 12 42812 42812 42812 428Daily refuse 350 1 367 109 0 1 825Bulky waste 96 239 234 4 572Garden waste 553 9 24 0 586Commercial andindustrial waste 4 324 858 1 105 1 6 288Hazardous waste 51 1 5 76 133Special hospital waste 0 4 0 3 7Processing residue 1 940 270 799 0 3 008Not known 7 0 1 0 8
Note: The data originates from the information system on waste and recycling (ISAG) which is kept by the DanishEnvironmental Protection Agency.
Source: Environmental Protection Agency, sugar factories, the recycling industry, and power stations.

Statistical Yearbook 2000 Environment and energy
Table 20 Sales of pesticides 1994-1999
1994 1995 1996 1997 1998 1999
Tons
Sales of pesticide productsSales of pesticide productsSales of pesticide productsSales of pesticide products1
Total saleTotal saleTotal saleTotal sale 16 72216 72216 72216 722 19 43019 43019 43019 430 15 29515 29515 29515 295 14 82514 82514 82514 825 14 17914 17914 17914 179 12 44512 44512 44512 445Repellents 187 136 64 59 56 84Fungicides 2 120 2 395 1 626 2 105 1 911 1 999Rodenticides 309 246 412 306 375 441Herbicides 7 825 9 782 7 898 7 584 7 320 5 740Insecticides 1 194 1 501 738 1 030 1 185 900Soil disinfectants 24 21 48 3 0 4Combined fungicides and insecticides 32 31 18 19 26 16Algicides 364 58 0 0 0 1Slimicides for use in paper pulp 84 91 50 50 39 60Products against pests on farm animals 279 594 378 355 141 111Products for the protection of woodwork 3 884 4 026 3 890 3 044 2 756 2 657Plant growth regulators 421 551 173 271 369 432
Of which active ingredientsOf which active ingredientsOf which active ingredientsOf which active ingredients2
Active ingredients, totalActive ingredients, totalActive ingredients, totalActive ingredients, total 5 6155 6155 6155 615 6 6306 6306 6306 630 5 2715 2715 2715 271 4 5824 5824 5824 582 4 3264 3264 3264 326 3 6053 6053 6053 605Repellents 10 9 4 4 4 6Fungicides 1 096 1 246 791 1 027 891 884Rodenticides 3 3 3 4 4 3Herbicides 3 070 3 690 3 127 2 923 2 781 2 059Insecticides 159 220 90 97 102 86Soil disinfectants 23 19 31 3 0 4Combined fungicides and insecticides 19 6 3 3 3 2Algicides 11 5 0 0 0 0Slimicides for use in paper pulp 25 33 31 33 33 42Products against pests on farm animals 4 5 2 2 2 1Products for the protection of woodwork 935 1 069 1 097 346 297 261Plant growth regulators 260 325 93 140 209 257
1 A pesticide product comprises one or more effective substances, emulators, adhesives and inactive fillers. 2 That part of the product, which has a toxic effect.Source: Danish Environmental Protection Agency

Statistical Yearbook 2000 Environment and energy
Table 21 Extraction of raw materials 1990-1999
1990 1995 1998 1999
m3 in thousands
Extraction of raw materials, totalExtraction of raw materials, totalExtraction of raw materials, totalExtraction of raw materials, total33 97533 97533 97533 975 34 21134 21134 21134 211 37 60337 60337 60337 603 47 85847 85847 85847 858
Land:Land:Land:Land:Granite 810 662 183 180Chalk, limestone 2 924 4 049 3 445 3 343Quartz sand 186 191 191 279Clay 462 739 779 828Plastic clay and bentonite 303 311 325 352Moler 195 186 256 197Stone, gravel, sand 22 534 21 721 24 885 28 414Peat and sphagnum 399 259 336 253Other raw materials 292 440 205 1 149
SeaSeaSeaSeaSand, gravel, sand for land fillingetc. 5 870 5 652 6 999 12 863
Source: Counties and the National Forest and Nature Agency.

Statistical Yearbook 2000 Environment and energy
Table 22 Expenditure and revenue of the general government sectoron the environment 1991-1999
1991 1995 1999
DKK mio.
Environmental expenditure, totalEnvironmental expenditure, totalEnvironmental expenditure, totalEnvironmental expenditure, total 4 0274 0274 0274 027 6 7796 7796 7796 779 7 9917 9917 9917 991
Environmental protectionEnvironmental protectionEnvironmental protectionEnvironmental protection 1 2961 2961 2961 296 3 1903 1903 1903 190 3 7043 7043 7043 704Waste 476 446 332Water and land 289 623 509Air 101 1 599 2 187Other environmental protection measures 430 522 676
Forest and nature managementForest and nature managementForest and nature managementForest and nature management 1 7121 7121 7121 712 2 1652 1652 1652 165 2 4842 4842 4842 484Forest and nature 1 469 1 825 1 937Streams 195 249 238Agriculture and the environment 48 91 309
Environmental research and surveysEnvironmental research and surveysEnvironmental research and surveysEnvironmental research and surveys 368 368 368 368 541 541 541 541 506 506 506 506
Other environmental protectionOther environmental protectionOther environmental protectionOther environmental protectionmeasuresmeasuresmeasuresmeasures 651651651651 883883883883 1 2971 2971 2971 297Joint expenditure 632 845 1 254Protection of buildings 19 37 38Traffic and environment 0 1 5
Environmental revenue, totalEnvironmental revenue, totalEnvironmental revenue, totalEnvironmental revenue, total1111 4 0554 0554 0554 055 7 8047 8047 8047 804 12 00112 00112 00112 001
Environmental protectionEnvironmental protectionEnvironmental protectionEnvironmental protection 2 5922 5922 5922 592 1 9291 9291 9291 929 2 0062 0062 0062 006Waste 320 342 342Water and land 2 238 1 471 1 572Other environmental protection measures 34 116 92
Forest and nature managementForest and nature managementForest and nature managementForest and nature management 193 193 193 193 329 329 329 329 495 495 495 495Forest and nature 188 317 336Streams 5 12 7Agriculture and the environment 0 0 152
Environmental research and surveysEnvironmental research and surveysEnvironmental research and surveysEnvironmental research and surveys 38 38 38 38 137 137 137 137 198 198 198 198
Other environmental and nature measuresOther environmental and nature measuresOther environmental and nature measuresOther environmental and nature measures89898989 67 67 67 67 82 82 82 82
Environmental taxesEnvironmental taxesEnvironmental taxesEnvironmental taxes 1 1431 1431 1431 143 5 3425 3425 3425 342 9 2209 2209 2209 220
Energy and resource taxesEnergy and resource taxesEnergy and resource taxesEnergy and resource taxes 14 64314 64314 64314 643 18 39018 39018 39018 390 26 53426 53426 53426 534
Note: Figures only cover the general government sector. 1 Not including energy and resource taxes.

Statistical Yearbook 2000 Environment and energy
Table 23 Expenditure and revenue of the general government sector on the environment, by sub sectors 1999
Centralgovernment
Counties Municipalities Generalgovernment
sector, total1
DKK mio.
Environmental expenditure, totalEnvironmental expenditure, totalEnvironmental expenditure, totalEnvironmental expenditure, total 4 4164 4164 4164 416 1 3931 3931 3931 393 2 2272 2272 2272 227 8 0368 0368 0368 036
Environmental protectionEnvironmental protectionEnvironmental protectionEnvironmental protection 2 7612 7612 7612 761 523523523523 459459459459 3 7433 7433 7433 743Waste 120 - 212 332Water and land 94 380 74 548Air 2 187 - - 2 187Other environmental protection measures 360 143 173 676
Forest and nature managementForest and nature managementForest and nature managementForest and nature management 989989989989 214214214214 1 2861 2861 2861 286 2 4892 4892 4892 489Forest and nature 677 111 1 151 1 939Streams 3 104 135 242Agriculture and the environment 309 - - 309
Environmental research and surveysEnvironmental research and surveysEnvironmental research and surveysEnvironmental research and surveys 506506506506 ---- ---- 506506506506
Other environmental protection measuresOther environmental protection measuresOther environmental protection measuresOther environmental protection measures 159159159159 655655655655 483483483483 1 2971 2971 2971 297Joint expenditure 116 655 483 1 254Protection of buildings 38 - - 38Traffic and environment 5 - - 5
Environmental revenue, totalEnvironmental revenue, totalEnvironmental revenue, totalEnvironmental revenue, total2 9 7549 7549 7549 754 153153153153 2 2012 2012 2012 201 12 10812 10812 10812 108
Environmental protectionEnvironmental protectionEnvironmental protectionEnvironmental protection 27272727 94949494 1 9261 9261 9261 926 2 0472 0472 0472 047Waste 5 - 337 342Water and land - 67 1 544 1 611Other environmental protection measures 21 27 45 93
Forest and nature managementForest and nature managementForest and nature managementForest and nature management 247247247247 33333333 220220220220 500500500500Forest and nature 95 28 216 339Streams - 5 4 9Agriculture and the environment 152 - - 152
Environmental research and surveysEnvironmental research and surveysEnvironmental research and surveysEnvironmental research and surveys 198198198198 ---- ---- 198198198198
Other environmental and nature measuresOther environmental and nature measuresOther environmental and nature measuresOther environmental and nature measures 1111 26262626 55555555 82828282Joint expenditure 1 26 55 82Preservation of buildings - - - -Traffic and environment - - - -
Environmental taxesEnvironmental taxesEnvironmental taxesEnvironmental taxes 9 2819 2819 2819 281 ---- ---- 9 2819 2819 2819 281
Energy and resource taxesEnergy and resource taxesEnergy and resource taxesEnergy and resource taxes 26 56626 56626 56626 566 ---- ---- 26 56626 56626 56626 566
Note: Figures only cover the general government sector.1 Incl. transfers to other public sub sectors. 2 Not including energy and resource taxes.

Statistical Yearbook 2000 Environment and energy
Table 24 Convictions for offences against the environmentprotection Acts 1990-1997
1990 1996 1998
number of convictions
TotalTotalTotalTotal 403403403403 406406406406 475475475475
Environmental Protection Act 260 170 182Marine Environment Act 2 2 -Nature Conservation Act 18 60 28Washington Convention 9 16 3Forestry Act - - 1Act on urban and rural areas 18 17 25Act on holiday dwellings and camping 6 13 13Act on chemical compounds andproducts 5 2 6Other acts relating to the environment 85 126 217

Statistical Yearbook 2000 Environment and energy
Table 25 Denmark’s fauna and flora 1997
Total numberof known
Total number of ’listed species’ Species extinctin Denmark1
Species requiring special protection
species Directlyendangered2
Vulnerablespecies3
Rare species4
Number per cent number of species
TotalTotalTotalTotal 10 59810 59810 59810 598 3 1423 1423 1423 142 30303030 343343343343 611611611611 997997997997 1 1911 1911 1911 191
FloraFloraFloraFloraFungi / LichensFungi / LichensFungi / LichensFungi / Lichens 3 9503 9503 9503 950 1 4521 4521 4521 452 37373737 112112112112 268268268268 453453453453 619619619619Fungi 3 000 878 29 31 157 248 442Lichens 950 574 60 81 111 205 177
Vascular plantsVascular plantsVascular plantsVascular plants 1 0501 0501 0501 050 220220220220 21212121 23232323 36363636 66666666 95959595
FaunaFaunaFaunaFaunaInsectsInsectsInsectsInsects 5 2895 2895 2895 289 1 3591 3591 3591 359 26262626 190190190190 285285285285 450450450450 434434434434Ephemeroptera 42 20 48 5 8 4 3Plecoptera 25 10 40 2 2 3 3Odonata 50 21 42 4 4 7 6Pentatomoidea 56 15 27 0 2 7 6Trichoptera 168 54 32 10 3 12 29Beetles 3 674 964 26 144 233 328 259Butterflies 73 36 49 9 8 18 1Moths 900 141 16 13 12 45 71Zygaenidae 8 5 63 1 1 3 0Syrphidae 269 86 32 2 10 21 53Simuliidae 24 7 29 0 2 2 3
VertebratesVertebratesVertebratesVertebrates 309309309309 111111111111 36363636 18181818 22222222 28282828 43434343Freshwater fish 38 15 39 2 5 1 7Amphibians 14 5 36 0 1 3 1Reptiles 7 2 29 2 0 0 0Birds 200 74 37 14 15 14 31Mammals 50 15 30 0 1 10 4
Note. Definitions of categories are identical to those which are used in the so-called 'red lists'. These are national lists of the status of endangered animal and plantspecies.1 Species which are regarded as extinct in Denmark after 1850. 2 Species which are regarded as in danger of extinction in Denmark in the near future if the negativefactors which are currently affecting them continue. 3 Species which are expected to be directly endangered in Denmark if the negative factors which are currentlyaffecting them continue. 4 Species which are so few in number that they are particularly sensitive to random man-made or natural fluctuations and negligence.
Source: National Forest and Nature Agency.

Statistical Yearbook 2000 Environment and energy
Table 26 Breeding pairs of the 20 most common birds in Denmark 1997
No. Species Number of breeding pairs Trend
1 Blackbird 2 250 000 Rising 2 Chaffinch 1 700 000 Rising 3 Skylark 1 360 000 Falling 4 House sparrow 944 000 Falling 5 Great tit 745 000 Fluctuating 6 Starling 660 000 Falling 7 Willow warbler 603 000 Stable 8 Yellowhammer 567 000 Stable 9 European greenfinch 489 000 Rising10 Tree sparrow 482 000 Rising11 Wren 404 000 Fluctuating12 Whitethroat 358 000 Falling13 Swallow 275 000 Falling14 Wood pigeon 291 000 Rising15 Robin 285 000 Fluctuating16 Blackcap 284 000 Rising17 Common linnet 283 000 Stable18 Song thrush 259 000 Stable19 Magpie 249 000 Rising20 Bluetit 245 000 Fluctuating
Source: National Forest and Nature Agency

Statistical Yearbook 2000 Environment and energy
Table 27 Breeding pairs of the 20 most rare birds in Denmark 1997
No. Species Number of breeding pairs Developmental trend
1 Black stork 1-3 Rising 2 Bluethroat 1-3 Rising 3 Barnacle goose 2-3 Rising 4 White-tailed eagle 3 Rising 5 Osprey 3 Stable 6 Corncrake 0-5 Falling 7 Common sandpiper 0-5 Fluctuating 8 Hen harrier 4-5 Rising 9 White-throated dipper 4-5 Rising10 European serin 5 Fluctuating11 Tengmalm’s owl 5 Fluctuating12 Canada goose 5 Rising13 White stork 6 Falling14 Stonechat 6-8 Fluctuating15 Crane 2-9 Rising16 Gull-billed tern 9 Rapidly falling17 Black grouse 9 Falling18 Golden plover 5-10 Falling19 Hobby 5-10 Stable20 Spotted nutcracker 10 Stable
Note. Protection of wild birds in Denmark is regulated by the Act on hunting and game management and the NatureProtection Act. Species with 0-2 breeding pairs in Denmark have been excluded.
Source: National Forest and Nature Agency.

Statistical Yearbook 2000 Environment and energy
Table 28 Number of mammals killed in Denmark 1990-1999
1990/91 1995/96 1997/98 1998/99
thousands
TotalTotalTotalTotal 302.5302.5302.5302.5 326.5326.5326.5326.5 283.3283.3283.3283.3 279.5279.5279.5279.5
Red deer 1.9 2.9 3.3 3.3Fallow deer 3.5 3.7 4.1 3.8Sica 0.4 0.4 0.7 0.5Roe deer 73.0 105.0 101.0 101.0Hare 148.0 162.0 113.0 106.0Rabbits 17.0 6.0 4.6 7.5Squirrel 0.3 . . .1 . . .1 . . .1
Foxes 50.0 38.0 42.0 45.0Badger 1.0 . . .1 . . .1 . . .1
Polecat 0.9 0.7 1.8 1.1Mink 2.8 4.6 8.0 6.7Stone marten 3.7 3.2 4.8 4.6
Note. Number of people holding hunting licences in the 1998/99 season was 171,000.1 This species is totally protected, but individual animals may be killed in accordance with the Statutory Order on gameinjuries.
Source: National Environmental Research Institute, Dept. of Flora and Fauna Ecology.

Statistical Yearbook 2000 Environment and energy
Table 29 Number of birds killed in Denmark 1990-1999
1990/91 1995/96 1997/98 1998/99
thousands
TotalTotalTotalTotal 2 8662 8662 8662 866 2 5852 5852 5852 585 2 2812 2812 2812 281 2 2462 2462 2462 246
Grey partridge 85 94 65 57Pheasant 900 812 705 742Heron 1 1 2 1Woodcock 27 27 22 25Snipe 32 24 20 18Mallard 696 768 643 670Other surface-feedingduck 152 155 94 89Eider duck 135 114 106 72Other diving duck 58 45 36 34Goose 14 16 15 18Common coot 24 18 13 14Gull 99 47 41 38Wood pigeon 351 262 288 239Eurasian collared dove 12 10 10 8Rook 92 81 84 92Crow 104 69 81 75Black-billed magpie 60 38 43 43Cormorant . . . 3 4 4Starling . . . 1 7 7
Note. Number of people holding hunting licences in the 1998/99 season was 171,000.
Source: National Environmental Research Institute, Dept. of Flora and Fauna ecology.

Statistical Yearbook 2000 Environment and energy
Table 30 Energy balance sheet for Denmark 1998
Crude oiland semi-manufac-tured oil
Coal, coke,etc.
Oil products Natural gas Other gas Renewableenergy
resources
Electricity Districtheating
tons in thousands 1 000Nm3
1 000tons
Tj GWh Tj
ProductionProductionProductionProduction 11 556 11 556 11 556 11 556 - - - - 7 583 7 583 7 583 7 583 13 914 13 914 13 914 13 914 432 432 432 432 66 858 66 858 66 858 66 858 38 762 38 762 38 762 38 762 121 784 121 784 121 784 121 784ImportsImportsImportsImports 4 832 4 832 4 832 4 832 8 416 8 416 8 416 8 416 5 779 5 779 5 779 5 779 - - - - 10 10 10 10 479 479 479 479 3 280 3 280 3 280 3 280 - - - -StockStockStockStock 511 511 511 511 - 1 100- 1 100- 1 100- 1 100 156 156 156 156 - 128- 128- 128- 128 - 11- 11- 11- 11 - - - - - - - - - - - -Waste and cable lossesWaste and cable lossesWaste and cable lossesWaste and cable losses 85 85 85 85 83 83 83 83 90 90 90 90 179 179 179 179 5 5 5 5 647 647 647 647 1 999 1 999 1 999 1 999 24 347 24 347 24 347 24 347ExportsExportsExportsExports 7 907 7 907 7 907 7 907 140 140 140 140 4 299 4 299 4 299 4 299 2 785 2 785 2 785 2 785 78 78 78 78 57 57 57 57 7 602 7 602 7 602 7 602 0 0 0 0Total domestic consumptionTotal domestic consumptionTotal domestic consumptionTotal domestic consumption 7 885 7 885 7 885 7 885 9 293 9 293 9 293 9 293 8 816 8 816 8 816 8 816 11 079 11 079 11 079 11 079 370 370 370 370 66 633 66 633 66 633 66 633 32 441 32 441 32 441 32 441 97 436 97 436 97 436 97 436
HouseholdsHouseholdsHouseholdsHouseholds - - - - 10 10 10 10 2 721 2 721 2 721 2 721 730 730 730 730 57 57 57 57 8 014 8 014 8 014 8 014 10 186 10 186 10 186 10 186 62 874 62 874 62 874 62 874
Agriculture, fishing and quarryingAgriculture, fishing and quarryingAgriculture, fishing and quarryingAgriculture, fishing and quarrying - - - - 105 105 105 105 807 807 807 807 674 674 674 674 7 7 7 7 2 469 2 469 2 469 2 469 2 118 2 118 2 118 2 118 1 888 1 888 1 888 1 888Agriculture, horticulture, and forestry - 49 555 128 6 2 469 1 974 1 885Fishing, etc. - - 220 - - - 64 -Quarrying and mining - 56 32 546 - - 80 3
ManufacturingManufacturingManufacturingManufacturing 7 885 7 885 7 885 7 885 446 446 446 446 815 815 815 815 928 928 928 928 280 280 280 280 5 336 5 336 5 336 5 336 9 690 9 690 9 690 9 690 5 970 5 970 5 970 5 970Mfr. of food, beverages and tobacco - 104 228 377 5 7 2 207 1 161Mfr. of textile, wearing apparel and leather - - 13 28 1 1 200 125Mfr. of wood, paper; printing and publishing - - 45 94 2 3 900 1 076 1 628Mfr. of refined petroleum products, chemicalsand plastic 7 885 19 101 117 239 19 2 150 1 208Mfr. of non-metallic mineral, etc. - 322 288 137 18 6 831 48Mfr. of iron and basis metals - 1 120 162 15 108 2 826 1 610Mfr. of furniture and manufacturing n.e.s. - - 21 12 1 1 297 400 190
Energy and water supplyEnergy and water supplyEnergy and water supplyEnergy and water supply - - - - 8 732 8 732 8 732 8 732 1 569 1 569 1 569 1 569 8 434 8 434 8 434 8 434 - - - - 50 813 50 813 50 813 50 813 491 491 491 491 24 24 24 24
ConstructionConstructionConstructionConstruction - - - - - - - - 316 316 316 316 5 5 5 5 14 14 14 14 - - - - 242 242 242 242 - - - -
Wholesale and retail trade, hotels and restaWholesale and retail trade, hotels and restaWholesale and retail trade, hotels and restaWholesale and retail trade, hotels and restauuuu----rants, etc.rants, etc.rants, etc.rants, etc. ---- - - - - 367 367 367 367 104 104 104 104 5 5 5 5 - - - - 3 7363 7363 7363 736 9 043 9 043 9 043 9 043Sale and repair of motor vehicles, gas stations, etc. - - 76 13 - - 329 1 107Wholesale and commission sale, except of motorvehicles - - 205 42 2 - 1 351 3 674Retail trade and repair work, except motor vehicles - - 69 27 1 - 1 466 2 317Hotels and restaurants, etc. - - 19 22 3 - 591 1 944
Transport, postal services and telecommunicTransport, postal services and telecommunicTransport, postal services and telecommunicTransport, postal services and telecommunicaaaa----tiontiontiontion - - - - - - - - 1 890 1 890 1 890 1 890 14 14 14 14 2 2 2 2 - - - - 1 467 1 467 1 467 1 467 1 190 1 190 1 190 1 190Transport - - 1 860 6 2 - 1 227 508Post and telecommunication - - 30 8 - - 240 682
Financial intermediation, etc. business activFinancial intermediation, etc. business activFinancial intermediation, etc. business activFinancial intermediation, etc. business activiiiitiestiestiesties - - - - - - - - 93 93 93 93 45 45 45 45 1 1 1 1 - - - - 1 010 1 010 1 010 1 010 3 856 3 856 3 856 3 856Financial intermediation and insurance, etc. - - 7 11 - - 257 928Letting and sale of real estate - - 27 7 - - 128 628Business activities, etc. - - 59 27 - - 625 2 300
Public and personal servicesPublic and personal servicesPublic and personal servicesPublic and personal services - - - - - - - - 237 237 237 237 145 145 145 145 5 5 5 5 - - - - 3 502 3 502 3 502 3 502 12 591 12 591 12 591 12 591Public administration and defence, etc. - - 108 20 2 - 466 1 757Education - - 28 36 1 - 863 3 117Human health activities - - 13 22 - - 539 1 947Social institution, etc. - - 23 27 - - 636 2 297Refuse disposal, organisations, entertainment, etc. - - 66 40 1 - 997 3 473

Statistical Yearbook 2000 Environment and energy
Table 31 Energy consumption in Denmark 1990-1998
1990 1995 1998
thousand tons
Energy consumption, grossEnergy consumption, grossEnergy consumption, grossEnergy consumption, grossHard coal etc. 9 995 10 987 9 242Coke and furnace coke 45 51 47Brown coal etc. 6 9 4Waste 2 943 3 569 3 611Fuel wood, etc. 1 110 1 255 1 090Straw 861 843 922Kerosene 118 14 10Jet fuel 666 657 806Motor gasoline 1 584 1 892 1 999Other petrol and oil products 19 750 1 220Gas/Diesel oil 3 906 3 897 3 789Fuel oil 947 997 813Petroleum-coke 182 176 179Liquid gas (LPG) 100 87 85Refinery gas 265 370 236
mio. Nm3
Natural gas3 1 703 3 009 3 941
thousand GJ
Bio gas 600 713 1 426Wind energy and water power 2 298 3 395 10 100
mio KWh
Electricity supplyElectricity supplyElectricity supplyElectricity supply
Electricity sold, public works 28 548 31 470 32 588Dwellings 9 015 9 549 9 590Agriculture, etc. 2 349 2 544 2 559Manufacturing 8 112 9 451 9 796Other industries, publicadministration, etc. 9 068 9 892 10 536
thousand tons
Crude oil and natural gasCrude oil and natural gasCrude oil and natural gasCrude oil and natural gasCrude oil, Danish production 5 985 9 225 11 825
mio. Nm3
Natural gas, Danish production 3 081 5 164 7 313
Note. Gross energy consumption is defined as the amount of energy available after conversion in refineries and beforeconversion at electricity, gas, or district heating power stations. This definition is different from the 'Manufacturers' in-vestment by sector and county', which does not include energy converted in refineries.1 Corrected for cross-border trade. 2 Including waste oil. From 1995 incl. orimulsion. 3 Excl. consumption on North-Seaplatforms.
Source: Danish Energy Agency and Association of Danish Electric Utilities.

Statistical Yearbook 2000 Environment and energy
Table 32 Production of renewable energy 1990-1998
1990 1995 1998
TJ
Total productionTotal productionTotal productionTotal production 54 80654 80654 80654 806 65 72565 72565 72565 725 76 72976 72976 72976 729Solar heat 105 219 300Wind energy 2 197 4 238 10 005Water power 101 109 98Straw 12 481 12 824 13 359Wood chips 1 724 2 340 3 038Wood 7 019 9 191 8 339Wood pills 1 575 2 138 2 261Wood waste 6 175 5 665 5 851Bio gas 752 1 729 2 670Waste combustion 15 006 23 931 27 310Fish oil 744 251 14Geothermal heat1 2 510 3 043 3 484
1 Heat pumps and geothermy.
Source: Danish Energy Agency.

Statistical Yearbook 2000 Environment and energy
Table 33 Manufacturers’ energy consumption 1997
Solid fuel Liquid fuel
Gas Electricity Districtheating
1 000 GJ
Manufacturing, totalManufacturing, totalManufacturing, totalManufacturing, total1,2 19 067 19 067 19 067 19 067 26 287 26 287 26 287 26 287 56 494 56 494 56 494 56 494 30 53930 53930 53930 539 5 477 5 477 5 477 5 477
14009140091400914009 Extraction of gravel, clay, stone and salt, etc.Extraction of gravel, clay, stone and salt, etc.Extraction of gravel, clay, stone and salt, etc.Extraction of gravel, clay, stone and salt, etc.1 6141 6141 6141 614 1 1121 1121 1121 112 378 378 378 378 264 264 264 264 2 2 2 2
15009150091500915009 Mfr. of food, beverages and tobaccoMfr. of food, beverages and tobaccoMfr. of food, beverages and tobaccoMfr. of food, beverages and tobacco2 2 982 2 982 2 982 2 982 7 453 7 453 7 453 7 453 15 398 15 398 15 398 15 398 6 827 6 827 6 827 6 827 1 132 1 132 1 132 1 132151000 Mfr. of meat and meat products 2 1 339 2 195 1 924 122155000 Mfr. of dairy products - 525 3 894 1 377 220158909 Mfr. of other food products 2 852 4 668 7 199 2 835 556159000 Mfr. of beverages 128 904 2 004 620 223160000 Mfr. of tobacco and related products - 16 107 72 11
17009170091700917009 Mfr. of textiles, clothing and leatherMfr. of textiles, clothing and leatherMfr. of textiles, clothing and leatherMfr. of textiles, clothing and leather 1 1 1 1 239 239 239 239 1 118 1 118 1 118 1 118 599 599 599 599 85 85 85 85170000 Mfr. of textiles 1 200 1 023 498 42180000 Mfr. of clothing - 23 51 63 39190000 Mfr. of leather and footwear 0 16 43 38 4
20000200002000020000 Mfr. of wood and wood productsMfr. of wood and wood productsMfr. of wood and wood productsMfr. of wood and wood products 3 454 3 454 3 454 3 454 853 853 853 853 202 202 202 202 985 985 985 985 8 8 8 8
21009210092100921009 Mfr. of paper; printing and publishingMfr. of paper; printing and publishingMfr. of paper; printing and publishingMfr. of paper; printing and publishing 42 42 42 42 316 316 316 316 3 513 3 513 3 513 3 513 2 081 2 081 2 081 2 081 1 437 1 437 1 437 1 437210000 Mfr. of pulp, paper and paper products 9 282 3 301 1 414 1 186221200 Publishing of newspapers - 1 13 185 102221309 Publishing activities excl. newspapers - 4 64 116 76222009 Printing etc. 32 29 136 365 72
23000230002300023000 Mfr. of refined petroleum, etc.Mfr. of refined petroleum, etc.Mfr. of refined petroleum, etc.Mfr. of refined petroleum, etc. ---- 1 3801 3801 3801 380 18 38218 38218 38218 382 1 0551 0551 0551 055 257257257257
24000240002400024000 Mfr. of chemicalsMfr. of chemicalsMfr. of chemicalsMfr. of chemicals 579 579 579 579 2 106 2 106 2 106 2 106 3 403 3 403 3 403 3 403 4 109 4 109 4 109 4 109 1 158 1 158 1 158 1 158241009 Mfr. of chemical raw materials 13 874 2 154 2 290 950243009 Mfr. of paints, soap, cosmetics, etc. 566 223 709 939 86244000 Mfr. of pharmaceuticals - 1 009 541 880 123
25000250002500025000 Rubber and plastic productsRubber and plastic productsRubber and plastic productsRubber and plastic products 3 3 3 3 244 244 244 244 1 355 1 355 1 355 1 355 2 097 2 097 2 097 2 097 67 67 67 67
26000260002600026000 Mfr. of non-metallic mineral, etc.Mfr. of non-metallic mineral, etc.Mfr. of non-metallic mineral, etc.Mfr. of non-metallic mineral, etc. 9 256 9 256 9 256 9 256 10 360 10 360 10 360 10 360 6 114 6 114 6 114 6 114 2 708 2 708 2 708 2 708 38 38 38 38261009 Mfr. of glass and ceramic goods, etc. 0 123 1 484 555 19263009 Mfr. of bricks and concrete, etc. 9 256 10 237 4 630 2 152 19
27009270092700927009 Mfr. and processing of basic metalMfr. and processing of basic metalMfr. and processing of basic metalMfr. and processing of basic metal 42 42 42 42 685 685 685 685 3 229 3 229 3 229 3 229 4 286 4 286 4 286 4 286 253 253 253 253270000 Mfr. of basic metal - 196 1 950 2 373 81281009 Mfr. of construction materials of metal 6 271 404 564 100286009 Mfr. of hand tools, packaging of metal, etc. 36 218 876 1 349 72
29000290002900029000 Mfr. of machinery and equipmentMfr. of machinery and equipmentMfr. of machinery and equipmentMfr. of machinery and equipment 0 0 0 0 838 838 838 838 1 653 1 653 1 653 1 653 2 221 2 221 2 221 2 221 502 502 502 502291000 Mfr. of marine engines, compressors, etc. - 186 667 1 105 217292000 Mfr. of other general purpose machinery 0 337 290 421 83293000 Mfr. of agricultural and forestry machinery 0 118 311 167 32294009 Mfr. of machinery for industries, etc. - 155 171 328 126297000 Mfr. of domestic appliances 0 41 215 201 44
30009300093000930009 Mfr. of electrical and optical equipmentMfr. of electrical and optical equipmentMfr. of electrical and optical equipmentMfr. of electrical and optical equipment 52 52 52 52 210 210 210 210 631 631 631 631 1 047 1 047 1 047 1 047 294 294 294 294300009 Mfr. of computers, electric motors, etc. - 114 198 435 168320000 Mfr. of radios and communication
equipment, etc. 52 46 220 329 27330000 Mfr. of medical and optical instruments, etc. 0 51 213 284 99
35009350093500935009 Mfr. of transport equipmentMfr. of transport equipmentMfr. of transport equipmentMfr. of transport equipment 4 4 4 4 201 201 201 201 729 729 729 729 903 903 903 903 125 125 125 125351000 Building and repair of ships, etc. 4 75 414 528 49352009 Mfr. of transport equipment, excl. ships - 126 314 375 75
36000360003600036000 Mfr. of furniture and manufacturing n.e.s.Mfr. of furniture and manufacturing n.e.s.Mfr. of furniture and manufacturing n.e.s.Mfr. of furniture and manufacturing n.e.s. 1 039 1 039 1 039 1 039 290 290 290 290 388 388 388 388 1 357 1 357 1 357 1 357 120 120 120 120361000 Mfr. of furniture 1 034 258 295 1 055 58365009 Mfr. of toys, gold and silver articles, etc. 5 32 93 303 62
Note. The table includes workplaces in firms with 20 or more employed in the industry.1 Incl. extraction of gravel, clay, stone and salt, etc. 2 Excl. bakeries.