Environment 2002 - Forsiden - regjeringen.no · Environment 2002 Ministry of ... As part of the...
36
Environment 2002 Ministry of Petroleum and Energy Visiting address: Einar Gerhardsens plass 1 Postal address: P O Box 8148 Dep, N-0033 Oslo Tel +47 22 24 90 90 Fax +47 22 24 95 65 http://www.oed.dep.no E-mail: [email protected] The Norwegian petroleum sector
Transcript of Environment 2002 - Forsiden - regjeringen.no · Environment 2002 Ministry of ... As part of the...

Environment 2002
Ministry of Petroleum and Energy
Visiting address:
Einar Gerhardsens plass 1
Postal address:
P O Box 8148 Dep, N-0033 Oslo
Tel +47 22 24 90 90Fax +47 22 24 95 65
http://www.oed.dep.noE-mail: [email protected]
The Norwegian petroleum sector

Editor: Hæge Fjellheim, MPEEnglish editor: Rolf E GooderhamEdition completed: March 2002
Layout/design: Marketing Services ASIllustration: Inger FærvikPhotos: Havforskningsinstituttet, Norges Geologiske Undersøkelser, © Øyvind Hagen, Statoil, © Eksportutvalget for fisk, Tromsø, © Tor Jensen, Det Norske Veritas AS, © Norsk Hydro ASA, Marketing Services’ photo archivePaper: cover: Munken Lynx 240 g, inside pages: Munken Lynx 150 gPrinter: BK Vestfold GrafiskeCirculation: 3 500 Norwegian/5 000 English
ISSN 1502-3400

5
Foreword
SECTION 1
Petroleum activities in Norway
Environmental protection by the authoritiesExploration phase
Development and operation phase
Closing phase
Status of emissions and dischargesCarbon dioxide (CO2)
Nitrogen oxides (NOx)
Non-methane volatile organic compounds (nmVOC)
Chemicals, oil and other organic compounds
SECTION 2
Introduction
ChallengesOverlapping areas
Seismic surveying
Discharges to the sea
Petroleum activities close to the coast and in northern areas
Instruments and measuresImpact assessments
Requirements for seismic surveys and exploration drilling
Measures to reduce conflicts over sea areas
Discharge permits and environmental monitoring
Environmental management
Research and development
7
8
9
11111213
1516192123
28
29
3131313132
33333435353637
Contents


7
1
The Ministry of Petroleum and Energy producesan annual environmental review in cooperationwith the Norwegian Petroleum Directorate. Thepurpose of this publication is threefold:
• to increase knowledge about the environ-mental aspects of Norwegian oil and gas acti-vities
• to take a more detailed look at a specific topicwhich particularly concerns both the industryand the authorities, and identify the challengesand options faced
• to emphasise the government's goal of ensuringthat Norway reconciles its role as a large energyproducer with a pioneering position on environ-mental issues.
This year's edition focuses on the topic of "oiland fish – common sea". Both the petroleum andfishing industries depend on the waters of fNorway. Ever since petroleum activities began onthe Norwegian continental shelf more than 30years ago, the authorities have been keen toensure that these two sectors can work in thesame sea areas.
What challenges and opportunities face thepetroleum industry over discharges to the sea andliving marine resources? How can the authoritiesensure that this sector is able to coexist with thefisheries? These and similar questions about therelationship between the petroleum and fishingindustries in their shared seas are covered insection two of this publication.
Environment 2002 also incorporates a factualsection, which covers the status of emissions/discharges, environmental impacts and measuresto reduce discharges to the sea and emissions tothe air from petroleum activities. The MPE hopesthat a publication of this kind can enhance basicknowledge about petroleum activities and environ-mental issues.
Special thanks are again due this year to theexternal reference group, which includes repre-sentatives from the Bellona environmental organis-ation, the Norwegian Oil Industry Association(OLF) and the Federation of NorwegianEngineering Industries (TBL), for its constructivecontributions and comments during the work onEnvironment 2002.
Einar SteensnæsMinister of Petroleum and Energy
Foreword

Section 1
Facts

9
1
Petroleum activities in Norway
averaged 3.1 mill barrels per day in 2001, and isexpected to average three mill barrels per day for2002 as a whole. This level is likely to be main-tained over the next four years.
Gas and small quantities of natural gas liquids(NGL) are also produced. Sales of gas areexpected to build up from the present level of 60bn scm per year to an annual total of 100 bn scmin 2010.
In addition to offshore developments, land-based facilities have been built at Kårstø,Kollsnes, Sture, Mongstad and Tjeldbergodden inorder to bring oil and gas ashore and processthem to a greater or lesser degree.
Oil and gas are non-renewable resources, andtheir production often generates revenues inexcess of those normally achieved in other indus-tries. In Norway, much of these additionalearnings accrue to the government through taxesand the SDFI. In addition, the governmentreceives dividends from Statoil and Norsk Hydro.
Petroleum activities have contributed enor-mous revenues to Norwegian society. Totalearnings from the sector have varied over time inline with changes in prices and production. Seefigure 2. Petroleum revenues are largely deter-mined by world market prices for crude oil, theUS dollar exchange rate and production costs.This means that the government loses consider-able revenues when the price of oil is low. Annualgovernment cash flow from the sector is reduced
Facts about the petroleum sector
• Accounted in 2001 for 47 per cent of the value ofNorwegian exports.
• Contributed 32.8 per cent of overall govern-ment revenues in 2001 through:- revenues from the state's direct financial
interest (SDFI)- taxes from the oil companies- dividends from Statoil and Norsk Hydro.
• Gas will gain increasing importance comparedwith oil.
• Remaining oil and gas resources on theNorwegian continental shelf (NCS) aresubstantial. Forty-eight per cent of totalresources lie in existing fields/discoveries, 28per cent remain to be discovered and 24 percent have been produced.
• That provides a basis for at least 50 years of oilproduction and 100 years of gas output.
Oil production from the NCS started on theEkofisk field in 1971. Gas exports began from thesame field in 1977. Bringing Draugen on stream in1993 introduced the Norwegian Sea as a productionprovince, and Snøhvit was approved this year asthe first Barents Sea development.
Production has generally grown year by year(see figure 1) since activities began. Oil output
0
50
100
150
200
250
300
1992 1995 1998 2001 2004 2007 2010
mill
Sm
3 o
.e.
mrd
200
2 N
OK
200
250
300
150
100
50
1989
30
35
20
25
10
5
15 Pro
sen
t
1991 1993 1995 1996 1999 2001*
Figure 1 Production of oil and gas on the NCS.(Source: MPE/NPD)
Figure 2 Government's net cash flow from petroleum activi-ties 1988-2001. (Source: MPE/NPD/Ministry of Finance) *estimate
Oil production(incl NGL and condensate)
Gas production
Net cash flow
Share ofstate revenues
Shar
e
Bn
200
2 N
OK
Mill
scm
oe

10
1
by an estimated NOK 1 billion for each NOK 1 fallin the price of a barrel of oil.
Demand for goods and services generated byoperations on the NCS has created major spin-offsfor the community. A high percentage of thecontracts for exploration, development, production,transport and removal of redundant equipment
have been won against international competitionby Norwegian companies. This has helpedNorwegian offshore suppliers to become so strongthat they have also gradually gained entry to theinternational market in recent years. Being competi-tive on the world market is vital for the industry'ssurvival beyond the producing life of the NCS.
11
1
Environmental protection by the authorities
Environmental policy in Norway has historically
been based on direct regulation of environ-
mentally harmful emissions and discharges, but
increased use is now been made of economic
instruments such as taxes. The authorities in a
number of other countries have shown greater
preference for agreements with industry to limit
the environmental impact of various types of
emissions and discharges.
The Norwegian authorities regard close coopera-tion with the industry as essential for achievingestablished environmental goals without imposingexcessive economic costs on society. Miljøsokwas established in 1995 in order to promote suchcollaboration in the petroleum industry.
This initiative aimed to maintain the positionof the NCS as an example of environment-friendlyand competitive oil and gas activities. Oil compa-nies, contractors, the authorities and otheraffected interests have participated in its work.Miljøsok ended in 2000, but is being followed upby a new organisation for collaboration, theEnvironment Forum.
Exploration phaseThe objective of opening new areas for explora-tion is to find profitable petroleum resources forfuture development and production. The mostimportant environmental impact of exploration
work is the threat of acute discharges (spills) ofoil, which are potentially dangerous to larvae, fisheggs, fish, seabirds, marine mammals and lifealong the shore. However, the likelihood of suchspills is very low. No major acute discharges haveoccurred during exploration drilling on the NCS.
Before a new area of the NCS is opened forpetroleum activities, detailed analyses are carriedout on behalf of the government to assess theextent to which exploration could harm the envi-ronment. The obligation to carry out such impactassessments is laid down in the Petroleum Act.Studies are subject to public consultation andthen presented to the Storting (parliament).Special impact assessments have been carried outfor the Norwegian Sea, the Skagerrak and thesouthern Barents Sea.
The government also lays down specificrequirements in opened areas which seek torestrict conflicts with environmental and fishinginterests. These can include restrictions on whendrilling is allowed to take place, and specificemergency response requirements to limitdamage done by possible oil spills.
Once an area has been opened for petroleumactivities, blocks in the area can be put on offer.Production licences are awarded to those compa-nies which the government believes, after anoverall evaluation, can best recover the predictedassets in the area.
12
1The Barents Sea is an important area for
several reasons. It ranks as one of Norway's bestfishing areas while probably also containingsubstantial oil and gas resources. Extensivestudies have been carried out in connection withthe opening of the southern Barents Sea in 1989and ahead of the development of the Snøhvit gasfield.
Where further petroleum activities in thesewaters are concerned, the government wishes toinvestigate the overall impact of all commercialactivity in the Barents Sea in order to establish aholistic management plan. This would takeunified account of the environment, fishing, petro-leum activities and maritime transport.
The Ministry of Petroleum and Energy(MPE) has taken steps to establish the conse-quences of year-round petroleum activities in thewaters northwards from the Lofoten Islands aspart of the work of drawing up the plan. Thisincludes a review of previous studies in order toidentify where the need for additional knowledgeis greatest.
Development and production phaseOnce commercially-viable discoveries have beenmade, the next phase covers development andoperation to recover these assets.
Before the licensees can develop a discovery,the Petroleum Act requires that a plan for develop-ment and operation (PDO), and possibly a plan forinstallation and operation (PIO), is approved by theauthorities.
As part of the PDO/PIO process, the operatormust submit an impact assessment. This studywill describe any environmental ef fects ofexpected emissions and discharges, and includes asystematic review of costs and benefits of anymitigatory measures. Both the programme and theactual impact assessment are subject to publicconsultation.
Depending on the scope of the development,
the PDO/PIO is approved by the King in Councilor the Storting on the basis of an overall evalua-tion. Environmental protection represents one ofthe criteria applied in this evaluation.
In addition to the danger of acute discharges,the production phase involves continuous emis-sions to the air and discharges to the sea. Theseprimarily include:• discharges of water containing residual oil
and chemicals• emissions of carbon dioxide (CO2) and
nitrogen oxides (NOx) from energy production and flaring
• emissions of non-methane volatile organic compounds (nmVOC) during offshore loading of oil.
The following policy instruments aredeployed by the authorities to limit the environ-mental impact of emissions and dischargesduring the operating phase:
Carbon dioxide
With effect from 1 January 1991, the CarbonDioxide Tax Act imposed a carbon tax on the useof gas, oil and diesel oil in petroleum activities onthe NCS. This tax is levied on all combustion offossil fuels – primarily natural gas and diesel –which emit carbon dioxide. From 1 January 2002,the tax rate on the NCS is NOK 0.73 per litre ofoil/scm of gas.
Gas flaring, other than volumes necessary forsafety reasons during normal operation, is notpermitted under the Petroleum Act without theapproval of the MPE.
Nitrogen oxides
Apart from possible requirements imposedduring consideration of the PDO/PIO, nitrogenoxide emissions are currently unregulated on theNCS during the operating phase. Norway signeda new international agreement, the Gothenburg

13
1protocol in 1999, which includes an undertakingto ensure that nitrogen oxide emissions in 2010are 29 per cent lower than they were in 1990.Possible national instruments to meet thiscommitment are currently under consideration.In this context, the Norwegian PetroleumDirectorate (NPD) has studied proposals for anitrogen oxide quota system on the NCS as apossible instrument.
NmVOC
NmVOC emissions from offshore loading andstoring crude oil are now governed by emissionpermits issued under the authority of thePollution Control Act.
Oil, organic compounds and chemicals
Companies must apply to the NorwegianPollution Control Authority (SFT) for permits todischarge oil and chemicals to the sea. Thesepermits are issued in accordance with the provi-sions of the Pollution Control Act. This statuteprovides that operating companies have theresponsibility and obligation to establish thenecessary emergency response arrangements todeal with acute spills. Local and central govern-ment emergency response plans provide furtherprotection.
Closing phaseSeveral Norwegian offshore fields have now ceasedproduction or are nearing the end of their producinglife. The authorities have reached decisions on thedisposal of redundant installations on North-EastFrigg, East Frigg, Odin, Mime, TommelitenGamma, 2/4-S, Yme, Lille-Frigg and Frøy.
A cessation plan for the Ekofisk I facilitieswas received by the MPE in the autumn of 1999,and it was resolved in the autumn of 2001 thatthese installations should be brought ashore forrecycling. The MPE received a cessation plan forFrigg in November 2001, and this is under consi-
deration by the authorities in both Norway andthe UK.
The rules in the Petroleum Act on disposingof installations will be applied in accordance withrelevant national and international commitments.In 1998, the ministerial meeting of the conventionfor the protection of the marine environment of thenorth-east Atlantic (Ospar) approved a generalprohibition on the disposal of redundant offshoreinstallations in the area covered by the convention.This ban makes exceptions for concrete platforms,the bottom section of large steel structures andinstallations which, for unforeseen circumstances,are better disposed of on site. Before a decision istaken on the need to make an exception from theOspar ban, other parties to the convention mustbe consulted.
Otherwise, the main regulations derive fromthe 1982 UN Convention on the Law of the Sea,guidelines adopted under its authority, and theInternational Maritime Organisation (IMO).These rules mean that the bulk of Norway'sredundant offshore installations will be broughtashore for recycling or disposal.
The Ospar resolution does not cover pipelinesand cables. A three-year study was launched in1996 to clarify the effect of various disposaloptions for such facilities, and this led to thepresentation of Report no 47 (1999-2000) to theStorting on decommissioning redundant pipe-lines and umbilicals on the NCS.
As a general rule, permission to leave pipe-lines and umbilicals in place should be grantedwhen they cause no inconvenience or pose nosafety risk to demersal fisheries compared withthe cost of trenching, covering or removal.
Disposal issues are treated in accordancewith the above-mentioned Ospar regulations andthe Petroleum Act, together with prevailingguidelines. Taken together, these provisionsprovide a well-structured framework for dealingwith decommissioning.


15
1Status of emissions and discharges
The petroleum sector accounts for a substantial
percentage of Norway's emissions of carbon
dioxide (CO2), nitrogen oxides (NOx) and non-
methane volatile organic compounds (nmVOC). In
addition, it generates minor emissions of methane
(CH4) and marginal emissions of sulphur dioxide
(SO2). Operations also cause discharges of oil and
various chemicals into the sea.
The various emission components contribute todifferent environmental problems. In dealing withtransnational pollution and emissions anddischarges in common areas such as internationalwaters, the countries involved must work togetherto achieve the desired environmental goals.
Several international agreements commitNorway to limit emissions of various substances.How this affects the petroleum sector depends onthe terms of the specific agreement. Those relatingto emissions to the air usually specify ceilings foreach country. The terms are crucial in determiningwhether obligatory emission curbs must beimplemented entirely within a country or whetherthey can also be achieved in other countrieswhere reduction costs may be lower. The costs ofreducing emissions and discharges, both nationallyand internationally, will be crucial in determiningthe extent to which measures are imposed on thepetroleum sector.
Global environmental problemsBoth carbon dioxide and methane are green-house gases which contribute to global warming.They are regulated internationally through theUN framework convention on climate change.Norway's obligations under the Kyoto protocolmean that its average greenhouse gas emissionsin 2008-2012 cannot be more than one per centhigher than in 1990. That involves a reduction ofabout six per cent from the current level. Thiscommitment can be met through reductions bothdomestically and in other countries through theuse of the Kyoto mechanisms.
Regional environmental problemsNitrogen oxides, sulphur dioxide and nmVOCcontribute to regional transboundary environ-mental problems, such as acid rain, eutrophica-tion (over-fertilisation) and ground-level ozone.They also cause certain local pollution problems.Emissions of these gases are regulated throughprotocols under the convention on long-rangetransboundary air pollution.
Norway, other European countries, the USAand Canada signed a new Gothenburg protocol inDecember 1999, which seeks to solve the envi-ronmental problems represented by acidification,eutrophication and ground-level ozone. Underthis agreement, Norway must cut its annual emis-sions of nitrogen oxides to 156 000 tonnes by2010. That represents a 29 per cent reductionfrom the 1990 level.
The commitment for nmVOC is virtually iden-tical to the obligation accepted by Norway underthe earlier Geneva protocol. This requirednmVOC emissions from mainland Norway andthe Norwegian economic zone south of the 62ndparallel in 1999 to be reduced by 30 per centcompared with 1989. Under the Gothenburgprotocol, overall national emissions cannot exceed195 000 tonnes per year.
Local environmental problems Oil and chemical discharges from offshore instal-lations may have local effects around their sourceand are regulated nationally by emission permitsissued under the Pollution Control Act. In addition,such discharges are regulated by the Osparconvention because they take place in inter-national waters and thus concern more than onecountry.
A maximum oil content has been set interna-tionally for discharges of water to the sea, and atarget for reducing total oil discharges from theoffshore sector. Chemical discharges are regu-lated internationally with the aid of a categorisa-tion of the inherent properties of each chemical.

16
1 Figure 4 Carbon dioxide emissions from petroleum activitiesin 2000 by source. (Source: MPE/NPD)
Stasjonære kilderoffshore 88,1 %
Prosessutslipp 6,6 %
Leteboring 0,7 %
Utvinningsboring 2,8 %
Gassterminaler 1,8 %
Process emissions 6.6 %
Exploration drilling 0.7 %
Production drilling 2.8 %
Gas terminals 1.8 %
Stationary sourcesoffshore 88.1 %
Carbon dioxide (CO2)
Environmental impact of carbon dioxide
• The most important gas contributing to thegreenhouse effect, which can lead in turn toglobal warming.
• According to the UN's panel on climate change,"the balance of evidence suggests a discerniblehuman influence on global climate".
Emissions of carbon dioxide from human activitiesderive largely from burning fossil fuels. Petroleumactivities account for about 27 per cent ofNorwegian emissions of this gas (see figure 3), andthis percentage is expected to increase over time.The other major sources in Norway are road trafficand other mobile sources, heating, and variousindustrial processes.
As figure 4 shows, the bulk of carbon dioxideemissions by the petroleum sector derive fromoffshore installations. Other sources include gasreceiving terminals on land and – indirectly –nmVOC emissions (process emissions). Virtuallyall taxed carbon dioxide emissions from instal-lations on the NCS derive from gas combustion inturbines and through flaring, and burning dieseloil (figure 5). Natural gas releases the lowestvolume of carbon dioxide per unit of energy ofany fossil fuel.
Total carbon dioxide emissions from the sectorhave grown year by year, mainly as a result of
increased activity. The trend in recent years andforecasts for the immediate future are shown infigure 6. Higher overall emissions do not meanthere have been no environmental gains. However,improved energy utilisation and reduced flaringhave not been enough to offset the rise in energyconsumption to which increased activity hascontributed.
One indication that operations have becomemore efficient is that carbon dioxide emissions perunit of oil equivalent produced declined by 24 percent from 1990 to 2001 (see figure 7).
This can partly be attributed to:• general improvements in technology• measures to reduce emissions, partly prompted
by the carbon tax imposed in 1991.
However, other factors – including a growingnumber of producing fields and the fact that keyfields have reached a mature phase – could boostemissions.
Generally speaking, emissions from producinga unit of oil or gas vary both between fields and overa field's producing life. Reservoir conditions andtransport distances to the gas market are factorswhich produce variations between fields in energydemand and consequently in emissions. Varyingemissions over a field's producing life reflect therising water cut (proportion of water in the well-stream) as production continues. Since energyrequirements for processing are largely determinedby the total volume of water, oil and gas in the well-
Vegtrafikk 22 % Fyring 19 %
Andre industri-prosesser 18 %
Kysttrafikkog fiske 5 %
Andre mobilekilder 9 %
Petroleums-virksomheten 27 %
Figure 3 Sources of Norwegian carbon dioxide emissions,2000. (Source: Statistics Norway/SFT)
Heating 19 %
Other industrialprocesses 18 %
Coastal traffic andfishing 5 %
Road traffic 22 %
Petroleum operations 27 %
Other mobilesources 9 %

17
1
stream, emissions per unit produced will rise as afield ages. This is one reason for a slight increasein Norwegian emissions per unit produced inrecent years.
The trend on the NCS towards more maturefields and the northward shift of activities encou-rage higher emissions per unit produced.Treatment and transport of produced gas requiremore energy than liquids production, and theproportion of produced gas in total Norwegianoutput is steadily rising. This makes an importantcontribution to the development of the "carbondioxide emissions per unit produced" indicator.Figures from the NPD for 2001 show a slightincrease in overall carbon dioxide emissions bythe offshore sector from 2000 to 2001.
Some comparisons of emissions per unit of oiland gas produced in various countries have beenmade to gain some impression of how much green-house gas is released from activities on the NCS andin comparable regions elsewhere. It must beemphasised that considerable uncertainties attachto such comparative figures.
A study by the Sintef research foundationcompared greenhouse gases on the NCS withsimilar emissions in other countries, includingRussia, the Netherlands, Britain and the USA.Russian carbon dioxide emissions from gas produc-tion were not available.
Activities on the NCS came out well in the study.An oil or gas unit produced on the UK continentalshelf - perhaps the area most directly comparable toNorway's offshore sector – generates more thanthree times the emissions of a similar unit on theNCS, for example.
Measures to reduce carbon dioxide emissions
The development of combined cycle solutions off-shore, recycling of flare gas and injection of carbondioxide from produced gas on Sleipner West help toshow that Norway's offshore sector is welladvanced in applying environmentally efficient tech-nology.
Combined cycle systems, currently operationalon Oseberg, Snorre and Eldfisk, involve using thewaste heat in gas turbine exhaust fumes to producesteam for generating additional electricity. Theseunits are unique in offshore terms.
The carbon dioxide content in Sleipner Westoutput must be reduced in order to meet salesspecifications for the natural gas. This field is thefirst on which carbon dioxide separated from thewellstream has been injected in a sub-surfaceformation. That in turn eliminates about one milliontonnes of carbon dioxide emissions per year.
Injecting carbon dioxide to improve recovery
Carbon dioxide can to some extent replace orsupplement injection of natural gas and water tomaintain pressure in oil and condensate (light oil)reservoirs and thereby improve recovery. Thelargest potential for using carbon dioxide in this wayis expected to be in tertiary production after water-flooding on the major oil fields.
This potential has two aspects. One is that partof the gas resources injected will be lost because
0
2
4
6
8
10
12
14
Mill
. to
nn
1990 1994 1998 2002 2006 2010 2014
Figure 6 Total emissions of carbon dioxide from theNorwegian petroleum sector.
(Source: MPE/NPD)
Mill
to
nn
es
Brenngass 82 %
Fakkel 13 %
Diesel 5 %
Figure 5 Taxed carbon dioxide emissions from oil and gas production by source. (Source: NPD)
Flaring 13 %
Diesel 5 %
Fuel gas 82 %

18
1
they cannot be produced again. The NPD estimatesthat this loss averages about 20 per cent of theinjected gas. Some 40-50 bn scm of gas annually isdue to be injected for pressure support in 2000-2005.
Second, some of the residual oil will bedissolved by injected carbon dioxide during tertiaryproduction after waterflooding. Carbon dioxide canalso drain areas unaffected by the water, such as thetop of the reservoir. Injecting carbon dioxide toimprove oil recovery has been practised in the USAfor many years.
To follow up one of the measures proposed inthe final report on Common environment – common
commitment from the second Miljøsok phase, theauthorities have established an action team withrepresentatives from a number of the companies,the Norwegian Oil Industry Association (OLF) andthe NPD to clarify the potential for using carbondioxide to improve oil recovery. Initiated in thespring of 2001, this study is due to be competed inthe autumn of 2002.
The work will be carried out in three phases:• selection of fields for preliminary evaluation• preliminary evaluation of the potential in the
selected fields using classic methods• full-scale compositional simulation on the basis
of results from the preliminary evaluation.
Work will also cover the cost implications ofmodifications required to existing facilities. It hasbeen decided to study Gullfaks, Ekofisk, Brage andVigdis/Borg/Snorre North/Tordis. This provides amix of large and small fields and of sandstone andchalk reservoirs.
Technology decided for use in reducingcarbon dioxide emissions:
• carbon dioxide separation from the SleipnerWest wellstream and subsequent depositionbelow ground
• utilising exhaust heat in the process system• more efficient energy generation, such as the
use of combined heat and power on Oseberg,Snorre and Eldfisk
• optimal dimensioning of pipelines• replacing old installations, as on Ekofisk• making greater use of more efficient gas
engines in place of gas turbines• optimising new fields for energy use and
utilisation• supplying electricity from land to Troll A• recovering flare gas• transferring power between Snorre A and B.
0,0
20,0
40,0
60,0
1991 1993 1995 1997 1999 2001kg C
O2
per
net
to p
rod
use
rt S
m3
o.e.
Figure 7 Emissions of CO2 per unit produced.(Source: NPD)
Kg
CO
2p
er n
et p
rod
uce
d s
cm o
e 60.0
40.0
20.0
0.0

19
1
Environmental impact of nitrogen oxides
• Harm to fish and animal life through acidifica-tion of river systems and soils.
• Damage to buildings, stone and metals fromacid precipitation.
• Eutrophication causing changes to the compo-sition of the ecosystem.
• Damage to health, crops and building from theformation of ground-level ozone when nitrogenoxides and nmVOC are exposed to sunlight.
Nitrogen oxides are mainly formed by burning fossil
fuels. Emission volumes depend on both combus-
tion technology and fuel consumption. Gas turbines
generate lower nitrogen oxide emissions than
diesel engines, for instance.
Mobile sources account for the bulk of Norwegiannitrogen oxide emissions (see figure 8). The petro-leum sector contributes 23 per cent. As withcarbon dioxide, turbines, flaring and dieselengines on installations represent major offshoresources (see figure 9). Some emissions will alsorelate to exploration and gas receiving terminalson land.
As figure 10 shows, emissions of nitrogenoxides from the sector have grown steadily since
1990. This is primarity because increased activityhas boosted energy consumption and therebyvolumes released. The change in emissions perunit produced provides an indication of offshoreefficiency gains. Emissions per unit produced areshown in figure 11.
Carbon dioxide and nitrogen oxide emissionsare closely linked, since both derive from the sameprincipal sources. The only exception is lownitrogen oxide burner technology for gas turbines,which can cut the release of these components byup to 90 per cent without affecting carbon dioxideemissions. In some cases, the amount of carbondioxide given off can actually rise with this techno-logy.
Emissions per unit produced of oil equivalentprovide an appropriate way to compare emissionson the NCS with those from similar areas else-where. It must be emphasised that, for manyreasons, considerable uncertainty attaches to suchcross-national comparisons. A study for Miljøsokindicates that emissions of nitrogen oxides on theNCS are lower than in countries which offer anappropriate comparison.
Norway signed a new international agreement(the Gothenburg protocol) in 1999. This is dedi-cated in part to regulating nitrogen oxide emissions.Possible measures for reducing such emissions arelisted below, but it is too early to say what impactthis agreement will have on the petroleum sector.
Nitrogen oxides (NOx)
Andre mobile kilder 7 %
Kysttrafikk ogfiske 36 %
Andre industri-prosesser 5 %
Fyring 7%
Vegtrafikk 22%
Petroleums-virksomheten 23 % Brenngass 66 %
Fakkel 16 %
Diesel 18 %
Figure 8 Sources of nitrogen oxide emissions in Norway, 2000. (Source : Statistics Norway)
Figure 9 Nitrogen oxide emissions from oil and gas production by source, 2001.
(Source: NPD)
Other industrial processes 5 %
Coastal traffic and fishing 36 %
Other mobile sources 7 %
Flaring 16 %
Diesel 18 %
Fuel gas 66 %
Heating 7 %
Road traffic 22 %
Petroleum operations 23 %

20
1
Measures to reduce nitrogen oxideemissions:
• installing low nitrogen oxide burners in new gasturbines, with the potential to reduce emissionsby up to 90 per cent
• the same measures for reducing carbon dioxideemissions, apart from separation
• catalytic cleaning• steam injection in the combustion chamber.
The NPD established an action team in the autumnof 2000, with participation from the industry, toundertake a technical-economic impact assessmentof retrofitting low nitrogen oxide burners on gasturbines and selective catalytic reduction (SCR) ongas engines. A final report was presented in theautumn of 2001. Low nitrogen oxide burners areregarded today as the most relevant way to achievesignificant emission reductions from Norwegianoffshore oil and gas activities.
Compared with earlier analyses, this study hasprovided a more sophisticated and diversifiedpicture of the cost of measures. Costs associatedwith increased downtime on installations as a conse-quence of retrofitting low nitrogen oxide burnersare a "new" and dominant consideration. Turbineswith such burners also need more frequent andextensive maintenance than traditional machines. Ina life-cycle perspective, this adds up to a substantialadditional expenditure.
The study shows that the general level of costsfor retrofitting low nitrogen oxide burners issubstantially higher than was previously estimated.And the environmental benefit of retrofitting suchunits will vary from turbine to turbine. Generallyspeaking, burners on machines with high energyefficiency will yield a substantial environmentalgain. Installing them on turbines running at partialload will increase carbon dioxide emissions whilefailing to achieve the same nitrogen oxide reduc-tions as full-load operation.
1990 1994 1998 2002 2006 2010 20140,0
20,0
40,0
60,0
tuse
n t
on
n
0,000
0,050
0,100
0,150
0,200
0,250
kg
NO
x p
er
ne
tto
p
rod
use
rt S
m3
o.e
.
1991 1993 1995 1997 1999 2001
Figure 10 Emissions of nitrogen oxides from the Norwegianpetroleum sector. (Source: MPE/NPD)
Figure 11 Emissions of nitrogen oxides per unit produced.(Source: MPE/NPD)
Tho
usa
nd
to
nn
es
60
40
20
0
Kg
NO
xp
er n
et
scm
oe
pro
du
ced
0.250
0.200
0.150
0.100
0.050
0.000
21
1
Environmental effects of nmVOC
• Formation of ground-level ozone may damagehuman health as well as crops and buildings.
• Direct exposure may damage the respiratorysystem.
• Contributes indirectly to the greenhouse effectbecause carbon dioxide and ozone form whennmVOC reacts with air in the atmosphere.
NmVOC is a general term for volatile organic
compounds other than methane which vaporise
from crude oil and other substances.
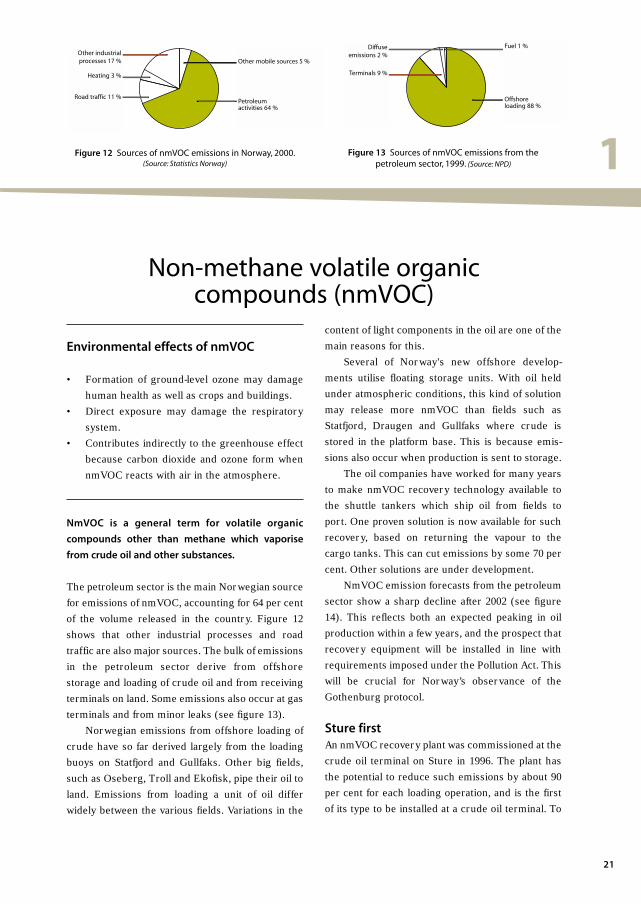
The petroleum sector is the main Norwegian sourcefor emissions of nmVOC, accounting for 64 per centof the volume released in the country. Figure 12shows that other industrial processes and roadtraffic are also major sources. The bulk of emissionsin the petroleum sector derive from offshorestorage and loading of crude oil and from receivingterminals on land. Some emissions also occur at gasterminals and from minor leaks (see figure 13).
Norwegian emissions from offshore loading ofcrude have so far derived largely from the loadingbuoys on Statfjord and Gullfaks. Other big fields,such as Oseberg, Troll and Ekofisk, pipe their oil toland. Emissions from loading a unit of oil differwidely between the various fields. Variations in the
content of light components in the oil are one of themain reasons for this.
Several of Norway's new offshore develop-ments utilise floating storage units. With oil heldunder atmospheric conditions, this kind of solutionmay release more nmVOC than fields such asStatfjord, Draugen and Gullfaks where crude isstored in the platform base. This is because emis-sions also occur when production is sent to storage.
The oil companies have worked for many yearsto make nmVOC recovery technology available tothe shuttle tankers which ship oil from fields toport. One proven solution is now available for suchrecovery, based on returning the vapour to thecargo tanks. This can cut emissions by some 70 percent. Other solutions are under development.
NmVOC emission forecasts from the petroleumsector show a sharp decline after 2002 (see figure14). This reflects both an expected peaking in oilproduction within a few years, and the prospect thatrecovery equipment will be installed in line withrequirements imposed under the Pollution Act. Thiswill be crucial for Norway’s observance of theGothenburg protocol.
Sture firstAn nmVOC recovery plant was commissioned at thecrude oil terminal on Sture in 1996. The plant hasthe potential to reduce such emissions by about 90per cent for each loading operation, and is the firstof its type to be installed at a crude oil terminal. To
Non-methane volatile organic compounds (nmVOC)
Andre industri-prosesser 17 %
Fyring 3 %
Vegtrafikk 11 % Petroleums-virksomheten 64 %
Andre mobile kilder 5 %
Bøyelasting sokkelen 88 %
Terminal 9 %
Diffuse utslipp 2 %
Brensel 1 %
Figure 12 Sources of nmVOC emissions in Norway, 2000.(Source: Statistics Norway)
Figure 13 Sources of nmVOC emissions from the petroleum sector, 1999. (Source: NPD)
Other industrialprocesses 17 %
Heating 3 %
Road traffic 11 %
Other mobile sources 5 %
Petroleum activities 64 %
Diffuse emissions 2 %
Terminals 9 %
Fuel 1 %
Offshoreloading 88 %

22
1
use it, tankers must be equipped with the appro-priate connectors.
Recovery actually achieved in the first year ofoperation was just under 40 per cent, since only alimited number of the tankers had the necessaryequipment. To encourage installation of the latter,considerable reductions in port fees are beingoffered to ships with the relevant connectors. Mostvessels now have recovery facilities, and all carriersmust have installed nmVOC recovery systems by 1January 2003. Technology problems and hot oilmean that only 50 per cent of emissions were reco-vered in 2001. Studies are currently under way toupgrade the plant to meet new operating conditions.The aim is a recovery factor of 80-90 per cent.
International comparisons indicate that emis-
sions of nmVOC per volume of oil and gas producedare higher on the NCS than in other countries. Thehigh proportion of offshore loading off Norwaycould be one explanation.
Measures to reduce nmVOC emissions:
• recovery of nmVOC at Sture• recovery of nmVOC on the NCS:
- return to the oil cargo- measures in process plants on the
installations- recovery relating to storage- new concepts for recovery during loading- condensing for use as fuel on the shuttle
tanker.
0
50
100
150
200
250
300
1000
to
nn
VO
C
1990 1994 1998 2002 2006 2010 2014 1991 1993 1995 1997 1999 20010
0,4
0,8
1,2
kg
Figure 14 Total emissions of nmVOC from the Norwegian petroleum sector. (Source: MPE/NPD)
Figure 15 NmVOC emissions per produced unit.(Source: MPE/NPD)
Tho
usa
nd
to
nn
es
Kg
1.2
0.8
0.4
0

23
1
Chemicals, oil and other organic compounds
Environmental effects of discharging oiland other organic compounds:
• Spills/acute discharges can harm fish, marinemammals, seabirds and shore zones.
• Considerable uncertainty exists about theenvironmental consequences of operationaldischarges. No environmental damage has yetbeen proven. Considerable research is underway, particularly into long-term effects.
• Great uncertainty also exists about the long-term effects of dissolved organic compounds,such as polycyclic aromatic hydrocarbons(PAH) and alkyl phenols. Considerable re-search is again being conducted in this area.
Environmental effects of dischargingchemicals:
• Discharges embrace a variety of substanceswith very different potential effects on the envi-ronment.
• Most of the chemicals used (more than 99 percent) are assumed to have little or no environ-mental impact.
• Little is still known about the possible long-termeffects of chemical discharges.
• Several of the chemicals have some local toxiceffect. Studies show they are diluted in thewater column, and thereby do not represent asignificant acute environmental hazard beyondthe immediate vicinity of the discharge.
• Some of the chemical discharges could haveextremely serious environmental conse-quences, including hormonal disturbances,and be bio-accumulative.
Oil and other organic compoundsDischarges from Norwegian petroleum activitiesare estimated to account for two per cent of the total
oil entering the North Sea. The main sources areshipping and the mainland, via rivers. Oildischarges from the petroleum sector derive almostentirely from ordinary operations, although acutespills do occur.
Produced water consists primarily of formationwater which has been in contact with the oil in thereservoir, and accordingly contains a number oforganic compounds. The most important in anenvironmental perspective are PAH and alkylphenols.
ChemicalsThis is a generic term for all additives and othersubstances used in drilling and well operations andin oil and gas production. An efficient oil and gasbusiness would be impossible without chemicals.
Substantial efforts are therefore being made todevelop substances which cause the least possibleharm to the environment when used. The Charmmodel, developed by the nations involved in Ospar,is applied to ensure that environmental considera-tions are taken into account when selectingchemicals for offshore use.
In considering the environmental impact ofchemical discharges, it is important to distinguishbetween:• largely harmless and more harmful chemicals• the quantities used and discharged• where discharges are made and under what
conditions, and conditions in the recipient (water column).
More than 99 per cent of the chemicals used inNorwegian petroleum activities are thought to havelittle or no environmental impact. A large proportionexist naturally in seawater. The remainder arechemicals which have an impact on the environ-ment or whose potential effects have not been suffi-ciently well documented.
Forty-one per cent of the chemicals used weredischarged to the sea in 2001, including the water in

24
1
which these substances were dissolved. The figurefor 1989 was 64 per cent (excluding the water).Chemicals not discharged were dissolved in the oil,deposited below ground or treated as waste.
Drilling and well operationsAs figure 16 shows, drilling and well operationsclearly rank as the biggest source of chemicaldischarges on the NCS. Year-on-year changes in theoverall figure for such discharges therefore relatelargely to variations in the number of wells drilled.
Discharging oily drill cuttings has been prohi-bited on the NCS since 1991. As figure 18 shows,this ban has contributed to a significant reduction inoil discharges from operations compared with thelevel if oily cuttings could still be discharged.
Combined with increasing injection of cuttingsbelow ground, new drilling methods and technologyhave cut discharges per metre drilled in recentyears (see figure 19). Since water-based drillingfluids use more chemicals, the switch to this type offluid following the ban on discharging oil-basedmud has pulled in the opposite direction. As men-tioned above, cuttings contaminated with oil-basedmud are no longer discharged on the NCS.Recycling, underground injection and disposal onland are alternative ways of avoiding dischargesfrom drilling.
Produced waterWater produced together with oil and gas is themain source of oil discharges to the sea from dailyoperations (see figure 20). Even if such water iscarefully treated before discharge, it still containsoil residues and dissolved organic compounds.
The average concentration of oil in producedwater on the NCS has been declining slightly. Underthe Ospar convention, the oil content in waterdischarged to the sea must not exceed 40 g/cu.m.In 2001, Ospar approved recommendations that thisceiling should be reduced to 30 g/cu.m from 2006,and that total oil discharges in produced water bymember countries should be reduced by 15 per centin the same year compared with the 2000 level. Theannual average for Norwegian installations in 2000was about 25 g/cu.m. This concentration has beenfairly stable since 1990 (see figure 21).
Several of Norway's largest fields have nowreached such a mature phase that their water cut ishigher than before, boosting the volume ofproduced water and thereby oil discharges.Injecting produced water below ground has startedon a growing number of Norwegian fields (seefigure 22). Just under 13 per cent of all producedwater was injected in 2001.
Discharges of production and injection chemi-cals have risen in recent years, primarily reflectingincreased use of subsea templates and more waterinjection. Such operations normally depend onchemicals. However, no clear trend can bediscerned in the content of production chemicals inproduced water (see figure 23).
Acute spillsHarm caused to the natural environment by oil spillsdepends on various factors which are more impor-tant than the size of the spill. Spill site, season, windstrength, current and the effectiveness of emer-gency response are crucial for the scope of anyharm. Most serious Norwegian oil spills have
Borekjemikalier 90 %
Gassbehandlings-kjemikalier 5 %
Prod. Kjemikalier 4 %
Andre kjemikalier 1 %
Figure 16 Chemical discharges on the NCS by activity, 2000.(Source: SFT)
Gas treatment chemicals 5 %
Production chemicals 4 %
Other chemicals 1 %
Drilling chemicals 90 %

25
1
involved ships close to the coast. Norway's petro-leum sector has not been responsible for anymajor oil spills reaching the shore. Extendingof fshore activities towards coastal and moreenvironmentally-sensitive areas will increase therisk of serious harm from oil spills caused byoperations on offshore installations or loadinginto tankers on the field.
A relatively large number of oil spills haveoccurred on Norwegian offshore installations (seefigure 24). As mentioned above, however, the totalvolume of oil involved in these spills is extremelylimited compared with other sources.
Zero discharge strategy at seaThe "zero discharge" concept does not mean thatall types of discharge will cease, and the term canconsequently be somewhat misleading. It refersto a strategy for the continuous reduction ofenvironmentally-harmful emissions towards alevel which equals zero for all practical purposes.Any harm to the environment at this level willdepend on the content of potentially harmfulchemicals as well as the time and place of thedischarge. The degree of harm will depend on thecontent of environmentally-harmful compounds andon field-specific conditions for discharge andrecipient.
The general rule for new stand-alone develop-ments will be zero discharges to the sea. It isimportant to carry out an overall evaluation ofdischarges to the sea, emissions to the air andenergy conservation before final technologicalsolutions are chosen.
This strategy will also be pursued for fields in
production and for smaller developments tied backto existing installations. Local conditions on thevarious installations will affect which solutions areappropriate in such cases. The aim is for all fields toachieve zero harmful discharges by 2005.
New technology is important in successfullyimplementing the zero discharge strategy. Solutionsfor separating or blocking water before it reachesthe installation will be key elements in achievingthis goal. Separation can take place either downholeor on the seabed. In addition to reducing dischargesto the sea, such technology could have favourableeffects on emissions to the air (because energyconsumption is reduced) and on oil production(because the water is used for pressure support toimprove oil recovery).
A pioneer on TrollTroll Pilot is a subsea unit designed to separateproduced water from the rest of the wellstream inone of the flowlines running to the Troll C platform.The water is then injected back into the reservoir,cutting both transport of produced water anddischarges of oily water.
Such benefits can also be achieved by downholeseparation, which has so far only been tested infields on land.
Where appropriate, returning produced waterbelow ground is another method which could helpto reduce discharges. Such technology is usedtoday on several fields, and will be implemented onseveral recently-approved developments. It will beparticularly interesting on fields which need waterinjection for pressure support.
Injecting produced water when pressure
0
40 000
80 000
120 000
160 000
200 000
1990 1992 1994 1996 1998 2000
tonn
0
500
1 000
1 500
2 000
2 500
3 000
3 500
1990 1992 1994 1996 1998 2000
Oljeh.borekaks Prod.vann FortrengningSøl Totale oljeutslipp
ton
n
Figure 17 Total chemicals discharged from Norwegian petroleum activities. (Source: SFT)
Figure 18 Total oil discharges by source.(Source: SFT)
Oily cuttingsProduced waterDisplacementSpillsTotal discharges
Ton
nes
Ton
nes

26
1
support is not required will boost energy consump-tion, and thereby emissions to the air. In such cases,an overall evaluation can determine whether themethod is appropriate. Trials have been carried outon other fields with shutting off aquifers downhole,which could also reduce the water cut.
Technologies for eliminating or reducingdischarges of environmentally-harmfulcompounds in produced water
• full or partial injection below ground after
topside separation• mechanical or chemical shut-off of aquifers in
wells• separation downhole or on the seabed, followed
by injection back below ground.
Technologies to avoid discharges of drilling fluids
• recycling• collection and injection below ground• collection and disposal on land.

27
1Produsert vann 89 %
Ballast- og drenasjevann 10 %
Akutte oljeutslipp 1 %
0
200
400
600
800
1990 1992 1994 1996 1998 20000
5
10
15
20
25
30 tonn
antall
ton
n
anta
ll
1990 1992 1994 1996 1998 20000
40
80
120
160
200
g/m
3 (g
/m3 )
0,0
10,0
20,0
30,0
1990 1992 1994 1996 1998 2000
Ton
n p
er b
ore
t m
eter
0,00
0,10
0,20
0,30
0,40
0,50
1990 1992 1994 1996 1998 2000
Figure 19 Discharges of drilling chemicals per metre drilled.(Source: SFT/NPD)
Figure 21 Discharges of oil per cubic metre of produced water. (Source: SFT)
Figure 23 Content of production, injection and pipeline chemicals in produced water. (Source: SFT)
Figure 24 Acute oil spills over one tonne.(Source: SFT)
0
50
100
150
200
250
1990 1998 2006 2014 2022 2030
mill
m3
Produsert vann
Utslipp produsert vann
Figure 22 Volumes of produced water and produced waterdischarged, historical and forecast. (Source: NPD)
Figure 20 Oil discharges on the NCS by activity, 2000.(Source: SFT)
Ton
nes
Mill
cu
.m
Nu
mb
er
G/c
u.m
G
/cu
.m
Tonnes
Number
Produced water
Produced water discharged
Acute discharges 1 %
Produced water 89 %
Ballast and drainage water 10 %
30
20
10
0
Ton
nes
/ m
etre
dri
lled
0.50
0.40
0.30
0.20
0.10
0.00

Section 2
Oil and fish – common sea
29
2Introduction
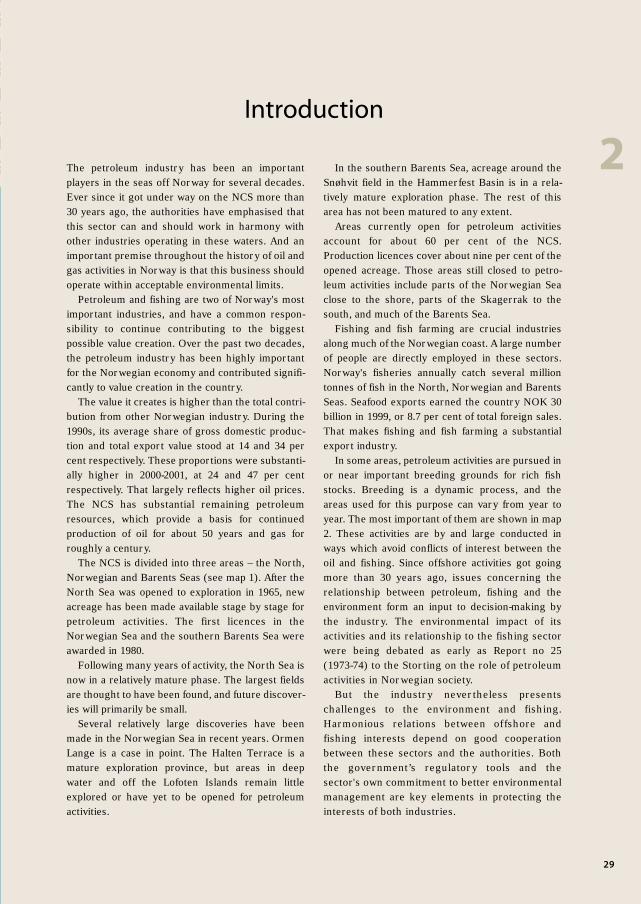
The petroleum industry has been an importantplayers in the seas off Norway for several decades.Ever since it got under way on the NCS more than30 years ago, the authorities have emphasised thatthis sector can and should work in harmony withother industries operating in these waters. And animportant premise throughout the history of oil andgas activities in Norway is that this business shouldoperate within acceptable environmental limits.
Petroleum and fishing are two of Norway's mostimportant industries, and have a common respon-sibility to continue contributing to the biggestpossible value creation. Over the past two decades,the petroleum industry has been highly importantfor the Norwegian economy and contributed signifi-cantly to value creation in the country.
The value it creates is higher than the total contri-bution from other Norwegian industry. During the1990s, its average share of gross domestic produc-tion and total export value stood at 14 and 34 percent respectively. These proportions were substanti-ally higher in 2000-2001, at 24 and 47 per centrespectively. That largely reflects higher oil prices.The NCS has substantial remaining petroleumresources, which provide a basis for continuedproduction of oil for about 50 years and gas forroughly a century.
The NCS is divided into three areas – the North,Norwegian and Barents Seas (see map 1). After theNorth Sea was opened to exploration in 1965, newacreage has been made available stage by stage forpetroleum activities. The first licences in theNorwegian Sea and the southern Barents Sea wereawarded in 1980.
Following many years of activity, the North Sea isnow in a relatively mature phase. The largest fieldsare thought to have been found, and future discover-ies will primarily be small.
Several relatively large discoveries have beenmade in the Norwegian Sea in recent years. OrmenLange is a case in point. The Halten Terrace is amature exploration province, but areas in deepwater and off the Lofoten Islands remain littleexplored or have yet to be opened for petroleumactivities.
In the southern Barents Sea, acreage around theSnøhvit field in the Hammerfest Basin is in a rela-tively mature exploration phase. The rest of thisarea has not been matured to any extent.
Areas currently open for petroleum activitiesaccount for about 60 per cent of the NCS.Production licences cover about nine per cent of theopened acreage. Those areas still closed to petro-leum activities include parts of the Norwegian Seaclose to the shore, parts of the Skagerrak to thesouth, and much of the Barents Sea.
Fishing and fish farming are crucial industriesalong much of the Norwegian coast. A large numberof people are directly employed in these sectors.Norway's fisheries annually catch several milliontonnes of fish in the North, Norwegian and BarentsSeas. Seafood exports earned the country NOK 30billion in 1999, or 8.7 per cent of total foreign sales.That makes fishing and fish farming a substantialexport industry.
In some areas, petroleum activities are pursued inor near important breeding grounds for rich fishstocks. Breeding is a dynamic process, and theareas used for this purpose can vary from year toyear. The most important of them are shown in map2. These activities are by and large conducted inways which avoid conflicts of interest between theoil and fishing. Since offshore activities got goingmore than 30 years ago, issues concerning therelationship between petroleum, fishing and theenvironment form an input to decision-making bythe industry. The environmental impact of itsactivities and its relationship to the fishing sectorwere being debated as early as Report no 25(1973-74) to the Storting on the role of petroleumactivities in Norwegian society.
But the industry nevertheless presentschallenges to the environment and fishing.Harmonious relations between of fshore andfishing interests depend on good cooperationbetween these sectors and the authorities. Boththe government’s regulatory tools and thesector's own commitment to better environmentalmanagement are key elements in protecting theinterests of both industries.

30
2
Opened for exploration
Opened on special terms
Can be opened on special terms
Not open for exploration
Awarded area
Seismic area
k
NORTH SEA
NORWEGIAN SEA
RIDGEBARENTS SEA
Ocea
nic cr
ust
Bedrock
Bedroc
k
Map 1 Petroleum activities on the NCS.
Map 2 Breeding grounds for fish along the Norwegian coast.

31
2
Overlapping areas
Both industries are naturally dependent on beingphysically present where their resource bases are tobe found. Balancing the interests of both sides inaccessing areas can be relevant issues in everyphase of petroleum activities.
This is particularly crucial when announcingblocks on offer for exploration drilling, definingsafety zones around oil installations, laying pipelinesand cables, and access for fish after petroleum activi-ties have ceased.
Seismic surveying
Extensive research has been conducted by thepetroleum industry into the environmental effectsof seismic surveys over a number of years, inclu-ding studies by Norway's Institute of MarineResearch. This work has concluded that no directphysical damage can be identified to fish, fry orlarvae from seismic data gathering. However,surveys could frighten marine life to a smallextent and thereby reduce catches.
Substantial technological progress has beenmade in the quality of seismic information and theability to handle large volumes of such data. Thismakes it possible to improve the quality of surveyssubstantially ahead of exploration drilling, which inturn increases the likelihood of making a discovery
and thereby reduces the need for wells. Thatdevelopment represents an environmental gain initself.
Discharges to the sea
Discharges to the sea from petroleum activities andtheir potential effects on living marine resourcesalso play an important role in relations between thisindustry and fishing. The principal components insuch discharges are oil, other organic compoundsand chemicals. They largely derive from regularactivities, but acute spills and discharges from drill-ing can also occur. Norway's oil and gas businessaccounts for about two per cent of the oil dischargedto the North Sea, with shipping and run-off fromland via rivers as the main sources.
About 85 per cent of the oil discharged by thepetroleum sector is contained in produced water,which primarily comes up from the formation inthe wellstream. The environmental impact of suchwater relates primarily to organic componentssuch as PAH and alkyl phenols, heavy metals andsome chemicals.
However, the dispersion and effects of producedwater are difficult to track in the water columnbecause concentrations of substances are small,dilution is high and no plants or animals remain longwithin the direct area of influence of the discharges.Just under 13 per cent of produced water on the
Challenges

32
2
NCS is injected back below ground, and forecastsindicate that this will rise to about a third when waterproduction from offshore wells peaks around2010.
Various chemicals are necessary as additivesand utilities in petroleum activities, with drillingand well activities accounting for most of theconsumption and discharges. Dischargingsubstances which might cause environmentalharm is normally banned today, with the environ-mental impact of discharges from ordinary drill-ing activities both minor and confined to the areaimmediately around a well.
The operators are working to reduce theimpact of such discharges even further. However,a number of chemicals used in petroleum activi-ties have some toxic effect locally, while a smallproportion of the substances discharged couldhave disruptive effects on hormones and be bio-accumulative. About 99 per cent of the chemicalsused are thought to have little or no environ-mental impact, but knowledge about possiblelong-term effects remains inadequate.
At present, the probability of acute spills frompetroleum activities is very low. No large acutespills have occurred since the Bravo incident in1977. Potential sources of accidental dischargesfrom the petroleum sector will be blowouts, pipe-lines and shuttle tankers.
Petroleum activities close to the coastand in northern areas
Challenges relating to the marine environmentwill differ between the North, Norwegian and
Barents Seas. And new challenges have arisennow that the petroleum sector in the North Seahas entered a mature phase, and activities aremoving steadily further north and closer to theshore.
Food chains in the environmentally-sensitivenorthern waters are fewer and shorter. Longperiods of darkness and low temperatures meanthat degradability and other environmental effectsof oil and chemical discharges differ from thosefound further south. Warmblooded marine animalscontain significantly more fat, which makes themmore likely to accumulate many of the mostproblematic environmental toxins.
An important challenge for the future will beto learn more about activities close to the shoreand in the far north, including year-round activityoff the Lofoten Islands.
It is important to develop a system whichallows available knowledge to be applied in anoptimal manner when carrying out impact assess-ments and risk analyses.
Better tools are needed for evaluating thebiological impact of environmental toxins and forimpact assessments and risk analyses.
Petroleum activities in these waters also posea substantial challenge for developing technologyto minimise their discharges to the sea.

33
2Building on established instruments will beimportant for becoming better equipped to meetfuture challenges in the relations between thepetroleum and fishing industries. Impact assess-ments and discharge permits are key measures.Activities in more environmentally-sensitivewaters also require an increased commitment toresearch and technology development.
Impact assessments
To ensure that petroleum activities are harmonisedwith other important social interests, weight hasbeen given from the start to preparing detailedstudies and analyses on the impact this industrycould have on such aspects as the marine environ-ment and fishing. The oil and gas sector was one ofthe first in Norway to develop a system for suchassessments.
The Petroleum Act requires that impact assess-ments are carried out before an area is opened,developing a specific field and the cessation of activi-ties. In addition, regional impact assessments arecarried out to provide an overall picture of theeffects on the environment and other industries in aregion.
Consultation with affected industries and environ-mental organisations forms an important part ofthe impact assessment process, and theircomments provide a natural input to decision-making. The impact assessment system has helpedto lay the basis for pursuing oil and gas activities inthe same waters as industries such as fishingwithout generating major conflicts of interest.
Impact assessments when opening an area
Before production licences can be awarded, anarea must be opened for petroleum activities. Inthat context, the authorities carry out an impactassessment, which includes an evaluation of the
possible environmental, economic and social effectsof activities on adjoining industries such as fishing.
Local authorities and key interest organisationsconsidered to have an interest must be consultedon the question of opening new areas before it isput to the Storting.
Impact assessments for developments and
cessation of activities
The Petroleum Act also requires the operator, onbehalf of the licensees, to submit an assessmentas part of its plan for development and operation(PDO) and plan for installation and operation(PIO) which covers the impact of producing therelevant discovery on nature, the environmentand the fisheries.
This assessment must outline possible envir-onmental effects of anticipated discharges and theimpact on other industries, including fishing. Asystematic cost/benefit analysis of possiblemitigatory measures is also required.
The impact assessment is used as a toolthroughout the development period to ensure thatenvironmental considerations are taken intoaccount. Both the programme for the assessmentand the completed work are subject to publicconsultation.
According to the Petroleum Act, a similarassessment must also be carried out as part of acessation plan.
Regional impact assessments
In order to obtain the best possible overview ofenvironmental impacts, petroleum activities alsoneed to be assessed across wider areas. This isdone through a regional impact assessmentprepared by the companies, which will also provideimportant background information for impactassessments relating to specific developments.
Such assessments have been done for theNorth Sea in 1999. A regional impact assessment
Instruments and measures

34
2
was also carried out for the Norwegian Sea in 1998,but activities on this part of the NCS have changedsubstantially since then. As a result, the NorwegianSea regional impact assessment is due to beupdated. Once that has been done, such assess-ments will cover the whole NCS from 56°N to69°N.
The ecosystem in northern sea areas is thoughtto be particularly vulnerable to both operational andaccidental discharges, and more knowledge aboutactivities in these regions is required.
The Barents Sea has some of the world'srichest stocks of fish, seabirds and marinemammals, and the authorities want to take acautious approach to ensure that environmentalconditions there are taken sufficiently into account.As a result, the MPE wants to initiate an impactassessment covering the area from northwardsfrom the Lofoten Islands.
A number of impact assessments have beendone for petroleum activities in the Barents Sea,which will form an important basis for work on theregional impact assessment. Together with theimpact assessments for fishing and marine trans-port, this will form part of a unified managementplan for the Barents Sea.
Requirements for seismic surveys andexploration drilling
Once an area has been opened to petroleum activi-ties, regional seismic surveys are conducted onbehalf of the authorities. These form part of theinput available to companies when submitting
applications in offshore licensing rounds. After aproduction licence has been awarded, the licenseescarry out more detailed seismic surveys ahead ofexploration drilling.
Since the 15th licensing round in 1996, theauthorities have requested applicants in the accom-panying documentation to take special account offishing activities and stocks of living marineresources when planning drilling activities.
A number of block-specific conditions relatingto the environment and fishing have also been setin the 17th round in 2001. Tight restrictions havebeen imposed on seismic surveying out of concernfor seabirds and fish stocks. Very strict curbs arealso set on discharges of produced water in bothexploration and production phases, and limits havebeen put on the number of exploration wells whichcan be drilled simultaneously.
Work on preparing and implementing seismicsurveys is pursued in close cooperation with thefisheries authorities. To ensure that licensees areaware of fishing-related conditions and take theseinto account, the Directorate of Fisheries and theInstitute of Marine Research have prepared mater-ials which show where and when the various fishstocks normally breed.
Each licensee is required by the PetroleumAct to submit information on a planned survey tothe authorities, which consider whether thesurvey can be carried out as planned. In someareas, surveying is banned for specified periods toprotect the marine environment.
A ship conducting seismic surveys must carrya fisheries specialist, and maintain an acceptabledistance from fishing vessels.
35
2
More information is needed about whetherseismic shooting frightens sand eels, and a researchprogramme will be established to investigate thisissue.
Measures to reduce conflicts over seaareas
Various measures have been implemented toreduce potential conflicts from overlapping use ofsea areas by the two industries in various phasesof petroleum activities.
Licensees are committed during the explora-tion phase to a work programme which normallyincludes seismic surveying and drilling commit-ments. An average seismic survey lasts 20-25 days,while a well averages just under 50 days. The drill-ing commitment usually covers one-three wells.Other than these activities, no acreage is occupiedduring the exploration phase.
During production, offshore installations andthe safety zone around them mean some loss ofarea for fishing. The aim is to minimise this depri-vation. All subsea installations must accordinglycope with being over-trawled. However, a 500-metre safety zone is required around structureswhich extend above the sea surface. How much ofa loss these zones are for fishing varies from placeto place. The potential for a conflict of interestbetween the two industries depends on suchfactors as depth, currents and fishing gear as wellas the significance of the area for fisheries.
In the closing phase, the Ospar convention'srequirements for removing installations means
that the area occupied during production againbecomes accessible for fishing and other users ofthe sea. An overall assessment of the conse-quences for the environment and fishing as wellas the costs involved will be applied by the author-ities to determine the fate of installations notcovered by Ospar.
Discharge permits and environmentalmonitoring
Strict regulations have been introduced under theauthority of the Pollution Act to minimisedischarges to the sea from petroleum activities. Inorder to discharge oil or chemicals, operatorsmust apply to the SFT for a permit.
Regular monitoring of the marine environmentis one of the requirements imposed in such permits,and provides an important supplement to thesurveillance carried out by the authorities. Suchmonitoring has been pursued off Norway over 30years on every field, from pre-drilling surveys tofollow-up after production ceases. Together withexperimental studies, it helps to identify whichdischarges call for countermeasures.
The studies have shown a significant reductionin environmental impact around offshore platformssince discharging oil-based drilling mud was bannedin 1993. Discharges are now estimated to havecaused pollutions across 0.04 per cent of the seabedin those parts of the NCS where oil and gas areproduced.
In cooperation with the Norwegian Oil IndustryAssociation (OLF) and others, the UK Offshore

36
2
Operators Association (Ukooa) has conducted astudy which aims to establish acceptable and prac-tical solutions for disposing of drill cuttings whichhave been deposited on the seabed. At present,there are no mitigatory measures which offer amore appropriate alternative to leaving suchcuttings in place.
To meet the challenges presented by petroleumactivities in areas close to the shore, the authoritiesplan a general expansion in existing biological moni-toring of living marine resources in the NorwegianSea. This will be introduced in connection with the17th licensing round in order to identify the possibleimpact of the petroleum sector.
Environmental management
The zero discharge philosophy represents animportant measure for minimising discharges tothe sea from petroleum activities. It provides anexample of the way Norway's authorities andindustry have jointly succeeded in integratingenvironmental concerns in these operations.
This philosophy was introduced in Report no58 (1996-97) to the Storting on environmentalpolicies for sustainable development. Zerodischarges can be achieved by continuously reduc-ing the release of environmentally-harmfulchemicals towards a level which equals zero forall practical purposes. At this level, environmentalharm will depend on the content of potentiallyharmful chemicals as well as the time and place ofthe discharge.
Assessments relating to zero discharges will
also take account of emissions to the air. Thespecial feature of working to achieve zerodischarges is its focus on all harmful componentsreleased to the sea, rather than the generally one-sided concentration on oil which has prevailedinternationally.
The offshore operators have developed a stra-tegy for zero environmentally harmful dischargesfor their fields, and will be assessing measures forachieving zero emissions from drilling/well activi-ties, production and pipelines. Measures in thesecategories will cover all discharges to the seafrom offshore activities. They are directed both atvarious chemical additives and at handling thewater flow as such. Measures for produced waterwill be implemented on every field. The zerodischarge philosophy is due to be fully imple-mented by 2005.
One development by the oil industry in thiscontext is the environmental impact factor (EIF),a tool for calculating the total effect of a dischargestream. This makes it possible to assess whichcomponents in produced water are most harmfulto the environment, and to compare the environ-mental impact of various discharge streams. Thatin turn allows countermeasures to be prioritised.This method is based on knowledge aboutdischarge volumes, diffusion and toxicity.
Similarly, the dose-related risk and assess-ment model (Dream) has been developed tocalculated the environmental risk posed byproduced water and other discharges to the sea.The emphasis is again on alkyl phenols as well asPAH as the substances with the greatest potentialfor causing environmental harm. Action against

37
2
them should therefore be prioritised. At the sametime, the modelling work shows that the environ-mental risk posed by discharges on the NCS islow.
The chemical hazard and risk model (Charm)provides another tool which makes it possible toachieve environmental improvements in the mosteffective possible way. With its aid, the industrycan compare the various chemicals in order toselect those which represent the lowest environ-mental risk. The authorities have also requiredthe players to make environmental risk assess-ments with the aid of Charm when adopting newchemicals.
Research and development
Technology development
Considerable technological progress has beenmade since oil production from the Ekofisk fieldcommenced in 1971. With each new offshoredevelopment, the industry has demonstratedadvances in its technical solutions.
The trend outlined above, with petroleum activ-ities expanding in the far north and areas closer tothe shore combined with a shift towards activitiesin deeper water and smaller, more marginal fields,indicate that a substantial technological challengelies ahead. Technology and possible developmentsolutions already being devised can help to reducethe potential for conflicts between petroleum activ-ities on the one hand and fishing and environ-mental interests on the other.
Technology development will generally be
positive for the environment, and many solutionshave been specially devised to reduce the negativeenvironmental impact of oil and gas activities. Thetechnologies relevant for each offshore project willdepend on a number of field-specific conditions.Technical solutions available for use in future devel-opments will be very different from those utilised onthe NCS so far.
Wellstream separation subsea or downhole isone example of new technology now under devel-opment, and could cut energy consumption andproduced water discharges to the sea in the longerterm. Much energy is needed to transport waterfrom reservoir to surface process plant for treat-ment and possible injection back below ground.Subsea or downhole separation would significantlyreduce this energy requirement, while earlyremoval of water from the wellstream could alsocut the need for process chemicals.
The Troll Pilot project on the Troll field iscurrently testing subsea separation. Testing of thedownhole approach, which will be important forfurther development and application of thistechnology, should be initiated on the NCS during2002-03.
Technology development also contributes tosimpler and less extensive production solutions. Inaddition to reduced energy consumption and emis-sions to the sea, these advances will help to cut thesize of traditional installations or to eliminate them.New technical solutions also enhance safety anddiminish the risk of acute spills to the sea.
Long-term effects of discharges to the sea
Large-scale studies are currently being pursued by

38
2
the industry itself into the possible impact of itsactivities on the living marine environment. Bodiessuch as the Norwegian Institute of MarineResearch, the Sintef research foundation and theNorwegian Institute for Water Research are alsohelping to enhance knowledge about this issue.
But there is wide agreement that informationon the long-term effects of discharges to the seahas been inadequate, and that the commitmentbeing made in this area should be strengthenedand organised in a more appropriate way.
A broad-based working group drawn from theresearch community, the authorities concernedand the industry has considered where the needis greatest, and how the various parties involvedcan be coordinated and cooperate in a morerational way than before.
The group has recommended that research intolong-term effects in the water column should begiven priority in this area. In its view, long-termeffects of acute spills and drilling fluids should begiven top priority, followed by the link between re-search and monitoring, special research tasks inArctic areas, discharges from drill cuttings andacute spills in the coastal and shore zone.
Over the coming decade, most of the dischargesto the sea from petroleum activities will derive fromfields which are already in production. These willeventually move into a mature phase with a rising
water cut. At the same time, possible future exten-sion of petroleum activities into deeper waters,Arctic areas and waters close to vulnerable coastswill create special requirements for more informa-tion on long-term effects of discharges to the sea.
The authorities accordingly want to establish aresearch programme as soon as possible and incooperation with the industry to look at such long-term effects.
Disseminating information
Another key task is the dissemination of existingknowledge and establishing a shared under-standing of the challenges faced. Since Miljøsokwas established in 1995, it has provided a meetingplace for key players from oil companies, thesupplies industry, the authorities, the researchcommunity, environmental groups and fishingorganisations.
This partnership reflected a desire to developmore effective cooperation between the Norwegianauthorities and the country's oil and gas industry inorder to resolve the most important environmentalchallenges.
Miljøsok ended in 2000, but is being followedup by the Environment Forum as a new arena forcollaboration. Relations between the fishing andpetroleum industries was a central issue at theforum's inaugural meeting in the autumn of 2001.