Enisse Kharroubi - Monetary policy, factor allocation and growth
19
Monetary policy, factor allocation and growth Ryan Banerjee, Enisse Kharroubi, Fabrizio Zampolli BIS-IMF-OECD productivity conference 10-11 January 2018, Paris Disclaimer: the views expressed are those of the presenters and not necessarily those of the BIS
-
Upload
structuralpolicyanalysis -
Category
Economy & Finance
-
view
179 -
download
0
Transcript of Enisse Kharroubi - Monetary policy, factor allocation and growth

Monetary policy, factor allocation and growth
Ryan Banerjee, Enisse Kharroubi, Fabrizio Zampolli
BIS-IMF-OECD productivity conference10-11 January 2018, Paris
Disclaimer: the views expressed are those of the presenters and not necessarily those of the BIS

Motivation
10 years after Great Financial Crisis (GFC) productivity growth remains weak
Key crisis factors seem less relevant Credit conditions loose Banks have largely repaired their balance sheets Global growth is picking up
What are the effects of monetary policy? Easier monetary policy essential to stabilise demand in the depths of
the crisis But what are the effects on resource allocation?
- Especially during extended period of exceptionally low interest rates
2

This paper
How does monetary policy affect resource allocation? Could go in either direction
Good: Easy monetary policy may help highly productivity firms expand by alleviating credit constraints
Bad: Easy monetary policy can slow productivity enhancing reallocation if it reduces pressure on non-viable firms to exit
New method to analyse contribution of factor reallocation to productivity Show the relationship between a productivity
decomposition and panel regressions Use this insight to examine impact of monetary policy on
contribution of reallocation to productivity growth
3

Main results
Sectoral reallocation closely linked to the slope of the yield curve Rather than either short or long-term rates alone
Shocks which flatten the yield curve Reduce the contribution of factor reallocation across sectors
to aggregate productivity growth Evidence holds for both capital and labour reallocation but
stronger for labour Not driven by properties of yield curve signalling the phase of
the cycle Different way monetary policy conducted pre and post GFC
Pre-crisis: yield curve flattening monetary tightening Post-crisis: yield curve flattening monetary easing May indicate state-dependency (credit market functioning,
financial vs. real shocks, etc…)
4

Related literature
Factor reallocation boosts productivity growth in downturns eg Cabellero and Hammour (1994, 1996), Davis and Haltiwanger (1992), Mortensen and Pissarides (1994)
Cleansing effect may be weaker if young productive firms exit eg Baden-Fuller (1989), Dunne et al (1989), Eslava et al (2010)
Reallocation in US less intense during 2008-09 recession than in previous recessions Foster et al (2016)
Productivity decompositions eg Baily et al (2001), Olley and Pakes (1996), Borio et al (2015)
5

Decomposing total factor productivity growth
Assume aggregate TFP is an average of sectoral TFPs (𝐴𝐴𝑠𝑠𝑠𝑠) weighted by their shares in aggregate input (𝑥𝑥𝑠𝑠𝑠𝑠) (eg labour)
𝐴𝐴𝑠𝑠𝑥𝑥 = ∑𝑠𝑠 ⁄𝑥𝑥𝑠𝑠𝑠𝑠 𝑥𝑥𝑠𝑠 𝐴𝐴𝑠𝑠𝑠𝑠 TFP growth can be decomposed into common and allocative
components
(where 𝑎𝑎𝑠𝑠𝑥𝑥 = ⁄𝑥𝑥𝑠𝑠𝑠𝑠 𝑥𝑥𝑠𝑠 𝐴𝐴𝑠𝑠𝑠𝑠/𝐴𝐴𝑠𝑠𝑥𝑥)
6
Average relative rate of labour
accumulation across sectors
Average size-weighted TFP growth across
sectors
Covariance of relative rate of labour accumulation and size-weighted TFP
growth across sectors
Common component Allocation component
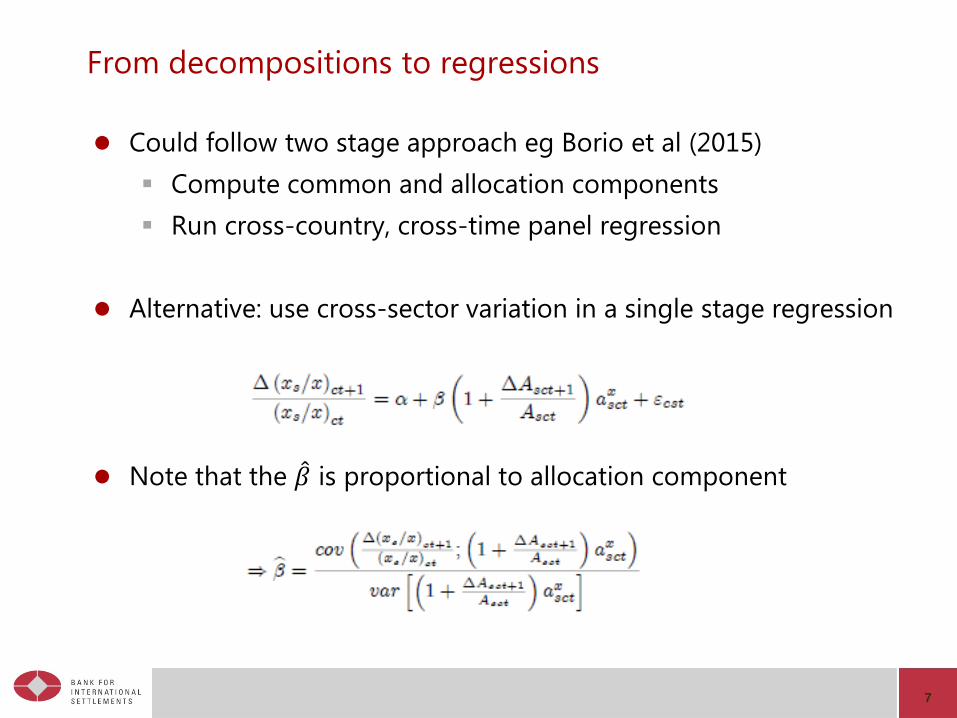
From decompositions to regressions
Could follow two stage approach eg Borio et al (2015) Compute common and allocation components Run cross-country, cross-time panel regression
Alternative: use cross-sector variation in a single stage regression
Note that the �̂�𝛽 is proportional to allocation component
7

Regression specification
Baseline regression:(𝑥𝑥𝑠𝑠/𝑥𝑥)𝑐𝑐𝑠𝑠+1
(𝑥𝑥𝑠𝑠/𝑥𝑥)𝑐𝑐𝑠𝑠= 𝛼𝛼𝑠𝑠𝑐𝑐 + 𝛼𝛼𝑐𝑐𝑠𝑠 + 𝛼𝛼𝑠𝑠𝑠𝑠 + 𝛽𝛽1 + 𝛽𝛽2𝑀𝑀𝑐𝑐𝑠𝑠 1 +
∆𝐴𝐴𝑠𝑠𝑐𝑐𝑠𝑠+1𝐴𝐴𝑠𝑠𝑐𝑐𝑠𝑠
𝑎𝑎𝑠𝑠𝑐𝑐𝑠𝑠𝑥𝑥
+ 𝛽𝛽0𝑍𝑍𝑠𝑠𝑐𝑐𝑠𝑠 + 𝜀𝜀𝑠𝑠𝑐𝑐𝑠𝑠
where 𝑀𝑀𝑐𝑐𝑠𝑠 is a vector of current and past macro variables including Interest rate surprises: 1 and 2 year lagged Sales growth: Current and 1 year lagged Credit growth: Current and 1 year lagged
We are interested in the element of 𝛽𝛽2 which measures the sensitivity of factor allocation growth to the interaction between sectoral TFP growth and interest rate surprises
8

Data
EU-KLEMS 10 countries 2000-2015. Austria, Belgium, Denmark, Finland,
France, Germany, Italy, Netherlands, Sweden, United States Aggregate and sectoral value added, sales, employment,
hours worked, capital stock and total factor productivity growth
13 sectors
Additional datasets OECD: 1-year ahead forecast errors in policy rates and 10-y
government bond yields as interest rate surprises BIS: aggregate data on credit to the non-financial corporate
sector
9

10
Summary statistics – productivity growth
Common component accounts for most of average labour and capital productivity growth, but allocation component accounts for most of average TFP growth
Allocation component volatility is about 1/3 of (total factor) productivity growth volatility.
Mean Std. dev.Labour productivity growth 1.03% 2.24%
Allocation component 0.06% 0.70%Common component 0.97% 2.31%
Capital Productivity growth -0.55% 1.99%Allocation component 0.02% 0.60%Common component -0.56% 2.01%
TFP growth (weighted by employment shares) 0.13% 1.68%Allocation component 0.11% 0.56%Common component 0.03% 1.70%
TFP growth (weighted by hours shares) 0.20% 1.71%Allocation component 0.13% 0.54%Common component 0.07% 1.70%
11
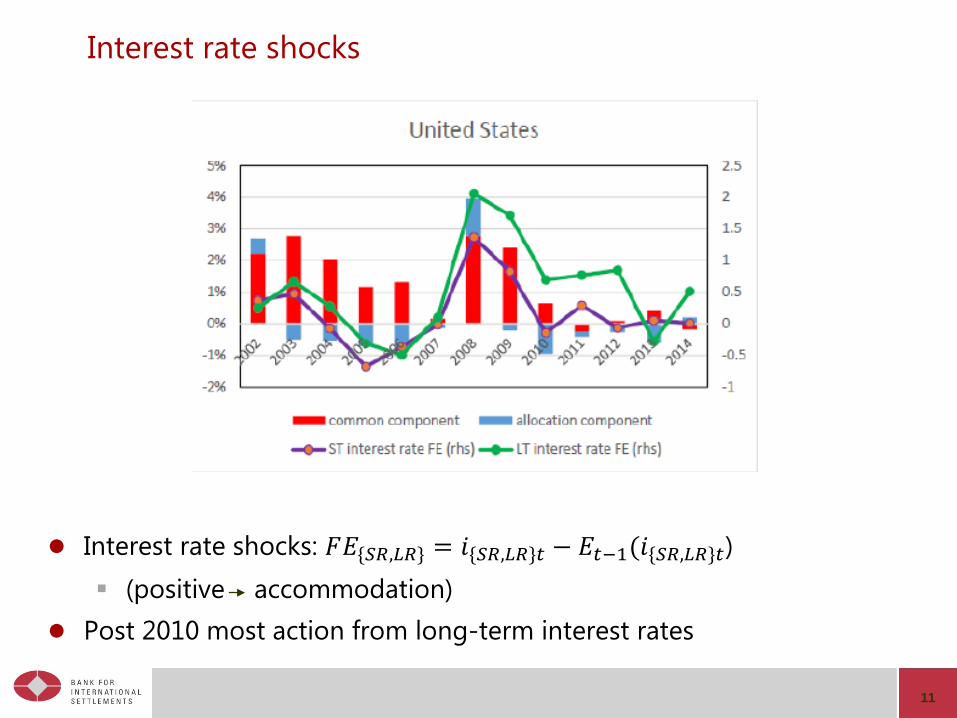
Interest rate shocks
Interest rate shocks: 𝐹𝐹𝐸𝐸{𝑆𝑆𝑆𝑆,𝐿𝐿𝑆𝑆} = 𝑖𝑖{𝑆𝑆𝑆𝑆,𝐿𝐿𝑆𝑆}𝑠𝑠 − 𝐸𝐸𝑠𝑠−1(𝑖𝑖{𝑆𝑆𝑆𝑆,𝐿𝐿𝑆𝑆}𝑠𝑠) (positive accommodation)
Post 2010 most action from long-term interest rates

12
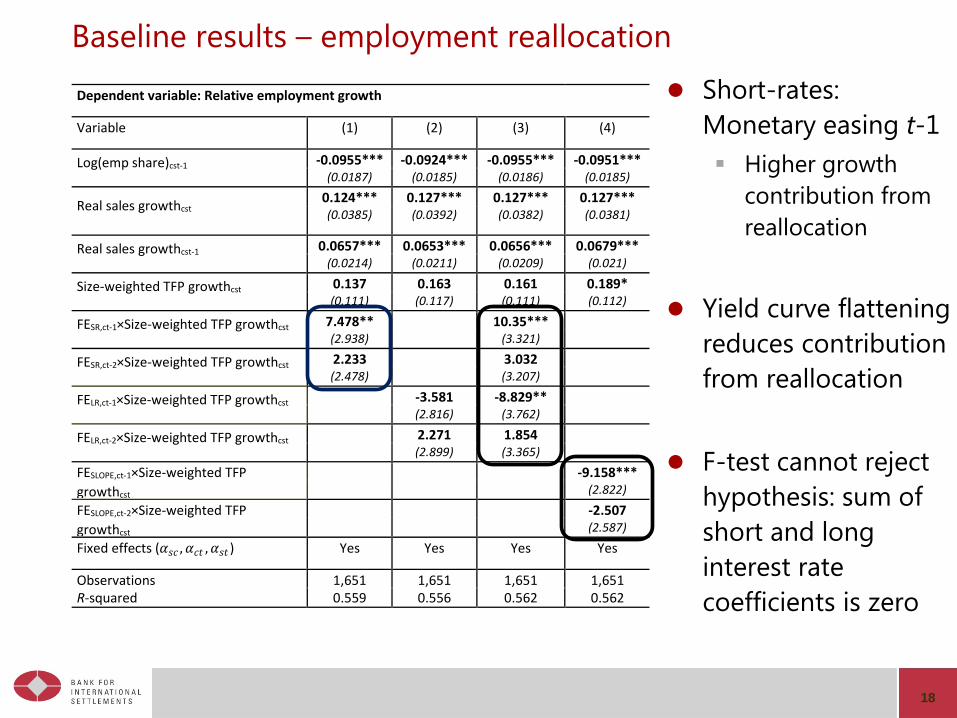
Dependent variable: Relative employment growth Variable (1) (2)
log(𝑒𝑒𝑒𝑒𝑒𝑒 𝑠𝑠𝑠𝑎𝑎𝑠𝑠𝑒𝑒)𝑐𝑐𝑠𝑠𝑠𝑠−1 -0.0955*** -0.0951***(0.0186) (0.0185)
𝑅𝑅𝑒𝑒𝑎𝑎𝑅𝑅 𝑠𝑠𝑎𝑎𝑅𝑅𝑒𝑒𝑠𝑠 𝑔𝑔𝑠𝑠𝑔𝑔𝑔𝑔𝑔𝑔𝑠𝑐𝑐𝑠𝑠𝑠𝑠 0.127*** 0.127***(0.0382) (0.0381)
𝑅𝑅𝑒𝑒𝑎𝑎𝑅𝑅 𝑠𝑠𝑎𝑎𝑅𝑅𝑒𝑒𝑠𝑠 𝑔𝑔𝑠𝑠𝑔𝑔𝑔𝑔𝑔𝑔𝑠𝑐𝑐𝑠𝑠𝑠𝑠−1 0.0656*** 0.0679***(0.0209) (0.0210)
𝑇𝑇𝐹𝐹𝑇𝑇𝑔𝑔𝑠𝑠𝑔𝑔𝑔𝑔𝑔𝑔𝑠(𝑆𝑆𝑖𝑖𝑆𝑆𝑒𝑒 𝑊𝑊𝑒𝑒𝑖𝑖𝑔𝑔𝑠𝑔𝑔𝑒𝑒𝑊𝑊)𝑐𝑐𝑠𝑠𝑠𝑠 0.161 0.189*(0.111) (0.112)
𝐹𝐹𝐸𝐸𝑆𝑆𝑆𝑆,𝑐𝑐𝑠𝑠−1 ∗ 𝑇𝑇𝐹𝐹𝑇𝑇𝑔𝑔𝑠𝑠𝑔𝑔𝑔𝑔𝑔𝑔𝑠(𝑆𝑆𝑊𝑊)𝑐𝑐𝑠𝑠𝑠𝑠 10.35***(3.321)
𝐹𝐹𝐸𝐸𝑆𝑆𝑆𝑆,𝑐𝑐𝑠𝑠−2 ∗ 𝑇𝑇𝐹𝐹𝑇𝑇𝑔𝑔𝑠𝑠𝑔𝑔𝑔𝑔𝑔𝑔𝑠(𝑆𝑆𝑊𝑊)𝑐𝑐𝑠𝑠𝑠𝑠 3.032(3.207)
𝐹𝐹𝐸𝐸𝐿𝐿𝑆𝑆,𝑐𝑐𝑠𝑠−1 ∗ 𝑇𝑇𝐹𝐹𝑇𝑇𝑔𝑔𝑠𝑠𝑔𝑔𝑔𝑔𝑔𝑔𝑠(𝑆𝑆𝑊𝑊)𝑐𝑐𝑠𝑠𝑠𝑠 -8.829**(3.762)
𝐹𝐹𝐸𝐸𝐿𝐿𝑆𝑆,𝑐𝑐𝑠𝑠−2 ∗ 𝑇𝑇𝐹𝐹𝑇𝑇𝑔𝑔𝑠𝑠𝑔𝑔𝑔𝑔𝑔𝑔𝑠(𝑆𝑆𝑊𝑊)𝑐𝑐𝑠𝑠𝑠𝑠 1.854(3.365)
𝐹𝐹𝐸𝐸𝑆𝑆𝑆𝑆𝑆𝑆𝑆𝑆𝑆𝑆 𝑐𝑐𝑠𝑠−1 ∗ 𝑇𝑇𝐹𝐹𝑇𝑇𝑔𝑔𝑠𝑠𝑔𝑔𝑔𝑔𝑔𝑔𝑠(𝑆𝑆𝑊𝑊)𝑐𝑐𝑠𝑠𝑠𝑠 -9.158***(2.822)
𝐹𝐹𝐸𝐸𝑆𝑆𝑆𝑆𝑆𝑆𝑆𝑆𝑆𝑆 𝑐𝑐𝑠𝑠−2 ∗ 𝑇𝑇𝐹𝐹𝑇𝑇𝑔𝑔𝑠𝑠𝑔𝑔𝑔𝑔𝑔𝑔𝑠(𝑆𝑆𝑊𝑊)𝑐𝑐𝑠𝑠𝑠𝑠 -2.507(2.587)
𝐹𝐹𝑖𝑖𝑥𝑥𝑒𝑒𝑊𝑊 𝑒𝑒𝑒𝑒𝑒𝑒𝑒𝑒𝑒𝑒𝑔𝑔𝑠𝑠 (𝛼𝛼𝑠𝑠𝑐𝑐 ,𝛼𝛼𝑐𝑐𝑠𝑠,𝛼𝛼𝑠𝑠𝑠𝑠) Yes Yes
Obs 1,651 1,651R-squared 0.562 0.562
Short-rates: Monetary easing t-1 Higher growth
contribution from reallocation
Yield curve flattening reduces contribution from reallocation
F-test cannot reject hypothesis: sum of short and long interest rate coefficients is zero
Robust to inclusion of credit gap and sales growth (current + 1 lag)
Baseline results – employment reallocation
13
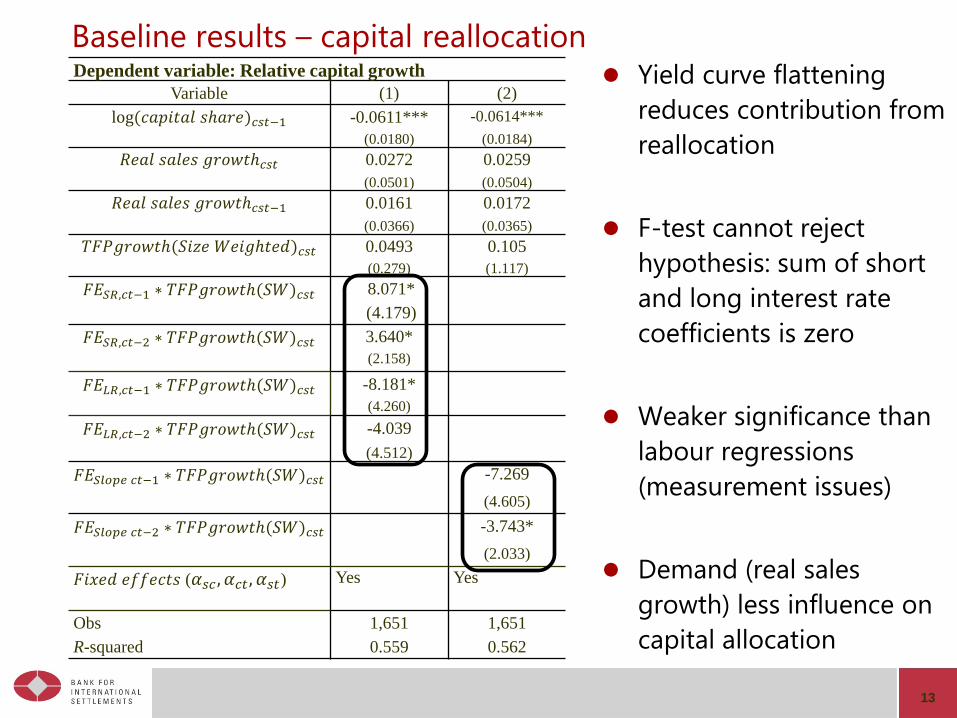
Dependent variable: Relative capital growth Variable (1) (2)
log(𝑒𝑒𝑎𝑎𝑒𝑒𝑖𝑖𝑔𝑔𝑎𝑎𝑅𝑅 𝑠𝑠𝑠𝑎𝑎𝑠𝑠𝑒𝑒)𝑐𝑐𝑠𝑠𝑠𝑠−1 -0.0611*** -0.0614***(0.0180) (0.0184)
𝑅𝑅𝑒𝑒𝑎𝑎𝑅𝑅 𝑠𝑠𝑎𝑎𝑅𝑅𝑒𝑒𝑠𝑠 𝑔𝑔𝑠𝑠𝑔𝑔𝑔𝑔𝑔𝑔𝑠𝑐𝑐𝑠𝑠𝑠𝑠 0.0272 0.0259(0.0501) (0.0504)
𝑅𝑅𝑒𝑒𝑎𝑎𝑅𝑅 𝑠𝑠𝑎𝑎𝑅𝑅𝑒𝑒𝑠𝑠 𝑔𝑔𝑠𝑠𝑔𝑔𝑔𝑔𝑔𝑔𝑠𝑐𝑐𝑠𝑠𝑠𝑠−1 0.0161 0.0172(0.0366) (0.0365)
𝑇𝑇𝐹𝐹𝑇𝑇𝑔𝑔𝑠𝑠𝑔𝑔𝑔𝑔𝑔𝑔𝑠(𝑆𝑆𝑖𝑖𝑆𝑆𝑒𝑒 𝑊𝑊𝑒𝑒𝑖𝑖𝑔𝑔𝑠𝑔𝑔𝑒𝑒𝑊𝑊)𝑐𝑐𝑠𝑠𝑠𝑠 0.0493 0.105(0.279) (1.117)
𝐹𝐹𝐸𝐸𝑆𝑆𝑆𝑆,𝑐𝑐𝑠𝑠−1 ∗ 𝑇𝑇𝐹𝐹𝑇𝑇𝑔𝑔𝑠𝑠𝑔𝑔𝑔𝑔𝑔𝑔𝑠(𝑆𝑆𝑊𝑊)𝑐𝑐𝑠𝑠𝑠𝑠 8.071*(4.179)
𝐹𝐹𝐸𝐸𝑆𝑆𝑆𝑆,𝑐𝑐𝑠𝑠−2 ∗ 𝑇𝑇𝐹𝐹𝑇𝑇𝑔𝑔𝑠𝑠𝑔𝑔𝑔𝑔𝑔𝑔𝑠(𝑆𝑆𝑊𝑊)𝑐𝑐𝑠𝑠𝑠𝑠 3.640*(2.158)
𝐹𝐹𝐸𝐸𝐿𝐿𝑆𝑆,𝑐𝑐𝑠𝑠−1 ∗ 𝑇𝑇𝐹𝐹𝑇𝑇𝑔𝑔𝑠𝑠𝑔𝑔𝑔𝑔𝑔𝑔𝑠(𝑆𝑆𝑊𝑊)𝑐𝑐𝑠𝑠𝑠𝑠 -8.181*(4.260)
𝐹𝐹𝐸𝐸𝐿𝐿𝑆𝑆,𝑐𝑐𝑠𝑠−2 ∗ 𝑇𝑇𝐹𝐹𝑇𝑇𝑔𝑔𝑠𝑠𝑔𝑔𝑔𝑔𝑔𝑔𝑠(𝑆𝑆𝑊𝑊)𝑐𝑐𝑠𝑠𝑠𝑠 -4.039(4.512)
𝐹𝐹𝐸𝐸𝑆𝑆𝑆𝑆𝑆𝑆𝑆𝑆𝑆𝑆 𝑐𝑐𝑠𝑠−1 ∗ 𝑇𝑇𝐹𝐹𝑇𝑇𝑔𝑔𝑠𝑠𝑔𝑔𝑔𝑔𝑔𝑔𝑠(𝑆𝑆𝑊𝑊)𝑐𝑐𝑠𝑠𝑠𝑠 -7.269(4.605)
𝐹𝐹𝐸𝐸𝑆𝑆𝑆𝑆𝑆𝑆𝑆𝑆𝑆𝑆 𝑐𝑐𝑠𝑠−2 ∗ 𝑇𝑇𝐹𝐹𝑇𝑇𝑔𝑔𝑠𝑠𝑔𝑔𝑔𝑔𝑔𝑔𝑠(𝑆𝑆𝑊𝑊)𝑐𝑐𝑠𝑠𝑠𝑠 -3.743*(2.033)
𝐹𝐹𝑖𝑖𝑥𝑥𝑒𝑒𝑊𝑊 𝑒𝑒𝑒𝑒𝑒𝑒𝑒𝑒𝑒𝑒𝑔𝑔𝑠𝑠 (𝛼𝛼𝑠𝑠𝑐𝑐 ,𝛼𝛼𝑐𝑐𝑠𝑠,𝛼𝛼𝑠𝑠𝑠𝑠) Yes Yes
Obs 1,651 1,651R-squared 0.559 0.562
Yield curve flattening reduces contribution from reallocation
F-test cannot reject hypothesis: sum of short and long interest rate coefficients is zero
Weaker significance than labour regressions (measurement issues)
Demand (real sales growth) less influence on capital allocation
Baseline results – capital reallocation

Just the signalling properties of the yield curve?
14
Flatter yield curve forecasts slower growth (eg Estrella and Hardouvelis (1991) and productivity tends to be procyclical
BUT: fluctuations in productivity driven by common component Signalling fluctuations in yield curve slope affect average
productivity across all sectors – not reallocation between sectors
Correlation between forecast errors in the yield curve slope and TFP growth in the following two years is close to zero

15
Dependent variable: Relative growth inVariable Employment Hours worked Capital Stock
𝑇𝑇𝐹𝐹𝑇𝑇𝑔𝑔𝑠𝑠𝑔𝑔𝑔𝑔𝑔𝑔𝑠(𝑆𝑆𝑖𝑖𝑆𝑆𝑒𝑒 𝑊𝑊𝑒𝑒𝑖𝑖𝑔𝑔𝑠𝑔𝑔𝑒𝑒𝑊𝑊)𝑠𝑠 0.181 0.117 0.0536(0.117) (0.145) (0.281)
𝐹𝐹𝐸𝐸𝑆𝑆𝑆𝑆,𝑠𝑠−1 ∗ 𝑇𝑇𝐹𝐹𝑇𝑇𝑔𝑔𝑠𝑠𝑔𝑔𝑔𝑔𝑔𝑔𝑠(𝑆𝑆𝑊𝑊)𝑠𝑠 16.95*** 10.22** 14.20*(4.960) (4.852) (8.522)
* Post 2008 interaction-11.02** -2.203 -10.52(5.501) (5.918) (7.967)
𝐹𝐹𝐸𝐸𝑆𝑆𝑆𝑆,𝑠𝑠−2 ∗ 𝑇𝑇𝐹𝐹𝑇𝑇𝑔𝑔𝑠𝑠𝑔𝑔𝑔𝑔𝑔𝑔𝑠(𝑆𝑆𝑊𝑊)𝑠𝑠 1.091 8.932 -3.147(5.899) (7.420) (8.796)
* Post 2008 interaction0.0878 -3.561 8.307(7.297) (9.043) (9.983)
𝐹𝐹𝐸𝐸𝐿𝐿𝑆𝑆,𝑠𝑠−1 ∗ 𝑇𝑇𝐹𝐹𝑇𝑇𝑔𝑔𝑠𝑠𝑔𝑔𝑔𝑔𝑔𝑔𝑠(𝑆𝑆𝑊𝑊)𝑠𝑠 -21.13*** -7.331 -12.32*(7.400) (7.751) (11.15)
* Post 2008 interaction14.66** -2.487 4.048(6.554) (8.071) (12.34)
𝐹𝐹𝐸𝐸𝐿𝐿𝑆𝑆,𝑠𝑠−2 ∗ 𝑇𝑇𝐹𝐹𝑇𝑇𝑔𝑔𝑠𝑠𝑔𝑔𝑔𝑔𝑔𝑔𝑠(𝑆𝑆𝑊𝑊)𝑠𝑠 5.547 -5.573 2.665(8.733) (9.269) (12.60)
* Post 2008 interaction-5.639 -1.088 -7.964(9.176) (9.809) (12.01)
Fixed effects (𝛼𝛼𝑠𝑠𝑐𝑐 ,𝛼𝛼𝑐𝑐𝑠𝑠,𝛼𝛼𝑠𝑠𝑠𝑠) Yes Yes Yes
Observations 1,651 1,633 1,464R-squared 0.564 0.564 0.572
Sum of coefficients:not significantsignificant
Effect of short-term interest rate surprises loses significance after 2008.
Effect of long-term interest rate surprises becomes significant after 2008.
Changes are less clear-cut for capital growth regressions.
Robustness: Pre-post GFC

Conclusions
Slope of the yield curve closely linked to contribution of reallocation to productivity growth Surprise flattening of the yield curve reduces contribution of
reallocation
As monetary policy operations have changed with short-rates hitting the ZLB May suggest some state dependency
Two possible interpretations Pre-crisis, tighter credit conditions reduce growth of high
productivity entrants but post-crisis, loose conditions slow exit of unproductive firms.
Higher productivity growth sectors hold more short term debt.
16

EXTRA SLIDES
17
Dependent variable: Relative employment growth
Variable (1) (2) (3) (4)
Log(emp share)cst-1 -0.0955*** -0.0924*** -0.0955*** -0.0951***
(0.0187) (0.0185) (0.0186) (0.0185)
Real sales growthcst 0.124*** 0.127*** 0.127*** 0.127*** (0.0385) (0.0392) (0.0382) (0.0381)
Real sales growthcst-1 0.0657*** 0.0653*** 0.0656*** 0.0679*** (0.0214) (0.0211) (0.0209) (0.021)
Size-weighted TFP growthcst 0.137 0.163 0.161 0.189* (0.111) (0.117) (0.111) (0.112)
FESR,ct-1×Size-weighted TFP growthcst 7.478** 10.35*** (2.938)
(3.321)
FESR,ct-2×Size-weighted TFP growthcst 2.233 3.032 (2.478)
(3.207)
FELR,ct-1×Size-weighted TFP growthcst -3.581 -8.829** (2.816) (3.762)
FELR,ct-2×Size-weighted TFP growthcst 2.271 1.854 (2.899) (3.365)
FESLOPE,ct-1×Size-weighted TFP growthcst
-9.158*** (2.822)
FESLOPE,ct-2×Size-weighted TFP growthcst
-2.507 (2.587)
Fixed effects (𝛼𝛼𝑠𝑠𝑒𝑒 ,𝛼𝛼𝑒𝑒𝑔𝑔 ,𝛼𝛼𝑠𝑠𝑔𝑔 ) Yes Yes Yes Yes
Observations 1,651 1,651 1,651 1,651 R-squared 0.559 0.556 0.562 0.562
18
Short-rates: Monetary easing t-1 Higher growth
contribution from reallocation
Yield curve flattening reduces contribution from reallocation
F-test cannot reject hypothesis: sum of short and long interest rate coefficients is zero
Baseline results – employment reallocation

Dependent variable: Relative capital growth
Variable (1) (2) (3) (4)
Log(emp share)cst-1 -0.0611*** -0.0617*** -0.0613*** -0.0614*** (0.0180) (0.0185) (0.0185) (0.0184)
Real sales growthcst 0.0272 0.0255 0.0259 0.0259 (0.0501) (0.0502) (0.0505) (0.0504)
Real sales growthcst-1 0.0161 0.0175 0.0179 0.0172 (0.0366) (0.0354) (0.0356) (0.0365)
Size-weighted TFP growthcst 0.0493 0.0401 0.0728 0.105 (0.279) (0.117) (1.264) (1.177)
FESR,ct-1×Size-weighted TFP growthcst 8.071* 8.321* 6.974 (4.179) (4.344) (5.276)
FESR,ct-2×Size-weighted TFP growthcst 3.640* 3.529 3.632* (2.158) (2.220) (2.188)
FELR,ct-1×Size-weighted TFP growthcst -8.181* -7.996** -7.728* (4.260) (4.030) (4.262)
FELR,ct-2×Size-weighted TFP growthcst -4.039 -4.784 -5.022 (4.512) (4.483) (4.616)
FESLOPE,ct-1×Size-weighted TFP growthcst
-7.269 (4.605)
FESLOPE,ct-2×Size-weighted TFP growthcst
-3.743* (2.033)
Fixed effects (𝛼𝛼𝑠𝑠𝑒𝑒 ,𝛼𝛼𝑒𝑒𝑔𝑔 ,𝛼𝛼𝑠𝑠𝑔𝑔 ) Yes Yes Yes Yes
Additional controls interacted with size-weighted TFP growth
None Credit gap Credit gap
Sales growth
Observations 1,651 1,651 1,651 1,651 R-squared 0.559 0.556 0.562 0.562
19
Yield curve flattening reduces contribution from reallocation
F-test cannot reject hypothesis: sum of short and long interest rate coefficients is zero
Weaker significance than labour regressions (measurement issues)
Demand (real sales growth) less influence on capital allocation
Baseline results – capital reallocation