
MSME Conclave - Facilitating Financing & Enhancing Competitiveness

0
Enhancing Tourism Competitiveness through Improved Air ConnectivityPresented by:
ICF International
International Tourism FairMadrid, 20‐24 January, 2016

11
Agenda
1. Aviation Industry Overview
2. Improving Air Connectivity through Air Service Development (ASD)
3. Airline Route Planning Process
4. Conducting a Route Forecast
5. Example Business Case Slides
6. Tactics for Small Markets

22
Introduction to ICF

3
ICF is one of the most experienced global aviation and aerospace consultancies
Airports • Airlines • Aerospace & MRO • Asset AdvisoryAirports • Airlines • Aerospace & MRO • Asset Advisory
joined ICF in 2012
joined ICF in 2011
joined ICF in 2007
53 years in business (founded 1963)
100+ professional staff− Dedicated exclusively to aviation and aerospace
− Blend of consulting professionals and experienced aviation executives
Specialized, focused expertise and proprietary knowledge
Broad functional capabilities
More than 10,000 private sector and public sector assignments
Backed by parent company ICF International (2014 revenue: US$1.05 billion)
Global presence –– offices around the world with partner in Israel
New York • Boston • Ann Arbor • London • Singapore • Beijing • Hong Kong

44
Our client base spans the aviation industry, giving us a holistic view of the industry
International and regional passenger airlines
Major and regional airports
Tourism ministries and agencies
National, regional and local governments
Air cargo, express, and integrated logistics operators
IT, equipment, and service providers
Airframe, engine, and avionics suppliers
Aircraft leasing companies
Investors and financial institutions
Booking, distribution, and travel services
Maintenance, Repair, and Overhaul industry
Corporate and business aviation

55
ICF offers an unmatched global airline client list and network of airline contacts

66
We are especially strong in international air service experience and support
Boston
Baltimore
Miami
Dallas/Ft. Worth
Denver
LasVegas
LosAngeles
U.S./CanadaU.S./Canada
Tampa
SaltLake City Islip
SanFrancisco
Ft. Myers
Richmond
Edmonton
Indianapolis
Omaha
San Paulo
LiberiaBogota
Port ofSpain
Medellin
Lima
South / CentralAmerica, CaribbeanSouth / Central
America, Caribbean
*
* Mexico includes all airports managed by GAP, ASUR and OMA
San Jose
San Juan
Quito
Santiago
Rio De Janeiro
Natal
ManchesterNewcastle
Donetsk
Cairo
Nantes
Stockholm
Istanbul
Europe / Russia/ Middle EastEurope / Russia/ Middle East
*
Spain includes all airports managed by AENA
Birmingham
Oman
MedinahHeraklion
JeddahRiyadh
Morocco
MoscowHamburg
London
Cheongju
Krasnoyarsk
AsiaAsia
SiemReap
ShanghaiKunming
Beijing
Khabarovsk
Hong Kong
Singapore
SeoulICN

77
Introduction to the GAP Mexican Pacific Airports

88
Mexican Pacific Airport Group (GAP) maintains and operates 12 airports in Mexico, as well as Montego Bay Jamaica
Source: GAP
Airport Code
Guadalajara GDL
Tijuana TIJ
Puerto Vallarta PVR
Los Cabos SJD
Hermosillo HMO
Leon BJX
La Paz LAP
Mexicali MXL
Morelia MLM
Aguascalientes AGU
Los Mochis LMM
Manzanillo ZLO
Montego Bay MBJ
TIJ4.4-3%%
GAP airports served 29.2 million passengers in the 12 months ending June 2015, representing 4% growth over the previous year
MXL0.57%
HMO1.3-5%
LAP0.71%
SJD3.1-11% PVR
3.418%
GDL9.17%
LMM0.325%
ZLO0.2-1%
MLM0.54%
AGU0.619%
BJX1.323%
Passengers, MillionsYear-over-Year % Change
Investors include:
GAP listed on:
MBJ3.86.7%

99
Diversified Portfolio of Airports
Public Float85%
Aeropuertos Mexicanos del Pacífico15%
Controladora Mexicana de Aeropuertos (CMA)
66.6%
AENA Internacional
33.4%
GAP‐at‐a‐GlanceRelevant Information
Airport Geographic Presence in México
Shareholder Structure> Grupo Aeroportuario del Pacífico, S.A.B. de C.V. is a holding
company that operates 12 airports throughout Mexico’s Pacific region. The concession was granted for a 50-year period and will expire in 2049.
• In addition, in April 2015 GAP acquired “DCA” (Spanish company), which has a majority stake in MBJ Airports Limited.
• GAP’s shares are listed on the NYSE under ticker symbol “PAC” and on the Mexican Stock Exchange under ticker symbol “GAP”.
• S&P (mxAAA/stable/mxA-1+) and Moody’s (Aaa.mx/stable/Baa1)
2014 Profitability: • EBITDA of Ps. 3,690 mm (+13.3%), EBITDA Margin of 70.1%• 2014 dividends paid were Ps. 3,100 mm
Page 9
MexicaliTijuana
Hermosillo
Los Mochis
La PazLos CabosAguascalientesGuanajuatoPuerto VallartaGuadalajaraMoreliaManzanillo
Passenger share by Airport 2015
Jamaica
Desarrollo de Concesiones Aeroportuarias100%
MBJ Airports Limited74.5%

1010
Key events:• 2006 – 2007 – Low‐Cost Carrier Effect / Price Wars • 2008 – 2009 – Exit of 8 airlines, economic downturn and AH1N1 crisis • 2010 – 2011 – Mexicana Airlines ceases operations• 2012 – 2014 – Traffic Recovery, surpassing 2008 numbers• 2015 – Traffic reached highest numbers in Gap´s history
Page 10
GAP Passenger Traffic History
Traffic Composition 2015…
11.8%CAGR ' 06 vs 15:
4.42%

1111
A Company focused on profitability and development
Page 11
GAP continues generating constant growth, despite being in a mature industry, but with a great opportunity of growth in
future years.
CAGR ' 06 vs 14: 10.65%
*Figures include the recognition of a gain in the fair value of theacquisition of DCA and MBJ, which generated one‐time other incomeof Ps. 161.9 million.
2,023 2,337 2,239 2,134
2,441 2,597
2,939 3,256
3,690
4,517
‐
500
1,000
1,500
2,000
2,500
3,000
3,500
4,000
4,500
5,000
2006 2007 2008 2009 2010 2011 2012 2013 2014 2015E*
Millions
EBITDA
CAGR ' 06 vs 15E: 9.34%
Billion
s of M
exican
Pesos

1212
What are the objectives of this session?
1. Understand the value of an Air Service Development Program
2. Learn the essential elements of an airline business case
3. Understand the network planning process of an airline
4. Learn how to conduct a route forecast (traffic and revenue)
5. Understand the key elements of a “Business Case” for airlines
6. Understand the need for Financial Incentives and a Stakeholder Committee

1313
Aviation Industry Overview

1414
World air traffic growth has outpaced GDP growth – a trend that is forecast to continue well into the future
0
500
1,000
1,500
2,000
2,500
3,000
3,500GDP History & Forecast
Traffic History
Airbus Traffic Forecast (4.7%)
Boeing Traffic Forecast (5.0%)
ICF Traffic Forecast (4.0%)
IATA Forecast (4.0%)
World GDP Growth and Air Transport World Traffic (RPKs)Indexed: 1970 = 100
Note: RPK (Revenue Passenger Kilometer): number of paying passengers x kilometers flownSource: Airline Monitor, February 2015; Oxford Economics; World Economic Outlook, Airbus/Boeing/Embraer Market Outlooks, ICF 2014
ICF’s traffic forecast allows for lumpy economic growth and a weakening of the low‐cost carrier cycle
ICF’s traffic forecast allows for lumpy economic growth and a weakening of the low‐cost carrier cycle
Forecast (2014‐2034)
World GDP
World Traffic

1515
8.0%
6.3%
5.3% 5.4%5.9%
6.7%
4.5%
6.6%
4.0%
5.0%5.6%
6.0%
0%
1%
2%
3%
4%
5%
6%
7%
8%
9%
2010 2011 2012 2013 2014 2015F
Traffic (RPK) Capacity (ASK)
Airlines appear to have found the art of “capacity discipline” in recent years, much to the delight of investors
Source: IATA Air Transport Market Analysis – Dec reports from 2010‐2014, September report for 2015
2015 YTD (September)
Passenger Traffic / Capacity GrowthYear‐Over‐Year Percent Change
As a result, average load factor has not dropped below 78% for over two yearsAs a result, average load factor has not dropped below 78% for over two years

1616
In the next 20 years, IATA forecasts a 4.0% annual average growth in global air passenger journeys – differing by region
Source: IATA
North America651m3.3%
Europe577m2.6%
Middle East250m5.1% Asia Pacific
1753m4.9%
Africa190m4.9%
2.2 times the number of air passenger journeys in 2034
compared with today
In order‐ China, USA, India, Indonesia, Brazil are expected to have the biggest increases
in passengers numbers
Latin America328m4.4%
Growth and change in passenger journeys by region (% and million, 2014‐2034)

1717
-$6 -$4
$5
$15
-$26
-$5
$17
$8$6
$11
$20
$25
-$30
-$20
-$10
$0
$10
$20
$30
2004 2005 2006 2007 2008 2009 2010 2011 2012 2013 2014 2015F
Driven by capacity discipline, airline consolidation, and lower fuel costs, the industry has successfully returned to profitability
Global Airline Profitability (Net Profit)
Source: IATA Central Forecast Dec 2014
$ Billions

1818
Aviation fuel costs have dropped significantly during the past years to below $40/bbl (65% lower than summer 2014)
(USD)
If sustained, low fuel prices could bring dramatic changes to the industryIf sustained, low fuel prices could bring dramatic changes to the industry
Oil Price per Barrel (US$) – WTI Cushing, Oklahoma
Source: U.S. EIA data of January 18, 2016
$0
$20
$40
$60
$80
$100
$120

1919
ICF sees a number of potential impacts on aviation if low oil prices are sustained
income Increase of disposable income higher air travel demand
Lower airline operating costs can flow through to increased travel demand due to lower ticket prices
Higher profitsOlder airplanes kept in service longer
Capacity increases at a slightly greater rateMore new entrants/start‐up carriers(especially in emerging markets)
Higher air travel demand increased traffic at airports increased spending while at airports
Increased demand for airport access by airlinesDemand for more space to accommodate increased capacity
Air Travel Demand
Passenger Airlines
Airports
Sustained Low PricesNear Term
Source: ICF research
Industry consensus is it’s too early to tell if the reductions will be long‐termIndustry consensus is it’s too early to tell if the reductions will be long‐term
2020
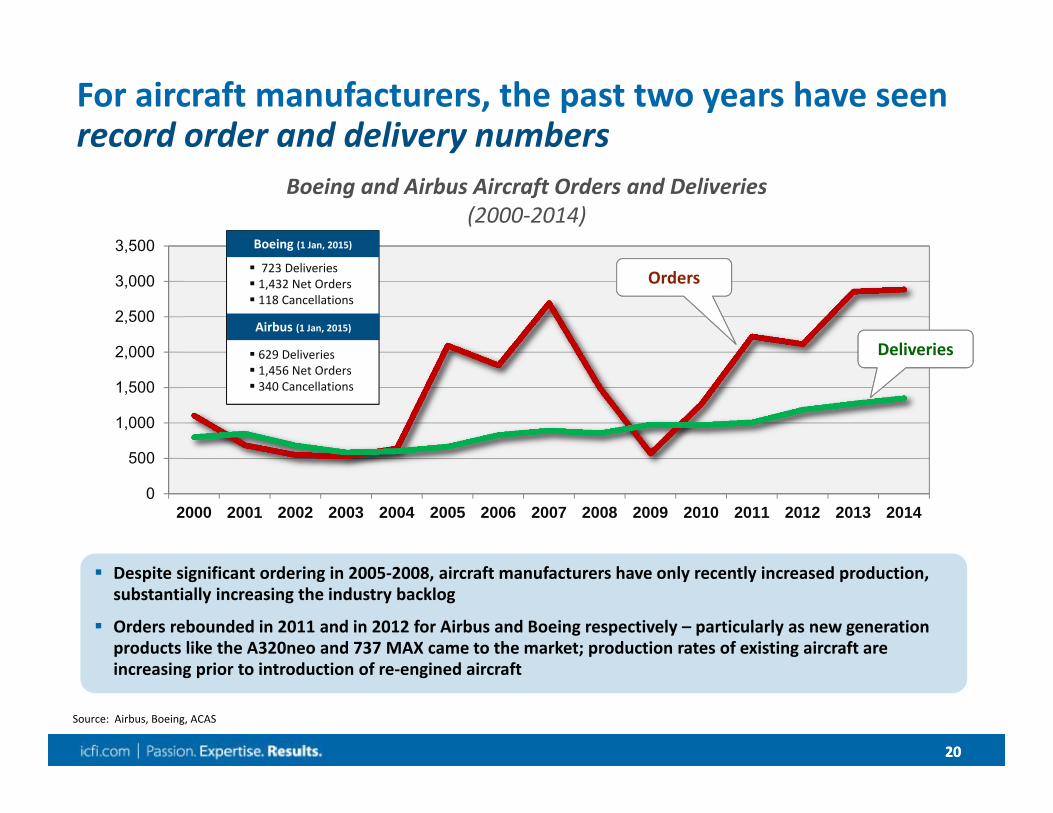
For aircraft manufacturers, the past two years have seen record order and delivery numbers
Despite significant ordering in 2005‐2008, aircraft manufacturers have only recently increased production, substantially increasing the industry backlog
Orders rebounded in 2011 and in 2012 for Airbus and Boeing respectively – particularly as new generation products like the A320neo and 737 MAX came to the market; production rates of existing aircraft are increasing prior to introduction of re‐engined aircraft
Source: Airbus, Boeing, ACAS
0
500
1,000
1,500
2,000
2,500
3,000
3,500
2000 2001 2002 2003 2004 2005 2006 2007 2008 2009 2010 2011 2012 2013 2014
Boeing and Airbus Aircraft Orders and Deliveries (2000‐2014)
Deliveries
Orders
Boeing (1 Jan, 2015)
Airbus (1 Jan, 2015)
629 Deliveries 1,456 Net Orders 340 Cancellations
723 Deliveries 1,432 Net Orders 118 Cancellations

2121
Airline strategy continues to evolve – a new long‐haul, low cost model has emerged
Note: Aircraft includes those place by operator and by lessors assigned to operator; Source: Innovata; CAPA
December 2013
December 2015 • 26 787‐9 Dreamliners on order• 9 long‐haul destinations added

2222
Airline strategy continues to evolve – hybrid low cost carriers are blurring the line between full service carriers and pure low‐cost carriers
Source: Innovata
New hybrid model: combination of cost savings methodology of pure LCCs with the services, flexibility, and routes structure of full service carriers
Low‐cost Carriers Full Service Carriers
Short haul, point‐to‐point
Same fare to all customers
No codesharing
Direct sales only
Single aircraft type/ one seating class
Short and long‐haul; connecting flights
Differentiated fares
Use of codesharing/alliances
Distributes through GDS
Mix of aircraft types / mix of seating classes
Network
Fares
Partnerships
Sales/Dist.
Operations
Examples:

2323
Airline strategy continues to evolve – New global network carriers have emerged to challenge existing players
Source: Innovata
December 2008 December 2015
+39 Destinations
‐8 Destinations
2424
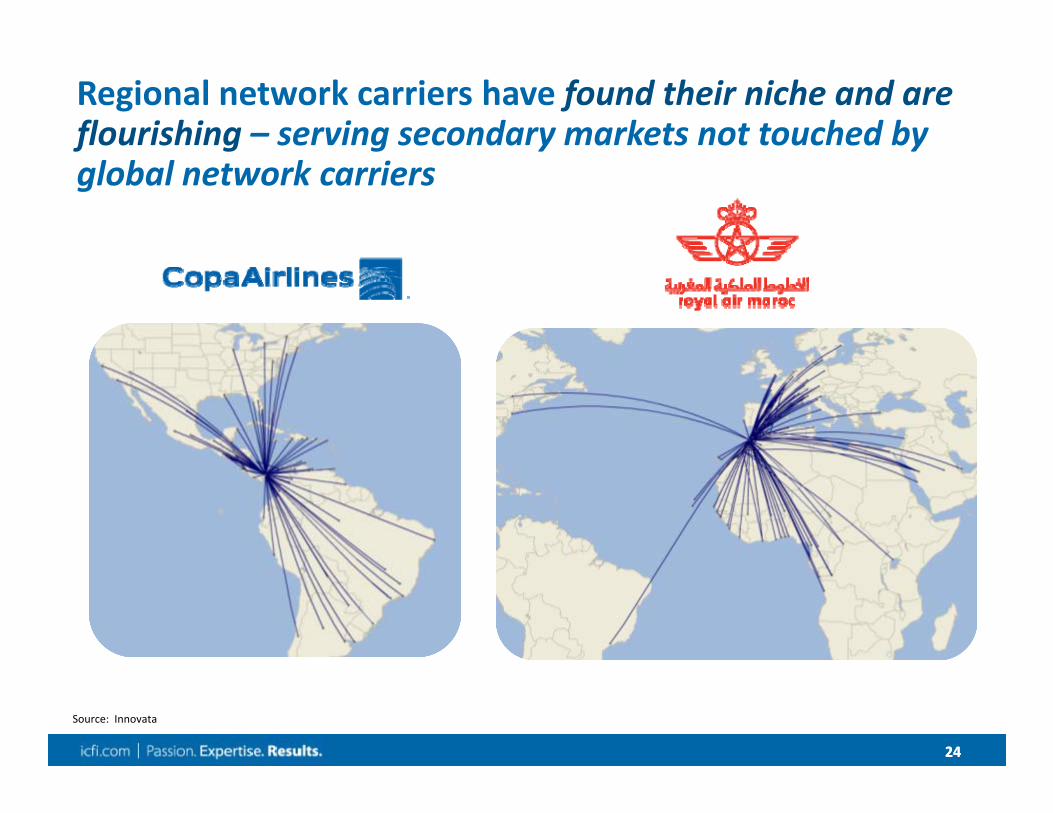
Regional network carriers have found their niche and are flourishing – serving secondary markets not touched by global network carriers
Source: Innovata

2525
What is the aviation outlook beyond 2015?
The air transport industry enjoys solid growth drivers, including:– Population growth
– Increasing air service liberalization
– Economic dynamism of emerging countries
Global economic expansion is expected to, which in turn will drive air travel demand, though performance will vary by region:– North America is leasing the economic global acceleration
– Eurozone is finally gaining momentum
– Despite concerns of economic slowdown in China, Asia remains a high growth region
– Latin American economies dependent on natural resources have slumped recently, though the long‐term trend is positive
Low cost carrier (LCCs) expansion is another aspect of the markets structure that will evolve. Low cost carriers are oised to take advantage of the growing middle classes in emerging markets that are flying for the first time
Source: Airbus

2626
Connecting your Destination through Air Service Development

27
What is Air Service Development (ASD) and what are its primary objectives?
Proactive strategy to influence airlines’ decision‐making process and increase air service by communicating the strengths of your destination – while talking to airlines in their own “language”
OBJECTIVES:
Create new first‐time flights– New markets; New airlines
Maintain existing flights– Monitor current performance
– Stay in contact with the airlines
Promote growth– More frequencies; Larger aircraft;
Better schedule
WHO:
ASD programs can be run by: – An airport, a destination, a region
or at the national level
– Should include multiple stakeholders so the destination talks with one‐voice
For all types of destinations:– Leisure, religious, cultural, etc.

28
Why does your airport/destination need an Air Service Development Program?
Your destination is competing with thousands of other destinations for air service – airlines have limited fleets and resources!
Airports Around the World – Traffic Density

2929
What does an ASD program consist of?
Ongoing Communication with Airlines and Operators – Not just one time!
Talk to airlines in their own language – with their own metrics and methodologies
Information about the
destinations (news ahead of time)
Quantitative business case with a specific proposal and
forecast
Team of stakeholders: one entity the
airline can speak with about service
Incentive program and support for the airline
A well‐coordinated effort that combines:

3030
Air Service Development strategy involves a diagnostic of the market, establishing a strategy and creating an implementation plan
1Diagnostic 2 DefineStrategy 3 Implement
Air Service Development Strategy
Benchmarking
Historical Evaluation
Airline Strategy
Identify Opportunities
Estimate Demand
Prioritize
Define Communication Plan
Conferences and Meetings
Support Channels
Business Cases
Introduction to the Market
Demand Statistics
Proposed Itinerary
Traffic/Revenue Projections
Incentives and Support
The Business Cases are the key tool for executing your Air Service Development Strategy
The Business Cases are the key tool for executing your Air Service Development Strategy

3131
The diagnostic of the airport environment is an essential step in identifying new opportunities for air service
Benchmarking– Compare the service offering (destinations, airlines, frequencies) of your airport vs.
competitors in the same region
Historical evaluation of traffic and service offering– Understand where the growth is, what hasn’t worked, where there is potential for growth,
etc.
Airline Strategy– Understand how airlines operate (Hub, point to point), evolution of alliances, aircraft
orders, etc.

3232
161100 100 82
52 48 28 22
93
206
92
369
5034
0
50
100
150
200
250
300
350
PTY LIM BOG SCL SJO CCS UIO GYE
Domestic
International
Example: Comparison of Quito’s international service vs. other airports in the region
Source: OAGSource: OAG
Weekly Seats by Airport (‘000s) June 2014
UIO has a lower international service offering than its competitorsUIO has a lower international service offering than its competitors

3333
The diagnostic allows you to define a strategy, focusing on and prioritizing objectives to increase air service
Identify potential routes and airlines– What existing routes merit additional service?
– What new routes do I want to promote?
– What airlines do I want to attract?
Estimating Origin‐Destination demand– This is the key element of air service development that allows you to:• Determine the volume of traffic in the local market and beyond‐hub• Understand the seasonality of traffic• Identify the point of sale
Establish priorities– Prioritize opportunities in the short, medium, and long‐term
– Understand the effort needed to achieve each objective

3434
Lastly, the best method of implementing the strategy should be determined – attending meetings and taking advantage of other support channels
Define how to contact the airlines of interest– Conferences and/or direct meetings with airlines
– Begin with the regional office or directly with headquarters?
– Contacting the right people saves time: Planners
Choose the conferences/frequency of attendance that best fit your strategy– Regional, global conferences• Routes, Jumpstart, Tourism conferences for vacation markets
– How many times per year?
Take advantage of external support channels– What other stakeholders can support the effort to develop air service?
35
Elements of an effective Business Case
Economic, demographic, tourism, etc. trends
Developments that will generate new traffic
Existing service Historical traffic growth Market size
Comparison with other similar markets operated by the airline
Schedule / Aircraft Passengers (local and connecting)
Revenue Impact on other routes (if applicable)
Information Promoting your Market
Summary of Existing Service and Demand
Fit with the Airline’s Strategy
Route Forecast
Support for the New Route
Airport Information
Incentives Marketing assistance External support channels
Runway and terminal specifications
Rates and charges

36
Risk sharing and commitment are sought by many airlines, by way of financial incentives
Financial incentives from the airport can take many forms:– Discounts on traditional airport fees– Creative solutions (e.g. rebates, fuel savings) – Pre‐purchase of airline tickets by local businesses for
future use– Revenue and profitability guarantees– Funds for advertising and promotion
Other Stakeholders– Discounts on hotel, transportation and meals for
airline crew overnights– Preferential rates for airline vacation programs at
hotels and tourist attractions
Examples of airport discounts– Landing Fees– Security screening– Jet‐bridge
– Parking– Rental of check‐in counters
and office space

3737
Growing Air Service Usually Requires You…
Work with an Air Service Committee of stakeholders– If you don’t have one, start one!
Include Air Service planning – far in advance
Talk to airlines and operators regularly– Have an ongoing relationship with them– Tell them things they don’t know– Give them concrete proposals and financial incentives– The destination should speak with one voice and present unified proposals
– Attend “Routes” conferences, both global and regional– Attend relevant tourism conferences such as ITB, FITUR, World Travel Market
If you are not sure of how to do these things, ask for help!

3838
Golden Rules:
1 Do not assume that airlines and operators have enough staff or enough information to be evaluating your market regularly – they don’t!
2 Airports and destinations must be continually supplying information and making proposals in order to stay “top of mind”
3 Remember that you are competing with (many) other destinations and airports for limited airline capacity

3939
Airline Route Planning Process

40
Formal planning process
Centralized planning process with little input from regional offices
Various planning levels with different time horizons
Expansion plan guided by long‐term strategy
Focused on profitability
Less formal process
Value the input of their regional representatives
Few decision makers
Expect to share the risk (with the airport, tour operators, etc.)
Focused on growth
Focused on high volumes of traffic
In order to make logical and interesting route proposals to airlines, it’s important to understand how airlines think
Traditional Airlines “Niche” Airlines

4141
FINALIZE
The planning process for a traditional airline is long…
PLANNING
STRATEGY
FleetProductNetwork DesignFacilities
MarketsStaffItinerary StructurePreliminary Itinerary
5 Years 3 Years – 18 Months This YearHorizon
Final ItineraryAvailability of staff/gatesRates/Slots

4242
…While for “niche” airlines, the process is more streamlined
PLANNING
STRATEGY
FleetProduct
Prioritization of markets
1‐2 Year This YearHorizon
You will probably present to a
decision‐maker
You will probably present to a
decision‐maker

4343
What do airlines consider when evaluating a new route?
Network Strategy– Net new aircraft (orders minus retirements)
– Hub(s) structure– Strategy for short/long haul– Strategy for Latin America– Alliance strategy
Risks and Opportunities
Financial Position– Liquidity– Costs and revenue vs. competitors

4444
How does an airline decide to deploy its fleet?
If an airline doesn’t increase its active fleet, new service can only be added if an existing service is cancelled – It is difficult to create new international service by increasing the fleet’s utilization (i.e., the hours operated)
New (net) aircraft can be used for:– Increase frequencies on existing routes– No route development costs
– Increase the aircraft size on an existing route– No route development costs
– Open a new route/destination– Requires investment in staff, offices, marketing, etc.

4545
For the airport, the question is whether there is or is not demand– Can a high load factor and good fare be achieved?
For the airline, traffic and profitability are just the beginning– Do we have the right aircraft?– Does the route fit within our network strategy?• Independent• Our alliance
– Is the risk – reward trade‐off acceptable?– How does this opportunity compare with others?
For airlines, route planning is a question of finding the best use of limited resources

46
What chance does an airport have in influencing the decision‐making process of an airline?
Minimize risks associated with opening a new route
Make the best use of limited resources– Aircraft and staff– Planning analysts (important: airlines
cannot assess all opportunities)
Identify and analyze hundreds of new route opportunities– Participation in route development
conferences demonstrates that airlines seek help in this process
Reduce or share the risk– Reduce airport costs– Marketing assistance– Economic incentives for the route
Demonstrate a commitment to the client’s needs– Efficient operations– Modern and well‐maintained
infrastructure
Identify opportunities through a logical, quantitative, and convincing Business Case
The Goals of the airline… …are Opportunities for the airport

4747
Conducting a Route Forecast

4848
Overview of the route forecasting process
Identify potential markets
Choose the aircraft type for the airline/market
Collect data on existing demand and service offered
Define assumptions for the forecast– Suggested itinerary– Growth rate of traffic– Average fare– Market share

4949
Considerations when choosing the proposed aircraft
Aircraft range
Size corresponds to level of demand
Aircraft used by the airline in similar markets
Orders and delivery schedule
Operating restrictions– Runway length– Height above sea level, temperature– Noise restrictions
Key FactorsKey Factors

5050
Example of aircraft range analysis
Engine CF6-80C2B7F GE90-94B GEnx-1B70 CFM56-7B26 CFM56-7B27-B1 PW2040Capacity 218 PAX @ 210 lb 300 PAX @ 210 lb 242 PAX @ 210 lb 126 PAX @ 210 lb 162 PAX @ 210 lb 201 PAX @ 210 lb
Distance (nm) 767-300ER 777-200ER 787-800 737-700 737-800 757-200Europe
MAD 4,711 YES - 9,800 lb cargoAMS 5,148 NO NO NOCDG 5,043 YES - 520 lb cargo
LatinAmericaEZE 2,377 YES - 42,300 lb cargo YES - 6,900 lb cargo YES - 860 lb cargoSCL 2,058 YES - 10,400 lb cargo YES - 4,800 lb cargoGRU 2,341 YES - 7,400 lb cargo YES - 1,300 lb cargo
North AmericaEWR 2,446 YES - 6,200 lb cargo YES - 70 lb cargo YES - 12,260 lb cargoYYZ 2,610 YES - 4,482 lb cargoLAX 3,024 YES - 26,600 lb cargo
AsiaICN 8,143 NO NO NO
Preliminary Analysis of Aircraft Range

51
Local
Connecting Online
Interline
With Code Share partners
Possible PassengerFlows
Types of Connections
Identify local and connecting markets (on the same airline or multiple airlines) what will feed the proposed route

5252
PaxIS– Captures tickets purchased through all travel agencies that participate in IATA’s BSP and includes:• Origin and Destination airports, Connecting airports• Airline that markets and operates each segment, Point of sale• Month of trip, Fare class
– PaxIS supplier, IATA, estimates full market size
Market Information Data Tapes (“MIDT”) – Captures reservation data from the primary GDS systems (Amadeus, Sabre, Worldspan y Galileo). The level of detail is similar to what is provided by PaxIS
Estimate the size of the Origin – Destination market: the essential ingredient for making a successful Business Case
Sources of Origin – Destination Traffic Data
However, neither MIDT nor PaxIS capture direct sales…However, neither MIDT nor PaxIS capture direct sales…
53
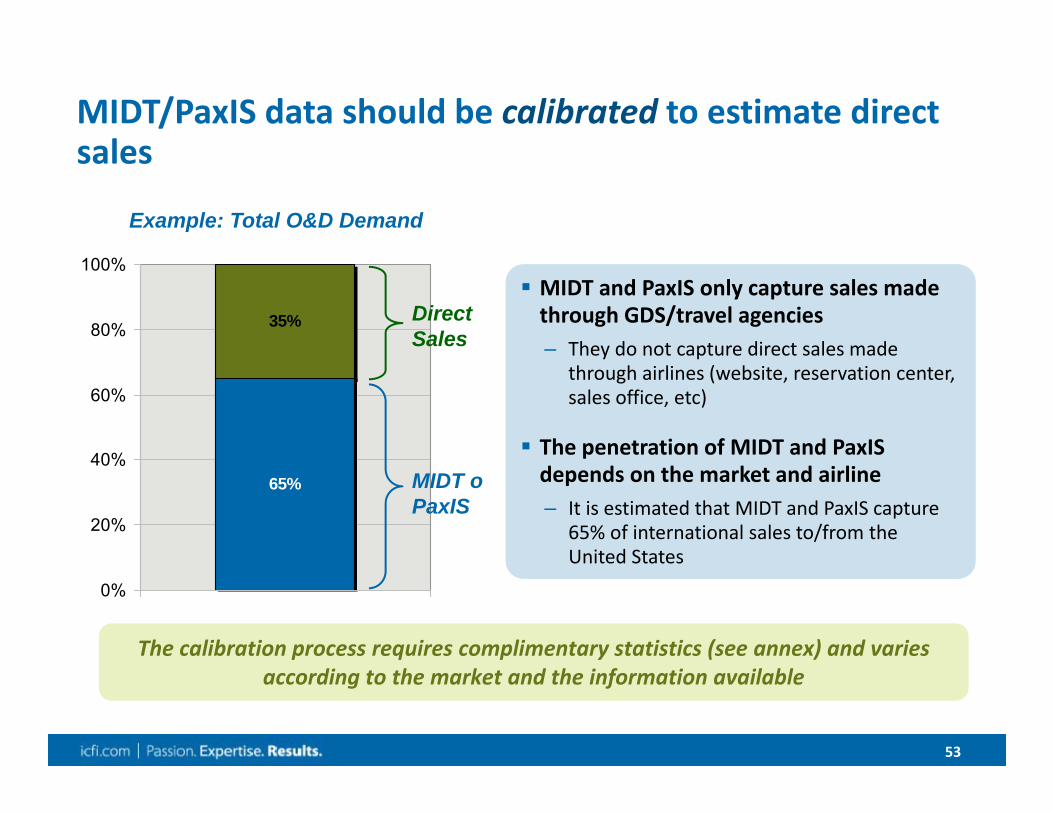
MIDT/PaxIS data should be calibrated to estimate direct sales
65%
35%
0%
20%
40%
60%
80%
100% MIDT and PaxIS only capture sales made through GDS/travel agencies– They do not capture direct sales made
through airlines (website, reservation center, sales office, etc)
The penetration of MIDT and PaxISdepends on the market and airline– It is estimated that MIDT and PaxIS capture
65% of international sales to/from the United States
MIDT and PaxIS only capture sales made through GDS/travel agencies– They do not capture direct sales made
through airlines (website, reservation center, sales office, etc)
The penetration of MIDT and PaxISdepends on the market and airline– It is estimated that MIDT and PaxIS capture
65% of international sales to/from the United States
Example: Total O&D Demand
MIDT o PaxIS
DirectSales
The calibration process requires complimentary statistics (see annex) and varies according to the market and the information available

5454
After calculating the actual Origin – Destination traffic, the demand stimulus generated by the new service must be estimated
New nonstop flights typically stimulate traffic demand– Stimulus is the result of easier market access and greater marketing of the destination (airlines, tour operators, etc.)
– New service attracts new passengers, just as it allows existing passengers to travel more frequently (above all in the business segment)
A market’s first nonstop flight can stimulate demand between 100% and 300%
In addition to demand in the local market, it is common to see lesser stimulation in connecting markets, especially when the airline serving the new route has a strong presence in the connecting markets

5555
For example, KLM’s entrance in the Amsterdam‐ Panama City market stimulated traffic
0
200
400
600
800
1,000
1,200
1,400 Other routingsAMS‐PTY nonstop6‐month average
1,030 Pax/Month(+161%)
395Pax/Month
1,150Pax/Month(+192%)
Amsterdam – Panama City TrafficApril 2007 – March 2010
Amsterdam – Panama City TrafficApril 2007 – March 2010
Source: MIDT, April 2007 – March 2010
MonthlyPassengers

5656
Estimating average fares by origin – destination market
Both PaxIS and MIDT have information on average fares by market– However, both sources tend to over estimate the fare as more price –sensitive passengers tend to to use direct sales channels
Average fares by airline and market can also be found on the internet– Travel agencies such as Expedia, Travelocity, Orbitz, etc.– Search engines such as Sidestep, Kayak, etc.– Airline websites
In order to estimate the average fare on the proposed route, it isrecommended to use the best information possible for markets with a similar profile as a point of reference

5757
Choosing the schedule – Key Factors
It is an airline that connects passengers through a hub?– If so, the schedule should fit into a connecting bank in order to maximize traffic
Does the airline have alliance partners at the airport?– If so, “online alliance” connections should be considered
What are the schedules in similar markets?– Overnight?– Morning arrival/departure? Evening? Etc.
How many weekly frequencies?– The maximum possible should be proposed according to demand, but also consistent with similar markets operated by the airline
Seasonal or year‐round service?– Depends on the seasonality of traffic and the type of market (business, leisure, VFR, etc)

5858
For example, in the case of a proposal for Copa, any new route should fit into a connecting bank
-10
-5
0
5
10
7:00
8:00
9:00
10:0
0
11:0
0
12:0
0
13:0
0
14:0
0
15:0
0
16:0
0
17:0
0
18:0
0
19:0
0
20:0
0
21:0
0
22:0
0
Operations by hour at PTYJune 2010
Operations by hour at PTYJune 2010
Arr
ival
sto
PTY
Dep
artu
res
from
PTY
Source: OAG Schedules
Bank1 Bank2 Bank3 Bank4
5959
All of this information is needed for the essential analysis of the Business Case: the forecast of market share, passenger traffic, and revenue on the proposed route
ICF SH&E uses NETWORKS, a proprietary tool that models route schedules to estimate the market share of each airline– Currently used by British Airways, Copa Airlines, Virgin Atlantic, Oneworld
NETWORKS is “QSI” (Quality of Service Index) model, an industry‐accepted methodology for calculating carrier share
NETWORKS quantifies the market share of each segment (the “QSI”), taking into account: – Type of service (Online, Interline, Etc.)
– Frequency
– Number of stops and connections
– Total travel time (between origin and destination)
– Type of aircraft (size, jet vs. turboprop)
– Etc.

6060
What is a “local” passenger?
“Local” passengers begin their journey at the flight’s departure airport and end their journey at the flight’s arrival airport (and vice versa)– Local passengers do not make connections or change planes
Example: Houston – Quito
IAH UIO

6161
What is a connecting passenger?
A connecting passenger begins their journey at a point before flight’s origin and/or ends their journey at a point beyond the flight’s destination– These passengers make one or more connections
Example: Houston – Quito
UIO
NRT
ORD
IAH

62
QSI example: SCL – NYC market
SCL
LIM
MIA
NYC
AA/LA
DL
AA
DL
LA
ATL
LALA
Source: SH&E NETWORKS based on OAG schedules June 2010
QSI Share SCL‐NYCJune 2010
Option Time Frequency Stops Cxns
LA nonstop 10:50 5x weekly 0 0
LA via LIM 12:30 Daily 1 0
AA via MIA 13:40 Daily 1 1
DL via ATL 13:55 Daily 1 1
LA41%
AA29%
CM6%
DL14%
Others10%

6363
The model quantifies each service in the market and allocates traffic and revenue according to its market share
Note: SICF uses thenomenclature “CSI” to refer to “QSI”
“QSI” is calculated based on several service perameters
Each carrier’s market share is based on its QSI score

6464
Traffic and Revenue Forecast for the Route FLL – UIO2010
Frequency: 2x WeeklyAircraft: A319Frequency: 2x WeeklyAircraft: A319
Revenue from passenger tickets is complemented by other sources (cargo, onboard sales, etc), which is estimated based on each airline’s experience
Revenue from passenger tickets is complemented by other sources (cargo, onboard sales, etc), which is estimated based on each airline’s experience
(Financials in USD) Per Flight Per Week (4 Flights)Passengers % Total Revenue Passengers Revenue
Local MarketMiami - Quito 54 56% $11,678 217 $46,712
Connecting MarketsNew York - Quito 29 30% $4,118 118 $16,473Chicago - Quito 4 4% $520 15 $2,082Quito - Washington 3 3% $483 13 $1,934Boston - Quito 3 3% $377 11 $1,508Orlando - Quito 2 2% $290 8 $1,161Other 2 2% $129 7 $517Total Connecting 43 44% $5,919 173 $23,675
Total Pax/Pax Revenue 98 $17,597 390 $70,386
Other Revenue ( @ 10% of pax) $1,760 $7,039Total Flight Revenue $19,356 $77,425
Load Factor 68%Average Fare (excl. surcharges) $180
The final result is a traffic and revenue forecast for the proposed route
Local PassengersLocal Passengers
Connecting Pass.Connecting Pass.
Other RevenueOther Revenue
Load Factor and FareLoad Factor and Fare
Frequency and AircraftFrequency and Aircraft

6565
For top tier airlines, network simulation tools have become an integral part of today’s management decision making process
Why? In an increasingly complex business environment with narrowing profit margins, simulation enables airlines to reduce financial exposure and risk
Who uses NetWorks?
Schedule and network planners Airline strategists Fleet and capacity managers Revenue Planners, and Regional Managers
… to help them better understand their network’s strengths and weaknesses – by itself and against its competitors
Network & Schedule Analysissystems and services
[ ][ ][ ][ ]
Created for Air France and fully developed for British Airways over ten years ago, NetWorks has been
continuously refined ever since
Created for Air France and fully developed for British Airways over ten years ago, NetWorks has been
continuously refined ever since
NetWorks traces its heritage to SH&E founder Nat Simat, who developed the original methodology while serving on the US CAB
6666
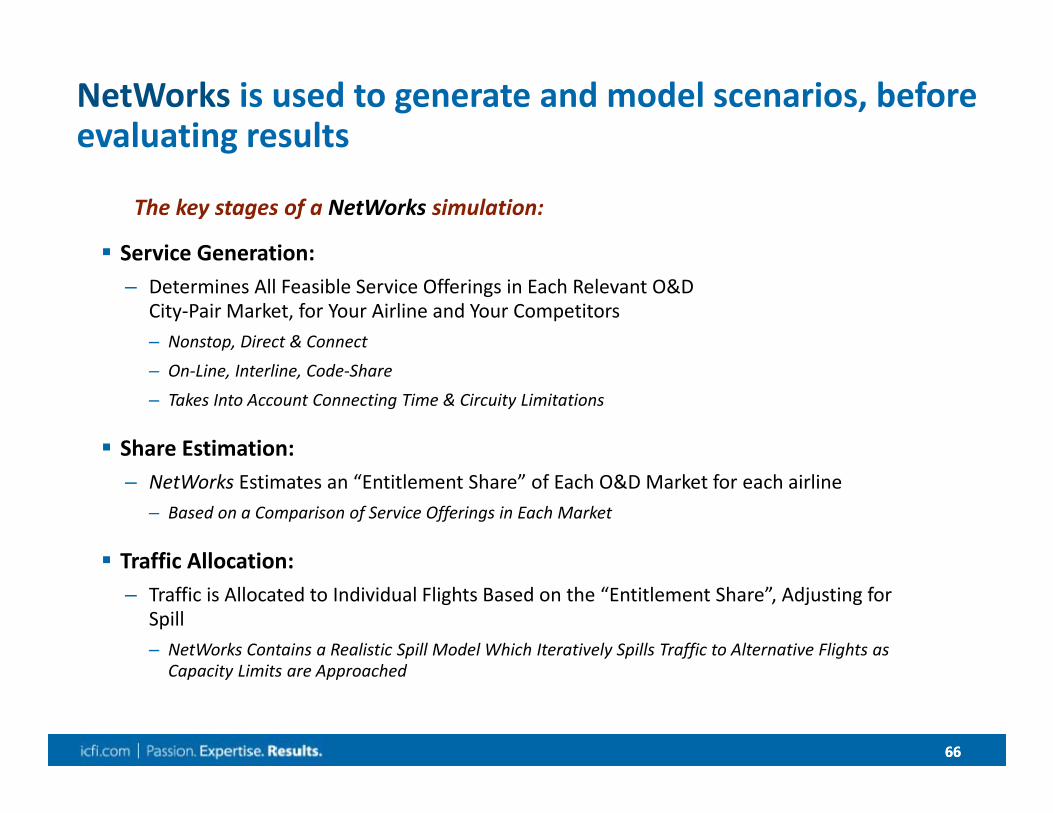
NetWorks is used to generate and model scenarios, before evaluating results
Service Generation:– Determines All Feasible Service Offerings in Each Relevant O&D
City‐Pair Market, for Your Airline and Your Competitors– Nonstop, Direct & Connect
– On‐Line, Interline, Code‐Share
– Takes Into Account Connecting Time & Circuity Limitations
Share Estimation:– NetWorks Estimates an “Entitlement Share” of Each O&D Market for each airline
– Based on a Comparison of Service Offerings in Each Market
Traffic Allocation:– Traffic is Allocated to Individual Flights Based on the “Entitlement Share”, Adjusting for
Spill– NetWorks Contains a Realistic Spill Model Which Iteratively Spills Traffic to Alternative Flights as
Capacity Limits are Approached
The key stages of a NetWorks simulation:
6767
Example Business Case
Guadalajara – Amsterdam, KLMGrupo Aeroportuario del Pacifico (GAP)

Prepared by
Mexican Pacific Airport Group (GAP) Route ProposalsMexican Pacific Airport Group (GAP) Route Proposals
Prepared forGAP by
Opportunity in Guadalajara (GDL)
Prepared for:
19 – 22 September 2015

69
Prepared forGAP by
Introduction
Route Forecast:
About the Destination:
Guadalajara is the 11th largest economy
in Latin America
Guadalajara is the second most
populous city in Mexico…
Guadalajara is one of the major
business destinations in
Mexico
Market Aircraft Season Passenger Segment
Weekly Freq.
Estimated Load Factor
AMS-GDL A330 Annual Business 3 84%
…with access to a population of more
than 16 million
#2

70
Prepared forGAP by
Mexican Pacific Airport Group (GAP) maintains and operates 12 airports in Mexico, as well as Montego Bay Jamaica
Source: GAP
Airport Code
Guadalajara GDL
Tijuana TIJ
Puerto Vallarta PVR
Los Cabos SJD
Hermosillo HMO
Leon BJX
La Paz LAP
Mexicali MXL
Morelia MLM
Aguascalientes AGU
Los Mochis LMM
Manzanillo ZLO
Montego Bay MBJ
TIJ4.4-3%%
GAP airports served 29.2 million passengers in the 12 months ending June 2015, representing 4% growth over the previous year
MXL0.57%
HMO1.3-5%
LAP0.71%
SJD3.1-11% PVR
3.418%
GDL9.17%
LMM0.325%
ZLO0.2-1%
MLM0.54%
AGU0.619%
BJX1.323%
Passengers, MillionsYear-over-Year % Change
Investors include:
GAP listed on:
MBJ3.86.7%

Prepared by
Mexican Pacific Airport Group (GAP) Route ProposalsMexican Pacific Airport Group (GAP) Route Proposals
Prepared forGAP by
Market Overview of Guadalajara

72
Prepared forGAP by
Mexico Highlights
Population of 121 million
Second most populous country in Latin America after Brazil
Member of the North American Free Trade Agreement (NAFTA) with the United States and Canada
In 2014, Mexico was the world’s 15th
largest economy*
Largest Latin American trading partner with Europe and second largest with Middle East/Asia
Average annual GDP growth of 3.5% projected between 2015 and 2018
*2014 Current prices
Sources: IMF World Economic Outlook April 2015; Inter-American Development Bank; European Commission

73
Prepared forGAP by
Passenger traffic and trade between Mexico and Europe have seen steady growth over the last five years
Source: IATA PaxIS, Instituto Nacional de Estadística, Geografía e Informática (INEGI)
The passenger air market between Mexico and Europe has grown by 9% annually in the last 5 years
O&D Passenger Traffic Trend
0
500
1,000
1,500
2,000
2,500
3,000
3,500
YE June2011
YE June2012
YE June2013
YE June2014
YE June2015
Passengers (‘000)
Mexico – Europe O&D TrafficYE June 2011 – YE June 2015
CAGR YE June ‘11 – YE June ‘15: +9%
% Growth Y-o-Y Change +22% 1% +8%+6%
USD Million
0
10
20
30
40
50
60
70
80
YE June2011
YE June2012
YE June2013
YE June2014
YE June2015
Imports from Europe
Exports to Europe
Trade Between Mexico and EuropeYE June 2011 – YE June 2015
+15% +5% +2%-1%Y-o-YChange
CAGR YE June ‘11 – YE June ‘15: +5%

74
Prepared forGAP by
Guadalajara will offer 858 weekly passenger departures to 52 destinations in October 2015
Source: Innovata October 2015
GAP Airports
27 destinations
22 destinations
Panama City
Guatemala City
San José

75
Prepared forGAP by
Guadalajara is the capital of the state of Jalisco, which combined with surrounding states has a population of more than 16 million
Guadalajara has the 2nd largest catchment area in Mexico
16.4m
Source: Consejo Nacional de Población, 2010 census
Rank Catchment Area Airport Population (millions)
1 Mexico City MEX 25.0
2 Guadalajara GDL 16.4
3 Monterrey MTY 11.5
Catchment Area Population = Drive time of 4 hours or less
Top 3 Catchment Areas in Mexico
25.0m
11.5m
GDL
MTY
MEX

76
Prepared forGAP by
Guadalajara is known as the “Silicon Valley” of Mexico, given the strong presence of technology and software companies
150Software and services
companies
20+ Universities that
graduate thousands of engineers and design students each year
600+ High‐technology
companies, more than any other city in Mexico
Guadalajara is home to…
Source: Plan Maestro para el Centro Creativo Digital
8Software/Technology
parks

77
Prepared forGAP by
Guadalajara is fast becoming a hub for start-up and creative/design companies
26 design centers and a multimedia park
35 business in the “Centro de Software”, a start-up incubator
IBM opened a “Smarter Cities Exploration Center” in Guadalajara dedicated to designing solutions for infrastructure challenges
Guadalajara is home to the Ciudad Creativa Digital (CCD), a cluster of digital, entertainment, and creative industries

78
Prepared forGAP by
Recent Business Developments:
The state of Jalisco received USD $1.2 billion in Foreign Direct Investment (FDI) in 2014
Source: El Financiero; El Economista
•After a recent outreach trip to Europe, the state of Jalisco received tentative commitments for investment of at least USD $200 million from 4 German auto manufacturers
•Nestle announced plans to invest USD $360 million in the construction and operation of a food plan that will open in 2016
•Several technology companies have announced investment for expansion projects in the region, including Cisco (USD $30m); Intel (USD $33.7m); y IBM (USD $4.5m)
•Hyatt will open a new hotel in Guadalajara in 2016 with 200 rooms
• A Starwood Luxury Collection Hotel will open in 2015

79
Prepared forGAP by
Source: Secretaría de Desarrollo Económico del Estado de Jalisco
European and Asian companies have offices in Jalisco
European Companies with Investment in Jalisco2007 – May 2015United Kingdom
Avntk S.C.
Worldmark De MéxicoXyratex
NetherlandsAD Optical Disc de México
Hitachi Global Storage Technologies
SpainCopreci de México S.A. De C.V.
Globa End´SHotel Riu Plaza Guadalajara
Inmobiliaria FadesamexMexikor
GermanyBader
Bdt MéxicoBoeringer Ingelheim Vetmedica
BoschContinental Automotive
DräxlmaierEpiq Mx
Fresenius Medical Care de MexicoGoTech
Petosa S.A.de C.V. Polymer Technik Elbe (PTE)
Siemens VDOVoit Automotive de México
VorwekWoco Tech de Mexico
Zf Sachs Suspension México
FranceAlmeria
Gamelofts de R.L. de C.VPromotora Automotriz (FIAT)
Sidel de MéxicoTechnicolor Mexicana
Total México S.A. de C.V.Virbac
Efi Automotive
SwitzerlandNestle México
Kuehne & Nagel
SwedenSandvik Mining and Construction
H&M
IndiaHCL Technologies Mexico
MGDC SC (Tata)
JapanDaido Metal
Miyazaki Seiko
Nippon Shokuhin

80
Prepared forGAP by
Foreign investment from Europe is distributed across a variety of sectors and totaled USD $500 million 2014
Source: Secretaría de Desarrollo Económico del Estado de Jalisco; Ciudad Creativa Digital
Investment Projects in the State of JaliscoBy Sector2011-2014
Automotive42%
Electronics17%
Renewable Energy9%
Trade8%
Food and Beverage8%
Aerospace8%
Construction4%
Information Technology
4%
The state of Jalisco has been the country’s leader in investment in the electronics sector for the past decade
In 2014, 15 companies have decided to invest in Jalisco, with a total investment of $500 million dollars and 2,600 potential employees

81
Prepared forGAP by
Due to a large number of both business and leisure travelers throughout the year, Guadalajara has a well-developed hotel infrastructure
Source: SECTUR. Cifras preliminares 2012
Guadalajara has many rich cultural attractions including, colonial architecture, museums,
shopping, various dining options, and exciting nightlife
Accommodation in GDL (2014)
Rooms (4 stars or more) 10,773
% Occupancy (4 stars or more) 58%

82
Prepared forGAP by
In 2017 a new highway will open between Guadalajara and Puerto Vallarta, reducing the drive time by 90 minutes
The new highway will connect Guadalajara with Puerto Vallarta in 3 hours (current drive time is 4.5 hours)
Puerto Vallarta is a popular leisure destination in Mexico, offering 40 km of beaches, world-class golf courses and sport fishing, among other activities
GDL

83
Prepared forGAP by
Guadalajara is a Gateway to other economically important regions in its catchment area
Sources: El Financiero; El Economista
Leon-Guanajuato
Aguascalientes
Michoacán
León-Guanajuato is one of Mexico’s most economically important cities
The state has a high presences of companies in the agro-industrial and automotive industries
Aguascalientes is another leading city in the country’s automotive industry
There are currently 75 automotive industry investment projects underway, with over 100 companies operating in the sector
These three regions are more accessible from Guadalajara
than Mexico City
Michoacán is an important logistics center with modern highway, rail, maritime, and air transportation infrastructure
The state’s geographic position gives it access to 60 million consumers, or 55% of national consumption

84
Prepared forGAP by
0 2 4 6 8
7. Nayarit
6. San Luis Potosi
5. Aguascalientes
4. Guanajuato
3. Querétaro
2. Michoacán
1. Colima
Guadalajara Mexico City
Most of the flights between Mexico and Europe go through Mexico City, and the majority of the passengers from the Guadalajara catchment areadrives to Mexico City to travel
Ground Travel TimeGuadalajara catchment area versus Mexico City
Ground Time
Places in states like Guanajuato, Aguascalientes, Michoacán, Colima and Nayarit have easier access to GDL, by distance and to avoid the
chaotic traffic at Mexico City
Source: México SCT
Time (Hours)
GDL
MEX1.
2.
3.4.
5.
6.
7.

85
Prepared forGAP by
The demand between Guadalajara and Europe, potential for KLM, consists of the local market from the city of Guadalajara and thedemand in the catchment area
GAP and ICF have used the following method to build market sizes:
1
2
3
4
Local demand from GDL
Passengers in the Guadalajara catchment areawho currently travel from/to Mexico City (using a point of sale analysis)
Market stimulation following new non-stop service
Size of the demand
=
+
+

86
Prepared forGAP by
KLM has the opportunity to be a leading airline between Mexico and Europe with a potential demand of more than 1,800 passengersweekly each way between Guadalajara and its catchment area
Potential demand between Guadalajara and EuropeActual air traffic + Traffic from the Guadalajara catchment area
Average weekly demand 2016, one-way
1/ Includes Jalisco, Guanajuato, Michoacán, Querétaro, Aguascalientes, Colima and Nayarit2/ Does not include the demand stimulation due to a new non-stop service
Source: MIDT – POS Analysis, PaxIS Market Sizes and ICF Analysis
The potential number of passengers who could fly from/to Guadalajara and who are currentlyflying from/to Mexico City was determined based on the analysis of the zip codes of passengers
flying from/to Mexico City
Local demand – one way Guadalajara –Amsterdam
Guadalajara – OtherEuropean destinations
Guadalajara – AllEurope
Actual Area 39 1,210 1,249
Diverted MEX1
(Guadalajara Area of Influence) 18 545 563
Total Potential withoutstimulation2 57 1,755 1,812

87
Prepared forGAP by
0
200
400
600
800
1,000
1,200
1,400
1,600
1,800
Jul-06 Oct-06 Jan-07 Apr-07 Jul-07 Oct-07 Jan-08 Apr-08
CM launched PTY-GDL
Stimulation = 252%
Source: IATA PaxIS
A new non-stop flight, on a market without non-stop flights or only served by connecting flights, stimulates air demand
Panama City– Guadalajara Demand Stimulation due to Copa New ServicePassengers
0
500
1,000
1,500
2,000
2,500
Apr-07 Jul-07 Oct-07 Jan-08 Apr-08 Jul-08 Oct-08 Jan-09
KL launchedAMS-PTY
Stimulation = 186%
Amsterdam – Panama City Demand Stimulation due to KLM New ServicePassengers
0
500
1,000
1,500
2,000
2,500
Nov-10 Feb-11 May-11 Aug-11 Nov-11 Feb-12 May-12 Aug-12
KL launchedAMS-UIO
Stimulation = 152%
Amsterdam – Quito Demand Stimulation due to KLM New Service
Passengers

88
Prepared forGAP by
Note: Local TimeSource: ICF / GAP Analysis, OAG Schedules
KLM Schedule for Proposed Amsterdam – Guadalajara Nonstop Seasonal ServiceThree Weekly Flights on an 330-200
There is currently no non-stop service from Amsterdam to Guadalajara
New service from Europe to Guadalajara have historically resulted in traffic stimulation; the same is expected for Amsterdam – Guadalajara
GAP and ICF used a 90% conservative stimulation
KLM’s code-share agreements with its SkyTeam partners Air France and Aeromexico will enable KLM to reap the benefit of numerous connection opportunities
The proposed schedule is modeled after existing flights from Europe to Mexico and aims to maximize connecting traffic by leveraging synergies with Aeromexico, its SkyTeam partner
330-200 Aircraft 330-200135 Frequency 135
City10:00 Depart Amsterdam Arrive 11:52
14:52 Arrive Guadalajara Depart 17:00
Flight Distance: 9,365 kmAvg. Flight Time: 11:52
Paris, Madrid, Barcelona, London, Roma & Others
Connections via Amsterdam MCT: 90 min.
Mexico City, Culiacan, Mexicali, Tijuana, Veracruz & Others
Connections via GuadalajaraMCT: 90 min.

89
Prepared forGAP by
KLM could achieve a 84% average load factor in the Amsterdam –Guadalajara market
AMS GDL
Connection in AMS
Market Weekly Pax*
% of onboard
Paris 73 12%
Madrid 43 7%
Barcelona 31 5%
Zurich 29 5%
Rome 29 5%
Others 360 59%
Total Connecting 614 92%
AverageFare*:
US $582
QSI Share:
70%
Weekly Pax Each Way 2016:
60
Local MarketStimulation:
90%
Weekly Pax with Stimulation:
114
Loca
l Tra
ffic
*Average fare for all onboard passengers
Load Factor
84%A330-200
[3 Weekly Frequencies]
Local market share of onboard:
8%
Aircraft:
*Passengers each way
Tota
l
Notes: /1 GAP and ICF further adjust PaxIS Plus data to insure accuracy on market sizes/2 Based on IATA Traffic Forecast for the period YE May 2015 growth rate 2016 for Mexico-Europe market is 5.0%/3 Available Air fare data sources (PaxIS) do not include YQ's, taxes and commissions

90
Prepared forGAP by
Guadalajara has become a cargo center offering non-stop air services, not only in the Americas but in Asia and Europe
Source: WTC Confianza
Air France, Lufthansa, Cargolux y Panalpina offer direct air Service to
Paris, London-Stansted, Frankfurt and Luxemburg from Guadalajara
Destination Weekly Frequency
Aircraft Type

91
Prepared forGAP by
Multinational companies with offices in Jalisco move air cargo from and to Guadalajara
Source: WTC Confianza
Mexican and foreign
companies from different sectors
are part of the cargo ecosystem
of Jalisco

92
Prepared forGAP by
Europe is the second largest cargo destination to/from Guadalajara with 22% share of the cargo traffic
Share of Cargo Tonnage at Guadalajara by Origin/Destination Region
CY 2014
Source: WTC Confianza
Asia47%
Europe22%
North America
22%
South America6%
Others3%
Guadalajara is the perfect gateway to connect Mexico and Latin America with Europe

93
Prepared forGAP by
Guadalajara International Airport
Operates 24 hours a day, seven days a week
Two operating runways; the longest has a length of 3,999 meters
3rd busiest airport in Mexico in terms of annual passengers
Equipped with CUTE and CUSS systems
2nd busiest cargo airport in Mexico by volume
GAP will invest USD 35 million between 2015-2017 to expand
the passenger terminal

94
Prepared forGAP by
GAP is pleased to incentivize the new route by offering a discount on airport services for one year at GAP airports
The above package includes 100% discounts on Airport Services (Landing, parking, etc.), Passenger and Carry-on Screening Charges.
A discount of 100% in Airport Space Rental will also be included.
If KLM decides to open the route, GAP will also offer a 100% rebate in TUA at Guadalajara.
The above discounts do not include a rebate of the check-in luggage screening, buses and air bridges.
GAP is currently working to develop the incentives plan for Montego Bay.
Source: GAP, ICF Analysis
* These incentive amounts are representative, pending final schedules, passenger traffic and negotiations
The following discounts would be offered to KLM:
Market Season Weekly Freq.
Estimated Load Factor
Annual Incentive (USD)
AMS-GDL Annual 3 84% $XXX

95
Prepared forGAP by
GAP has the relationships and market knowledge to assist KLM in its evaluation of the proposed route
Market Analysis• GAP & ICF airport group are prepared to assist KLM with all due diligence required
to gain a thorough understanding of the proposed route
Market Analysis• GAP & ICF airport group are prepared to assist KLM with all due diligence required
to gain a thorough understanding of the proposed route
Visit to Guadalajara and Montego Bay • GAP would like to invite the KLM planners to visit GAP at the Guadalajara and
Montego Bay airport facilities and its touristic locations
Visit to Guadalajara and Montego Bay • GAP would like to invite the KLM planners to visit GAP at the Guadalajara and
Montego Bay airport facilities and its touristic locations
Visit to KLM’s offices• Alternatively, GAP would be pleased to meet with more KLM staff at corporate
headquarters
Visit to KLM’s offices• Alternatively, GAP would be pleased to meet with more KLM staff at corporate
headquarters

96
Prepared forGAP by
Mexican Pacific Airport Group Contact Information
Phone:+52 (33) 3880-1100
Dial 266 or 336 for Airline Marketing Services
Fax - Dial 339
Corporate Offices:Mariano Otero #1249 B
6th Floor (World Trade Center)Rinconada del Bosque
Guadalajara JaliscoMexico, 44530
Grupo Aeroportuario del Pacifico is the holder of the concessions to operate 12 international airports in Mexico, covering an influence area with a population of approximately 34.5 million.
Fernando Bosque [email protected]
Tomas RamirezChief Commercial [email protected]
Omar MirandaCommercial Airport Revenue [email protected]
Carlos CharpenelCommercial Activities and [email protected]
Florencia ZermeñoCommercial Activities and [email protected]

9797
Tactics for Small Markets

9898
What are some of the challenges small markets face in air service development?
Lack of reliable origin‐destination demand data for your marketLack of reliable origin‐destination demand data for your market11
22
33
44
55
Current demand does not reflect the full potential of your market
Convincing Airlines that flying to your destination will not negatively impact their other flights
Generating greater visibility with Airlines to differentiate yourself from competing markets
What can be done if demand is not sufficient enough to justify air service?
9999
Challenge #1 – Lack of reliable data for estimating current demand in your market
Common data sources for origin‐destination (O&D) demand are MIDT or IATA PaxIS…
In many cases, passengers in small markets do not arrive by plane but by bus, or have to buy two separate tickets (one international and one domestic)
Nevertheless, there are alternatives to measure and estimate demand:– MIDT / IATA PaxIS by Point of Sale
• Passengers that buy in your city by fly from another airport
– Estimate demand in proportion to total national demand• For example, based on the % of country GDP that your city/region represents
– Establish comparisons with other similar destinations• For example, based on the population’s purchasing power, number of 4‐star hotels, etc.
– Evaluate national or regional government statistics• For example, tourist arrivals to archeological sites, hotel nights, etc.
Typically data from different sources must be compared and combined for a complete view of current demand

100100
Challenge #1 – Lack of reliable data for estimating current demand in your market – Example

101101
Challenge #2 – Current demand does not reflect the full potential of your market
Various factors could make current demand lower than its true potential:– Limited air service offering– High airfares– Unattractive flight times
IT is well known by Airlines that limited air service reduced demand, and that an increase in the number of seats generates an increase in demand
In such cases, estimated demand must be stimulated in order to reflect the impact of the new flight– It is important to analyze examples of market stimulation generated by Airlines (using MIDT or IATA PaxIS)

102102
Challenge #2 – Current demand does not reflect the full potential of your market – Example
Roundtrip Airfares
$565
$415
$690
$560
MIA‐SMR MIA‐AUA MIA‐IQT MIA‐MAO
Nota: tarifas aéreas vigentes el 19 de mayo para salidas el 17 de junio y estadia de una semana. MIA‐SMR en Avianca; MIA‐AUA en InselAir; MIA‐IQT en Copa y MIA‐MAO en LATAM
Destinations with little air service tend to have higher fares than similar destination
with more air service
‐27%
‐19%
Santa Marta (SMR)
Iquitos (IQT)

103103
Challenge #3 – Convincing Airlines that flying to your destination will not negatively impact their other flights
When an airline already operates service to your country or airport, they may fear that adding an new flight will negatively impact their existing flights. For example:– United, which operates IAH‐Quito, might fear that EWR‐Quito will steal traffic from its flight to IAH
– Copa, which operates PTY‐Lima, might fear that PTY‐Chiclayo affect its Lima flight
Destinations must show Airlines that the new flight will complement the existing service, instead of cannibalizing it. But how?
Using a QSI analysis, combined with current flight load factor data– QSI (Quality of Service Index): allows modelling of how traffic that is “diverted” to the new flight is replaced by new demand
– Load factors: there is a relationship between load factor and the “spill” (demand that cannot be filled by the airlines)

104104
Challenge #3 – Convincing Airlines that flying to your destination will not negatively impact their other flights ‐ Example

105105
Challenge #4 – Generating greater visibility with airlines to differentiate yourself from competing markets
Competition for attracting new routes is intense: there are more routes and potential destination than what airlines are able to serve
In a context where demand exceeds supply, your destination must stand out among the rest – above all when it is a smaller and less well known market
There are various methods for achieving this objective:– Develop convincing analyses – without this, there is no working strategy
• Airlines seek relevant data that demonstrate the viability of the route
– Participate actively in route development conferences• The biggest is World Routes
• For tourism destinations, there are other events such as FITUR
– Visit with Airlines at their offices• Ideally after a making a first introduction
• The involvement of other stakeholders in highly recommended
– Offer a robust incentive program, including financial guarantees• These costs should be absorbed by the community, not just the airline

106106
Challenge #5 – What can be done if demand is not sufficient enough to justify air service – Example
There will be routes that simply do not have the demand needed to justify new service, but play an important, strategic role for your destination
There are alternatives that can generate more traffic for your destination
If you want to attract traffic from long‐haul markets where there is potential demand, you might suggest to a codeshare agreement to an airline to carry traffic to your airport– This generates additional traffic for the airline operating the flight, with low marginal costs – In some cases, it codesharing could lead to an increase in the size of the aircraft being used to
operate to your market to accommodated the increased demand– This is a low‐risk option for all parties

107
Thank You!


