Enhancing Tourism Competitiveness through Improved Air Connectivity
83
Enhancing Tourism Competitiveness through Improved Air Connectivity Presented by: UNWTO / ICF International International Tourism Fair Madrid, 20‐24 January, 2016
Transcript of Enhancing Tourism Competitiveness through Improved Air Connectivity

0
Enhancing Tourism Competitiveness through Improved Air ConnectivityPresented by:
UNWTO / ICF International
International Tourism FairMadrid, 20‐24 January, 2016

11
Agenda
1. Aviation Industry Overview
2. Improving Air Connectivity through Air Service Development (ASD)
3. Airline Route Planning Process
4. Conducting a Route Forecast
5. Example Business Case
22
Introduction to ICF
3
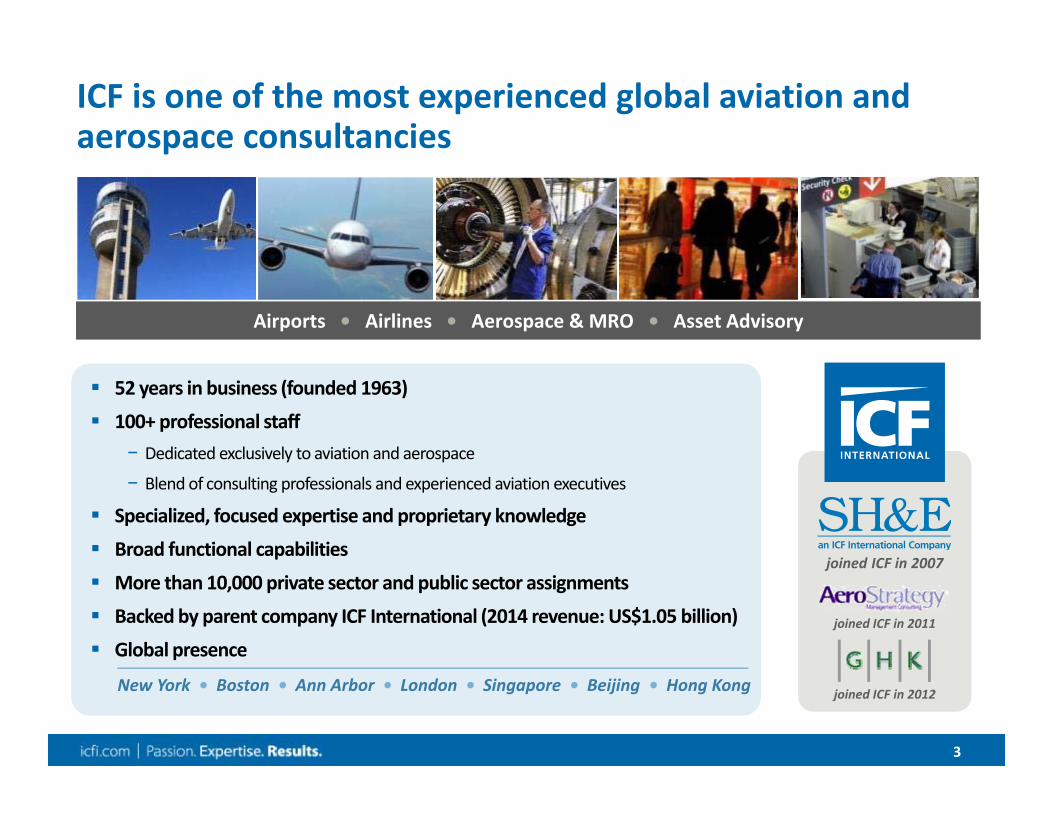
ICF is one of the most experienced global aviation and aerospace consultancies
Airports • Airlines • Aerospace & MRO • Asset AdvisoryAirports • Airlines • Aerospace & MRO • Asset Advisory
joined ICF in 2012
joined ICF in 2011
joined ICF in 2007
52 years in business (founded 1963)
100+ professional staff− Dedicated exclusively to aviation and aerospace
− Blend of consulting professionals and experienced aviation executives
Specialized, focused expertise and proprietary knowledge
Broad functional capabilities
More than 10,000 private sector and public sector assignments
Backed by parent company ICF International (2014 revenue: US$1.05 billion)
Global presence
New York • Boston • Ann Arbor • London • Singapore • Beijing • Hong Kong
44
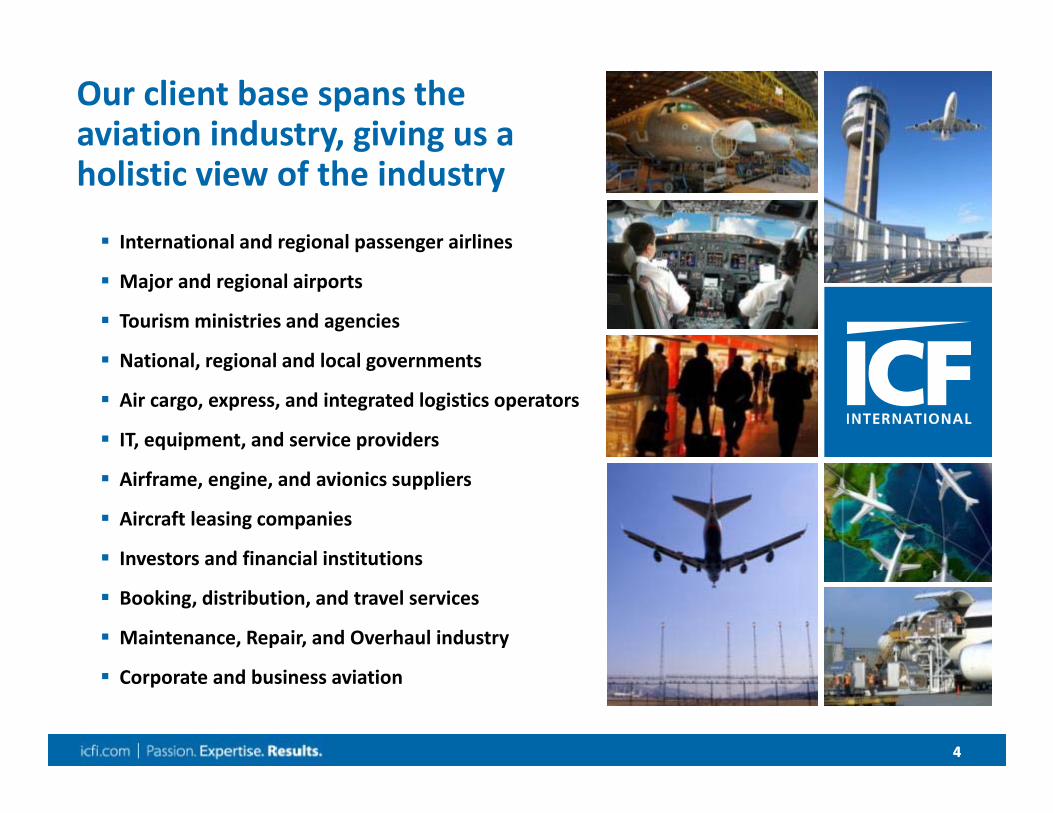
Our client base spans the aviation industry, giving us a holistic view of the industry
International and regional passenger airlines
Major and regional airports
Tourism ministries and agencies
National, regional and local governments
Air cargo, express, and integrated logistics operators
IT, equipment, and service providers
Airframe, engine, and avionics suppliers
Aircraft leasing companies
Investors and financial institutions
Booking, distribution, and travel services
Maintenance, Repair, and Overhaul industry
Corporate and business aviation

55
ICF offers an unmatched global airline client list and network of airline contacts
66
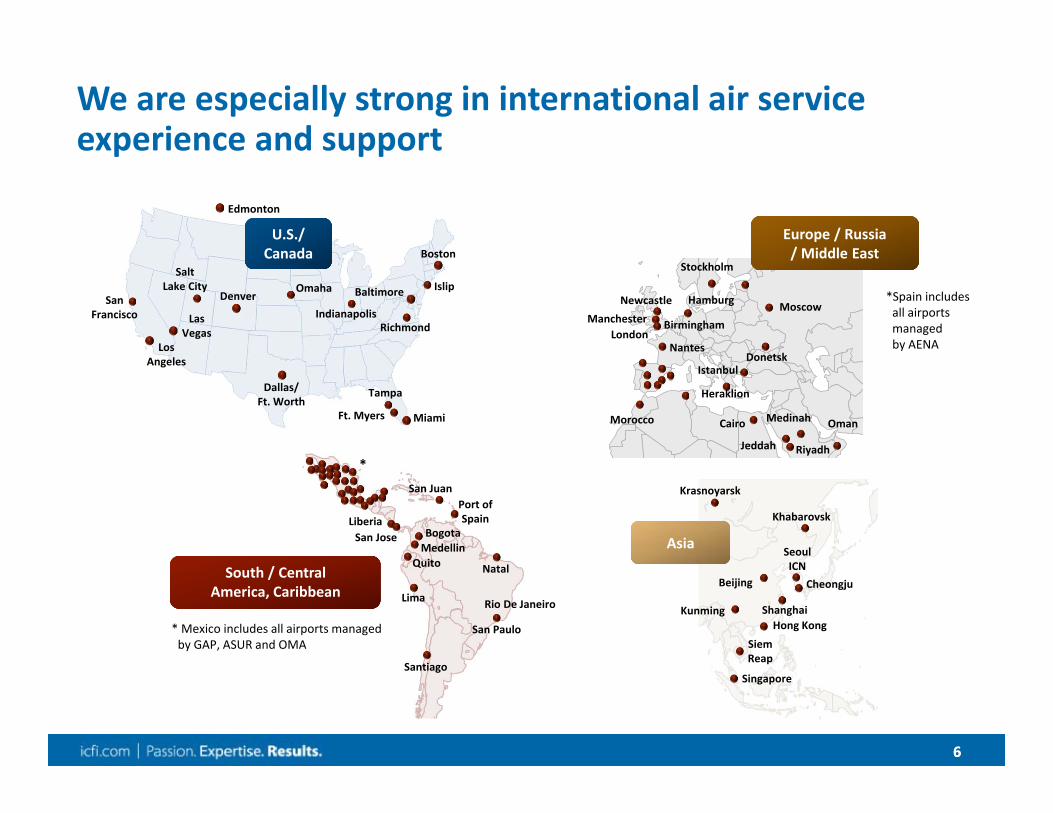
We are especially strong in international air service experience and support
Boston
Baltimore
Miami
Dallas/Ft. Worth
Denver
LasVegas
LosAngeles
U.S./CanadaU.S./Canada
Tampa
SaltLake City Islip
SanFrancisco
Ft. Myers
Richmond
Edmonton
Indianapolis
Omaha
San Paulo
LiberiaBogota
Port ofSpain
Medellin
Lima
South / CentralAmerica, CaribbeanSouth / Central
America, Caribbean
*
* Mexico includes all airports managed by GAP, ASUR and OMA
San Jose
San Juan
Quito
Santiago
Rio De Janeiro
Natal
ManchesterNewcastle
Donetsk
Cairo
Nantes
Stockholm
Istanbul
Europe / Russia/ Middle EastEurope / Russia/ Middle East
*Spain includes all airports managed by AENA
Birmingham
OmanMedinah
Heraklion
Jeddah Riyadh
Morocco
MoscowHamburg
London
Cheongju
Krasnoyarsk
AsiaAsia
SiemReap
ShanghaiKunming
Beijing
Khabarovsk
Hong Kong
Singapore
SeoulICN
77
Aviation Industry Overview
88
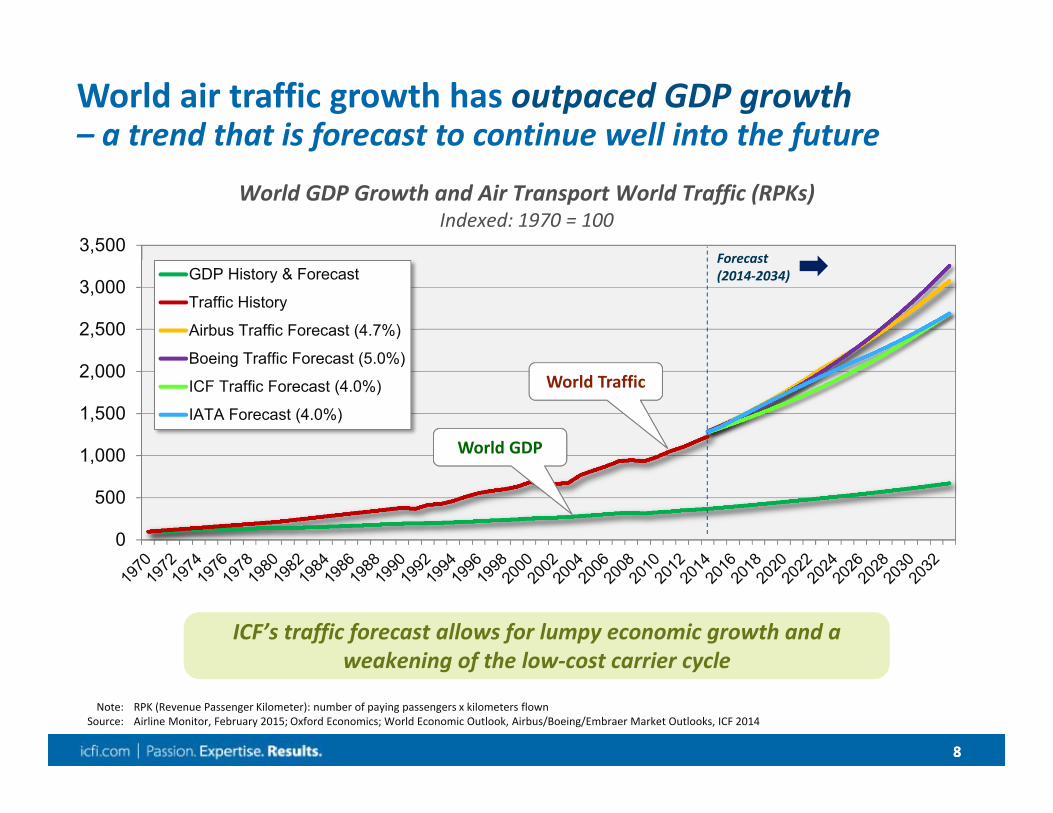
World air traffic growth has outpaced GDP growth – a trend that is forecast to continue well into the future
0
500
1,000
1,500
2,000
2,500
3,000
3,500GDP History & Forecast
Traffic History
Airbus Traffic Forecast (4.7%)
Boeing Traffic Forecast (5.0%)
ICF Traffic Forecast (4.0%)
IATA Forecast (4.0%)
World GDP Growth and Air Transport World Traffic (RPKs)Indexed: 1970 = 100
Note: RPK (Revenue Passenger Kilometer): number of paying passengers x kilometers flownSource: Airline Monitor, February 2015; Oxford Economics; World Economic Outlook, Airbus/Boeing/Embraer Market Outlooks, ICF 2014
ICF’s traffic forecast allows for lumpy economic growth and a weakening of the low‐cost carrier cycle
Forecast (2014‐2034)
World GDP
World Traffic
99
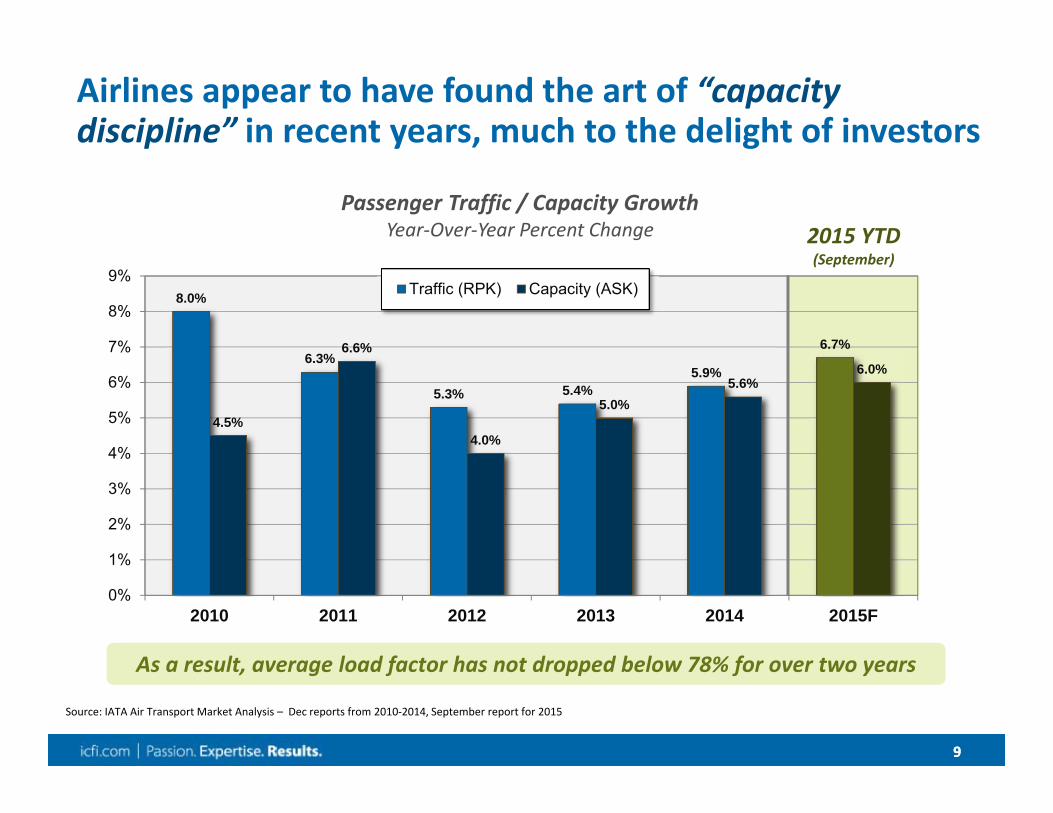
8.0%
6.3%
5.3% 5.4%5.9%
6.7%
4.5%
6.6%
4.0%
5.0%5.6%
6.0%
0%
1%
2%
3%
4%
5%
6%
7%
8%
9%
2010 2011 2012 2013 2014 2015F
Traffic (RPK) Capacity (ASK)
Airlines appear to have found the art of “capacity discipline” in recent years, much to the delight of investors
Source: IATA Air Transport Market Analysis – Dec reports from 2010‐2014, September report for 2015
2015 YTD (September)
Passenger Traffic / Capacity GrowthYear‐Over‐Year Percent Change
As a result, average load factor has not dropped below 78% for over two years
1010
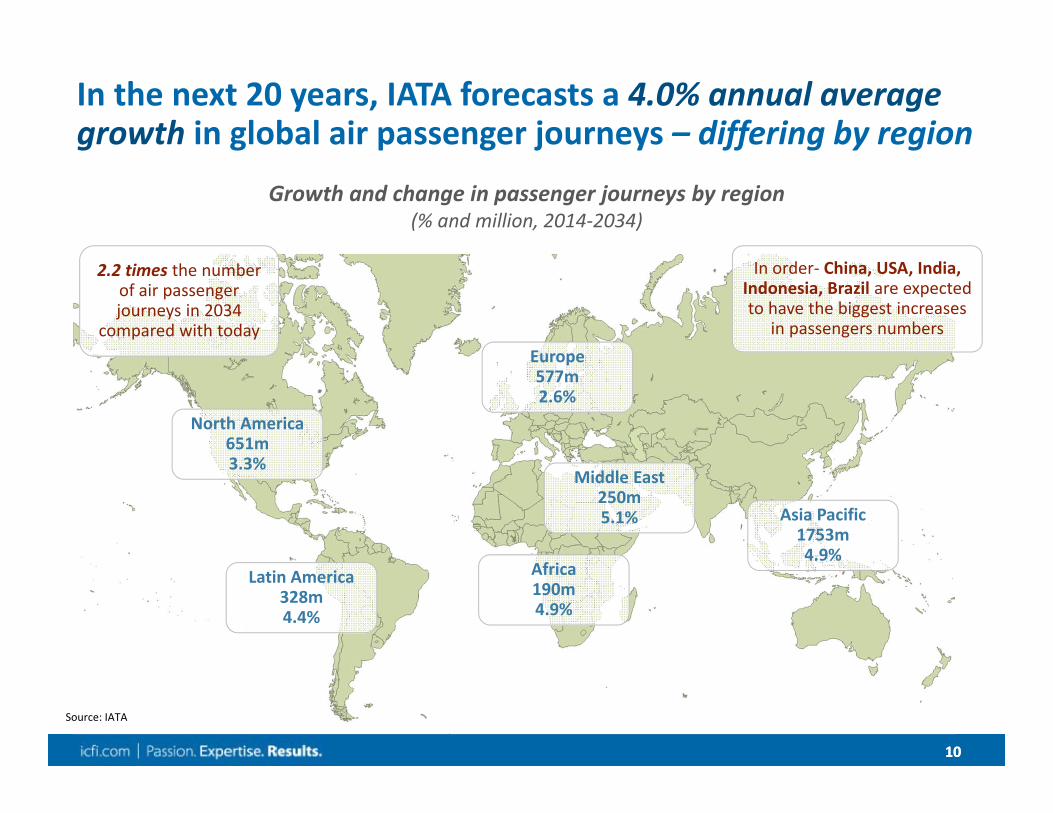
In the next 20 years, IATA forecasts a 4.0% annual average growth in global air passenger journeys – differing by region
Source: IATA
North America651m3.3%
Europe577m2.6%
Middle East250m5.1% Asia Pacific
1753m4.9%
Africa190m4.9%
2.2 times the number of air passenger journeys in 2034
compared with today
In order‐ China, USA, India, Indonesia, Brazil are expected to have the biggest increases
in passengers numbers
Latin America328m4.4%
Growth and change in passenger journeys by region (% and million, 2014‐2034)
1111
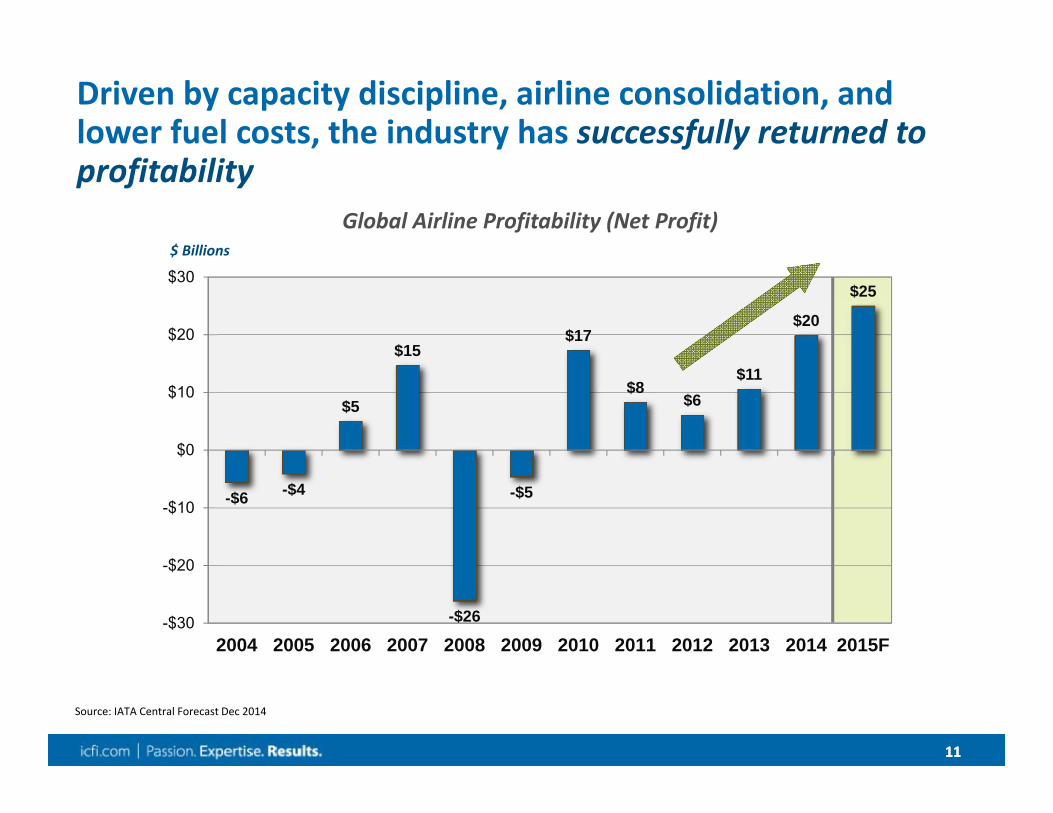
-$6 -$4
$5
$15
-$26
-$5
$17
$8$6
$11
$20
$25
-$30
-$20
-$10
$0
$10
$20
$30
2004 2005 2006 2007 2008 2009 2010 2011 2012 2013 2014 2015F
Driven by capacity discipline, airline consolidation, and lower fuel costs, the industry has successfully returned to profitability
Global Airline Profitability (Net Profit)
Source: IATA Central Forecast Dec 2014
$ Billions

1212
Aviation fuel costs have dropped significantly during the past years to below $40/bbl (65% lower than summer 2014)
(USD)
If sustained, low fuel prices could bring dramatic changes to the industryIf sustained, low fuel prices could bring dramatic changes to the industry
Oil Price per Barrel (US$) – WTI Cushing, Oklahoma
Source: U.S. EIA data of January 18, 2016
$0
$20
$40
$60
$80
$100
$120
1313
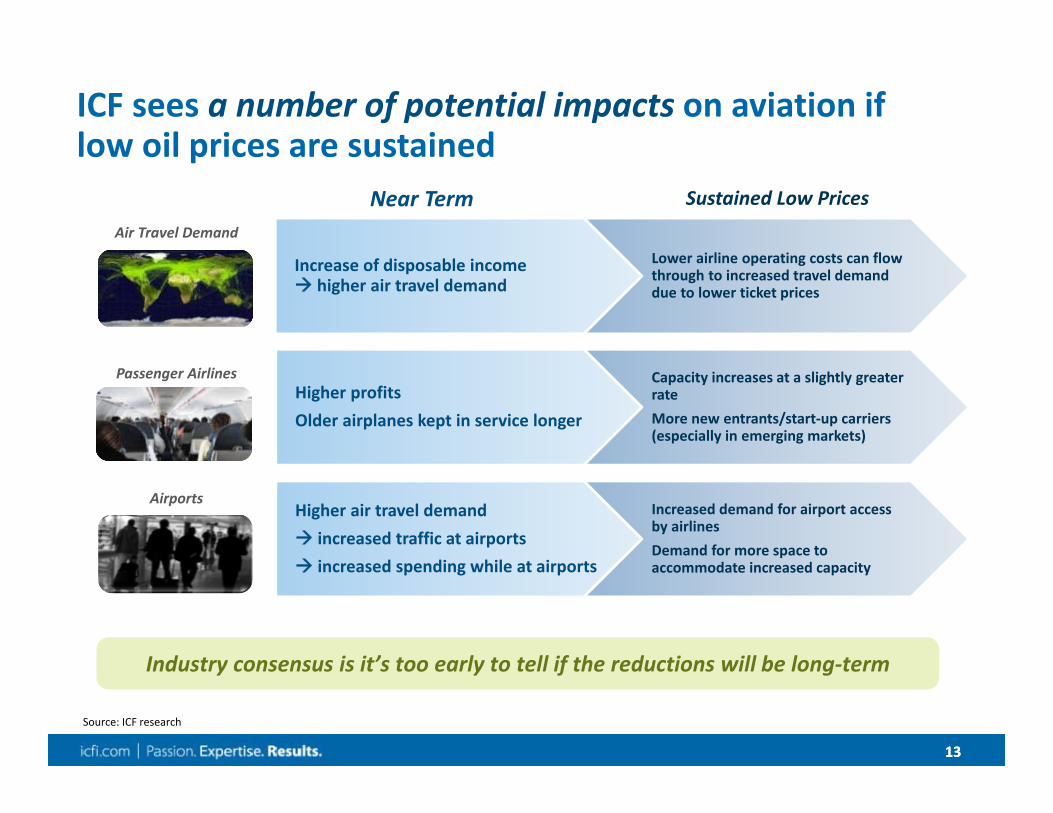
ICF sees a number of potential impacts on aviation if low oil prices are sustained
income Increase of disposable income higher air travel demand
Lower airline operating costs can flow through to increased travel demand due to lower ticket prices
Higher profitsOlder airplanes kept in service longer
Capacity increases at a slightly greater rateMore new entrants/start‐up carriers(especially in emerging markets)
Higher air travel demand increased traffic at airports increased spending while at airports
Increased demand for airport access by airlinesDemand for more space to accommodate increased capacity
Air Travel Demand
Passenger Airlines
Airports
Sustained Low PricesNear Term
Source: ICF research
Industry consensus is it’s too early to tell if the reductions will be long‐term
1414
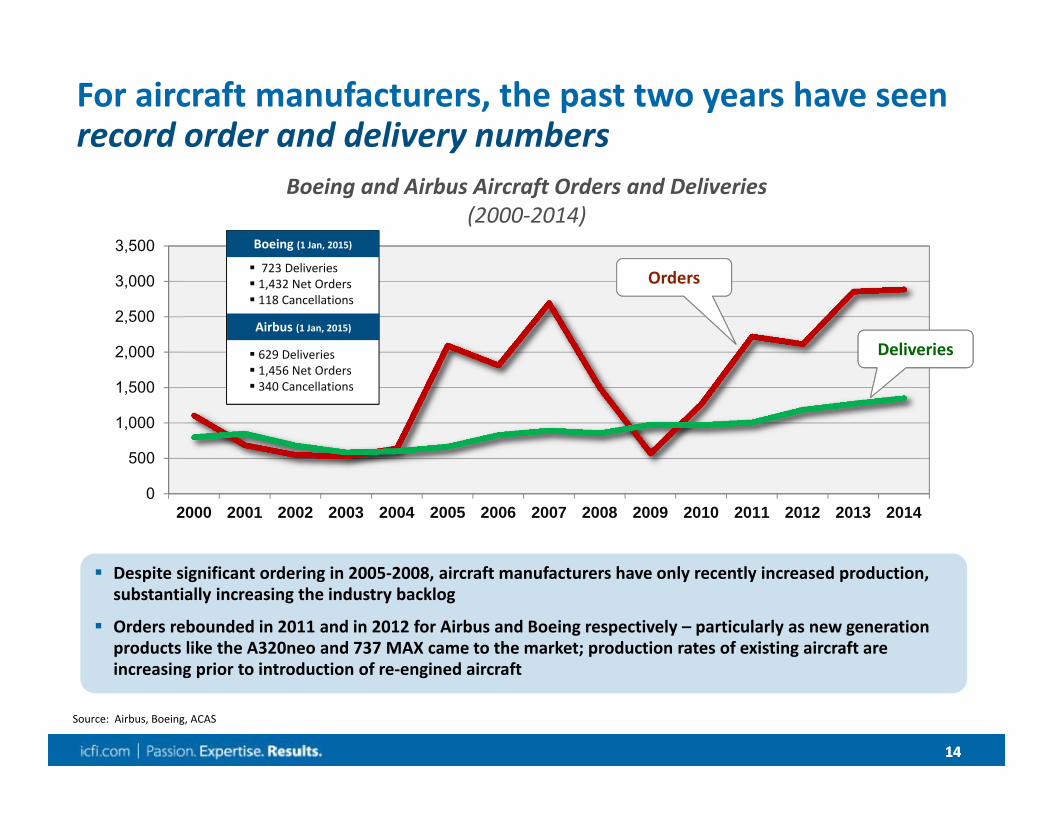
For aircraft manufacturers, the past two years have seen record order and delivery numbers
Despite significant ordering in 2005‐2008, aircraft manufacturers have only recently increased production, substantially increasing the industry backlog
Orders rebounded in 2011 and in 2012 for Airbus and Boeing respectively – particularly as new generation products like the A320neo and 737 MAX came to the market; production rates of existing aircraft are increasing prior to introduction of re‐engined aircraft
Source: Airbus, Boeing, ACAS
0
500
1,000
1,500
2,000
2,500
3,000
3,500
2000 2001 2002 2003 2004 2005 2006 2007 2008 2009 2010 2011 2012 2013 2014
Boeing and Airbus Aircraft Orders and Deliveries (2000‐2014)
Deliveries
Orders
Boeing (1 Jan, 2015)
Airbus (1 Jan, 2015)
629 Deliveries 1,456 Net Orders 340 Cancellations
723 Deliveries 1,432 Net Orders 118 Cancellations
1515
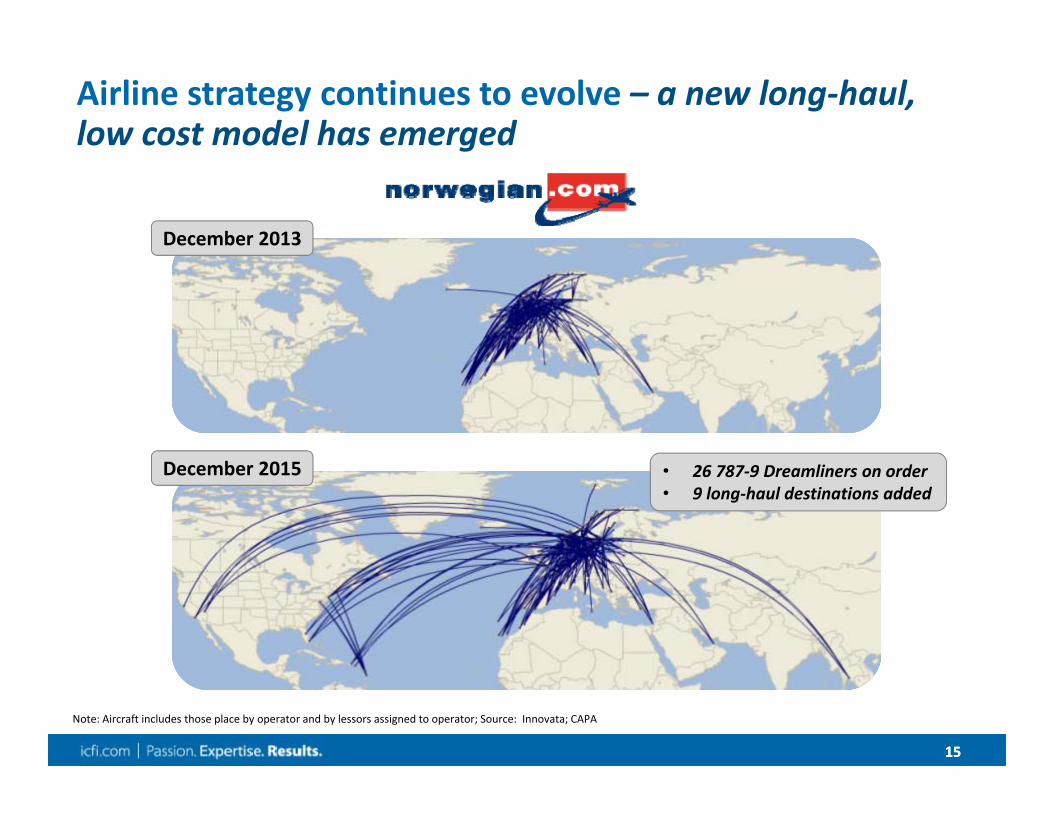
Airline strategy continues to evolve – a new long‐haul, low cost model has emerged
Note: Aircraft includes those place by operator and by lessors assigned to operator; Source: Innovata; CAPA
December 2013
December 2015 • 26 787‐9 Dreamliners on order• 9 long‐haul destinations added
1616
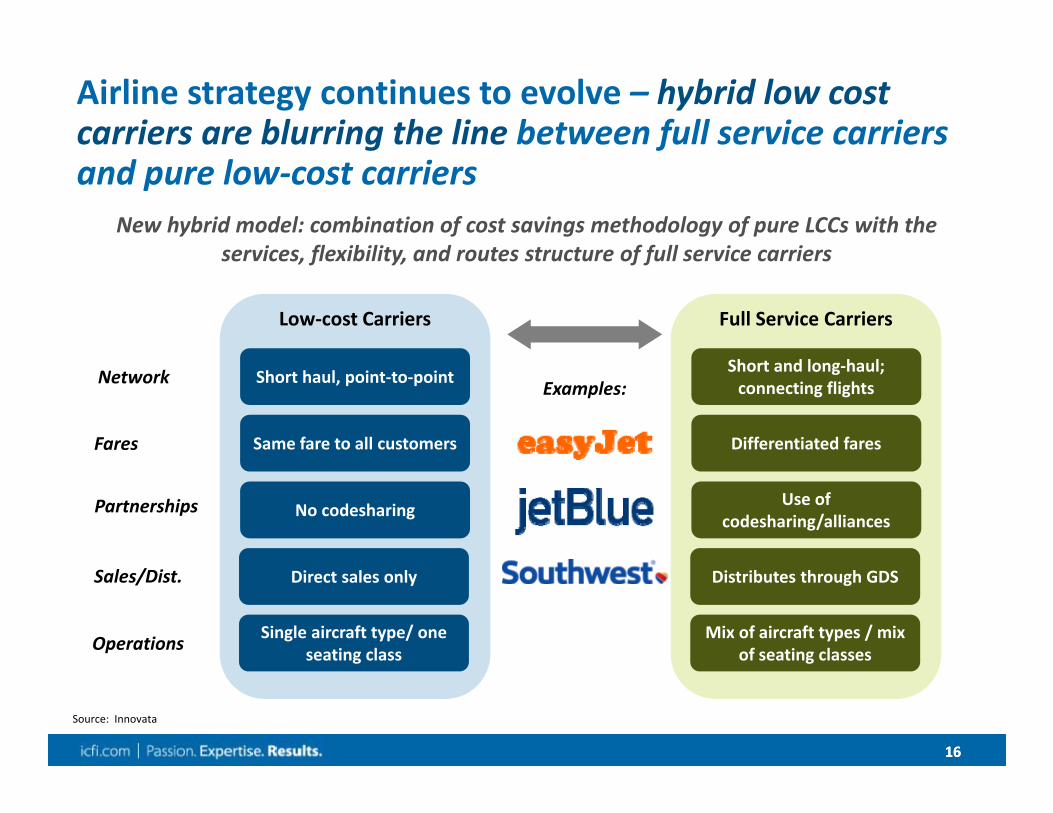
Airline strategy continues to evolve – hybrid low cost carriers are blurring the line between full service carriers and pure low‐cost carriers
Source: Innovata
New hybrid model: combination of cost savings methodology of pure LCCs with the services, flexibility, and routes structure of full service carriers
Low‐cost Carriers Full Service Carriers
Short haul, point‐to‐point
Same fare to all customers
No codesharing
Direct sales only
Single aircraft type/ one seating class
Short and long‐haul; connecting flights
Differentiated fares
Use of codesharing/alliances
Distributes through GDS
Mix of aircraft types / mix of seating classes
Network
Fares
Partnerships
Sales/Dist.
Operations
Examples:
1717
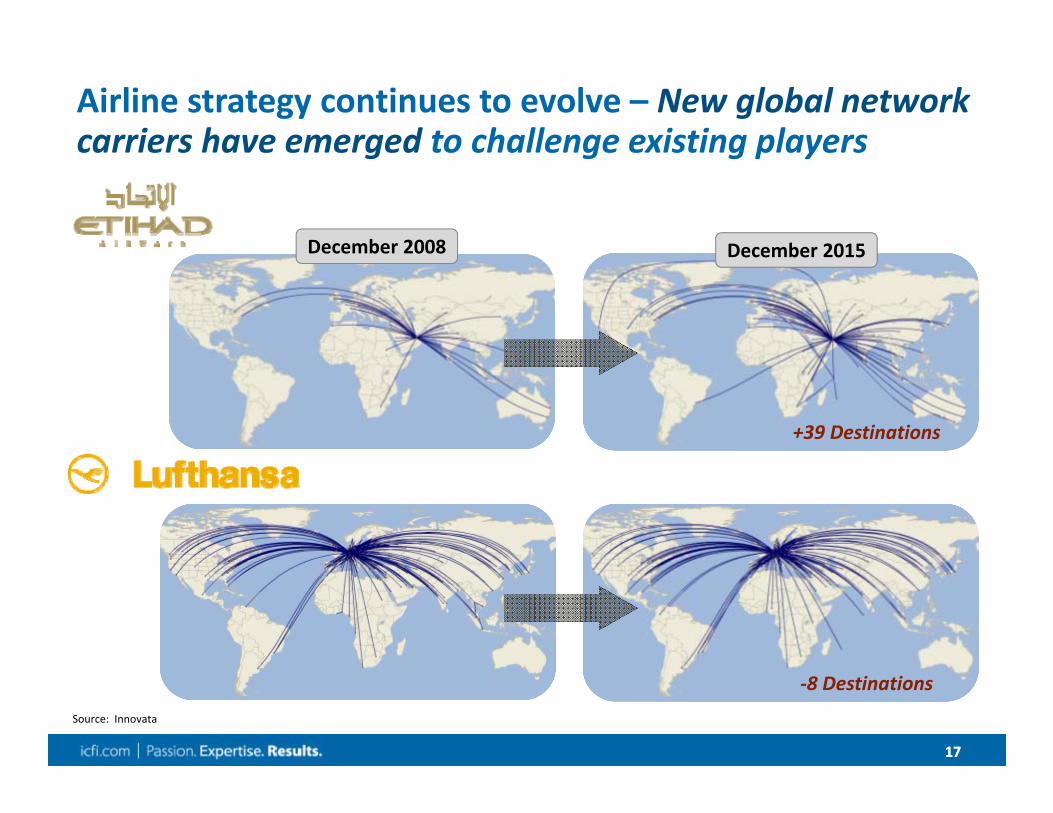
Airline strategy continues to evolve – New global network carriers have emerged to challenge existing players
Source: Innovata
December 2008 December 2015
+39 Destinations
‐8 Destinations
1818
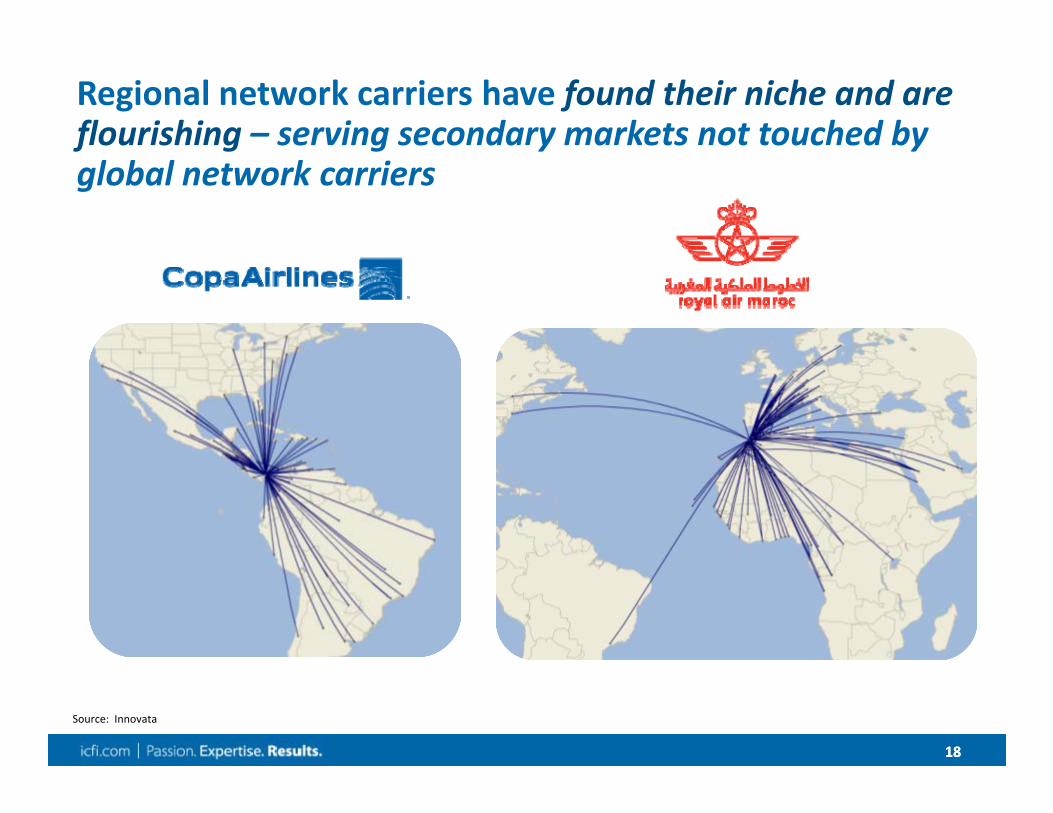
Regional network carriers have found their niche and are flourishing – serving secondary markets not touched by global network carriers
Source: Innovata
1919
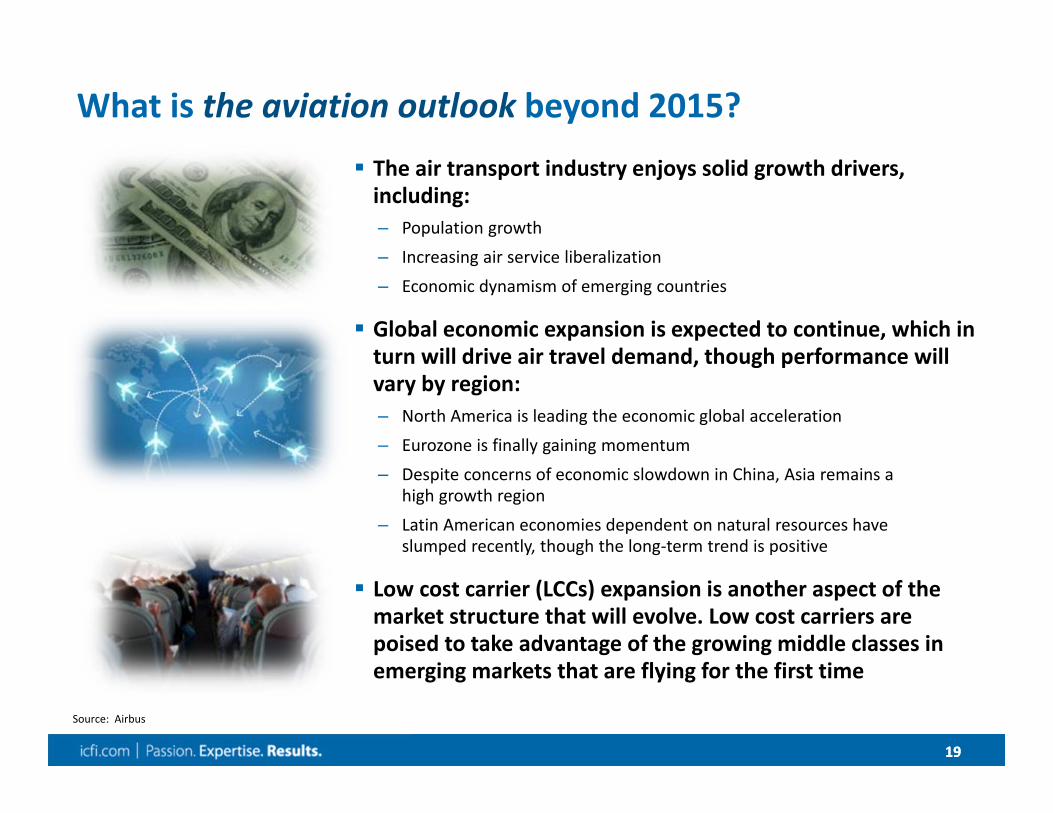
What is the aviation outlook beyond 2015?
The air transport industry enjoys solid growth drivers, including:– Population growth
– Increasing air service liberalization
– Economic dynamism of emerging countries
Global economic expansion is expected to continue, which in turn will drive air travel demand, though performance will vary by region:– North America is leading the economic global acceleration
– Eurozone is finally gaining momentum
– Despite concerns of economic slowdown in China, Asia remains a high growth region
– Latin American economies dependent on natural resources have slumped recently, though the long‐term trend is positive
Low cost carrier (LCCs) expansion is another aspect of the market structure that will evolve. Low cost carriers are poised to take advantage of the growing middle classes in emerging markets that are flying for the first time
Source: Airbus
2020
Connecting your Destination through Air Service Development
21
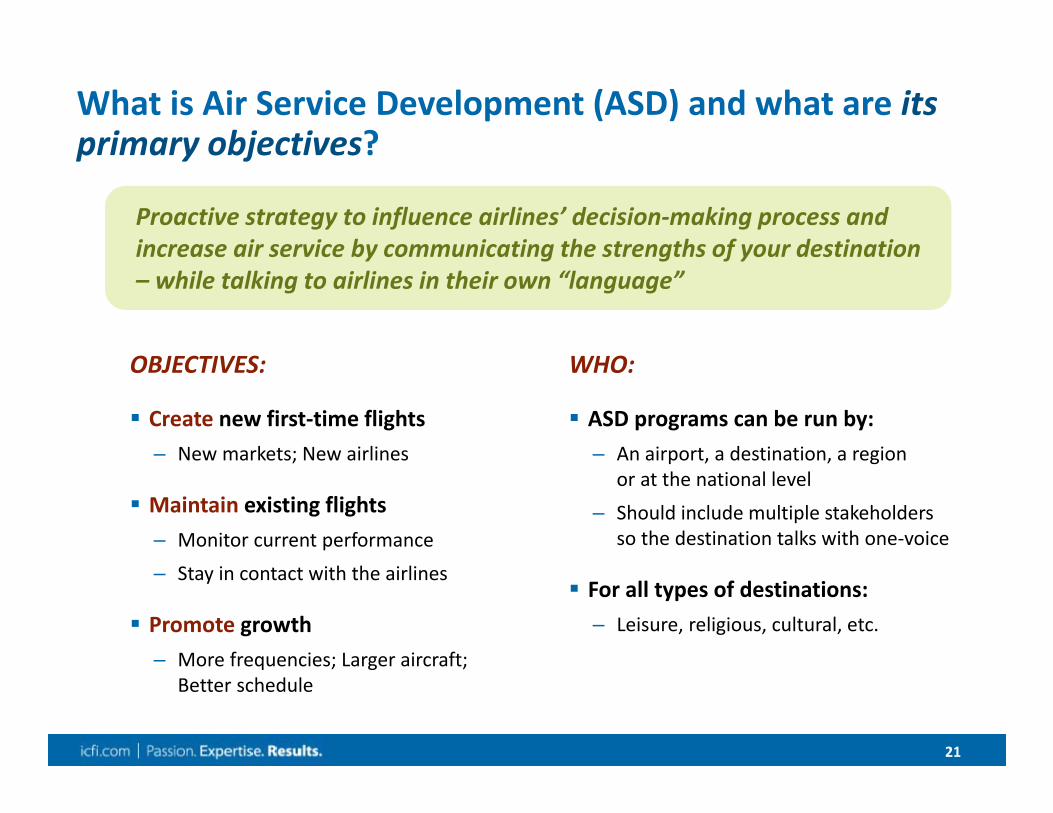
What is Air Service Development (ASD) and what are its primary objectives?
Proactive strategy to influence airlines’ decision‐making process and increase air service by communicating the strengths of your destination – while talking to airlines in their own “language”
OBJECTIVES:
Create new first‐time flights– New markets; New airlines
Maintain existing flights– Monitor current performance
– Stay in contact with the airlines
Promote growth– More frequencies; Larger aircraft;
Better schedule
WHO:
ASD programs can be run by: – An airport, a destination, a region
or at the national level
– Should include multiple stakeholders so the destination talks with one‐voice
For all types of destinations:– Leisure, religious, cultural, etc.
22
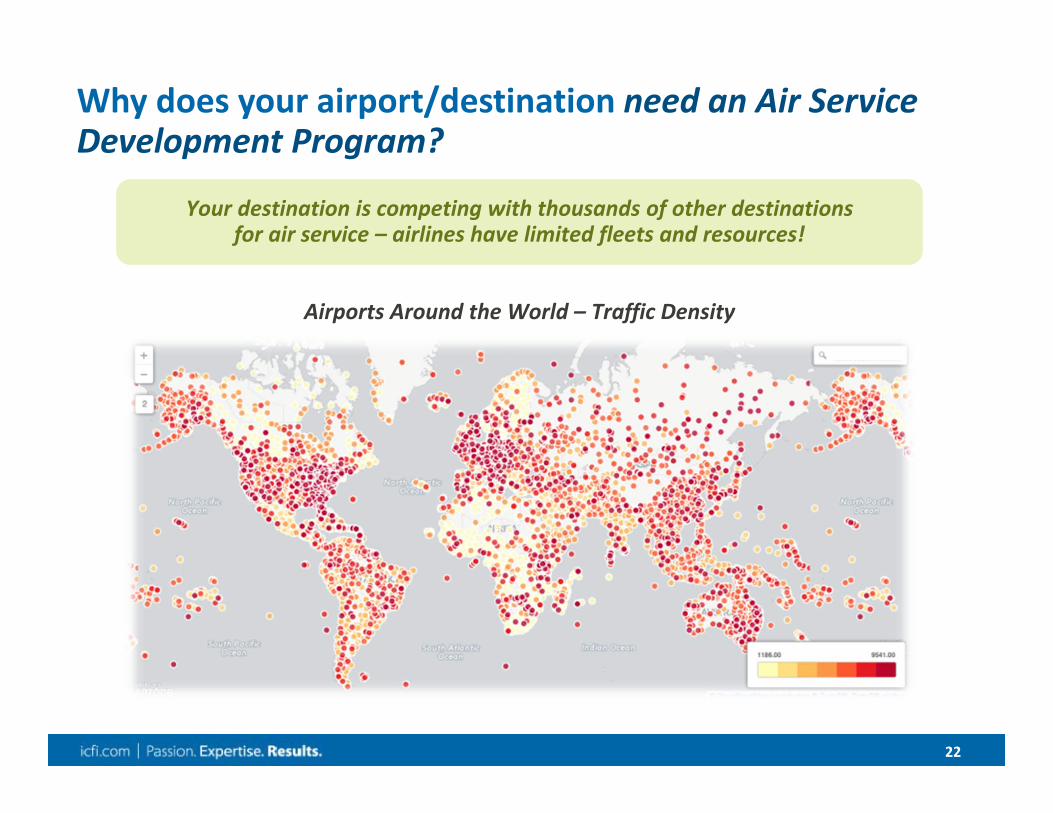
Why does your airport/destination need an Air Service Development Program?
Your destination is competing with thousands of other destinations for air service – airlines have limited fleets and resources!
Airports Around the World – Traffic Density

2323
What does an ASD program consist of?
Ongoing Communication with Airlines and Operators – Not just one time!
Talk to airlines in their own language – with their own metrics and methodologies
Information about the
destinations (news ahead of time)
Quantitative business case with a specific proposal and
forecast
Team of stakeholders: one entity the
airline can speak with about service
Incentive program and support for the airline
A well‐coordinated effort that combines:
2424
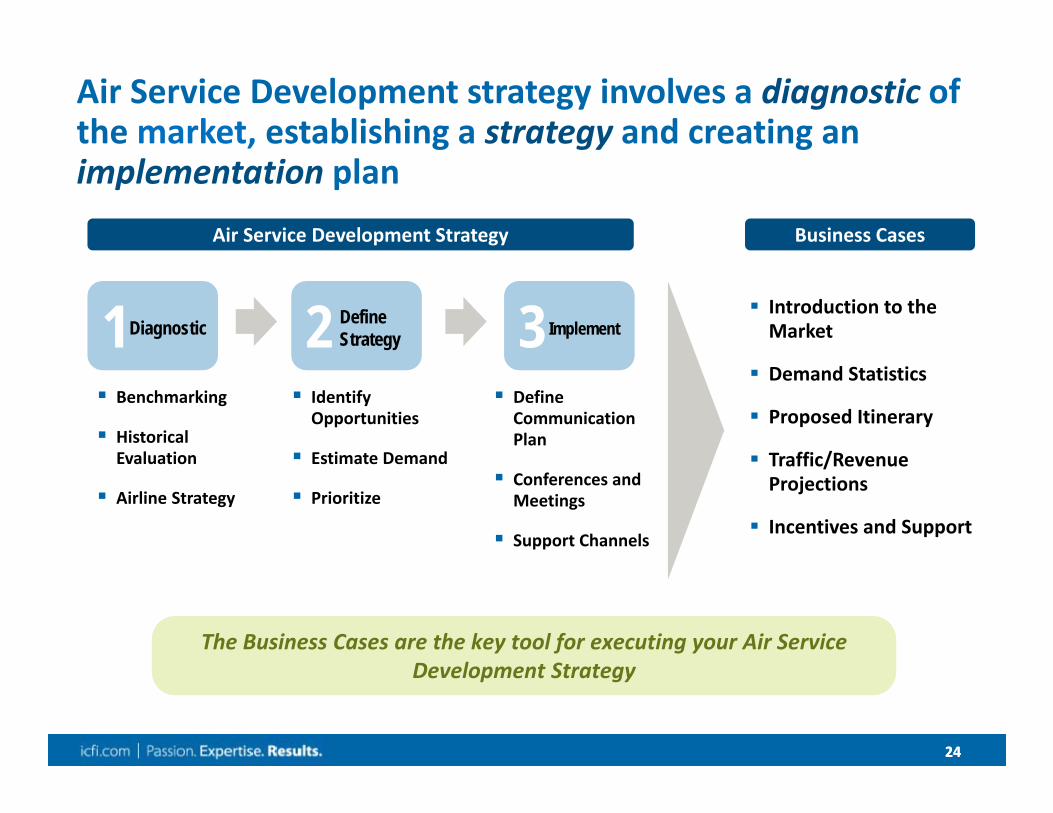
Air Service Development strategy involves a diagnostic of the market, establishing a strategy and creating an implementation plan
1Diagnostic 2 DefineStrategy 3 Implement
Air Service Development Strategy
Benchmarking
Historical Evaluation
Airline Strategy
Identify Opportunities
Estimate Demand
Prioritize
Define Communication Plan
Conferences and Meetings
Support Channels
Business Cases
Introduction to the Market
Demand Statistics
Proposed Itinerary
Traffic/Revenue Projections
Incentives and Support
The Business Cases are the key tool for executing your Air Service Development Strategy

2525
The diagnostic of the airport environment is an essential step in identifying new opportunities for air service
Benchmarking– Compare the service offering (destinations, airlines, frequencies) of your airport vs.
competitors in the same region
Historical evaluation of traffic and service offering– Understand where the growth is, what hasn’t worked, where there is potential for growth,
etc.
Airline Strategy– Understand how airlines operate (Hub, point to point), evolution of alliances, aircraft
orders, etc.
2626
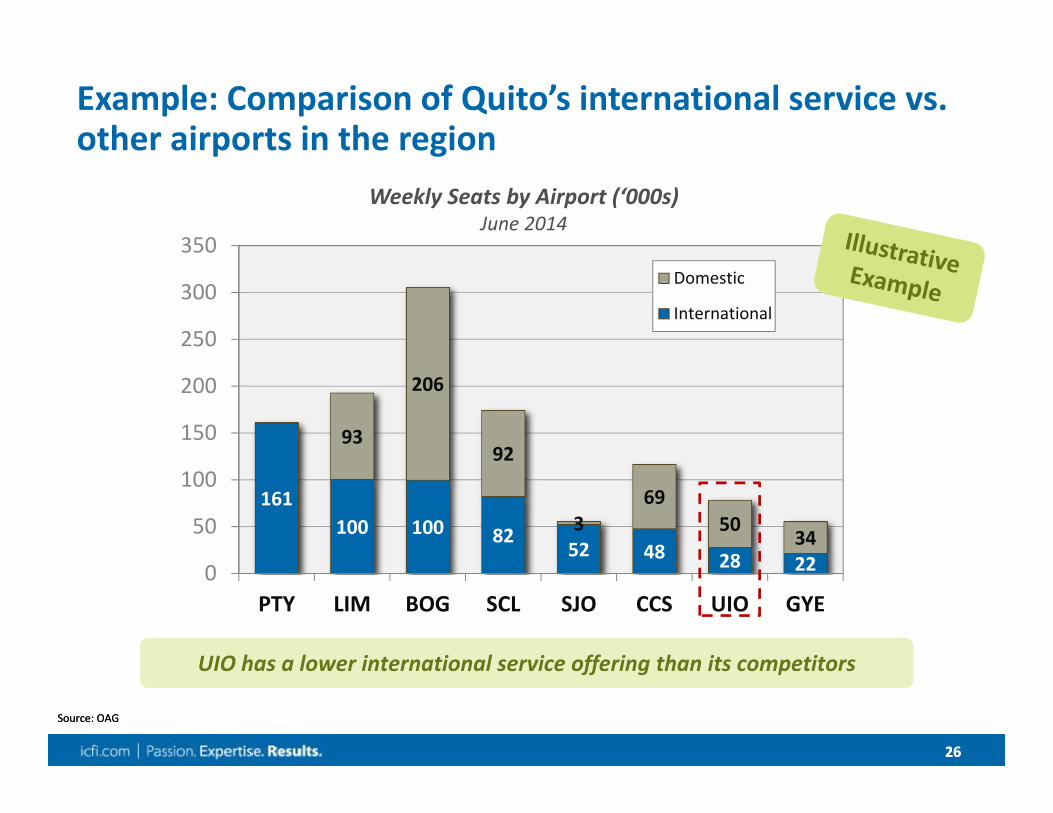
161100 100 82
52 48 28 22
93
206
92
369
5034
0
50
100
150
200
250
300
350
PTY LIM BOG SCL SJO CCS UIO GYE
Domestic
International
Example: Comparison of Quito’s international service vs. other airports in the region
Source: OAGSource: OAG
Weekly Seats by Airport (‘000s) June 2014
UIO has a lower international service offering than its competitors
2727
The diagnostic allows you to define a strategy, focusing on and prioritizing objectives to increase air service
Identify potential routes and airlines– What existing routes merit additional service?
– What new routes do I want to promote?
– What airlines do I want to attract?
Estimating Origin‐Destination demand– This is the key element of air service development that allows you to:• Determine the volume of traffic in the local market and beyond‐hub• Understand the seasonality of traffic• Identify the point of sale
Establish priorities– Prioritize opportunities in the short, medium, and long‐term
– Understand the effort needed to achieve each objective
2828
Lastly, the best method of implementing the strategy should be determined – attending meetings and taking advantage of other support channels
Define how to contact the airlines of interest– Conferences and/or direct meetings with airlines
– Begin with the regional office or directly with headquarters?
– Contacting the right people saves time: Planners
Choose the conferences/frequency of attendance that best fit your strategy– Regional, global conferences• Routes, Jumpstart, Tourism conferences for vacation markets
– How many times per year?
Take advantage of external support channels– What other stakeholders can support the effort to develop air service?
29
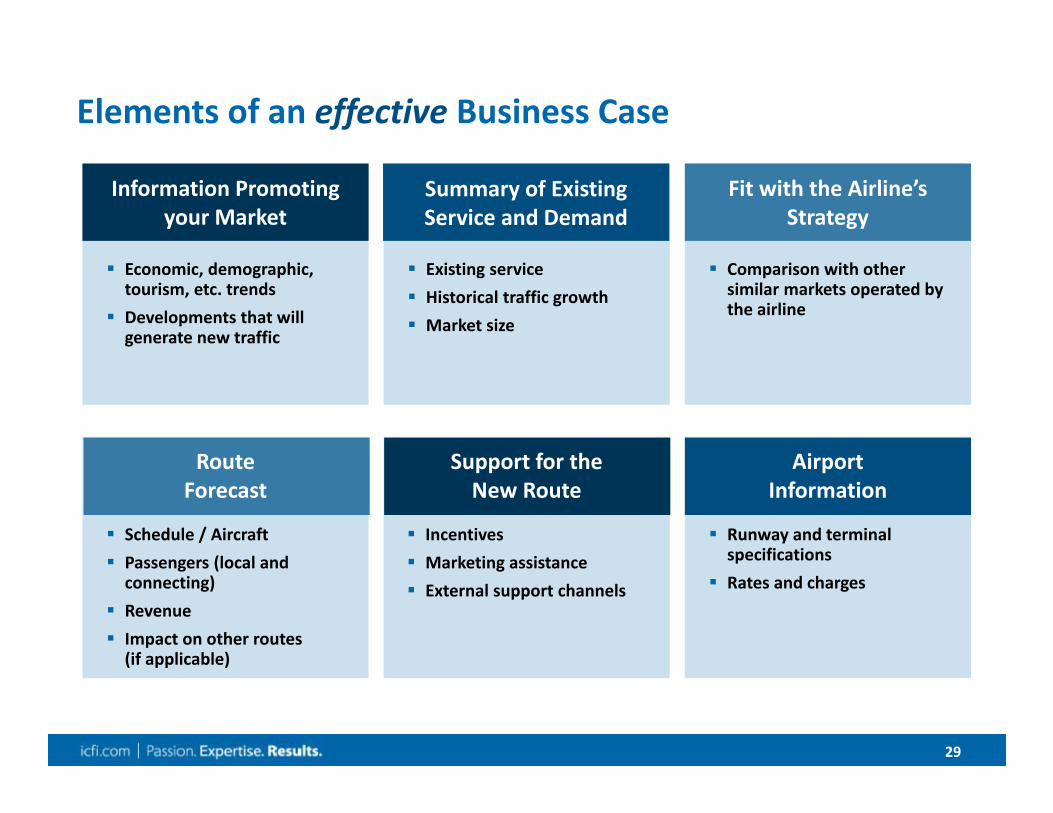
Elements of an effective Business Case
Economic, demographic, tourism, etc. trends
Developments that will generate new traffic
Existing service Historical traffic growth Market size
Comparison with other similar markets operated by the airline
Schedule / Aircraft Passengers (local and connecting)
Revenue Impact on other routes (if applicable)
Information Promoting your Market
Summary of Existing Service and Demand
Fit with the Airline’s Strategy
Route Forecast
Support for the New Route
Airport Information
Incentives Marketing assistance External support channels
Runway and terminal specifications
Rates and charges

30
Risk sharing and commitment are sought by many airlines, by way of financial incentives
Financial incentives from the airport can take many forms:– Discounts on traditional airport fees– Creative solutions (e.g. rebates, fuel savings) – Pre‐purchase of airline tickets by local businesses for
future use– Revenue and profitability guarantees– Funds for advertising and promotion
Other Stakeholders– Discounts on hotel, transportation and meals for
airline crew overnights– Preferential rates for airline vacation programs at
hotels and tourist attractions
Examples of airport discounts– Landing Fees– Security screening– Jet‐bridge
– Parking– Rental of check‐in counters
and office space

3131
Growing Air Service Usually Requires You…
Work with an Air Service Committee of stakeholders– If you don’t have one, start one!
Include Air Service planning – far in advance
Talk to airlines and operators regularly– Have an ongoing relationship with them– Tell them things they don’t know– Give them concrete proposals and financial incentives– The destination should speak with one voice and present unified proposals
– Attend “Routes” conferences, both global and regional– Attend relevant tourism conferences such as ITB, FITUR, World Travel Market
If you are not sure of how to do these things, ask for help!
3232
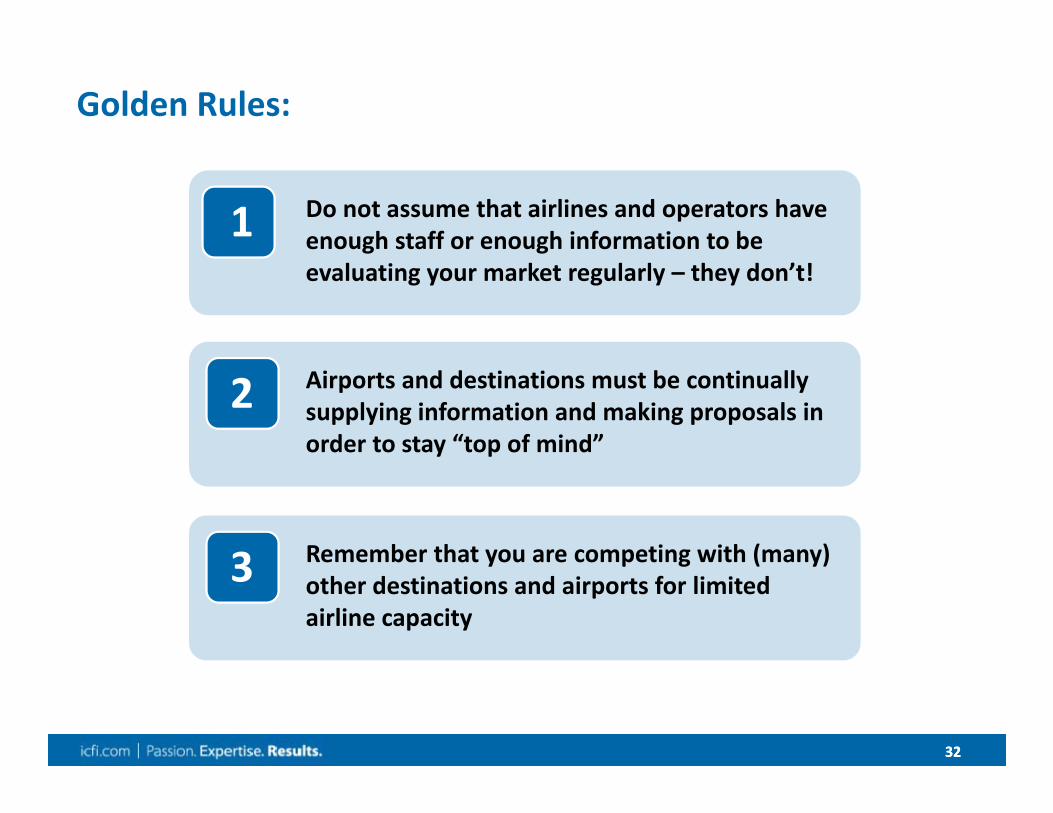
Golden Rules:
1 Do not assume that airlines and operators have enough staff or enough information to be evaluating your market regularly – they don’t!
2 Airports and destinations must be continually supplying information and making proposals in order to stay “top of mind”
3 Remember that you are competing with (many) other destinations and airports for limited airline capacity
3333
Airline Route Planning Process
34
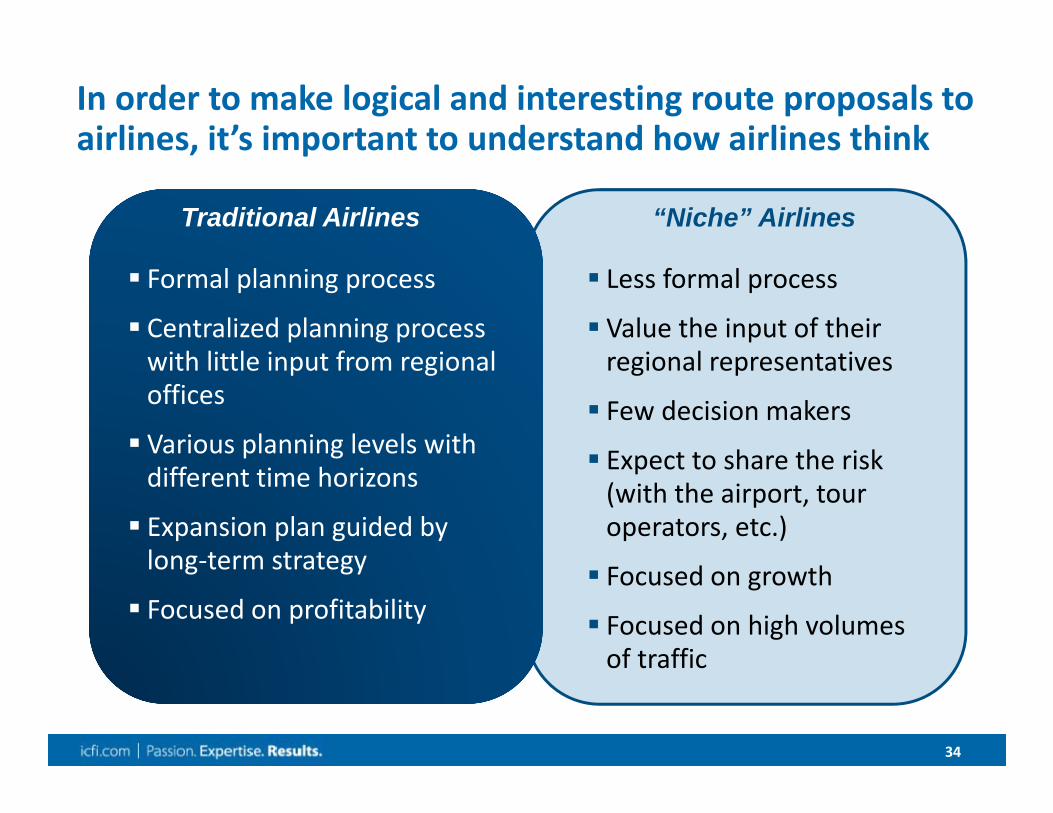
Formal planning process
Centralized planning process with little input from regional offices
Various planning levels with different time horizons
Expansion plan guided by long‐term strategy
Focused on profitability
Less formal process
Value the input of their regional representatives
Few decision makers
Expect to share the risk (with the airport, tour operators, etc.)
Focused on growth
Focused on high volumes of traffic
In order to make logical and interesting route proposals to airlines, it’s important to understand how airlines think
Traditional Airlines “Niche” Airlines
3535
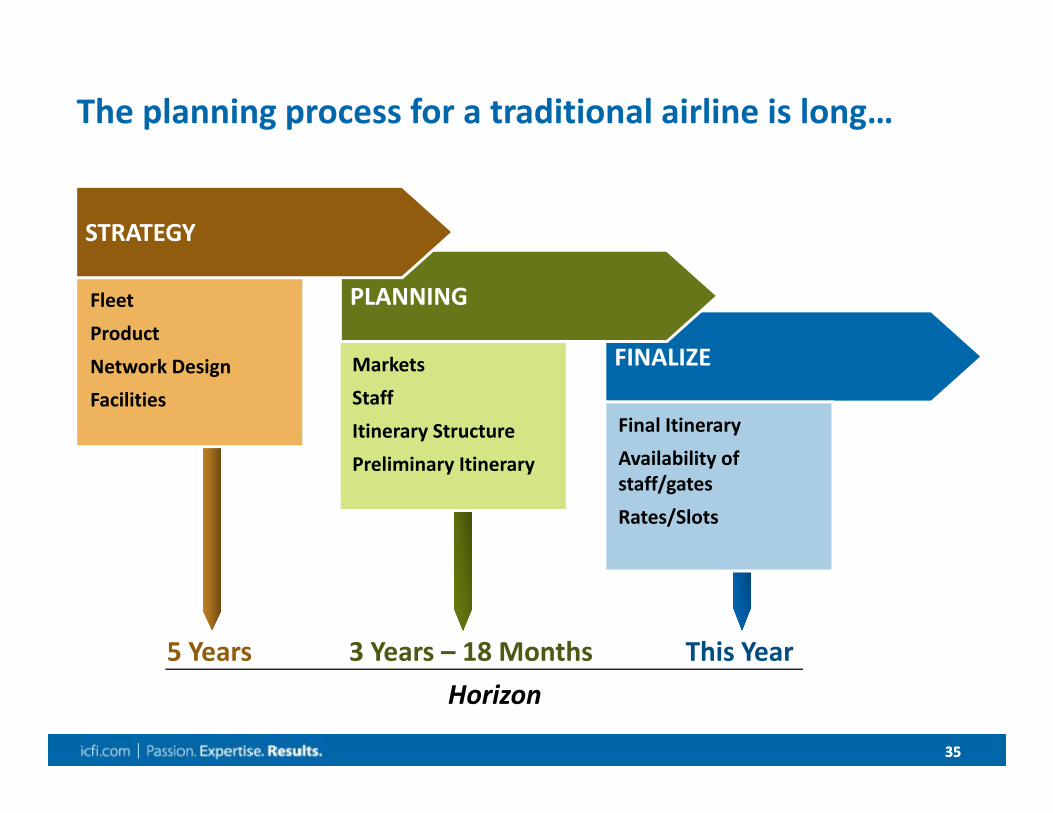
FINALIZE
The planning process for a traditional airline is long…
PLANNING
STRATEGY
FleetProductNetwork DesignFacilities
MarketsStaffItinerary StructurePreliminary Itinerary
5 Years 3 Years – 18 Months This YearHorizon
Final ItineraryAvailability of staff/gatesRates/Slots
3636
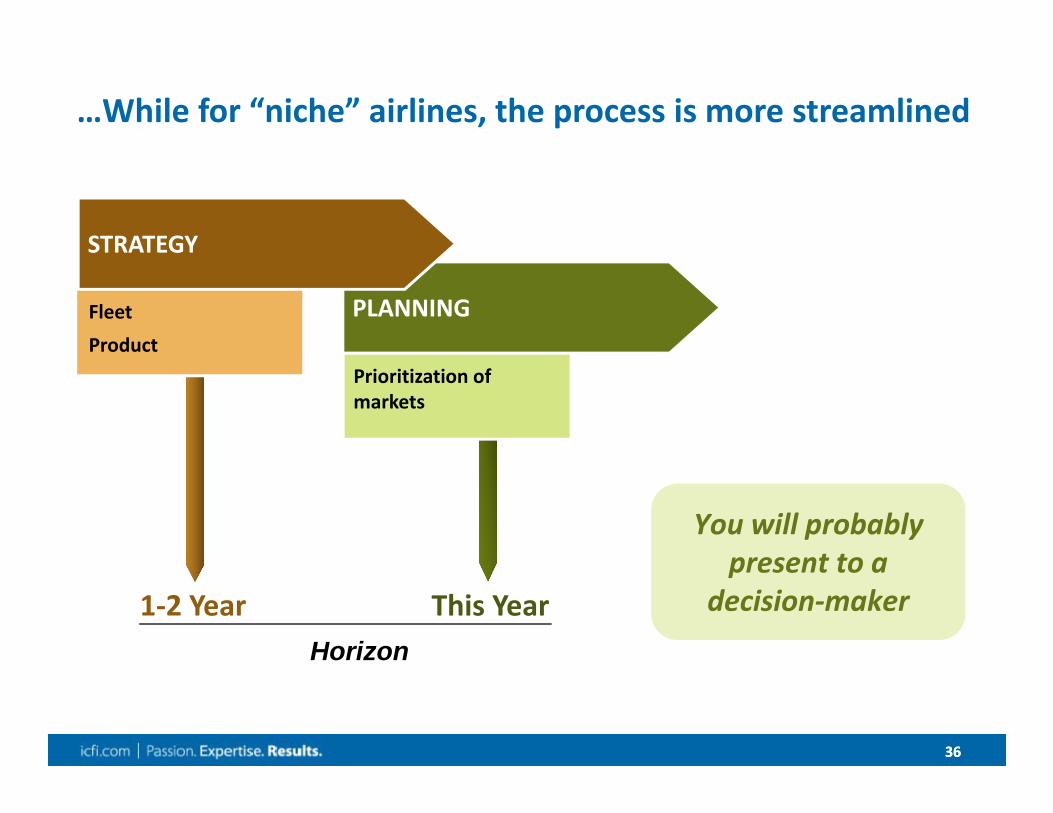
…While for “niche” airlines, the process is more streamlined
PLANNING
STRATEGY
FleetProduct
Prioritization of markets
1‐2 Year This YearHorizon
You will probably present to a
decision‐maker

3737
What do airlines consider when evaluating a new route?
Network Strategy– Net new aircraft (orders minus retirements)
– Hub(s) structure– Strategy for short/long haul– Alliance strategy
Risks and Opportunities
Financial Position– Liquidity– Costs and revenue vs. competitors
3838
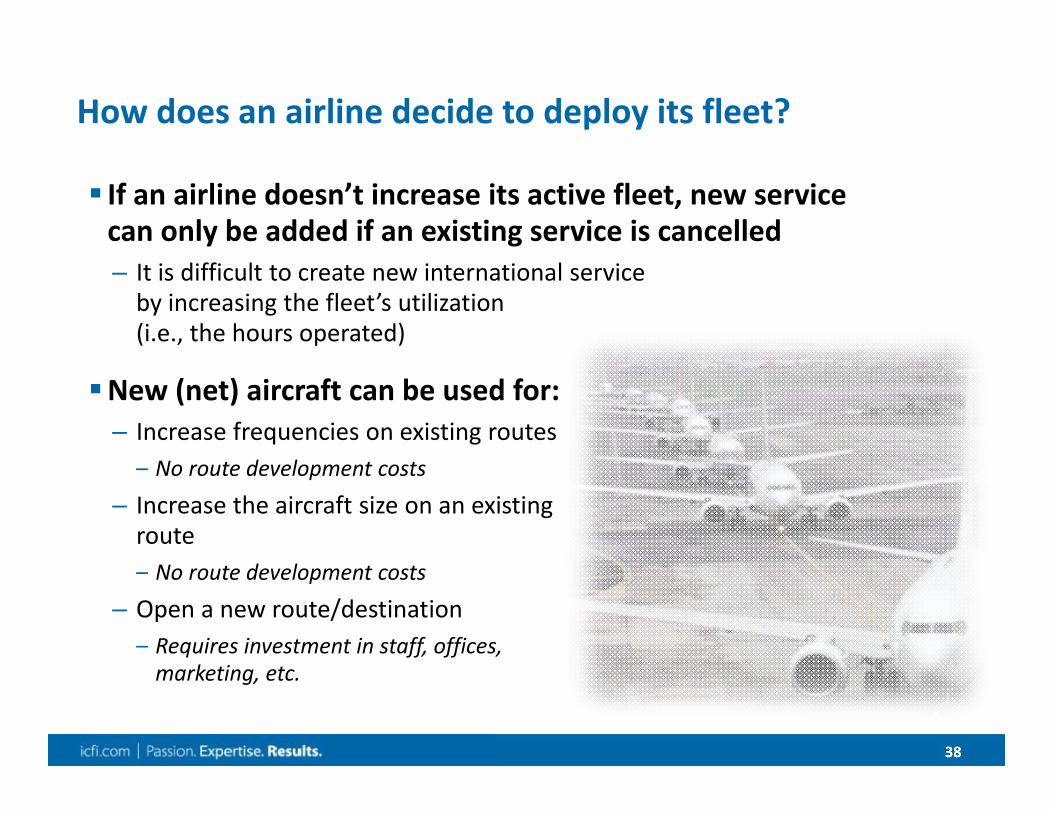
How does an airline decide to deploy its fleet?
If an airline doesn’t increase its active fleet, new service can only be added if an existing service is cancelled – It is difficult to create new international service by increasing the fleet’s utilization (i.e., the hours operated)
New (net) aircraft can be used for:– Increase frequencies on existing routes– No route development costs
– Increase the aircraft size on an existing route– No route development costs
– Open a new route/destination– Requires investment in staff, offices, marketing, etc.
3939
For the airport, the question is whether there is or is not demand– Can a high load factor and good fare be achieved?
For the airline, traffic and profitability are just the beginning– Do we have the right aircraft?– Does the route fit within our network strategy?• Independent• Our alliance
– Is the risk – reward trade‐off acceptable?– How does this opportunity compare with others?
For airlines, route planning is a question of finding the best use of limited resources
40
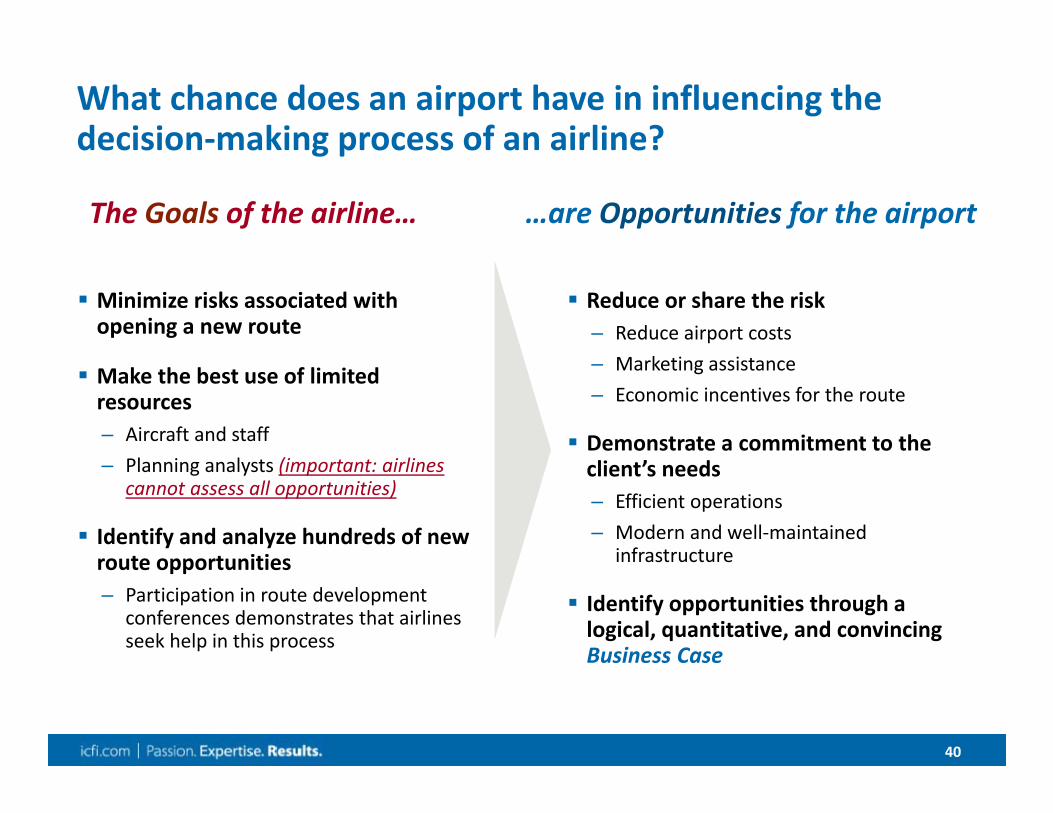
What chance does an airport have in influencing the decision‐making process of an airline?
Minimize risks associated with opening a new route
Make the best use of limited resources– Aircraft and staff– Planning analysts (important: airlines
cannot assess all opportunities)
Identify and analyze hundreds of new route opportunities– Participation in route development
conferences demonstrates that airlines seek help in this process
Reduce or share the risk– Reduce airport costs– Marketing assistance– Economic incentives for the route
Demonstrate a commitment to the client’s needs– Efficient operations– Modern and well‐maintained
infrastructure
Identify opportunities through a logical, quantitative, and convincing Business Case
The Goals of the airline… …are Opportunities for the airport

4141
Conducting a Route Forecast

4242
Overview of the route forecasting process
Identify potential markets
Choose the aircraft type for the airline/market
Collect data on existing demand and service offered
Define assumptions for the forecast– Suggested itinerary– Growth rate of traffic– Average fare– Market share
4343
Considerations when choosing the proposed aircraft
Aircraft range
Size corresponds to level of demand
Aircraft used by the airline in similar markets
Orders and delivery schedule
Operating restrictions– Runway length– Height above sea level, temperature– Noise restrictions
Key Factors
4444
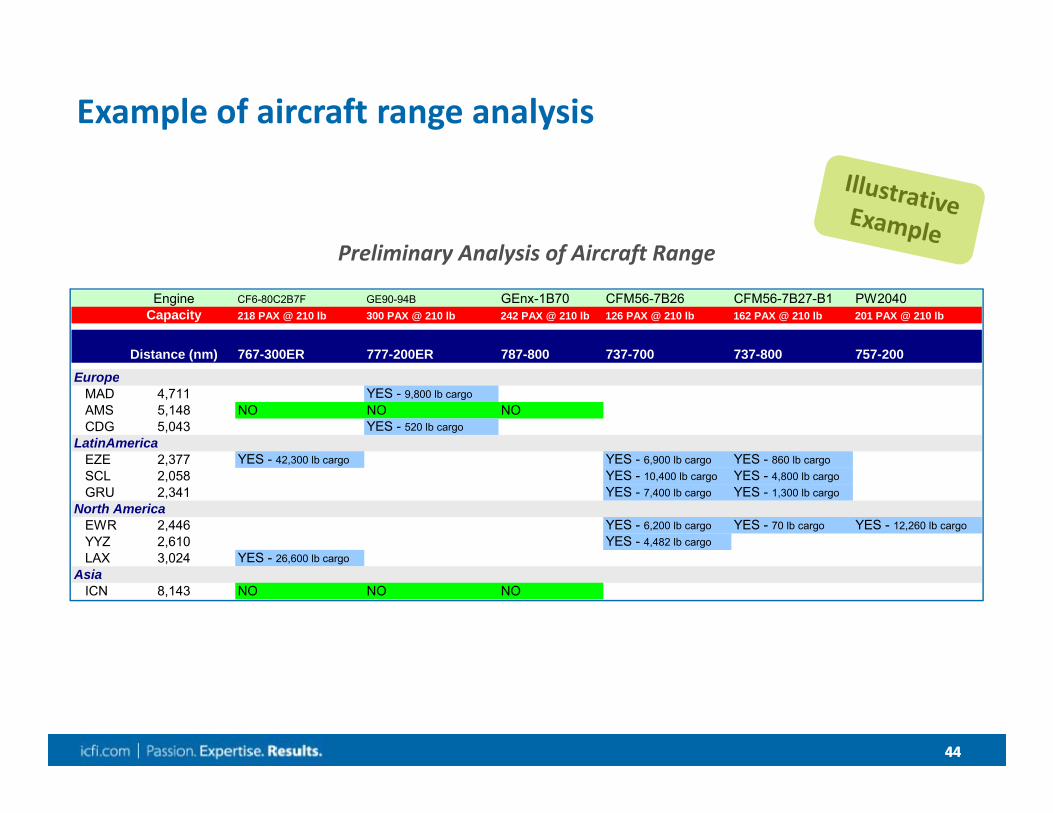
Example of aircraft range analysis
Engine CF6-80C2B7F GE90-94B GEnx-1B70 CFM56-7B26 CFM56-7B27-B1 PW2040Capacity 218 PAX @ 210 lb 300 PAX @ 210 lb 242 PAX @ 210 lb 126 PAX @ 210 lb 162 PAX @ 210 lb 201 PAX @ 210 lb
Distance (nm) 767-300ER 777-200ER 787-800 737-700 737-800 757-200Europe
MAD 4,711 YES - 9,800 lb cargoAMS 5,148 NO NO NOCDG 5,043 YES - 520 lb cargo
LatinAmericaEZE 2,377 YES - 42,300 lb cargo YES - 6,900 lb cargo YES - 860 lb cargoSCL 2,058 YES - 10,400 lb cargo YES - 4,800 lb cargoGRU 2,341 YES - 7,400 lb cargo YES - 1,300 lb cargo
North AmericaEWR 2,446 YES - 6,200 lb cargo YES - 70 lb cargo YES - 12,260 lb cargoYYZ 2,610 YES - 4,482 lb cargoLAX 3,024 YES - 26,600 lb cargo
AsiaICN 8,143 NO NO NO
Preliminary Analysis of Aircraft Range
45
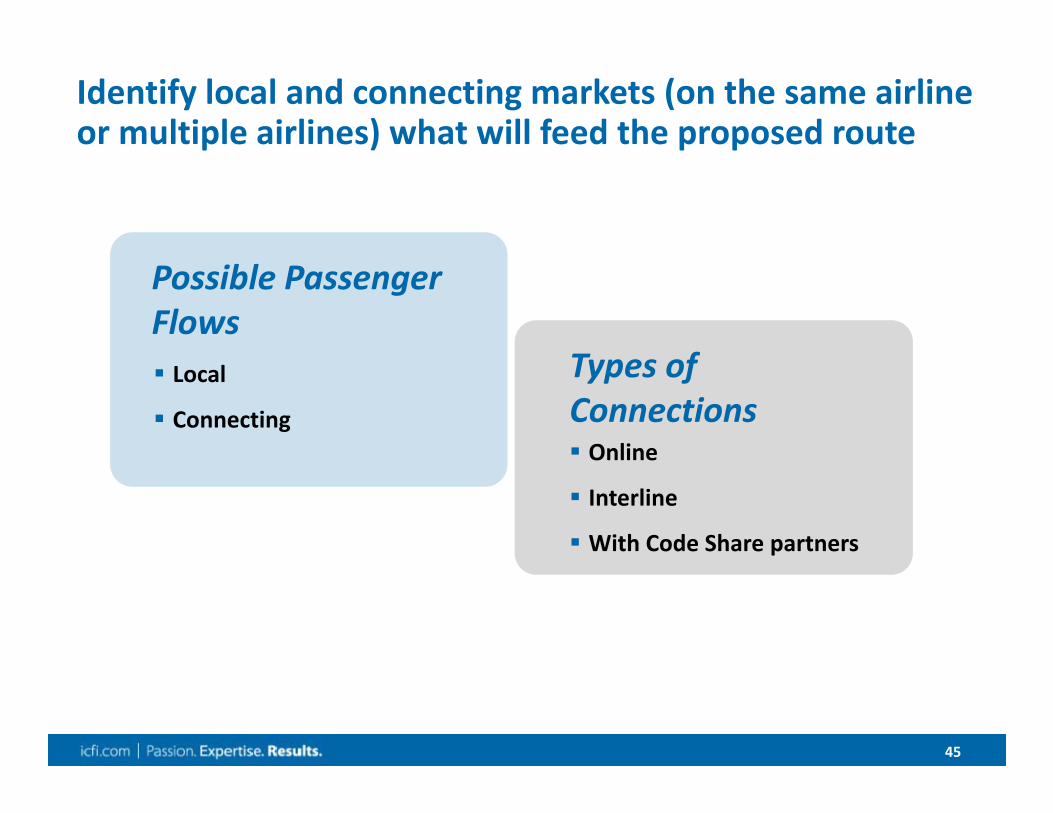
Local
Connecting Online
Interline
With Code Share partners
Possible PassengerFlows
Types of Connections
Identify local and connecting markets (on the same airline or multiple airlines) what will feed the proposed route

4646
PaxIS– Captures tickets purchased through all travel agencies that participate in IATA’s BSP and includes:• Origin and Destination airports, Connecting airports• Airline that markets and operates each segment, Point of sale• Month of trip, Fare class
– PaxIS supplier, IATA, estimates full market size
Market Information Data Tapes (“MIDT”) – Captures reservation data from the primary GDS systems (Amadeus, Sabre, Worldspan y Galileo). The level of detail is similar to what is provided by PaxIS
Estimate the size of the Origin – Destination market: the essential ingredient for making a successful Business Case
Sources of Origin – Destination Traffic Data
However, neither MIDT nor PaxIS capture direct sales…

47
MIDT/PaxIS data should be calibrated to estimate direct sales
65%
35%
0%
20%
40%
60%
80%
100% MIDT and PaxIS only capture sales made through GDS/travel agencies– They do not capture direct sales made
through airlines (website, reservation center, sales office, etc)
The penetration of MIDT and PaxISdepends on the market and airline– It is estimated that MIDT and PaxIS capture
65% of international sales to/from the United States
Example: Total O&D Demand
MIDT o PaxIS
DirectSales
The calibration process requires complimentary statistics (see annex) and varies according to the market and the information available

4848
After calculating the actual Origin – Destination traffic, the demand stimulus generated by the new service must be estimated
New nonstop flights typically stimulate traffic demand– Stimulus is the result of easier market access and greater marketing of the destination (airlines, tour operators, etc.)
– New service attracts new passengers, just as it allows existing passengers to travel more frequently (above all in the business segment)
A market’s first nonstop flight can stimulate demand between 100% and 300%
In addition to demand in the local market, it is common to see lesser stimulation in connecting markets, especially when the airline serving the new route has a strong presence in the connecting markets
4949
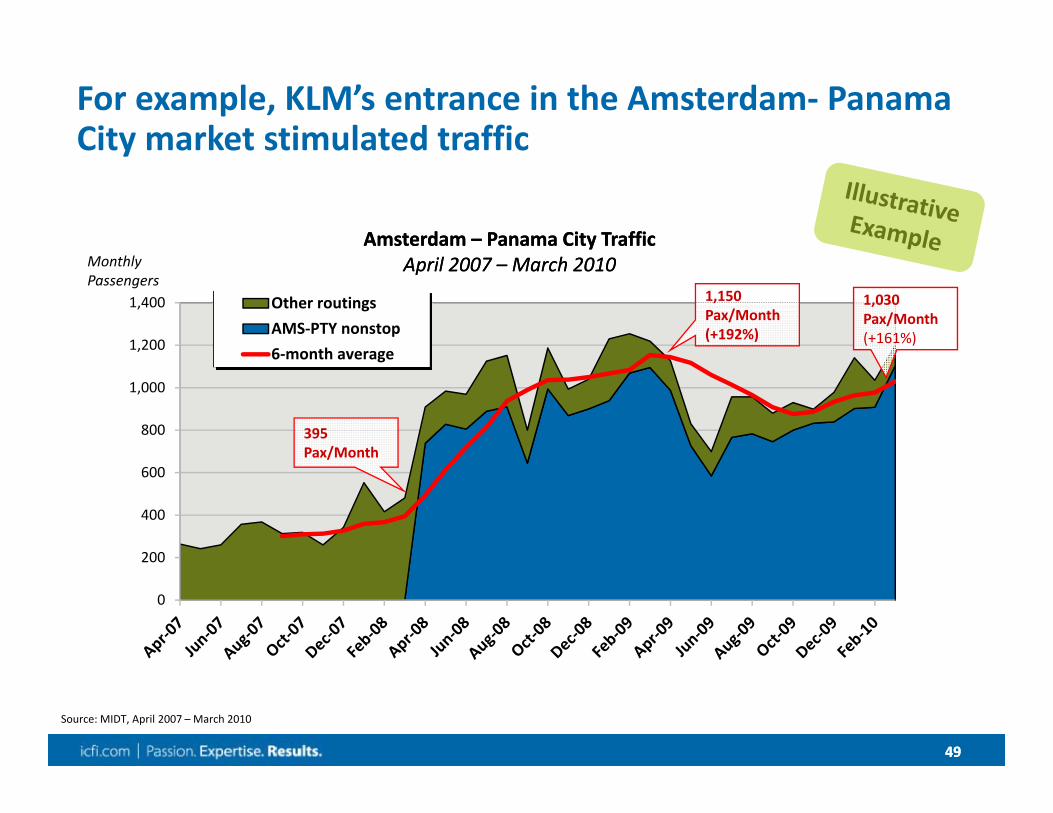
For example, KLM’s entrance in the Amsterdam‐ Panama City market stimulated traffic
0
200
400
600
800
1,000
1,200
1,400 Other routingsAMS‐PTY nonstop6‐month average
1,030 Pax/Month(+161%)
395Pax/Month
1,150Pax/Month(+192%)
Amsterdam – Panama City TrafficApril 2007 – March 2010
Amsterdam – Panama City TrafficApril 2007 – March 2010
Source: MIDT, April 2007 – March 2010
MonthlyPassengers

5050
Estimating average fares by origin – destination market
Both PaxIS and MIDT have information on average fares by market– However, both sources tend to over estimate the fare as more price –sensitive passengers tend to to use direct sales channels
Average fares by airline and market can also be found on the internet– Travel agencies such as Expedia, Travelocity, Orbitz, etc.– Search engines such as Sidestep, Kayak, etc.– Airline websites
In order to estimate the average fare on the proposed route, it isrecommended to use the best information possible for markets with a similar profile as a point of reference
5151
Choosing the schedule – Key Factors
It is an airline that connects passengers through a hub?– If so, the schedule should fit into a connecting bank in order to maximize traffic
Does the airline have alliance partners at the airport?– If so, “online alliance” connections should be considered
What are the schedules in similar markets?– Overnight?– Morning arrival/departure? Evening? Etc.
How many weekly frequencies?– The maximum possible should be proposed according to demand, but also consistent with similar markets operated by the airline
Seasonal or year‐round service?– Depends on the seasonality of traffic and the type of market (business, leisure, VFR, etc)
5252
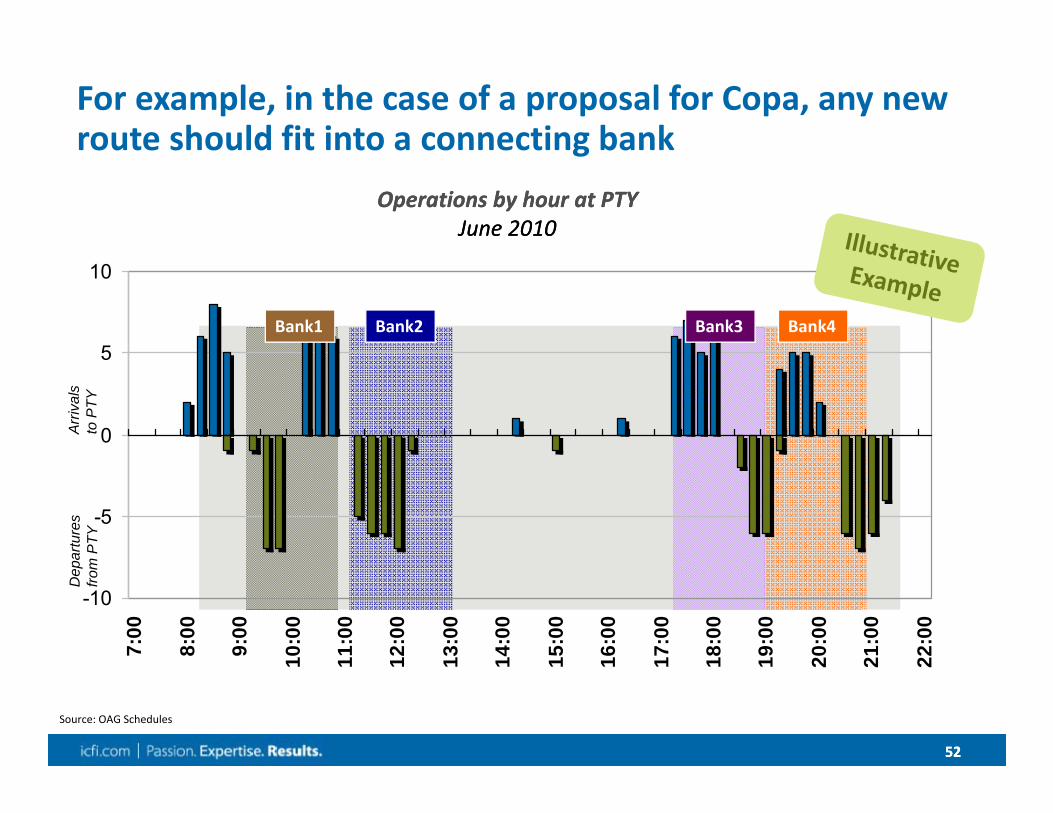
For example, in the case of a proposal for Copa, any new route should fit into a connecting bank
-10
-5
0
5
10
7:00
8:00
9:00
10:0
0
11:0
0
12:0
0
13:0
0
14:0
0
15:0
0
16:0
0
17:0
0
18:0
0
19:0
0
20:0
0
21:0
0
22:0
0
Operations by hour at PTYJune 2010
Operations by hour at PTYJune 2010
Arr
ival
sto
PTY
Dep
artu
res
from
PTY
Source: OAG Schedules
Bank1 Bank2 Bank3 Bank4

5353
All of this information is needed for the essential analysis of the Business Case: the forecast of market share, passenger traffic, and revenue on the proposed route
ICF uses NETWORKS, a proprietary tool that models route schedules to estimate the market share of each airline– Currently used by British Airways, Copa Airlines, Virgin Atlantic, Oneworld
NETWORKS is “QSI” (Quality of Service Index) model, an industry‐accepted methodology for calculating carrier share
NETWORKS quantifies the market share of each segment (the “QSI”), taking into account: – Type of service (Online, Interline, Etc.)
– Frequency
– Number of stops and connections
– Total travel time (between origin and destination)
– Type of aircraft (size, jet vs. turboprop)
– Etc.
5454
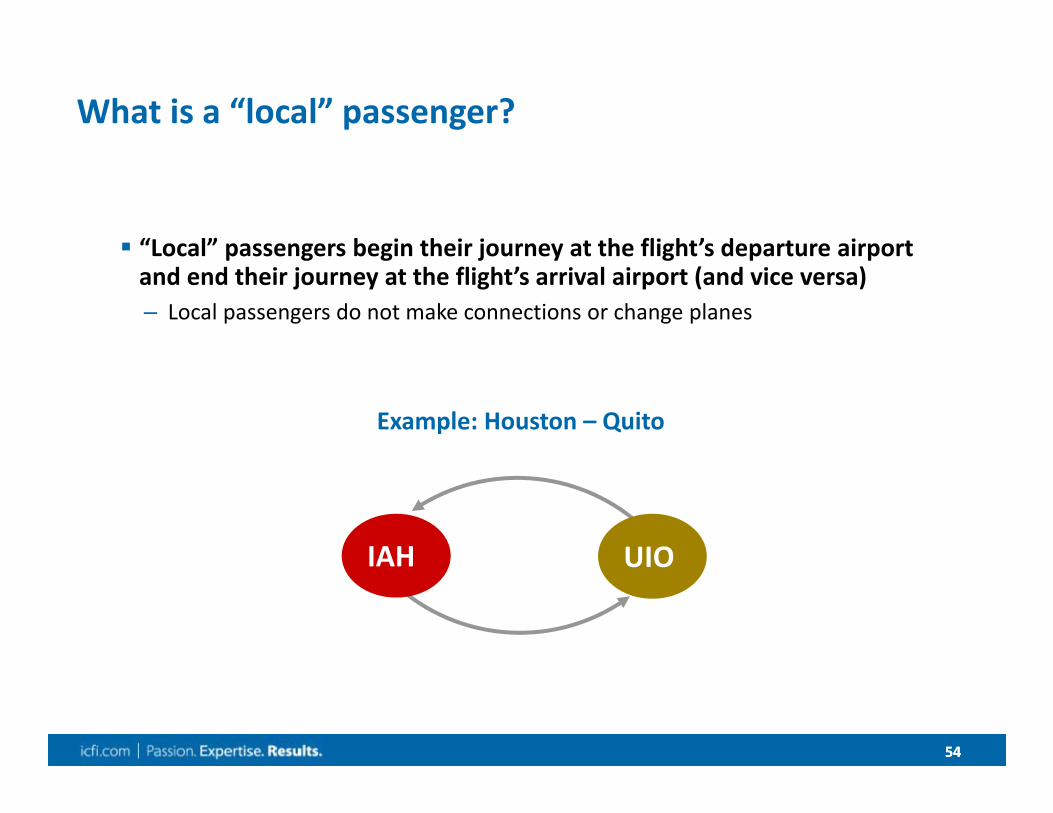
What is a “local” passenger?
“Local” passengers begin their journey at the flight’s departure airport and end their journey at the flight’s arrival airport (and vice versa)– Local passengers do not make connections or change planes
Example: Houston – Quito
IAH UIO
5555
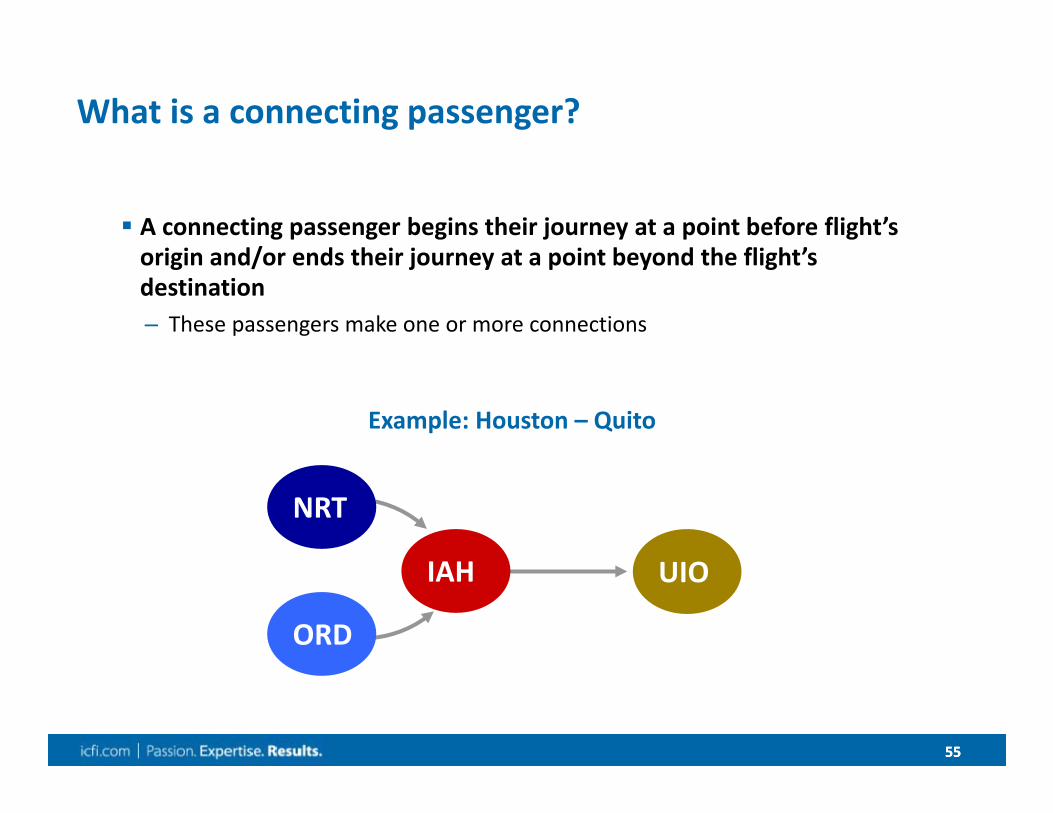
What is a connecting passenger?
A connecting passenger begins their journey at a point before flight’s origin and/or ends their journey at a point beyond the flight’s destination– These passengers make one or more connections
Example: Houston – Quito
UIO
NRT
ORD
IAH
56
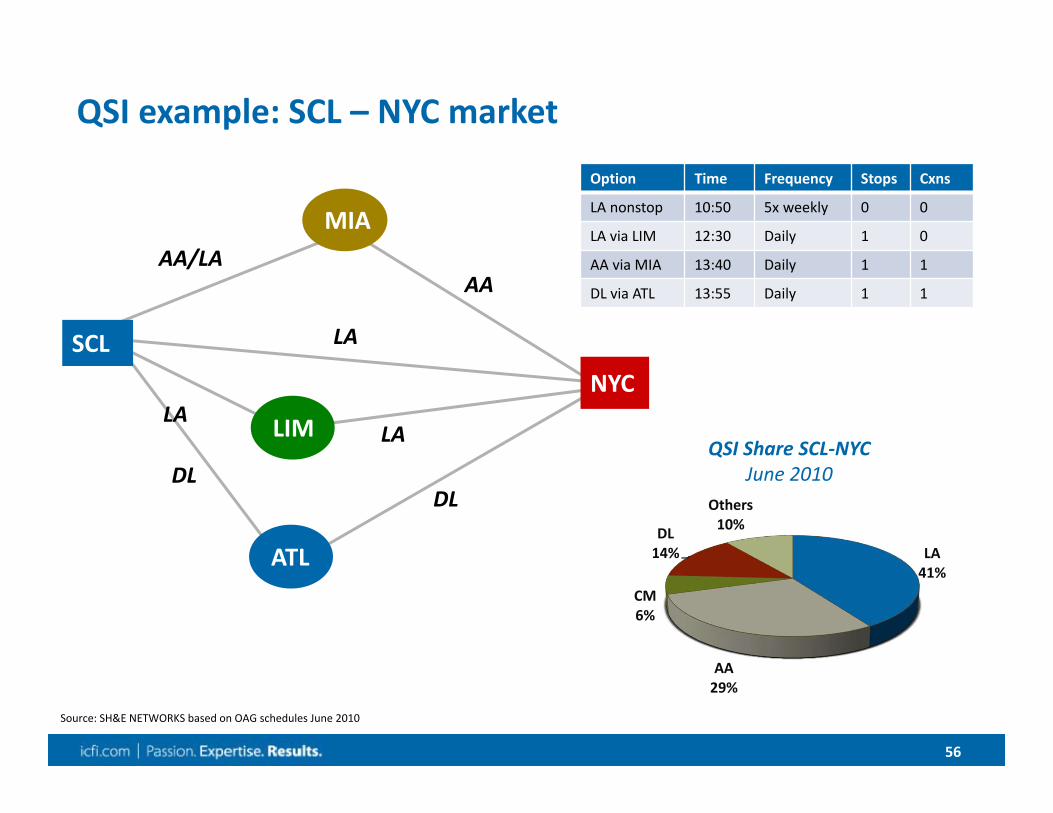
QSI example: SCL – NYC market
SCL
LIM
MIA
NYC
AA/LA
DL
AA
DL
LA
ATL
LALA
Source: SH&E NETWORKS based on OAG schedules June 2010
QSI Share SCL‐NYCJune 2010
Option Time Frequency Stops Cxns
LA nonstop 10:50 5x weekly 0 0
LA via LIM 12:30 Daily 1 0
AA via MIA 13:40 Daily 1 1
DL via ATL 13:55 Daily 1 1
LA41%
AA29%
CM6%
DL14%
Others10%
5757
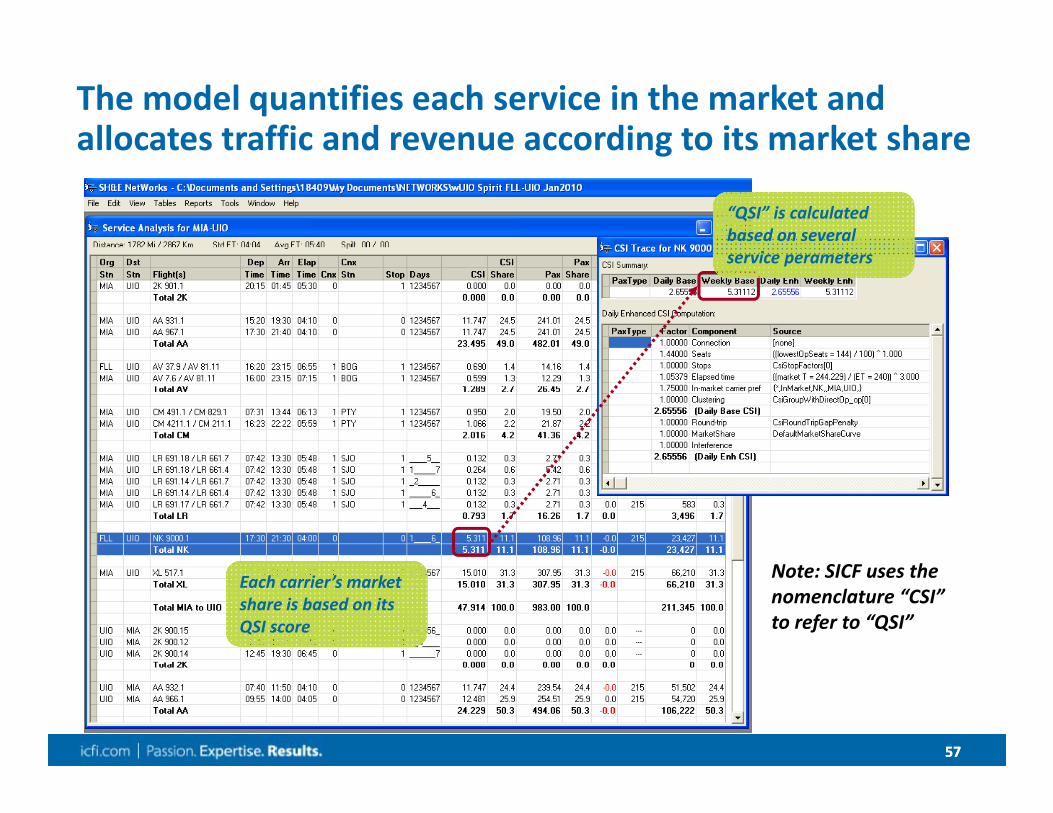
The model quantifies each service in the market and allocates traffic and revenue according to its market share
Note: SICF uses thenomenclature “CSI” to refer to “QSI”
“QSI” is calculated based on several service perameters
Each carrier’s market share is based on its QSI score
5858
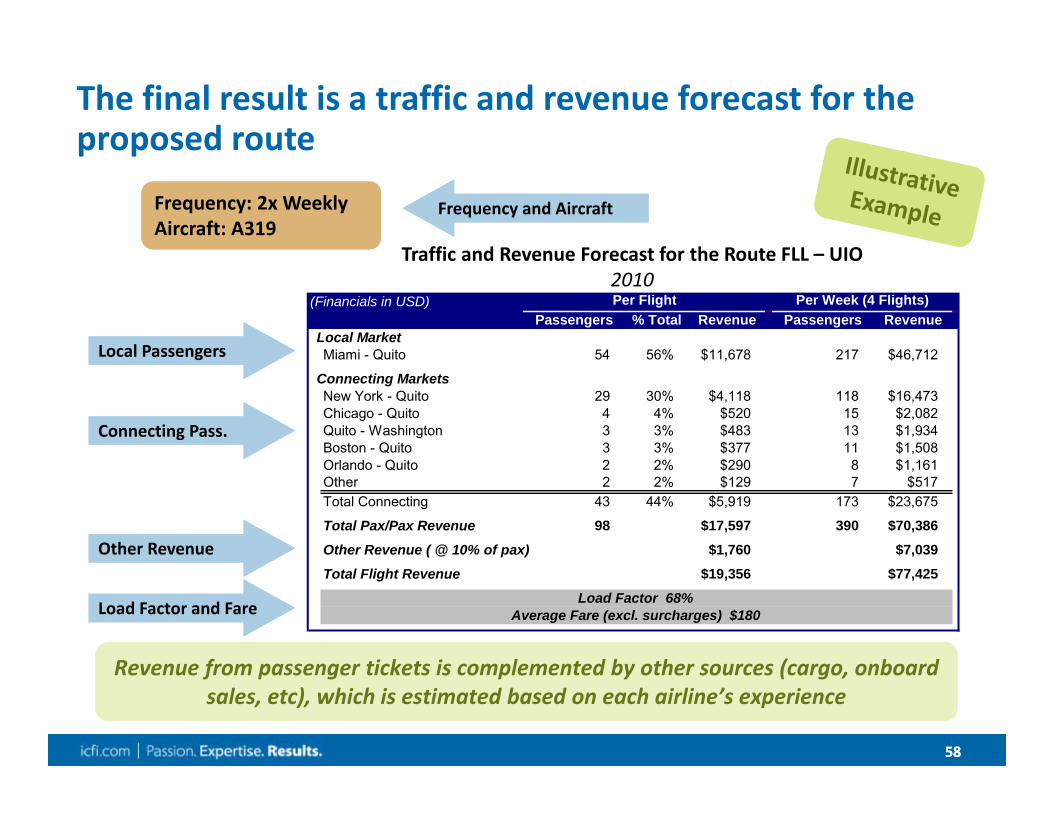
Traffic and Revenue Forecast for the Route FLL – UIO2010
Frequency: 2x WeeklyAircraft: A319Frequency: 2x WeeklyAircraft: A319
Revenue from passenger tickets is complemented by other sources (cargo, onboard sales, etc), which is estimated based on each airline’s experience
(Financials in USD) Per Flight Per Week (4 Flights)Passengers % Total Revenue Passengers Revenue
Local MarketMiami - Quito 54 56% $11,678 217 $46,712
Connecting MarketsNew York - Quito 29 30% $4,118 118 $16,473Chicago - Quito 4 4% $520 15 $2,082Quito - Washington 3 3% $483 13 $1,934Boston - Quito 3 3% $377 11 $1,508Orlando - Quito 2 2% $290 8 $1,161Other 2 2% $129 7 $517Total Connecting 43 44% $5,919 173 $23,675
Total Pax/Pax Revenue 98 $17,597 390 $70,386
Other Revenue ( @ 10% of pax) $1,760 $7,039Total Flight Revenue $19,356 $77,425
Load Factor 68%Average Fare (excl. surcharges) $180
The final result is a traffic and revenue forecast for the proposed route
Local PassengersLocal Passengers
Connecting Pass.Connecting Pass.
Other RevenueOther Revenue
Load Factor and FareLoad Factor and Fare
Frequency and AircraftFrequency and Aircraft
5959
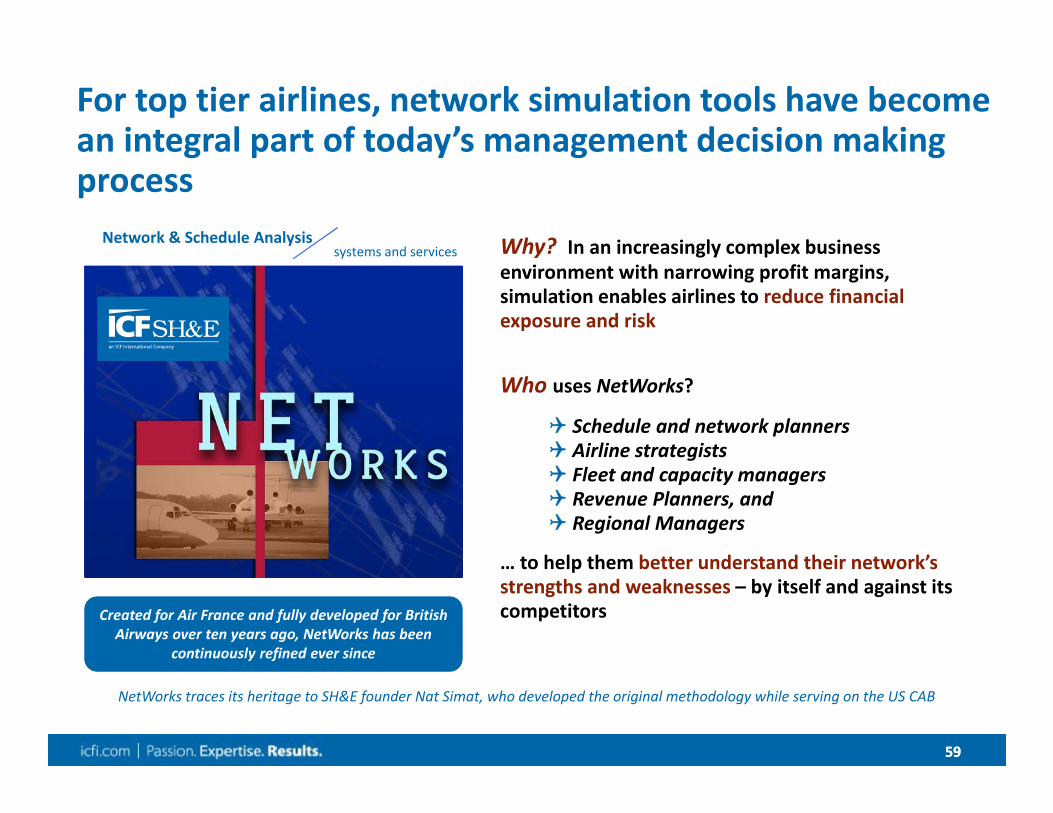
For top tier airlines, network simulation tools have become an integral part of today’s management decision making process
Why? In an increasingly complex business environment with narrowing profit margins, simulation enables airlines to reduce financial exposure and risk
Who uses NetWorks?
Schedule and network planners Airline strategists Fleet and capacity managers Revenue Planners, and Regional Managers
… to help them better understand their network’s strengths and weaknesses – by itself and against its competitors
Network & Schedule Analysissystems and services
[ ][ ][ ][ ]
Created for Air France and fully developed for British Airways over ten years ago, NetWorks has been
continuously refined ever since
Created for Air France and fully developed for British Airways over ten years ago, NetWorks has been
continuously refined ever since
NetWorks traces its heritage to SH&E founder Nat Simat, who developed the original methodology while serving on the US CAB
6060
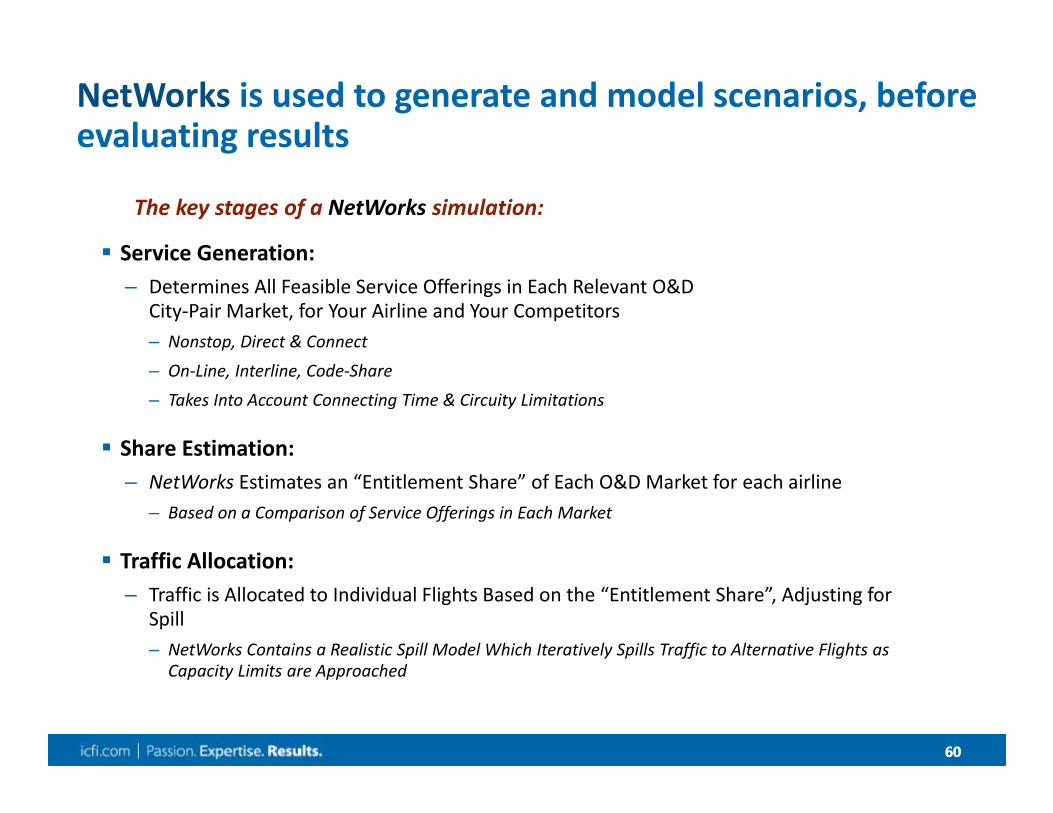
NetWorks is used to generate and model scenarios, before evaluating results
Service Generation:– Determines All Feasible Service Offerings in Each Relevant O&D
City‐Pair Market, for Your Airline and Your Competitors– Nonstop, Direct & Connect
– On‐Line, Interline, Code‐Share
– Takes Into Account Connecting Time & Circuity Limitations
Share Estimation:– NetWorks Estimates an “Entitlement Share” of Each O&D Market for each airline
– Based on a Comparison of Service Offerings in Each Market
Traffic Allocation:– Traffic is Allocated to Individual Flights Based on the “Entitlement Share”, Adjusting for
Spill– NetWorks Contains a Realistic Spill Model Which Iteratively Spills Traffic to Alternative Flights as
Capacity Limits are Approached
The key stages of a NetWorks simulation:
6161
Example Business Case
Los Cabos–Houston for Southwest AirlinesGrupo Aeroportuario del Pacifico (GAP)
Prepared by
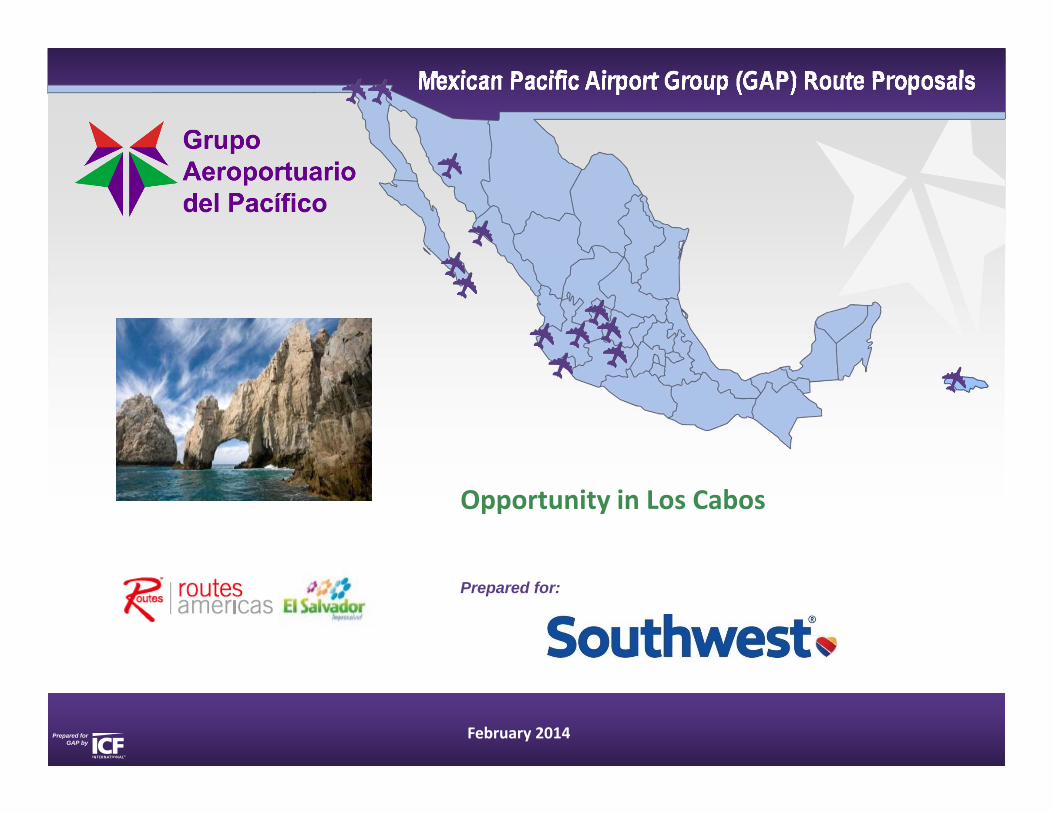
Mexican Pacific Airport Group (GAP) Route ProposalsMexican Pacific Airport Group (GAP) Route Proposals
Prepared forGAP by
Opportunity in Los Cabos
Prepared for:
February 2014

63
Prepared forGAP by
Mexican Pacific Airport Group (GAP) maintains and operates 12 airports in Mexico, as well as Montego Bay Jamaica
Fuente: GAP
Airport Code
Guadalajara GDL
Tijuana TIJ
Puerto Vallarta PVR
Los Cabos SJD
Hermosillo HMO
Leon BJX
La Paz LAP
Mexicali MXL
Morelia MLM
Aguascalientes AGU
Los Mochis LMM
Manzanillo ZLO
Montego Bay MBJ
TIJ4.4-3%%
GAP airports served 29.2 million passengers in the 12 months ending June 2015, representing 4% growth over the previous year
MXL0.57%
HMO1.3-5%
LAP0.71%
SJD3.1-11% PVR
3.418%
GDL9.17%
LMM0.325%
ZLO0.2-1%
MLM0.54%
AGU0.619%
BJX1.323%
Passengers, MillionsYear-over-Year % Change
Investors include:
GAP listed on:
MBJ3.86.7%
64
Prepared forGAP by
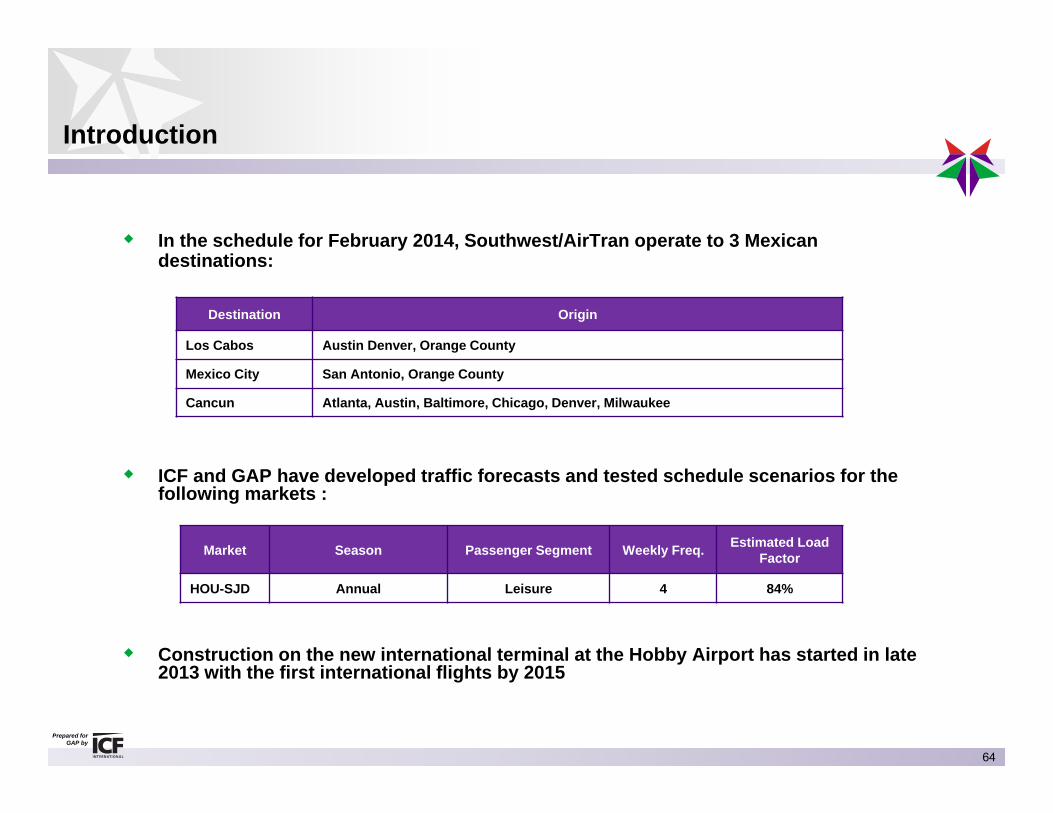
In the schedule for February 2014, Southwest/AirTran operate to 3 Mexican destinations:
ICF and GAP have developed traffic forecasts and tested schedule scenarios for the following markets :
Construction on the new international terminal at the Hobby Airport has started in late 2013 with the first international flights by 2015
Market Season Passenger Segment Weekly Freq. Estimated Load Factor
HOU-SJD Annual Leisure 4 84%
Introduction
Destination Origin
Los Cabos Austin Denver, Orange County
Mexico City San Antonio, Orange County
Cancun Atlanta, Austin, Baltimore, Chicago, Denver, Milwaukee
65
Prepared forGAP by
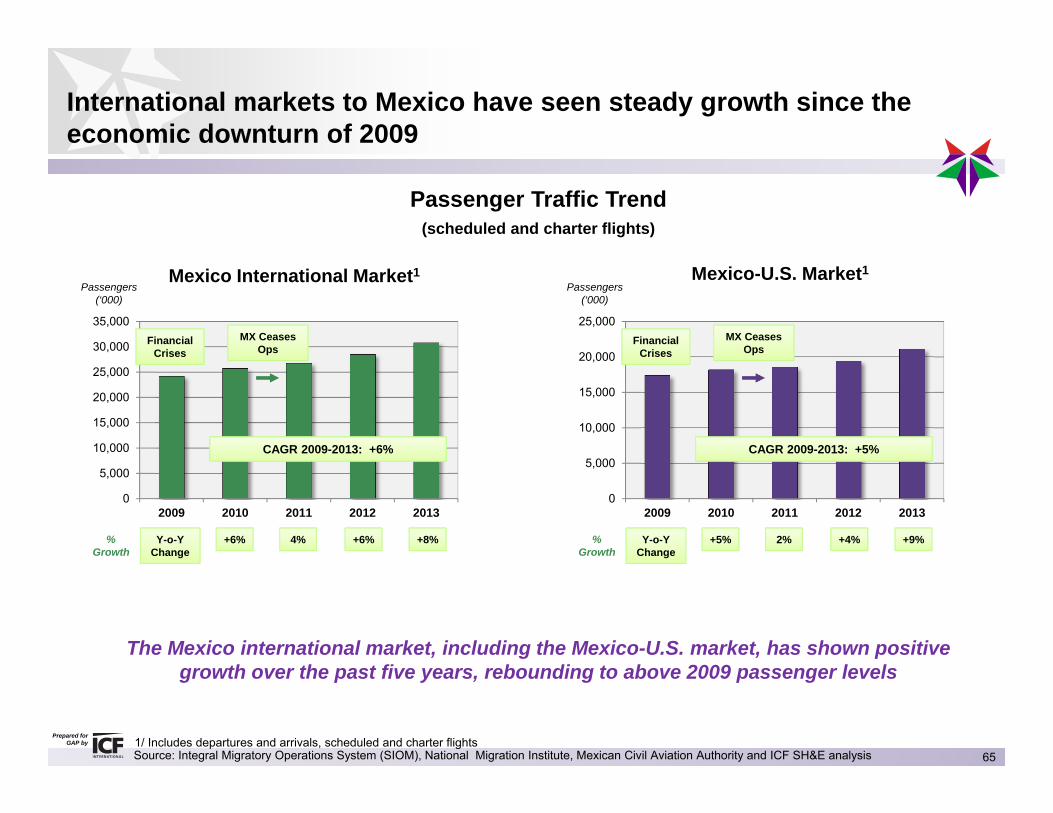
International markets to Mexico have seen steady growth since the economic downturn of 2009
Source: Integral Migratory Operations System (SIOM), National Migration Institute, Mexican Civil Aviation Authority and ICF SH&E analysis1/ Includes departures and arrivals, scheduled and charter flights
Passenger Traffic Trend(scheduled and charter flights)
Mexico International Market1
0
5,000
10,000
15,000
20,000
25,000
30,000
35,000
2009 2010 2011 2012 2013
% Growth
Passengers (‘000)
+6% 4% +8%
CAGR 2009-2013: +6%
Y-o-Y Change
Financial Crises
MX Ceases Ops
+6%
Mexico-U.S. Market1
0
5,000
10,000
15,000
20,000
25,000
2009 2010 2011 2012 2013
% Growth
Passengers (‘000)
+5% 2% +9%
CAGR 2009-2013: +5%
Y-o-Y Change
Financial Crises
MX Ceases Ops
+4%
The Mexico international market, including the Mexico-U.S. market, has shown positive growth over the past five years, rebounding to above 2009 passenger levels
66
Prepared forGAP by
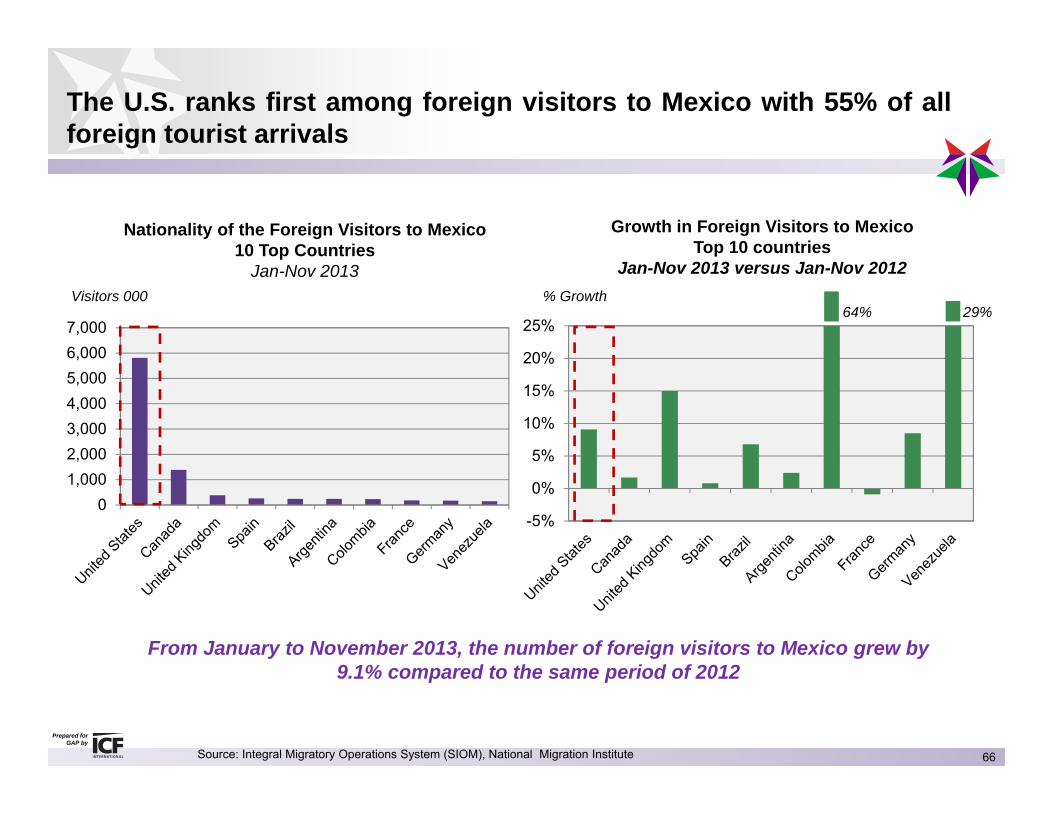
29%
-5%
0%
5%
10%
15%
20%
25%
01,0002,0003,0004,0005,0006,0007,000
The U.S. ranks first among foreign visitors to Mexico with 55% of allforeign tourist arrivals
Source: Integral Migratory Operations System (SIOM), National Migration Institute
Visitors 000
Nationality of the Foreign Visitors to Mexico10 Top Countries
Jan-Nov 2013
Growth in Foreign Visitors to MexicoTop 10 countries
Jan-Nov 2013 versus Jan-Nov 2012% Growth
From January to November 2013, the number of foreign visitors to Mexico grew by 9.1% compared to the same period of 2012
64%
Prepared by
Mexican Pacific Airport Group (GAP) Route ProposalsMexican Pacific Airport Group (GAP) Route Proposals
Prepared forGAP by
Market Overview of Los Cabos
68
Prepared forGAP by
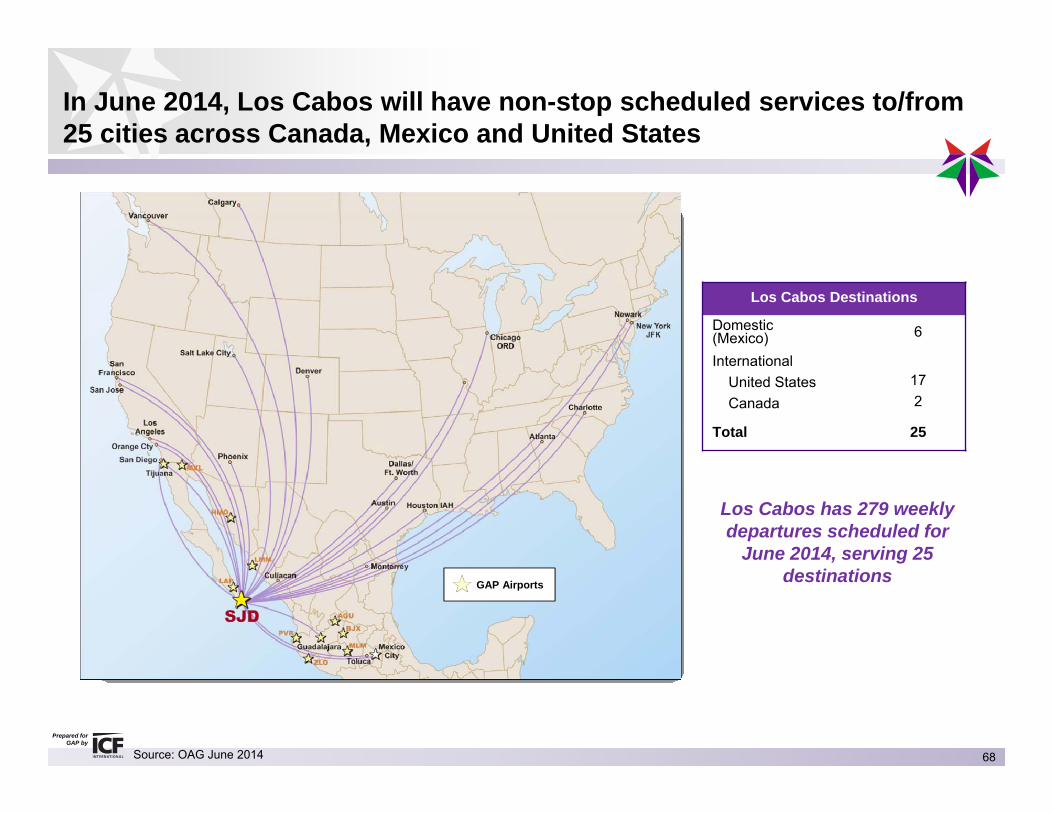
In June 2014, Los Cabos will have non-stop scheduled services to/from 25 cities across Canada, Mexico and United States
Source: OAG June 2014
Los Cabos Destinations
Domestic (Mexico) 6
InternationalUnited StatesCanada
172
Total 25
Los Cabos has 279 weekly departures scheduled for
June 2014, serving 25 destinationsGAP Airports
69
Prepared forGAP by
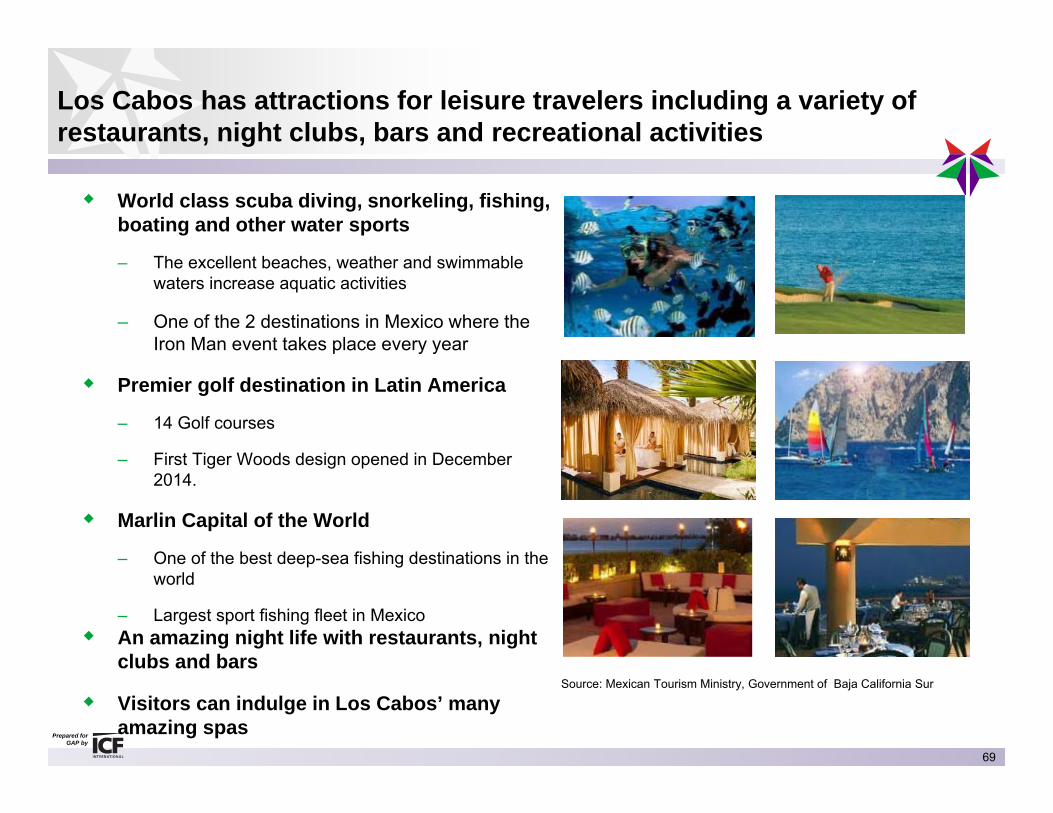
Los Cabos has attractions for leisure travelers including a variety of restaurants, night clubs, bars and recreational activities
Source: Mexican Tourism Ministry, Government of Baja California Sur
World class scuba diving, snorkeling, fishing, boating and other water sports
– The excellent beaches, weather and swimmable waters increase aquatic activities
– One of the 2 destinations in Mexico where the Iron Man event takes place every year
Premier golf destination in Latin America
– 14 Golf courses
– First Tiger Woods design opened in December 2014.
Marlin Capital of the World
– One of the best deep-sea fishing destinations in the world
– Largest sport fishing fleet in Mexico An amazing night life with restaurants, night
clubs and bars
Visitors can indulge in Los Cabos’ many amazing spas
70
Prepared forGAP by
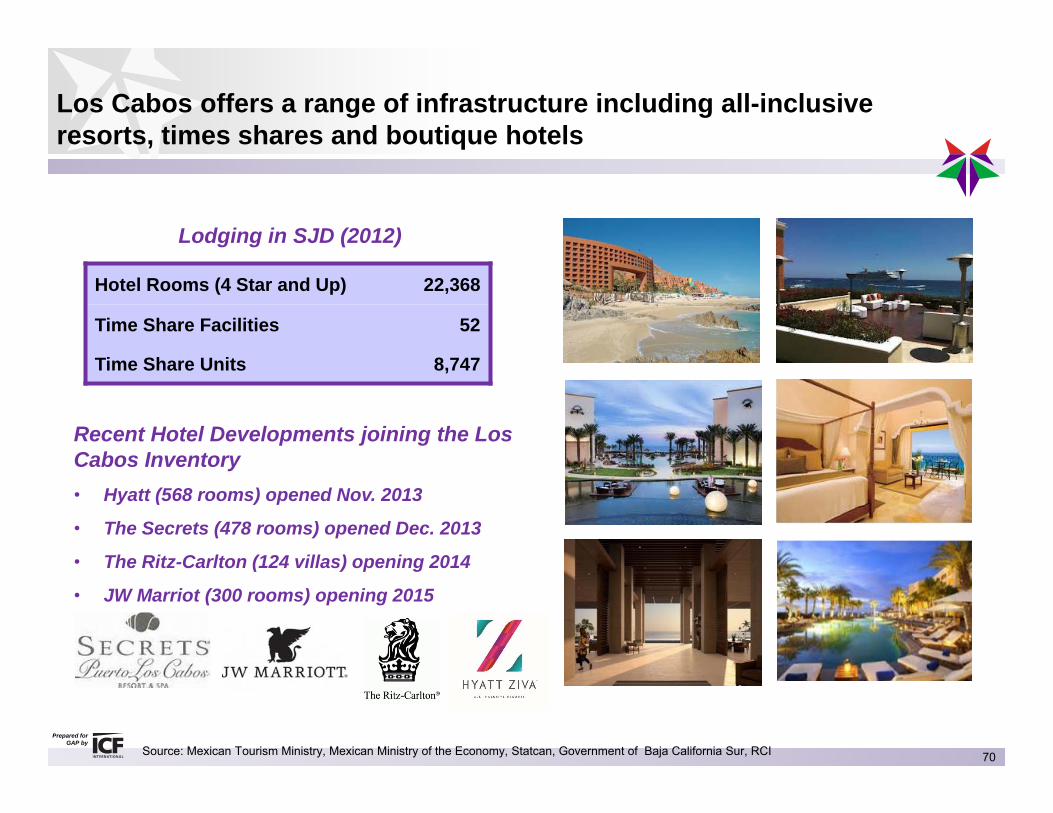
Los Cabos offers a range of infrastructure including all-inclusive resorts, times shares and boutique hotels
Source: Mexican Tourism Ministry, Mexican Ministry of the Economy, Statcan, Government of Baja California Sur, RCI
Lodging in SJD (2012)
Hotel Rooms (4 Star and Up) 22,368
Time Share Facilities 52
Time Share Units 8,747
Recent Hotel Developments joining the Los Cabos Inventory• Hyatt (568 rooms) opened Nov. 2013
• The Secrets (478 rooms) opened Dec. 2013
• The Ritz-Carlton (124 villas) opening 2014
• JW Marriot (300 rooms) opening 2015
71
Prepared forGAP by
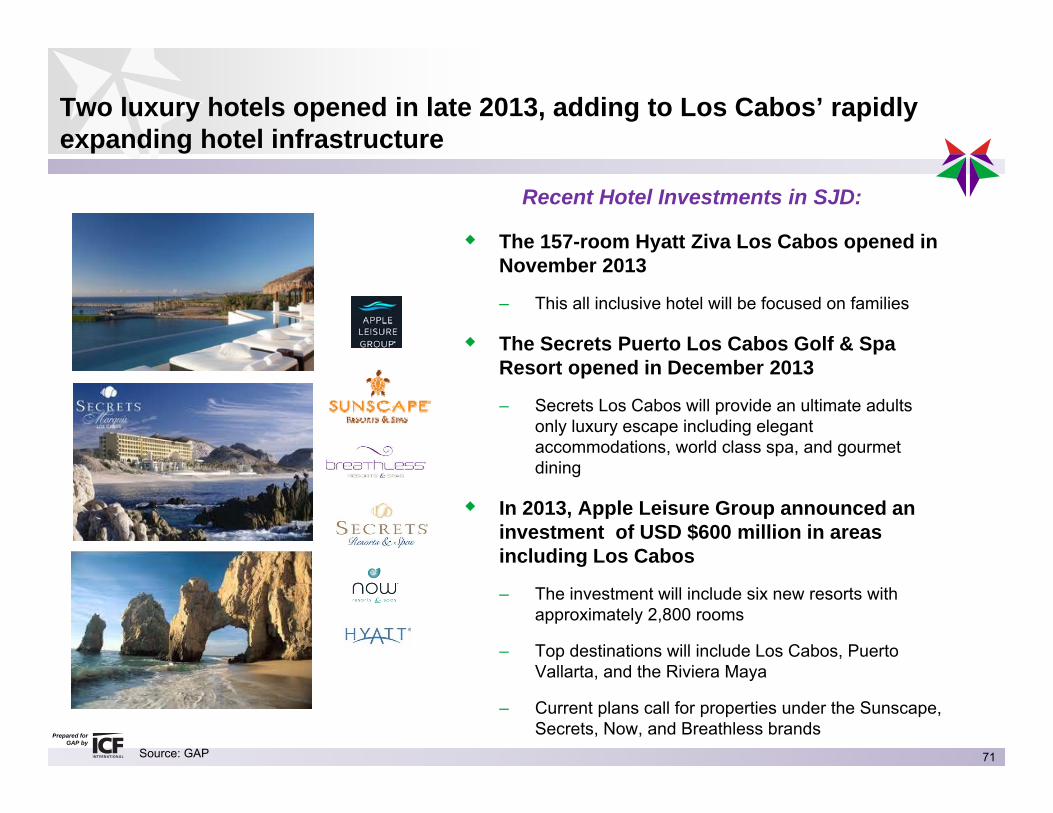
Two luxury hotels opened in late 2013, adding to Los Cabos’ rapidly expanding hotel infrastructure
The 157-room Hyatt Ziva Los Cabos opened in November 2013
– This all inclusive hotel will be focused on families
The Secrets Puerto Los Cabos Golf & Spa Resort opened in December 2013
– Secrets Los Cabos will provide an ultimate adults only luxury escape including elegant accommodations, world class spa, and gourmet dining
In 2013, Apple Leisure Group announced an investment of USD $600 million in areas including Los Cabos
– The investment will include six new resorts with approximately 2,800 rooms
– Top destinations will include Los Cabos, Puerto Vallarta, and the Riviera Maya
– Current plans call for properties under the Sunscape, Secrets, Now, and Breathless brands
Recent Hotel Investments in SJD:
Source: GAP
72
Prepared forGAP by
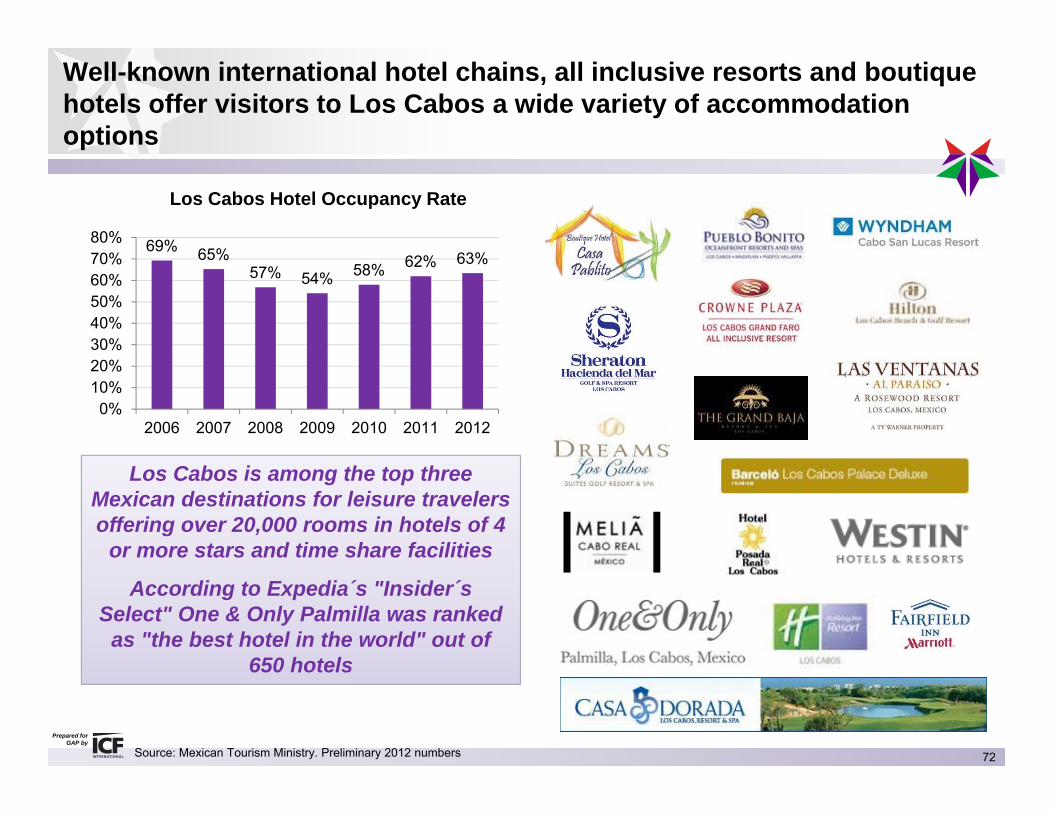
Well-known international hotel chains, all inclusive resorts and boutique hotels offer visitors to Los Cabos a wide variety of accommodation options
Source: Mexican Tourism Ministry. Preliminary 2012 numbers
Los Cabos Hotel Occupancy Rate
69% 65%57% 54% 58% 62% 63%
0%10%20%30%40%50%60%70%80%
2006 2007 2008 2009 2010 2011 2012
Los Cabos is among the top three Mexican destinations for leisure travelers offering over 20,000 rooms in hotels of 4
or more stars and time share facilities
According to Expedia´s "Insider´s Select" One & Only Palmilla was ranked
as "the best hotel in the world" out of 650 hotels
73
Prepared forGAP by
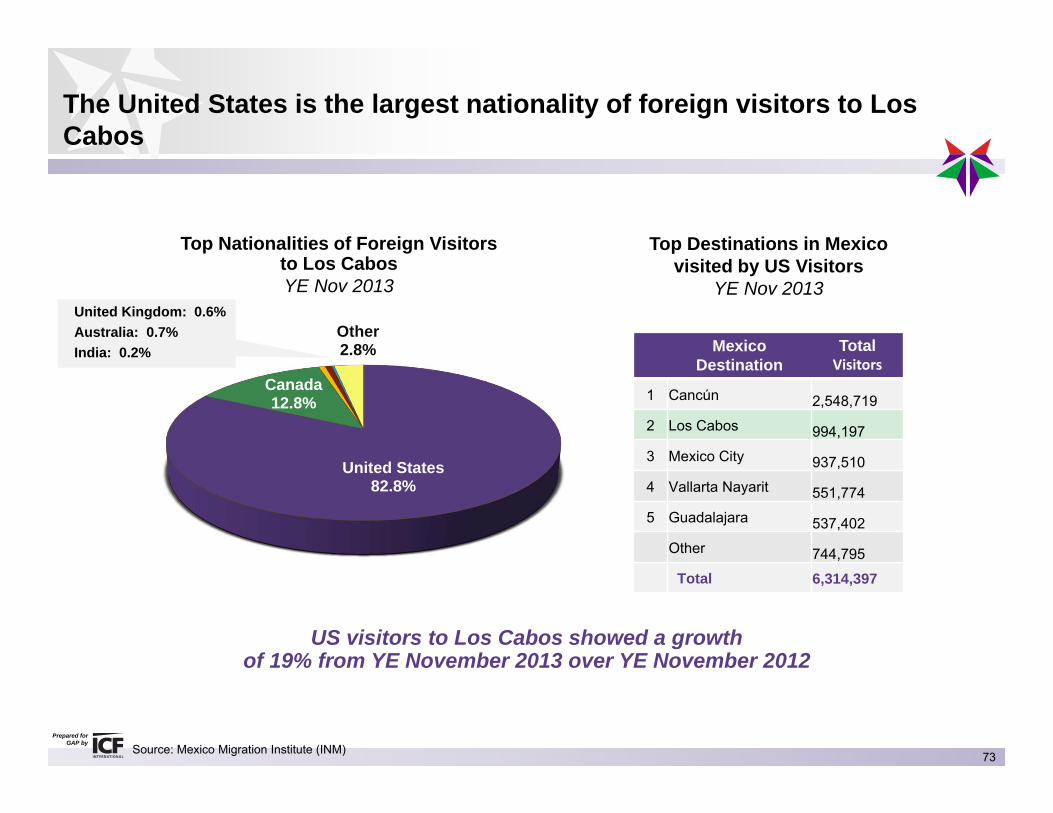
Source: Mexico Migration Institute (INM)
Top Destinations in Mexico visited by US Visitors
YE Nov 2013
Top Nationalities of Foreign Visitors to Los Cabos YE Nov 2013
United States82.8%
Canada12.8%
Other2.8%
United Kingdom: 0.6%Australia: 0.7%India: 0.2%
US visitors to Los Cabos showed a growth of 19% from YE November 2013 over YE November 2012
MexicoDestination
TotalVisitors
1 Cancún 2,548,719
2 Los Cabos 994,197
3 Mexico City 937,510
4 Vallarta Nayarit 551,774
5 Guadalajara 537,402
Other 744,795
Total 6,314,397
The United States is the largest nationality of foreign visitors to Los Cabos
74
Prepared forGAP by
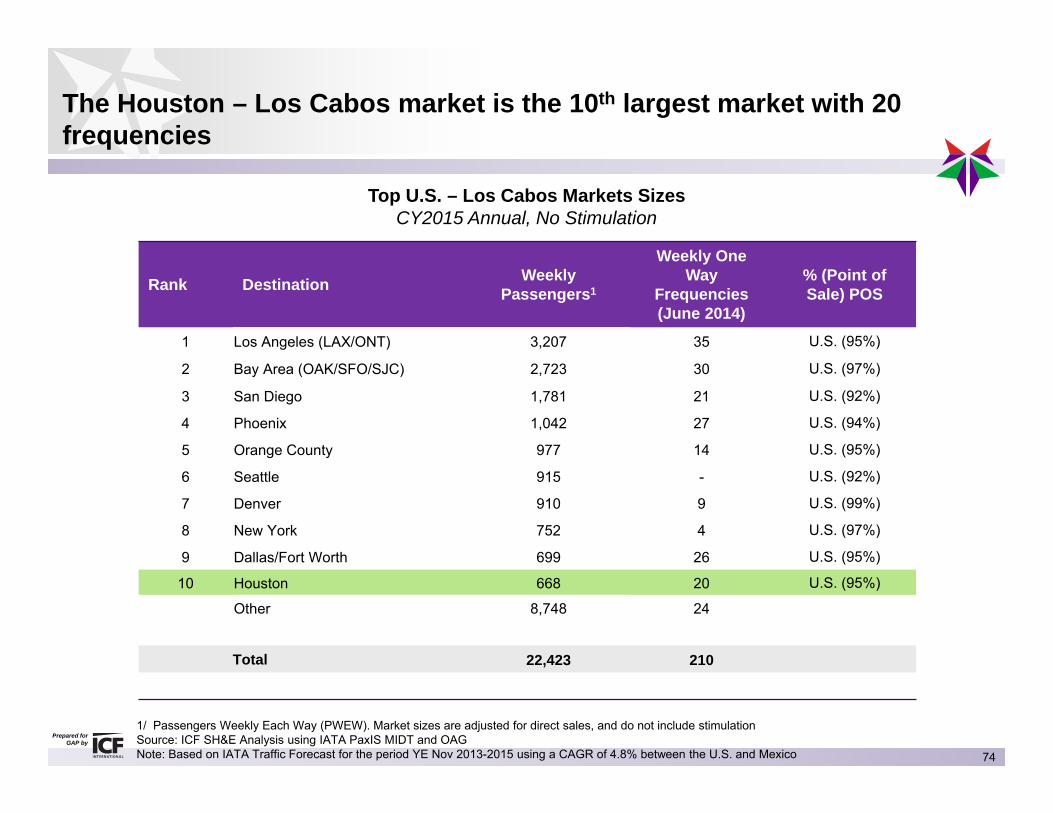
Top U.S. – Los Cabos Markets SizesCY2015 Annual, No Stimulation
Rank Destination Weekly Passengers1
Weekly One Way
Frequencies (June 2014)
% (Point of Sale) POS
1 Los Angeles (LAX/ONT) 3,207 35 U.S. (95%)
2 Bay Area (OAK/SFO/SJC) 2,723 30 U.S. (97%)
3 San Diego 1,781 21 U.S. (92%)
4 Phoenix 1,042 27 U.S. (94%)
5 Orange County 977 14 U.S. (95%)
6 Seattle 915 - U.S. (92%)
7 Denver 910 9 U.S. (99%)
8 New York 752 4 U.S. (97%)
9 Dallas/Fort Worth 699 26 U.S. (95%)
10 Houston 668 20 U.S. (95%)
Other 8,748 24
Total 22,423 210
The Houston – Los Cabos market is the 10th largest market with 20 frequencies
1/ Passengers Weekly Each Way (PWEW). Market sizes are adjusted for direct sales, and do not include stimulationSource: ICF SH&E Analysis using IATA PaxIS MIDT and OAGNote: Based on IATA Traffic Forecast for the period YE Nov 2013-2015 using a CAGR of 4.8% between the U.S. and Mexico

75
Prepared forGAP by
Travel between the Houston and Los Cabos market shows peaks during the winter and summer
Demand Seasonality between Houston and Los Cabos market2010, 2011, 2012 and 2013
% of passengers
Source: IATA PaxIS
0%
2%
4%
6%
8%
10%
12%
Jan Feb Mar Apr May Jun Jul Aug Sep Oct Nov Dec
2010 2011 2012 2013
76
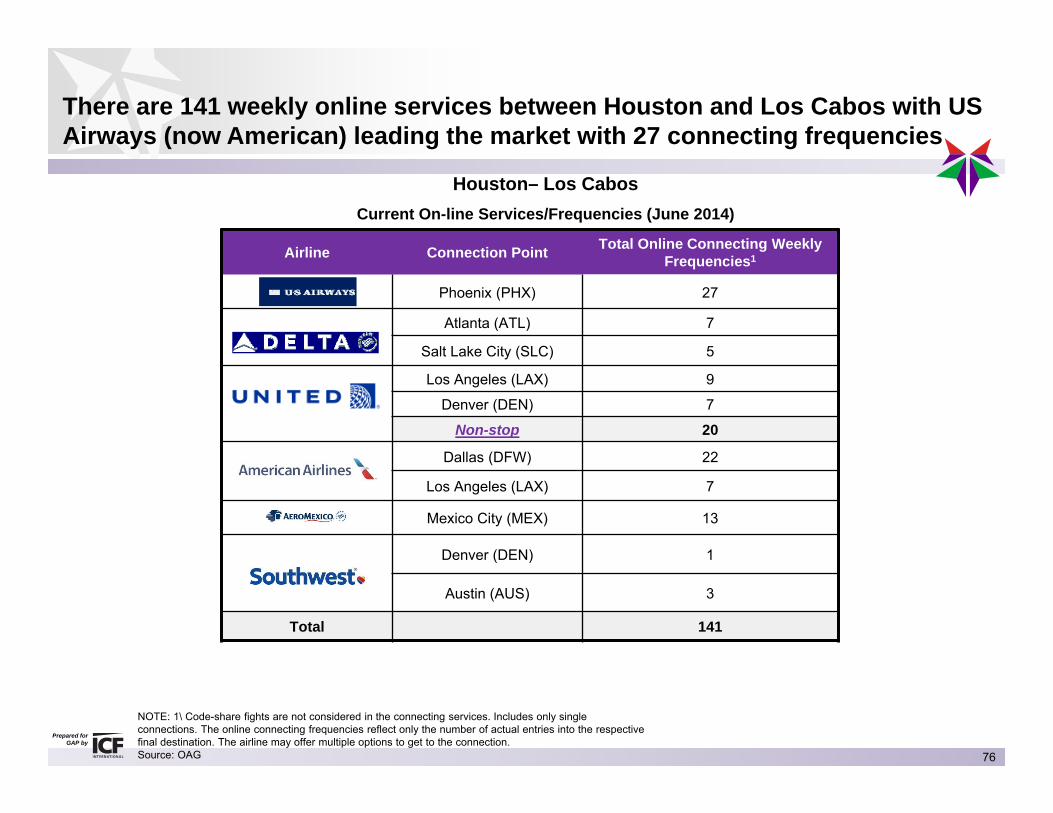
Prepared forGAP by
Airline Connection Point Total Online Connecting Weekly Frequencies1
Phoenix (PHX) 27
Atlanta (ATL) 7
Salt Lake City (SLC) 5
Los Angeles (LAX) 9
Denver (DEN) 7
Non-stop 20
Dallas (DFW) 22
Los Angeles (LAX) 7
Mexico City (MEX) 13
Denver (DEN) 1
Austin (AUS) 3
Total 141
NOTE: 1\ Code-share fights are not considered in the connecting services. Includes only single connections. The online connecting frequencies reflect only the number of actual entries into the respective final destination. The airline may offer multiple options to get to the connection.Source: OAG
Houston– Los CabosCurrent On-line Services/Frequencies (June 2014)
There are 141 weekly online services between Houston and Los Cabos with US Airways (now American) leading the market with 27 connecting frequencies
77
Prepared forGAP by
0
500
1000
1500
2000
2500
3000
0
4
8
12
16
20
24
Traf
fic (P
asse
nger
s w
eekl
y ea
ch w
ay)
Wee
kly
Freq
uenc
ies
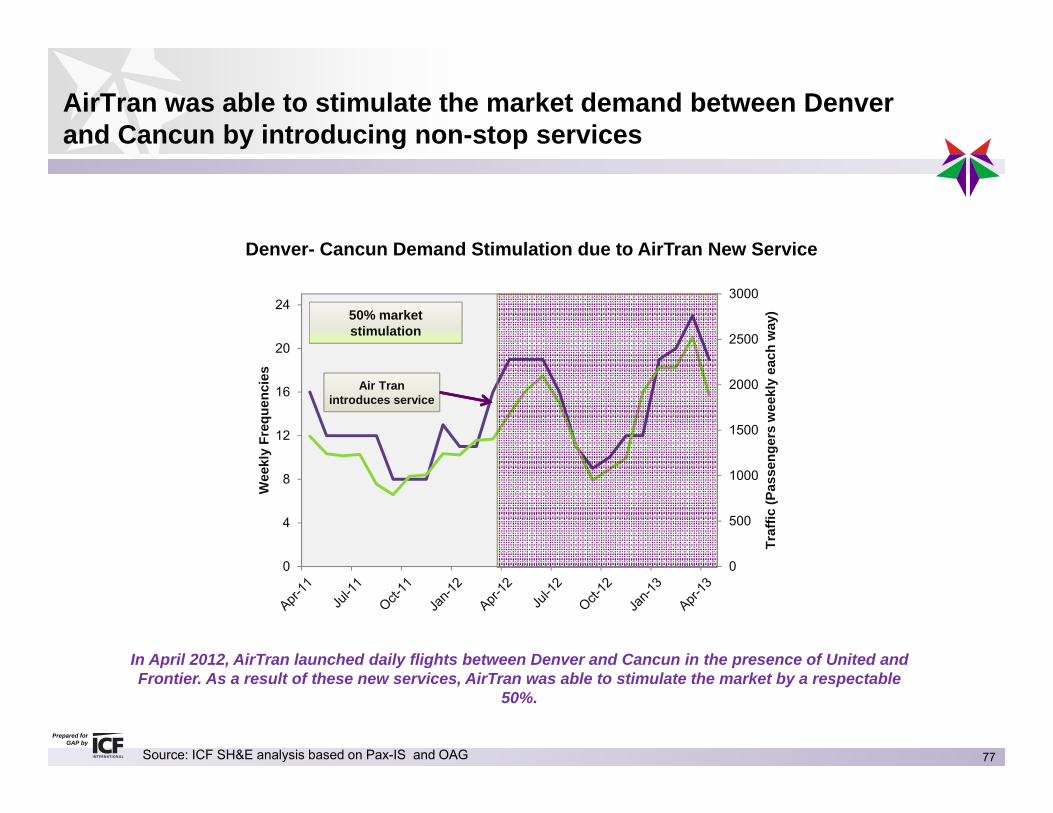
Air Tran introduces service
50% market stimulation
In April 2012, AirTran launched daily flights between Denver and Cancun in the presence of United and Frontier. As a result of these new services, AirTran was able to stimulate the market by a respectable
50%.
Source: ICF SH&E analysis based on Pax-IS and OAG
AirTran was able to stimulate the market demand between Denver and Cancun by introducing non-stop services
Denver- Cancun Demand Stimulation due to AirTran New Service
78
Prepared forGAP by
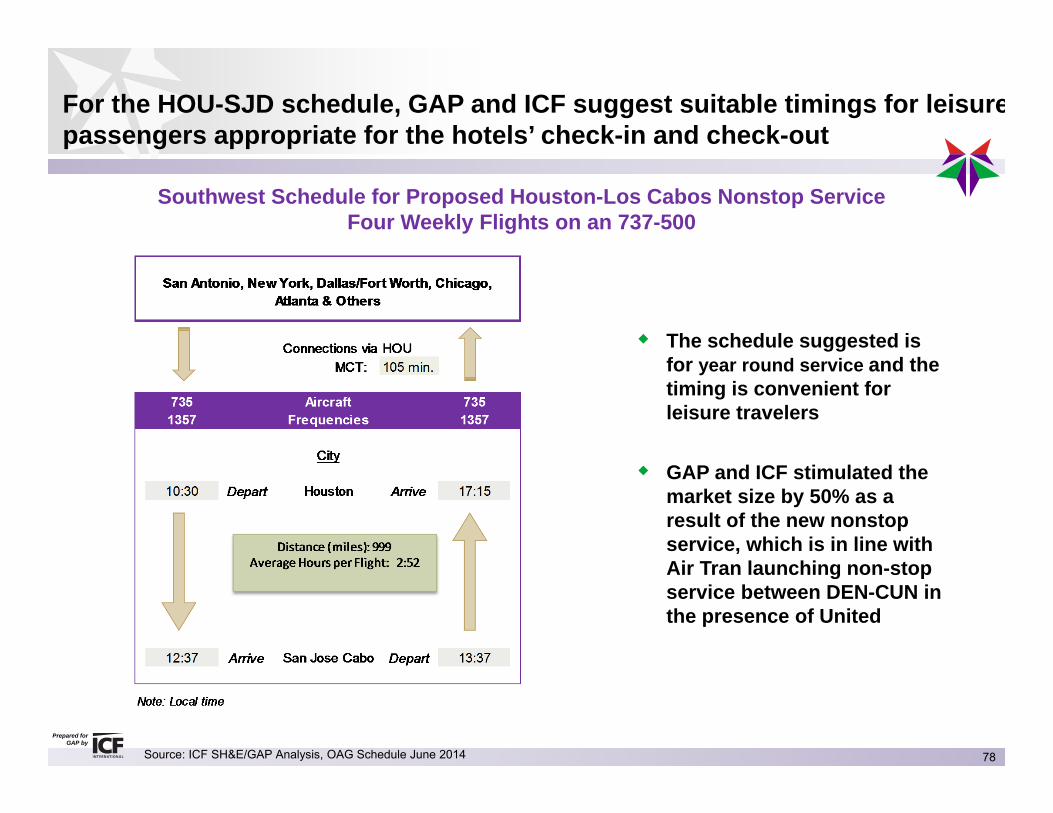
Southwest Schedule for Proposed Houston-Los Cabos Nonstop ServiceFour Weekly Flights on an 737-500
For the HOU-SJD schedule, GAP and ICF suggest suitable timings for leisurepassengers appropriate for the hotels’ check-in and check-out
The schedule suggested is for year round service and the timing is convenient for leisure travelers
GAP and ICF stimulated the market size by 50% as a result of the new nonstop service, which is in line with Air Tran launching non-stop service between DEN-CUN in the presence of United
Source: ICF SH&E/GAP Analysis, OAG Schedule June 2014
79
Prepared forGAP by
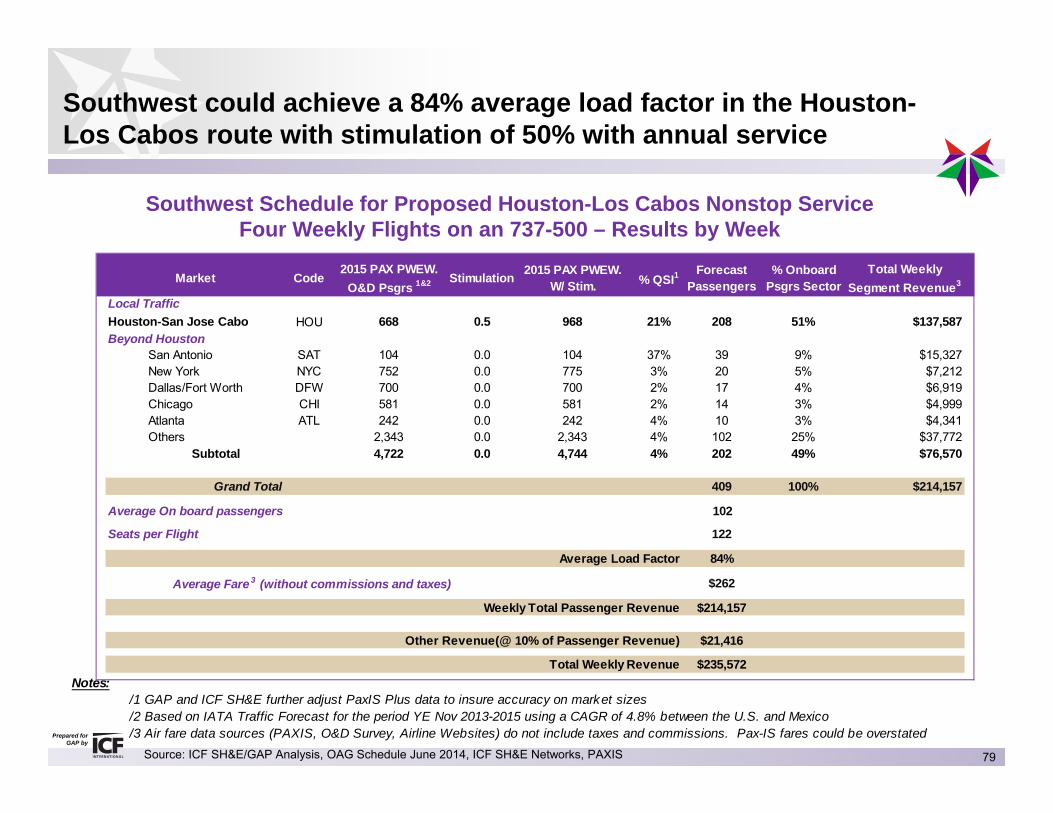
Southwest could achieve a 84% average load factor in the Houston-Los Cabos route with stimulation of 50% with annual service
Southwest Schedule for Proposed Houston-Los Cabos Nonstop ServiceFour Weekly Flights on an 737-500 – Results by Week
Source: ICF SH&E/GAP Analysis, OAG Schedule June 2014, ICF SH&E Networks, PAXIS
Notes:/1 GAP and ICF SH&E further adjust PaxIS Plus data to insure accuracy on market sizes/2 Based on IATA Traffic Forecast for the period YE Nov 2013-2015 using a CAGR of 4.8% between the U.S. and Mexico/3 Air fare data sources (PAXIS, O&D Survey, Airline Websites) do not include taxes and commissions. Pax-IS fares could be overstated
Code2015 PAX PWEW.
O&D Psgrs 1&2 Stimulation 2015 PAX PWEW. W/ Stim. % QSI1
Forecast Passengers
% Onboard Psgrs Sector
Total Weekly Segment Revenue3
HOU 668 0.5 968 21% 208 51% $137,587
SAT 104 0.0 104 37% 39 9% $15,327NYC 752 0.0 775 3% 20 5% $7,212DFW 700 0.0 700 2% 17 4% $6,919CHI 581 0.0 581 2% 14 3% $4,999ATL 242 0.0 242 4% 10 3% $4,341
2,343 0.0 2,343 4% 102 25% $37,7724,722 0.0 4,744 4% 202 49% $76,570
409 100% $214,157
102
122
84%
$262
$214,157
$21,416
$235,572
Grand Total
Total Weekly Revenue
Average On board passengers
Weekly Total Passenger Revenue
Other Revenue(@ 10% of Passenger Revenue)
Average Load Factor
Seats per Flight
Average Fare3 (without commissions and taxes)
Beyond HoustonHouston-San Jose Cabo
AtlantaOthers
Subtotal
Chicago
San AntonioNew YorkDallas/Fort Worth
Local Traffic
Market
Prepared by
Mexican Pacific Airport Group (GAP) Route ProposalsMexican Pacific Airport Group (GAP) Route Proposals
Prepared forGAP by
Incentives and Next Steps

81
Prepared forGAP by
GAP has the relationships and market knowledge to assist Southwest in their evaluation of the proposed destinations
Market Analysis• GAP & ICF airport group are prepared to assist Southwest with all due diligence
required to gain a thorough understanding of the proposed route
Market Analysis• GAP & ICF airport group are prepared to assist Southwest with all due diligence
required to gain a thorough understanding of the proposed route
Visit to Los Cabos• GAP would like to invite the Southwest planners to visit GAP airport facilities
and its touristic locations
Visit to Los Cabos• GAP would like to invite the Southwest planners to visit GAP airport facilities
and its touristic locations
Visit to Southwest’s offices• Alternatively, GAP would be pleased to meet with more Southwest’s staff at
corporate headquarters
Visit to Southwest’s offices• Alternatively, GAP would be pleased to meet with more Southwest’s staff at
corporate headquarters

82
Thank You!
Jared HarckhamVice President, ICF [email protected]
Eric TolerAssociate, ICF [email protected]