Enhanced Oil Recovery by Water Alternating Gas (WAG ... · PDF fileEnhanced Oil Recovery by...
32
Enhanced Oil Recovery by Water Alternating Gas (WAG) Injection: The Opportunity and the Challenge Centre for Enhanced Oil Recovery & CO 2 Solutions Characterisation of Three Phase Flow and Water Alternating Gas (WAG) Injection Studies JIP Institute of Petroleum Engineering, Heriot-Watt University, Edinburgh Scotland, UK Contact: Prof. Mehran Sohrabi Telephone: +44 (0)131 451 3568 Email: [email protected] Sohrabi M., Fatemi M., Ireland S. Presented by: Mobeen Fatemi 06 May 2014
-
Upload
vuongthien -
Category
Documents
-
view
234 -
download
8
Transcript of Enhanced Oil Recovery by Water Alternating Gas (WAG ... · PDF fileEnhanced Oil Recovery by...
Enhanced Oil Recovery by
Water Alternating Gas (WAG)
Injection: The Opportunity and
the Challenge
Centre for Enhanced Oil Recovery & CO2
Solutions
Characterisation of Three Phase Flow and
Water Alternating Gas (WAG) Injection
Studies JIP
Institute of Petroleum Engineering,
Heriot-Watt University, Edinburgh
Scotland, UK
Contact:
Prof. Mehran Sohrabi
Telephone: +44 (0)131 451 3568
Email: [email protected]
Sohrabi M., Fatemi M., Ireland S.
Presented by: Mobeen Fatemi
06 May 2014

North-Sea WAG Injection Potential
Distribution of EOR field applications by method in the North Sea (total of 19
projects). (SPE 99546; 2006)
2
WAG48%
MEOR5%
FAWAG11%
SWAG5%
MGI31%
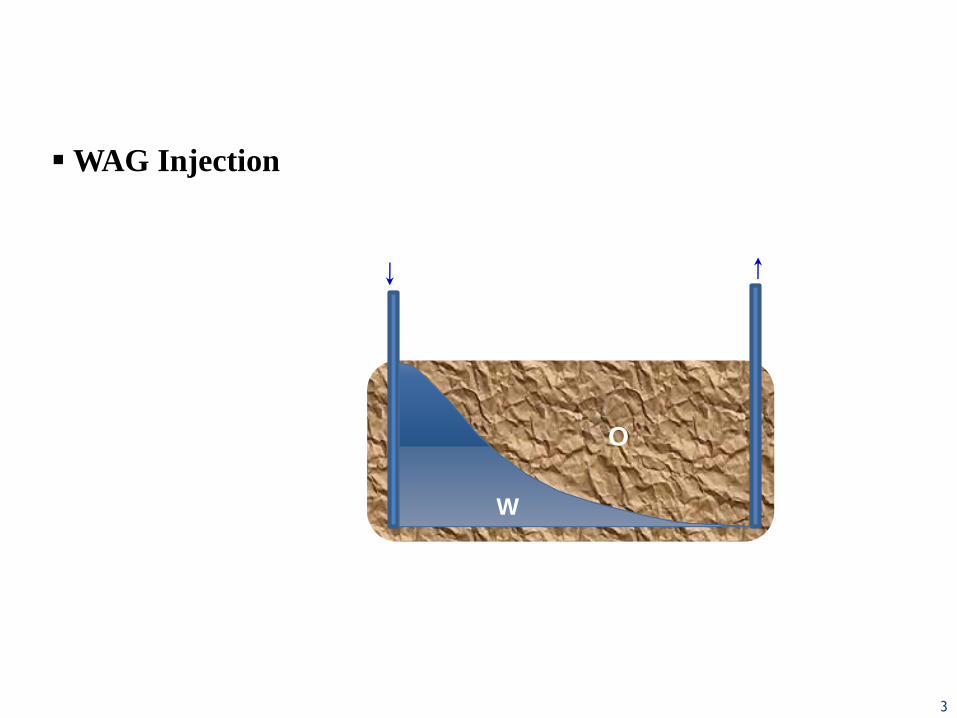
WAG Injection
O
W
3

O
W
G
WAG Injection
4

O
W+ O
G+O
G+W+O
WAG involves major
complexity and
hysteresis, caused by
injection alternation
that happens during
process.
WAG Injection
5

WAG Injection
WAG involves major complexity and hysteresis, caused by
alternating injection that happens during process.Therefore,
numerical simulation of WAG injection becomes extremely
complex (involves the 2-phase and 3-phase Pc and kr and also
their hysteresis behavior).
Our current understanding of the physics (and sometime
chemistry) involved in three-phase flow is currently limited
and hence quantifying and predicting the outcome of these
processes are difficult.
6

7
Measuring 3-phase kr is very difficult and time consuming
hence many correlations have been proposed for calculating
3-phase kr from the more readily available 2-phase data
Note: These models are usually based on water-wet systems and high
IFT gas/oil.
WAG Injection

8
Formulation available in the existing reservoir simulators are
not capable of adequately account for the complex interplay
of hysteresis, capillary pressure, wettability, IFT, trapped
phase saturation and their impact on flow under three-phase
flow regime.
WAG Injection

Water Flood
Gas injection
Alternating slugs of gas and water (WAG)?
Sequence of gas and water injection?
Simultaneous injection of water and gas (SWAG)?
Wettability?
Interfacial Tension (gas type)?
Rock type?
Rock Permeability?
Miscibility?
Trapped phase saturation and hysteresis?
Reliability of Reservoir Performance Prediction
9

06/05/2014 10
06/05/2014 10
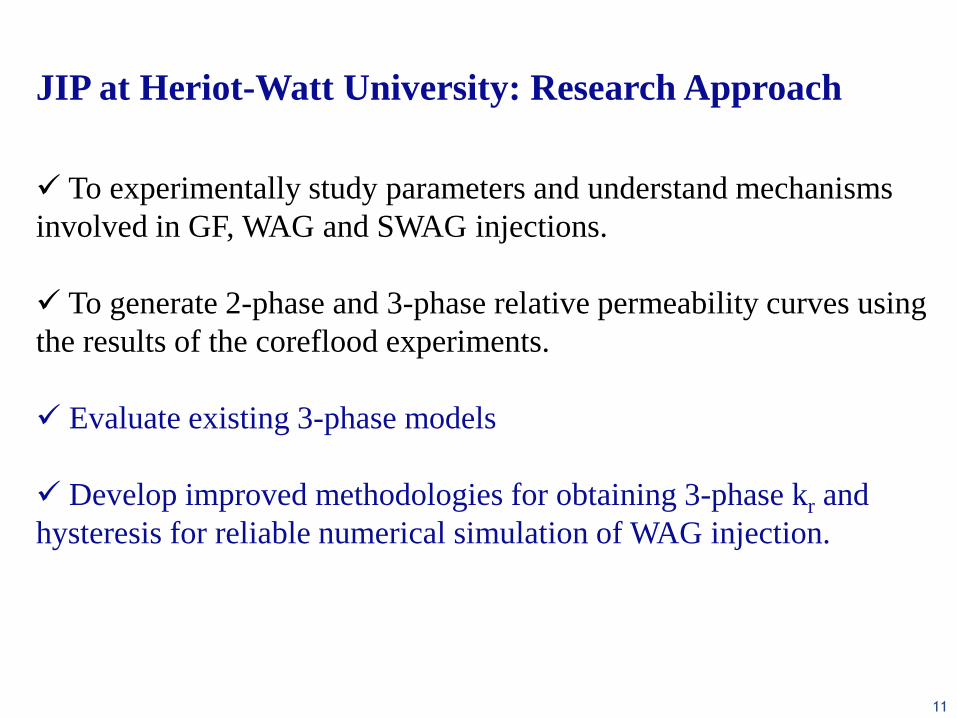
JIP at Heriot-Watt University: Research Approach
To experimentally study parameters and understand mechanisms
involved in GF, WAG and SWAG injections.
To generate 2-phase and 3-phase relative permeability curves using
the results of the coreflood experiments.
Evaluate existing 3-phase models
Develop improved methodologies for obtaining 3-phase kr and
hysteresis for reliable numerical simulation of WAG injection.
11

Experimental Condition
Different injection scenarios WAG, SWAGContinuous GasContinues Water
Different IFT valuesHigh IFT (immiscible)Low IFT (intermediate)Very low IFT (near-miscible)
Different wettability conditionsWater-Wet, Oil-Wet & Mixed-Wet
Different Core SamplesCarbonates, Sandstones
12
13
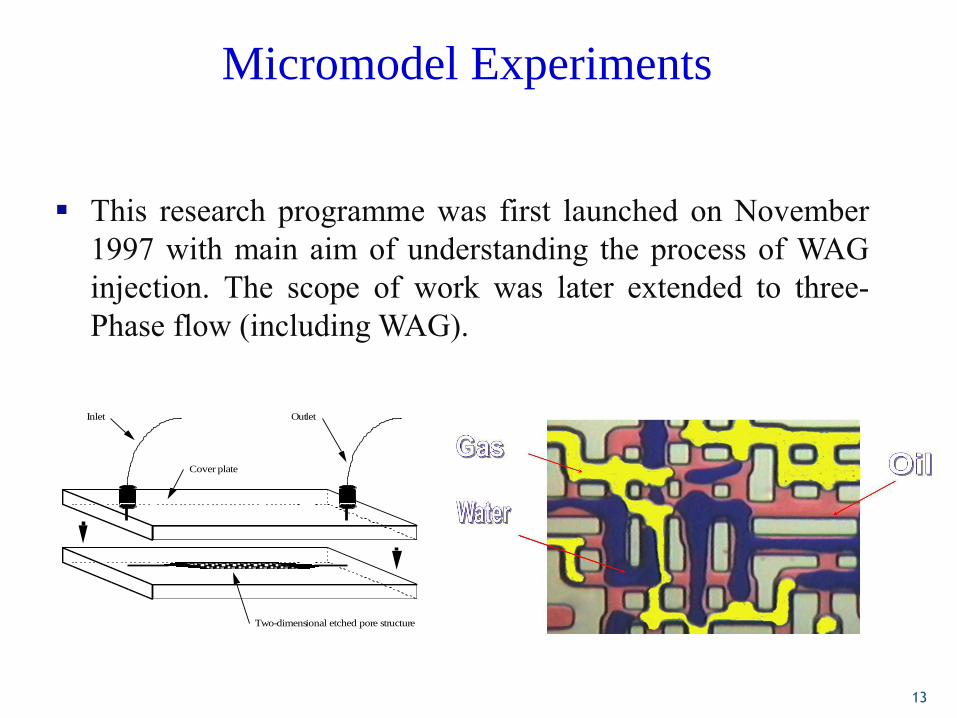
This research programme was first launched on November
1997 with main aim of understanding the process of WAG
injection. The scope of work was later extended to three-
Phase flow (including WAG).
Inlet Outlet
Cover plate
Two-dimensional etched pore structure
Micromodel Experiments
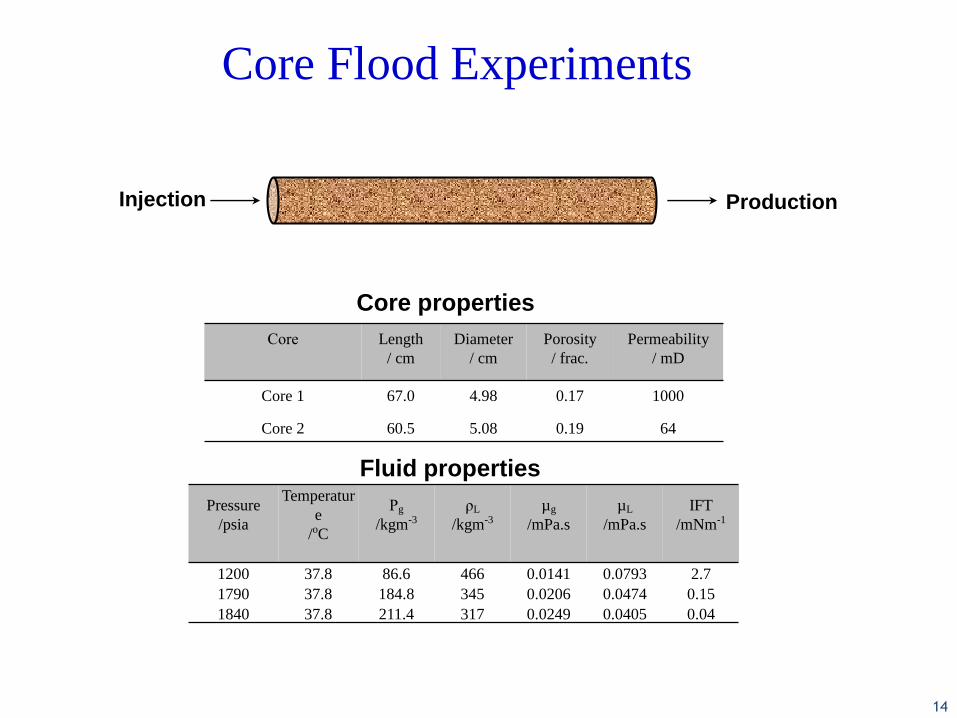
Core Length
/ cm
Diameter
/ cm
Porosity
/ frac.
Permeability
/ mD
Core 1 67.0 4.98 0.17 1000
Core 2 60.5 5.08 0.19 64
Core Flood Experiments
Pressure
/psia
Temperatur
e
/oC
Ρg
/kgm-3
ρL
/kgm-3
µg
/mPa.s
µL
/mPa.s
IFT
/mNm-1
1200 37.8 86.6 466 0.0141 0.0793 2.7
1790 37.8 184.8 345 0.0206 0.0474 0.15
1840 37.8 211.4 317 0.0249 0.0405 0.04
Core properties
Fluid properties
Injection Production
14
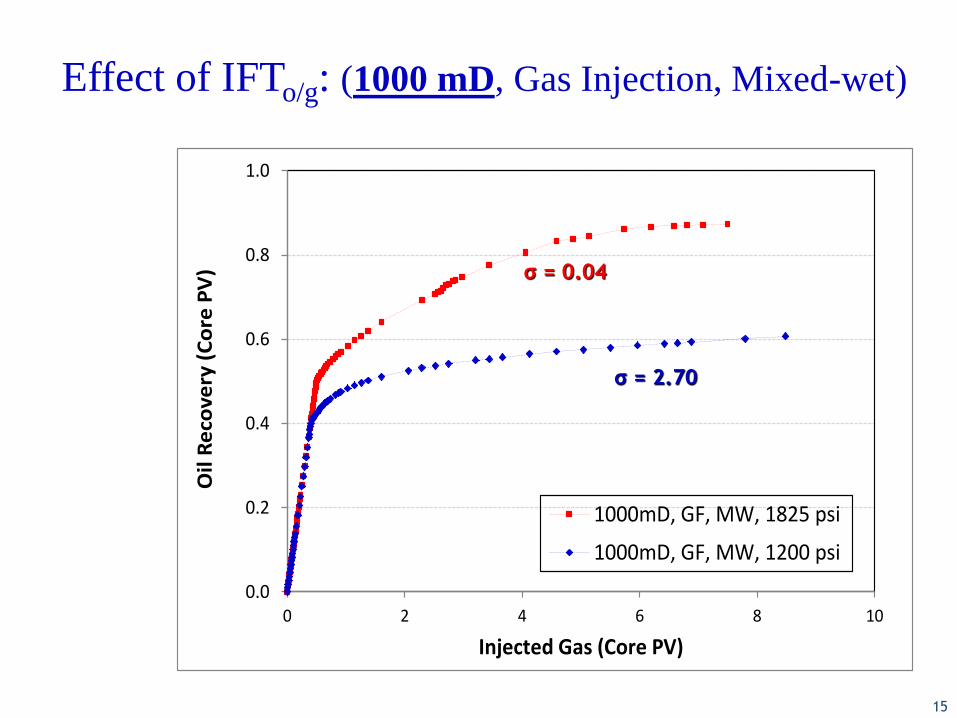
Effect of IFTo/g: (1000 mD, Gas Injection, Mixed-wet)
15
0.0
0.2
0.4
0.6
0.8
1.0
0 2 4 6 8 10
Oil
Re
cove
ry (
Co
re P
V)
Injected Gas (Core PV)
1000mD, GF, MW, 1825 psi
1000mD, GF, MW, 1200 psi
σ = 2.70
σ = 0.04

Effect of IFTo/g: (65 mD, Gas Injection, Mixed-wet)
16
σ = 2.70
σ = 0.04
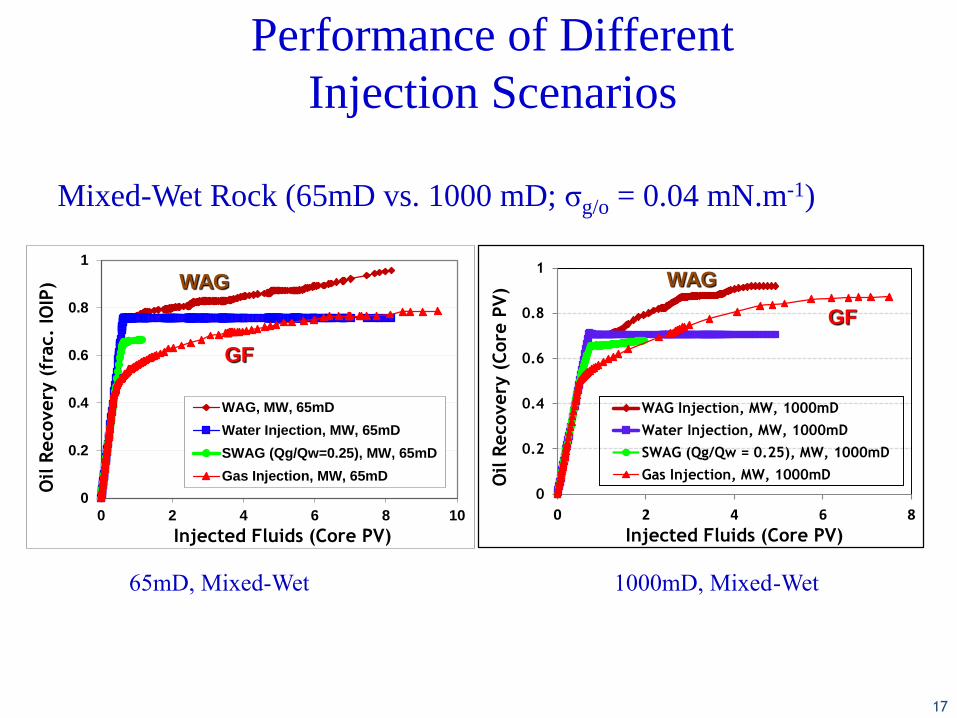
65mD, Mixed-Wet 1000mD, Mixed-Wet
0
0.2
0.4
0.6
0.8
1
0 2 4 6 8 10
Oil R
ecovery
(fr
ac.
IOIP
)
Injected Fluids (Core PV)
WAG, MW, 65mD
Water Injection, MW, 65mD
SWAG (Qg/Qw=0.25), MW, 65mD
Gas Injection, MW, 65mD
0
0.2
0.4
0.6
0.8
1
0 2 4 6 8O
il R
ecovery
(C
ore
PV
)
Injected Fluids (Core PV)
WAG Injection, MW, 1000mD
Water Injection, MW, 1000mD
SWAG (Qg/Qw = 0.25), MW, 1000mD
Gas Injection, MW, 1000mD
Mixed-Wet Rock (65mD vs. 1000 mD; σg/o = 0.04 mN.m-1)
Performance of Different
Injection Scenarios
WAG WAG
GF
GF
17

65mD, Mixed-Wet 1000mD, Mixed-Wet
0
20
40
60
80
100
0 2 4 6 8 10
Pre
ssure
Dro
p (
psi
)
Injected Fluids (Core PV)
SWAG (Qg/Qw=1), MW, 65mD
WAG, 65mD, MW, IDIDID
Water Injection, MW, 65mD
Gas Injection, MW, 65mD
0
5
10
15
20
25
0 2 4 6 8Pre
ssure
Dro
p (
psi
)
Injected Fluids (Core PV)
SWAG, MW, 1000mD
WAG, MW, 1000mD
Water Injection, MW, 1000mD
Gas Injection, MW, 1000mD
Mixed-Wet Rock (65mD Vs. 1000 mD; σg/o = 0.04 mN.m-1)
Effect of Injection Scenario on
Injectivity
18

19
G OW G WG WSw,im=18% , Soi=82%
W G
65 mD
WAG-IDIDIDID
Mixed-wet
0
0.1
0.2
0.3
0.4
0.5
0.6
0.7
0.8
0.9
0 2.5 5 7.5 10 12.5
Prod
uced
Oil
(fra
c. S
orw
)
Injected WAG (Core PV)
WAG-IDIDIDID, 65mD, MW, 1840 psia
WAG-IDIDIDID, 65mD, MW, 1790 psia
WAG-IDIDIDID, 65mD, MW, 1215 psia
σ = 2.70
σ = 0.04
σ = 0.15
Effect of Gas/Oil IFT on WAG

20
W1
W2
W3
W1
W3
W2
σ = 2.70σ = 0.04
0.1
1
10
100
0 0.5 1 1.5 2 2.5 3
Inje
ctiv
ity
(cc/
psi
)
Injected Brine (Core PV)
W1
W2
W3
W1
W2
W3
σ = 0.15
Effect of IFTOil/Gas on Injectivity

21
One of the major achievements of this research is a
growing set of core flood data covering a wide range
of pertinent parameters (IFT, Wettability, Hysteresis,
K, Rock Type, etc) investigating various injection
strategies.
As far as we know, no such comprehensive data is
available in published literature.
A unique set experimental data

22
Measuring 3-phase kr is very difficult and time
consuming hence many correlations have been
proposed for calculating 3-phase kr from the more
readily available 2-phase data.
+
0.0
0.0
0.2
0.4
0.6
0.8
1.0
0.0
0.2
0.4
0.6
0.8
1.0
k r
1.00.80.60.40.2
k rog
k rg
0.0
0.0
0.2
0.4
0.6
0.8
1.0
0.0
0.2
0.4
0.6
0.8
1.0
1.00.80.60.40.2
k row
k rw
2Ph Oil & Gas 2Ph Oil & Water 3Ph Oil k r
So
Sg=1
Sw
k ro0.01
0.80
Use 2Ph k rg in 3Ph
and 2Ph k rw in 3Ph
SwSg SwSg
Three-phase kr Determination
22

23
Fluid injection
Unsteady state 2-phase test
2-phase kr
Simulation of WAG
test using 3-phase kr
models
Swir =18%, k=65 mD
WAG experiment
Fluid injection Swir =18%, k=65 mD
Comparing experiment and simulation results e.g.
recovery and pressure representing the accuracy
of that particular 3-phase kr model.
Evaluation of 3-phase kr Modells
23

0
0.02
0.04
0.06
0.08
0.1
0.12
0.14
0.16
0.18
0.2
0 2 4 6 8
PVinj
Oil
Reco
very
, P
V
EXPERIMENT
0
0.02
0.04
0.06
0.08
0.1
0.12
0.14
0.16
0.18
0.2
0 2 4 6 8
PVinj
Oil
Reco
very
, P
V
EXPERIMENT
BAKER2
0
0.02
0.04
0.06
0.08
0.1
0.12
0.14
0.16
0.18
0.2
0 2 4 6 8
PVinj
Oil
Reco
very
, P
V
EXPERIMENT
SWI
BAKER2
0
0.02
0.04
0.06
0.08
0.1
0.12
0.14
0.16
0.18
0.2
0 2 4 6 8
PVinj
Oil
Reco
very
, P
V
EXPERIMENT
STONE2
SWI
BAKER2
0
0.02
0.04
0.06
0.08
0.1
0.12
0.14
0.16
0.18
0.2
0 2 4 6 8
PVinj
Oil
Reco
very
, P
V
EXPERIMENT
STONE2
SWI
BAKER1
BAKER2
0
0.02
0.04
0.06
0.08
0.1
0.12
0.14
0.16
0.18
0.2
0 2 4 6 8
PVinj
Oil
Reco
very
, P
V
EXPERIMENT
STONE1
STONE2
SWI
BAKER1
BAKER2
0
0.02
0.04
0.06
0.08
0.1
0.12
0.14
0.16
0.18
0.2
0 2 4 6 8
PVinj
Oil
Reco
very
, P
V
EXPERIMENT
STONE1
STONE2
SWI
BAKER1
BAKER2
LARSEN
0
0.02
0.04
0.06
0.08
0.1
0.12
0.14
0.16
0.18
0.2
0 2 4 6 8
PVinj
Oil
Reco
very
, P
V
EXPERIMENT
STONE1
STONE2
SWI
BAKER1
BAKER2
LARSEN
STONE-EXPONENT
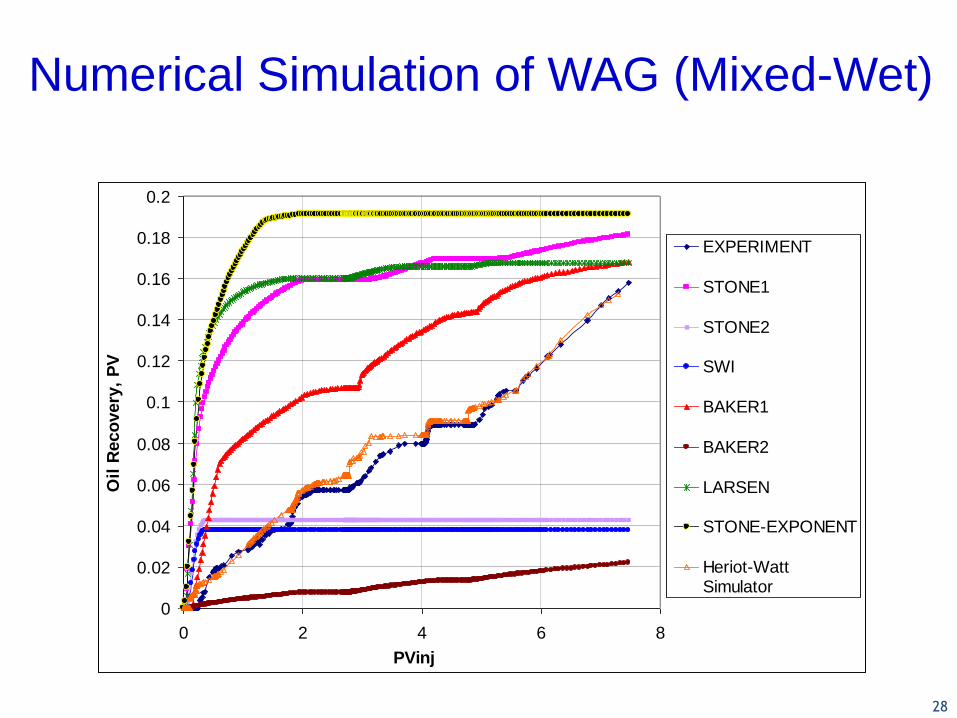
Numerical Simulation of WAG (Mixed-Wet)
24

25
Existing three-phase kr models lead to large errors
in prediction of WAG performance.
What is the actual 3-phase kr during WAG
?
25

26
Another major achievement of the project is development
of a software for obtaining three-phase kr and Pc.
3-phase kr can be obtained directly instead of indirectly from
2-phase.
kro =kro (Sw, Sg)
krw =krw (So, Sg)
krg =krg (Sw, So)
Gas
Oil
Water
OilWater Gas
Direct 3-phase kr - 3RPSim
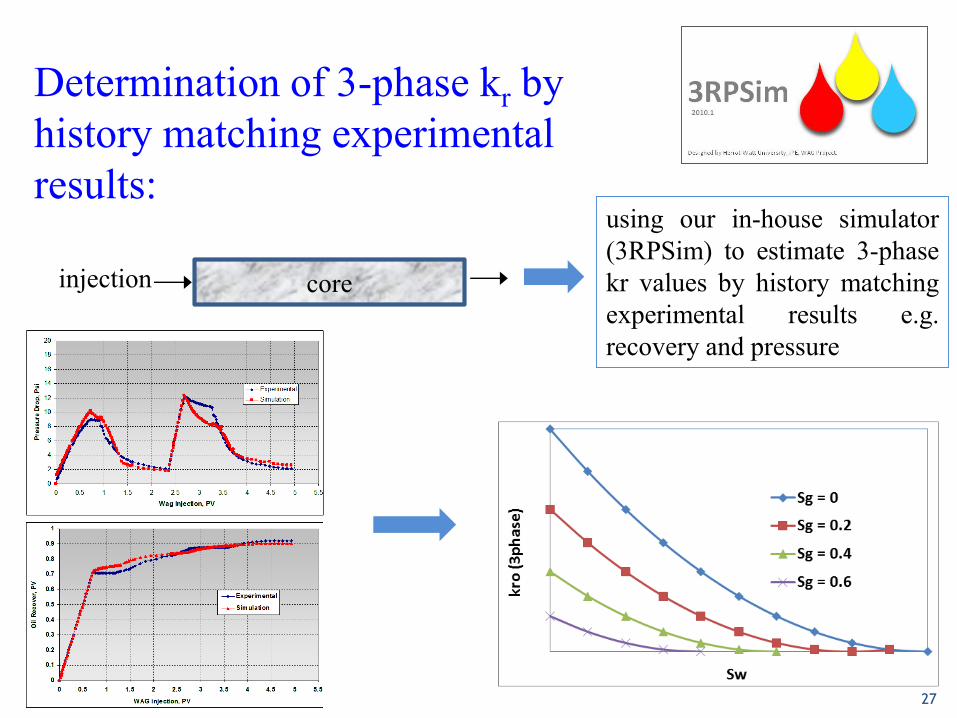
27
injection core
using our in-house simulator
(3RPSim) to estimate 3-phase
kr values by history matching
experimental results e.g.
recovery and pressure
Determination of 3-phase kr by
history matching experimental
results:
0
0.02
0.04
0.06
0.08
0.1
0.12
0.14
0.16
0.18
0.2
0 2 4 6 8
PVinj
Oil
Reco
very
, P
V
EXPERIMENT
0
0.02
0.04
0.06
0.08
0.1
0.12
0.14
0.16
0.18
0.2
0 2 4 6 8
PVinj
Oil
Reco
very
, P
V
EXPERIMENT
BAKER2
0
0.02
0.04
0.06
0.08
0.1
0.12
0.14
0.16
0.18
0.2
0 2 4 6 8
PVinj
Oil
Reco
very
, P
V
EXPERIMENT
SWI
BAKER2
0
0.02
0.04
0.06
0.08
0.1
0.12
0.14
0.16
0.18
0.2
0 2 4 6 8
PVinj
Oil
Reco
very
, P
V
EXPERIMENT
STONE2
SWI
BAKER2
0
0.02
0.04
0.06
0.08
0.1
0.12
0.14
0.16
0.18
0.2
0 2 4 6 8
PVinj
Oil
Reco
very
, P
V
EXPERIMENT
STONE2
SWI
BAKER1
BAKER2
0
0.02
0.04
0.06
0.08
0.1
0.12
0.14
0.16
0.18
0.2
0 2 4 6 8
PVinj
Oil
Reco
very
, P
V
EXPERIMENT
STONE1
STONE2
SWI
BAKER1
BAKER2
0
0.02
0.04
0.06
0.08
0.1
0.12
0.14
0.16
0.18
0.2
0 2 4 6 8
PVinj
Oil
Reco
very
, P
V
EXPERIMENT
STONE1
STONE2
SWI
BAKER1
BAKER2
LARSEN
0
0.02
0.04
0.06
0.08
0.1
0.12
0.14
0.16
0.18
0.2
0 2 4 6 8
PVinj
Oil
Reco
very
, P
V
EXPERIMENT
STONE1
STONE2
SWI
BAKER1
BAKER2
LARSEN
STONE-EXPONENT
0
0.02
0.04
0.06
0.08
0.1
0.12
0.14
0.16
0.18
0.2
0 2 4 6 8
PVinj
Oil
Reco
very
, P
V
EXPERIMENT
STONE1
STONE2
SWI
BAKER1
BAKER2
LARSEN
STONE-EXPONENT
Heriot-WattSimulator
Numerical Simulation of WAG (Mixed-Wet)
28

New Hysteresis model
Required two-phase data for running this model1. Oil/water : krow2. Oil/gas : krog3. Gas/water : krgw, krwg
three-phase pore occupancy
Saturation function
accounting cyclic
Hyst
Two-phase kr
3Ph
ri rij rjk rik rkjk f k k k k (1 )(1 )
i
j k
Sf
S S
SPE #152218. Three-Phase Relative Permeabilityand Hysteresis Model for Simulation of WaterAlternating Gas (WAG) Injection. MehranSohrabi 29

Three-Phase Flow JIP at Heriot-Watt University
Micromodel Experiment Core-flood Experiment
Mechanisms of Flow Mechanisms of FlowExamining different
injection Scenario
Generating kr and Pc
data
Analyse experimental
data
Evaluate capability of existing simulators and models
Three-Phase kr Three-Phase Pc Hysteresis IFT scalingTrapped
saturationViscous
fingering
Modelling
New improved mathematical
model for calculating flow
parameters (kr , Pc , trap
phase, hysteresis..)
High quality measured data
for different rock and fluid
conditions (kr & Pc)
methodologies to correct the SCAL
data due to experimental artefact
(viscous fingering, end-Effects)
In-house Software
(3RPSim)
Deliverable
30

Project’s Sponsors
31

32