Engineering seismological studies in and around Zagazig ... · (SeisImager/SW Manual, 2006). ......
11
Engineering seismological studies in and around Zagazig city, Sharkia, Egypt M. El-Eraki a , A.A. Mohamed b , A.A. El-Kenawy a , M.S. Toni b , I.M. Shimaa a, * a Zagazig University, Faculty of Science, Geology Department, Zagazig, Egypt b National Research Institute of Astronomy and Geophysics (NRIAG), Helwan, Egypt Received 1 July 2012; accepted 10 December 2012 Available online 24 January 2013 KEYWORDS Ambient vibrations; Surface waves; Fundamental frequency Abstract The aim of this paper is to study the ground vibrations using Nakamura technique to evaluate the relation between the ground conditions and the earthquake characteristics. Microtre- mor measurements were carried out at 55 sites in and around Zagazig city. The signals were pro- cessed using horizontal to vertical spectral ratio (HVSR) technique to estimate the fundamental frequencies of the soil deposits and its corresponding H/V amplitude. Seismic measurements were acquired at nine sites for recording the surface waves. The recorded waveforms were processed using the multi-channel analysis of surface waves (MASW) method to infer the shear wave velocity profile. The obtained fundamental frequencies were found to be ranging from 0.7 to 1.7 Hz and the maximum H/V amplitude reached 6.4. These results together with the average shear wave velocity in the surface layers were used for the estimation of the thickness of the upper most soft cover layers (depth to bedrock). The sediment thickness generally increases at the northeastern and southwest- ern parts of the area which is in good agreement with the local geological structure. The results of this work showed the zones of higher potential damage in the event of an earthquake in the study area. ª 2013 Production and hosting by Elsevier B.V. on behalf of National Research Institute of Astronomy and Geophysics. Introduction Zagazig city is the capital of El Sharkia governorate and situ- ated on the Nile Delta in the midst of a fertile district. It is lo- cated on the Muweis Canal and presents a promising area for both agricultural expansion and urban development. The importance of Zagazig city is referred to its high density of population, urbanization, and its archaeological sites as the ruins of Bubastis which located 3 km southeast of the town. The study area (Fig. 1) is located between latitudes 30°32 0 45 00 and 30°38 0 24 00 N and longitudes 31°25 0 26 00 and 31°33 0 36 00 E. It is well known and widely accepted that site effects play an important role in characterizing seismic ground motions be- cause they may strongly amplify seismic motions within the uppermost layer of the ground (Abd El-Aal, 2008, 2010a,b). The ground shaking site effect caused by an earthquake can vary significantly even within a small distance. This is because at sites having soft sediments or topographic undulation, the ground motion is amplified as the seismic energy gets trapped * Corresponding author. Tel.: +20 2 25560645. E-mail address: [email protected] (I.M. Shimaa). Peer review under responsibility of National Research Institute of Astronomy and Geophysics. Production and hosting by Elsevier NRIAG Journal of Astronomy and Geophysics (2012) 1, 141–151 National Research Institute of Astronomy and Geophysics NRIAG Journal of Astronomy and Geophysics www.elsevier.com/locate/nrjag 2090-9977 ª 2013 Production and hosting by Elsevier B.V. on behalf of National Research Institute of Astronomy and Geophysics. http://dx.doi.org/10.1016/j.nrjag.2012.12.009
Transcript of Engineering seismological studies in and around Zagazig ... · (SeisImager/SW Manual, 2006). ......
NRIAG Journal of Astronomy and Geophysics (2012) 1, 141–151
National Research Institute of Astronomy and Geophysics
NRIAG Journal of Astronomy and Geophysics
www.elsevier.com/locate/nrjag
Engineering seismological studies in and around
Zagazig city, Sharkia, Egypt
M. El-Erakia, A.A. Mohamed
b, A.A. El-Kenawy
a, M.S. Toni
b, I.M. Shimaa
a,*
a Zagazig University, Faculty of Science, Geology Department, Zagazig, Egyptb National Research Institute of Astronomy and Geophysics (NRIAG), Helwan, Egypt
Received 1 July 2012; accepted 10 December 2012
Available online 24 January 2013
*
E
Pe
A
20
ht
KEYWORDS
Ambient vibrations;
Surface waves;
Fundamental frequency
Corresponding author. Tel.-mail address: High_Dam83
er review under responsibil
stronomy and Geophysics.
Production an
90-9977 ª 2013 Production
tp://dx.doi.org/10.1016/j.nrja
: +20 2@yahoo
ity of N
d hostin
and hosti
g.2012.12
Abstract The aim of this paper is to study the ground vibrations using Nakamura technique to
evaluate the relation between the ground conditions and the earthquake characteristics. Microtre-
mor measurements were carried out at 55 sites in and around Zagazig city. The signals were pro-
cessed using horizontal to vertical spectral ratio (HVSR) technique to estimate the fundamental
frequencies of the soil deposits and its corresponding H/V amplitude. Seismic measurements were
acquired at nine sites for recording the surface waves. The recorded waveforms were processed
using the multi-channel analysis of surface waves (MASW) method to infer the shear wave velocity
profile. The obtained fundamental frequencies were found to be ranging from 0.7 to 1.7 Hz and the
maximum H/V amplitude reached 6.4. These results together with the average shear wave velocity
in the surface layers were used for the estimation of the thickness of the upper most soft cover layers
(depth to bedrock). The sediment thickness generally increases at the northeastern and southwest-
ern parts of the area which is in good agreement with the local geological structure. The results of
this work showed the zones of higher potential damage in the event of an earthquake in the study
area.ª 2013 Production and hosting by Elsevier B.V. on behalf of National Research Institute of Astronomy
and Geophysics.
Introduction
Zagazig city is the capital of El Sharkia governorate and situ-
ated on the Nile Delta in the midst of a fertile district. It is lo-cated on the Muweis Canal and presents a promising area for
25560645..com (I.M. Shimaa).
ational Research Institute of
g by Elsevier
ng by Elsevier B.V. on behalf of N
.009
both agricultural expansion and urban development. Theimportance of Zagazig city is referred to its high density of
population, urbanization, and its archaeological sites as theruins of Bubastis which located 3 km southeast of the town.The study area (Fig. 1) is located between latitudes 30�3204500and 30�3802400N and longitudes 31�2502600 and 31�3303600E.
It is well known and widely accepted that site effects play animportant role in characterizing seismic ground motions be-cause they may strongly amplify seismic motions within the
uppermost layer of the ground (Abd El-Aal, 2008, 2010a,b).The ground shaking site effect caused by an earthquake canvary significantly even within a small distance. This is because
at sites having soft sediments or topographic undulation, theground motion is amplified as the seismic energy gets trapped
ational Research Institute of Astronomy and Geophysics.

Fig. 1 Location map of the study area.
142 M. El-Eraki et al.
due to the impedance contrast between sediments and theunderlying bedrock leading to a resonance patterns (Lacave
et al., 1999). Theoretical analysis and observational data haveshown that each site has a specific resonance frequency atwhich ground motion gets amplified (Bard, 2000). Manmadestructures having resonance frequency matching that of the
site have the maximum likelihood of getting damaged. There-fore, studying of site response of the study area is important inurban planning and construction of the seismically-safe
structures.The surface of the earth is always in motion at seismic fre-
quencies, even without earthquakes. These constant vibrations
called microtremors and characterized by very small ampli-tude. Generally, these ambient vibrations are generated by nat-ural disturbances such as wind, rain and ocean waves and by
human activities such as people walking, motor cars andmovement of machinery in factories (Okada, 1997). The hori-zontal to vertical (H/V) spectral ratio method, also called theNakamura technique (Nakamura, 1989) is characterized by
its simplicity, low-cost both for survey and analysis and mini-mal disturbances to the other activities especially in the inhab-itant areas. The H/V technique is effective in estimating the
fundamental frequency of soil deposits while it gives the lowerbound estimate of the H/V amplitude of ground vibration.
Surface wave measurements were carried out in the area of
study as it has a great potential for site characterization. Sur-face waves were generated by the active source means that seis-mic energy is intentionally generated at a specific locationrelative to the geophone spread and recording begins when
the source energy is imparted into the ground. Surface waveenergy decays exponentially with depth beneath the surface.Longer wavelength (longer period and lower frequency) sur-
face waves travel deeper and thus give more information aboutdeeper velocity structure. Shorter wavelength (shorter periodand higher frequency) surface waves travel shallower and thus
give more information about shallower velocity structure(SeisImager/SW� Manual, 2006). The surface waves were
processed using the 1-D multi-channel analysis of surfacewaves (MASW) method to infer the shear wave velocity profile
through two main steps; the first is the calculation of the dis-persion curves, the second is the inversion of the dispersioncurves to a shear wave velocity profile. The shear wave velocityis very important in studying the vibration characteristics of
subsurface layers which are important for the earthquakesresistant structure design (Kanai, 1983). The results of averageshear wave velocity together with the microtremor results were
used for estimating the thickness of sediments overlying thebedrock.
Geology
The eastern part of the Nile Delta is characterized by low reliefand its surface slopes gently towards the north direction and
take a rolled shape towards the south direction where the landrises up to a moderately elevated plateau with elevation rangesbetween 5 and 100 m (Bayoumy, 1971; Abd El Gawad, 1997).
El Sharkia governorate (Fig. 2) is mainly composed of Nilesilt, Neonile deposits, Pre-Nile deposits, stabilized dunes, sab-kha deposits and marsh, silt, clay and evaporates (GPC andCONOCO, 1987). Based on information from boreholes
drilled in Zagazig city by Sharkia Portable Water and Sanita-tion Co. and gathered from the educational buildings author-ity (drilled by Faculty of Engineering, Cairo University and
Faculty of Petroleum Engineering, Suez Canal University),the study area consists of two layers: clay and thick depositsof sands graded from very fine to coarse grained sand with
clayey and shale intercalations at some depths. El Sharkia gov-ernorate geomorphologically has its own bearing groundwaterresources, reservoirs and discharging drainage canals.
The stratigraphic succession of El Sharkia governorate isranging in age from Tertiary to Quaternary and has a thick-ness of more than 500 m with Mid-Tertiary basaltic flows.The Quaternary deposits cover most of the governorate
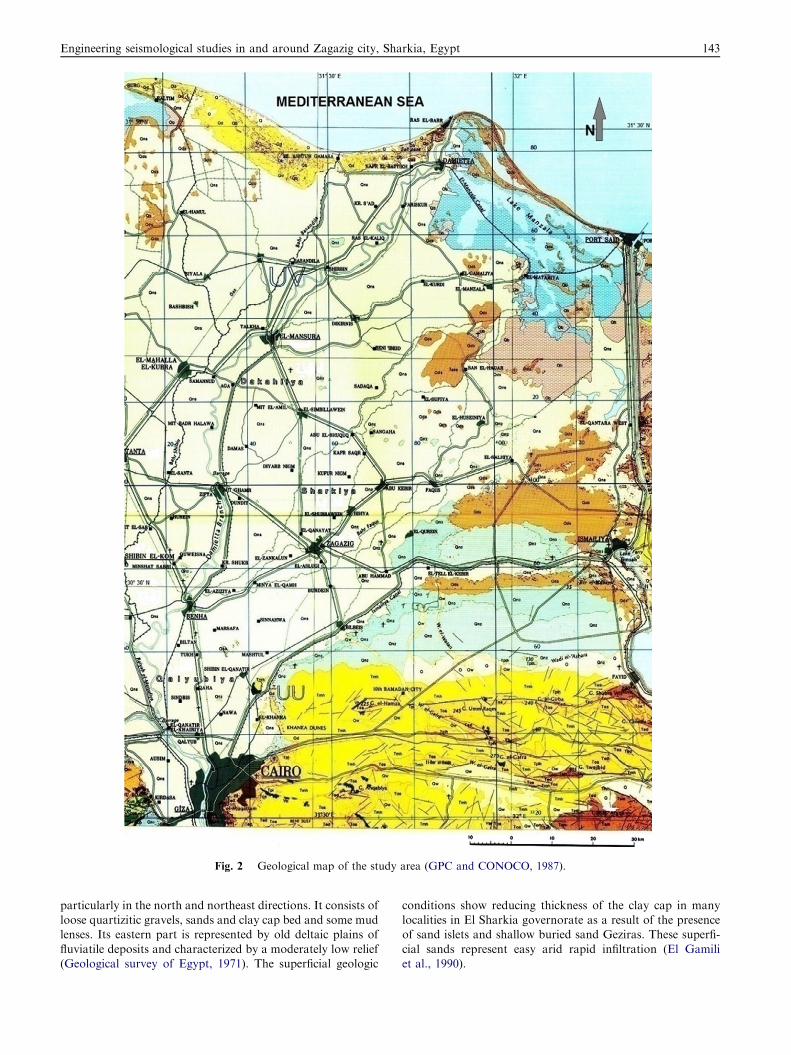
Fig. 2 Geological map of the study area (GPC and CONOCO, 1987).
Engineering seismological studies in and around Zagazig city, Sharkia, Egypt 143
particularly in the north and northeast directions. It consists ofloose quartizitic gravels, sands and clay cap bed and some mudlenses. Its eastern part is represented by old deltaic plains of
fluviatile deposits and characterized by a moderately low relief(Geological survey of Egypt, 1971). The superficial geologic
conditions show reducing thickness of the clay cap in manylocalities in El Sharkia governorate as a result of the presenceof sand islets and shallow buried sand Geziras. These superfi-
cial sands represent easy arid rapid infiltration (El Gamiliet al., 1990).

Fig. 2 (continued)
144 M. El-Eraki et al.
The subsurface Tertiary rocks are divided from bottom to
top into: Oligocene rocks, Miocene rocks and Pliocene rocks.The subsurface Miocene rocks are subdivided from down totop into Sidi Salem, Qawasim and Rosetta formations. Whilethe Pliocene rock units are subdivided from bottom to top into
Abu Madi, Kafr EI Sheikh and Wastani formations (Schlum-berger, 1984).
Seismicity
The seismicity of the study area is related to the interaction be-tween the African, Arabian and Eurasian plates and Sinai sub-
plate. The area was affected by earthquakes both historical(e.g. 2200 BC, Sharkia province earthquake with maximumintensity VII near Tell Basta and Abu Hammad) and instru-
mental (e.g. 29 April, 1974, Abu-Hammad earthquake withmagnitude = 4.9). Zagazig city is located in a moderately ac-tive seismic area and is affected by six active seismogenic zones
which have different levels of seismic activity as follows:
(1) Abu Zabal Zone, where the epicenter of 28 December,1999 earthquake and its aftershocks were occurred.
The epicentral area was affected by three normal faultstrending in the E–W, NW–SE, and NE–SW directions.The structure in the Abu Zabal area was created by ten-
sional stresses (Abd El-Aal, 2010b).(2) South-West Cairo Zone (Dahshour zone), where the epi-
central area of the 12 October, 1992 earthquake
(Mw = 5.8) took place. This zone is affected by two faultstrending in E–W andNW–SE directions (Meshref, 1990).
(3) Cairo-Suez District Zone (CSD) which is characterized
by moderate seismic activity. The focal mechanism solu-tion for the 29 April, 1974, Abu Hammed earthquakegave two fault planes trending in ENE–WSW and
NNW–SSE directions with left lateral strike slip motionalong the second plane (Mousa, 1989; Hassib, 1990).
(4) Gulf of Suez Zone, the structure of the Gulf of Suez rift
is dominated by normal faults linked by transverseactive faults have N–S and NNE–SSW trends (Colletaet al., 1988). The southern end of the Gulf is character-
ized by relatively high seismic activity due to tensilestresses resulting from the crustal movements amongthe Arabian, African plates and the Sinai subplate(Shwartz and Arden, 1960). The southern Gulf of Suez
zone is characterized by higher seismic activity whencompared with the northern and central zones of thegulf and the 1969 and 1972 earthquake swarms were
reported at this zone.(5) Gulf of Aqaba Zone (AQB), which is characterized by a
high seismic activity. Its structure is dominated by N–S
strike slip system that resulted in the creation ofen-echelon rhomb shaped grabens where changes inthe trend to NNW–SSE and back to N–S occur. These
grabens are filled with a few kilometers of sediment(Dahy, 2010). The importance of the Gulf of Aqabacomes from the occurrence of earthquake swarms (e.g.1983, 1993 and 2002 earthquake swarms).
(6) South-East Mediterranean Sea Zone (Med), which ischaracterized by the occurrences of small and moderateto large earthquakes. Its high level of seismic activity is
related to the continental shelf and the probable deepfaults (Maamoun and Ibrahim, 1978).
Microtremor data acquisition and processing
Microtremor measurements were carried out at 55 sites (Fig. 3)in Zagazig area during two periods; the first period was from16 to 23 June, 2011 and the second from 22 to 27 February,
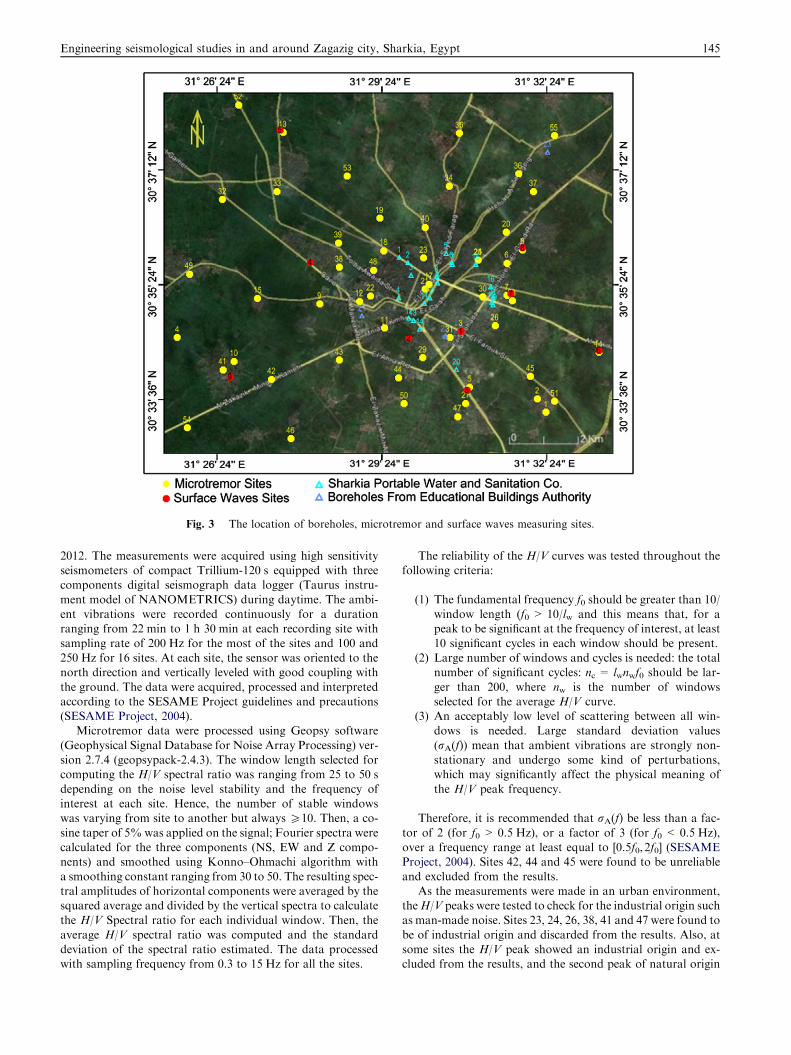
Fig. 3 The location of boreholes, microtremor and surface waves measuring sites.
Engineering seismological studies in and around Zagazig city, Sharkia, Egypt 145
2012. The measurements were acquired using high sensitivityseismometers of compact Trillium-120 s equipped with threecomponents digital seismograph data logger (Taurus instru-
ment model of NANOMETRICS) during daytime. The ambi-ent vibrations were recorded continuously for a durationranging from 22 min to 1 h 30 min at each recording site with
sampling rate of 200 Hz for the most of the sites and 100 and250 Hz for 16 sites. At each site, the sensor was oriented to thenorth direction and vertically leveled with good coupling with
the ground. The data were acquired, processed and interpretedaccording to the SESAME Project guidelines and precautions(SESAME Project, 2004).
Microtremor data were processed using Geopsy software
(Geophysical Signal Database for Noise Array Processing) ver-sion 2.7.4 (geopsypack-2.4.3). The window length selected forcomputing the H/V spectral ratio was ranging from 25 to 50 s
depending on the noise level stability and the frequency ofinterest at each site. Hence, the number of stable windowswas varying from site to another but always P10. Then, a co-
sine taper of 5%was applied on the signal; Fourier spectra werecalculated for the three components (NS, EW and Z compo-nents) and smoothed using Konno–Ohmachi algorithm with
a smoothing constant ranging from 30 to 50. The resulting spec-tral amplitudes of horizontal components were averaged by thesquared average and divided by the vertical spectra to calculatethe H/V Spectral ratio for each individual window. Then, the
average H/V spectral ratio was computed and the standarddeviation of the spectral ratio estimated. The data processedwith sampling frequency from 0.3 to 15 Hz for all the sites.
The reliability of the H/V curves was tested throughout thefollowing criteria:
(1) The fundamental frequency f0 should be greater than 10/window length (f0 > 10/lw and this means that, for apeak to be significant at the frequency of interest, at least
10 significant cycles in each window should be present.(2) Large number of windows and cycles is needed: the total
number of significant cycles: nc = lwnwf0 should be lar-
ger than 200, where nw is the number of windowsselected for the average H/V curve.
(3) An acceptably low level of scattering between all win-dows is needed. Large standard deviation values
(rA(f)) mean that ambient vibrations are strongly non-stationary and undergo some kind of perturbations,which may significantly affect the physical meaning of
the H/V peak frequency.
Therefore, it is recommended that rA(f) be less than a fac-
tor of 2 (for f0 > 0.5 Hz), or a factor of 3 (for f0 < 0.5 Hz),over a frequency range at least equal to [0.5f0,2f0] (SESAMEProject, 2004). Sites 42, 44 and 45 were found to be unreliable
and excluded from the results.As the measurements were made in an urban environment,
theH/V peaks were tested to check for the industrial origin suchas man-made noise. Sites 23, 24, 26, 38, 41 and 47 were found to
be of industrial origin and discarded from the results. Also, atsome sites the H/V peak showed an industrial origin and ex-cluded from the results, and the second peak of natural origin
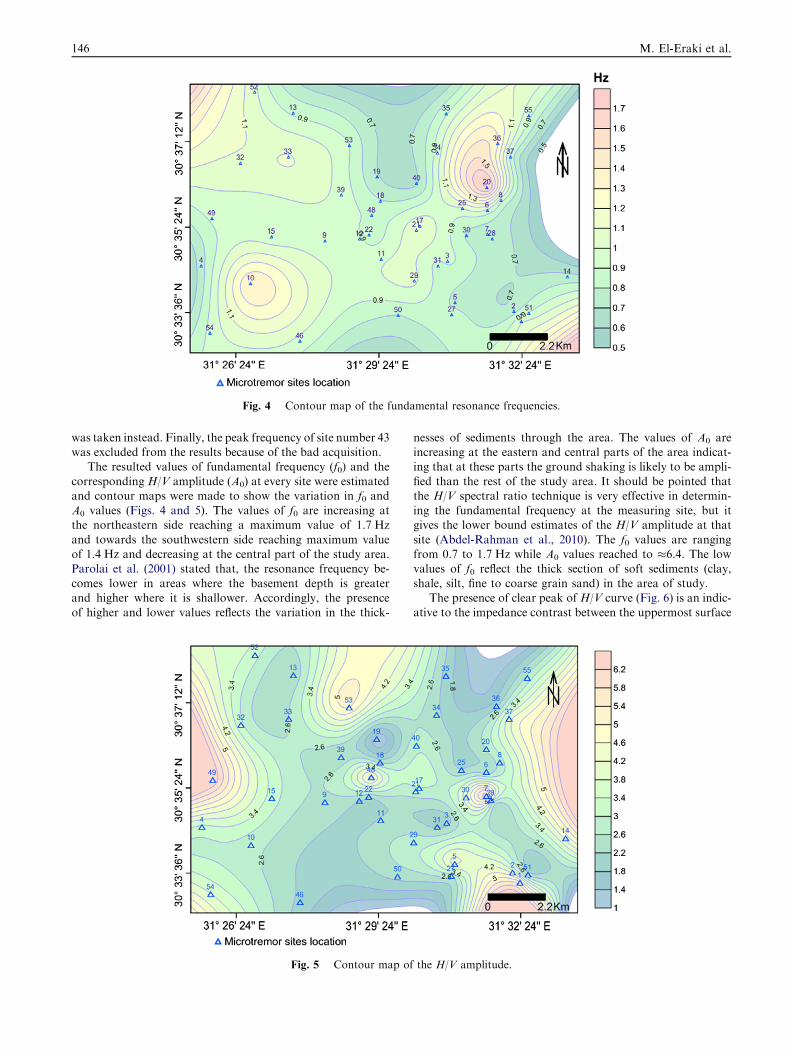
Fig. 4 Contour map of the fundamental resonance frequencies.
146 M. El-Eraki et al.
was taken instead. Finally, the peak frequency of site number 43was excluded from the results because of the bad acquisition.
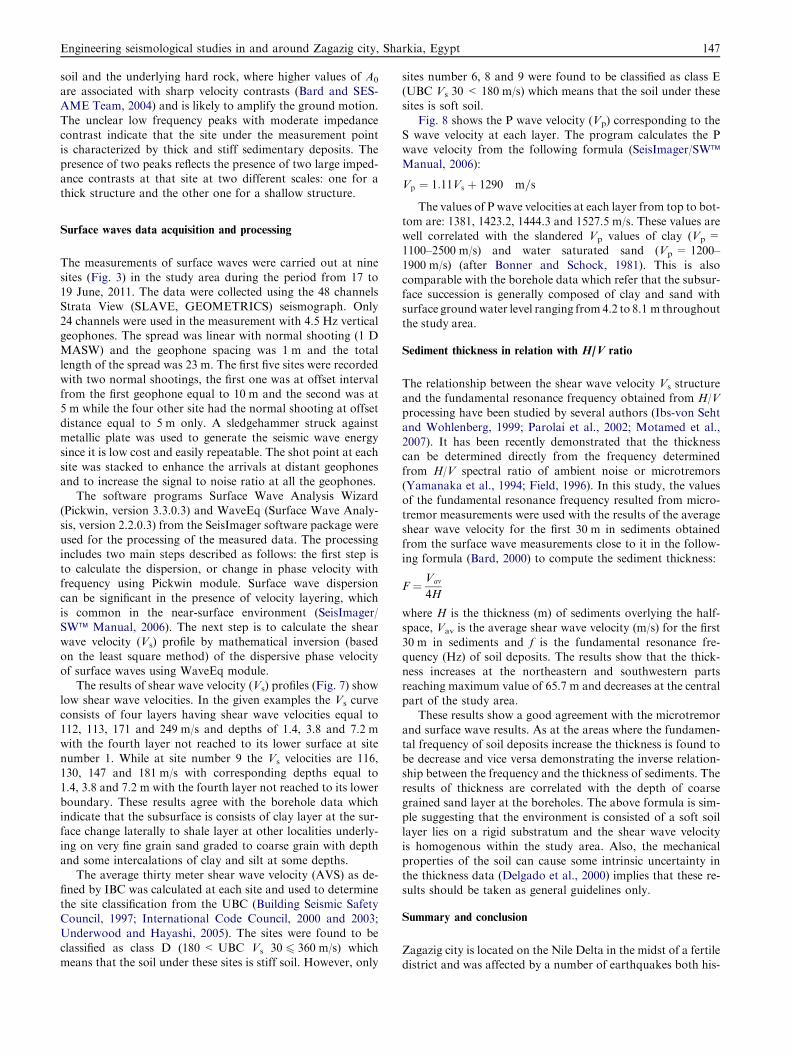
The resulted values of fundamental frequency (f0) and the
corresponding H/V amplitude (A0) at every site were estimatedand contour maps were made to show the variation in f0 andA0 values (Figs. 4 and 5). The values of f0 are increasing atthe northeastern side reaching a maximum value of 1.7 Hz
and towards the southwestern side reaching maximum valueof 1.4 Hz and decreasing at the central part of the study area.Parolai et al. (2001) stated that, the resonance frequency be-
comes lower in areas where the basement depth is greaterand higher where it is shallower. Accordingly, the presenceof higher and lower values reflects the variation in the thick-
Fig. 5 Contour map of
nesses of sediments through the area. The values of A0 areincreasing at the eastern and central parts of the area indicat-ing that at these parts the ground shaking is likely to be ampli-
fied than the rest of the study area. It should be pointed thatthe H/V spectral ratio technique is very effective in determin-ing the fundamental frequency at the measuring site, but itgives the lower bound estimates of the H/V amplitude at that
site (Abdel-Rahman et al., 2010). The f0 values are rangingfrom 0.7 to 1.7 Hz while A0 values reached to �6.4. The lowvalues of f0 reflect the thick section of soft sediments (clay,
shale, silt, fine to coarse grain sand) in the area of study.The presence of clear peak of H/V curve (Fig. 6) is an indic-
ative to the impedance contrast between the uppermost surface
the H/V amplitude.
Engineering seismological studies in and around Zagazig city, Sharkia, Egypt 147
soil and the underlying hard rock, where higher values of A0
are associated with sharp velocity contrasts (Bard and SES-AME Team, 2004) and is likely to amplify the ground motion.
The unclear low frequency peaks with moderate impedancecontrast indicate that the site under the measurement pointis characterized by thick and stiff sedimentary deposits. The
presence of two peaks reflects the presence of two large imped-ance contrasts at that site at two different scales: one for athick structure and the other one for a shallow structure.
Surface waves data acquisition and processing
The measurements of surface waves were carried out at nine
sites (Fig. 3) in the study area during the period from 17 to19 June, 2011. The data were collected using the 48 channelsStrata View (SLAVE, GEOMETRICS) seismograph. Only
24 channels were used in the measurement with 4.5 Hz verticalgeophones. The spread was linear with normal shooting (1 DMASW) and the geophone spacing was 1 m and the totallength of the spread was 23 m. The first five sites were recorded
with two normal shootings, the first one was at offset intervalfrom the first geophone equal to 10 m and the second was at5 m while the four other site had the normal shooting at offset
distance equal to 5 m only. A sledgehammer struck againstmetallic plate was used to generate the seismic wave energysince it is low cost and easily repeatable. The shot point at each
site was stacked to enhance the arrivals at distant geophonesand to increase the signal to noise ratio at all the geophones.
The software programs Surface Wave Analysis Wizard(Pickwin, version 3.3.0.3) and WaveEq (Surface Wave Analy-
sis, version 2.2.0.3) from the SeisImager software package wereused for the processing of the measured data. The processingincludes two main steps described as follows: the first step is
to calculate the dispersion, or change in phase velocity withfrequency using Pickwin module. Surface wave dispersioncan be significant in the presence of velocity layering, which
is common in the near-surface environment (SeisImager/SW� Manual, 2006). The next step is to calculate the shearwave velocity (Vs) profile by mathematical inversion (based
on the least square method) of the dispersive phase velocityof surface waves using WaveEq module.
The results of shear wave velocity (Vs) profiles (Fig. 7) showlow shear wave velocities. In the given examples the Vs curve
consists of four layers having shear wave velocities equal to112, 113, 171 and 249 m/s and depths of 1.4, 3.8 and 7.2 mwith the fourth layer not reached to its lower surface at site
number 1. While at site number 9 the Vs velocities are 116,130, 147 and 181 m/s with corresponding depths equal to1.4, 3.8 and 7.2 m with the fourth layer not reached to its lower
boundary. These results agree with the borehole data whichindicate that the subsurface is consists of clay layer at the sur-face change laterally to shale layer at other localities underly-ing on very fine grain sand graded to coarse grain with depth
and some intercalations of clay and silt at some depths.The average thirty meter shear wave velocity (AVS) as de-
fined by IBC was calculated at each site and used to determine
the site classification from the UBC (Building Seismic SafetyCouncil, 1997; International Code Council, 2000 and 2003;Underwood and Hayashi, 2005). The sites were found to be
classified as class D (180 < UBC Vs 30 6 360 m/s) whichmeans that the soil under these sites is stiff soil. However, only
sites number 6, 8 and 9 were found to be classified as class E(UBC Vs 30 < 180 m/s) which means that the soil under thesesites is soft soil.
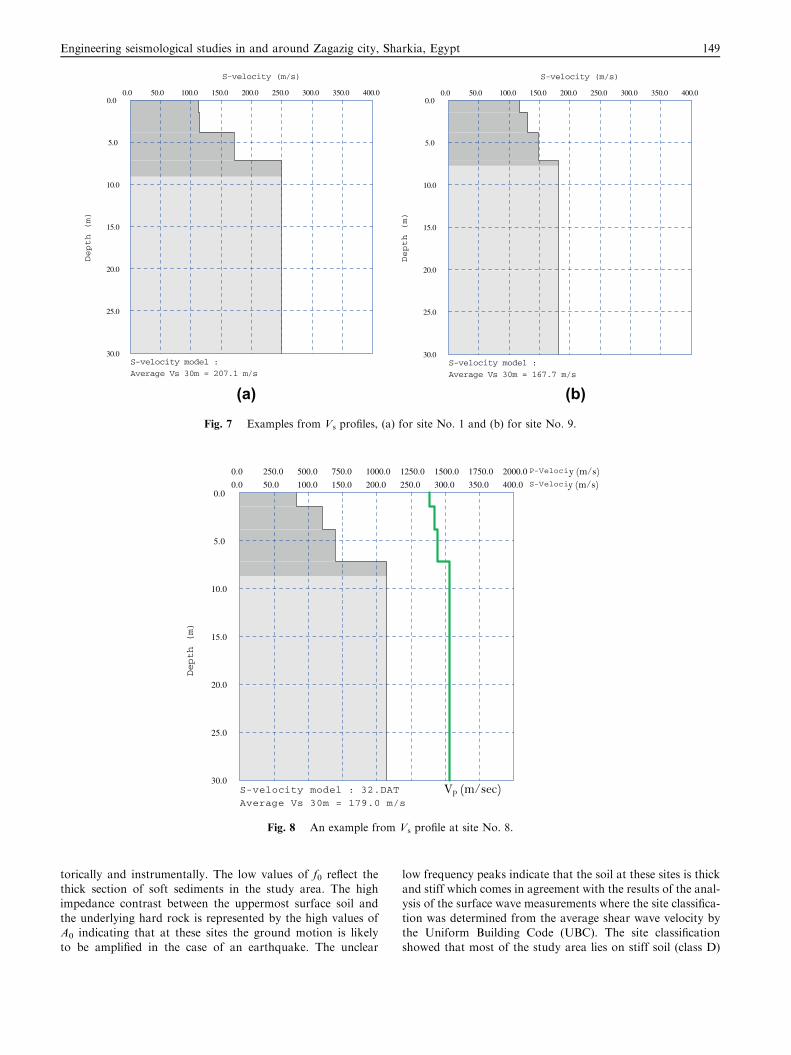
Fig. 8 shows the P wave velocity (Vp) corresponding to theS wave velocity at each layer. The program calculates the Pwave velocity from the following formula (SeisImager/SW�Manual, 2006):
Vp ¼ 1:11Vs þ 1290 m=s
The values of P wave velocities at each layer from top to bot-
tom are: 1381, 1423.2, 1444.3 and 1527.5 m/s. These values arewell correlated with the slandered Vp values of clay (Vp =1100–2500 m/s) and water saturated sand (Vp = 1200–
1900 m/s) (after Bonner and Schock, 1981). This is alsocomparable with the borehole data which refer that the subsur-face succession is generally composed of clay and sand with
surface groundwater level ranging from4.2 to 8.1 m throughoutthe study area.
Sediment thickness in relation with H/V ratio
The relationship between the shear wave velocity Vs structureand the fundamental resonance frequency obtained from H/V
processing have been studied by several authors (Ibs-von Sehtand Wohlenberg, 1999; Parolai et al., 2002; Motamed et al.,2007). It has been recently demonstrated that the thicknesscan be determined directly from the frequency determined
from H/V spectral ratio of ambient noise or microtremors(Yamanaka et al., 1994; Field, 1996). In this study, the valuesof the fundamental resonance frequency resulted from micro-
tremor measurements were used with the results of the averageshear wave velocity for the first 30 m in sediments obtainedfrom the surface wave measurements close to it in the follow-
ing formula (Bard, 2000) to compute the sediment thickness:
F ¼ Vam
4H
where H is the thickness (m) of sediments overlying the half-space, Vav is the average shear wave velocity (m/s) for the first
30 m in sediments and f is the fundamental resonance fre-quency (Hz) of soil deposits. The results show that the thick-ness increases at the northeastern and southwestern parts
reaching maximum value of 65.7 m and decreases at the centralpart of the study area.
These results show a good agreement with the microtremor
and surface wave results. As at the areas where the fundamen-tal frequency of soil deposits increase the thickness is found tobe decrease and vice versa demonstrating the inverse relation-ship between the frequency and the thickness of sediments. The
results of thickness are correlated with the depth of coarsegrained sand layer at the boreholes. The above formula is sim-ple suggesting that the environment is consisted of a soft soil
layer lies on a rigid substratum and the shear wave velocityis homogenous within the study area. Also, the mechanicalproperties of the soil can cause some intrinsic uncertainty in
the thickness data (Delgado et al., 2000) implies that these re-sults should be taken as general guidelines only.
Summary and conclusion
Zagazig city is located on the Nile Delta in the midst of a fertiledistrict and was affected by a number of earthquakes both his-
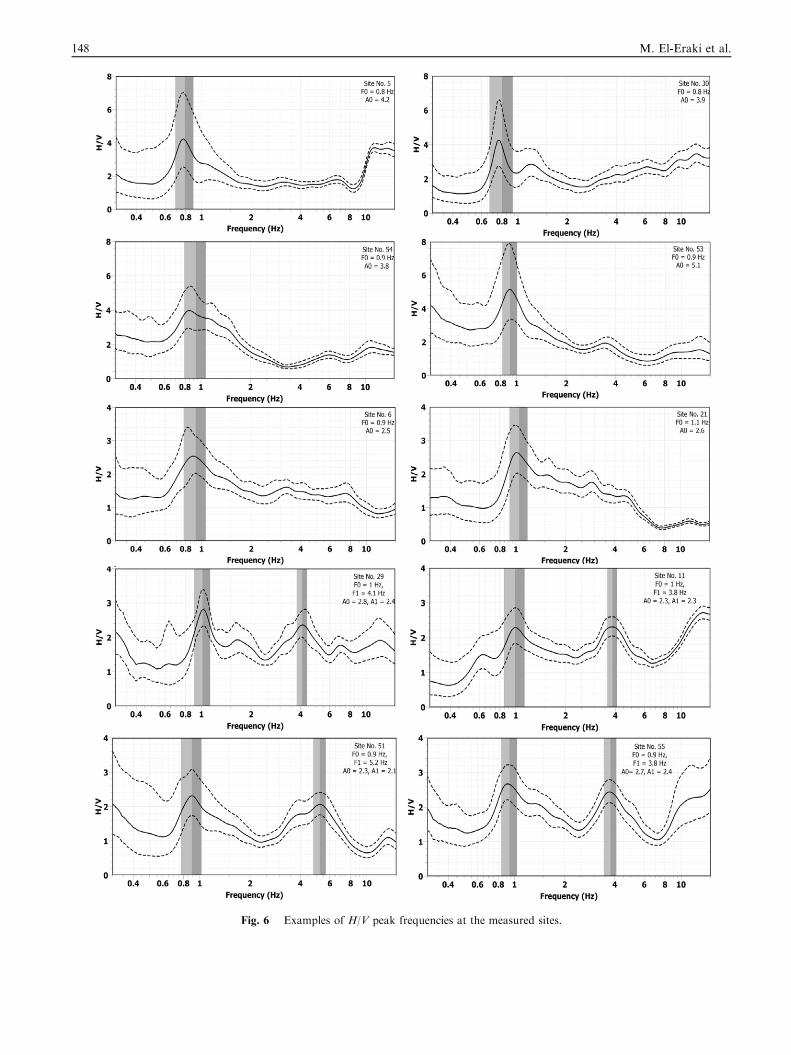
Fig. 6 Examples of H/V peak frequencies at the measured sites.
148 M. El-Eraki et al.
(a) (b)Fig. 7 Examples from Vs profiles, (a) for site No. 1 and (b) for site No. 9.
Fig. 8 An example from Vs profile at site No. 8.
Engineering seismological studies in and around Zagazig city, Sharkia, Egypt 149
torically and instrumentally. The low values of f0 reflect thethick section of soft sediments in the study area. The highimpedance contrast between the uppermost surface soil and
the underlying hard rock is represented by the high values ofA0 indicating that at these sites the ground motion is likelyto be amplified in the case of an earthquake. The unclear
low frequency peaks indicate that the soil at these sites is thickand stiff which comes in agreement with the results of the anal-ysis of the surface wave measurements where the site classifica-
tion was determined from the average shear wave velocity bythe Uniform Building Code (UBC). The site classificationshowed that most of the study area lies on stiff soil (class D)

150 M. El-Eraki et al.
while other regions lies on soft soil (class E). The calculatedlongitudinal wave (Vp) values also come in agreement withthe values of the sediments constituting the study area.
The results of microtremor and surface waves are highlycomparable with the borehole data. The relationship betweenthe fundamental frequency of the soil deposits and the average
shear wave velocity gave a reasonable estimation of the sedi-ment thickness. Microtremor is powerful tool in microzona-tion studies due to the low cost, speed and ease of data
acquisition and analysis. The results of this study should beconsidered before the construction of civil engineering struc-ture in the study area.
Acknowledgments
The authors greatly appreciate to the team works from theSeismology Department, National Research Institute ofAstronomy and Geophysics (NRIAG), Egypt for performing
the measurements. Thanks to assistant researcher MohamedAbd El-Hay for his contribution in the research. Also thanksto the holding company for drinking water and the educational
buildings authority for providing the borehole data.
References
Abd El Gawad, A.M., 1997. Shallow geophysical exploration for
defining the water occurrences in the area east of the Nile Delta,
Egypt. Ph.D. thesis, Fac. Sci., Ain. Shams Univ., Cairo, Egypt,
410p.
Abd El-Aal, A.K., 2008. Simulating time-histories and pseudo-spectral
accelerations from the 1992 Cairo earthquake at the proposed El-
Fayoum New City Site, Egypt. Acta Geophys. 56, 1025–1042.
Abd El-Aal, A.K., 2010a. Modeling of seismic hazard at the
northeastern part of greater Cairo metropolitan area, Egypt. J.
Geophys. Eng. 7, 75–90.
Abd El-Aal, A.K., 2010b. Ground motion prediction from nearest
seismogenic zones in and around Greater Cairo Area, Egypt. Nat.
Hazards Earth Syst. Sci. 10, 1495–1511.
Abdel-Rahman, K., Abd El-Aal, A.K., El-Hady, S.M., Mohamed,
A.A., Abdel-Moniem, E., 2010. Fundamental site frequency
estimation at new Domiat city, Egypt. Arab J. Geosci..
Bard, P.-Y., 2000. Lecture Notes on ‘‘Seismology, Seismic Hazard
Assessment and Risk Mitigation’’. International Training Course,
Potsdam, 160p.
Bard, Z.P.-Y., SESAME Team, 2004. Guidelines for the Implemen-
tation of the H/V Spectral Ratio Technique on the Ambient
Vibrations: Measurements, Processing and Interpretation. Univ.
Joseph Fourier.
Bayoumy, M.R., 1971. Pedological studies on agricultural expansion
areas west of the Suez Canal. M.Sc. Thesis, Fac. Agric., Cairo
Univ., Egypt, 85p.
Bonner, B.P., Schock, R.N., 1981. Seismic wave velocity. In: Toulou-
kian, Y.S., Judd, W.R., Roy, R.F. (Eds.), . In: Physical Properties
of Rocks and Minerals, vol. II-2. McGraw-Hill/CINDAS Data
Series of Material Properties.
Uniform, Building Code (UBC), 1997. Building Seismic Safety
Council. Uniform, Building Code (UBC).
Colleta, P., Le Quellec, P., Letouzy, J., Moretti, I., 1988. Longitudinal
evolution of the Suez rift structure, Egypt. Tectonophysics 53, 221–
233.
Dahy, S.A., 2010. A study on seismicity and tectonic setting in the
northeastern part of Egypt. Res. J. Earth Sci. 1 (2), 8–13, NRIAG,
Egypt.
Delgado, J., Lopez Casado, C., Giner, J., Estevez, A., Cuenca, A.,
Molinal, S., 2000. Microtremors as a geophysical exploration tool:
applications and limitations. Pure Appl. Geophys. 157, 1445–1462.
El Gamili, M.M., Hassaneen, A.Gh., El Mahmoudi, A.E., 1990.
Geophysical implications in environmental geology for develop-
ment of the eastern Nile Delta. In: A.R.E. Geophys. Proc. of 3rd
Scient. Gen. Meeting, NRIAG. pp. 117–125.
Field, E.H., 1996. Spectral amplification in a sediment-filled valley
exhibiting clear basin-edge-induced waves. Bull. Seismol. Soc. Am.
86, 991–1005.
Geological Survey of Egypt, 1971. Compiled geological map of Egypt,
Cairo, Egypt.
GPC and CONOCO, 1987. Geological map of Egypt. Map scale
1:500.000.
Hassib, G., 1990. Study of the focal mechanisms for recent earth-
quakes in Egypt and their tectonic implications. M.Sc. Thesis, Fac.
Sci., Sohag Univ, Egypt.
Ibs-von Seht, M., Wohlenberg, J., 1999. Microtremor measurements
used to map thickness of soft sediments. Bull. Seismol. Soc. Am.
89, 250–259.
International Building Code (IBC), 2000. International Code Council.
International Building Code (IBC).
Kanai, K., 1983. Engineering Seismology. University of Tokyo Press,
Japan, 251p.
Lacave, C., Bard, P.-Y., Koller, M.G., 1999. Microzonation: tech-
niques and examples. In: Block 15: Naturgefahren Erdbebenrisiko,
23pp. Available from: <http://www.ndk.ethz.ch/pages/publ/Kol-
ler.pdf> (electronic book on the Internet).
Maamoun, M., Ibrahim, E.M., 1978. Tectonic activity of Egypt as
indicated by earthquakes. Bull. Helwan Institute of Astronomy and
Geophysics (HIAG) 170.
Meshref, W.M., 1990. Tectonic framework. In: Said, R. (Ed.), The
Geology of Egypt. A.A Balkema, Rotterdam, Netherlands, pp.
113–155.
Motamed, R., Ghalandarzadeh, A., Tawhata, I., Tabtabaei, S., 2007.
Seismic microzonation and damage assessment of Bam City,
Southeastern Iran. J. Earthquake Eng. 11, 110–132.
Mousa, H.M., 1989. Earthquake activities in Egypt and adjacent
regions and its relation to geotectonic features in Egypt. M.Sc.
Thesis, Fac. Sci., Mansoura Univ.
Nakamura, Y., 1989. A method for dynamic characteristics estimation
of subsurface using microtremor on the ground surface. Q. Rep.
RTRI 1 (30), 25–33.
Okada, H., 1997. The Microtremor Survey Method. Course notes
series, Vol. 12. Society of Exploration Geophysicists. Translated by
Koya Suto, Brisbane, 2002. pp. 1-104.
Parolai, S., Bormann, P., Milkereit, C., 2001. Assessment of the
natural frequency of the sedimentary cover in the Cologne area
(Germany) using noise measurements. J. Earthquake Eng. 5, 541–
564.
Parolai, S., Bormann, P., Milkereit, C., 2002. New relationships
between Vs, thickness of sediments, and resonance frequency
calculated by H/V ratio of seismic noise for the Cologne area
(Germany). Bull. Seismol. Soc. Am. 92, 2521–2526.
Schlumberger, 1984. Well evaluation conference, Egypt. Schlumberger,
Middle East, S.A..
SeisImager/SW� Manual, 2006. Windows software for analysis of
surface waves. Pickwin� v. 3.2, WaveEq� v. 2.2 and GeoPlot� v.
8.2.5. Manual v. 2.2. Including explanation of surface wave data
acquisition using Geometrics Seismodule Controller Software (v.
9.14) for ES-3000, Geode, and StrataVisor NZ seismographs.
Geometrics, Inc.
SESAME Project, 2004. Guidelines for the implementation of the H/V
spectral ratio technique on ambient vibrations measurements,
processing and interpretation. SESAME European Research
Project.
Shwartz, D.H., Arden, D., 1960. Geological history of the Red Sea
area. Bull. Am. Assoc. Petrol. Geologists. 44, 1621–1637.

Engineering seismological studies in and around Zagazig city, Sharkia, Egypt 151
Underwood, D.H., Hayashi, K., 2005. Seismic Surface Wave Survey-
ing With Geometrics, Inc. Seismographs and SeisImager/SW
Software, Geometrics, Inc. Short Course Notes, San Jose, Califor-
nia and London, United Kingdom, 83p.
Yamanaka, H., Takemura, M., Isida, H., Niwa, M., 1994. Character-
istics of long-period microtremors and their applicability in
exploration of deep sedimentary layers. Bull. Seismol. Soc. Am.
84, 1831–1841.