BIOLOGICAL MONITORING OF COASTAL MARINE ...Multivariate AMBI (M-AMBI) was applied with the default...
46
BULGARIAN ACADEMY OF SCIENCES INSTITUTE OF OCEANOLOGY REPORT B IOLOGICAL MONITORING OF COASTAL MARINE WATERS AND LAKES - BENTHIC INVERTEBRATE FAUNA
Transcript of BIOLOGICAL MONITORING OF COASTAL MARINE ...Multivariate AMBI (M-AMBI) was applied with the default...

BBUULLGGAARRIIAANN AACCAADDEEMMYY OOFF SSCCIIEENNCCEESS
II NN SS TT II TT UU TT EE OO FF OO CC EE AA NN OO LL OO GG YY
REPORT
BIOLOGICAL MONITORING OF COASTAL MARINE WATERS
AND LAKES - BENTHIC INVERTEBRATE FAUNA

The present study was carried out within the Contract BUL 007/07 -
“Capacity building aimed at the development of a Pilot Programme of
measures for the Black Sea River Basin management plan of coastal
waters at risk – Burgas and Varna bay”.
Authors: Assoc. researcher Valentina Todorova, PhD – coastal marine waters
Assoc. researcher Antoaneta Trayanova – highly modified water bodies
Assoc. prof. Tsenka Konsulova, PhD - coastal marine waters and highly
modified water bodies
Cover picture: Lyubomir Klisurov ©
2

TABLE OF CONTENTS
1. STUDY AREA AND SAMPLING SITES…………..………………...…..……..…4
2. MATERIALS AND METHODS………………………….…………...……….….6
2.1. Sampling and sample processing……………………………………………6
2.2. Statistical analyses for ecological state assessment…………………….6
3. RESULTS………………………………………………………......…….….10
3. 1. Ecological state of coastal waters in Varna bay (BG2BS000C005) and Burgas bay (BG2BS000C008, BG2BS000C009, BG2BS000C010 and
BG2BS000C011) in August 2008…………………………………………….…..10
3. 2. Overview of the historical trends in the ecological state of Varna bay
and Burgas bay (BG2BS000C009, BG2BS000C010)......……………………..13
3. 3. Ecological state of the highly modified water bodies Varna lake
(BG2PR100L001) and Beloslav lake (BG2PR100L002) in August 2008…..22
3. 4. Overview of the historical trends in the ecological state of the highly modified water bodies Varna lake (BG2PR100L001) and Beloslav lake
(BG2PR100L002) in August 2008………………………………………………..23
4. CONCLUSIONS………………………………………….……….................31
5. REFERENCES……………….………………………….….………………..33
ANNEX 1...................................................................................................35
ANNEX 2...................................................................................................46
3
1. STUDY AREA AND SAMPLING SITES
The study area covers the two largest bays along the Bulgarian Black Sea coast –
Burgas bay (WB BG2BS000C008, BG2BS000C009, BG2BS000C010 and BG2BS000C011)
and Varna bay (WB BG2BS000C005), as well as the two interconnected coastal lakes of
Varna (WB BG2PR100L001) and Beloslav (WB BG2PR100L002) that used to be fresh water
basins originally but nowadays are modified to brackish lagoons due to established
connection with Varna bay through couple of artificial channels. Macrozoobenthos was
sampled at eighteen locations, of which 7 stations in Beloslav-Varna lakes, 2 stations in the
outlets of the channels between Varna lake and Varna bay, 2 stations in Varna Bay and 7
stations in the large Burgas bay area as shown on Figure 1, geographic coordinates and
depth given in Table 1. Sampling was carried out in August 2008 onboard RV “Akademik”
and FV “Elis”.
Table 1. Geographic coordinates and depth of sampling stations.
Coordinates Station
Latitude N Latitude E
Sediment type Depth (m)
1. Beloslav lake West 27°40’14 43°11’26” Mud 7 2. Beloslav lake East 27°41’50 43°11’42” Mud 2 3. Channel Beloslav-Varna lakes 27°44’22 43°11’38” Mud 12 4. Varna lake West 27°46'28 43°11’35” Mud 12.5 5. Varna lake North-West 27°47’29 43°11’55” Mud 14 6. Varna lake Center 27°48’52 43°11’11” Mud 14 7. Varna lake East 27°52’12 43°12’09” Mud 8 8. Old Channel 27°54’33 43°11’23” Sand 2 9. New channel 27°54’12 43°11’04” Mud 12 10. Varna bay 1 43o11'07'' 27o56'11'' Mud 17 11. Varna bay 2 43o12'07'' 27o57'19'' Mud 16.4 12. Nesebar 42o40'48'' 27o46'44'' Mud 22 13. Cocketrice 42o39'03'' 27o53'20'' Sand 17 14. Rosenets 42o27'47'' 27o31'01'' Mud 14.5 15. Burgas 42o30'23'' 27o40'20'' Mixed 27 16. Burgas bay 42o30'00'' 27o48'00'' Mud 35 17. Sozopol 42o26'03'' 27o43'21'' Mud 38 18. Maslen nos 42o20'08'' 27o49'09'' Mud 47
4

Figure 1. Sampling network for macrozoobenthos in Varna bay, Varna-Beloslav lakes (top) and Burgas bay (bottom).
5

2. MATERIALS AND METHODS
2.1. Sampling and sample processing
The procedures of collection, onboard and laboratory processing of samples were
accomplished according to the “Manual for collection and treatment of soft bottom
macrozoobenthos samples” (Todorova, Konsulova, 2005).
Van Veen grab with a sampling area of 0.1 m2 was employed as a macrozoobenthos
sampler. One replicate was collected at every station. The samples were initially sieved
onboard through metal gauze sieves with mesh size 1.0 x 1.0 mm and 0.5 x 0.5 mm, fixed
with 37-41 % buffered formaldehyde and appropriately labeled for further identification.
Laboratory processing including sorting, taxonomic identification (Fauvel, 1923, 1927,
Marinov, 1977, Morduhay-Boltovskoy, 1968, 1969, 1972), abundance and biomass (wet
weight) determination was accomplished in the Marine Biology and Ecology Department by
highly qualified personnel.
The raw data are provided in Annex 1.
2.2. Statistical analyses for ecological state assessment
Coastal waters
Shannon community diversity index (H’) (Shannon and Weaver, 1963) was employed,
reference and boundary values between ecological classes for water bodies with muddy
sediments and water bodies with sandy and mixed sediments determined according to
Trayanova, Todorova and Konsulova, 2007 (Table 2).
Table 2. Classification scheme for Shannon community diversity index (H’).
Water bodies with muddy sediments
Ecological status High Good Moderate Poor Bad
H' average 3.6 2.9 2.2 1.5 0.7 Range H' ≥ 3.3 3.3 > H' ≥ 2.5 2.5 > H' ≥ 1.8 1.8 > H' ≥ 1.1 H' < 1.1 EQR 1 0.8 0.6 0.4 0.2
Water bodies with sandy and mixed sediments
Ecological status High Good Moderate Poor Bad
H' average 4.5 3.6 2.7 1.8 0.9 Range H' ≥ 4 4 > H' ≥ 3.1 3.1 > H' ≥ 2.2 2.2 > H' ≥ 1.3 H' < 1.3 EQR 1 0.8 0.6 0.4 0.2
Marine Biotic Index (AMBI) was used, the boundaries between the ecological classes
are those identified by Borja et al., (2000, 2003) and Muxica et al., (2005) (Table 3). Different
6

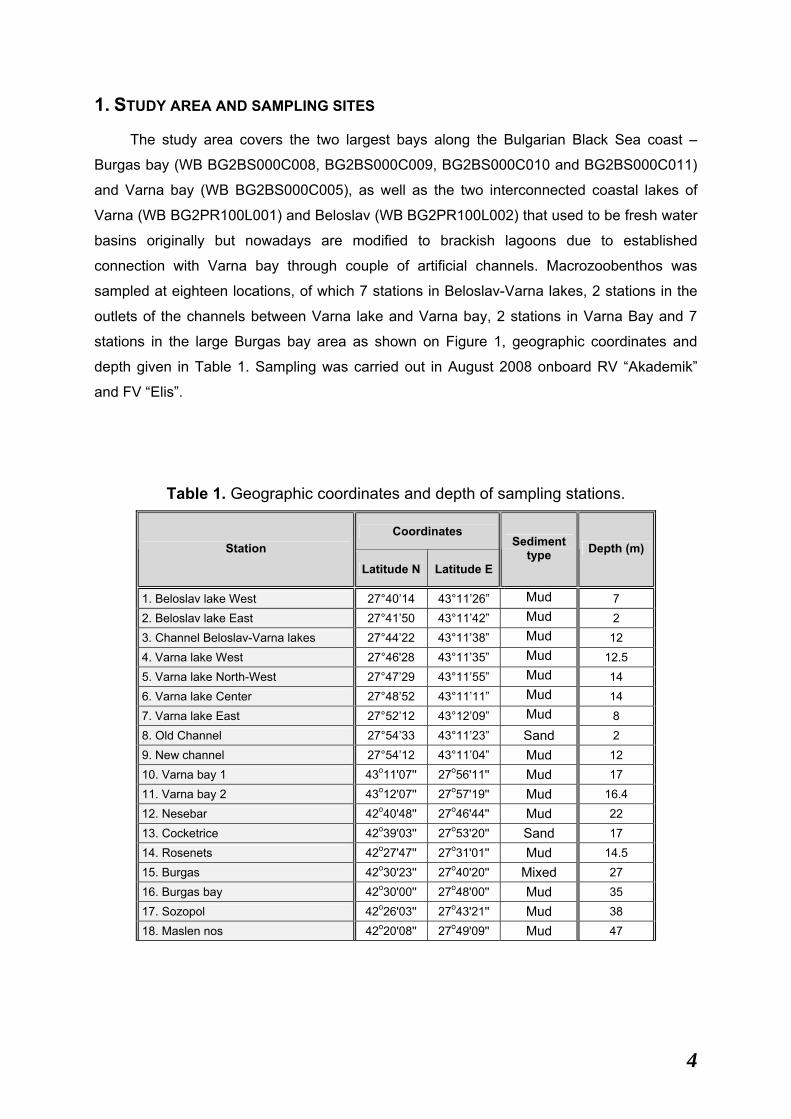
from the original species ecological classification, the polychaete worm Aricidea claudiae
was moved from group I (species very sensitive to organic enrichment) to group III (species
tolerant to excess organic matter). The arguments in support of this shift are that in the
Bulgarian Black Sea Aricidea claudiae occurs together with and shows similar ecological
preferences as Heteromastus filiformis (ecological group IV), Oligochaeta (ecological
group V), Nephtys hombergii (ecological group II), and Melinna palmata (ecological group III)
as shown in the species similarity dendrogram on Figure 2. Therefore the middling ecological
group from the above – group III is selected as characteristic of A. claudiae. Another
argument is the fact that Aricidea claudiae attains high abundance in organically enriched
muddy sediments.
Table 3. Classification scheme for A Marine Biotic Index (AMBI).
Ecological status AMBI
High 0.0 < AMBI ≤ 1.2
Good 1.2 < AMBI ≤ 3.3
Moderate 3.3 < AMBI ≤ 4.3
Poor 4.3 < AMBI ≤ 5.5
Bad 5.5 < AMBI ≤ 6.0 Azoic sediment (7.0)
Multivariate AMBI (M-AMBI) was applied with the default EQR boundaries according to
Borja et al., 2006 (Table 4). In the calculation of M-AMBI the bad and high boundary values
for diversity are those given above (Table 2) and the bad - high boundary values for richness
are set as 9-40 for muddy and 14-50 for sandy/mixed sediments.
Table 4. Classification scheme for Multivariate AMBI (M-AMBI).
Ecological status M - AMBI
High M-AMBI ≥ 0.85 Good 0.85 > M-AMBI ≥ 0.55
Moderate 0.55 > M-AMBI ≥ 0.39 Poor 0.39 > M-AMBI ≥ 0.20 Bad 0.20 > M-AMBI
7
P aram y s is k roy e r iT erebe llides s t roem i
O dos t om ia ac ut aP apillic ardium papillos um
A bra albaN em ert ina g. s p.
B it t ium re t ic ula t umC y lic hnina um bilic at a
A nadara inaequiv alv isE x ogone gem m if era
P arv ic ardium ex iguumP hy llodoc e m uc os a
P it ar rudisR is s oa lineolat a
P horonis eux in ic olaA bra p r is m at ic a
O riops is arm andiS p is ula s ubt runc at a
C eras t oderm a glauc umA m pelis c a d iadem a
M y t ilus gallorov inc ia lisF abr ic ia s abella
C hry s allida t erebellumA c t inot hoe c lav at a
I dot hea ba lt ic aH y drobia v en t ros a
P ec t inar ia k oreniR is s oa parv a
R et us a t runc at ulaE ba la point e li
H y drobia ac ut aS y nc helid ium m ac ulat um
P aphia aureaC irra t u lidae g. s p.
A ps eudops is os t roum ow iA c t in ia equina
A c ant hoc ardia pauc ic os t at aC ham elea gallina
S phaeros y llis h is t r ixC aly pt raea c hinens is
M odio lus adr iat ic usP lat y nereis dum er ilii
Luc inella d iv ar ic at aR apana v enos a
P ro t odorv illea k ef ers t e in iP oly c irrus jubat us
B ranc hios t om a lanc eola t umS y llides longoc ir rat a
A onides pauc ibranc hiat usP rot odr ilus f lav oc apit at us
T urbella r ia g. s p.M ic ropht halm us s z elk ow ii
P oly dora c ilia t aS y llis hy alina
X ant ho pores s aLepidoc hit ona c inereaN as s ar ius ret ic ulat us
T hrac ia papy rac eaD iogenes pugilat or
Lept os y napt a inc haerensO dos t om ia eulim oides
S y llis grac ilisLepidoc hit ona c aprearum
S alv at or ia c lav at aM y a arenar ia
C apit om as t us m inim usS pio f ilic orm is
G ly c era c onv olut aP er ioc u lodes longim anus
M agelona papillic ornisM elit a palm at a
Lent id ium m edit erraneumP y gos pio e legansC ham elea gallina
T ellina t enuisI phinoe m aeot ic a
E t eone pic t aK ellia s uborbic u lar is
R hit hropanopeus har r is ii t r ident at aH edis t e d iv ers ic olor
C hironom idae larv aeN udibranc hia s p.
G am m arus s ubt y pic usA bra s egm ent um
M ic rodeut opus gry llo t a lpaC eras t oderm a glauc um
H arm ot hoe im bric at aM y t ilas t e r lineat us
N eant hes s uc c ineaP rionos pio c ir r if era
B alanus im prov is usC orophium bonelliLept oplana g. s p.
F ic opom at us enigm at ic usP oly dora c ornut a
S t reblos pio s hrubs olii
D ec apoda larv aeM e linna palm at a
N epht y s hom bergiiO ligoc haet a g. s p.
A r ic ideac laudiaeH et erom as t us f ilif orm is
U pogebia pus illa
100 80 60 40 20 0
Similarity
Figure 2. Dendrogram of Bray-Curtis similarity among species, based on log (x+1) transformed abundance with the group of Aricidea claudiae indicated in red frame.
8

Highly modified water bodies
An expert judgement and knowledge of the conditions under evaluation were applied
for the assessment of the ecological status of Beloslav and Varna Lakes because no
classification system has been adopted and verified until now. The assessment takes into
account the species richness, diversity and sensitivity / tolerance of species to pollution. In
case the sediments are defaunated or macrozoobenthos is presented by a single species
bad status is attributed (stations Beloslav Lake West and Varna Lake Center – Tables 12
and 13). When the macrozoobenthic community is characterized by higher species richness,
the percentage share of sensitive and tolerant to pollution species contribute to status
evaluation (stations Beloslav lake East and Varna lake East - Tables 12 and 13).
For the overall classification of the ecological status of the water bodies the one-out-all-
out principle has been applied, i. e. the worst value of all stations is accepted as final.
The historical trends in the ecological state were assessed on the basis of available
data in IO-BAS database, the number of samples per water body / station by years, months
and totally given in Annex 2.
PRIMER 5 (Primer-E Ltd) (Clarke and Warwick, 1994), AMBI 4.0 (AZTI-Tecnalia) and
Microsoft Excel software packages were employed for the statistical analyses of data.
9

3. RESULTS 3. 1. Ecological state of coastal waters in Varna bay (BG2BS000C005) and Burgas bay (BG2BS000C008, BG2BS000C009, BG2BS000C010 and BG2BS000C011) in August 2008
The two stations situated in the outlets of the old and new channels connecting Varna
lake to Varna bay are included in the assessment, considered as coastal waters due to
similar invertebrate fauna as demonstrated on the dendrogram of Bray-Curtis similarity
among sampling stations given on Figure 3.
Figure 3. Dendrogram of Bray-Curtis similarity among stations, based on log (x+1) transformed abundance of macrofauna. Coastal marine stations indicated in blue background, lake stations indicated in green background.
The values of diversity (H’), AMBI and M-AMBI at the sampling stations in Varna and
Burgas bay are given in Table 5.
The ecological state determined according to each of the indices used is given in
Table 6. The overall assessment is made according to the principle “one-out-all-out”, i.e. the
final ecological state at a given location is the lowest estimation of all indices.
0 20 40 60 80
Varna lake CenterChannel Beloslav-Varna lakesVarna lake West Beloslav lake East Varna lake East Rosenets Maslen nos Sozopol Burgas bay Burgas Nesebar Varna bay 1 Varna bay 2 New channel Old Channel Cocketrice
100
Similarity
10

Table 5. Diversity (H’), AMBI and M-AMBI values at stations in Varna and Burgas bay.
Water Body Station Sediment type H’ AMBI M-AMBI
Old Channel Sand 2.91 4.04 0.46BG2PR100L001 New channel Mud 3.38 3.46 0.73Varna bay 1 Mud 1.97 4.56 0.32BG2BS000C005 Varna bay 2 Mud 1.80 4.13 0.24Nesebar Mud 1.98 4.11 0.32Rosenets Mud 3.46 3.21 0.56BG2BS000C008 Burgas Mixed 1.39 3.00 0.38
BG2BS000C009 Cocketrice Sand 3.45 3.09 0.67Burgas bay Mud 1.31 3.18 0.35BG2BS000C010 Maslen nos Mud 1.78 2.93 0.46
BG2BS000C011 Sozopol Mud 2.69 2.98 0.48
Table 6. Classification of the ecological status of Black Sea coastal waters in Varna and Burgas bays according to Diversity (H’), AMBI and M-AMBI values
Station H’ AMBI M-AMBI Overall ES Water Body Overall ES
Old Channel Moderate Moderate Moderate ModerateNew channel High Moderate Good Moderate
BG2PR100L001 Moderate
Varna bay 1 Moderate Poor Poor Poor Varna bay 2 Moderate Moderate Poor Poor
BG2BS000C005 Poor
Nesebar Moderate Moderate Poor Poor Rosenets High Good Good Good Burgas Poor Good Poor Poor
BG2BS000C008 Poor
Cocketrice Good Good Good Good BG2BS000C009 Good Burgas bay Poor Good Poor Poor Maslen nos Moderate Good Moderate Moderate
BG2BS000C010 Poor
Sozopol Good Good Moderate Moderate BG2BS000C011 Moderate
The ecological state of Varna bay (BG2BS000C005) is poor according to both sampling
stations and therefore is a water body at risk. Surprisingly, the stations in the new and old
channels between Varna lake and Varna bay show moderate ecological state – better than
the conditions in the proper Varna bay. Varna-Beloslav lakes are usually deemed as a major
source of pollution to Varna bay, however the above results suggest that pressures, other
than the industries situated around the lakes, contribute to the ecological decline in Varna
11

bay. Urbanisation, tourism, coastal defence constructions, and shipping possibly add
significant pressure, thus worsening the ecological state in the coastal waters of Varna bay.
The internal Burgas bay (BG2BS000C008) is in poor ecological state according to
stations Nesebar and Burgas, the assessment providing evidence that this coastal area is a
water body at risk too. Quite unexpectedly, Rosenets, situated in the innermost part of
Burgas bay, is in good ecological state, however following the rule “one-out-all-out” the
overall ecological state of water body BG2BS000C008 is assessed as poor.
Cocketrice (BG2BS000C009), being on the external margin of large Burgas bay in
direction to the sea and also being a protected site, is less disturbed and manifests good
ecological state according to the benthic invertebrate fauna.
Station Maslen nos (BG2BS000C010) is also less disturbed, being in moderate
ecological state. However, Burgas bay (BG2BS000C010), being in poor ecological state
downgrades the final assessment for water body BG2BS000C010 to poor.
Sozopol (BG2BS000C011) is in moderate ecological state. Yet, it is rather questionable
if station Sozopol is truly indicative of water body BG2BS000C011, since the station is
situated on the margin of two adjacent water bodies. Moreover, it is demonstrated on the
dendrogram of Figure 3 that there is a close similarity of station Sozopol (BG2BS000C011)
with the stations Burgas bay and Maslen nos, both in water body BG2BS000C010. The
question is raised whether the monitoring site for water body BG2BS000C011 should be
moved to another more representative location. Clearly, a single station, besides marginal, is
not sufficient to characterise the ecological state of the entire water body BG2BS000C011.
12

3. 2. Overview of the historical trends in the ecological state of Varna bay (BG2BS000C005), and Burgas bay (BG2BS000C009, BG2BS000C010)
Historical data available for Varna bay (BG2BS000C005) at locations close to the
current sampling stations are limited to couple of stations - st.5 and st.8 from Varna bay
monitoring network of IO-BAS, sampled in August 1991 and August 1998. The above
stations correspond roughly to stations Varna bay 1 and Varna bay 2 respectively. The latter
stations from the BSBD monitoring network were sampled in 2007, the data used in the
assessment too.
The results for diversity H’ and AMBI are controversial suggesting some improvement
in the ecological state according to somewhat increasing diversity, however worsening
according to increasing AMBI starting from the end of the 1990s (Figure 4, Table 7). Lack of
sample replication does not allow assessment of the statistical significance of change.
Table 7. Historical trends in the ecological status of Varna bay (BG2BS000C005) according to Diversity (H’), AMBI and M-AMBI values and overall assessment.
Index
Stations/ Years
H' Status AMBI Status M-AMBI Status Overall ES by station
ES for WB BG2BS000C005
st.5/1991 1.75 Poor 3.13 Good 0.35 Poor Poor st.8/1991 1.05 Bad 3.02 Good 0.24 Poor Bad
Bad
st.5/1998 2.13 Moderate 4.34 Poor 0.33 Poor Poor st.8/1998 2.69 Good 3.91 Moderate 0.43 Moderate Moderate
Poor
VB1/2007 2.31 Moderate 4.54 Poor 0.38 Poor Poor VB2/2007 2.00 Moderate 4.03 Moderate 0.26 Poor Poor
Poor
VB1/2008 1.97 Moderate 4.56 Poor 0.33 Poor Poor VB2/2008 1.80 Moderate 4.13 Moderate 0.24 Poor Poor
Poor
The results for M-AMBI suggest persistent poor ecological state of Varna bay since the
1990s to the present day (Figure 5, Table 7). Another conclusion deriving from Figure 5 is
that the northern part of Varna bay (st.8, VB2) is continuously in worse ecological state
compared to the southern Varna bay area (st.5, VB1), except from 1998, when there is a
slight improvement evident. However lack of replicate samples does not allow estimation of
the statistical significance of M-AMBI differences. Varna lake inflow does not influence the
northern bay as much as the southern bay, therefore other pressures play an important role
in the ecological degradation of the northern area and should be adequately addressed for
identification and mitigation.
13

0.00
1.00
2.00
3.00
4.00
5.00
6.00
st.5
/199
1
st.8
/199
1
st.5
/199
8
st.8
/199
8
VB
1/20
07
VB
2/20
07
VB
1/20
08
VB
2/20
08
stations/years
AMBI
0.00
0.50
1.00
1.50
2.00
2.50
3.00
H'
AMBI H'
Figure 4. Diversity H’ and AMBI for Varna bay stations by years.
High
Good
Moderate
Poor
Bad
Figure 5. M-AMBI for Varna bay stations by years.
14

The historical trends in the ecological state of Burgas bay are drawn from three
locations for which data series are available: Cocketrice (BG2BS000C009), Burgas bay and
Maslen nos (both BG2BS000C010). Historical data series are not available for the rest of the
stations, therefore tendencies in the ecological status of water bodies BG2BS000C008 and
BG2BS000C011 cannot be delineated.
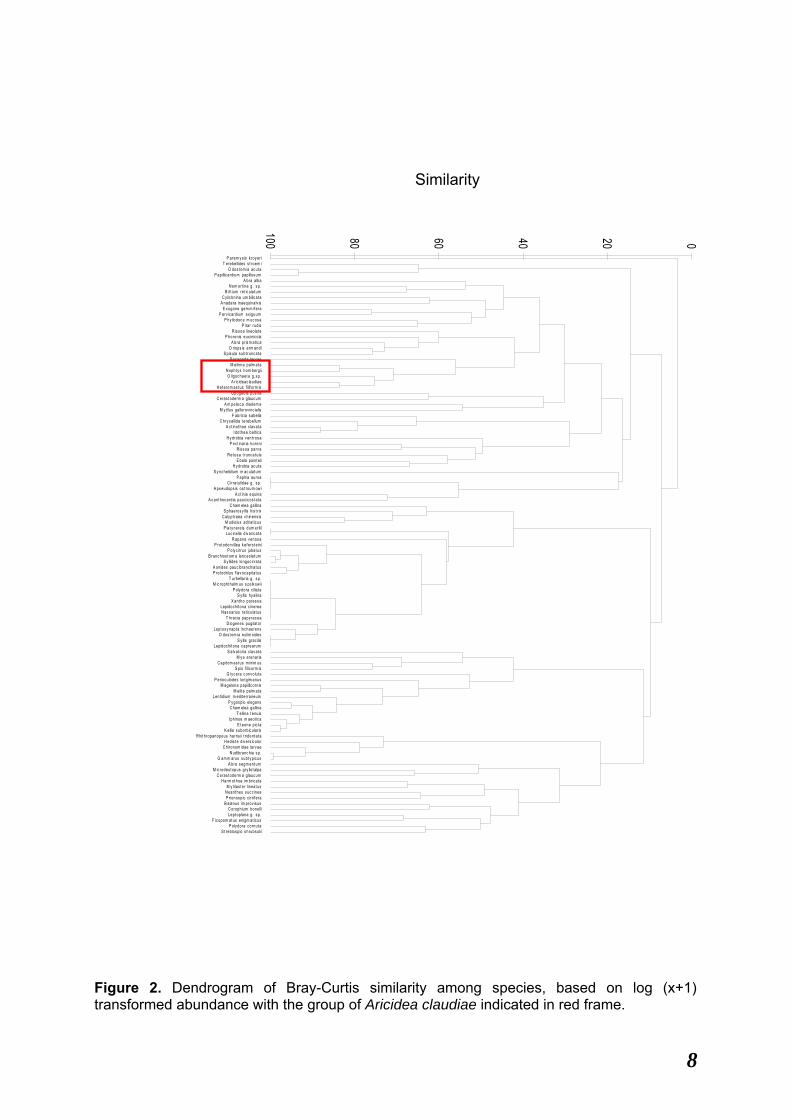
The historical data available for station Cocketrice (BG2BS000C009) encompasses a
considerable period of 17 years since 1992 to 2008, though missing data for 6 years makes
the dataset somewhat sporadic and irregular. AMBI fluctuates in the range 2.03 – 3.3, i.e.
good ecological state is observed throughout the period 1992 – 2008 (Figure 6, Table 8), no
trend of improvement or worsening is evident. Diversity shows strong variability in 1992, the
three replicate samples with H’ falling within the moderate, good and high range of values,
the good state accepted as an average (Figure 6, Table 8). In 1993 H’ values for both
replicates are in the range of the moderate state. Since 1995 H’ fluctuates weaker within the
range of the good ecological state with the exception of 2007 when diversity shows moderate
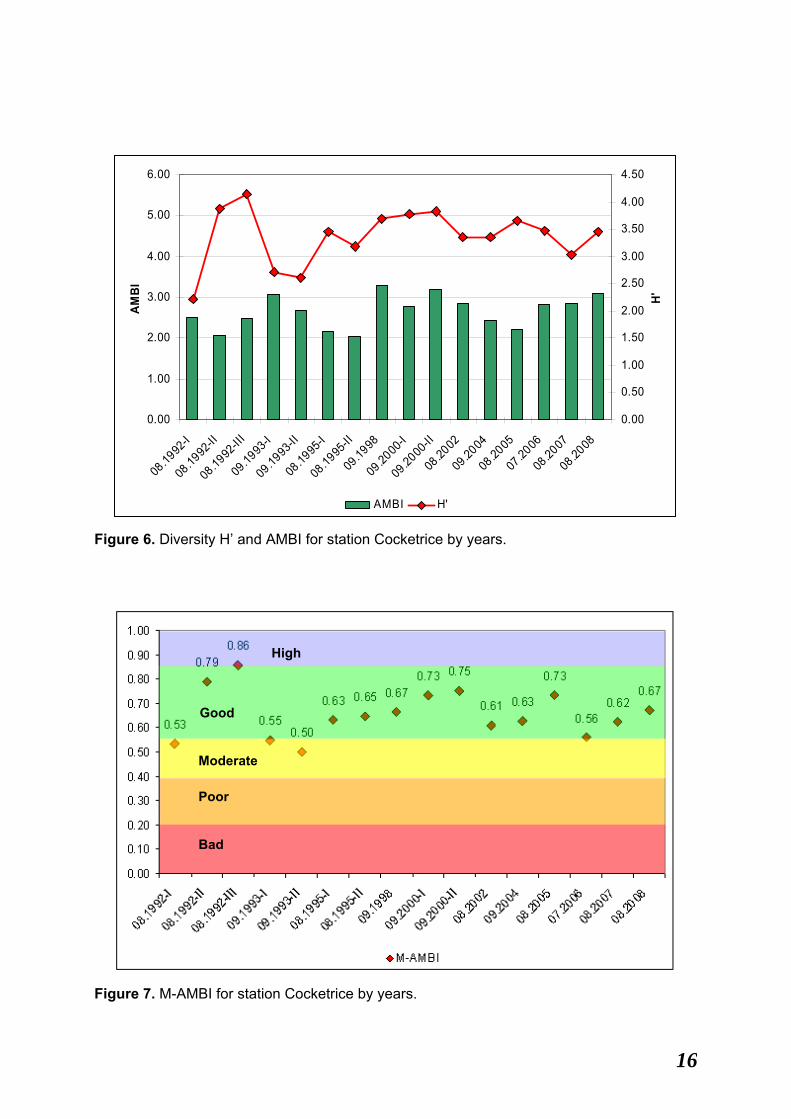
ecological state. The historical trends in M-AMBI largely follow the pattern of H’ with stronger
variability between moderate and high status in the beginning of the 1990s (1992, 1993) and
more narrow fluctuation within the range of the good ecological state since 1995 to the
present (Figure 7, Table 8). On the overall the indices show stabilization of the ecological
state within the range of the good state values since mid1990s.
Table 8. Historical trends in the ecological status at station Cocketrice (BG2BS000C009) according to Diversity (H’), AMBI and M-AMBI values and overall assessment.
Index
Month/Year
H' Status AMBI Status M-AMBI Status ES for WB BG2BS000C009
08.1992-I 2.21 Moderate 2.51 Good 0.53 Moderate 08.1992-II 3.88 Good 2.06 Good 0.79 Good 08.1992-III 4.14 High 2.48 Good 0.86 High
Good
09.1993-I 2.71 Moderate 3.08 Good 0.55 Moderate 09.1993-II 2.61 Moderate 2.68 Good 0.50 Moderate
Moderate
08.1995-I 3.46 Good 2.17 Good 0.63 Good 08.1995-II 3.19 Good 2.03 Good 0.65 Good
Good
09.1998 3.70 Good 3.30 Good 0.67 Good Good 09.2000-I 3.78 Good 2.77 Good 0.73 Good 09.2000-II 3.82 Good 3.19 Good 0.75 Good
Good
08.2002 3.34 Good 2.84 Good 0.61 Good Good 09.2004 3.34 Good 2.43 Good 0.63 Good Good 08.2005 3.65 Good 2.20 Good 0.73 Good Good 07.2006 3.47 Good 2.82 Good 0.56 Good Good 08.2007 3.02 Moderate 2.84 Good 0.62 Good Moderate 08.2008 3.45 Good 3.09 Good 0.67 Good Good
15
0.00
1.00
2.00
3.00
4.00
5.00
6.00
08.19
92-I
08.19
92-II
08.19
92-III
09.19
93-I
09.19
93-II
08.19
95-I
08.19
95-II
09.19
98
09.20
00-I
09.20
00-II
08.20
02
09.20
04
08.20
05
07.20
06
08.20
07
08.20
08
AMBI
0.00
0.50
1.00
1.50
2.00
2.50
3.00
3.50
4.00
4.50
H'
AMBI H'
Figure 6. Diversity H’ and AMBI for station Cocketrice by years.
High
Good
Moderate
Poor
Bad
Figure 7. M-AMBI for station Cocketrice by years.
16

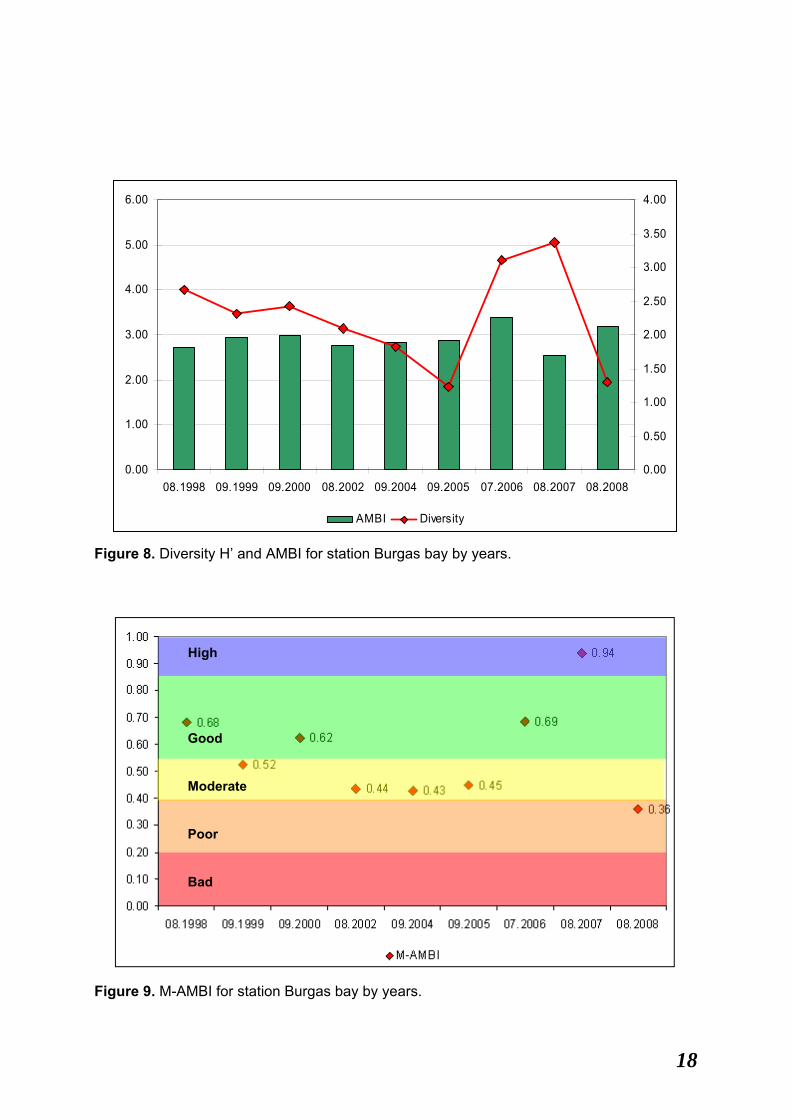
The historical data set available for station Burgas bay encompasses the period 1998-
2008 with missing data in 2001 and 2003. Nevertheless the data are adequately indicative of
the ecological state alterations during the last decade. Throughout the period AMBI
fluctuates in the good ecological state range of values with the exception of 2006 when AMBI
takes a moderate ecological state value (Figure 8, Table 9). Unlike AMBI, diversity H’ varies
in a broad range, taking values from high (2007) to poor (2005 and 2008), as well as good in
1998, 2006 and moderate in the period 1999-2004 (Table 9).
M-AMBI is also highly variable, taking values from high to poor in adjacent years (2007
and 2008 respectively) but for the most of the period in the range of the moderate/good
ecological status (Figure 9, Table 9).
Uncertainly in the assessment derives from the lack of sample replication to account for
the biological variability, however the decline in the ecological status in 2008, made evident
by each of the indices used, as well as almost persistent moderate ES in the period 1999 –
2005 raise serious concern.
Table 9. Historical trends in the ecological status at station Burgas bay according to Diversity (H’), AMBI and M-AMBI values and overall assessment.
Index
Month/Year
H' Status AMBI Status M-AMBI Status Overall ES
08.1998 2.67 Good 2.72 Good 0.68 Good Good 09.1999 2.32 Moderate 2.94 Good 0.52 Moderate Moderate 09.2000 2.43 Moderate 2.99 Good 0.62 Good Moderate 08.2002 2.09 Moderate 2.78 Good 0.44 Moderate Moderate 09.2004 1.83 Moderate 2.84 Good 0.43 Moderate Moderate 09.2005 1.23 Poor 2.87 Good 0.45 Moderate Poor 07.2006 3.12 Good 3.39 Moderate 0.69 Good Moderate 08.2007 3.37 High 2.55 Good 0.94 High Good 08.2008 1.31 Poor 3.18 Good 0.36 Poor Poor
17
0.00
1.00
2.00
3.00
4.00
5.00
6.00
08.1998 09.1999 09.2000 08.2002 09.2004 09.2005 07.2006 08.2007 08.20080.00
0.50
1.00
1.50
2.00
2.50
3.00
3.50
4.00
AMBI Diversity
Figure 8. Diversity H’ and AMBI for station Burgas bay by years.
High
Good
Moderate
Poor
Bad
Figure 9. M-AMBI for station Burgas bay by years.
18

The historical dataset for station Maslen nos encompasses the decade 1999 – 2008
with missing data in 2001 and 2003. AMBI varies within the range of the good ES with an
only exception in 1999 when AMBI takes a moderate ES value (Figure 10, Table 10).
Diversity H’ stays in the range of the good ES during the first half of the period, but since
2005 broad fluctuations take place, indicating poor ES in 2005 and 2008, good ES in 2006
and moderate ES in 2007 (Figure 10, Table 10). This is reflected in M-AMBI that declines
from good ES in the beginning of the period (1999-2002) to moderate/poor since 2004, the
worsening raising concern (Figure 11, Table 10). Broader fluctuation of M-AMBI and diversity
suggest an ecological instability during last 5 years.
Table 10. Historical trends in the ecological status at station Maslen nos according to Diversity (H’), AMBI and M-AMBI values and overall assessment.
Index
Month/Year
H' Status AMBI Status M-AMBI Status Overall ES
09.1999 3.12 Good 3.68 Moderate 0.60 Good Moderate 09.2000 2.56 Good 2.95 Good 0.63 Good Good 08.2002 2.65 Good 2.68 Good 0.59 Good Good 09.2004 2.34 Good 2.78 Good 0.48 Moderate Moderate 09.2005 1.52 Poor 2.94 Good 0.31 Poor Poor 07.2006 2.61 Good 2.72 Good 0.55 Good Good 08.2007 2.29 Moderate 2.82 Good 0.51 Moderate Moderate 08.2008 1.78 Poor 2.93 Good 0.45 Moderate Poor
19

0.00
1.00
2.00
3.00
4.00
5.00
6.00
09.1999 09.2000 08.2002 09.2004 09.2005 07.2006 08.2007 08.2008
AMBI
0.00
0.50
1.00
1.50
2.00
2.50
3.00
3.50
H'
AMBI H'
Figure 10. Diversity H’ and AMBI for station Maslen nos by years.
High
Good
Moderate
Poor
Bad
Figure 11. M-AMBI for station Maslen nos by years.
20
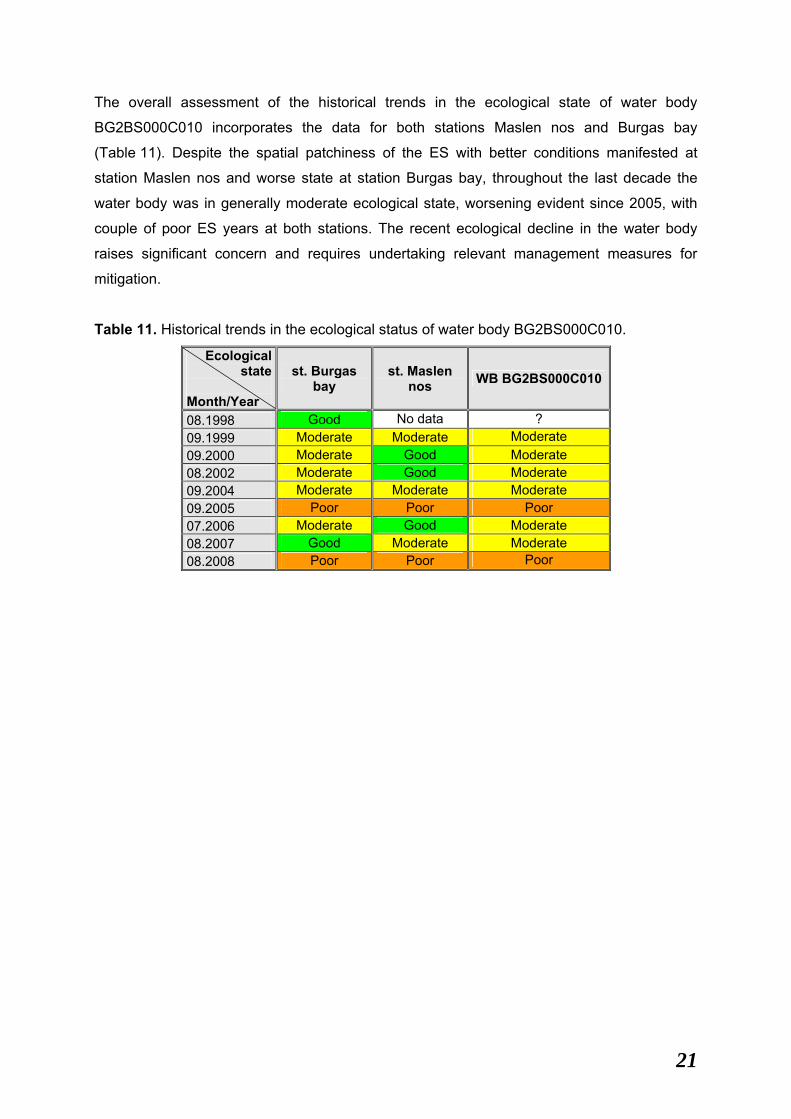
The overall assessment of the historical trends in the ecological state of water body
BG2BS000C010 incorporates the data for both stations Maslen nos and Burgas bay
(Table 11). Despite the spatial patchiness of the ES with better conditions manifested at
station Maslen nos and worse state at station Burgas bay, throughout the last decade the
water body was in generally moderate ecological state, worsening evident since 2005, with
couple of poor ES years at both stations. The recent ecological decline in the water body
raises significant concern and requires undertaking relevant management measures for
mitigation.
Table 11. Historical trends in the ecological status of water body BG2BS000C010.
Ecological state
Month/Year
st. Burgas bay
st. Maslen nos WB BG2BS000C010
08.1998 Good No data ? 09.1999 Moderate Moderate Moderate 09.2000 Moderate Good Moderate 08.2002 Moderate Good Moderate 09.2004 Moderate Moderate Moderate 09.2005 Poor Poor Poor 07.2006 Moderate Good Moderate 08.2007 Good Moderate Moderate 08.2008 Poor Poor Poor
21

3. 3. Ecological state of the highly modified water bodies Varna lake (BG2PR100L001) and Beloslav lake (BG2PR100L002) in August 2008
The ecological status of Beloslav Lake based on two sampling stations is assessed as
bad (Table 12). No living macrozoobenthos organisms in the western part of the Lake
(station Beloslav lake West) have been found. Despite of greater species richness (S=13) the
eastern part (station Beloslav lake East) is also in bad status due to low diversity (H’=0.89)
and dominance of species tolerant to pollution (96.6 %).
Table 12. Ecological status of Beloslav Lake in 2008.
Station S H' % of
sensitive species
% of tolerant species
Ecological status WB Ecological
Status
Beloslav lake West 0 n.c.* 0 0 Bad Beloslav lake East 13 0.89 0.1 96.6 Bad
BG2PR100L002 Bad
*n.c. – not calculated due to low species richness
The ecological status of Varna Lake is categorized as bad (Table 13). The soft bottom
sediment of north-western part of the Lake (station Varna lake North-West) is defaunated;
the central part is inhabited by a single species (station Varna lake Center); the
macrozoobenthic community of western part (station Varna lake West) and the channel
between the Lakes consists of two species. The eastern part of Varna Lake (station Varna
lake East) is classified in moderate status due to higher species richness and diversity and
presence of sensitive to pollution species.
Table 13. Ecological status of Varna Lake in 2008.
Station S H' % of
sensitive species
% of tolerant species
Ecological status WB Ecological
Status
Channel Beloslav-Varna lakes 2 0.65 0 100 Bad
Varna lake West 2 0.86 0 100 Bad Varna lake North-West 0 n.c. 0 0 Bad
Varna lake Center 1 n.c. 0 0 Bad Varna lake East 16 2.61 2.8 42.6 Moderate
Old Channel 31 2.91 4.5 42.1 Moderate New channel 34 3.38 2.9 32.9 Moderate
BG2PR100L001 Bad
22

3. 4. Overview of the historical trends in the ecological state of the highly modified water bodies Varna lake (BG2PR100L001) and Beloslav lake (BG2PR100L002) in August 2008
Data sets for two periods have been used for historical review of the status. The first
set includes 24 stations sampled in the period 1999-2002 (Figure 12). The second set
encompasses the period 1990-1991 (Figure 13).
Figure 12. Sampling stations in Beloslav Lake, Varna Lake and the channels in 1999-2002.
Figure 13. Sampling stations in Beloslav Lake, Varna Lake and the channels in 1990-1991.
The ecological status of Beloslav Lake in the period 1990-1991 has been assessed as
bad (Tables 14, 15, 16 and 17). The worst conditions for macrofauna development offered
the western part of the Lake (adjacent to the Port Varna-West) - the sediments are azoic
throughout all seasons (station A6). The same was valid for the area in the vicinity of
Provadijska River mouth (station A7), where only one species tolerant to pollution was
registered in winter of 1991. The rest of the stations are characterized by absence of
23

macrofauna or by presence of few invertebrate species and dominance of Chironomid
larvae, considered as tolerant to pollution (Borja et al., 2000).
In the period 1999-2002 the ecological status of Beloslav Lake ranged from bad to poor
(Tables 18, 19, 20 and 21). Station A3, located in the south-eastern part of the Lake, reach
moderate status in winter and spring (Tables 19 and 21). The winter offers better conditions
for benthic invertebrates resulting in higher ecological status of water body (Table 19). The
opposite is the case in summer (Table 20).
Table 14. Ecological status of Beloslav Lake in summer of 1990.
Station S H' Ecological status WB Ecological
Status А6 0 n.c. Bad A8 4 0.21 Bad
A10 1 nc Bad A11 2 0.08 Bad A12 4 0.08 Bad
BG2PR100L001 Bad
Table 15. Ecological status of Beloslav Lake in autumn of 1990.
Station S H' Ecological status WB Ecological
Status A6 0 n.c. Bad A7 0 n.c. Bad A8 1 n.c. Bad A9 1 n.c. Bad A10 0 n.c. Bad A11 1 n.c. Bad A12 2 n.c. Bad
BG2PR100L001 Bad
Table 16. Ecological status of Beloslav Lake in winter of 1991.
Station S H' Ecological status WB Ecological
Status A6 0 n.c. Bad A7 1 n.c. Bad A8 1 n.c. Bad A9 1 n.c. Bad A10 1 n.c. Bad A11 1 n.c. Bad A12 1 n.c. Bad
BG2PR100L001 Bad
24

Table 17. Ecological status of Beloslav Lake in spring of 1991.
Station S H' Ecological status WB Ecological
Status A6 0 n.c. Bad A7 0 n.c. Bad A8 2 0.46 Bad A9 0 n.c. Bad A10 1 n.c. Bad A11 2 0.32 Bad A12 3 0.70 Bad
BG2PR100L001 Bad
Table 18. Ecological status of Beloslav Lake in autumn of 1999.
Station S H' Ecological status WB Ecological
Status A1 2 0.97 Bad A2 1 n.c. Bad A2a 1 n.c. Bad PR 4 1.45 Poor A3 7 2.25 Poor A3a 9 1.28 Poor
BG2PR100L001 Bad
Table 19. Ecological status of Beloslav Lake in winter of 2000.
Station S H' Ecological status WB Ecological
Status KS 5 1.99 Poor A1 4 1.68 Poor A2 6 1.90 Poor PR 7 1.86 Poor A3 9 1.97 Moderate
BG2PR100L001 Poor
Table 20. Ecological status of Beloslav Lake in summer of 2001.
Station S H' Ecological status WB Ecological
Status A1 0 n.c. Bad A2 12 2.09 Poor A2a 1 n.c. Bad PR 1 n.c. Bad A3 7 1.90 Poor A3a 1 n.c. Bad
BG2PR100L001 Bad
25
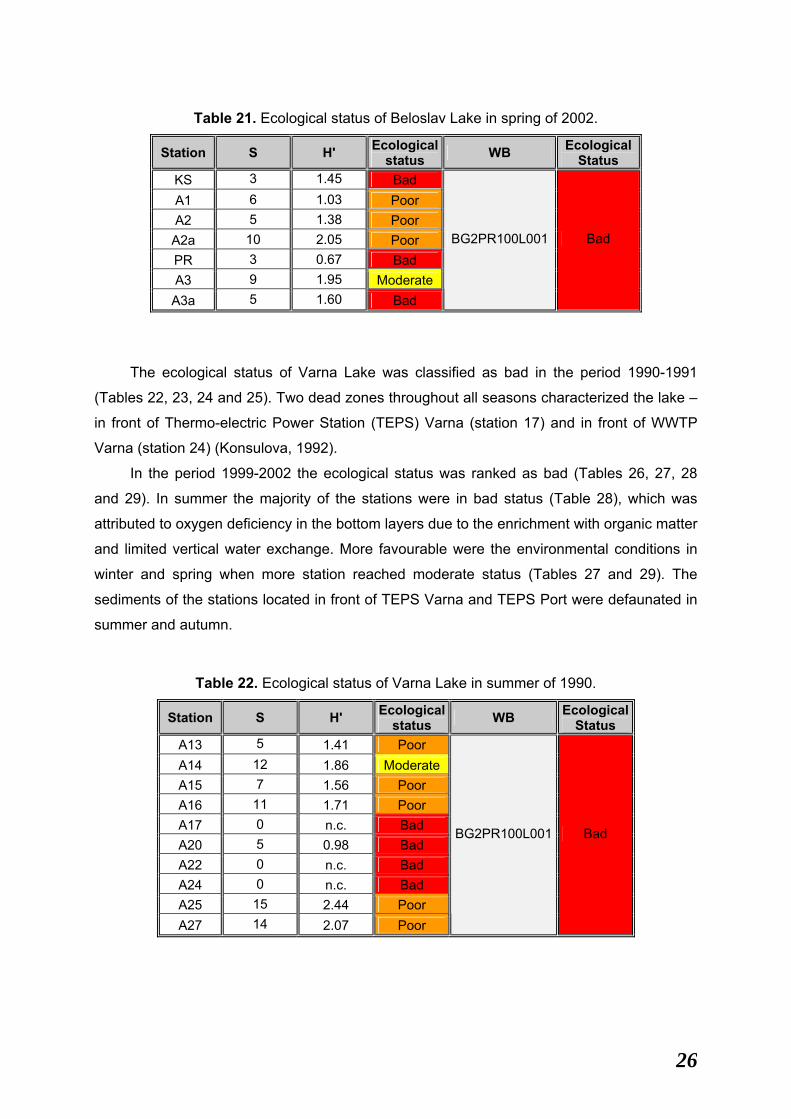
Table 21. Ecological status of Beloslav Lake in spring of 2002.
Station S H' Ecological status WB Ecological
Status KS 3 1.45 Bad A1 6 1.03 Poor A2 5 1.38 Poor A2a 10 2.05 Poor PR 3 0.67 Bad A3 9 1.95 Moderate A3a 5 1.60 Bad
BG2PR100L001 Bad
The ecological status of Varna Lake was classified as bad in the period 1990-1991
(Tables 22, 23, 24 and 25). Two dead zones throughout all seasons characterized the lake –
in front of Thermo-electric Power Station (TEPS) Varna (station 17) and in front of WWTP
Varna (station 24) (Konsulova, 1992).
In the period 1999-2002 the ecological status was ranked as bad (Tables 26, 27, 28
and 29). In summer the majority of the stations were in bad status (Table 28), which was
attributed to oxygen deficiency in the bottom layers due to the enrichment with organic matter
and limited vertical water exchange. More favourable were the environmental conditions in
winter and spring when more station reached moderate status (Tables 27 and 29). The
sediments of the stations located in front of TEPS Varna and TEPS Port were defaunated in
summer and autumn.
Table 22. Ecological status of Varna Lake in summer of 1990.
Station S H' Ecological status WB Ecological
Status A13 5 1.41 Poor A14 12 1.86 Moderate A15 7 1.56 Poor A16 11 1.71 Poor A17 0 n.c. Bad A20 5 0.98 Bad A22 0 n.c. Bad A24 0 n.c. Bad A25 15 2.44 Poor A27 14 2.07 Poor
BG2PR100L001 Bad
26

Table 23. Ecological status of Varna Lake in autumn of 1990.
Station S H' Ecological status WB Ecological
Status A13 1 n.c. Bad A14 3 0.87 Bad A15 3 1.03 Bad A16 0 n.c. Bad A17 0 n.c. Bad A18 0 n.c. Bad A19 8 2.05 Poor A20 4 1.19 Bad A21 2 1.00 Bad A22 0 n.c. Bad A23 0 n.c. Bad A24 0 n.c. Bad A25 5 0.95 Poor A26 1 n.c. Bad A27 5 0.95 Bad
BG2PR100L001 Bad
Table 24. Ecological status of Varna Lake in winter of 1991
Station S H' Ecological status WB Ecological
Status A13 3 1.07 Bad A14 5 2.02 Poor A15 5 0.20 Bad A16 1 n.c. Bad A17 0 n.c. Bad A18 2 0.35 Bad A19 7 1.59 Bad A20 8 1.39 Bad A21 1 n.c. Bad A22 4 1.02 Bad A25 12 2.01 Moderate A26 1 n.c. Bad A27 13 2.11 Poor
BG2PR100L001 Bad
27

Table 25. Ecological status of Varna Lake in spring of 1991.
Station S H' Ecological status WB Ecological
Status A13 1 n.c. Bad A14 5 1.68 Poor A15 3 1.22 Bad A16 3 1.37 Bad A17 0 n.c. Bad A18 4 1.21 Bad A19 7 1.15 Bad A20 10 1.43 Bad A21 0 n.c. Bad A22 1 n.c. Bad A23 8 1.06 Bad A24 0 n.c. Bad A25 6 1.51 Bad A26 2 0.99 Bad A27 15 1.58 Poor
BG2PR100L001 Bad
Table 26. Ecological status of Varna Lake in autumn of 1999.
Station S H' Ecological status WB Ecological
Status A4 3 1.10 Bad A5 14 1.23 Poor A6 0 n.c. Bad A6a 3 1.50 Bad A7 3 1.27 Bad A8 10 0.55 Bad A8a 6 0.43 Bad A9 4 0.86 Bad A9a 9 1.70 Poor A10 10 1.79 Poor A11 11 1.43 Poor A12 10 2.59 Moderate A13 13 2.04 Poor A14 5 2.03 Poor A15 15 2.26 Moderate A16 23 3.14 Moderate A17 10 2.61 Poor
BG2PR100L001 Bad
28
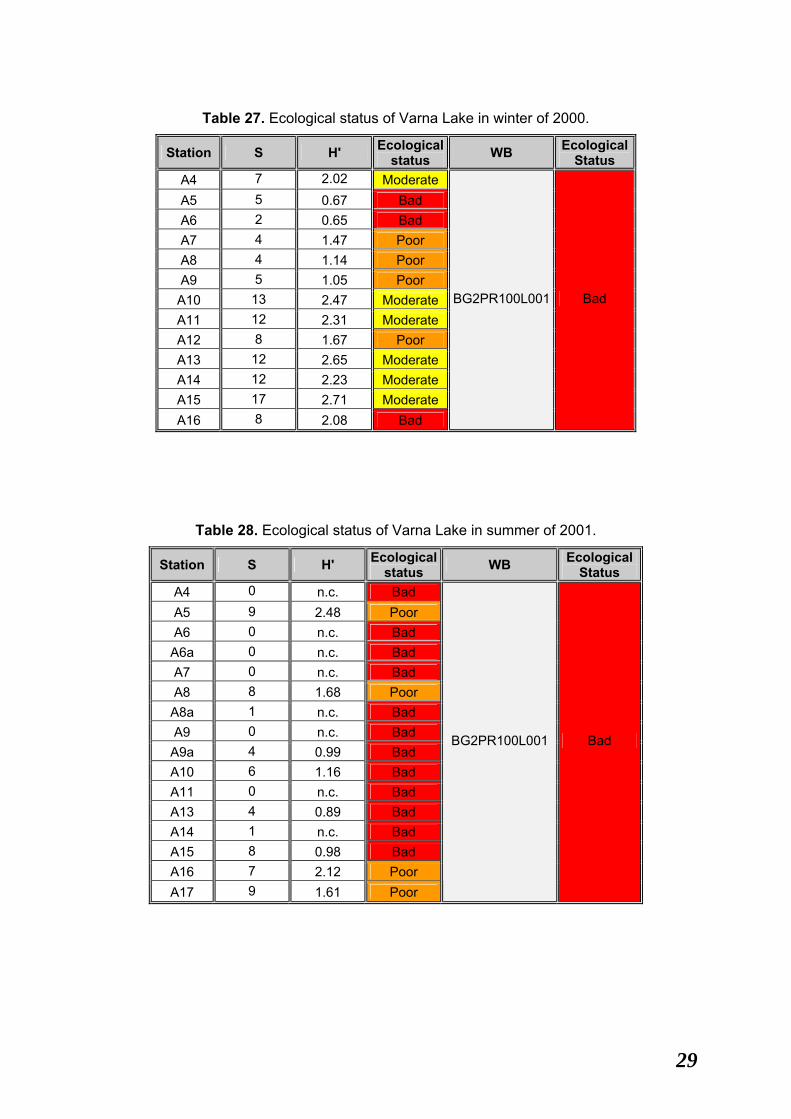
Table 27. Ecological status of Varna Lake in winter of 2000.
Station S H' Ecological status WB Ecological
Status A4 7 2.02 Moderate A5 5 0.67 Bad A6 2 0.65 Bad A7 4 1.47 Poor A8 4 1.14 Poor A9 5 1.05 Poor A10 13 2.47 Moderate A11 12 2.31 Moderate A12 8 1.67 Poor A13 12 2.65 Moderate A14 12 2.23 Moderate A15 17 2.71 Moderate A16 8 2.08 Bad
BG2PR100L001 Bad
Table 28. Ecological status of Varna Lake in summer of 2001.
Station S H' Ecological status WB Ecological
Status A4 0 n.c. Bad A5 9 2.48 Poor A6 0 n.c. Bad A6a 0 n.c. Bad A7 0 n.c. Bad A8 8 1.68 Poor A8a 1 n.c. Bad A9 0 n.c. Bad A9a 4 0.99 Bad A10 6 1.16 Bad A11 0 n.c. Bad A13 4 0.89 Bad A14 1 n.c. Bad A15 8 0.98 Bad A16 7 2.12 Poor A17 9 1.61 Poor
BG2PR100L001 Bad
29

Table 29. Ecological status of Varna Lake in spring of 2002.
Station S H' Ecological status WB Ecological
Status A4 2 1.00 Bad A5 12 1.81 Moderate A6 4 1.92 Poor A6a 4 1.31 Poor A7 11 2.37 Moderate A8 13 1.42 Poor A8a 2 0.92 Bad A9 4 1.66 Bad A9a 2 0.54 Bad A10 13 1.85 Moderate A11 9 1.56 Bad A12 7 1.69 Poor A13 17 2.53 Moderate A14 8 2.69 Poor A15 16 2.28 Moderate A16 20 1.78 Poor A17 16 1.51 Poor
BG2PR100L001 Bad
There is a tendency of status improvement in 1999-2002 in comparison to 90-ies in
both lakes. It is expressed in lack of dead zones throughout all seasons and higher species
richness and diversity, which results in better ecological status of certain stations.
The overall comparison reveals that the conditions under evaluation remain not
appropriate for development of stable macrozoobenthic community in both water bodies
(Table 30) and they meet the risk of failing to achieve good ecological status to 2015.
Table 30. Ecological status of Beloslav Lake (BG2PR100L002) and Varna Lake (BG2PR100L001) by years.
WB 2008 2002 2001 2000 1999 1991 1990 BG2PR100L002 Bad Bad Bad Poor Bad Bad Bad BG2PR100L001 Bad Bad Bad Bad Bad Bad Bad
30

C o n c l u s i o n s a n d r e c o m m e n d a t i o n s :
The ecological state of water body BG2BS000C005 (Varna bay) in August 2008 is
poor. Persistent poor ecological state is evident since the 1990s to the present day, although
the historical dataset is sporadic. Pressures, other than the industries situated around the
lakes, play an important role in the ecological degradation of the northern Varna bay area
and should be adequately addressed for identification and mitigation. The water body of
Varna bay is identified as a vulnerable area, which ecological state may not be improved
without taking adequate management measures.
The ecological state of the water body BG2BS000C008 (internal Burgas bay) in August
2008 is generally poor, despite the patchiness manifested at station Rosenets that is in good
ecological state. The historical trends cannot be delineated due to lack of previous data at
the monitoring stations.
The external areas of large Burgas bay in direction to the open sea (stations
Cocketrice, Maslen nos and Sozopol) are generally less disturbed.
In water body BG2BS000C009 (station Cocketrice) continuous good ecological state
has been maintained over the last decade, excluding 2007 when a decline to moderate ES
was observed.
In water body BG2BS000C010 the ecological state in August 2008 is poor at both
stations. High ecological instability is manifested during the last decade with broad
fluctuations from poor to high ES, moderate ES being predominant at station Burgas bay and
a trend of ecological deterioration from good in the beginning of the investigated period
(1999-2002) to moderate/poor since 2004 to the present at station Maslen nos. Throughout
the last decade the water body was in generally moderate ecological state, worsening
evident since 2005, with couple of poor ES years at both stations.
Water body BG2BS000C011 (station Sozopol) is in moderate ecological state in
August 2008. Yet, the conclusion is rather dubious due to the marginal location of the
monitoring station Sozopol on the boundary with water body BG2BS000C010, as well as lack
of other representative sampling stations. Clearly, a single station, besides peripheral, is not
sufficient to characterise the ecological state of the entire water body BG2BS000C011.
Therefore, we recommend replacement of station Sozopol by at least two newly selected
monitoring sites within the water body BG2BS000C011. Historical data are not available for
the water body.
On the overall the geographic area of large Burgas bay as a whole is deemed a water
body at risk not to meet the good ecological state requirements until 2015 without relevant
management measures. The spatial patchiness in the ecological state should be taken into
consideration when management measures for mitigation are being planned.
31

The western part of Beloslav Lake and the area adjacent to TEPS Varna are identified
as the most affected by anthropogenic pressures areas, where status of waters may not be
improved without appropriate measures. The cumulative effect of enrichment with organic
matter and pollution with inert materials and toxic substances leads to poor quantitative
development of benthic macrofauna, elimination of certain taxonomic groups and mass
mortality of benthic invertebrates in summer and autumn.
Uncertainly in the above assessments derives from lack of sampling replication to
account for the biological variability. This critical drawback should be overcome in future
monitoring.
32
R e f e r e n c e s : Borja, A., J. Franco & V. Pérez, 2000. A marine biotic index to establish the
ecological quality of soft bottom benthos within European estuarine and coastal environments, Marine Pollution Bulletin, 40(12): 1100-1114.
Borja, A., Franco, J., Muxika, I., 2003. Classification tools for marine ecological quality assessment: the usefulness of macrobenthic communities in an area affected by a submarine outfall. ICES CM 2003/Session J-02, Tallinn, Estonia, 24–28 September.
Borja, A., A. B. Josefson, A. Miles, I. Muxika, F. Olsgard, G. Phillips, J. G. Rodríguez and B. Rygg, 2006 (in press). An approach to the intercalibration of benthic ecological status assessment in the North Atlantic ecoregion, according to the European Water Framework Directive. Marine Pollution Bulletin.
Clarke, K. R., R. M. Warwick, 1994. Change in marine communities: an approach to statistical analysis and interpretation. Plymouth, Plymouth Marine Laboratory, 144 pp.
Common implementation strategy for the Water Framework Directive (2000/60/EC). Guidance Document № 13, Overall Approach to the Classification of Ecological Status and Ecological Potential, 2005, EC, 53 pp.
Common implementation strategy for the Water Framework Directive (2000/60/EC). Guidance Document № 5, Transitional and Coastal Waters Typology, Reference Conditions and Classification Systems, 2003, EC, 116 pp.
Directive 2000/60/EC of the European Parliament and of the Council of 23 October 2000 establishing a framework for Community action in the field of water policy, 72 pp.
Fauvel, P., 1923. Polychètes errantes. Faune de France, Vol. 5, Paris.
Fauvel, P., 1927. Polychètes sédenteires. Faune de France, Vol. 16, Paris.
Konsulova Ts., 1992. Macrozoobenthic communities present state in Varna and Beloslav lakes adjacent to Black Sea, Rapp. Comm. Int. Mer Medit., 33, p. 43.
Marinov, T., 1977. Fauna of Bulgaria, 6. Polychaeta. Sofia, Publishing house of the Bulgarian Academy of Sciences, 258 pp. (In Bulgarian).
Morduhay-Boltovskoy, M. D., (Ed.), 1968. A key to Black Sea and Azov Sea fauna, vol. I, Kiev, Naukova Dumka, 437 pp. (In Russian).
Morduhay-Boltovskoy, M. D., (Ed.), 1972. A key to Black Sea and Azov Sea fauna, vol. II, Kiev, Naukova Dumka, 536 pp. (In Russian).
Morduhay-Boltovskoy, M. D., (Ed.), 1969. A key to Black Sea and Azov Sea fauna, vol. III, Kiev, Naukova Dumka, 340 pp. (In Russian).
33
Muxika, I., Borja, Á., Bonne, W., 2005. The suitability of the marine biotic index (AMBI) to new impact sources along European coasts. Ecological Indicators, 5: 19-31.
Shannon, C. E. & W. Weaver, 1963. The mathematical theory of communication, University Illinois Press, Urbana, 117 pp.
Todorova V. & Konsulova T., 2005. Manual for collection and treatment of soft bottom macrozoobenthos samples. Online: http://bsc.ath.cx/documents/ ExpertNetwork/docs/Expert%20Network%20%20Zoobenthos/Todorova%20Manual_zoobenthos.doc
Trayanova A., V. Todorova, Ts. Konsluova, 2007. Benthic Invertebrate Fauna: Identification of reference (high status) and bad status values, Development of classification tool for the selected metrics, Initial assessment of the ecological status of the coastal waters, Final Report of Project “Evaluation of the impact from land-based activities on the marine & coastal environment, ecosystems & biodiversity in Bulgaria”, Ecolas NV, 17 pp.
34

Annex 1. Data on the species composition, abundance and biomass (wet weight) of macrozoobenthos at sampling stations.
Date: 31.07.2008 Station: Beloslav lake West; Depth: 7m; Type of sediments: Mud Coordinates: 43o11' 26'' N; 27o40' 14'' E No living macrozoobenthos organisms Date: 31.07.2008 Station: Beloslav lake East; Depth: 2m; Type of sediments: Empty tubes of Mercierella enigmatica - huge quantity. Coordinates: 43o11' 42'' N; 27o41' 50'' E № Species composition Abundance Biomass
1 Chironomidae larvae 560 1.1322 Leptoplana g. sp. 20 0.0123 Nudibranchia sp. 220 0.814 Hediste diversicolor 5940 405 Mercierella enigmatica 20 0.036 Neanthes succinea 20 0.087 Polydora cornuta 1760 1.2168 Streblospio shrubsolii 880 0.1829 Oligochaeta g. sp. 2360 0.188
10 Balanus improvisus 6880 241.811 Corophium bonelli 122480 26.3212 Gammarus subtypicus 200 0.6413 Rhithropanopeus harrisii tridentata 260 640.6 Total: 141040 953.01 Date: 31.07.2008 Station: Channel Beloslav-Varna lakes; Depth: 12 m; Type of sediments: Mud Coordinates: 43o11' 38'' N; 27o44' 22'' E № Species composition Abundance Biomass
1 Corophium bonelli 100 0.012 Mytilus galloprovincialis 20 0.02
Total: 120 0.03 Date: 31.07.2008 Station: Varna lake West; Depth: 12.5 m; Type of sediments: Mud Coordinates: 43o11' 35'' N; 27o46' 28'' E № Species composition Abundance Biomass
1 Balanus improvisus 40 0.032 Corophium bonelli 100 0.014
Total: 140 0.044
35
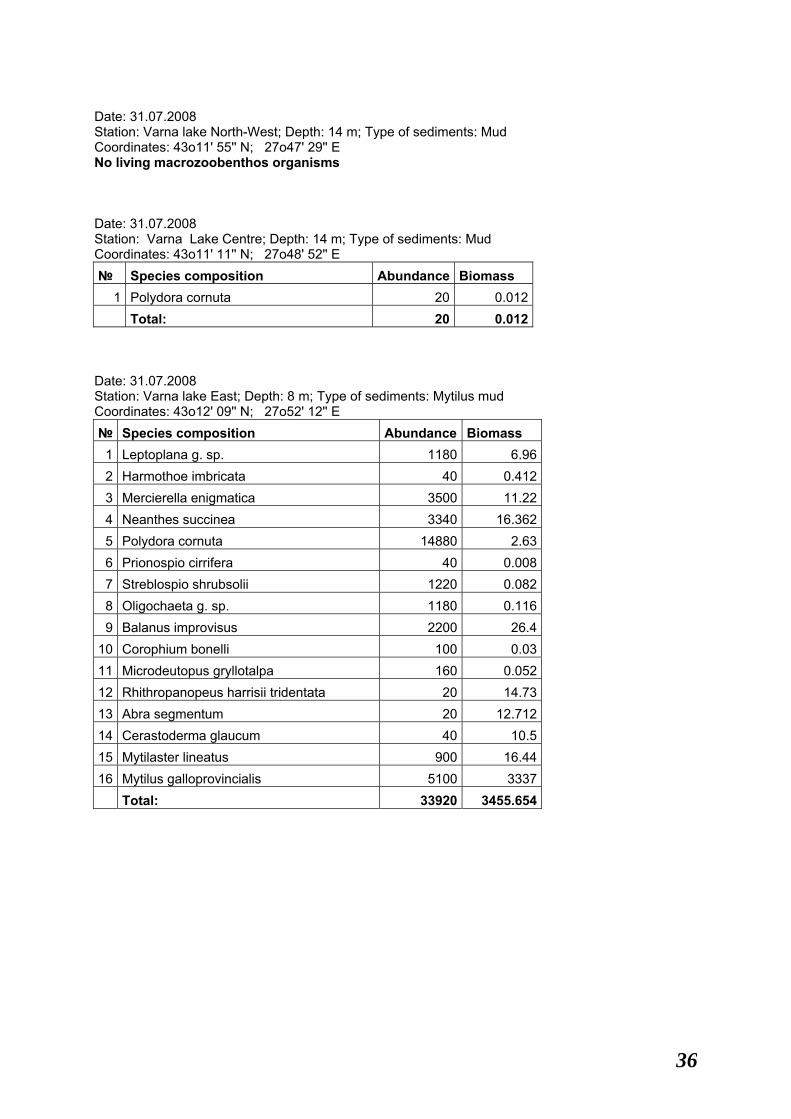
Date: 31.07.2008 Station: Varna lake North-West; Depth: 14 m; Type of sediments: Mud Coordinates: 43o11' 55'' N; 27o47' 29'' E No living macrozoobenthos organisms Date: 31.07.2008 Station: Varna Lake Centre; Depth: 14 m; Type of sediments: Mud Coordinates: 43o11' 11'' N; 27o48' 52'' E № Species composition Abundance Biomass
1 Polydora cornuta 20 0.012 Total: 20 0.012 Date: 31.07.2008 Station: Varna lake East; Depth: 8 m; Type of sediments: Mytilus mud Coordinates: 43o12' 09'' N; 27o52' 12'' E № Species composition Abundance Biomass
1 Leptoplana g. sp. 1180 6.962 Harmothoe imbricata 40 0.4123 Mercierella enigmatica 3500 11.224 Neanthes succinea 3340 16.3625 Polydora cornuta 14880 2.636 Prionospio cirrifera 40 0.0087 Streblospio shrubsolii 1220 0.0828 Oligochaeta g. sp. 1180 0.1169 Balanus improvisus 2200 26.4
10 Corophium bonelli 100 0.0311 Microdeutopus gryllotalpa 160 0.05212 Rhithropanopeus harrisii tridentata 20 14.7313 Abra segmentum 20 12.71214 Cerastoderma glaucum 40 10.515 Mytilaster lineatus 900 16.4416 Mytilus galloprovincialis 5100 3337 Total: 33920 3455.654
36

Date: 31.07.2008 Station: Old Channel Varna Lake - Varna Bay ; Depth: 2 m; Type of sediment: Sand - vary hard Coordinates: 43o11' 23'' N; 27o54' 33'' E
№ Species composition Abundance Biomass
ind/m2 g/m2
1 Nemertini g. sp. 20 0.0032 Aricidea claudiae 40 0.0093 Capitomastus minimus 4800 0.4664 Eteone picta 80 0.475 Glycera convoluta 10 0.0026 Heteromastus filiformis 70 0.0487 Magelona papillicornis 10 0.0528 Neanthes succinea 150 0.5519 Platynereis dumerilii 10 0.004
10 Polydora cornuta 330 0.11211 Prionospio cirrifera 160 0.04112 Pygospio elegans 40 0.00513 Salvatoria clavata 200 0.00914 Spio filicornis 3910 1.4815 Oligochaeta g.sp. 1210 0.11116 Ampelisca diadema 30 0.01717 Iphinoe maeotica 130 0.01818 Melita palmata 20 0.02419 Microdeutopus gryllotalpa 10 0.00320 Perioculodes longimanus 30 0.00421 Upogebia pusilla 50 58.722 Ebala pointeli 10 0.00323 Bittium reticulatum 30 0.46724 Cerastoderma glaucum 1620 8.49725 Chamelea gallina 60 6.75126 Kellia suborbicularis 100 0.19727 Lentidium mediterraneum 470 2.828 Lucinella divaricata 10 1.05229 Mya arenaria - juv. 480 0.57530 Mytilus galloprovincialis - juv. 30 0.098
31 Tellina tenuis 200 52.3
Total: 14320 134.869
37

Date: 31.07.2008 Station: New Channel Varna Lake - Varna Bay; Depth: 12 m; Type of sediment: Mud+empty shells of Cardium; oil patches in the surfice of water. Smell of H2S Coordinates: 43o11' 04'' N; 27o54' 12'' E
№ Species composition Abundance Biomass
ind/m2 g/m2
1 Actinothoe clavata 20 14.6 2 Nemertini g. sp. 30 0.02 3 Phoronis euxinicola 20 0.006 4 Capitomastus minimus 150 0.015 5 Fabricia sabella 650 0.035 6 Harmothoe imbricata 10 0.003 7 Heteromastus filiformis 2500 1.057 8 Melinna palmata 240 0.09 9 Nepthis hombergii 60 3.263
10 Neanthes succinea 30 0.009 11 Pectinaria koreni 20 0.005 12 Phyllodoce (Anaitides) mucosa 40 0.149 13 Polydora cornuta 240 0.069 14 Prionospio cirrifera 20 0.005 15 Streblospio shrubsolii 720 0.087 16 Spio filicornis 130 0.04 17 Oligochaeta g.sp. 310 0.03 18 Idothea baltica 10 0.002 19 Perioculodes longimanus 10 0.004 20 Upogebia pusilla 10 4.1 21 Bittium reticulatum 40 0.407 22 Cylichnina umbilicata 30 0.166 23 Chrysallida terebellum 60 0.056 24 Hydrobia acuta 30 0.11 25 Retusa truncatula 10 0.03 26 Rissoa lineolata 40 0.066 27 Abra alba 20 1.173 28 Abra prismatica 200 3.681 29 Cerastoderma glaucum 800 6.1 30 Ebala pointeli 40 0.009 31 Mya arenaria 300 0.03 32 Mytilaster lineatus 40 0.024 33 Parvicardium exiguum 20 0.008
34 Spisula subtruncata 20 0.134
Total: 6870 35.583
38

Date: 31.07.2008 Station: Varna Bay 1; Depth 15 m; Type of sediment: Sand, Upogebia; Smell of H2S Coordinates: 43o11' 07'' N; 27o56' 11'' E
№ Species composition Abundance Biomass
ind/m2 g/m2
1 Nemertini g. sp. 10 0.0512 Aricidea claudiae 2080 0.5123 Capitomastus minimus 10 0.0164 Glycera convoluta 10 0.0935 Heteromastus filiformis 260 1.9436 Melinna palmata 10 0.0247 Mercierella enigmatica 10 0.0718 Nepthis hombergii 170 2.4319 Phyllodoce (Anaitides) mucosa 10 0.013
10 Polydora cornuta 30 0.01711 Prionospio cirrifera 50 0.00912 Oligochaeta g.sp. 4150 3.08113 Ampelisca diadema 90 0.06114 Decapoda larvae 110 0.00815 Upogebia pusilla 240 119.216 Bittium reticulatum 10 0.10417 Calyptraea chinensis juv. 10 0.02218 Cylichnina umbilicata 40 0.09219 Anadara inaequivalvis juv. 20 0.24320 Cerastoderma glaucum juv. 200 0.11521 Mytilus galloprovincialis 40 0.16
22 Pitar rudis juv. 30 0.121
Total: 7590 128.387
39
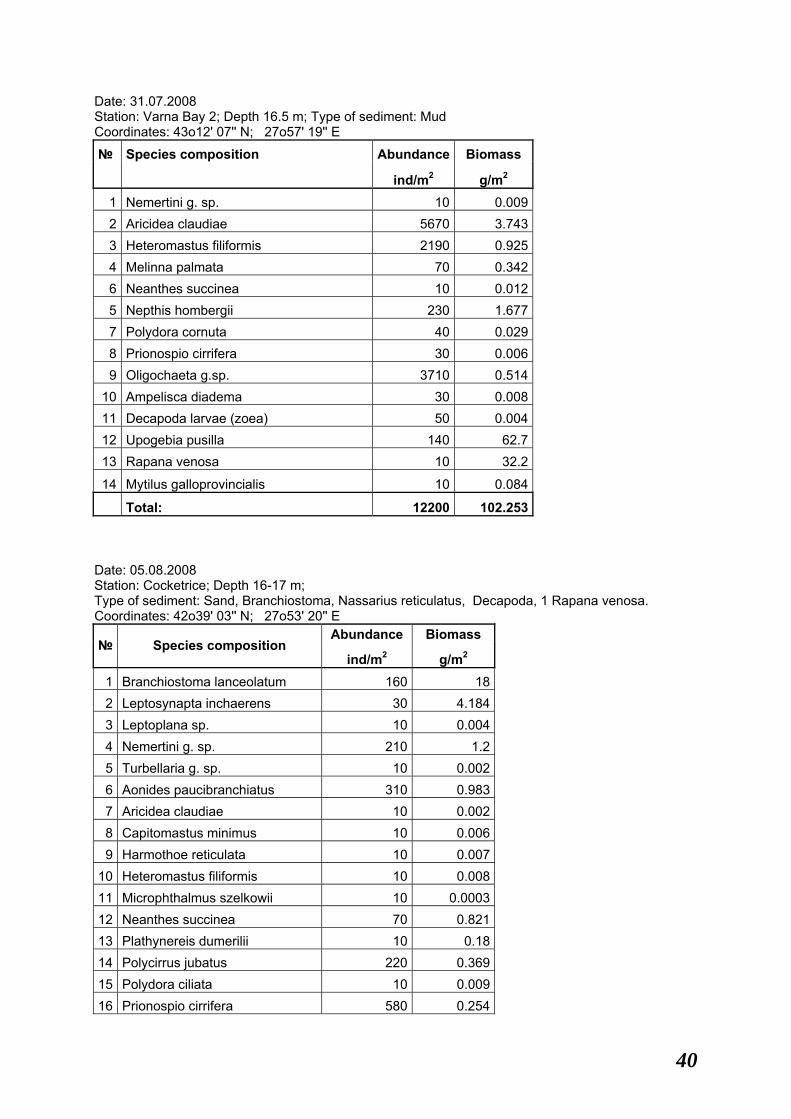
Date: 31.07.2008 Station: Varna Bay 2; Depth 16.5 m; Type of sediment: Mud Coordinates: 43o12' 07'' N; 27o57' 19'' E
№ Species composition Abundance Biomass
ind/m2 g/m2
1 Nemertini g. sp. 10 0.0092 Aricidea claudiae 5670 3.7433 Heteromastus filiformis 2190 0.9254 Melinna palmata 70 0.3426 Neanthes succinea 10 0.0125 Nepthis hombergii 230 1.6777 Polydora cornuta 40 0.0298 Prionospio cirrifera 30 0.0069 Oligochaeta g.sp. 3710 0.514
10 Ampelisca diadema 30 0.00811 Decapoda larvae (zoea) 50 0.00412 Upogebia pusilla 140 62.713 Rapana venosa 10 32.2
14 Mytilus galloprovincialis 10 0.084
Total: 12200 102.253 Date: 05.08.2008 Station: Cocketrice; Depth 16-17 m; Type of sediment: Sand, Branchiostoma, Nassarius reticulatus, Decapoda, 1 Rapana venosa. Coordinates: 42o39' 03'' N; 27o53' 20'' E
Abundance Biomass № Species composition
ind/m2 g/m2
1 Branchiostoma lanceolatum 160 182 Leptosynapta inchaerens 30 4.1843 Leptoplana sp. 10 0.0044 Nemertini g. sp. 210 1.25 Turbellaria g. sp. 10 0.0026 Aonides paucibranchiatus 310 0.9837 Aricidea claudiae 10 0.0028 Capitomastus minimus 10 0.0069 Harmothoe reticulata 10 0.007
10 Heteromastus filiformis 10 0.00811 Microphthalmus szelkowii 10 0.000312 Neanthes succinea 70 0.82113 Plathynereis dumerilii 10 0.1814 Polycirrus jubatus 220 0.36915 Polydora ciliata 10 0.00916 Prionospio cirrifera 580 0.254
40

17 Protodrilus flavocapitatus 500 0.01518 Protodorvillea kefersteini 1380 0.3119 Salvatoria clavata 830 0.0820 Sphaerosyllis histrix 280 0.0221 Spio filicornis 470 1.1222 Syllis gracilis 20 0.07523 Syllis hyalina 10 0.00124 Syllides longocirrata 180 0.00625 Oligochaeta g. sp. 4320 0.26426 Balanus improvisus 100 2.99527 Diogenes pugilator 50 6.55728 Upogebia pusilla larvae 70 0.01229 Xantho poressa 10 4.32530 Lepidochitona cinerea 10 0.17831 Middendorffia caprearum 20 0.00432 Bittium reticulatum 10 0.04133 Calyptraea chinensis 160 2.02434 Nassarius reticulatus 10 12.235 Odostomia eulimoides 20 0.03436 Anadara inaequivalvis 30 176.237 Chamelea gallina 720 13038 Lucinella divaricata 10 0.00739 Modiola adriatica 570 4.8540 Mytilaster lineatus 500 2.941 Rapana venosa 10 686.9
42 Thracia papyracea 10 0.467
Total: 11970 1057.6143
41

Date: 05.08.2008 Station: Nesebar; Depth 22 m; Type of sediment: Soft mud; Upogebia (adults and postlarvae), Poilychaeta; Coordinates: 42o40' 48'' N; 27o46' 44'' E
№ Species composition Abundance Biomass
ind/m2 g/m2
1 Leptoplana sp. 30 0.0142 Aricidea claudiae 3680 1.3963 Heteromastus filiformis 4050 1.6055 Neanthes succinea 10 0.124 Nepthis hombergii 250 3.216 Oriopsis armandi 40 0.0057 Phyllodoce (Anaitides) mucosa 50 0.0288 Prionospio cirrifera 30 0.0099 Oligochaeta g.sp. 2110 0.209
10 Paramysis kroyeri 10 0.00511 Balanus improvisus 10 0.27812 Decapoda larvae 100 0.00613 Upogebia pusilla 60 30.414 Hydrobia acuta 50 0.04615 Abra prismatica 70 0.76816 Cerastoderma glaucum juv. 40 0.02417 Chamelea gallina 10 22.118 Pitar rudis juv. 20 0.015
19 Spisula subtruncata 10 0.019
Total: 10630 60.257 Date: 05.08.2008 Station: Rosenets; Depth 13.5 m; Type of sediment: Soft mud - poor. Coordinates: 42o27' 47'' N; 27o31' 01'' E
№ Species composition Abundance Biomass
ind/m2 g/m2
1 Phoronis euxinicola 40 0.0182 Aricidea claudiae 290 0.0463 Heteromastus filiformis 200 0.0575 Melinna palmata 300 0.1254 Nepthis hombergii 110 3.2166 Pectinaria coreni juv. 10 0.00017 Oligochaeta g.sp. 490 0.058 Decapoda larvae 340 0.0819 Bittium reticulatum 260 1.603
10 Cylichnina umbilicata 60 0.1811 Ebala pointeli 50 0.008
42
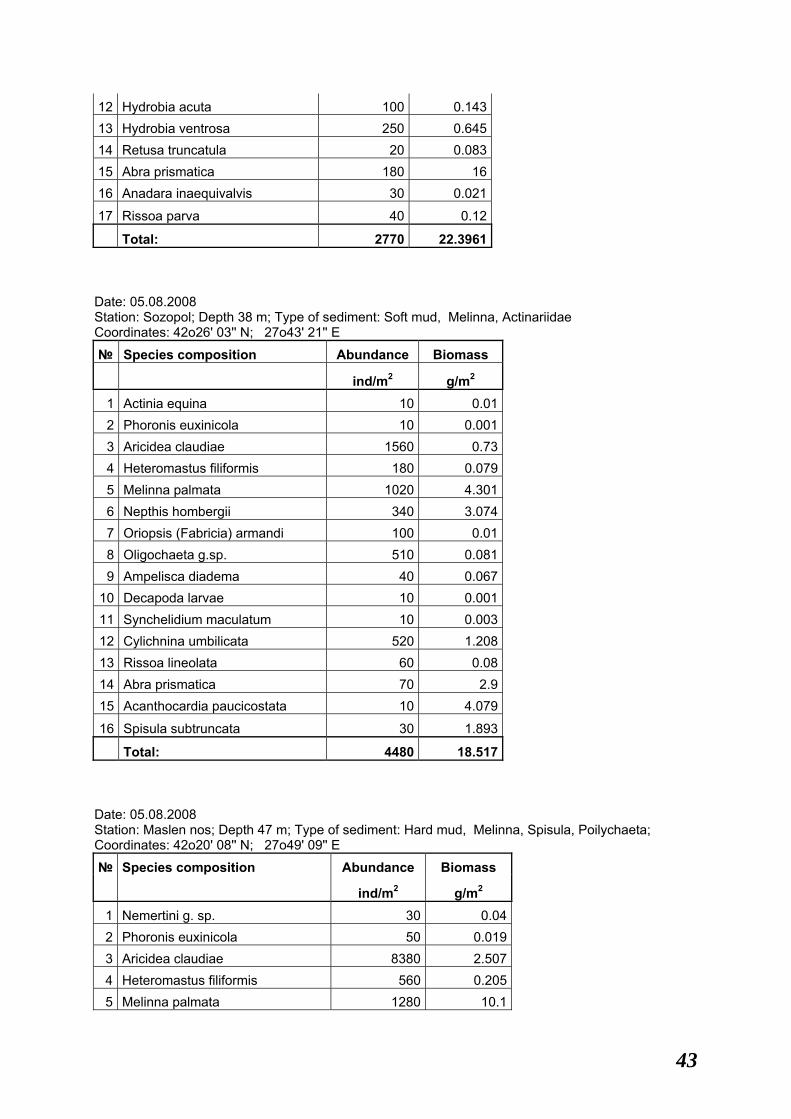
12 Hydrobia acuta 100 0.14313 Hydrobia ventrosa 250 0.64514 Retusa truncatula 20 0.08315 Abra prismatica 180 1616 Anadara inaequivalvis 30 0.021
17 Rissoa parva 40 0.12
Total: 2770 22.3961 Date: 05.08.2008 Station: Sozopol; Depth 38 m; Type of sediment: Soft mud, Melinna, Actinariidae Coordinates: 42o26' 03'' N; 27o43' 21'' E
№ Species composition Abundance Biomass
ind/m2 g/m2
1 Actinia equina 10 0.012 Phoronis euxinicola 10 0.0013 Aricidea claudiae 1560 0.734 Heteromastus filiformis 180 0.0795 Melinna palmata 1020 4.3016 Nepthis hombergii 340 3.0747 Oriopsis (Fabricia) armandi 100 0.018 Oligochaeta g.sp. 510 0.0819 Ampelisca diadema 40 0.067
10 Decapoda larvae 10 0.00111 Synchelidium maculatum 10 0.00312 Cylichnina umbilicata 520 1.20813 Rissoa lineolata 60 0.0814 Abra prismatica 70 2.915 Acanthocardia paucicostata 10 4.079
16 Spisula subtruncata 30 1.893
Total: 4480 18.517 Date: 05.08.2008 Station: Maslen nos; Depth 47 m; Type of sediment: Hard mud, Melinna, Spisula, Poilychaeta; Coordinates: 42o20' 08'' N; 27o49' 09'' E
№ Species composition Abundance Biomass
ind/m2 g/m2
1 Nemertini g. sp. 30 0.042 Phoronis euxinicola 50 0.0193 Aricidea claudiae 8380 2.5074 Heteromastus filiformis 560 0.2055 Melinna palmata 1280 10.1
43
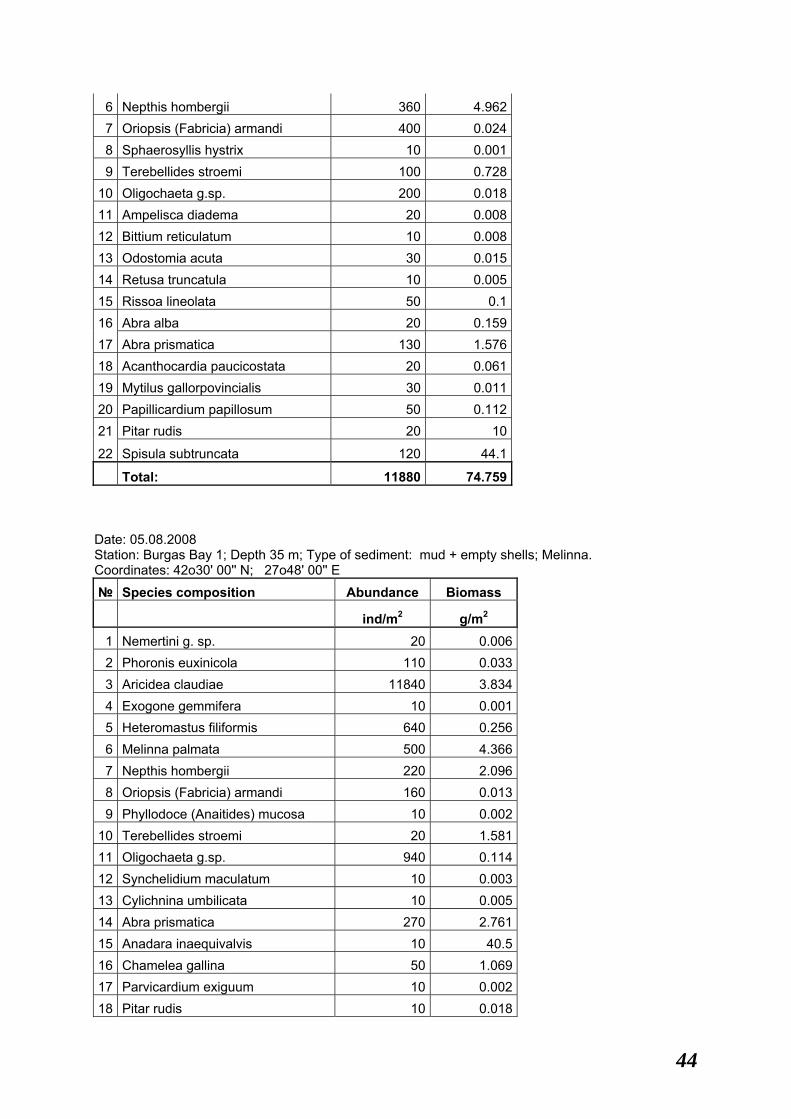
6 Nepthis hombergii 360 4.9627 Oriopsis (Fabricia) armandi 400 0.0248 Sphaerosyllis hystrix 10 0.0019 Terebellides stroemi 100 0.728
10 Oligochaeta g.sp. 200 0.01811 Ampelisca diadema 20 0.00812 Bittium reticulatum 10 0.00813 Odostomia acuta 30 0.01514 Retusa truncatula 10 0.00515 Rissoa lineolata 50 0.116 Abra alba 20 0.15917 Abra prismatica 130 1.57618 Acanthocardia paucicostata 20 0.06119 Mytilus gallorpovincialis 30 0.01120 Papillicardium papillosum 50 0.11221 Pitar rudis 20 10
22 Spisula subtruncata 120 44.1
Total: 11880 74.759 Date: 05.08.2008 Station: Burgas Bay 1; Depth 35 m; Type of sediment: mud + empty shells; Melinna. Coordinates: 42o30' 00'' N; 27o48' 00'' E
№ Species composition Abundance Biomass
ind/m2 g/m2
1 Nemertini g. sp. 20 0.0062 Phoronis euxinicola 110 0.0333 Aricidea claudiae 11840 3.8344 Exogone gemmifera 10 0.0015 Heteromastus filiformis 640 0.2566 Melinna palmata 500 4.3667 Nepthis hombergii 220 2.0968 Oriopsis (Fabricia) armandi 160 0.0139 Phyllodoce (Anaitides) mucosa 10 0.002
10 Terebellides stroemi 20 1.58111 Oligochaeta g.sp. 940 0.11412 Synchelidium maculatum 10 0.00313 Cylichnina umbilicata 10 0.00514 Abra prismatica 270 2.76115 Anadara inaequivalvis 10 40.516 Chamelea gallina 50 1.06917 Parvicardium exiguum 10 0.00218 Pitar rudis 10 0.018
44

19 Spisula subtruncata 20 0.015
Total: 14860 56.675 Date: 05.08.2008 Station: Burgas ; Depth 27 m; Type of sediment: shell sand + mud; Coordinates: 42o30' 23'' N; 27o40' 20'' E
№ Species composition Abundance Biomass
ind/m2 g/m2
1 Actinia equina 10 0.3292 Nemertini g. sp. 100 0.083 Phoronis euxinicola 10 0.0214 Aricidea claudiae 13240 1.1285 Capitomastus minimus 30 0.0056 Cirratulidae g. sp. 10 0.17 Exogone gemmifera 30 0.0028 Heteromastus filiformis 640 0.1559 Melinna palmata 180 0.143
10 Nepthis hombergii 180 1.79511 Pectinaria (Lagis) koreni 10 0.10212 Polydora cornuta 10 0.00313 Prionospio cirrifera 1300 0.23514 Phyllodoce (Anaitides) mucosa 10 0.00915 Sphaerosyllis histrix 10 0.00116 Oligochaeta g.sp. 160 0.02217 Apseudopsis ostroumowi 10 0.00718 Balanus improvisus 10 0.27719 Decapoda larvae 100 0.0120 Bittium reticulatum 40 1.37621 Calyptraea chinensis 120 0.78922 Cylichnina umbilicata 20 0.01123 Rissoa parva 10 0.02224 Abra alba 200 1.40825 Acanthocardia paucicostata 20 0.00826 Anadara inaequivalvis 20 0.0127 Chamelea gallina 20 1028 Modiola adriatica 80 0.87329 Mytilus galloprovincialis 40 137.630 Parvicardium exiguum 20 0.10331 Pitar rudis 110 0.945
32 Tapes lineatus 10 20
Total: 16760 177.569
45

Annex 2. Number of samples per water body or station by sampling years, months and totally
Water body Stations
Year Month B
elos
lav
lake
Varn
a la
ke
Cha
nnel
s La
kes
- Va
rna
Bay
Varn
a B
ay
1
Varn
a B
ay
2
Coc
ketr
ice
Bou
rgas
B
ay
Mas
len
nos
Num
ber
of
sam
ples
7 5 9 1 15 1990 11 7 13 2 22 2 7 11 2 20 5 7 13 2 22 1991 8 1 1 2
1992 8 3 3 1993 9 2 2 1995 8 2 2
8 1 1 1 3 1998 9 1 1 9 1 1 2 1999
11 6 15 2 23 9 2 1 1 4 2000 3 5 11 2 18
2001 8 6 14 2 22 2002 8 7 15 2 1 1 1 27 2004 9 1 1 1 3
8 1 1 2005 9 1 1 2
2006 7 1 1 1 3 2007 8 1 1 1 1 1 5 2008 8 2 7 2 1 1 1 1 1 16
Num
ber
of
sa
mpl
es
52 108 17 4 4 16 9 8 218
46