Engineering Scale Testing of Transformational Non-Aqueous ... · –Begin by testing on CHP flue...
19
www.rti.org RTI International is a registered trademark and a trade name of Research Triangle Institute. Engineering Scale Testing of Transformational Non-Aqueous Solvent- Based CO 2 Capture Process at Technology Centre Mongstad DE-FE0031590 Paul Mobley, Jak Tanthana, Aravind V. Rayer, Vijay Gupta, Mustapha Soukri and Marty Lail 1 Leila Faramarzi, Kjetil Hantveit, Christophe Benquet, and Stein Olav Nesse Andrew Jones, Maureen Davison, Jose Figueroa, Lynn Brickett, and John Litynski
Transcript of Engineering Scale Testing of Transformational Non-Aqueous ... · –Begin by testing on CHP flue...

www.rti.orgRTI International is a registered trademark and a trade name of Research Triangle Institute.
Engineering Scale Testing of Transformational Non-Aqueous Solvent-
Based CO2 Capture Process at Technology Centre Mongstad
DE-FE0031590
Paul Mobley, Jak Tanthana, Aravind V. Rayer, Vijay Gupta, Mustapha Soukri and Marty Lail
1
Leila Faramarzi, Kjetil Hantveit, Christophe
Benquet, and Stein Olav Nesse
Andrew Jones, Maureen Davison, Jose Figueroa, Lynn
Brickett, and John Litynski

Acknowledgement and Disclaimer
2
Acknowledgement: This presentation is based on work supported by the Department of Energy under
Award Number DE-FE0031590.
Disclaimer: “This presentation was prepared as an account of work sponsored by an agency of the
United States Government. Neither the United States Government nor any agency thereof, nor any of
their employees, makes any warranty, express or implied, or assumes any legal liability or
responsibility for the accuracy, completeness, or usefulness of any information, apparatus, product, or
process disclosed, or represents that its use would not infringe privately owned rights. Reference
herein to any specific commercial product, process, or service by trade name, trademark,
manufacturer, or otherwise does not necessarily constitute or imply its endorsement,
recommendation, or favoring by the United States Government or any agency thereof. The views and
opinions of authors expressed herein do not necessarily state or reflect those of the United States
Government or any agency thereof.”

Project Summary
3
Objective: Testing and evaluation of the transformational
Non-Aqueous Solvent (NAS)-based CO2 capture technology
at engineering scale at TCM
Key Metrics• Solvent performance including capture rate, energy
requirements, solvent losses
• Solvent degradation, corrosion, emissions
• Resolve remaining technical and process risks
• Technoeconomic and EHS evaluation
Specific Challenges• Operate TCM plant within emission requirements
• Minimize rise in absorber temperature
• Maximize NAS performance with existing hardware
limitations
Timeframe: 8/8/18 to 12/31/21*
Total Funding: $18,738,512*
*Pending DOE approval
Partners:
CO2 Technology Centre Mongstad (TCM), Norway

4
Project Objectives
DOE Performance Goal:
▪ New coal-fired power plants with CO2 capture at a cost of electricity 30% lower than
the baseline cost of electricity from a supercritical PC plant with CO2 capture, or
approximately $30 per tonne of CO2 captured by 2030.
– Reducing the parasitic energy penalty is the most important factor
Project Objectives:
▪ Confirm the potential to reduce the parasitic energy penalty by 20 to 40% compared with the
MEA process
▪ Demonstrate the long-term process operational reliability
▪ Verify solvent degradation rate, emissions, solvent loss, and corrosion characteristics
▪ Perform a NAS-specific revamp of the TCM unit to show lower energy penalty
▪ Demonstrate NAS in the modified TCM unit for at least two months

▪ Cumulative DOE funding > $20 MM and ~$15 MM
funding from RTI industrial partners
▪ Solvent development work finalized
▪ Pilot testing completed at SINTEF Tiller and
National Carbon Capture Center (NCCC)
▪ Pre-commercial demonstration (12 MW) underway
at Technology Center Mongstad (TCM), Norway
(current)
▪ Long-term potential for large scale CO2 capture
applications
▪ Commercialization path via process technology
licensing
▪ Application potential for high-efficiency acid gas
separations
Development History for Novel, Non-Aqueous Solvents
5
▪ CO2 Capture Technology with substantially reduced
energy consumption
▪ Minimum changes to existing process to realize
NAS optimal performance
▪ Commodity-scale production ready

R&D Strategic Approach
Path to Reducing ICOE and Cost
of CO2 Avoided
▪ Primarily focus on reducing energy
consumption – reboiler duty
▪ Reduce capital expenditure
▪ Simplify process arrangement
▪ Materials of construction
▪ Limit operating cost increase
1 Rochelle, G. T. Amine Scrubbing for CO2 Capture. Science 2009, 325,
1652-1654.
Breakdown of the Thermal Regeneration Energy Load
Sensible
Heat
Heat of
Vaporization
Heat of
AbsorptionReboiler
Heat Duty
For NAS, heat of vaporization of water becomes a negligible
term to the heat duty
Process capable of achieving these criteria will have a lower
energy penalty than SOTA processes
Oper.
11%
Power
56%
Capital
33%
6
Solvent Cp [J/g K]
ΔHabs
[kJ/mol] ΔHvap
[kJ/mol]
xsolv [mol solvent/mol solution]
Δα [mol CO2/ mol solvent]
Reboiler Heat Duty [GJ/t-CO2]
30 wt% MEA-H2O
3.8 85 40 0.11 0.34 3.75
RTI’s NASs 2.0 85 negl. 0.47 0.45 2.40

From lab to large scale (12 MW) demonstration through series of projects
NAS CO2 Capture Technology Path to Market
Pilot Testing at Tiller
Plant
(Norway, 2015-2018)
Demonstration of all
process components at
pilot scale
Large Bench-Scale
System (RTI
facility, 2014-2016)
Demonstration of
key process
features (≤ 2,000
kJ/kg CO2)
Lab-Scale
Development &
Evaluation
(2010-2013)
Solvent screening
and Lab-scale
evaluation
Engineering-Scale Validation
(2018+)
Pre-commercial Demonstration
at Technology Centre Mongstad,
Norway (~12 MWe)
Pilot Testing at SSTU
(NCCC, 2018)
Degradation, emission, and
corrosion characterizations under
real flue gas
Emissions control
(Tiller, 2018+)
Effective emissions mitigation
strategy for WLS at
engineering-scale
~$2.7MM ~$3 MM
6kW~$18.75 MM
12 MW~$3MM
60 kW
~$3.5MM~$0.75MM
50 kW
7

Bench-Scale Testing of Refined Solvents
8
Absorber
3” Sch. 10 SS316 (8.5 m)
Mellapak 350X
Temp: 30-55°C
Pressure: Up to 200 kPa
Gas Vel: 0.33-1.5 m/s
L: 15-75 kg/h
Regenerator
3” Sch. 10 SS316 (7.1 m)
Mellapak 350x
Temp :Up to 150°C
Pressure: Up to 1MPa
6 kW ~120 kg CO2/day
Simulated Flue Gas PropertiesFG Flow Rate: 100 to 485 SLPM
CO2 Feed Rate: 1.8 to 8.6 kg/h
Feed Temp.: 30 to 50°C
Target Comp: CO2: 13.3%; H2O: 6.1%; O2: 2.35%; N2: bal.
CO2 Content: up to 20 %vol
Water Content: ~0 to 12.3%vol
Comparison of Reboiler Duty of NASs
L/G (mass/mass)
2 4 6 8 10
Reb
oil
er D
uty
(M
J/k
gC
O2)
1.0
1.5
2.0
2.5
3.0
NAS-3
NAS-4
NAS-5
Conditions for Experimental Data • Absorber: 37-40°C• Regenerator: 87-98°C• Pressure: 2.5 bar• Interstage Heater Regeneration

Testing of RTI NAS in Tiller Pilot Plant
9
Objectives:• Compare MEA and NAS in
conventional system
• Water balance
• Confirm reboiler heat duty
• Emission measurement
Results:• MEA baseline testing completed
• NAS baseline testing completed• 350 hours of testing with propane +
50 hours with coal flue gas
• Confirmed reduction in reboiler duty

Design Improvements for NAS-based Process
Additional equipment:
• Interstage coolers
• Interstage heaters
• Rich-solvent preheater
10
ABSORBER REGENERATOR
HX-305
HX-305
Lean solvent pumpRich solvent pump
Interstage CoolersInterstage Heaters
Trim Cooler
Wash sections
Cross over heat exchanger
HX-315
HX-325
HX-335
HX-215
HX-225
HX-235
Int. CoolersNone = 1.4 at 72% [164] and 2.86 [162]235 = 2.25[163]215/225 = 2.25 [160]225/235 = 2.16 [161]215/235 = 2.15 [159]All = 2.19 [166]
Int. Heaters315 = 2.47 [169]325 = 3.23 [171]335 = 3.16 [170]315/325 = 2.38 [168]325/335 = 2.65 [167]315/335 = 2.49 [172]all = 2.19 [166]
SRD Highlights:
• Interstage coolers: 2.19 (all) to 3.23 (none)
• Interstage heaters: 2.19 (all) to 2.86 (none)
• The use of preheater (HX-305) appeared to lower the SRD

CO2
loading (molCO2
/molamine
)
0.0 0.2 0.4 0.6
PC
O2
(kP
a)
10-1
100
101
102
103
104
120oC
80oC
40oC
Regressed VLE
Rigorous Aspen Plus rate-based model for CO2 Capture using NAS
Regressed Heat of absorption
CO2
loading (molCO2
/molamine
)
0.0 0.1 0.2 0.3 0.4 0.5 0.6
H
ab
s (
kJ/m
ol C
O2)
0
20
40
60
80
100
120
120oC
80oC
40oC
o Thermodynamic Model
▪ VLE, Reaction kinetics and Habs
measured at RTI
▪ Electrolyte NRTL symmetric method for
non-ideal liquids
▪ RK equation of state for vapor
▪ Concentration-based reaction kinetics
▪ Rate-based models for absorber and
stripper
o Hydrodynamic Model
▪ Viscosity and heat capacity data
measured at RTI
▪ Other properties such as surface tension,
thermal conductivity etc., estimated using
Group contribution methods or using
interaction parameters.
▪ Electrolyte transport property models
Process Model for Non-Aqueous Solvents

BP1 Key Tasks
12
Key TasksMilestone Number
and TaskApproaches/ planned Activities
Planned Completion
Date
Initial TMP M3/T1 • Evaluation of technology potential December 31, 2018
EH&S report as outlined in
Appendix E of the FOA
M4/T2 • Evaluate environmental health and
safety concerns of planned test
campaign
• Identify potential risks
January 31, 2019
Solvent qualification test
results
M5/T3 • Perform qualifying tests at SINTEF-
Tiller to show equivalent
performance of vendor-prepared
solvent
September 30, 2019
FEED study and cost
estimate
M6/T4 • Perform FEED study with EPC at
TCM to determine coarse cost
estimate of plant modifications
December 31, 2019
BP1 Success Criteria : Completion of FEED study and favorable cost-benefit
analysis justifying modifications to TCM to show improved performance of
NAS (Task 4)
13
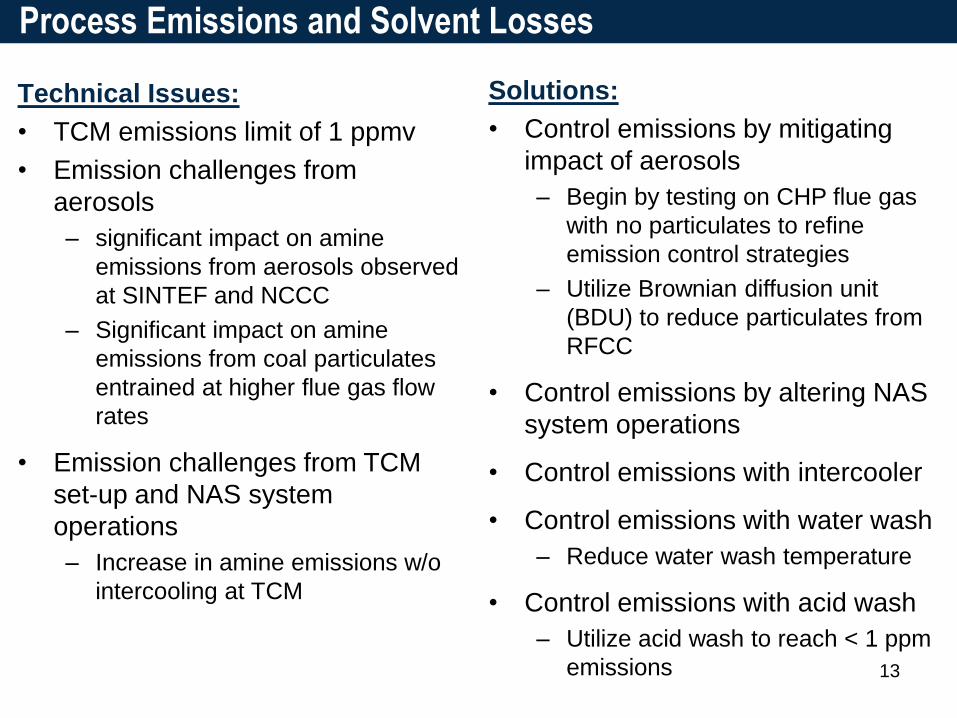
Technical Issues:
• TCM emissions limit of 1 ppmv
• Emission challenges from
aerosols
– significant impact on amine
emissions from aerosols observed
at SINTEF and NCCC
– Significant impact on amine
emissions from coal particulates
entrained at higher flue gas flow
rates
• Emission challenges from TCM
set-up and NAS system
operations
– Increase in amine emissions w/o
intercooling at TCM
Solutions:
• Control emissions by mitigating
impact of aerosols
– Begin by testing on CHP flue gas
with no particulates to refine
emission control strategies
– Utilize Brownian diffusion unit
(BDU) to reduce particulates from
RFCC
• Control emissions by altering NAS
system operations
• Control emissions with intercooler
• Control emissions with water wash
– Reduce water wash temperature
• Control emissions with acid wash
– Utilize acid wash to reach < 1 ppm
emissions
Process Emissions and Solvent Losses

14
Higher amine emissions due to absence of an intercooler at TCM
Emission reduction strategies based on
testing at Tiller and RTI:
o Operating the water wash column at lower
temperatures
o Lowering the gas flow-rate
o Adding an intercooler to the absorber
20 30 40 50 60 700
50
100
150
200
250
Temperatures, C
Am
ine E
mis
sio
ns, ppm
Amine Emissions vs. Top Intercooler Temperatures
High Flow
Low Flow
30 40 50 60 700
5
10
15
20
25
Temperature, C
Heig
ht, m
Absorber Temperature Profiles by Run #
Intercooled
No Intercooling
10
15
15
15
20
20
20
20
25
25
25
30
30
30
35
35 4045
Temperature, C
Am
ine In, ppm
Amine Out vs. Amine In and Temperature
20 22 24 26 28 30
100
200
300
400
500
600
700
800
900
1000
10
15
20
25
30
35
40
45
Control Emissions by Altering NAS System Operations
14

Use of Process Models to aid TCM modifications work
15
0
1
2
3
4
5
6
7
8
9
10
11
12
13
14
15
16
17
18
40.0 50.0 60.0
Colu
mn H
t (m
)
Temperature (Celsius)
(Liquid)
Intercooler at bottom
Intercooler at Top
0
1
2
3
4
5
6
7
8
9
10
11
12
13
14
15
16
17
18
40.0 50.0 60.0
Colu
mn H
t (m
)
Temperature (Celsius)
(Gas)
Intercooler at bottom
Intercooler at Top
o Evaluate impact of intercooler placement
(top or bottom of the absorber column)o RCC25-50 case (inlet at 25 °C, 50% flow)
chosen for evaluation
o Model shows low sensitivity to intercooler
location for SRD and heat removal.
o For both cases
o SRD = 2.71 GJ/t-CO2
o Heat Removal in intercooler = 2.72 MW
o Estimate amine emissions out of water
wash and acid wash
o Model emissions after absorber at 400 ppm,
reduced to < 1 ppm after water wash and acid
wash
Predicted temperature profile across absorber

Control Emissions with Acid Wash
16
Amine Emission (ppm)
0.1110100
pH
of
so
luti
on
0
2
4
6
8
10
Experimental Values
Sigmoidal Plot
Key finding:
o Testing at RTI show outlet amine emissions < 1 ppm when pH was below 7
Strategies for TCM:
o Operate at lower gas flow rates to lengthen residence time in wash-section
o Lower gas flow-rates will also reduce aerosol formation due to lower particle entrainment
RTI BsGAS Results

Solvent Qualification at SINTEF Tiller Plant
17
• 700-liter solvent batch produced by
Clariant
• Delivered to SINTEF Tiller in June
2019
• Solvent loaded into the plant
• Tiller functional testing underway
• Qualification testing underway
September 2
Day Night Priority No Activity description
1 1 1 1 NAS-Optimal (Prev. Cond.)
2 2 2 TCM Modified (Bot IC and Preheater)
2 2 2a TCM Modified (Bot IC and Preheater, Higher L/G)
3 2 3 TCM Modified (Top IC and Preheater)
3 2 3a TCM Modified (Top IC and Preheater, Higher L/G)
4 2 4 TCM Modified (2 ICs and Preheater)
4 2 5 TCM Modified (2 ICs, 2 IHs, and Preheater)
5 3 6 TCM Baseline (No Intercooling, Higher L/G)
5 3 7 TCM Baseline (No Intercooling, Higher L/G, Lower CR)
6 6 4 8TCM Modified (Top IC and Preheater, Higher L/G,
Demister)
August 22
Tiller Plant

FEED Study
18
Trim CoolerCrossover
Heat Exchanger
DCC
CO2 Absorption
Section
Wash Sections
CO2-rich NAS
Treated Flue Gas Sent
to Stack
Med-pressure
Steam
Condensate
Solvent
Regenerator
CO2 Product Gas to
Compression Train
Off-gas Cooler and
Wash Section
Raw Flue Gas
CO2-lean NAS
Me
d-p
ressu
re
Ste
am
Co
nd
en
sa
te
1
2
3
4
5
6
7
8 9
10
11
• Selected EPC Pressura to perform FEED study
• Commenced August 19th, 2019
• Determine coarse cost estimate for modifications +/- 20%
• Absorber intercooler
• Regenerator pre-heater

Summary
19
• Methods identified and demonstrated for reducing amine emissions
<1ppm at TCM
• Solvent qualification underway at SINTEF to demonstrate
performance of manufactured solvent
• EPC company selected for to perform FEED study at TCM
• FEED study underway to determine cost of TCM modifications
Thanks for your attention!
Marty Lail, Ph.D.
Senior Director, Carbon Capture and Conversion
Technology for Energy, Environment, and Engineering
RTI International
3040 Cornwallis Rd.
Research Triangle Park, NC 27709
919-485-5703 (o)
919-809-2204 (l)