Engineering Program Assessment · KENNETH R. WHITE, PH ... Fundamentals of Engineering ... and...
24
Engineering Program Assessment
Transcript of Engineering Program Assessment · KENNETH R. WHITE, PH ... Fundamentals of Engineering ... and...

Engineering ProgramAssessment

Using the Fundamentals
of Engineering (FE)
Examination to Assess
Academic Programs
WALTER LEFEVRE, PH.D., P.E.
JOHN W. STEADMAN, PH.D., P.E.
JILL S. TIETJEN, P.E.
KENNETH R. WHITE, PH.D., P.E.
DAVID L. WHITMAN, PH.D., P.E.
®

© 2005, All Rights ReservedNational Council of Examinersfor Engineering and Surveying®
Institutions of higher education are increasingly being encouraged to evaluate their academic programs with reference to a national norm or standard. This pressure may come from state legislators who want to assign cost-benefit labels and measure the effectiveness of higher
education, or it may result from accreditation requirements, which are becoming progressively driven by accountability and benchmarking. Whatever the reason, institutions must find practical, objective ways to assess their programs.
Assessment ProcessIn engineering education, assessment has become a major topic as a result of the Accreditation Board for Engineering and Technology’s (ABET) Engineering Criteria 2000 (EC 2000). However, instructional effectiveness is difficult to measure and is often assessed by indirect, subjective methods. While various assessment tools have been used to evaluate instructional effectiveness, results have rarely been published or applied in a consistent manner. In addition, collected data may be misused or misinterpreted, leading to erroneous conclusions.
One potentially effective tool for assessing certain aspects of engineering education is the National Council of Examiners for Engineering and Surveying (NCEES) Fundamentals of Engineering (FE) examination, sometimes called the EIT exam. This exam, developed to measure minimum technical competence, is the first step in the professional licensing of engineers. It is a pass-fail exam taken by approximately 40,000 people a year, most of whom are recent college graduates or seniors within one year of graduating. Although exam results do provide some specific data on performance in a given subject, these data are not used directly for licensing. They can, however, serve as a valuable resource in making valid comparisons and conclusions when properly used in the assessment process.
Effective assessment of academic programs requires a set of tools and processes to evaluate various aspects of education. If the tools are to have any value as benchmarks or have credibility on an objective basis, they should ultimately make it possible to compare one institution with another. Assessment tools with this comparative value are particularly difficult to obtain. Methods such as portfolios or surveys lack uniformity. And forcing comparisons—by asking an employer to compare graduates of different schools, for example—makes it difficult to ensure objectivity.
1
FE Examination
As the only nationally normed examination that addresses specific engineering topics, the FE exam is an extremely attractive tool for outcomes assessment. In fact, since 1996 the FE exam has been formatted for the express purpose of facilitating the assessment process.
For example, the discipline-specific exams for chemical, civil, electrical, environmental, industrial, and mechanical engineering were developed to include topics from upper-level courses—topics that were not appropriate when students from all engineering disciplines took the same exam. The exam content was revised to better measure students’ knowledge of subjects taught in current junior- and senior-level engineering courses. The topics included in the discipline-specific exam were determined via surveys that were sent to every ABET-accredited engineering program in the United States. The most recent survey was conducted in 2004, and a new set of exam specifications became effective for the October 2005 exam.
Through careful analysis, FE exam results may be used to assess particular aspects of the following ABET Criterion 3 outcomes: (a) an ability to apply knowledge of mathematics, science, and engineering; (b) an ability to conduct experiments and analyze and interpret data; (c) an ability to design a system, component, or process to meet desired needs; (e) an ability to define, formulate, and solve engineering problems; (f ) an understanding of professional and ethical responsibility; and (k) an ability to use the techniques, skills, and modern engineering tools necessary for engineering practice.
Although the FE exam does provide a means of assessment, employing the exam as an assessment tool has both advantages and disadvantages; therefore, its widespread use as such should be analyzed carefully. The FE exam should not, for example, be used to determine the curricular content of any program: its purpose is to test competency for licensure. The FE exam is not intended to force programs to be similar. For licensure purposes, the total score is evaluated rather than the score in any specific subset of questions. Passing the exam does not denote competence in all subjects but instead shows an average minimum competency in several subject areas.
One potential error in using the FE exam results as an assessment tool is focusing on the percentage of candidates who pass the exam. This criterion is too broad to be effective in improving subdiscipline instruction; more specific measures are needed. Too often, the passing rates of individual programs are compared with those of other institutions, and these rates become more important than the subject-matter evaluations. Administrators or faculty who select those who are allowed to attempt the examination may be demonstrating this faulty mentality. In such a situation, the focus becomes “teaching to the exam” and not truly assessing how well students have learned the subject matter in the curriculum.
2
Using the FE Exam as an Assessment Tool
In light of these limitations, how does one properly use the FE exam as an assessment tool? First, the department or program faculty should determine what subjects to teach and to what depth and breadth to teach them. These decisions are a major part of the outcome goals to be set by each
program as required by ABET EC 2000. After establishing the topics to teach, the faculty should set specific goals for student performance and then use the relevant portions of the FE exam to assess the students’ knowledge in specific areas such as water resources, electric circuits, or machine design. The faculty should then compare their goals to the knowledge demonstrated by graduates of the program. This scenario assumes that examinees are not selected to inflate the passing rates to make the school appear superior. In fact, for this assessment process to be valid, the population taking the exam must be representative of the entire population of graduates from the program. This can be accomplished either by having all seniors take the exam or by choosing a sample appropriately.
A related issue is ensuring that people who take the exam make an honest effort to complete all problems to the best of their ability. Analysis of FE examinees over a number of test administrations has revealed that few students fail to take the exam seriously. However, motivating students to review materials before the exam, to prepare adequately for the exam, and ultimately to do their best work is a legitimate concern. Faculty who have doubts about whether students are putting forth their best efforts should take steps to motivate them. Various methods are available to do this, such as informing them of the importance of the results to their future or actually requiring a passing score for graduation. Some programs that require all students to take the exam but do not require a passing score for graduation offer an incentive to do well by including pass-fail status on students’ transcripts. Clearly, if the results are to be useful for outcomes assessment, the students must be performing in a way that accurately portrays their understanding.
FE Exam Topic CoverageTo effectively use the FE exam as an assessment tool, faculty should know the specifications for the morning (AM) and afternoon (PM) exams as well as the level of understanding the items are meant to measure. Specifications for both the pre- and post-October 2005 exams are provided in the Appendix to show the evolution of material covered on the exam. Changes to the specifications were based specifically on faculty feedback to NCEES surveys. Assessments will be more meaningful if students take the discipline-specific PM exam, which addresses more advanced engineering topics rather than the general engineering PM exam. However, even the general exam will provide information on basic topics relevant to most programs.
3
FE Examination Results
The NCEES publishes performance data on all FE exams administered.
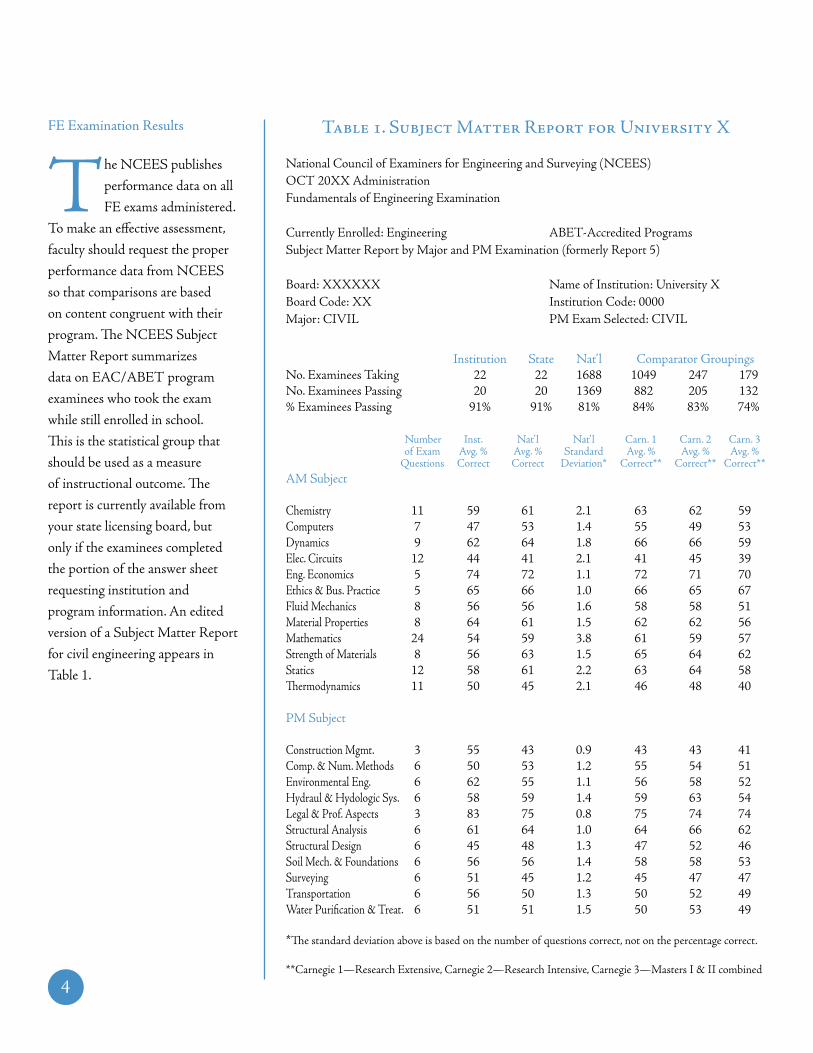
To make an effective assessment, faculty should request the proper performance data from NCEES so that comparisons are based on content congruent with their program. The NCEES Subject Matter Report summarizes data on EAC/ABET program examinees who took the exam while still enrolled in school. This is the statistical group that should be used as a measure of instructional outcome. The report is currently available from your state licensing board, but only if the examinees completed the portion of the answer sheet requesting institution and program information. An edited version of a Subject Matter Report for civil engineering appears in Table 1.
TABLE 1. SUBJECT MATTER REPORT FOR UNIVERSITY X
National Council of Examiners for Engineering and Surveying (NCEES) OCT 20XX AdministrationFundamentals of Engineering Examination
Currently Enrolled: Engineering ABET-Accredited ProgramsSubject Matter Report by Major and PM Examination (formerly Report 5)
Board: XXXXXX Name of Institution: University XBoard Code: XX Institution Code: 0000Major: CIVIL PM Exam Selected: CIVIL
Institution State Nat’l Comparator GroupingsNo. Examinees Taking 22 22 1688 1049 247 179No. Examinees Passing 20 20 1369 882 205 132% Examinees Passing 91% 91% 81% 84% 83% 74%
Number Inst. Nat’l Nat’l Carn. 1 Carn. 2 Carn. 3 of Exam Avg. % Avg. % Standard Avg. % Avg. % Avg. % Questions Correct Correct Deviation* Correct** Correct** Correct**AM Subject
Chemistry 11 59 61 2.1 63 62 59Computers 7 47 53 1.4 55 49 53Dynamics 9 62 64 1.8 66 66 59Elec. Circuits 12 44 41 2.1 41 45 39Eng. Economics 5 74 72 1.1 72 71 70Ethics & Bus. Practice 5 65 66 1.0 66 65 67Fluid Mechanics 8 56 56 1.6 58 58 51Material Properties 8 64 61 1.5 62 62 56Mathematics 24 54 59 3.8 61 59 57Strength of Materials 8 56 63 1.5 65 64 62Statics 12 58 61 2.2 63 64 58Thermodynamics 11 50 45 2.1 46 48 40
PM Subject
Construction Mgmt. 3 55 43 0.9 43 43 41Comp. & Num. Methods 6 50 53 1.2 55 54 51Environmental Eng. 6 62 55 1.1 56 58 52Hydraul & Hydologic Sys. 6 58 59 1.4 59 63 54Legal & Prof. Aspects 3 83 75 0.8 75 74 74Structural Analysis 6 61 64 1.0 64 66 62Structural Design 6 45 48 1.3 47 52 46Soil Mech. & Foundations 6 56 56 1.4 58 58 53Surveying 6 51 45 1.2 45 47 47Transportation 6 56 50 1.3 50 52 49Water Purification & Treat. 6 51 51 1.5 50 53 49
*The standard deviation above is based on the number of questions correct, not on the percentage correct.
**Carnegie 1—Research Extensive, Carnegie 2—Research Intensive, Carnegie 3—Masters I & II combined
4
Application of FE Exam Results
Prior to the exam, faculty should determine the expected performance in each topic area, depending on the emphasis of that topic in their program. For example, if a program places little emphasis on surveying or transportation facilities, students should be expected to perform accordingly. Conversely,
if the program has a strong emphasis on structural analysis, one would expect a much higher performance in this area compared to the national average. For more conclusive results, faculty should also consider performance over several administrations of the FE exam rather than from just one test administration. The form of this expected performance will depend on the analysis method chosen, a variety of which have been developed to examine the data from the Subject Matter Report with regard to program assessment. The three methods described in this paper are as follows:
• Percentage-Correct Method• Ratio Method• Scaled-Score Method
Percentage-Correct MethodThis method utilizes the “raw” data (% correct) directly from the Subject Matter Report. For example, assume that University X requires all graduating seniors in civil engineering to take (but not necessarily to pass) the FE exam with the civil engineering PM portion and that the faculty expect students’ collective performance to be as follows:
• Correctly answer at least 60% of the AM questions directly related to their major (engineering economics, ethics, fluid mechanics, mathematics, strength of materials, and statics) and correctly answer at least 40% in the other topics.
• Correctly answer at least 60% of the PM questions that are emphasized in University X’s program (hydraulics and hydrologic systems, legal and professional aspects, structural analysis, structural design, soil mechanics and foundations, and surveying), at least 40% in the other general civil engineering topics (construction management, environmental engineering, transportation, and water purification and treatment), and at least 30% in the topic not strongly emphasized (computers and numerical methods).
5
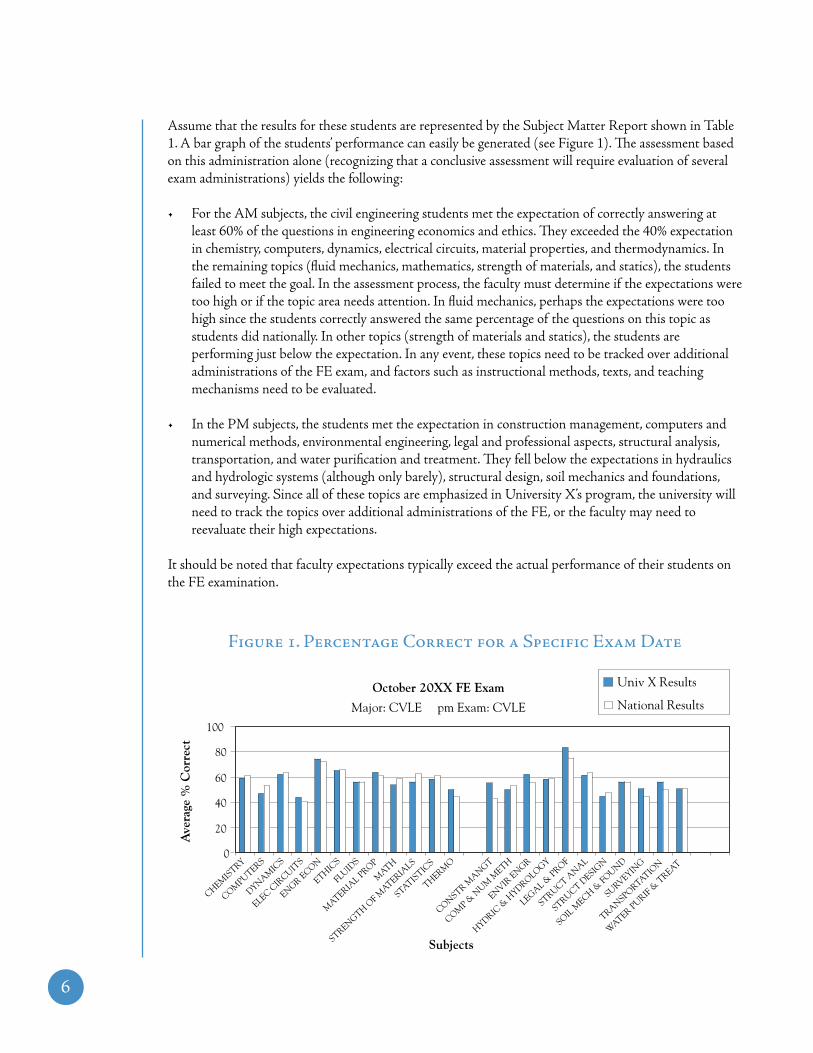
Assume that the results for these students are represented by the Subject Matter Report shown in Table 1. A bar graph of the students’ performance can easily be generated (see Figure 1). The assessment based on this administration alone (recognizing that a conclusive assessment will require evaluation of several exam administrations) yields the following:
• For the AM subjects, the civil engineering students met the expectation of correctly answering at least 60% of the questions in engineering economics and ethics. They exceeded the 40% expectation in chemistry, computers, dynamics, electrical circuits, material properties, and thermodynamics. In the remaining topics (fluid mechanics, mathematics, strength of materials, and statics), the students failed to meet the goal. In the assessment process, the faculty must determine if the expectations were too high or if the topic area needs attention. In fluid mechanics, perhaps the expectations were too high since the students correctly answered the same percentage of the questions on this topic as students did nationally. In other topics (strength of materials and statics), the students are performing just below the expectation. In any event, these topics need to be tracked over additional administrations of the FE exam, and factors such as instructional methods, texts, and teaching mechanisms need to be evaluated.
• In the PM subjects, the students met the expectation in construction management, computers and numerical methods, environmental engineering, legal and professional aspects, structural analysis, transportation, and water purification and treatment. They fell below the expectations in hydraulics and hydrologic systems (although only barely), structural design, soil mechanics and foundations, and surveying. Since all of these topics are emphasized in University X’s program, the university will need to track the topics over additional administrations of the FE, or the faculty may need to reevaluate their high expectations.
It should be noted that faculty expectations typically exceed the actual performance of their students on the FE examination.
FIGURE 1. PERCENTAGE CORRECT FOR A SPECIFIC EXAM DATE
0
20
40
60
80
100
Ave
rage
% C
orre
ct
Univ X Results
National Results
Subjects
CHEMIS
TRY
COMPUTERS
DYNAMIC
S
ELEC CIR
CUITS
ENGR ECON
ETHICS
FLUID
S
MATERIA
L PROP
MATH
STRENGTH OF M
ATERIALS
STATISTIC
S
THERMO
CONSTR MANGT
ENVIR ENGR
COMP &
NUM
METH
HYDRIC &
HYDROLOGY
LEGAL & PROF
STRUCT ANAL
STRUCT DESIG
N
SOIL M
ECH & FO
UND
SURVEYING
TRANSPORTATION
WATER PURIF
& TREAT
October 20XX FE Exam
Major: CVLE pm Exam: CVLE
6

Ratio Method
In many cases, the percentage-correct method produces unrealistic and perhaps unobtainable expectations for
the students’ performance (as mentioned previously concerning the topic of fluid mechanics). Moreover, the results of this method will be affected by the difficulty of a particular version of the FE examination. As an alternative to the percentage-correct method, faculty should consider using the ratio method to aid in developing reasonable expectations. For this method, the ratio of the performance at University X to the national performance is calculated for each topic area. The faculty then develop appropriate expectations from this scale, determining how much above or below the national average is acceptable for their students.
While a graph similar to Figure 1 can be developed for the October 20XX exam, it is, as described in the previous section, more informative to graph the performance on individual topics over time. Figures 2 and 3 show such graphs for student performance in two areas emphasized by University X.
0.60
0.80
1.00
1.20
1.40
OCT 96
APR 97
NOV 97
APR 98
OCT 98
APR 99
APR 00
OCT 00
APR 01
OCT 01
APR 02
OCT 02
APR 03
OCT 03
APR 04
OCT 04
Exam Date
Rat
io -
Uni
v X
to
Nat
iona
l Major: CVLE pm Exam: CVLE
EXPECTED GOAL
Subject: Engineering Economics
OCT 96
APR 97
NOV 97
APR 98
OCT 98
APR 99
APR 00
OCT 00
APR 01
OCT 01
APR 02
OCT 02
APR 03
OCT 03
APR 04
OCT 04
Exam Date
0.600.700.800.901.001.101.20
Major: CVLE pm Exam: CVLE
Subject: Structural Analysis
Rat
io -
Uni
v X
to
Nat
iona
l
EXPECTED GOAL
FIGURE 2. LONGITUDINAL STUDY OF UNIVERSITY X’S PERFORMANCE IN ENGINEERING ECONOMICS
FIGURE 3. LONGITUDINAL STUDY OF UNIVERSITY X’S PERFORMANCE IN STRUCTURAL ANALYSIS
7

Regarding these two examples, one could draw the following conclusions:
• University X assumes that its civil engineering students should score 10% higher in these two core subjects than the national average for civil engineering students. (Recall that the Subject Matter Report only reports national performance data for students in the same major.) The authors would argue, however, that this is a somewhat lofty and perhaps unobtainable goal for University X.
• Despite the loftiness of the university’s goal for engineering economics (Figure 2), the students have consistently been near it. Significant fluctuation occurred between April 2000 and October 2001, which, for example, may have been the result of a change from a long-time instructor to a new one. The drop in performance should have spurred a study of this subject, especially since the students’ performance has effectively been slightly below the goal since October 2001. If a more reasonable goal might be 1.00, or at least no larger than 1.05, the University is meeting the new expectation.
• According to Figure 2, the results of the latest exam in October 2004 show a dramatic drop below the expected goal. The authors suggest that an institution not react to a single drop below the goal, but should continue to monitor the situation.
• For structural analysis (Figure 3), note that University X determined that its initial goal of 1.1 was too high and that the goal changed to 1.00 before the October 2000 exam. This type of “close the loop” feedback is certainly acceptable. However, even with a lower goal of around 1.00, performances continued to fall short of expectations in April 2002, October 2002, and April 2003. Apparently, some decision was made regarding course work in this area, causing the performance to rise back up to expected levels.
• In an effort to smooth out the performance—especially in subjects covered very late in the curriculum—one can also average the April and October exam results to plot the yearly average ratios.
8

Other plotting techniques allow the same type of analysis as described above. One such example appears in Figure 4, which organizes the results by topic area for multiple test administrations in the same graph.
0.6 0.7 0.8 0.9 1 1.1 1.2 1.3 1.40.6 0.7 0.8 0.9 1 1.1 1.2 1.3 1.4
SPR 02
FALL 02
SPR 03
FALL 03
SPR 04
FALL 04
Below National Avg Above National Avg
Construction
Comput Mthds
Env Eng
Hydraulic Eng
Struct Analysis
Struct Design
Soil Mechanics
Surveying
Transportation
Water Treatment
% Correct
% Correct National
FIGURE 4. RATIO SCORES BY TOPIC AND EXAM DATE
9

Scaled-Score Method
The concept of the scaled-score method became possible following the April 2001 examination. The Subject Matter Report for that administration included, for the first time, standard deviation data. The standard deviation is based on the number of problems correct, not on the percentage
correct, and it is generated from the test scores of a specific group of examinees. In Table 1, for example, the relevant group would be the civil engineering majors who selected the Civil PM exam at the October 20XX administration. Thus, pertaining to this group, the national performance for engineering economics could be stated as having a mean of x = 0.72 * 5 = 3.6 problems correct and a standard deviation of σ = 1.1 problems. Further examination of Table 1 reveals that in all subjects, ±3σ effectively covers the entire range from 0% correct to 100% correct.
The scaled score was developed to allow universities to do the following:
• Present the data in a form that represents the number of standard deviations above or below the national average for each topic (as compared to the percentage above or below the national average given by the ratio method).• Allow a range of uncertainty in the university’s performance to account for small numbers of examinees.
The scaled score is defined as follows:
deviationstandardnational)nationallycorrect%–Xat Univcorrect(%questionsof#
deviationstandardnationalnationallycorrect#–Xat Univcorrect#
ScoreScaled
=
=
.Xat Univ takersof#
1
isS.S.foryuncertaintofrange theAnd
.deviationstandardnational*100
)nationallycorrect%–Xat Univcorrect(%* topicaforquestionsof#S.S.
S.S.
ascalculatedisscorescaled theTherefore,
n.institutiospecificanyatexam the
takingstudentsofnumberon thebasedyuncertaintofamountreasonableaallowsThis.0.1 Z
of valueausingsuggestandleunreasonabis that thisfeelauthorsThe.consideredbe toneeds
actionno that indicate wouldsubjectsallforbelow)(seeresultsanalysis that thelargesobe would
yuncertaint thecase,in thisHowever,2.58.be would Zinterval,confidence99%aforNormally,
.n
Z
case,In that deviation.standardsn'institutio
for thedsubstitutebecandeviationstandardnational that theassumedbe will
itns,institutioindividualfordatadeviationstandardprovidenotdoesNCEESSince
.n
Z
nZLet,
.n
Zisonintervalconfidence theor,
ZxZ-x
by)x(nsizeofsampleaofmean the torelatedis)(populationaofmeanThe
:meanaonintervalconfidenceofconcept theFrom
/2
/2
/2
/2
/2
/2
/2/2
±
=
−=
=
±−
=−
±−=−
±=
±
+≤≤
Natl
natlXUniv
XUnivNatl
natlXUniv
Natl
natlXUniv
XUniv
XUnivnatlXUnivnatlXUniv
XUniv
XUnivXUnivXUniv
xx
xxxY
xxxY
xY
nn
σ
σσ
σ
σ
σµ
σµ
σµ
α
α
α
α
α
α
αα
10

deviationstandardnational)nationallycorrect%–Xat Univcorrect(%questionsof#
deviationstandardnationalnationallycorrect#–Xat Univcorrect#
ScoreScaled
=
=
.Xat Univ takersof#
1
isS.S.foryuncertaintofrange theAnd
.deviationstandardnational*100
)nationallycorrect%–Xat Univcorrect(%* topicaforquestionsof#S.S.
S.S.
ascalculatedisscorescaled theTherefore,
n.institutiospecificanyatexam the
takingstudentsofnumberon thebasedyuncertaintofamountreasonableaallowsThis.0.1 Z
of valueausingsuggestandleunreasonabis that thisfeelauthorsThe.consideredbe toneeds
actionno that indicate wouldsubjectsallforbelow)(seeresultsanalysis that thelargesobe would
yuncertaint thecase,in thisHowever,2.58.be would Zinterval,confidence99%aforNormally,
.n
Z
case,In that deviation.standardsn'institutio
for thedsubstitutebecandeviationstandardnational that theassumedbe will
itns,institutioindividualfordatadeviationstandardprovidenotdoesNCEESSince
.n
Z
nZLet,
.n
Zisonintervalconfidence theor,
ZxZ-x
by)x(nsizeofsampleaofmean the torelatedis)(populationaofmeanThe
:meanaonintervalconfidenceofconcept theFrom
/2
/2
/2
/2
/2
/2
/2/2
±
=
−=
=
±−
=−
±−=−
±=
±
+≤≤
Natl
natlXUniv
XUnivNatl
natlXUniv
Natl
natlXUniv
XUniv
XUnivnatlXUnivnatlXUniv
XUniv
XUnivXUnivXUniv
xx
xxxY
xxxY
xY
nn
σ
σσ
σ
σ
σµ
σµ
σµ
α
α
α
α
α
α
αα
The range of uncertainty comes from the following derivation:
From the concept of confidence interval on a mean:
The mean of a population (μ) is related to the mean of a sample of size n (x) by
or, the confidence interval on μ is
Since NCEES does not provide standard deviation data for individual institutions, it will be assumed that the national standard deviation can be substituted for the institution’s standard deviation. In that case,
Normally, for a 99% confidence interval Zα/2 would be 2.58. However, in this case, the uncertainty
would be so large that the analysis results (see below) for all subjects would indicate that no action needs to be considered. The authors feel that this is unreasonable and suggest using a value of Z
α/2 = 1.0. This allows a reasonable amount of uncertainty based on the number of students taking the exam at any specific institution.
Therefore, the scaled score is calculated as
And the range of uncertainty for S.S. is
11

For the same topics previously discussed, the scaled-score graphs and some observations are as follows:
• For engineering economics, a ratio goal of 1.1 translated to a scaled- score goal of 0.25.
• Even with the range of uncertainty, the October 2004 results (shown in Figure 5) still indicate that engineering economics should be monitored over the next few exams.
• Even with the range of uncertainty, the April and October 2003 results for structural analysis (shown in Figure 6) warranted action. From the subsequent results, evidently University X did take some kind of remedial action.
Oct
96
Apr
97
Nov
97
Apr
98
Oct
98
Apr
99
Apr
00
Oct
00
Apr
01
Oct
01
Apr
02
Oct
02
Apr
03
Oct
03
Apr
04
Oct
04
Exam Date
Scal
ed S
core
Low
Scaled Score
Goal
High
Subject: Engineering Economics
Major: CVLE pm Exam: CVLE
-0.8000-0.6000-0.4000-0.20000.00000.20000.40000.60000.8000
Exam Date
Oct
96
Apr
97
Nov
97
Apr
98
Oct
98
Apr
99
Apr
00
Oct
00
Apr
01
Oct
01
Apr
02
Oct
02
Apr
03
Oct
03
Apr
04
Oct
04
Scal
ed S
core Low
Scaled Score
Goal
High
Subject: Structural Analysis
Major: CVLE pm Exam: CVLE
-1.2000
-0.8000
-0.4000
0.0000
0.4000
0.8000
FIGURE 5. SCALED-SCORE RESULTS FOR UNIVERSITY X’S PERFORMANCE IN ENGINEERING ECONOMICS
FIGURE 6. SCALED-SCORE RESULTS FOR UNIVERSITY X’S PERFORMANCE IN STRUCTURAL ANALYSIS
12
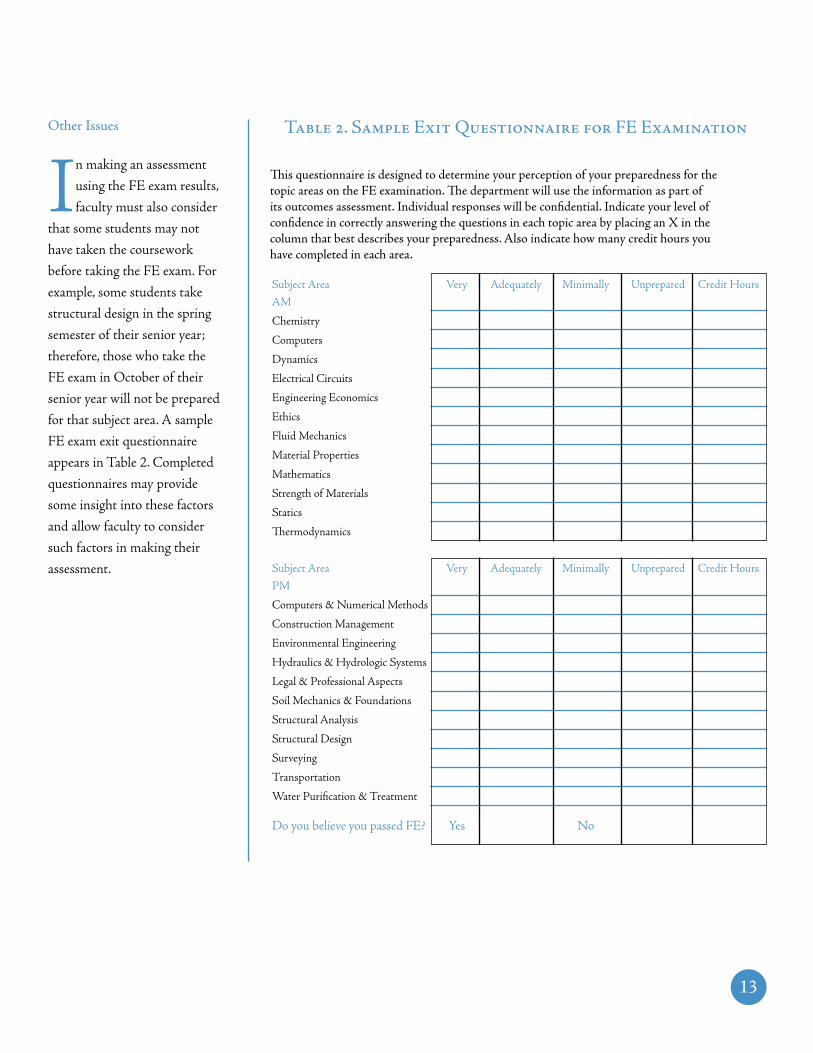
TABLE 2. SAMPLE EXIT QUESTIONNAIRE FOR FE EXAMINATION
Subject Area Very Adequately Minimally Unprepared Credit HoursAM
Chemistry
Computers
Dynamics
Electrical Circuits
Engineering Economics
Ethics
Fluid Mechanics
Material Properties
Mathematics
Strength of Materials
Statics
Thermodynamics
Subject Area Very Adequately Minimally Unprepared Credit HoursPM
Computers & Numerical Methods
Construction Management
Environmental Engineering
Hydraulics & Hydrologic Systems
Legal & Professional Aspects
Soil Mechanics & Foundations
Structural Analysis
Structural Design
Surveying
Transportation
Water Purification & Treatment
Do you believe you passed FE? Yes No
Other Issues
In making an assessment using the FE exam results, faculty must also consider
that some students may not have taken the coursework before taking the FE exam. For example, some students take structural design in the spring semester of their senior year; therefore, those who take the FE exam in October of their senior year will not be prepared for that subject area. A sample FE exam exit questionnaire appears in Table 2. Completed questionnaires may provide some insight into these factors and allow faculty to consider such factors in making their assessment.
This questionnaire is designed to determine your perception of your preparedness for the topic areas on the FE examination. The department will use the information as part of its outcomes assessment. Individual responses will be confidential. Indicate your level of confidence in correctly answering the questions in each topic area by placing an X in the column that best describes your preparedness. Also indicate how many credit hours you have completed in each area.
13
Effective assessment should result in continuous program improvement. Faculty should evaluate the results of student performance in individual subject areas. Doing so will identify the areas in which students are performing below the goals established by the faculty and perhaps significantly
below national or state averages. Evaluations should instigate not only the necessary changes in textbooks, teaching mechanisms, and laboratory procedures but also the possible reallocation of faculty to improve student performance. In one documented case in which FE exam results were used, student performance was significantly below the national average in hydraulics and hydrologic systems. The department head was surprised because the student evaluations for the course had been very good over several years. However, upon investigation, he found that the laboratory procedures used to reinforce the theory were shallow and that the performance demand on the students was low. The laboratory procedures and depth of instruction were improved over several semesters without lessening instruction on the theory. The most recent examinations indicate a significant improvement in student performance in this area. A point that cannot be overemphasized is that, for assessment purposes, the results of multiple exams should be considered and the exam content compared to the course content.
There are some other criticisms of using the FE examination data that should be addressed. One criticism is that only sample questions are provided to faculty, making it difficult for them to determine the level of knowledge required in the actual exam. NCEES cannot release exam questions without compromising its data bank and without requiring exam development volunteers to produce significantly more questions for the exam. Faculty could, however, use an exit questionnaire such as the one in Table 2 to learn more about the level of learning and preparation of their students by subject area. This questionnaire could also provide information about students who take the exam before having all appropriate coursework and aid in gathering other information such as whether transfer students have taken courses at other institutions.
A second criticism is that the data on student learning is incomplete because, at many institutions, the FE exam is not taken by all engineering students. Also, some students are not held accountable for the results, while students who voluntarily take the FE are usually highly motivated. One method of compensating for the variability in student attitude could be to make comparisons only within peer groups. For example, instead of comparing one institution’s students with the national average, one might use one of the other Carnegie classifications included on the Subject Matter Report.
14

Conclusions
After much experience using the FE exam for outcomes assessment, the authors find it to be a useful part of a balanced assessment program that includes other standardized tests, assessment tools, alumni surveys, and placement data. The FE exam is particularly important because it is the only
nationally normed test of upper-level engineering knowledge. The detailed reports of performance by subject area provide information that can help to evaluate a program’s success in achieving the outcomes specified by ABET. Over time, these reports can also help programs document the effects of curriculum revisions, teaching innovations, and other actions taken to improve student mastery of engineering topics.
Based on experience, the authors conclude the following:
• Engineering programs should seriously consider using the FE exam subject-level performance data as part of their program assessment, with proper regard for the caveats described.
• A program will gain the most from the FE exam as an assessment tool if it requires all students to take the exam, particularly the discipline-specific PM exam; if faculty establish specific goals for their programs; and if the administration compares the program to peer institutions with similar requirements.
• Member boards (state licensing boards) should become proactive in working with academic programs to stress the use and value of the FE exam as an assessment tool.
• Institutions must remember that the primary purpose of the FE exam is to assess minimal technical competencies. Other assessment tools are necessary to evaluate skills in higher-level theories or critical thought, which may be the focus of some portion of an institution’s program.
• The results of each FE exam administration (Subject Matter Report) should be sent directly to the institutions for their use.
15

FE EXAM SPECIFICATIONS
MORNING SESSION SUBJECTS AND PERCENTAGE OF QUESTIONS
Old New Old New Specs Specs Specs SpecsChemistry 9% 9% Fluid Mechanics 7% 7%Computers 5% 7% Material Properties 7% 7%Dynamics 8% Mathematics 20% 15%Electrical Circuits 10% 9% Strength of Materials 7% 7%Engineering Economics 4% 8% Statics 10%Ethics & Business Practice 4% 7% Thermodynamics 9% 7%Statics & Dynamics 10% Probability & Statistics 7%
AFTERNOON SESSION SPECIFICATIONS
Listed below are the topics that the discipline-specific examinations will cover, including the percentage of questions on each topic. The afternoon session will consist of 60 questions that count 2 points each, for a total of 120 points.
CHEMICAL INDUSTRIAL Old New Old NewChemical Reaction Engineering 10% 10% Computer Computations & Model 5%Chemical Thermodynamics 10% 10% Design of Industrial Experiments 5% Computer & Numerical Methods 5% Engineering Economics 5% 15%Heat Transfer 10% 10% Engineering Statistics 5%Mass Transfer 10% 10% Facility Design & Location 5%Material/Energy Balances 15% 15% Industrial Cost Analysis 5% Pollution Prevention 5% Industrial Ergonomics 5% Process Control 5% 5% Industrial Management 5% 10% Process Design & Economics 10% 10% Information System Design 5%Process Equipment Design 5% Manufacturing Processes 5%Process Safety 5% Manufacturing Systems Design 5% Transport Phenomena 10% Material Handling System Design 5% Chemistry 10% Math Optimization & Modeling 5%Fluid Dynamics 10% Production Planning & Scheduling 5% Computer Usage in Chemical Engr 5% Productivity Measurement & Mgt 5% Safety, Health & Environmental 5% Queuing Theory & Modeling 5% Simulation 5% Statistical Quality Control 5% Total Quality Management 5% Work Performance & Methods 5% Probability & Statistics 15% Modeling & Computation 12% Manufacturing & Production Sys 13% Facilities & Logistics 12% Human Factors, Productivity, Ergonomics & Work Design 12% Quality 11%
ENVIRONMENTAL Old New Water Resources 25% 25% Water & Wastewater Engineering 30% 30% Air-Quality Engineering 15% 15% Solid- & Hazardous-Waste Engr 15% 15% Environmental Science & Mgt 15% 15%
Appendix
16
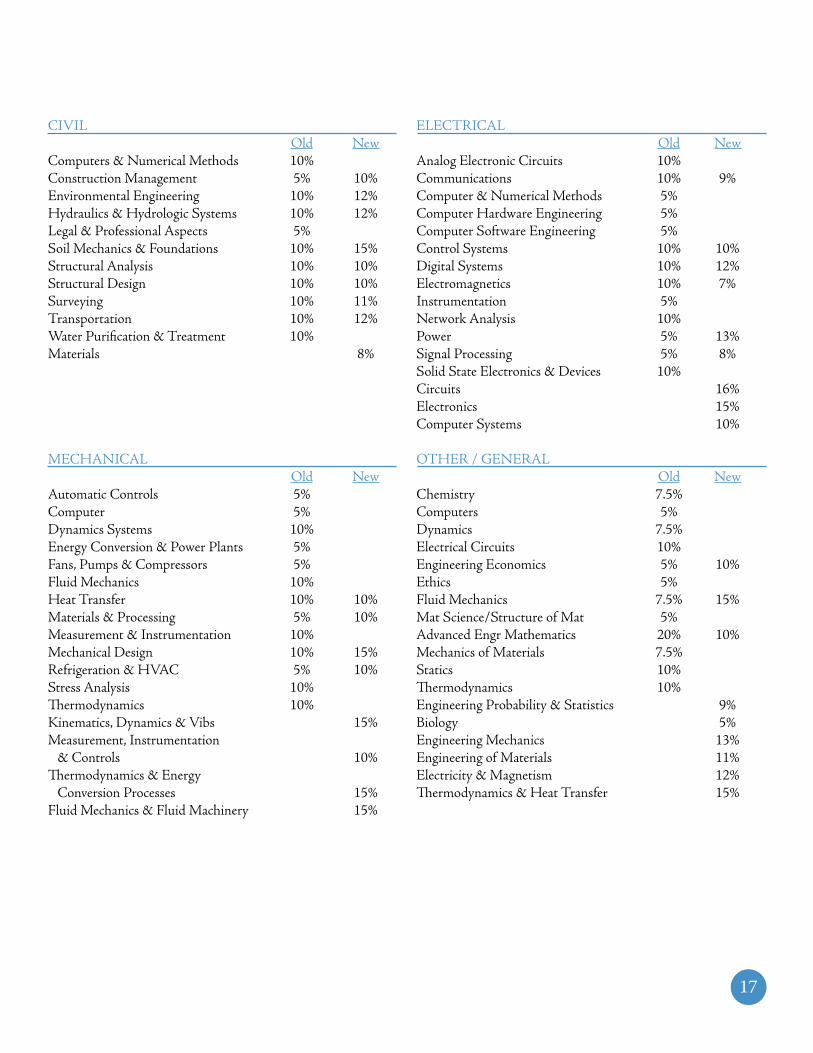
CIVIL ELECTRICAL Old New Old NewComputers & Numerical Methods 10% Analog Electronic Circuits 10%Construction Management 5% 10% Communications 10% 9%Environmental Engineering 10% 12% Computer & Numerical Methods 5%Hydraulics & Hydrologic Systems 10% 12% Computer Hardware Engineering 5%Legal & Professional Aspects 5% Computer Software Engineering 5%Soil Mechanics & Foundations 10% 15% Control Systems 10% 10%Structural Analysis 10% 10% Digital Systems 10% 12%Structural Design 10% 10% Electromagnetics 10% 7%Surveying 10% 11% Instrumentation 5%Transportation 10% 12% Network Analysis 10%Water Purification & Treatment 10% Power 5% 13%Materials 8% Signal Processing 5% 8% Solid State Electronics & Devices 10% Circuits 16% Electronics 15% Computer Systems 10%
MECHANICAL OTHER / GENERAL Old New Old NewAutomatic Controls 5% Chemistry 7.5%Computer 5% Computers 5% Dynamics Systems 10% Dynamics 7.5%Energy Conversion & Power Plants 5% Electrical Circuits 10%Fans, Pumps & Compressors 5% Engineering Economics 5% 10%Fluid Mechanics 10% Ethics 5% Heat Transfer 10% 10% Fluid Mechanics 7.5% 15% Materials & Processing 5% 10% Mat Science/Structure of Mat 5% Measurement & Instrumentation 10% Advanced Engr Mathematics 20% 10%Mechanical Design 10% 15% Mechanics of Materials 7.5%Refrigeration & HVAC 5% 10% Statics 10% Stress Analysis 10% Thermodynamics 10% Thermodynamics 10% Engineering Probability & Statistics 9% Kinematics, Dynamics & Vibs 15% Biology 5%Measurement, Instrumentation Engineering Mechanics 13% & Controls 10% Engineering of Materials 11%Thermodynamics & Energy Electricity & Magnetism 12% Conversion Processes 15% Thermodynamics & Heat Transfer 15%Fluid Mechanics & Fluid Machinery 15%
17

Walter LeFevre, Ph.D., P.E.
Walter LeFevre is professor emeritus in civil engineering at the University of Arkansas. He has served on NCEES examination committees since 1984 and has served 12 years on the Arkansas State Board of Engineers. He is a past president of the National Society of Professional Engineers (NSPE) and has served as an ABET national board member and as senior vice president of the American Society of Civil Engineers (ASCE).
Report Authors
John W. Steadman, Ph.D., P.E.
John W. Steadman is dean of the College of Engineering at the University of South Alabama. He also taught at the University of Wyoming for 32 years, 14 of which he was head of the Electrical and Computer Engineering Department. He has served on NCEES examination committees since 1986 and was president of NCEES in 1993–1994. He is currently past president of the Institute of Electrical and Electronics Engineers, Inc.–United States of America (IEEE–USA).
Jill S. Tietjen, P.E.
Jill S. Tietjen is a consulting electrical engineer in the electric utility industry. A past national president of the Society of Women Engineers, she served on the Colorado State Board of Registration for Professional Engineers and Professional Land Surveyors from 1996 to 2004 and is currently Western Zone Vice President on the NCEES Board of Directors as well as a member of the ABET Engineering Accreditation Commission.
Kenneth R. White, Ph.D., P.E.
Kenneth R. White is head of the Civil Engineering Department at New Mexico State University. He has served as Western Zone Vice President on the NCEES Board of Directors and has chaired the NCEES Examinations for Professional Engineers and Civil Engineering Exam Committees. He has also served two terms as member of the New Mexico State Board of Registration for Professional Engineers and Surveyors.
David L. Whitman, Ph.D., P.E.
David L. Whitman is professor of electrical and computer engineering at the University of Wyoming. He has been a member of the Wyoming State Board of Registration for Professional Engineers and Professional Surveyors for the past five years, has been involved with the NCEES FE Exam preparation for the past 10 years, and has been recently appointed to the Committee on Examinations for Professional Engineers.
18


National Council of Examiners for Engineering and SurveyingP.O. Box 1686
280 Seneca Creek RoadClemson, SC 29633-1686
864-654-6824, 800-250-3196Fax: 864-654-6033
www.ncees.org