Engineering Fracture Mechanics - MATISSE€¦ · Assessment of thermal fatigue life for 316L and...
19
Assessment of thermal fatigue life for 316L and P91 pipe components at elevated temperatures Karl-Fredrik Nilsson ⇑ , Franceso Dolci, Thomas Seldis, Stefan Ripplinger, Aleksander Grah, Igor Simonovski European Commission, JRC Directorate G – Nuclear Safety and Security, G.I.4 Nuclear Reactor Safety and Emergency Preparedness, 1755 ZG Petten, The Netherlands article info Article history: Received 14 March 2016 Received in revised form 13 September 2016 Accepted 16 September 2016 Available online 21 September 2016 Keywords: Thermal fatigue Cyclic-plasticity 316L P91 Total fatigue life assessment abstract This paper presents an analysis of thermal fatigue tests of pipe components with 14 mm wall thickness made of 316L austenitic steel or P91 ferritic-martensitic steels. The tests are done by heating the pipes to 550 °C by induction heating and then cyclic cooling by water cooling resulting in secondary thermal stresses and an axial constant with a constant primary stress between 0 and 100 MPa. The damage evolution and crack depth is measured by X-ray tomography and time-of-flight-diffraction. A very complex cracking is observed for the cases with no axial primary load, and with increasing primary load dominant cir- cumferential cracks are observed. The test are analysed by an engineering approach that included a thermal analysis, a cyclic-plasticity analysis and crack propagation. The forma- tion of a 1 mm crack is estimated by fatigue curves. The propagation from a stipulated 1 mm axial or circumferential crack is done by plasticity corrected stress intensity factors in conjunction with Paris law. The fatigue life predictions are compared with the experi- mental observations and in general very good agreement is reached, in particular for the cases with a large primary load. The proposed approach can be used in an engineering anal- ysis to predict the thermal fatigue life of a component. Ó 2016 Published by Elsevier Ltd. 1. Introduction Thermal fatigue is a long-standing topic and major life limiting degradation mechanism for mechanical components in nuclear and thermal power plants, automotive industry and aerospace. Significant research and development has therefore been devoted to better understand and develop predictive models in the last decades e.g. [1–9]. Although thermal fatigue is a well-known problem, much work is still needed to develop reliable predictive engineering approaches. Some of the specific issues are: heating and cooling transients of a surface, lead to temperature gradients in the components and thermal stresses arise when the thermal strain is totally or partly constrained; the damage is complex and typically starts with a network of surface cracks followed by the formation of a large number of interacting cracks; http://dx.doi.org/10.1016/j.engfracmech.2016.09.006 0013-7944/Ó 2016 Published by Elsevier Ltd. ⇑ Corresponding author. E-mail address: [email protected] (K.-F. Nilsson). Engineering Fracture Mechanics 168 (2016) 73–91 Contents lists available at ScienceDirect Engineering Fracture Mechanics journal homepage: www.elsevier.com/locate/engfracmech
Transcript of Engineering Fracture Mechanics - MATISSE€¦ · Assessment of thermal fatigue life for 316L and...
Engineering Fracture Mechanics 168 (2016) 73–91
Contents lists available at ScienceDirect
Engineering Fracture Mechanics
journal homepage: www.elsevier .com/locate /engfracmech
Assessment of thermal fatigue life for 316L and P91 pipecomponents at elevated temperatures
http://dx.doi.org/10.1016/j.engfracmech.2016.09.0060013-7944/� 2016 Published by Elsevier Ltd.
⇑ Corresponding author.E-mail address: [email protected] (K.-F. Nilsson).
Karl-Fredrik Nilsson ⇑, Franceso Dolci, Thomas Seldis, Stefan Ripplinger, Aleksander Grah,Igor SimonovskiEuropean Commission, JRC Directorate G – Nuclear Safety and Security, G.I.4 Nuclear Reactor Safety and Emergency Preparedness, 1755 ZG Petten,The Netherlands
a r t i c l e i n f o a b s t r a c t
Article history:Received 14 March 2016Received in revised form 13 September2016Accepted 16 September 2016Available online 21 September 2016
Keywords:Thermal fatigueCyclic-plasticity316LP91Total fatigue life assessment
This paper presents an analysis of thermal fatigue tests of pipe components with 14 mmwall thickness made of 316L austenitic steel or P91 ferritic-martensitic steels. The testsare done by heating the pipes to 550 �C by induction heating and then cyclic cooling bywater cooling resulting in secondary thermal stresses and an axial constant with a constantprimary stress between 0 and 100 MPa. The damage evolution and crack depth is measuredby X-ray tomography and time-of-flight-diffraction. A very complex cracking is observedfor the cases with no axial primary load, and with increasing primary load dominant cir-cumferential cracks are observed. The test are analysed by an engineering approach thatincluded a thermal analysis, a cyclic-plasticity analysis and crack propagation. The forma-tion of a 1 mm crack is estimated by fatigue curves. The propagation from a stipulated1 mm axial or circumferential crack is done by plasticity corrected stress intensity factorsin conjunction with Paris law. The fatigue life predictions are compared with the experi-mental observations and in general very good agreement is reached, in particular for thecases with a large primary load. The proposed approach can be used in an engineering anal-ysis to predict the thermal fatigue life of a component.
� 2016 Published by Elsevier Ltd.
1. Introduction
Thermal fatigue is a long-standing topic and major life limiting degradation mechanism for mechanical components innuclear and thermal power plants, automotive industry and aerospace. Significant research and development has thereforebeen devoted to better understand and develop predictive models in the last decades e.g. [1–9]. Although thermal fatigue is awell-known problem, much work is still needed to develop reliable predictive engineering approaches. Some of the specificissues are:
� heating and cooling transients of a surface, lead to temperature gradients in the components and thermal stresses arisewhen the thermal strain is totally or partly constrained;
� the damage is complex and typically starts with a network of surface cracks followed by the formation of a large numberof interacting cracks;

Nomenclature
RTF = krr/(aE) thermal fatigue resistancea thermal expansionk thermal conductivityE modulus of elasticityh heat transfer coefficientCi, cI parameters fitted to Chaboche kinematic hardening cyclic plasticity modelry yield stress in Chaboche kinematic hardening cyclic plasticity modelrzz, r//, ezz, e// axial and hoop stress and strain componentsDe, Dr total strain and stress rangeDem, Dep mechanical and plastic strain rangeK stress intensity factor computed from stresses and Handbook solutionsbk and ik parameters needed for K-calculations from stress fields; bk used to fit the stresses to polynomial ik tabulated
influence coefficients that depend on crack orientation and crack geometryJ J-integralKplc1, Kplc2 crack tip opening displacement and plastic collapse plasticity correction to stress intensity factor
CTODpl, CTODssy crack tip opening displacement computed from Dugdale models and used for crack tip opening displace-ment plasticity correction
rapp, rf average stress and flow stress used in the Dugdale modelLR normalized plastic collapse load used for plastic collapse correctionKmax, Kmin maximum and minimum computed stress intensity factor during a load cycleDKeff effective stress range used in Paris law
DKdeepeff , DKsurf
eff effective stress range at deepest and surface point of semi-elliptic crack
da/dN, dc/dN fatigue crack growth increment of a semi-elliptic crack in the depth and surface directionCp, mp Paris law parametersR ratio between Kmax and Kmin during a load cyclea, c depth and surface half-length of semi-elliptical cracka0, c0 depth and surface half-length of postulated semi-elliptical starter crack used for crack propagationF axial load applied in the testH, Ri wall thickness and inner radius of pipe componentt timeT temperature
74 K.-F. Nilsson et al. / Engineering Fracture Mechanics 168 (2016) 73–91
� the fatigue damage develops under non-isothermal conditions and multi-axial loading, and also often under variableamplitude;
� if the maximum temperature is in the creep range, creep-fatigue interaction may need to be accounted for; and� for low-cycle thermal fatigue cyclic plasticity must be addressed.
Thermal fatigue can be high cycle fatigue with low amplitude thermal loads, as for mixing of cold and hot fluids in a pipejunction, or a low frequency problem with high amplitude thermal loads; for instance due to periodic start-ups and shut-down of power plants. Low-cycle thermal fatigue is expected to become an increasing problem for power plants in thefuture, since they will need to operate in a more flexible manner to balance intermittency from renewable energy sources.
One obvious strategy to mitigate thermal fatigue is to use materials that are thermal fatigue resistant. High thermal stres-ses develop in materials with low thermal conductivity and high thermal expansion. A simple measure of a material’s ther-mal resistance is given by RTF ¼ krr=ðaEÞ, where k is the thermal conductivity, a the thermal expansion coefficient, E Young’smodulus and rr a critical stress such as yield stress [4]. The tempered ferritic-martensitic steel P91 and the austenitic steelssuch as 316L are commonly used structural materials in power plants. Using the RCC-MRx material data [10] for P91, RTF is4.2 � 103 at room temperature and 2.82 � 103 at 550 �C whereas for 316L the corresponding values are 0.89 � 103 and 0.68 � 103respectively. Thus P91 is expected to better resist thermal fatigue degradation than 316L. P91 is therefore often the referencematerials for certain components such as steam generators, heat exchangers and coolant pipes in sodium-cooled fast reac-tors [8,9] where thermal fatigue is an issue.
In this paper we will first summarize thermal fatigue simulation tests of P91 and 316L pipe components where the ther-mal fatigue loadings are simulated by continuous induction heating of the pipes and cyclic water cooling from the inside, inorder to induce typical thermal low-cycles fatigue damage. In the second part of the paper we will describe an engineeringassessment approach that can capture the key factors of thermal fatigue. The model predictions are compared with the

K.-F. Nilsson et al. / Engineering Fracture Mechanics 168 (2016) 73–91 75
experimental observations. The different modelling assumptions are then discussed in view of further improvements of themodelling approach.
2. Component tests
2.1. Test set-up
The JRC has developed a facility to simulate thermal fatigue loads and damage in pipe components (see Fig. 1) [5,6]. Thesepipes were fabricated from a block of material and are therefore expected be isotropic. The pipe has an inner radius of 10 mmand a wall thickness of 14 mm. In this study the central part of the pipe is heated continuously by induction to a temperatureof 550 �C using an external heating coil. A thermal load cycle is induced by pumping room temperature water through thepipe for around 10 s. After the water flow has stopped, air is blown through the pipe to remove remaining water from thesurface and the pipe heats up again through conduction from the hot outer surface for about 45 s when the next water flush-ing is started. The full thermal cycle takes around one minute. The pipe is held in a lever arm test machine providing an axialload, but no restraint on axial displacement. The thermal loads induce secondary self-equilibrating cyclic stresses whereasthe axial load gives a primary stress. A test specimen equipped with five thermocouples across the wall thickness was usedto measure the temperature profiles for P91 and 316L pipes respectively. The initial surface cracking was identified by replicamethods. Two different non-destructive methods were used to measure crack growth: time-of-flight-diffraction (TOFD) [11],as a relatively quick method to determine crack depth and X-ray computed tomography (XCT) for a three-dimensional map-ping of the damage [12]. Only very few dedicated well controlled thermal fatigue components tests are reported in the lit-erature [13].
2.2. Summary of component test results
Table 1 summarizes the test matrix and measured crack depths.
� F is the imposed axial load: 0, 50, 100 and 150 kN, which correspond to a nominal axial stresses of 0, 33, 66 and 100 MParespectively.
� Ni is number of cycles after which crack initiation was detected by replica. For the first tests (TFR1-TFR5) the first checkwas performed after 10,000 cycles following the same procedure adopted for previous tests, where the maximum tem-perature was 350 �C. With 550 �C surface cracking occurred well before 10,000 cycles, hence the ‘‘<” sign, and the firstreplica test were subsequently taken already after 1000 cycles.
� Ntest is the number of conducted thermal cycles.� amax refers to the maximum crack depth measured at Ntest for circumferential and/or axial cracks a (defined in Fig. 2).Failure means that a through-wall crack has formed. Good agreement was observed between crack depths from TOFDand CT results [12], as well as from direct comparison from cut specimens [14].
For the first tests (TFR1, 2, 3 and 5), a manually operated TOFD system was used. The tests were interrupted at intervalsand crack depth measurements were taken. The accuracy of the TOFDmeasurements were assessed by comparing with post-
(b)
48 mm
14 mm20 mm
224mm
axial load
48 mm
14 mm20 mm
224mm
axial load
(a)
Fig. 1. (a) Experimental set-up; (b) pipe dimensions.
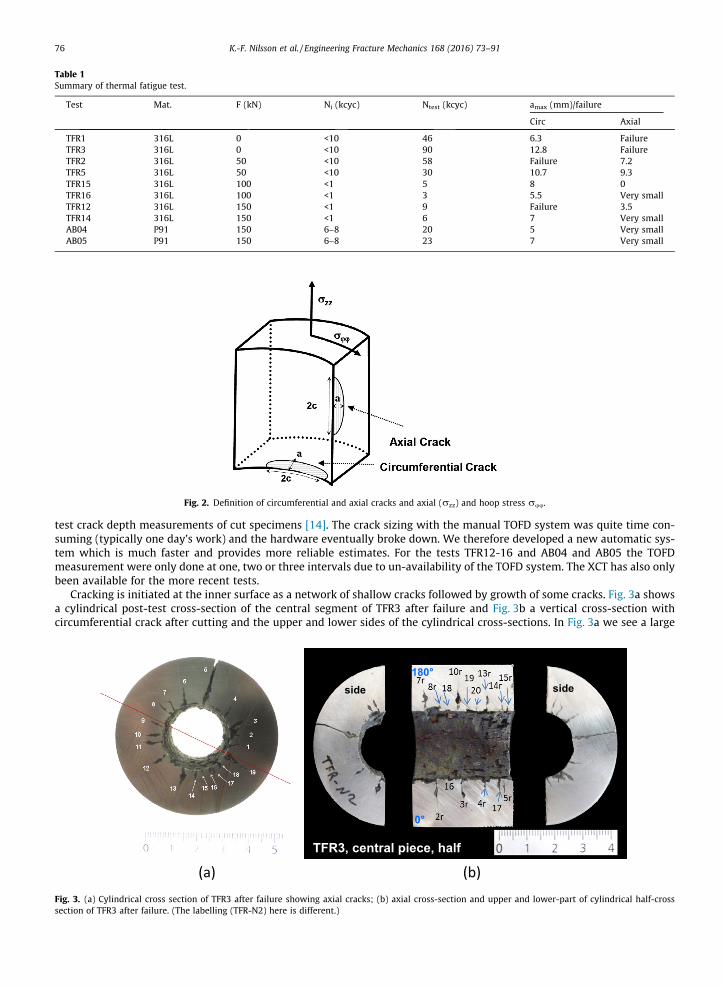
Table 1Summary of thermal fatigue test.
Test Mat. F (kN) Ni (kcyc) Ntest (kcyc) amax (mm)/failure
Circ Axial
TFR1 316L 0 <10 46 6.3 FailureTFR3 316L 0 <10 90 12.8 FailureTFR2 316L 50 <10 58 Failure 7.2TFR5 316L 50 <10 30 10.7 9.3TFR15 316L 100 <1 5 8 0TFR16 316L 100 <1 3 5.5 Very smallTFR12 316L 150 <1 9 Failure 3.5TFR14 316L 150 <1 6 7 Very smallAB04 P91 150 6–8 20 5 Very smallAB05 P91 150 6–8 23 7 Very small
Fig. 2. Definition of circumferential and axial cracks and axial (rzz) and hoop stress ruu.
76 K.-F. Nilsson et al. / Engineering Fracture Mechanics 168 (2016) 73–91
test crack depth measurements of cut specimens [14]. The crack sizing with the manual TOFD system was quite time con-suming (typically one day’s work) and the hardware eventually broke down. We therefore developed a new automatic sys-tem which is much faster and provides more reliable estimates. For the tests TFR12-16 and AB04 and AB05 the TOFDmeasurement were only done at one, two or three intervals due to un-availability of the TOFD system. The XCT has also onlybeen available for the more recent tests.
Cracking is initiated at the inner surface as a network of shallow cracks followed by growth of some cracks. Fig. 3a showsa cylindrical post-test cross-section of the central segment of TFR3 after failure and Fig. 3b a vertical cross-section withcircumferential crack after cutting and the upper and lower sides of the cylindrical cross-sections. In Fig. 3a we see a large
TFR3, central piece, half
side side
0°
180°
(a) (b)Fig. 3. (a) Cylindrical cross section of TFR3 after failure showing axial cracks; (b) axial cross-section and upper and lower-part of cylindrical half-crosssection of TFR3 after failure. (The labelling (TFR-N2) here is different.)

K.-F. Nilsson et al. / Engineering Fracture Mechanics 168 (2016) 73–91 77
number of uniformly distributed axial half-through the wall cracks and one surface breaking axial crack. On the axial cross-section in Fig. 3b, a large number of circumferential cracks can be seen with the deepest being almost 13 mm.
It follows from Table 1 that the number of cycles needed to reach a specific crack depth is generally reduced by increasingthe axial load. The axial load promotes the growth of circumferential cracks and reduces the number of deep cracks. This isclearly seen from the XCT mappings of TFR5, TFR12 and TFR 15 in Fig. 4. For TFR 5 with F = 50 kN, a very large number of
Fig. 4. Mapping of crack configuration: (a) TFR 5, F = 50 kN, 30,000 cycles; (b) TFR 12, F = 150 kN, 7000 cycles; (c) TFR15, F = 100 kN, 5000 cycles.

78 K.-F. Nilsson et al. / Engineering Fracture Mechanics 168 (2016) 73–91
interlinked axial cracks can be observed together with a small number of circumferential cracks. For TFR12 the two circum-ferential cracks are dominant whereas for TFR15 one, an almost circumferential planar crack, can be seen. It is surprising thatthe trend with a dominating circumferential crack is stronger for TFR 15 with F = 100 kN than for TFR12 with F = 150 kN.
By comparing TFR12 and 16 with AB04 and AB05 in Table 1 we see that initiation times are longer for P91 specimen thanfor 316L.
3. Thermal fatigue life assessment
The thermal fatigue life assessment is done in three consecutive steps. In the first step the temperature gradients are com-puted from a thermal analysis. In the second step the stresses and strains resulting from the thermal gradients and axialloads are computed. Both the thermal and stress analyses are done by finite element analyses of an uncracked componentusing the commercial FE-code ABAQUS. In the third step the crack initiation and propagation are calculated from the stressand strain fields in step 2 by post-processing procedures. The temperature dependent materials properties for 316L and P91steels were taken from RCC-MRx material data sheets [10] if not stated otherwise. The details of each of these steps are givenbelow.
3.1. Thermal analysis
The temperature fields are controlled by the heat transfer between coolant and pipe and the heat conduction in the pipe.The value of the heat transfer coefficient between the coolant and the solid, h, has very large impact on the temperaturefields and depends mainly on the physical properties of the coolant, the properties of the flow and to a lesser extent onthe properties of the solid. The heat transfer coefficient was computed by axi-symmetric transient CFD analysis with asolid-fluid interaction using the software tool ANSYS CFX. The model includes a solid domain, representing the metal wallof the heated pipe, and a fluid domain, representing the water within the pipe. The initial temperature of the pipe wall was550 �C. The pip bore hole was then filled with water at 20 �C, representing an instant filling of a hot pipe with the cold cool-ant with an inlet velocity of 4.77 m/s. The cold water heats up on its way and starts to boil at the surface once it attains100 �C. The RPI wall boiling model from the Rensselaer Polytechnic Institute [15] was applied.
The resulting heat transfer coefficients along the wall are shown in Fig. 5 for P91 and 316L at different times after the startof the water flushing. At the inlet (height 224 mm), the coefficient is low due to absence of boiling. The coefficient thenincreases along the tube length from enhanced heat transport and boiling. The overall heat transfer coefficient decreaseswith time due to equalisation of the temperatures during the transient. Except for the inlet part, the heat transfer coefficientdoes not vary significantly along the height of the specimen. From Fig. 5 it follows, as expected, that the heat transfer coef-ficient is very similar for 316L and the P91 specimens and varies from 27 kW/m2 K at the outlet in the beginning of the cool-ing, to 21 kW/m2 K at the end of the 10 s cooling. These values are in good agreement with typical literature data [16].
The temperature distribution from the cyclic thermal loadings in the tests was calculated by the ABAQUS FE axisymmetricmodel. The finite element mesh at the inner surface was very dense to capture the strong thermal gradients. The time depen-dent temperature distribution is then governed by the heat transfer coefficients and the thermal conductivity of the twosteels. The boundary conditions are illustrated in Fig. 6. The segment of the outer surface of the pipe with the coil had a pre-scribed temperature of 550 �C to represent the induction heating. The entire pipe was heated for 600 s followed by coolingcycles with water and heating cycles with no water flow. During the cyclic thermal loading a temperature of 550 �C was pre-scribed on the outer surface covered by the induction coil. For the cooling stage water with a temperature of 100 �C and aconstant heat transfer coefficient of 25 kW/m2 K was adopted for both steels. The heat transfer assessment did not distin-
Fig. 5. Computed wall heat transfer coefficient versus the height of a vertical pipe at different times from onset of cooling (a) 316L; (b) P91.
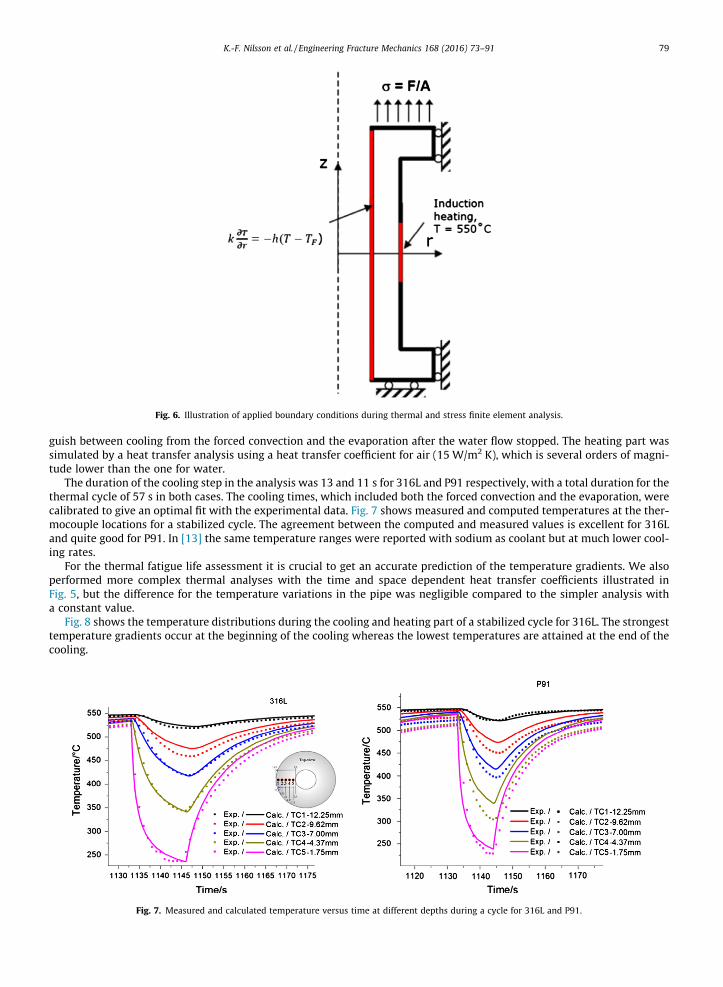
Fig. 6. Illustration of applied boundary conditions during thermal and stress finite element analysis.
K.-F. Nilsson et al. / Engineering Fracture Mechanics 168 (2016) 73–91 79
guish between cooling from the forced convection and the evaporation after the water flow stopped. The heating part wassimulated by a heat transfer analysis using a heat transfer coefficient for air (15 W/m2 K), which is several orders of magni-tude lower than the one for water.
The duration of the cooling step in the analysis was 13 and 11 s for 316L and P91 respectively, with a total duration for thethermal cycle of 57 s in both cases. The cooling times, which included both the forced convection and the evaporation, werecalibrated to give an optimal fit with the experimental data. Fig. 7 shows measured and computed temperatures at the ther-mocouple locations for a stabilized cycle. The agreement between the computed and measured values is excellent for 316Land quite good for P91. In [13] the same temperature ranges were reported with sodium as coolant but at much lower cool-ing rates.
For the thermal fatigue life assessment it is crucial to get an accurate prediction of the temperature gradients. We alsoperformed more complex thermal analyses with the time and space dependent heat transfer coefficients illustrated inFig. 5, but the difference for the temperature variations in the pipe was negligible compared to the simpler analysis witha constant value.
Fig. 8 shows the temperature distributions during the cooling and heating part of a stabilized cycle for 316L. The strongesttemperature gradients occur at the beginning of the cooling whereas the lowest temperatures are attained at the end of thecooling.
Fig. 7. Measured and calculated temperature versus time at different depths during a cycle for 316L and P91.

Fig. 8. Computed temperature distributions for the 316L pipe during cooling and heating.
80 K.-F. Nilsson et al. / Engineering Fracture Mechanics 168 (2016) 73–91
3.2. Stress-strain analysis of uncracked pipe
Fig. 6 also shows the used mechanical boundary conditions. The lower part is constrained axially; the upper part has aprescribed axial stress corresponding to the axial load. The lower and upper thicker parts of the pipe are constrained inthe radial direction and all other parts are traction free. The time dependent temperature distributions from the thermalanalysis are shown in Fig. 8, together with the boundary conditions resulting in time dependent stress and strain distribu-tions in the pipe. The temperature dependent Young’s modulus and Poisson’s ratio were taken directly from the RCC-MRxdata sheets for the two steels [10]. The thermal loadings induce low-cycle fatigue, which requires a cyclic plasticity consti-tutive model. For this we used the Chaboche model [17–19] implemented into the ABAQUS code. The cyclic plastic stress-strain curve can then be expressed as:
Dr2
¼XMi¼1
Ci
citanh ci
Depi2
� �þ ry þ R0ð1� e�bpÞ: ð1Þ
Here Dr=2 and Depi =2 are the stress and plastic strain amplitudes respectively, ry is the yield stress,PM
i¼1CicitanhðciDepi Þ is the
nonlinear kinematic hardening as first proposed by Frederick and Armstrong [20], and R0ð1� e�bpÞ is the isotropic cyclic soft-ening/hardening, where p is the accumulated cyclic plastic strain, R0 is the asymptotic value for stabilized cycles and b con-trols the speed of stabilization, and M is the number of terms used to describe nonlinear kinematic hardening. The materialconstants Ci; ci; ry; R0 and b need to be calibrated to cyclic stress-strain data.
RCC-MRx provides iso-thermal cyclic plastic stress-strain curves at the fatigue half-life for 316L and P91. The model in Eq.(1), but with no cyclic softening/hardening (i.e. R0 ¼ 0) was fitted to the RCC-MRx data for 316L and P91 respectively. Thedata in the literature may differ; for instance for P91, [21,22] give higher stress amplitudes than the RCC-MRx code. Fig. 9shows the calibrated data together with the RCC-MRx data. The calibrated values for Ci; ci; ry are given in Table 2. In thestress analysis interpolation of these values were used to cover the entire temperature range. The agreement is quite goodfor P91. For 316L the agreement is also very good up to a plastic strain amplitude of 0.015. For larger strain amplitudes themodels slightly underpredict the experimental stress amplitudes. Note that 316L has no temperature dependence in thetemperature range 300–550 �C. P91 yields at a much higher stress than 316L and its plastic hardening is much smaller.Parameters for P91 have clear temperature dependence. It should be noted that P91 has a significant and continuous cyclicsoftening [23–25] whereas 316L usually has a slight initial cyclic hardening that can be followed by softening [26–28]. Moreelaborate calibration to even more general Chaboche models would be possible, [29], but more data would be required andthis was out of the scope for this study.
3.2.1. Stress distributionsThe cyclic stress variations in the pipe stabilize after a few cycles and we only summarize some key observations for com-
puted stresses along the centre of the pipe. The thermal gradients during a cycle induce associated through-wall stress gra-dients. This is illustrated by Fig. 10 where the through-wall axial stress distributions for 316L, in the case with no axial load,from the onset of the down-shock until the end of the thermal cycle. At the end of the heating (t = 57 s), the inner surface is incompression and the outer surface in tension. The down-shock results in a very strong tensile stress increase close to theinner surface (t = 0.5 s) and stress reduction at the outer surface, but at a slower rate. The depth with tensile stress thenspreads from the inner surface as the cooling proceeds, and when the cooling stops (13 s) and the temperature increases,

-0.005 0.000 0.005 0.010 0.015 0.020
0
100
200
300
400
500
600
700 RCC-MRx 375C-550C Modelling -Chaboche 375C-550C RCC-MRx 20C Modelling -Chaboche 20C
Δσ/2
Δε/2
316L
-0.01 0.00 0.01 0.02 0.03 0.04 0.05 0.06 0.07 0.08
0
100
200
300
400
500
RCC-MRx 20C Modelling -Chaboche 20C
RCC-MRx 482C Modelling -Chaboche 482C
RCC-MRx 600C Modelling -Chaboche 600C
RCC-MRx 525C Modelling -Chaboche 525C
RCC-MRx 400C Modelling -Chaboche 400C
Δσ/2
Δε/2
P91
Fig. 9. Calculated and tabulated non-linear kinematic hardening models for 316L and P91.
Table 2Parameters used the non-linear kinematic hardening model.
C1 (MPa) c1 C2 (MPa) c2 C3 (MPa) c3 ry (MPa)
316L20 �C 125246 665.063 20,742 40 – – 30300–550 �C 125246 1061 25691 86.7 – – 39600 �C 150295 1061 24338 86.7 – – 30
P910 �C 18499 700 6000 300 2000 25 166400 �C 353500 2000 38700 300 900 25 95482 �C 305872 2191 48235 460.7 2500 25 90525 �C 215872 2191 48235 460.7 2500 25 90600 �C 146860 2055 31159 400 1900 25 85
wall depth [mm]0 2 4 6 8 10 12 14
zz [M
Pa]
-300
-200
-100
0
100
200
300cooling t= 0.5-13sheating 13.5 - 57s
13.5 s
16s
22s30s
57s
4s0.5, 1, 2s
13s
Fig. 10. Computed axial stress through-wall distribution for 316L and no axial load. The thermal load cycle is 57 s including cooling for 13 s. Wall depthrefers to distance from the inner wall.
K.-F. Nilsson et al. / Engineering Fracture Mechanics 168 (2016) 73–91 81
the inner surface goes into compression and the outer surface into tension. Although the temperature gradient at the onset ofcooling is confined to the inner surface, the entire stress distribution is affected since the secondary thermal stresses are self-equilibrating. Another important observation from Figs. 8 and 10 is that the highest tensile thermal stresses occur when thetemperature is low and thus we have an out-of-phase thermo-mechanical load.

Fig. 11. Through-wall distribution of maximum and minimum stresses for 316 and P91 specimens with F = 0 and 150 kN (a) axial stress; (b) hoop stress.
82 K.-F. Nilsson et al. / Engineering Fracture Mechanics 168 (2016) 73–91
The stress distributions vary significantly during the thermal cycle and the difference between the maximum and min-imum stresses is therefore more informative. Fig. 11 shows the through-wall distribution of the maximum and minimumaxial stress and hoop stress respectively for 316L and P91 during a stabilized cycle, for zero and 150 kN axial load. From theseplots some general observations can be drawn:
� the tensile stress close to the inner surface is higher for P91 than for 316L due to its higher yield stress;� the stress at the inner surface is bi-axial since the axial and hoop components are almost identical;� the axial load increases the mean stress of the axial stress component across the wall, but the peak tensile stress is hardlyaffected due to plastic stress re-distribution.
3.2.2. RatchetingIn the finite element analysis the stress variation stabilizes after some cycles but the plastic strain accumulates for each
cycle in the presence of a mean stress. This is illustrated in Fig. 12a for the axial stress and strain at the inner surface for 316Lwith F = 0 and 150 kN respectively. P91, which has a higher yield stress, has also less ratcheting and much smaller strainrange than 316L, as shown in Fig. 12b. It should be stressed that the analyses are based stabilized cyclic stress-strain curves.The hysteresis curves would be affected by cyclic hardening or softening.
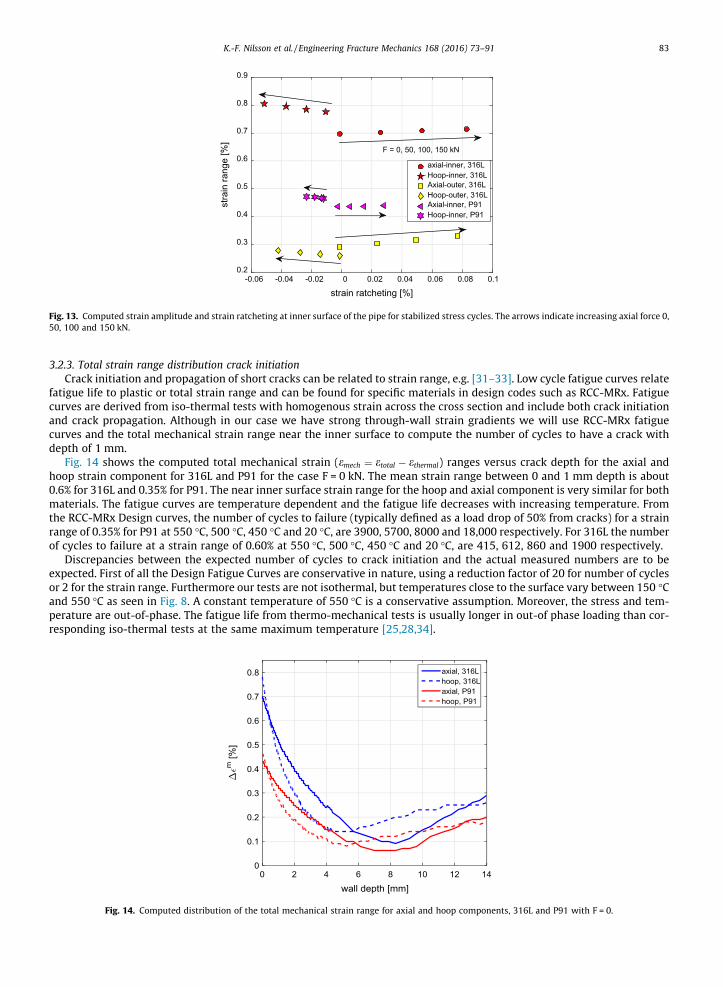
We conclude from Fig. 12 that the nonlinear kinematic cyclic plasticity model results in hysteresis curves with stabilizedstress and strain ranges and a constant mean-stress-dependent ratcheting, but it also varies through the wall thickness.Fig. 13 plots the strain range and the ratcheting between the computed ninth and tenth cycle for the hoop and axial com-ponent for F = 0, 50, 100 and 150 kN. The results are given for 316L at the inner and outer surface of the pipe and for P91 atthe inner surface. Since the plastic deformation is dilatation free, a positive ratcheting in the axial direction must be com-pensated by a negative ratcheting in the hoop direction. It can also be noted that although the strain ranges for 316L aremuch larger at the inner surface than at the outer surface, the ratcheting is of equal amplitude at the inner and outer surface.As already seen in Fig. 12b, P91 has overall smaller strain ranges and less ratcheting.
Purely kinematic non-linear hardening results in a constant ratcheting per cycle which leads to an over-prediction [30].More elaborate models that combine kinematic nonlinear hardening with isotropic hardening and inclusion of a thresholdstress allow models with limited ratcheting [30].
Fig. 12. Computed hysteresis curves for the axial stress and strain components at the inner surface during ten cycles (a) 316L for F = 0 and 150 kN; (b) 316Land P91 F = 150 kN.
strain ratcheting [%]-0.06 -0.04 -0.02 0 0.02 0.04 0.06 0.08 0.1
stra
in ra
nge
[%]
0.2
0.3
0.4
0.5
0.6
0.7
0.8
0.9
axial-inner, 316LHoop-inner, 316LAxial-outer, 316LHoop-outer, 316LAxial-inner, P91Hoop-inner, P91
F = 0, 50, 100, 150 kN
Fig. 13. Computed strain amplitude and strain ratcheting at inner surface of the pipe for stabilized stress cycles. The arrows indicate increasing axial force 0,50, 100 and 150 kN.
K.-F. Nilsson et al. / Engineering Fracture Mechanics 168 (2016) 73–91 83
3.2.3. Total strain range distribution crack initiationCrack initiation and propagation of short cracks can be related to strain range, e.g. [31–33]. Low cycle fatigue curves relate
fatigue life to plastic or total strain range and can be found for specific materials in design codes such as RCC-MRx. Fatiguecurves are derived from iso-thermal tests with homogenous strain across the cross section and include both crack initiationand crack propagation. Although in our case we have strong through-wall strain gradients we will use RCC-MRx fatiguecurves and the total mechanical strain range near the inner surface to compute the number of cycles to have a crack withdepth of 1 mm.
Fig. 14 shows the computed total mechanical strain (emech ¼ etotal � ethermal) ranges versus crack depth for the axial andhoop strain component for 316L and P91 for the case F = 0 kN. The mean strain range between 0 and 1 mm depth is about0.6% for 316L and 0.35% for P91. The near inner surface strain range for the hoop and axial component is very similar for bothmaterials. The fatigue curves are temperature dependent and the fatigue life decreases with increasing temperature. Fromthe RCC-MRx Design curves, the number of cycles to failure (typically defined as a load drop of 50% from cracks) for a strainrange of 0.35% for P91 at 550 �C, 500 �C, 450 �C and 20 �C, are 3900, 5700, 8000 and 18,000 respectively. For 316L the numberof cycles to failure at a strain range of 0.60% at 550 �C, 500 �C, 450 �C and 20 �C, are 415, 612, 860 and 1900 respectively.
Discrepancies between the expected number of cycles to crack initiation and the actual measured numbers are to beexpected. First of all the Design Fatigue Curves are conservative in nature, using a reduction factor of 20 for number of cyclesor 2 for the strain range. Furthermore our tests are not isothermal, but temperatures close to the surface vary between 150 �Cand 550 �C as seen in Fig. 8. A constant temperature of 550 �C is a conservative assumption. Moreover, the stress and tem-perature are out-of-phase. The fatigue life from thermo-mechanical tests is usually longer in out-of phase loading than cor-responding iso-thermal tests at the same maximum temperature [25,28,34].
Fig. 14. Computed distribution of the total mechanical strain range for axial and hoop components, 316L and P91 with F = 0.

84 K.-F. Nilsson et al. / Engineering Fracture Mechanics 168 (2016) 73–91
For TFR16 (316L) a circumferential crack of depth 1 mm was measured after 2000 cycles by the TOFD. Given the limiteddata and uncertainties on the reliability of the iso-thermal fatigue data, we will use this value to anchor the number of cyclesfor formation of a 1 mm crack. Dividing the measured value 2000 with the Design Curve value for failure at 550 �C, results ina reduction factor 4.8. Applying the same reduction factor for P91 gives 4.8 ⁄ 3900 = 18,700. A crack initiation time of 2000and 18,700 cycles for 316L and P91 respectively will be used. As seen in Fig. 13 the strain range at the surface is almost thesame for the axial and hoop strains. We will therefore assume that the same number of cycles is needed for the formation ofa 1 mm axial and a 1 mm circumferential crack. Moreover, since the magnitude of the axial force has a minor impact on theinner surface strain range (Fig. 11), we will also assume that the number of cycles to form a 1 mm crack is independent of theaxial load. In the experiments, surface cracking from replicas was observed already at the first inspection after 1000 cyclesfor 316L whereas the first surface cracking was observed after about 8000 cycles for P91. These observations are in line withour assumptions on the formation of a 1 mm crack.
3.3. Fatigue crack propagation
3.3.1. Computation of plasticity corrected stress intensity factorsA finite element analysis simulation of interacting fatigue cracks with complex shapes and where cracks are modelled
explicitly is impossible in practice. Therefore we adopted a number of simplifications for the crack propagation analysis. Firstof all we assumed a single circumferential or axial crack. We also assumed that the crack is semi-elliptical as shown in Fig. 15or axi-symmetric when the length of a circumferential crack (2c) reaches the inner surface perimeter.
The elastic stress intensity factor for a set of semi-elliptical or axi-symmetric cracks in a cylinder can be computed fromtabulated solutions obtained with a given stress distribution, as first proposed by Raju and Newman [35]. Firstly this requiresthat the stress distribution is fitted to a third-order polynomial,
rðx=H; tÞ ¼ b0ðtÞ þ b1ðtÞ xH
� �þ b2ðtÞ x
H
� �2þ b3ðtÞ x
H
� �3; ð2Þ
where x is the radial distance from the inner surface, H the wall thickness and bi the time dependent fitting coefficients. Athird order polynomial cannot exactly describe the full stress distribution. We therefore chose the length over which we cal-ibrated the stress distribution for the K-calculation. The length we used, is 1.5 times the crack depth (1.5�a) or the total widthH, if 1.5a is larger than H. Once the bi coefficients were obtained, the stress intensity factor was then computed from:
Kða; tÞ ¼ ffiffiffiffiffiffipa
pb0i0 þ b1i1
aH
� �þ b2i1
aH
� �2þ b3i3
aH
� �3� �
; ð3Þ
where i0, i1, i2 and i3 are the tabulated influence coefficients that depend on the shape of the crack a/2c (see Fig. 15); on thecrack/tube thickness ratio a/H; on the pipe geometry (wall thickness and inner radius); on the crack orientation (axial or cir-cumferential); and on the location along the crack front. The parameters in our analysis were taken from RCC-MRx(A16.8424.1 and A16.8434.1). The influence coefficients tabulated in RCC-MRx are given for the deepest point and the edgeof the elliptical crack for a/H = 0, 0.1, 0.4, 0.4, 0.6 and 0.8 and a/c = 1, 1/2, 1/4, 1/8, 1/16 and 0 (0 for the circumferential crackcorresponds to an axisymmetric crack). Tabulated data are not available for a thickness to inner-radius (H/Ri) equal to 1.4,which corresponds to our case. Values for bn coefficients for this special case were extrapolated using the available values.For cracks deeper than 80% (a/H > 0.8), we always need to use extrapolation.
The ‘‘Handbook approach” outlined above applies in principle only to elastic conditions, whereas in our case we are obvi-ously in the plastic regime. Moreover, K values based on a fully linear elastic analysis would grossly overestimate the crack
Fig. 15. Model used for semi-elliptical circumferential (left) and axial crack (right).

K.-F. Nilsson et al. / Engineering Fracture Mechanics 168 (2016) 73–91 85
growth in a strain controlled loading as in the case of thermal fatigue. Hence, we need ‘‘plastic-equivalent” K-factors todescribe the mechanics of fatigue crack propagation [36]. This is done through the J/K-equivalence,
K ¼ffiffiffiffiffiffiffiffiffiffiffiffiffiffiffiffiffiffiffiffiffiffiffiffiJE=ð1� m2Þ
q; ð4Þ
where J is the J-integral. The J-integral applies to both elastic and elasto-plastic conditions but Eq. (3) applies strictly only toelastic conditions. In elasto-plastic conditions a ‘‘plastic equivalent” K can be derived from the computed elasto-plastic J-integral and Eq. (4).
The stresses for the K-calculation in Eq. (3) are based on elastic-plastic stresses. This accounts for the reduction of theplastic-equivalent K for strain controlled loading. This would under-predict the plastic equivalent K so we need additional‘‘plasticity correction” factors. The plastic deformation gives a higher crack tip opening displacement compared to the elasticcase, which increases the ‘‘plastic K”. If J is assumed to be proportional to the crack tip opening displacement (CTOD), whichis the case for ideal-plastic materials, then it follows from Eq. (4) that the plastic stress intensity factor is given by:
Kpl ¼ Kel �ffiffiffiffiffiffiffiffiffiffiffiffiffiffiffiffiffiffiffiffiffiffiffiffiffiffiffiffiffiffiffiffiffiffiCTODpl=CTODssy
qð5Þ
The ratio between the plastic and small-scale yielding CTOD can be approximated by a Dugdale yield-strip model for anideal plastic material [37]. The resulting CTOD plasticity correction then becomes:
Kplc1 ¼ Kða; c;H; tÞ � rf
prapp
ffiffiffiffiffiffiffiffiffiffiffiffiffiffiffiffiffiffiffiffiffiffiffiffiffiffiffiffiffiffiffiffiffiffiffiffiffiffiffiffiffiffiffiffi8log sec
prapp
2rf
� �� �s: ð6Þ
Here rapp is the mean stress over a length of 1.5 times the crack depth and rf a representative flow stress. For a hardeningmaterial, the mean value between yield stress and ultimate strength is a natural choice. When a circumferential crack getsdeeper, the remaining specimen cross section is reduced. This would eventually result in a plastic collapse from the axialload when the ligament between the crack and the outer surface becomes small. A plasticity correction for this is doneby a plastic collapse factor taken from the R6 procedure for monotonic loading [38]:
Kplc2 ¼ Kplc1
f ðLRÞ ; where f ðLRÞ ¼ ð1� 0:14LRÞ � ½0:3þ 0:7 expð�0:65L6RÞ� ð7Þ
The plastic collapse factor is,
LR ¼ F= ðA0 � AcÞ � rf
;
where F is the axial force, A0 and Ac are the uncracked cross-section of the pipe and the area of the circumferential crackrespectively. This factor is empirical, derived for monotonic loading and has significant conservatism.
Using the elasto-plastic stresses reduces the effective K-values under strain controlled loading. The CTOD plasticity cor-rection (Eq. (6)) affects mainly short cracks whereas the plastic collapse correction (Eq. (7)) only applies to a circumferentialcrack, and becomes more important for deeper cracks. The two plasticity corrections were only applied to positive stressintensity factors. Thus, using Eqs. (2)–(7) and interpolation of the influence coefficients, we computed the stress intensityfactor as function of time for an arbitrarily shaped semi-elliptic circumferential or axial crack.
3.3.2. Crack propagationThe growth of the fatigue crack was calculated from Paris Law,
ðda=dNÞf ¼ CPðDKeff Þmp ð8aÞDKeff ¼ qðKmax � KminÞ ð8bÞ
q ¼1
1�R=2 ; R > 01�R=21�R ; R < 0
(ð8cÞ
Cp and mp are specific materials parameters, Kmax and Kmin are the computed maximum andminimum stress intensity factorsduring a complete cycle for a prescribed crack, DKeff is the effective stress intensity factor range and R is the ratio betweenKmin and Kmax, q is a measure to account for the plastic crack closure. Eqs. (8a)–(8c) are taken from RCC-MRx. These formulaswere used for both 316L and P91.
Fig. 16 shows computed DKeff values versus crack depth for different values of the axial load, all with a fixed crack aspectratio c/a = 2. Fig. 16a shows the computed DKeff for 316L with and without CTOD and plastic collapse corrections. The cracktip plasticity correction is, as expected, highest for short cracks. The plastic collapse correction only affects very deep cracksand will be only seen for cracks deeper than 11 mm. Fig. 16b shows the computed DKeff at the deepest point and the surfacepoint of a circumferential crack. For crack depths beyond 4 mm the surface point has a higher DKeff which indicates that apropagating crack would tend to increase the aspect ratio. Fig. 16c compares DKeff at the deepest point for a circumferentialand axial crack. DKeff for the axial is below the value for the circumferential crack and is not affected by the axial load. Finally
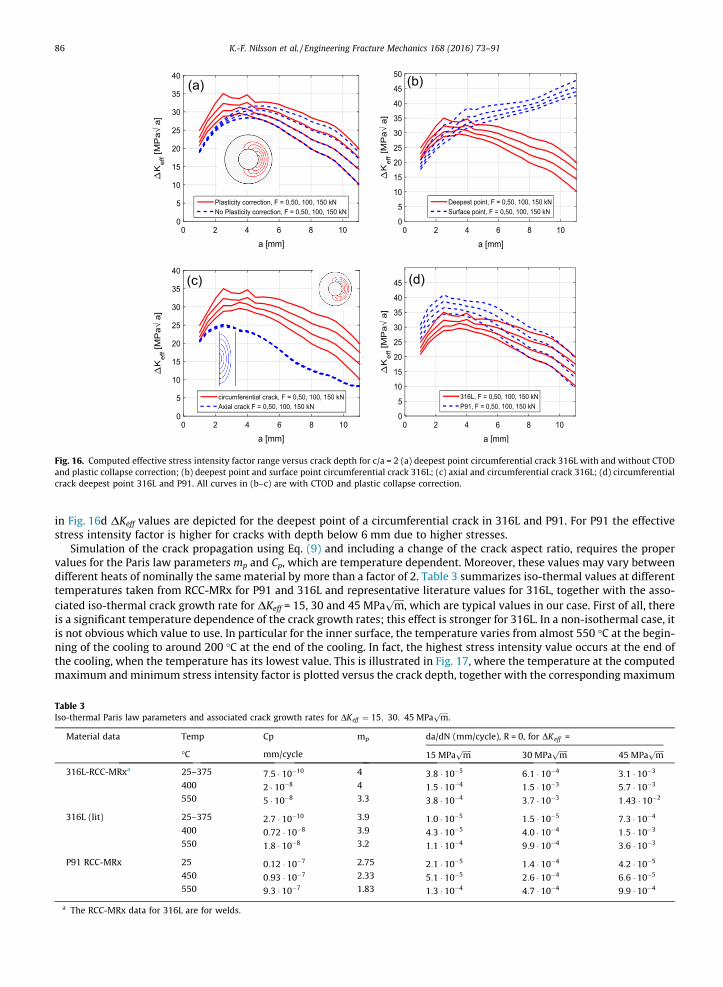
Fig. 16. Computed effective stress intensity factor range versus crack depth for c/a = 2 (a) deepest point circumferential crack 316L with and without CTODand plastic collapse correction; (b) deepest point and surface point circumferential crack 316L; (c) axial and circumferential crack 316L; (d) circumferentialcrack deepest point 316L and P91. All curves in (b–c) are with CTOD and plastic collapse correction.
86 K.-F. Nilsson et al. / Engineering Fracture Mechanics 168 (2016) 73–91
in Fig. 16d DKeff values are depicted for the deepest point of a circumferential crack in 316L and P91. For P91 the effectivestress intensity factor is higher for cracks with depth below 6 mm due to higher stresses.
Simulation of the crack propagation using Eq. (9) and including a change of the crack aspect ratio, requires the propervalues for the Paris law parameters mp and Cp, which are temperature dependent. Moreover, these values may vary betweendifferent heats of nominally the same material by more than a factor of 2. Table 3 summarizes iso-thermal values at differenttemperatures taken from RCC-MRx for P91 and 316L and representative literature values for 316L, together with the asso-ciated iso-thermal crack growth rate for DKeff = 15, 30 and 45 MPa
ffiffiffiffiffim
p, which are typical values in our case. First of all, there
is a significant temperature dependence of the crack growth rates; this effect is stronger for 316L. In a non-isothermal case, itis not obvious which value to use. In particular for the inner surface, the temperature varies from almost 550 �C at the begin-ning of the cooling to around 200 �C at the end of the cooling. In fact, the highest stress intensity value occurs at the end ofthe cooling, when the temperature has its lowest value. This is illustrated in Fig. 17, where the temperature at the computedmaximum andminimum stress intensity factor is plotted versus the crack depth, together with the corresponding maximum
Table 3Iso-thermal Paris law parameters and associated crack growth rates for DKeff ¼ 15; 30; 45 MPa
ffiffiffiffiffim
p.
Material data Temp Cp mp da/dN (mm/cycle), R = 0, for DKeff =
�C mm/cycle 15 MPaffiffiffiffiffim
p30 MPa
ffiffiffiffiffim
p45 MPa
ffiffiffiffiffim
p
316L-RCC-MRxa 25–375 7:5 � 10�10 4 3:8 � 10�5 6:1 � 10�4 3:1 � 10�3
400 2 � 10�8 4 1:5 � 10�4 1:5 � 10�3 5:7 � 10�3
550 5 � 10�8 3.3 3:8 � 10�4 3:7 � 10�3 1:43 � 10�2
316L (lit) 25–375 2:7 � 10�10 3.9 1:0 � 10�5 1:5 � 10�5 7:3 � 10�4
400 0:72 � 10�8 3.9 4:3 � 10�5 4:0 � 10�4 1:5 � 10�3
550 1:8 � 10�8 3.2 1:1 � 10�4 9:9 � 10�4 3:6 � 10�3
P91 RCC-MRx 25 0:12 � 10�7 2.75 2:1 � 10�5 1:4 � 10�4 4:2 � 10�5
450 0:93 � 10�7 2.33 5:1 � 10�5 2:6 � 10�4 6:6 � 10�5
550 9:3 � 10�7 1.83 1:3 � 10�4 4:7 � 10�4 9:9 � 10�4
a The RCC-MRx data for 316L are for welds.

Tem
pera
ture
[C° ]
Fig. 17. Temperature at the crack tip location for a semi-elliptical circumferential crack at computed maximum and minimum K-values together with themaximum and minimum temperatures during the cycle.
K.-F. Nilsson et al. / Engineering Fracture Mechanics 168 (2016) 73–91 87
and minimum temperatures during the load cycle. The relationship between the temperature and stress intensity factor ismore complicated than between stress and temperature, since the stress intensity factor depends on the total stress distri-bution across the wall. Also in this case, the stress intensity factors and temperatures are out of phase. There is much lessthermo-mechanical fatigue data on crack propagation than pure fatigue curves. Jacobsson et al. [39] noted the best agree-ment with thermo-mechanical crack growth tests experiments if the crack parameters were taken from the temperatureat maximum K, which, in our case, would mean 250 �C for a 1 mm deep crack.
For P91 we used the values given in RCC-MRx, which are in line with literature data [40–42]; whereas for 316L RCC-MRxonly gives the value for weld material, which gives a much higher crack growth rate than typical literature values. We there-fore use the literature data for 316L, [43–45]. Moreover, we will use the parameters for the maximum temperature (550 �C).This is expected to provide a conservative estimate of the crack growth rates.
3.4. Total thermal fatigue life assessment
We now have defined the tools to perform a total life assessment of the thermal fatigue test which includes the formationof a 1 mm deep crack and the propagation of the 1 mm crack until it becomes a surface breaking crack.
For the formation of a the 1 mm crack, which includes initiation of surface cracks and propagation of a short crack, weused the total strain range and the RCC-MRx design fatigue curves with a reduction factor of 4.8, as described above. Theused number of cycles for the 1 mm crack formation is 2000 cycles for 316L and 18,700 cycles for P91. The same values wereused for longitudinal and axial cracks and were independent of the applied axial load.
For the crack propagation, we computed the stress intensity factors at the deepest point and the surface point for a singlesemi-elliptic or axi-symmetric crack using the Eqs. (2)–(8). The crack propagation was calculated by cycle-by-cycle integra-tion for the deepest and surface points (see Fig. 15),
ðda=dNÞf ¼ CPðDKdeepeff Þmp
; aiþ1 ¼ ai þ dadN ;
ðdc=dNÞf ¼ CPðDKsurfeff Þmp
; ciþ1 ¼ aci þ dcdN ;
9=;: ð9Þ
This approach simulates in a natural way the change of the crack shape. When the length along the inner surface for axialcrack reaches the length of the pipe’s inner perimeter (i:e: 2c ¼ 2pRi ¼ 62:83 mm), Ri the inner radius of the pipe, weswitched from the Handbook solution of a semi-elliptic crack to an axi-symmetric crack. The stress used for the plasticitycorrections Eqs. (6) and (7) was 400 MPa for P91 and 350 MPa for 316L.
The depth of the initial crack from which we start the crack propagation, a0, is specified to be 1 mm. The crack propaga-tion rate depends also on the specified initial crack aspect ratio. It was stated above that shallow cracks were close to axi-symmetric in some cases, e.g. for TFR16. In some other cases shallow cracks were semi-elliptical with a relatively smallaspect ratio. To assess the influence of the initial shape we will analyse two cases: the first one with an aspect ratio c0/a0 = 2, which can be seen as a lower boundary for shallow cracks; the second case involves an axi-symmetric starter crackfor the circumferential crack and a corresponding aspect ratio for the axial crack, e.g. 2c0/a0 = 2Rip, which is an upper bound.
Fig. 18 shows computed crack depths versus number of cycles for some different cases together with some experimentaldata. Fig. 18a-c is for 316L.

Fig. 18. Computed crack depth versus number of cycles together with selected experimental data (a) circumferential crack, 316L c0/a0 = 2, with and withoutCTOD and plastic collapse correction; (b) 316L circumferential crack with c0/a0 = 2 and axisymmetric; (c) 316L circumferential and axial crack c0/a0 = 2 andpRi; (d) 316L and P91 circumferential crack c0/a0 = 2 and axisymmetric. All curves (c-d) are with CTOD and plastic collapse correction.
88 K.-F. Nilsson et al. / Engineering Fracture Mechanics 168 (2016) 73–91
Fig. 18a shows the result for a circumferential crack c0/a0 = 2, based on the elastic-plastic stresses but without and withand the plasticity corrections from Eqs. (6) and (7). The case without CTOD and plastic collapse corrections underestimatesthe crack growth rate with a large margin. The plasticity corrections give better agreement with the experimental data, butthe prediction is still non-conservative.
In Fig. 18b the predictions are compared for the axi-symmetric and semi-elliptical starter crack (c0/a0 = 2), in both caseswith the CTOD and plastic collapse corrections. The axi-symmetric case gives an excellent prediction for TFR12 and TFR14with F = 150 kN. For TFR 15 and TFR16 with F = 100 kN the predictions slightly underestimate the crack growth. For the caseTFR5 with F = 50 kN, the semi-elliptical starter crack gives a good estimate whereas the axi-symmetric case slightly overes-timates the crack growth rate. In the simulation, the semi-elliptical crack becomes axi-symmetric at a depth of about 10 mm.These predictions are in good agreement with the experimental observations that an axial force of 100 or 150 kN promotesshallow cracks that are almost axi-symmetric; whereas an axial load of 50 kN results in both axial and circumferential cracksof complex shape.
Fig. 18c plots the axial and circumferential crack depth evolution together with the experimental results for the case F = 0.The predictions are for c0/a0 = 2 and Rip. The crack depth is similar for both crack geometries and for crack depths beyond10 mm; the axial crack becomes the deepest one. The predictions are in good agreement with TFR3, whereas for TFR1 themodel over-predicts the crack depth for the circumferential crack and underestimate it for the axial crack. The large differ-ence between TFR1 and TFR3 is a clear indication of scatter. We know from the experiments that in this case the pipe cancontain a large number of cracks and crack interaction may be the main reason for the discrepancy between the two nom-inally identical tests.
Finally in Fig. 18d the predicted crack depth evolution is depicted for P91 and 316L for F = 150 kN. The agreement for bothmaterials is quite good given the various model assumptions. The longer fatigue life for P91 is mainly due to the later for-mation of the 1 mm crack. As mentioned in the introduction, P91 has a much higher ‘‘thermal fatigue resistance”. For thecrack propagation, the effective stress intensity factor is higher for P91 as shown in Fig. 16d, but P91 has better fatigue crackgrowth resistance as seen in Table 3, leading to a somewhat slower crack propagation rate for this case.

K.-F. Nilsson et al. / Engineering Fracture Mechanics 168 (2016) 73–91 89
4. Discussion
The crack initiation and crack propagation in a component subjected to thermal fatigue loading is controlled by a com-bination of complex non-isothermal loadings, interaction of multiple axial and circumferential cracks and depends on thespecifics of the materials, which are difficult to determine with high accuracy. A total life assessment therefore needs a num-ber of simplifications, as in our case, that seem very drastic at first. Nevertheless, the overall agreement between predictionsand the experiments is rather good. In order to further confirm this and evaluate additional improvements, more test dataare required. As an intermediate step, it is interesting to review the various assumptions and to what extent it is possible toimprove our engineering model.
The underlying mechanisms for the formation of a 1 mm crack are very complex and are affected by the microstructuralfeatures, such as grain size and orientation, and hence includes inherent scatter. The adopted approach based on design fati-gue curves with safety factors determined from experiments is a natural approach. However, it would need to be verified bymore data for crack initiation and short crack growth.
The propagation from a 1 mm deep starter crack depends on the assumed initial defect shape. This effect was quite sig-nificant for the circumferential crack and increased with the amplitude of the axial load. Since the loading is axi-symmetric,it is natural to assume an axi-symmetric circumferential starter crack. It was noted from the crack depth measurements thatcracks for the cases with F = 100 and 150 kN were indeed close to axi-symmetric, but for the cases with lower axial load thiswas not the case. The faster crack growth for TFR15 compared to TFR12 could be attributed to the differences in crack shape,as illustrated in Fig. 4b and c, where the more planar and axi-symmetric shape in TFR15 promotes faster growth than forTFR12. The shape of the starter crack is expected to have some inherent variation, which would be one contributor to vari-ations in fatigue life. From our modelling point of view there is no restriction on crack aspect ratio for a single crack, as longas it is semi-elliptical.
For the cases with an axial load of 100 or 150 kN, the experiments indicate the formation of a dominant circumferentialcrack, which explains the very good agreement between the tests and the simulations. For the cases with an axial load of 0 or50 kN, we know that a very complex cracking develops, including both axial and circumferential cracks interacting and coa-lescing into complex macro-cracks, as indicated by Fig. 4a. Crack interaction may promote or accelerate propagation of thedeepest cracks. Multiple cracking increases the compliance of the pipe component. Under thermal fatigue loading, which isstrain controlled, multi-cracking is expected to reduce the crack propagation rate; whereas for the axial primary loads theopposite effect is expected. Interaction between adjacent individual parallel crack depends on the size and distance betweenthe cracks; it would generally accelerate crack growth but the opposite can also occur. A third type of interaction would bewhen an axial and a circumferential crack link-up. TFR3 has a large number of axial cracks but the circumferential cracksnever developed fully into circumferential ones. Instead a circumferential crack would merge with an axial crack and furtherextension in the circumferential direction would be blocked, resulting in a rectangular crack shape rather than semi-elliptical as seen in Fig. 4a. In any case, modelling of crack interaction cannot be done using the Handbook solutions whichare based on single cracks. Explicitly modelling of propagation and coalescence of arbitrary interacting multiple cracks, forinstance in a FE-model, is not feasible, due to the required computational resources, as well as various additional complexmodel aspects that would need to be addressed.
Our analysis is based on the cyclic-strain curves from the RCC-MRx Design Code taken at mid-fatigue life. P91 has signif-icant softening and the initial stress-strain would have higher yield stress. This would promote higher crack propagation atearly life and would mainly affect the relatively shallow cracks in early fatigue life. Modifications to address cyclic softeningor hardening could potentially be incorporated but the analysis would be more complicated, since the change in strain rangewould need to be accounted for.
Crack tip closure effects depend on the crack geometry and the stress and strain distribution. In our analysis crack closurewas only taking into account in a very rudimentary way through the q-factor in Eq. (8c). More refined assessments wouldneed explicit modelling of elasto-plastic cracks. This is very difficult and would increase the complexity significantly. It wasshown in Figs. 12 and 13 that the nonlinear kinematic hardening model for cyclic plasticity results in substantial ratcheting.Although the ratcheting is over-predicted by the non-linear kinematic model, one would still expect quite significant ratch-eting, which also would impact the fatigue life [46,47].
The cracks propagate under non-isothermal loading. In the analysis we use the crack propagation parameters at themaximum temperature (550 �C), which should be a conservative approach. Other approaches such as relating the crackpropagation parameters to the temperature at the crack tip at when the stress intensity factor [39] could also be imple-mented as an extension to our model since we compute both the temperature and the stresses and strains at each pointin the pipe throughout the entire load-cycle. More advanced non-isothermal approaches would require more general crackpropagation laws and data than the iso-thermal Paris law in Eq. (8).
Two final points are corrosion effects and creep. The inner bore of the pipe is corroded after the test and corrosion isclearly visible. For crack initiation this should be included in the factor we used for the design fatigue curve. Fractographyof specimens, reported in [6,14], showed primarily transgranular crack propagation, which indicates that crack growth wasmainly due to fatigue. The maximum temperature is above the so-called negligible creep regime so creep-fatigue crackgrowth cannot be fully ruled out. From Fig. 10 it can be seen that any given point has tensile stresses only for a part ofthe load cycle, so there is no time to develop steady state creep. An estimate of the creep contribution per cycle was done

90 K.-F. Nilsson et al. / Engineering Fracture Mechanics 168 (2016) 73–91
in [6] by computing a C-integral for small-scale creep based on a model proposed by Riedel [48]. Using the maximum C-valueand integrating it over the load cycle gave a creep contribution much smaller than the fatigue contribution. Based on thisplus the observed transgranular crack growth, we conclude that creep effects are negligible.
In summary, the proposed model seems to predict the fatigue life of the tested pipe components quite well. It should bestressed that the thermal loads in our experiments are much higher than what can be expected for components under oper-ation. For instance for sodium fast reactors the temperature variation between coolant and the component’s maximum tem-perature seldom exceeds 100 �C and 200 �C could be seen as an upper limit. The thermal-shock frequency can be quite high,up to 10 Hz for the upper core structure in a sodium fast reactor. The approach outlined in this paper could, of course, beadopted and the deformation would primarily be elastic, which simplifies the analysis, and the sinusoidal method [49] couldbe applied. Test with lower temperature excursions, while keeping the same maximum temperature, would require a testfacility with sodium or a cooling medium with similar physical properties (in particular heat transfer coefficient).
5. Conclusions
In this paper we have presented low-cycle thermal fatigue tests of pipe components made of P91 tempered ferritic-martensitic steel and 316L austenitic steel, heated up to 550 �C and cooled by cyclic water down-shocks in combination withdifferent amplitudes of a static axial load. The evolution of the cracking was measured by time-of-flight ultrasounds diffrac-tion and X-ray computed tomography. By increasing the axial load, the fatigue life was reduced. For low axial loads thecracking was very complex with both circumferential and axial cracks, whereas for high axial loads a dominant circumfer-ential crack developed. P91 had better resistance than 316L against initiation of thermal fatigue cracks.
The tests were analysed by an engineering model that included a thermal finite element analysis to capture the temper-ature variations and a finite element elasto-plastic analysis of an un-cracked pipe to compute the associated stresses andstrains. The fatigue life, including the formation of a 1 mm deep crack and the propagation to a surface breaking crack,was computed by post-processing of the stress and strain results. Even though the analysis of this complex problem is basedon a number of simplifying assumptions, in particular the single crack assumption, the predicted crack growth versus num-ber of cycles is in quite good agreement with the experimental results and captures the observed difference between the twomaterials and the impact of the axial load. The model can be used as an engineering tool to predict the thermal fatigue life ofcomponents exposed to representative conditions.
Acknowledgement
The research leading to these results is partly funded by the European Atomic Energy Community’s (Euratom) SeventhFramework Programme FP7/2007-2013 under grant agreement No. 604862 (MatISSE project) and in the framework of theEERA (European Energy Research Alliance) Joint Programme on Nuclear Materials.
References
[1] Halford GH. Low-cycle thermal fatigue in NASA technical memorandum. Ohio 44135: National Aeronautics and Space Administration Lewis ResearchCenter Cleveland; 1986.
[2] Manson SS, Halford GR. Fatigue and durability of structural materials. Materials Park, Ohio 44073-0002: ASM International; 2006. ISBN-10:0871708256.
[3] Kadlec M, Haušild P, Siegl J, Materna A, Bystriansky J. Thermal fatigue crack growth in stainless steel. Int J Press Vessels Pip 2012;98:89–94.[4] Lu TJ, Fleck NA. The thermal shock resistance of solids. Acta Mater 1998;46(13):4755–68.[5] Paffumi E, Nilsson KF, Taylor NG. Simulation of thermal fatigue damage in a 316L model pipe component. Int J Press Vessels Pip 2008;85(11):798–813.[6] Paffumi E, Nilsson KF, Szaraz Z. Experimental and numerical assessment of thermal fatigue in 316 austenitic steel pipes. Eng Fail Anal 2015;47
(PB):312–27.[7] Charkaluc E, Rémy L. Thermal fatigue. In: Bathias C, Pineau A, editors. Fatigue of materials and structures, application to design and damage. London,
UK: ISTE Ltd; 2011 [chapter 7].[8] Wakai T, Inoue O, Ando M, Kobayashi S. Thermal fatigue crack growth tests and analyses of thick wall cylinder made of Mod. 9Cr–1Mo steel. Nucl Eng
Des 2015;295:797–803.[9] Chellapandi P, Chetal SC, Raj B. Thermal striping limits for components of sodium cooled fast spectrum reactors. Nucl Eng Des 2009;239(12):2754–65.[10] AFCEN. RCC-MRx design and construction rules for mechanical components of nuclear installations 2012 edition. Paris: AFCEN; 2012.[11] Charlesworth JP, Terple JAG. Engineering applications of ultrasonic time-of-flight diffraction research studies. John Wiley & Sons Inc; 1989.[12] Nilsson K-F et al. Analysis of crack morphologies and patterns from thermal fatigue using X-ray tomography. Procedia Mater Sci 2014;3:2180–6.[13] Ando M et al. Thermal transient test and strength evaluation of a thick cylinder model made of Mod. 9Cr-1Mo steel. Nucl Eng Des 2013;255:296–309.[14] González S, Ruiz A, Nilsson K-F. Microstructural analysis of thermal fatigue damage in 316L pipes. JRC scientific and policy reports; 2013.[15] Kurul NP, Podowski MZ. On the modeling of multidimensional effects in boiling channels. In: Proc of the 27th national heat transfer conference.
Minneapolis, MN; 1991.[16] Holman JP. Heat transfer. 10th ed. Boston: McGraw Hill; 2010.[17] Chaboche JL. Time-independent constitutive theories for cyclic plasticity. Int J Plast 1986;2(2):149–88.[18] Chaboche JL. Constitutive equations for cyclic plasticity and cyclic viscoplasticity. Int J Plast 1989;5(3):247–302.[19] Lemaitre J, Chaboche J-L. Mechanics of solid materials. Cambridge University Press; 1990.[20] Armstrong PJ, Frederick CO. A mathematical representation of the multiaxial Bauschinger effect; GEGB Report RD/B/N 7311966.[21] Farragher TP, Scully S, O’Dowd N, Leen SB. Development of life assessment procedures for power plant headers operated under flexible loading
scenarios. Int J Fatigue 2013;49:50–61.[22] Gorash Y, MacKenzie D. Safe structural design for fatigue and creep using cyclic yield strength. In: 3rd international ECCC creep & fracture conference.
Rome, Italy: Barceló Aran Mantegna Hotel; 2014.[23] Fournier B et al. Lifetime prediction of 9–12%Cr martensitic steels subjected to creep–fatigue at high temperature. Int J Fatigue 2010;32(6):971–8.
K.-F. Nilsson et al. / Engineering Fracture Mechanics 168 (2016) 73–91 91
[24] Guguloth K, Sivaprasad S, Chakrabarti D, Tarafder S. Low-cyclic fatigue behavior of modified 9Cr–1Mo steel at elevated temperature. Mater Sci Eng, A2014;604:196–206.
[25] Nagesha A et al. Isothermal and thermomechanical fatigue studies on a modified 9Cr–1Mo ferritic martensitic steel. Mater Sci Eng, A2012;554:95–104.
[26] Hong S-G, Lee S-B, Byun T-S. Temperature effect on the low-cycle fatigue behavior of type 316L stainless steel: cyclic non-stabilization and aninvariable fatigue parameter. Mater Sci Eng, A 2007;457(1–2):139–47.
[27] Škorík V, Šulák I, Obrtlík K, Polák J. Thermo-mechanical and isothermal fatigue behavior of austenitic stainless steel AISI 316L. Brno, Czech Republic:METAL; 2015.
[28] Nagesha A et al. A comparative study of isothermal and thermomechanical fatigue on type 316L(N) austenitic stainless steel. Mater Sci Eng, A 2010;527(21–22):5969–75.
[29] Rémy L, Szmytka F, Bucher L. Constitutive models for bcc engineering iron alloys exposed to thermal–mechanical fatigue. Int J Fatigue 2013;53:2–14.[30] Chaboche JL. On some modifications of kinematic hardening to improve the description of ratcheting effects. Int J Plast 1991;7(7):661–78.[31] Obrtlık K, Polák J, Hájek M, Vašek A. Short fatigue crack behaviour in 316L stainless steel. Int J Fatigue 1997;19(6):471–5.[32] Skelton RP. The treatment of very short crack growth in low cycle fatigue and creep fatigue. Mater High Temp 2015;32(3):323–39.[33] Pineau A, Antolovich SD. High temperature fatigue: behaviour of three typical classes of structural materials. Mater High Temp 2015;32(3):298–317.[34] Shankar V et al. Low cycle fatigue and thermo-mechanical fatigue behavior of modified 9Cr–1Mo ferritic steel at elevated temperatures. J Nucl Mater
2012;420(1–3):23–30.[35] Raju IS, Newman JJC. Stress-intensity factors for internal and external surface cracks in cylindrical vessels. J Pressure Vessel Technol 1982;104
(4):293–8.[36] Rice JR. Mechanics of crack tip deformation and extension by fatigue, In: J. Grosskreutz, editor. Fatigue Crack Propagation, ASTM STP 415, American
Society for Testing of Materials, ASTM; 1967. p. 217–311.[37] Dugdale DS. Yielding of steel sheets containing slits. J Mech Phys Solids 1960;8(2):100–4.[38] R6. Assessment of the integrity of structures containing defects. British energy report; 2001.[39] Jacobsson L, Persson C, Melin S. In-situ ESEM study of thermo-mechanical fatigue crack propagation. Mater Sci Eng, A 2008;496(1–2):200–8.[40] Babu MN, Swain SK, Dutt BS, Venugopal S, Sasikala G, editors. Influence of long-term ageing on fatigue crack growth behaviour of P91 steel at different
temperatures. In: Srivatsan TS, Imam MA, Srinivasan R, editors. Fatigue of materials III: advances and emergences in understanding. TMS (TheMinerals, Metals and Materials Society); 2014.
[41] Chaswal V et al. Fatigue crack growth mechanism in aged 9Cr–1Mo steel: threshold and Paris regimes. Mater Sci Eng, A 2005;395(1–2):251–64.[42] Reytier M. Fatigue crack growth in large cracked plates of martensitic p91 steel at 550 C. OMMI 2004;3(1).[43] Boyer HE. Atlas of fatigue curves. In: Boyer HE, editor. Materials Park, Ohio: ASM lnternatlonal; 1985.[44] Mills WJ, James LA. Fatigue crack propagation behaviour of type 316 stainless steel at elevated temperature in a vacuum. Int J Fatigue 1988;10(1):33–6.[45] Huthmann H, Picker C. Behaviour of short fatigue cracks in austenitic stainless steels, literature review. European Commission; 1995.[46] Tong J, Zhao LG, Lin B. Ratcheting strain as a driving force for fatigue crack growth. Int J Fatigue 2013;46:49–57.[47] Tong J et al. Near-tip strain ratcheting and crack growth at elevated temperature. Int J Fatigue 2016;82(Part 3):514–20.[48] Riedel H. Fracture at high temperatures. Materials research and engineering. Berlin: Springer Verlag; 1987.[49] Paffumi E, Radu V, Nilsson KF. Thermal fatigue striping damage assessment from simple screening criterion to spectrum loading approach. Int J Fatigue
2013;53:92–104.