
ENGINEERING COOKBOOK - Healthy Heating...1 Fan Types Axial Fan - An axial fan discharges air...
108
ENGINEERING COOKBOOK A Handbook for the Mechanical Designer
Transcript of ENGINEERING COOKBOOK - Healthy Heating...1 Fan Types Axial Fan - An axial fan discharges air...

ENGINEERING COOKBOOK
A Handbookfor theMechanicalDesigner
LOREN COOK COMPANY2015 E. DALE STREET SPRINGFIELD, MO 65803-4637
417.869.6474 FAX 417.862.3820www.lorencook.com

A Handbookfor the
Mechanical Designer
Second Edition
Copyright 1999
This handy engineering information guide is a token of
Loren Cook Company’s appreciationto the many fine mechanical designers
in our industry.
Springfield, MO

Fan Basics
Fan Types . . . . . . . . . . . . . . . . . . . . . . . . . . . . . . . . . . . . . . . 1Fan Selection Criteria . . . . . . . . . . . . . . . . . . . . . . . . . . . . . . 1Fan Laws. . . . . . . . . . . . . . . . . . . . . . . . . . . . . . . . . . . . . . . 2Fan Performance Tables and Curves . . . . . . . . . . . . . . . . . . 2Fan Testing - Laboratory, Field . . . . . . . . . . . . . . . . . . . . . . . 2Air Density Factors for Altitude and Temperature . . . . . . . . . 3Use of Air Density Factors - An Example . . . . . . . . . . . . . . . 3Classifications for Spark Resistant Construction . . . . . . . .4-5Impeller Designs - Centrifugal. . . . . . . . . . . . . . . . . . . . . . .5-6Impeller Designs - Axial . . . . . . . . . . . . . . . . . . . . . . . . . . . . 7Terminology for Centrifugal Fan Components. . . . . . . . . . . . 8Drive Arrangements for Centrifugal Fans . . . . . . . . . . . . .9-10Rotation & Discharge Designations for Centrifugal Fans 11-12Motor Positions for Belt or Chain Drive Centrifugal Fans . . 13Fan Installation Guidelines . . . . . . . . . . . . . . . . . . . . . . . . . 14Fan Troubleshooting Guide . . . . . . . . . . . . . . . . . . . . . . . . . 15
Motor and Drive Basics
Definitions and Formulas . . . . . . . . . . . . . . . . . . . . . . . . . . 16Types of Alternating Current Motors . . . . . . . . . . . . . . . .17-18Motor Insulation Classes. . . . . . . . . . . . . . . . . . . . . . . . . . . 18Motor Service Factors . . . . . . . . . . . . . . . . . . . . . . . . . . . . . 19Locked Rotor KVA/HP. . . . . . . . . . . . . . . . . . . . . . . . . . . . . 19Motor Efficiency and EPAct . . . . . . . . . . . . . . . . . . . . . . . . . 20Full Load Current . . . . . . . . . . . . . . . . . . . . . . . . . . . . . .21-22General Effect of Voltage and Frequency . . . . . . . . . . . . . . 23Allowable Ampacities of Not More Than Three Insulated Conductors . . . . . . . . . . . . . . . . . . . . . . . . .24-25Belt Drives. . . . . . . . . . . . . . . . . . . . . . . . . . . . . . . . . . . . . . 26Estimated Belt Drive Loss . . . . . . . . . . . . . . . . . . . . . . . . . . 27Bearing Life . . . . . . . . . . . . . . . . . . . . . . . . . . . . . . . . . . . . . 28
System Design Guidelines
General Ventilation . . . . . . . . . . . . . . . . . . . . . . . . . . . . . . . 29Process Ventilation . . . . . . . . . . . . . . . . . . . . . . . . . . . . . . . 29Kitchen Ventilation. . . . . . . . . . . . . . . . . . . . . . . . . . . . . . . . 30Sound . . . . . . . . . . . . . . . . . . . . . . . . . . . . . . . . . . . . . . . . . 31Rules of Thumb . . . . . . . . . . . . . . . . . . . . . . . . . . . . . . .31-32Noise Criteria . . . . . . . . . . . . . . . . . . . . . . . . . . . . . . . . . . . 32
Table of Contents

System Design Guidelines (cont.)
Sound Power and Sound Power Level. . . . . . . . . . . . . . . . . 32Sound Pressure and Sound Pressure Level . . . . . . . . . . . . 33Room Sones —dBA Correlation . . . . . . . . . . . . . . . . . . . . . 33Noise Criteria Curves. . . . . . . . . . . . . . . . . . . . . . . . . . . . . . 34Design Criteria for Room Loudness. . . . . . . . . . . . . . . . .35-36Vibration. . . . . . . . . . . . . . . . . . . . . . . . . . . . . . . . . . . . . . . . 37Vibration Severity . . . . . . . . . . . . . . . . . . . . . . . . . . . . . .38-39
General Ventilation Design
Air Quality Method . . . . . . . . . . . . . . . . . . . . . . . . . . . . . . . . 40Air Change Method . . . . . . . . . . . . . . . . . . . . . . . . . . . . . . . 40Suggested Air Changes. . . . . . . . . . . . . . . . . . . . . . . . . . . . 41Ventilation Rates for Acceptable Indoor Air Quality . . . . . . . 42Heat Gain From Occupants of Conditioned Spaces . . . . . . 43Heat Gain From Typical Electric Motors. . . . . . . . . . . . . . . . 44Rate of Heat Gain Commercial Cooking Appliances in Air-Conditioned Areas. . . . . . . . . . . . . . . . . . . . . . . . . . . . 45Rate of Heat Gain From Miscellaneous Appliances . . . . . . 46Filter Comparison . . . . . . . . . . . . . . . . . . . . . . . . . . . . . . . . 46Relative Size Chart of Common Air Contaminants . . . . . . . 47Optimum Relative Humidity Ranges for Health . . . . . . . . . . 48
Duct Design
Backdraft or Relief Dampers . . . . . . . . . . . . . . . . . . . . . . . . 49Screen Pressure Drop . . . . . . . . . . . . . . . . . . . . . . . . . . . . . 50Duct Resistance. . . . . . . . . . . . . . . . . . . . . . . . . . . . . . . . . . 51Rectangular Equivalent of Round Ducts . . . . . . . . . . . . . . . 52Typical Design Velocities for HVAC Components. . . . . . . . . 53Velocity and Velocity Pressure Relationships . . . . . . . . . . . 54U.S. Sheet Metal Gauges . . . . . . . . . . . . . . . . . . . . . . . . . . 55Recommended Metal Gauges for Ducts . . . . . . . . . . . . . . . 56Wind Driven Rain Louvers. . . . . . . . . . . . . . . . . . . . . . . . . . 56
Heating & Refrigeration
Moisture and Air Relationships . . . . . . . . . . . . . . . . . . . . . . 57Properties of Saturated Steam . . . . . . . . . . . . . . . . . . . . . . 58Cooling Load Check Figures . . . . . . . . . . . . . . . . . . . . . .59-60Heat Loss Estimates . . . . . . . . . . . . . . . . . . . . . . . . . . . .61-62Fuel Comparisons . . . . . . . . . . . . . . . . . . . . . . . . . . . . . . . . 62Fuel Gas Characteristics . . . . . . . . . . . . . . . . . . . . . . . . . . . 62
Table of Contents

Heating & Refrigeration (cont.)
Estimated Seasonal Efficiencies of Heating Systems . . . . 63Annual Fuel Use . . . . . . . . . . . . . . . . . . . . . . . . . . . . . . 63-64Pump Construction Types . . . . . . . . . . . . . . . . . . . . . . . . . 64Pump Impeller Types . . . . . . . . . . . . . . . . . . . . . . . . . . . . . 64Pump Bodies . . . . . . . . . . . . . . . . . . . . . . . . . . . . . . . . . . . 65Pump Mounting Methods . . . . . . . . . . . . . . . . . . . . . . . . . 65Affinity Laws for Pumps . . . . . . . . . . . . . . . . . . . . . . . . . . . 66Pumping System Troubleshooting Guide . . . . . . . . . . . 67-68Pump Terms, Abbreviations, and Conversion Factors . . . . 69Common Pump Formulas . . . . . . . . . . . . . . . . . . . . . . . . . 70Water Flow and Piping . . . . . . . . . . . . . . . . . . . . . . . . . 70-71Friction Loss for Water Flow . . . . . . . . . . . . . . . . . . . . . 71-72Equivalent Length of Pipe for Valves and Fittings . . . . . . . 73Standard Pipe Dimensions . . . . . . . . . . . . . . . . . . . . . . . . 74Copper Tube Dimensions . . . . . . . . . . . . . . . . . . . . . . . . . 74Typical Heat Transfer Coefficients . . . . . . . . . . . . . . . . . . . 75Fouling Factors . . . . . . . . . . . . . . . . . . . . . . . . . . . . . . . . . 76Cooling Tower Ratings. . . . . . . . . . . . . . . . . . . . . . . . . . . . 77Evaporate Condenser Ratings . . . . . . . . . . . . . . . . . . . . . 78Compressor Capacity vs. Refrigerant Temperature at 100°F Condensing . . . . . . . . . . . . . . . . . . . . . . . . . . . . . 78Refrigerant Line Capacities for 134a. . . . . . . . . . . . . . . . . 79Refrigerant Line Capacities for R-22 . . . . . . . . . . . . . . . . . 79Refrigerant Line Capacities for R-502 . . . . . . . . . . . . . . . . 80Refrigerant Line Capacities for R-717 . . . . . . . . . . . . . . . . 80
Formulas & Conversion Factors
Miscellaneous Formulas . . . . . . . . . . . . . . . . . . . . . . . . 81-84Area and Circumference of Circles . . . . . . . . . . . . . . . . 84-87Circle Formula . . . . . . . . . . . . . . . . . . . . . . . . . . . . . . . . . . 87Common Fractions of an Inch . . . . . . . . . . . . . . . . . . . . 87-88Conversion Factors . . . . . . . . . . . . . . . . . . . . . . . . . . . . 88-94Psychometric Chart. . . . . . . . . . . . . . . . . . . . . . . . . . . . . . 95
Index
. . . . . . . . . . . . . . . . . . . . . . . . . . . . . . . . . . . . . . . . . 96-103
Table of Contents

1
Fan Types
Axial Fan
- An axial fan discharges air parallel to the axis of theimpeller rotation. As a general rule, axial fans are preferred forhigh volume, low pressure, and non-ducted systems.
Axial Fan Types
Propeller, Tube Axial and Vane Axial.
Centrifugal Fan
- Centrifugal fans discharge air perpendicular tothe axis of the impeller rotation. As a general rule, centrifugalfans are preferred for higher pressure ducted systems.
Centrifugal Fan Types
Backward Inclined, Airfoil, Forward Curved, and Radial Tip.
Fan Selection Criteria
Before selecting a fan, the following information is needed.• Air volume required - CFM• System resistance - SP• Air density (Altitude and Temperature)• Type of service
• Environment type• Materials/vapors to be exhausted• Operation temperature
• Space limitations• Fan type• Drive type (Direct or Belt)• Noise criteria• Number of fans• Discharge• Rotation• Motor position• Expected fan life in years
Fan Basics
2
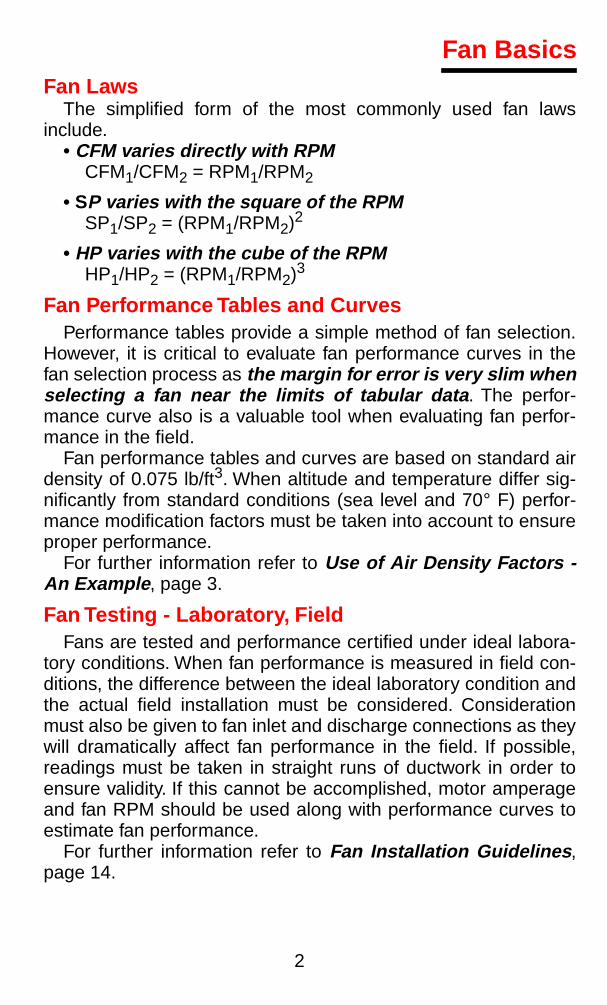
Fan Laws
The simplified form of the most commonly used fan lawsinclude.
•
CFM varies directly with RPM
CFM
1
/CFM
2
= RPM
1
/RPM
2
• S
P varies with the square of the RPM
SP
1
/SP
2
= (RPM
1
/RPM
2
)
2
•
HP varies with the cube of the RPM
HP
1
/HP
2
= (RPM
1
/RPM
2
)
3
Fan Performance Tables and Curves
Performance tables provide a simple method of fan selection.However, it is critical to evaluate fan performance curves in thefan selection process as
the margin for error is very slim whenselecting a fan near the limits of tabular data
. The perfor-mance curve also is a valuable tool when evaluating fan perfor-mance in the field.
Fan performance tables and curves are based on standard airdensity of 0.075 lb/ft
3
. When altitude and temperature differ sig-nificantly from standard conditions (sea level and 70
°
F) perfor-mance modification factors must be taken into account to ensureproper performance.
For further information refer to
Use of Air Density Factors -An Example
, page 3.
Fan Testing - Laboratory, Field
Fans are tested and performance certified under ideal labora-tory conditions. When fan performance is measured in field con-ditions, the difference between the ideal laboratory condition andthe actual field installation must be considered. Considerationmust also be given to fan inlet and discharge connections as theywill dramatically affect fan performance in the field. If possible,readings must be taken in straight runs of ductwork in order toensure validity. If this cannot be accomplished, motor amperageand fan RPM should be used along with performance curves toestimate fan performance.
For further information refer to
Fan Installation Guidelines
,page 14.
Fan Basics
3
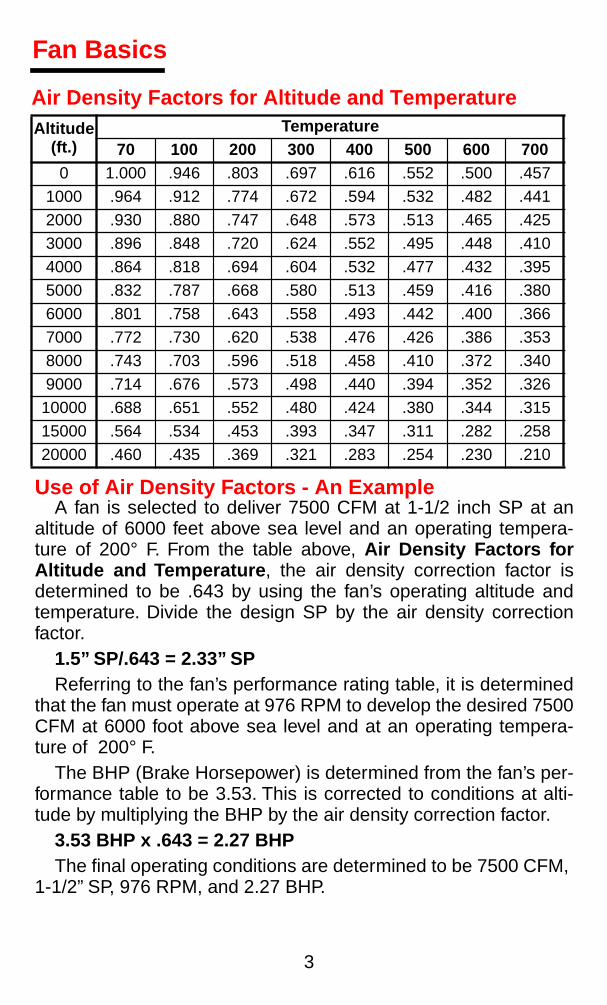
Air Density Factors for Altitude and Temperature
Altitude(ft.)
Temperature70 100 200 300 400 500 600 700
0 1.000 .946 .803 .697 .616 .552 .500 .4571000 .964 .912 .774 .672 .594 .532 .482 .4412000 .930 .880 .747 .648 .573 .513 .465 .4253000 .896 .848 .720 .624 .552 .495 .448 .4104000 .864 .818 .694 .604 .532 .477 .432 .3955000 .832 .787 .668 .580 .513 .459 .416 .3806000 .801 .758 .643 .558 .493 .442 .400 .3667000 .772 .730 .620 .538 .476 .426 .386 .3538000 .743 .703 .596 .518 .458 .410 .372 .3409000 .714 .676 .573 .498 .440 .394 .352 .32610000 .688 .651 .552 .480 .424 .380 .344 .31515000 .564 .534 .453 .393 .347 .311 .282 .25820000 .460 .435 .369 .321 .283 .254 .230 .210
Fan Basics
Use of Air Density Factors - An Example
A fan is selected to deliver 7500 CFM at 1-1/2 inch SP at analtitude of 6000 feet above sea level and an operating tempera-ture of 200
°
F. From the table above,
Air Density Factors forAltitude and Temperature
, the air density correction factor isdetermined to be .643 by using the fan’s operating altitude andtemperature. Divide the design SP by the air density correctionfactor.
1.5” SP/.643 = 2.33” SP
Referring to the fan’s performance rating table, it is determinedthat the fan must operate at 976 RPM to develop the desired 7500CFM at 6000 foot above sea level and at an operating tempera-ture of 200
°
F.The BHP (Brake Horsepower) is determined from the fan’s per-
formance table to be 3.53. This is corrected to conditions at alti-tude by multiplying the BHP by the air density correction factor.
3.53 BHP x .643 = 2.27 BHP
The final operating conditions are determined to be 7500 CFM, 1-1/2” SP, 976 RPM, and 2.27 BHP.
4
Fan applications may involve the handling of potentially explo-sive or flammable particles, fumes or vapors. Such applicationsrequire careful consideration of all system components to insurethe safe handling of such gas streams. This AMCA Standarddeals only with the fan unit installed in that system. The Standardcontains guidelines which are to be used by both the manufac-turer and user as a means of establishing general methods ofconstruction. The exact method of construction and choice ofalloys is the responsibility of the manufacturer; however, the cus-tomer must accept both the type and design with full recognitionof the potential hazard and the degree of protection required.
Construction Type
A. All parts of the fan in contact with the air or gas being han-dled shall be made of nonferrous material. Steps must alsobe taken to assure that the impeller, bearings, and shaft areadequately attached and/or restrained to prevent a lateralor axial shift in these components.
B. The fan shall have a nonferrous impeller and nonferrousring about the opening through which the shaft passes. Fer-rous hubs, shafts, and hardware are allowed provided con-struction is such that a shift of impeller or shaft will notpermit two ferrous parts of the fan to rub or strike. Stepsmust also be taken to assure the impeller, bearings, andshaft are adequately attached and/or restrained to preventa lateral or axial shift in these components.
C. The fan shall be so constructed that a shift of the impeller orshaft will not permit two ferrous parts of the fan to rub orstrike.
Notes
1. No bearings, drive components or electrical devices shallbe placed in the air or gas stream unless they are con-structed or enclosed in such a manner that failure of thatcomponent cannot ignite the surrounding gas stream.
2. The user shall electrically ground all fan parts.3. For this Standard, nonferrous material shall be a material
with less than 5% iron or any other material with demon-strated ability to be spark resistant.
Fan Basics
Classifications for Spark Resistant Construction†
†Adapted from AMCA Standard 99-401-86

5
Classifications for Spark Resistant Construction (cont.)
4.The use of aluminum or aluminum alloys in the presence ofsteel which has been allowed to rust requires special consid-eration. Research by the U.S. Bureau of Mines and othershas shown that aluminum impellers rubbing on rusty steelmay cause high intensity sparking.
The use of the above Standard in no way implies a guarantee ofsafety for any level of spark resistance. “Spark resistant construc-tion also does not protect against ignition of explosive gasescaused by catastrophic failure or from any airstream material thatmay be present in a system.”
Standard Applications
• Centrifugal Fans• Axial and Propeller Fans• Power Roof Ventilators
This standard applies to ferrous and nonferrous metals.The potential questions which may be associated with fansconstructed of FRP, PVC, or any other plastic compoundwere not addressed.
Impeller Designs - Centrifugal
Airfoil
- Has the highest efficiency of all of the centrifugal impellerdesigns with 9 to 16 blades of airfoil contourcurved away from the direction of rotation.Air leaves the impeller at a velocity less thanits tip speed. Relatively deep blades providefor efficient expansion with the blade pas-sages. For the given duty, the airfoil impellerdesign will provide for the highest speed of
the centrifugal fan designs.
Applications
- Primary applications include general heating sys-tems, and ventilating and air conditioning systems. Used in largersizes for clean air industrial applications providing significantpower savings.
Fan Basics
6
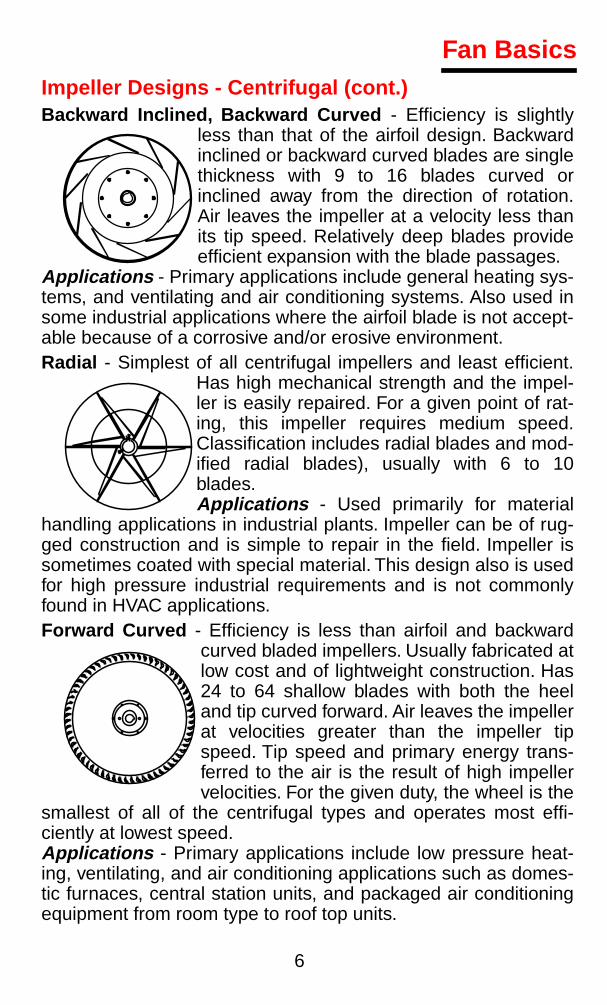
Impeller Designs - Centrifugal (cont.)
Backward Inclined, Backward Curved
- Efficiency is slightlyless than that of the airfoil design. Backwardinclined or backward curved blades are singlethickness with 9 to 16 blades curved orinclined away from the direction of rotation.Air leaves the impeller at a velocity less thanits tip speed. Relatively deep blades provideefficient expansion with the blade passages.
Applications
-
Primary applications include general heating sys-tems, and ventilating and air conditioning systems. Also used insome industrial applications where the airfoil blade is not accept-able because of a corrosive and/or erosive environment.
Radial
- Simplest of all centrifugal impellers and least efficient.Has high mechanical strength and the impel-ler is easily repaired. For a given point of rat-ing, this impeller requires medium speed.Classification includes radial blades and mod-ified radial blades), usually with 6 to 10blades.
Applications
-
Used primarily for materialhandling applications in industrial plants. Impeller can be of rug-ged construction and is simple to repair in the field. Impeller issometimes coated with special material. This design also is usedfor high pressure industrial requirements and is not commonlyfound in HVAC applications.
Forward Curved
- Efficiency is less than airfoil and backwardcurved bladed impellers. Usually fabricated atlow cost and of lightweight construction. Has24 to 64 shallow blades with both the heeland tip curved forward. Air leaves the impellerat velocities greater than the impeller tipspeed. Tip speed and primary energy trans-ferred to the air is the result of high impellervelocities. For the given duty, the wheel is the
smallest of all of the centrifugal types and operates most effi-ciently at lowest speed.
Applications
- Primary applications include low pressure heat-ing, ventilating, and air conditioning applications such as domes-tic furnaces, central station units, and packaged air conditioningequipment from room type to roof top units.
Fan Basics

7
Impeller Designs - Axial
Propeller
- Efficiency is low and usually limited to low pressureapplications. Impeller construction costs arealso usually low. General construction fea-tures include two or more blades of singlethickness attached to a relatively small hub.Energy transfer is primarily in form of velocitypressure.
Applications
- Primary applications includelow pressure, high volume air moving applications such as air cir-culation within a space or ventilation through a wall withoutattached duct work. Used for replacement air applications.
Tube Axial
- Slightly more efficient than propeller impeller designand is capable of developing a more usefulstatic pressure range. Generally, the numberof blades range from 4 to 8 with the hub nor-mally less than 50 percent of fan tip diameter.Blades can be of airfoil or single thicknesscross section.
Applications
- Primary applications includelow and medium pressure ducted heating, ventilating, and airconditioning applications where air distribution on the down-stream side is not critical. Also used in some industrial applica-tions such as drying ovens, paint spray booths, and fumeexhaust systems.
Vane Axial
- Solid design of the blades permits medium to highpressure capability at good efficiencies. Themost efficient fans of this type have airfoilblades. Blades are fixed or adjustable pitchtypes and the hub is usually greater than 50percent of the fan tip diameter.
Applications
- Primary applications includegeneral heating, ventilating, and air condition-
ing systems in low, medium, and high pressure applications.Advantage where straight through flow and compact installationare required. Air distribution on downstream side is good. Alsoused in some industrial applications such as drying ovens, paintspray booths, and fume exhaust systems. Relatively more com-pact than comparable centrifugal type fans for the same duty.
Fan Basics
8
Terminology for Centrifugal Fan Components
Housing
Side Panel
Impeller
Cutoff
Blast Area
Discharge
OutletArea
Cutoff
Scroll
FrameImpellerShroud
Inlet CollarBearingSupport
Inlet
Blade
Back Plate
Fan Basics
Shaft

9
Drive Arrangements for Centrifugal Fans†
SW
- Single Width,
SI
- Single Inlet
DW
- Double Width,
DI - Double Inlet
Arr. 1 SWSI - For belt driveor direct drive connection.Impeller over-hung. Twobearings on base.
Arr. 2 SWSI - For belt driveor direct drive connection.Impeller over-hung. Bearingsin bracket supported by fanhousing.
Arr. 3 SWSI - For belt driveor direct drive connection.One bearing on each sidesupported by fan housing.
Arr. 3 DWDI - For belt driveor direct connection. Onebearing on each side andsupported by fan housing.
Fan Basics
†Adapted from AMCA Standard 99-2404-78
10
Drive Arrangements for Centrifugal Fans (cont.)SW - Single Width, SI - Single InletDW - Double Width, DI - Double Inlet
Arr. 8 SWSI - For belt driveor direct connection.Arrangement 1 plusextended base for primemover.
Arr. 7 DWDI - For belt driveor direct connection.Arrangement 3 plus base forprime mover.
Arr. 10 SWSI - For beltdrive. Impeller overhung,two bearings, with primemover inside base.
Arr. 9 SWSI - For belt drive.Impeller overhung, twobearings, with prime moveroutside base.
Fan Basics
Arr. 4 SWSI - For directdrive. Impeller over-hung onprime mover shaft. No bear-ings on fan. Prime moverbase mounted or integrallydirectly connected.
Arr. 7 SWSI - For belt driveor direct connection.Arrangement 3 plus base forprime mover.

11
Rotation & Discharge Designations forCentrifugal Fans*
Clockwise
Top Horizontal
CounterclockwiseTop Angular Down
Clockwise Counterclockwise
Top Angular Up
Clockwise Counterclockwise
* Rotation is always as viewed from drive side.
Down Blast
Clockwise Counterclockwise
Fan Basics
12
* Rotation is always as viewed from drive side.
Rotation & Discharge Designations forCentrifugal Fans* (cont.)
Clockwise CounterclockwiseBottom Horizontal
Clockwise Counterclockwise
Bottom Angular Down
Clockwise Counterclockwise
Bottom Angular Up
Clockwise Counterclockwise
Up Blast
Fan Basics

13
Motor Positions for Belt Drive Centrifugal Fans†
To determine the location of the motor, face the drive side of thefan and pick the proper motor position designated by the lettersW, X, Y or Z as shown in the drawing below.
†Adapted from AMCA Standard 99-2404-78
Fan Basics
14
Correct Installations
Incorrect Installations
Turbulence Turbulence
Limit slope to7° diverging
Cross-sectionalarea not greaterthan 112-1/2% of
inlet area
Limit slope to15° converging
Cross-sectionalarea not greaterthan 92-1/2% of
inlet area
x
Minimum of 2-1/2inlet diameters
(3 recommended)
Correct InstallationsLimit slope to
15° converging
Cross-sectional areanot greater than 105%
of outlet area
Limit slope to7° diverging
Cross-sectional areanot greater than 95%
of outlet area
x
Minimum of 2-1/2outlet diameters
(3 recommended)
Incorrect Installations
TurbulenceTurbulence
Fan Installation GuidelinesCentrifugal Fan Conditions
Typical Inlet Conditions
Typical Outlet Conditions
Fan Basics

15
Fan Troubleshooting GuideLow Capacity or Pressure
• Incorrect direction of rotation – Make sure the fan rotates in same direction as the arrows on the motor or belt drive assembly.
• Poor fan inlet conditions –There should be a straight, clear duct at the inlet.
• Improper wheel alignment.
Excessive Vibration and Noise• Damaged or unbalanced wheel.• Belts too loose; worn or oily belts.• Speed too high.• Incorrect direction of rotation. Make sure the fan rotates in
same direction as the arrows on the motor or belt drive assembly.
• Bearings need lubrication or replacement.• Fan surge.
Overheated Motor• Motor improperly wired. • Incorrect direction of rotation. Make sure the fan rotates in
same direction as the arrows on the motor or belt drive assembly.
• Cooling air diverted or blocked.• Improper inlet clearance.• Incorrect fan RPM.• Incorrect voltage.
Overheated Bearings• Improper bearing lubrication.• Excessive belt tension.
Fan Basics

16
% slip =(synchronous speed - actual speed)
synchronous speedX 100
Definitions and Formulas
Alternating Current
: electric current that alternates or reversesat a defined frequency, typically 60 cycles per second (Hertz) inthe U.S. and 50 Hz in Canada and other nations.
Breakdown Torque
: the maximum torque a motor will developwith rated voltage and frequency applied without an abrupt dropin speed.
Efficiency
: a rating of how much input power an electric motorconverts to actual work at the rotating shaft expressed in per-cent.
% efficiency = (power out / power in) x 100
Horsepower
: a rate of doing work expressed in foot-pounds perminute.
HP = (RPM x torque) / 5252 lb-ft.
Locked Rotor Torque
: the minimum torque that a motor willdevelop at rest for all angular positions of the rotor with rated volt-age and frequency applied.
Rated Load Torque
: the torque necessary to produce ratedhorsepower at rated-load speed.
Single Phase AC
: typical household type electric powerconsisting of a single alternating current at 110-115 volts.
Slip
: the difference between synchronous speed and actualmotor speed. Usually expressed in percent slip.
Synchronous speed
: the speed of the rotating magnetic field inan electric motor.
Synchronous Speed = (60 x 2f) / p
Where: f = frequency of the power supplyp = number of poles in the motor
Three Phase AC
: typical industrial electric power consisting of 3alternating currents of equal frequency differing in phase of 120degrees from each other. Available in voltages ranging from 200to 575 volts for typical industrial applications.
Torque
: a measure of rotational force defined in foot-pounds orNewton-meters.
Torque = (HP x 5252 lb-ft.) / RPM
Motor and Drive Basics

17
Types of Alternating Current Motors
Single Phase AC Motors
This type of motor is used in fan applications requiring lessthan one horsepower. There are four types of motors suitable fordriving fans as shown in the chart below. All are single speedmotors that can be made to operate at two or more speeds withinternal or external modifications.
Single Phase AC Motors (60hz)
Three-phase AC Motors
The most common motor for fan applications is the three-phase squirrel cage induction motor. The squirrel-cage motor isa constant speed motor of simple construction that produces rel-atively high starting torque. The operation of a three-phasemotor is simple: the three phase current produces a rotatingmagnetic field in the stator. This rotating magnetic field causes amagnetic field to be set up in the rotor. The attraction and repul-sion of these two magnetic fields causes the rotor to turn.
Squirrel cage induction motors are wound for the followingspeeds:
Motor Type HP Range Efficiency Slip Poles/
RPM Use
Shaded Pole 1/6 to1/4 hp
low(30%)
high(14%)
4/15506/1050
small direct drive fans (low start torque)
Perm-split Cap.
Up to1/3 hp
medium(50%)
medium(10%)
4/16256/1075
small direct drive fans (low start torque)
Split-phase Up to1/2 hp
medium-high (65%)
low(4%)
2/34504/17256/11408/850
small belt drive fans (good start torque)
Capacitor-start
1/2 to34 hp
medium-high (65%)
low(4%)
2/34504/17256/11408/850
small belt drive fans (good start torque)
Number of Poles
60 HzSynchronous Speed
50 HzSynchronous Speed
2 3600 30004 1800 15006 1200 10008 900 750
Motor and Drive Basics
18
Types of Alternating Current Motors
Actual motor speed is somewhat less than synchronous speeddue to slip. A motor with a slip of 5% or less is called a “normalslip” motor. A normal slip motor may be referred to as a constantspeed motor because the speed changes very little with loadvariations. In specifying the speed of the motor on the nameplatemost motor manufacturers will use the actual speed of the motorwhich will be less than the synchronous speed due to slip.
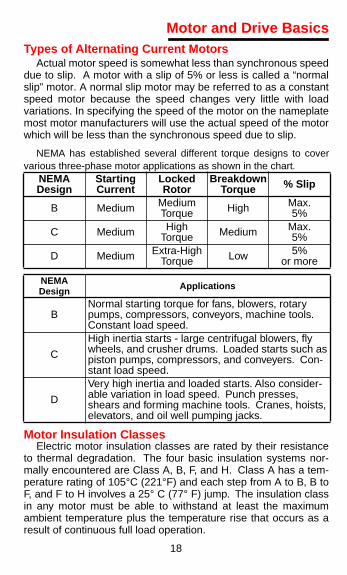
NEMA has established several different torque designs to covervarious three-phase motor applications as shown in the chart
.
Motor Insulation Classes
Electric motor insulation classes are rated by their resistanceto thermal degradation. The four basic insulation systems nor-mally encountered are Class A, B, F, and H. Class A has a tem-perature rating of 105°C (221°F) and each step from A to B, B toF, and F to H involves a 25° C (77° F) jump. The insulation classin any motor must be able to withstand at least the maximumambient temperature plus the temperature rise that occurs as aresult of continuous full load operation.
NEMADesign
StartingCurrent
LockedRotor
Breakdown Torque % Slip
B Medium Medium Torque High Max.
5%
C Medium HighTorque Medium Max.
5%
D Medium Extra-HighTorque Low 5%
or more
NEMADesign Applications
BNormal starting torque for fans, blowers, rotary pumps, compressors, conveyors, machine tools. Constant load speed.
C
High inertia starts - large centrifugal blowers, fly wheels, and crusher drums. Loaded starts such as piston pumps, compressors, and conveyers. Con-stant load speed.
D
Very high inertia and loaded starts. Also consider-able variation in load speed. Punch presses, shears and forming machine tools. Cranes, hoists, elevators, and oil well pumping jacks.
Motor and Drive Basics

19
Motor Service Factors
Some motors can be specified with service factors other than1.0. This means the motor can handle loads above the ratedhorsepower. A motor with a 1.15 service factor can handle a15% overload, so a 10 horsepower motor can handle 11.5 HP ofload. In general for good motor reliability, service factor shouldnot be used for basic load calculations. By not loading the motorinto the service factor under normal use the motor can betterwithstand adverse conditions that may occur such as higher thannormal ambient temperatures or voltage fluctuations as well asthe occasional overload.
Locked Rotor KVA/HP
Locked rotor kva per horsepower
is a rating commonly speci-fied on motor nameplates. The rating is shown as a code letteron the nameplate which represents various kva/hp ratings.
The nameplate code rating is a good indication of the startingcurrent the motor will draw. A code letter at the beginning of thealphabet indicates a low starting current and a letter at the end ofthe alphabet indicates a high starting current. Starting currentcan be calculated using the following formula:
Starting current = (1000 x hp x kva/hp) / (1.73 x Volts)
Code Letter kva/hp Code Letter kva/hp
A 0 - 3.15 L 9.0 - 10.0B 3.15 - 3.55 M 10.0 - 11.2C 3.55 - 4.0 N 11.2 - 12.5D 4.0 - 4.5 P 12.5 - 14.0E 4.5 - 5.0 R 14.0 - 16.0F 5.0 - 5.6 S 16.0 - 18.0G 5.6 - 6.3 T 18.0 - 20.0H 6.3 - 7.1 U 20.0 - 22.4J 7.1 - 8.0 V 22.4 and upK 8.0 - 9.0
Motor and Drive Basics
Motor and Drive Basics
20
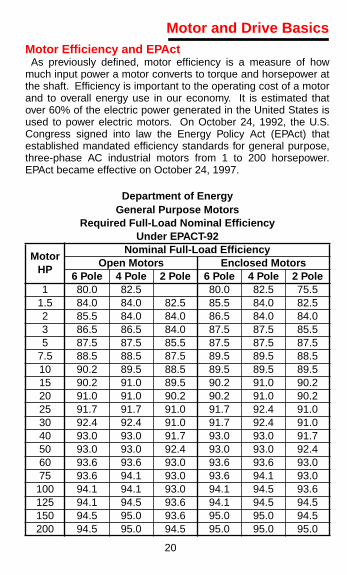
Motor Efficiency and EPActAs previously defined, motor efficiency is a measure of how
much input power a motor converts to torque and horsepower atthe shaft. Efficiency is important to the operating cost of a motorand to overall energy use in our economy. It is estimated thatover 60% of the electric power generated in the United States isused to power electric motors. On October 24, 1992, the U.S.Congress signed into law the Energy Policy Act (EPAct) thatestablished mandated efficiency standards for general purpose,three-phase AC industrial motors from 1 to 200 horsepower.EPAct became effective on October 24, 1997.
Department of Energy General Purpose Motors
Required Full-Load Nominal EfficiencyUnder EPACT-92
Motor HP
Nominal Full-Load EfficiencyOpen Motors Enclosed Motors
6 Pole 4 Pole 2 Pole 6 Pole 4 Pole 2 Pole1 80.0 82.5 80.0 82.5 75.5
1.5 84.0 84.0 82.5 85.5 84.0 82.52 85.5 84.0 84.0 86.5 84.0 84.03 86.5 86.5 84.0 87.5 87.5 85.55 87.5 87.5 85.5 87.5 87.5 87.5
7.5 88.5 88.5 87.5 89.5 89.5 88.510 90.2 89.5 88.5 89.5 89.5 89.515 90.2 91.0 89.5 90.2 91.0 90.220 91.0 91.0 90.2 90.2 91.0 90.225 91.7 91.7 91.0 91.7 92.4 91.030 92.4 92.4 91.0 91.7 92.4 91.040 93.0 93.0 91.7 93.0 93.0 91.750 93.0 93.0 92.4 93.0 93.0 92.460 93.6 93.6 93.0 93.6 93.6 93.075 93.6 94.1 93.0 93.6 94.1 93.0
100 94.1 94.1 93.0 94.1 94.5 93.6125 94.1 94.5 93.6 94.1 94.5 94.5150 94.5 95.0 93.6 95.0 95.0 94.5200 94.5 95.0 94.5 95.0 95.0 95.0

Motor and Drive Basics
Full Load Current†Single Phase Motors
† Based on Table 430-148 of the National Electric Code®, 1993. For motors running at usual speeds and motors with normal torque characteristics.
HP 115V 200V 230V1/6 4.4 2.5 2.21/4 5.8 3.3 2.91/3 7.2 4.1 3.61/2 9.8 5.6 4.93/4 13.8 7.9 6.91 16 9.2 8
1-1/2 20 11.5 102 24 13.8 123 34 19.6 175 56 32.2 28
7-1/2 80 46 4010 100 57.5 50
21

Motor and Drive Basics
Full Load Current†Three Phase MotorsA-C Induction Type-Squirrel Cage and Wound Rotor Motors*
† Branch-circuit conductors supplying a single motor shall have an ampacity not less than 125 percent of the motor full-load current rating.Based on Table 430-150 of the National Electrical Code®, 1993. For motors running at speeds usual for belted motors and with normal torque characteristics.
* For conductor sizing only
HP 115V 200V 230V 460V 575V 2300V 4000V1/2 4 2.3 2 1 0.83/4 5.6 3.2 2.8 1.4 1.11 7.2 4.15 3.6 1.8 1.4
1-1/2 10.4 6 5.2 2.6 2.12 13.6 7.8 6.8 3.4 2.73 11 9.6 4.8 3.95 17.5 15.2 7.6 6.1
7-1/2 25 22 11 910 32 28 14 1115 48 42 21 1720 62 54 27 2225 78 68 34 2730 92 80 40 3240 120 104 52 4150 150 130 65 5260 177 154 77 62 15.4 8.875 221 192 96 77 19.2 11100 285 248 124 99 24.8 14.3125 358 312 156 125 31.2 18150 415 360 180 144 36 20.7200 550 480 240 192 48 27.6Over 200 hp
Approx. Amps/hp 2.75 2.4 1.2 0.96 .24 .14
22

23
General Effect of Voltage and FrequencyVariations on Induction Motor Characteristics
CharacteristicVoltage
110% 90%
Starting Torque Up 21% Down 19%Maximum Torque Up 21% Down 19%Percent Slip Down 15-20% Up 20-30%Efficiency - Full Load Down 0-3% Down 0-2%3/4 Load 0 - Down Slightly Little Change1/2 Load Down 0-5% Up 0-1%Power Factor - Full Load Down 5-15% Up 1-7%3/4 Load Down 5-15% Up 2-7%1/2 Load Down 10-20% Up 3-10%Full Load Current Down Slightly to Up 5% Up 5-10%Starting Current Up 10% Down 10%Full Load - Temperature Rise Up 10% Down 10-15%Maximum Overload Capacity Up 21% Down 19%Magnetic Noise Up Slightly Down Slightly
CharacteristicFrequency
105% 95%
Starting Torque Down 10% Up 11%Maximum Torque Down 10% Up 11%Percent Slip Up 10-15% Down 5-10%Efficiency - Full Load Up Slightly Down Slightly3/4 Load Up Slightly Down Slightly1/2 Load Up Slightly Down SlightlyPower Factor - Full Load Up Slightly Down Slightly3/4 Load Up Slightly Down Slightly1/2 Load Up Slightly Down SlightlyFull Load Current Down Slightly Up SlightlyStarting Current Down 5% Up 5%Full Load - Temperature Rise Down Slightly Up SlightlyMaximum Overload Capacity Down Slightly Up SlightlyMagnetic Noise Down Slightly Up Slightly
Motor and Drive Basics

24
Allowable Ampacities of Not More Than Three Insulated Conductors
Rated 0-2000 Volts, 60° to 90°C (140° to 194°F), in Racewayor Cable or Earth (directly buried). Based on ambient air temper-ature of 30°C (86°F).
AWGkcmil
Temperature Rating of Copper Conductor
60°C (140°F)
TypesTW†, UF†
75°C (167°F)
TypesFEPW†, RH†, RHW†,
THHW†, THW†, THWN†, XHHW†, USE†, ZW†
90°C (194°F)
TypesTA,TBS, SA, SIS, FEP†, FEPB†,
MI, RHH†, RHW-2, THHN†, THHW†, THW-2, USE-2, XHH,
XHHW†, XHHW-2, ZW-2
18 — — 1416 — — 1814 20† 20† 25†12 25† 25† 30†10 30 35† 40†8 40 50 556 55 65 754 70 85 953 85 100 1102 95 115 1301 110 130 150
1/0 125 150 1702/0 145 175 1953/0 165 200 2254/0 195 230 260250 215 255 290300 240 285 320350 260 310 350400 280 335 380500 320 380 430600 355 420 475700 385 460 520750 400 475 535800 410 490 555900 435 520 5851000 455 545 6151250 495 590 6651500 520 625 7051750 545 650 7352000 560 665 750
Motor and Drive Basics
25
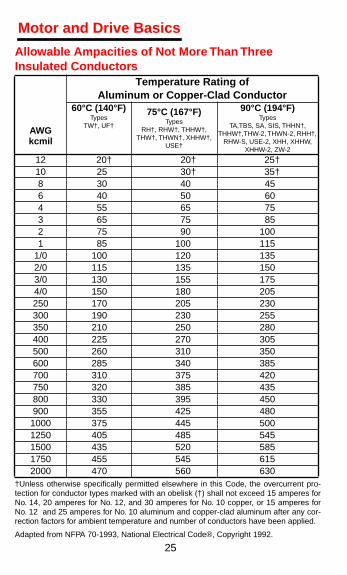
Allowable Ampacities of Not More Than Three Insulated Conductors
†Unless otherwise specifically permitted elsewhere in this Code, the overcurrent pro-tection for conductor types marked with an obelisk (†) shall not exceed 15 amperes forNo. 14, 20 amperes for No. 12, and 30 amperes for No. 10 copper, or 15 amperes forNo. 12 and 25 amperes for No. 10 aluminum and copper-clad aluminum after any cor-rection factors for ambient temperature and number of conductors have been applied.
Adapted from NFPA 70-1993, National Electrical Code®, Copyright 1992.
AWGkcmil
Temperature Rating of Aluminum or Copper-Clad Conductor
60°C (140°F)
TypesTW†, UF†
75°C (167°F)
TypesRH†, RHW†, THHW†,
THW†, THWN†, XHHW†, USE†
90°C (194°F)
TypesTA,TBS, SA, SIS, THHN†,
THHW†,THW-2, THWN-2, RHH†, RHW-S, USE-2, XHH, XHHW,
XHHW-2, ZW-2
12 20† 20† 25†10 25 30† 35†8 30 40 456 40 50 604 55 65 753 65 75 852 75 90 1001 85 100 115
1/0 100 120 1352/0 115 135 1503/0 130 155 1754/0 150 180 205250 170 205 230300 190 230 255350 210 250 280400 225 270 305500 260 310 350600 285 340 385700 310 375 420750 320 385 435800 330 395 450900 355 425 4801000 375 445 5001250 405 485 5451500 435 520 5851750 455 545 6152000 470 560 630
Motor and Drive Basics

26
Belt Drives
Most fan drive systems are based on the standard "V" drivebelt which is relatively efficient and readily available. The use ofa belt drive allows fan RPM to be easily selected through acombination of AC motor RPM and drive pulley ratios.
In general select a sheave combination that will result in thecorrect drive ratio with the smallest sheave pitch diameters.Depending upon belt cross section, there may be someminimum pitch diameter considerations. Multiple belts andsheave grooves may be required to meet horsepowerrequirements.
V-belt Length Formula
Once a sheave combination is selected we can calculateapproximate belt length. Calculate the approximate V-beltlength using the following formula:
L = Pitch Length of BeltC = Center Distance of SheavesD = Pitch Diameter of Large Sheaved = Pitch Diameter of Small Sheave
Belt Drive Guidelines
1. Drives should always be installed with provision for centerdistance adjustment.
2. If possible centers should not exceed 3 times the sum ofthe sheave diameters nor be less than the diameter of thelarge sheave.
3. If possible the arc of contact of the belt on the smallersheave should not be less than 120°.
4. Be sure that shafts are parallel and sheaves are in properalignment. Check after first eight hours of operation.
5. Do not drive sheaves on or off shafts. Be sure shaft andkeyway are smooth and that bore and key are of correctsize.
6. Belts should never be forced or rolled over sheaves. Morebelts are broken from this cause than from actual failure inservice.
7. In general, ideal belt tension is the lowest tension at whichthe belt will not slip under peak load conditions. Check belttension frequently during the first 24-48 hours of operation.
Motor RPMdesired fan RPM
Drive Ratio =
L = 2C+1.57 (D+d)+4C
(D-d) 2
Motor and Drive Basics

27
Range of drive losses for standard belts
Estimated Belt Drive Loss†
Higher belt speeds tend to have higher losses than lower beltspeeds at the same horsepower.
Drive losses are based on the conventional V-belt which hasbeen the “work horse” of the drive industry for several decades.
Example:
• Motor power output is determined to be 13.3 hp.• The belts are the standard type and just warm to the touch
immediately after shutdown.• From the chart above, the drive loss = 5.1%• Drive loss = 0.051 x 13.3 = 0.7 hp• Fan power input = 13.3 - 0.7 hp = 12.6 hp
1008060
4030
2015
1086
43
1
1.52
0.3
0.4
0.6
0.8 1 2 3 4 6 8 10 20 30 40 60 80 100
200
300
400
600
Dri
ve L
oss
, % M
oto
r P
ow
er O
utp
ut
Motor Power Output, hp
† Adapted from AMCA Publication 203-90.
Range of drive losses for standard belts
Motor and Drive Basics

28
Bearing Life
Bearing life is determined in accordance with methods pre-scribed in ISO 281/1-1989 or the Anti Friction Bearing Manufac-turers Association (AFBMA) Standards 9 and 11, modified tofollow the ISO standard. The life of a rolling element bearing isdefined as the number of operating hours at a given load andspeed the bearing is capable of enduring before the first signs offailure start to occur. Since seemingly identical bearings underidentical operating conditions will fail at different times, life isspecified in both hours and the statistical probability that a cer-tain percentage of bearings can be expected to fail within thattime period.
Example:
A manufacturer specifies that the bearings supplied in a partic-ular fan have a minimum life of L-10 in excess of 40,000 hours atmaximum cataloged operating speed. We can interpret thisspecification to mean that a minimum of 90% of the bearings inthis application can be expected to have a life of at least 40,000hours or longer.
To say it another way, we should expect lessthan 10% of the bearings in this application to fail within 40,000hours.
L-50 is the term given to Average Life and is simply equal to 5times the Minimum Life. For example, the bearing specifiedabove has a life of L-50 in excess of 200,000 hours.
At least 50%of the bearings in this application would be expected to have alife of 200,000 hours or longer.
Motor and Drive Basics
29
General Ventilation
• Locate intake and exhaust fans to make use of prevailingwinds.
• Locate fans and intake ventilators for maximum sweepingeffect over the working area.
• If filters are used on gravity intake, size intake ventilator tokeep intake losses below 1/8” SP.
• Avoid fans blowing opposite each other, When necessary,separate by at least 6 fan diameters.
• Use Class B insulated motors where ambient temperaturesare expected to be high for air-over motor conditions.
• If air moving over motors contains hazardous chemicals orparticles, use explosion-proof motors mounted in or out of theairstream, depending on job requirements.
• For hazardous atmosphere applications use fans of non-sparking construction.*
Process Ventilation
• Collect fumes and heat as near the source of generation aspossible.
• Make all runs of ducts as short and direct as possible.• Keep duct velocity as low as practical considering capture for
fumes or particles being collected.• When turns are required in the duct system use long radius
elbows to keep the resistance to a minimum (preferably 2duct diameters).
• After calculating duct resistance, select the fan havingreserve capacity beyond the static pressure determined.
• Use same rationale regarding intake ventilators and motorsas in General Ventilation guidelines above.
• Install the exhaust fan at a location to eliminate any recircula-tion into other parts of the plant.
• When hoods are used, they should be sufficient to collect allcontaminating fumes or particles created by the process.
*Refer to AMCA Standard 99; See page 4.
System Design Guidelines

30
Kitchen Ventilation
Hoods and Ducts
• Duct velocity should be between 1500 and 4000 fpm• Hood velocities (not less than 50 fpm over face area between
hood and cooking surface)• Wall Type - 80 CFM/ft2• Island Type - 125 CFM/ft2
• Extend hood beyond cook surface 0.4 x distance betweenhood and cooking surface
Filters
• Select filter velocity between 100 - 400 fpm• Determine number of filters required from a manufacturer’sdata (usually 2 cfm exhaust for each sq. in. of filter area maxi-mum)
• Install at 45 - 60° to horizontal, never horizontal• Shield filters from direct radiant heat• Filter mounting height:
• No exposed cooking flame—1-1/2’ minimum to filter• Charcoal and similar fires—4’ minimum to filter
• Provide removable grease drip pan• Establish a schedule for cleaning drip pan and filters and fol-low it diligently
Fans
• Use upblast discharge fan• Select design CFM based on hood design and duct velocity• Select SP based on design CFM and resistance of filters and
duct system• Adjust fan specification for expected exhaust air temperature
System Design Guidelines

31
Sound
Sound Power
(W)
- the amount of power a source converts tosound in watts.
Sound Power Level (LW)
- a logarithmic comparison of soundpower output by a source to a reference sound source, W
0
(10
-12
watt).
L
W
= 10 log
10
(W/W
0
) dB
Sound Pressure (P)
- pressure associated with sound outputfrom a source. Sound pressure is what the human ear reacts to.
Sound Pressure Level (Lp)
- a logarithmic comparison of soundpressure output by a source to a reference sound source, P
0
(2 x 10
-5
Pa).
Lp = 20 log
10
(P/P
0
) dB
Even though sound power level and sound pressure level areboth expressed in dB,
THERE IS NO OUTRIGHT CONVERSIONBETWEEN SOUND POWER LEVEL AND SOUND PRESSURELEVEL
. A constant sound power output will result in significantlydifferent sound pressures and sound pressure levels when thesource is placed in different environments.
Rules of Thumb
When specifying sound criteria for HVAC equipment, refer tosound power level, not sound pressure level.
When comparing sound power levels, remember the lowestand highest octave bands are only accurate to about +/-4 dB.
Lower frequencies are the most difficult to attenuate.
2 x sound pressure (single source) = +3 dB(sound pressure level)2 x distance from sound source = -6dB (sound pressure level)+10 dB(sound pressure level)= 2 x original loudness perception
When trying to calculate the additive effect of two soundsources, use the approximation (logarithms cannot be addeddirectly) on the next page.
System Design Guidelines

32
Rules of Thumb (cont.)
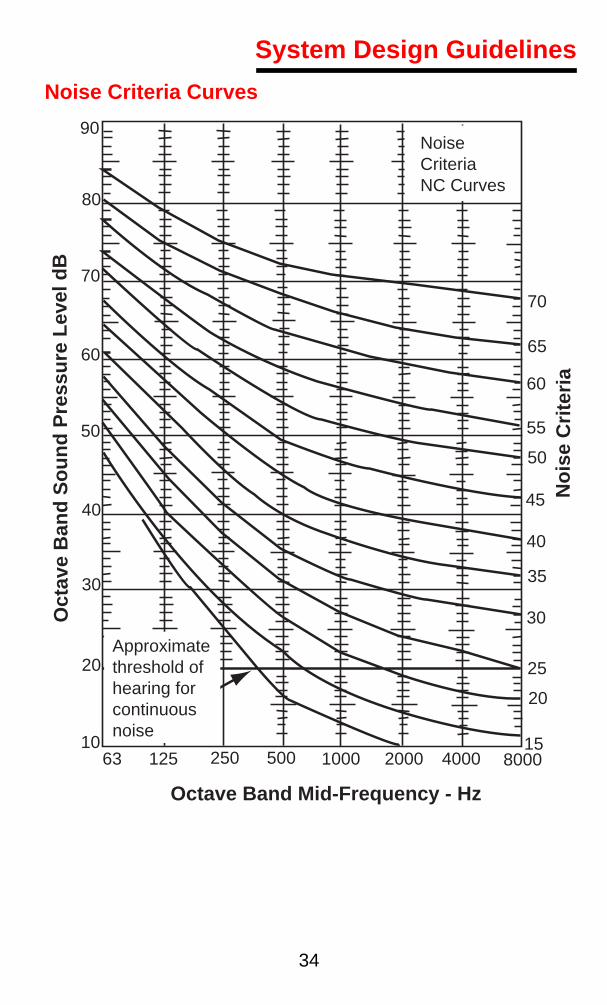
Noise Criteria
Graph sound pressure level for each octave band on NC curve. Highest curve intercepted is NC level of sound source. See
Noise Criteria Curves
., page 34.
Sound Power and Sound Power Level
Difference between sound pressure levels
dB to add to highest sound pressure level
0 3.01 2.52 2.13 1.84 1.55 1.26 1.07 0.88 0.69 0.5
10+ 0
Sound Power (Watts)Sound Power
Level dBSource
25 to 40,000,000 195 Shuttle Booster rocket100,000 170 Jet engine with afterburner
10,000 160 Jet aircraft at takeoff1,000 150 Turboprop at takeoff
100 140 Prop aircraft at takeoff10 130 Loud rock band
1 120 Small aircraft engine0.1 110 Blaring radio0.01 100 Car at highway speed
0.001 90Axial ventilating fan (2500 m
3
h) Voice shouting0.0001 80 Garbage disposal unit0.00001 70 Voice—conversational level
0.000001 60 Electronic equipment cooling fan
0.0000001 50 Office air diffuser0.00000001 40 Small electric clock0.000000001 30 Voice - very soft whisper
System Design Guidelines

33
Sound Pressure and Sound Pressure Level
Room Sones —dBA Correlation†
† From ASHRAE 1972 Handbook of Fundamentals
Sound Pressure (Pascals)
Sound Pressure Level dB
Typical Environment
200.0 140 30m from military aircraft at take-off
63.0 130 Pneumatic chipping and riveting (operator’s position)
20.0 120 Passenger Jet takeoff at 100 ft.
6.3 110 Automatic punch press (operator’s position)
2.0 100 Automatic lathe shop0.63 90 Construction site—pneumatic drilling0.2 80 Computer printout room0.063 70 Loud radio (in average domestic room)0.02 60 Restaurant0.0063 50 Conversational speech at 1m0.002 40 Whispered conversation at 2m0.00063 300.0002 20 Background in TV recording studios0.00002 0 Normal threshold of hearing
150
1009080706050
40
30
20
10950 60 70 80 90 100
dBA = 33.2 Log (sones) + 28, Accuracy ± 2dBA
Sound Level dBA
Lo
ud
nes
s, S
on
es
10
System Design Guidelines
34
Octave Band Mid-Frequency - Hz
Oct
ave
Ban
d S
ou
nd
Pre
ssu
re L
evel
dB
No
ise
Cri
teri
a
90
80
70
60
50
40
30
20
1063
70
65
60
55
50
45
40
35
30
25
20
15125 250 500 1000 2000 4000 8000
NoiseCriteriaNC Curves
Approximatethreshold ofhearing forcontinuousnoise
Noise Criteria Curves
System Design Guidelines

35
Design Criteria for Room Loudness
Note: Values showns above are room loudness in sones and are not fan sone ratings. For additional detail see AMCA publication 302 - Application of Sone Rating.
Room Type Sones Room Type Sones
Auditoriums Indoor sports activities
Concert and opera halls 1.0 to 3 Gymnasiums 4 to 12Stage theaters 1.5 to 5 Coliseums 3 to 9Movie theaters 2.0 to 6 Swimming pools 7 to 21Semi-outdoor amphi-
theaters 2.0 to 6 Bowling alleys 4 to 12
Lecture halls 2.0 to 6 Gambling casinos 4 to 12Multi-purpose
1.5 to 5
Manufacturing areas
Courtrooms
3.0 to 9
Heavy machinery 25 to 60Auditorium lobbies
4.0 to 12
Foundries 20 to 60TV audience studios
2.0 to 6
Light machinery 12 to 36
Churches and schools
Assembly lines 12 to 36Sanctuaries 1.7 to 5 Machine shops 15 to 50Schools & classrooms 2.5 to 8 Plating shops 20 to 50Recreation halls 4.0 to 12 Punch press shops 50 to 60Kitchens 6.0 to 18 Tool maintenance 7 to 21Libraries 2.0 to 6 Foreman’s office 5 to 15Laboratories 4.0 to 12 General storage 10 to 30Corridors and halls 5.0 to 15
OfficesHospitals and clinics
Executive 2 to 6Private rooms
1.7 to 5
Supervisor 3 to 9Wards
2.5 to 8
General open offices 4 to 12Laboratories
4.0 to 12
Tabulation/computation 6 to 18Operating rooms
2.5 to 8
Drafting 4 to 12Lobbies & waiting rooms
4.0 to 12
Professional offices 3 to 9Halls and corridors
4.0 to 12
Conference rooms 1.7 to 5Board of Directors 1 to 3Halls and corridors 5 to 15
System Design Guidelines
36
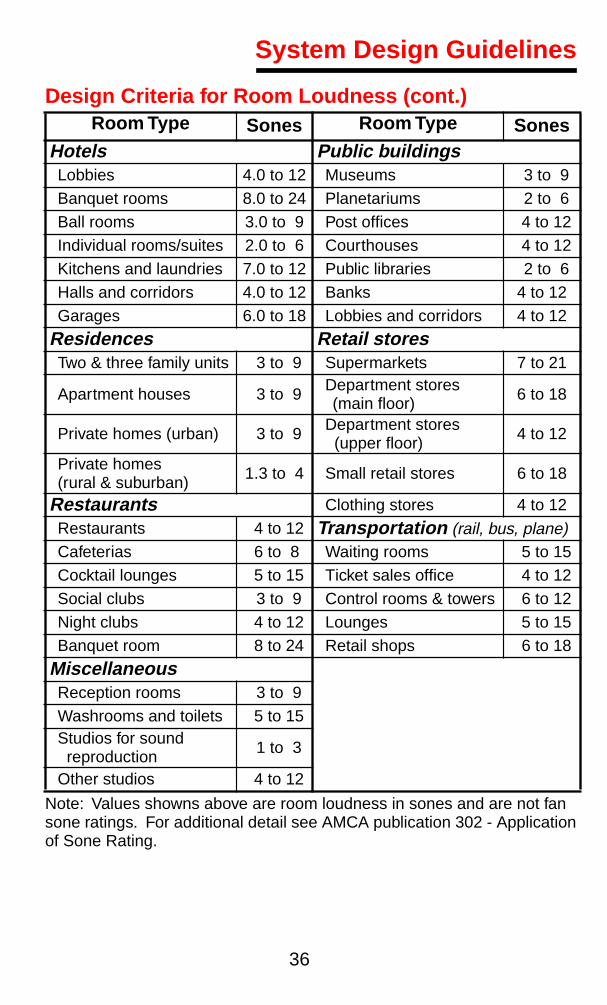
Design Criteria for Room Loudness (cont.)
Note: Values showns above are room loudness in sones and are not fan sone ratings. For additional detail see AMCA publication 302 - Application of Sone Rating.
Room Type Sones Room Type Sones
Hotels Public buildings
Lobbies 4.0 to 12 Museums 3 to 9Banquet rooms 8.0 to 24 Planetariums 2 to 6Ball rooms 3.0 to 9 Post offices 4 to 12Individual rooms/suites 2.0 to 6 Courthouses 4 to 12Kitchens and laundries 7.0 to 12 Public libraries 2 to 6Halls and corridors 4.0 to 12 Banks 4 to 12Garages 6.0 to 18 Lobbies and corridors 4 to 12
Residences Retail stores
Two & three family units 3 to 9 Supermarkets 7 to 21
Apartment houses 3 to 9 Department stores (main floor) 6 to 18
Private homes (urban) 3 to 9 Department stores (upper floor) 4 to 12
Private homes (rural & suburban) 1.3 to 4 Small retail stores 6 to 18
Restaurants
Clothing stores 4 to 12Restaurants 4 to 12
Transportation
(rail, bus, plane)
Cafeterias 6 to 8 Waiting rooms 5 to 15Cocktail lounges 5 to 15 Ticket sales office 4 to 12Social clubs 3 to 9 Control rooms & towers 6 to 12Night clubs 4 to 12 Lounges 5 to 15Banquet room 8 to 24 Retail shops 6 to 18
Miscellaneous
Reception rooms 3 to 9Washrooms and toilets 5 to 15Studios for sound reproduction 1 to 3
Other studios 4 to 12
System Design Guidelines

37
Vibration
System Natural Frequency
The natural frequency of a system is the frequency at whichthe system prefers to vibrate. It can be calculated by the follow-ing equation:
f
n
= 188 (1/d)
1/2
(cycles per minute)
The static deflection corresponding to this natural frequencycan be calculated by the following equation:
d = (188/f
n
)
2
(inches)
By adding vibration isolation, the transmission of vibration canbe minimized. A common rule of thumb for selection of vibrationisolation is as follows:
Critical installations are upper floor or roof mounted equipment.Non-critical installations are grade level or basement floor.Always use total weight of equipment when selecting isolation.Always consider weight distribution of equipment in selection.
Equipment RPM
Static Deflection of IsolationCritical
InstallationNon-criticalInstallation
1200+ 1.0 in 0.5 in600+ 1.0 in 1.0 in400+ 2.0 in 1.0 in300+ 3.0 in 2.0 in
System Design Guidelines
38
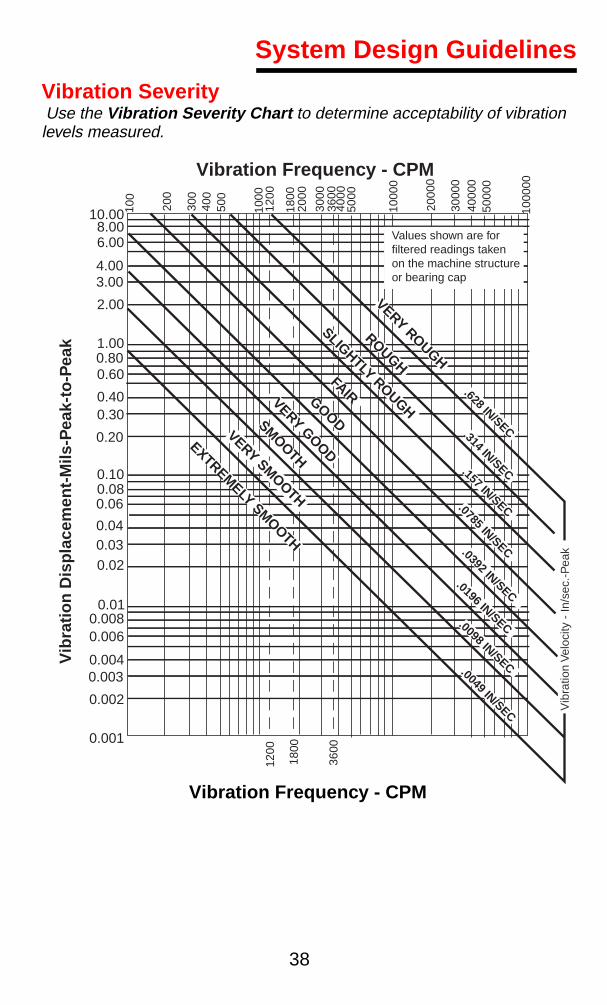
Vibration Severity
Use the
Vibration Severity Chart
to determine acceptability of vibration levels measured.
Vibration Frequency - CPM
10.008.006.00
4.003.00
2.00
1.000.800.60
0.400.30
0.20
0.100.080.06
0.040.030.02
0.010.0080.006
0.0040.003
0.002
0.001
100
200
300
400
500
1000
1200
1800
2000
3000
3600
4000
5000
1000
0
2000
0
3000
040
000
5000
0
1000
00
1200
1800
3600
Vib
ratio
n V
eloc
ity -
In/s
ec.-
Pea
k
Values shown are forfiltered readings takenon the machine structureor bearing cap
VERY SMOOTH
ROUGH
VERY ROUGH
SLIGHTLY ROUGHSMOOTH
EXTREMELY SMOOTH
VERY GOOD
GOOD
FAIR
.0049 IN/SEC
.0098 IN/SEC
.0196 IN/SEC
.0392 IN/SEC
.0785 IN/SEC
.157 IN/SEC
.314 IN/SEC
.628 IN/SEC
Vibration Frequency - CPM
Vib
rati
on
Dis
pla
cem
ent-
Mils
-Pea
k-to
-Pea
kSystem Design Guidelines

39
Vibration Severity (cont.)When using the Machinery Vibration Severity Chart, the
following factors must be taken into consideration:1. When using displacement measurements only filtered
displacement readings (for a specific frequency) should beapplied to the chart. Unfiltered or overall velocity readingscan be applied since the lines which divide the severityregions are, in fact, constant velocity lines.
2. The chart applies only to measurements taken on thebearings or structure of the machine. The chart does notapply to measurements of shaft vibration.
3. The chart applies primarily to machines which are rigidlymounted or bolted to a fairly rigid foundation. Machinesmounted on resilient vibration isolators such as coil springsor rubber pads will generally have higher amplitudes ofvibration than those rigidly mounted. A general rule is toallow twice as much vibration for a machine mounted onisolators. However, this rule should not be applied to highfrequencies of vibration such as those characteristic ofgears and defective rolling-element bearings, as theamplitudes measured at these frequencies are lessdependent on the method of machine mounting.
System Design Guidelines

40
Air Quality Method
Designing for acceptable indoor air quality requires that weaddress:
• Outdoor air quality• Design of the ventilation systems• Sources of contaminants• Proper air filtration• System operation and maintenance
Determine the number of people occupying the respectivebuilding spaces. Find the CFM/person requirements in Ventila-tion Rates for Acceptable Indoor Air Quality, page 42. Calculatethe required outdoor air volume as follows:
People = Occupancy/1000 x Floor Area (ft
2
)CFM = People x Outdoor Air Requirement (CFM/person)
Outdoor air quantities can be reduced to lower levels if properparticulate and gaseous air filtration equipment is utilized.
Air Change Method
Find total volume of space to be ventilated. Determine therequired number of air changes per hour.
CFM = Bldg. Volume (ft
3
) / Air Change Frequency
Consult local codes for air change requirements or, in absenceof code, refer to “Suggested Air Changes”, page 41.
Heat Removal Method
When the temperature of a space is higher than the ambientoutdoor temperature, general ventilation may be utilized to pro-vide “free cooling”. Knowing the desired indoor and the designoutdoor dry bulb temperatures, and the amount of heat removalrequired (BTU/Hr):
CFM = Heat Removal (BTU/Hr) / (1.10 x Temp diff)
General Ventilation Design
41
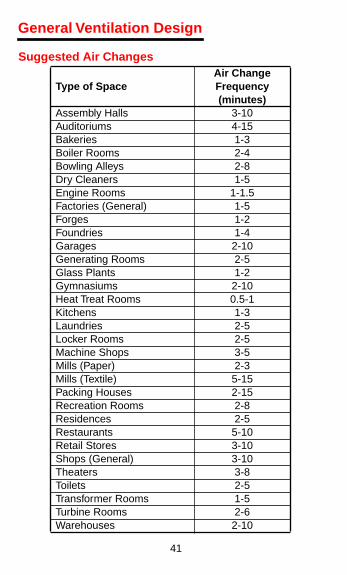
Suggested Air Changes
Type of SpaceAir ChangeFrequency(minutes)
Assembly Halls 3-10Auditoriums 4-15Bakeries 1-3Boiler Rooms 2-4Bowling Alleys 2-8Dry Cleaners 1-5Engine Rooms 1-1.5Factories (General) 1-5Forges 1-2Foundries 1-4Garages 2-10Generating Rooms 2-5Glass Plants 1-2Gymnasiums 2-10Heat Treat Rooms 0.5-1Kitchens 1-3Laundries 2-5Locker Rooms 2-5Machine Shops 3-5Mills (Paper) 2-3Mills (Textile) 5-15Packing Houses 2-15Recreation Rooms 2-8Residences 2-5Restaurants 5-10Retail Stores 3-10Shops (General) 3-10Theaters 3-8Toilets 2-5Transformer Rooms 1-5Turbine Rooms 2-6Warehouses 2-10
General Ventilation Design
42
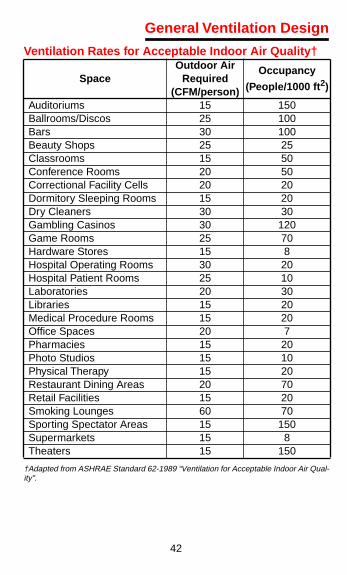
Ventilation Rates for Acceptable Indoor Air Quality†
†Adapted from ASHRAE Standard 62-1989 “Ventilation for Acceptable Indoor Air Qual-ity”.
SpaceOutdoor Air
Required(CFM/person)
Occupancy
(People/1000 ft
2
)
Auditoriums 15 150Ballrooms/Discos 25 100Bars 30 100Beauty Shops 25 25Classrooms 15 50Conference Rooms 20 50Correctional Facility Cells 20 20Dormitory Sleeping Rooms 15 20Dry Cleaners 30 30Gambling Casinos 30 120Game Rooms 25 70Hardware Stores 15 8Hospital Operating Rooms 30 20Hospital Patient Rooms 25 10Laboratories 20 30Libraries 15 20Medical Procedure Rooms 15 20Office Spaces 20 7Pharmacies 15 20Photo Studios 15 10Physical Therapy 15 20Restaurant Dining Areas 20 70Retail Facilities 15 20Smoking Lounges 60 70Sporting Spectator Areas 15 150Supermarkets 15 8Theaters 15 150
General Ventilation Design

43
Heat Gain From Occupants of Conditioned Spaces
1
Notes:
1
Tabulated values are based on 78°F for dry-bulb tempera-ture.
2
Adjusted total heat value for sedentary work, restaurant,includes 60 Btuh for food per individual (30 Btu sensible and30 Btu latent).
3
For bowling figure one person per alley actually bowling, andall others as sitting (400 Btuh) or standing (55 Btuh).
*
Use sensible values only when calculating ventilation toremove heat.
Adapted from Chapter 26 ASHRAE “Fundamentals” Handbook, 1989.
Typical Application Sensible Heat (BTU/HR)*
Latent Heat(BTU/HR)
Theater-Matinee 200 130Theater-Evening 215 135Offices, Hotels, Apartments 215 185Retail and Department Stores 220 230Drug Store 220 280Bank 220 280
Restaurant
2
240 310Factory 240 510Dance Hall 270 580Factory 330 670
Bowling Alley
3
510 940Factory 510 940
General Ventilation Design

44
Heat Gain From Typical Electric Motors†
† Adapted from Chapter 26 ASHRAE “Fundamentals” Handbook, 1989.
Motor Name-plate or Rated Horse-power
Motor Type
Nominal rpm
Full Load MotorEffi-
ciency in Percent
Motor In, Driven Equip-ment in Space Btuh
Motor Out,
Driven Equip-ment in Space Btuh
Motor 2nd
Driven Equip-
ment Out of Space
Btuh
0.25 Split Ph. 1750 54 1,180 640 5400.33 Split Ph. 1750 56 1,500 840 6600.50 Split Ph. 1750 60 2,120 1,270 8500.75 3-Ph. 1750 72 2,650 1,900 740
1 3-Ph. 1750 75 3,390 2,550 8501 3-Ph. 1750 77 4,960 3,820 1,1402 3-Ph. 1750 79 6,440 5,090 1,3503 3-Ph. 1750 81 9,430 7,640 1,7905 3-Ph. 1750 82 15,500 12,700 2,790
7,5 3-Ph. 1750 84 22,700 19,100 3,64010 3-Ph. 1750 85 29,900 24,500 4,49015 3-Ph. 1750 86 44,400 38,200 6,21020 3-Ph. 1750 87 58,500 50,900 7,61025 3-Ph. 1750 88 72,300 63,600 8,68030 3-Ph. 1750 89 85,700 76,300 9,44040 3-Ph. 1750 89 114,000 102,000 12,60050 3-Ph. 1750 89 143,000 127,000 15,70060 3-Ph. 1750 89 172,000 153,000 18,90075 3-Ph. 1750 90 212,000 191,000 21,200100 3-Ph. 1750 90 283,000 255,000 28,300125 3-Ph. 1750 90 353,000 318,000 35,300150 3-Ph. 1750 91 420,000 382,000 37,800200 3-Ph. 1750 91 569,000 509,000 50,300250 3-Ph. 1750 91 699,000 636,000 62,900
General Ventilation Design

45
Rate of Heat Gain From Commercial Cooking Appliances in Air-Conditioned Area†
Appliance Gas-Burning, Floor Mounted Type
Manufacturer’s Input Rating
Watts Btuh Heat gainWith Hood
Broiler, unit 70,000 7,000Deep fat fryer 100,000 6,500Oven, deck, per sq. ft of hearth area 4,000 400
Oven, roasting 80,000 8,000Range, heavy duty - Top section 64,000 6,400
Range, heavy duty - Oven 40,000 4,000Range, jr., heavy duty - Top section 45,000 4,500
Range, jr., heavy duty - Oven 35,000 3,500Range, restuarant type per 2-burner section 24,000 2,400
per oven 30,000 3,000 per broiler-griddle 35,000 3,500
Electric, Floor Mounted Type
Griddle 16,800 57,300 2,060Broiler, no oven 12,000 40,900 6,500 with oven 18,000 61,400 9,800Broiler, single deck 16,000 54,600 10,800Fryer 22,000 75,000 730Oven, baking, per sq. ft of hearth 500 1,700 270
Oven, roasting, per sq. ft of hearth 900 3,070 490
Range, heavy duty - Top section 15,000 51,200 19,100
Range, heavy duty - Oven 6,700 22,900 1,700Range, medium duty - Top section 8,000 27,300 4,300
Range, medium duty - Oven 3,600 12,300 1,900Range, light duty - Top section 6,600 22,500 3,600Range, light duty - Oven 3,000 10,200 1,600
† Adapted from Chapter 26 ASHRAE “Fundamentals” Handbook, 1989
General Ventilation Design

General Ventilation Design
Rate of Heat Gain From Miscellaneous Appliances
Adapted from Chapter 26 ASHRAE “Fundamentals” Handbook, 1989.*Use sensible heat gain for ventilation calculation.
Filter Comparison
Electrical Appliances
Manufacturer’s Rating
Recommended Rate ofHeat Gain, Btuh
Watts Btuh *Sensible Latent TotalHair dryer 1,580 5,400 2,300 400 2,700Hair dryer 705 2,400 1,870 330 2,200Neon sign, 30 30 per linear ft of tube 60 60Sterilizer, instrument 1,100 3,750 650 1,200 1,850Gas-Burning AppliancesLab burners Bunsen 3,000 1,680 420 2,100
Fishtail 5,000 2,800 700 3,500Meeker 6,000 3,360 840 4,200
Gas Light, per burner 2,000 1,800 200 2,000Cigar lighter 2,500 900 100 1,000
Filter TypeASHRAE
Arrestance Efficiency
ASHRAE Atmo-
spheric Dust Spot Efficiency
InitialPressure
Drop(IN.WG)
FinalPressure
Drop(IN.WG)
Permanent 60-80% 8-12% 0.07 .5Fiberglass Pad 70-85% 15-20% 0.17 .5Polyester Pad 82-90% 15-20% 0.20 .52” Throw Away 70-85% 15-20% 0.17 .52” Pleated Media 88-92% 25-30% 0.25 .5-.860% Cartridge 97% 60-65% 0.3 1.080% Cartridge 98% 80-85% 0.4 1.090% Cartridge 99% 90-95% 0.5 1.0HEPA 100% 99.97% 1.0 2.0
46
General Ventilation Design
0.0001
0.00
10.
010.
11
1010
010
0010
000
Rai
n
Toba
cco
Sm
oke
Mis
ts
Dia
met
er o
fH
uman
Hai
r Hea
vy In
dust
. Dus
t
Oil
Sm
oke
Fog
Yeas
t-C
ells
Vis
ible
By
Hum
an E
ye
Gas
Mol
ecul
es
Viru
s
Bac
teria
Pol
len
Pla
nt S
pore
s
Mol
ds
X-r
ays
Ele
ctro
nic-
Mic
rosc
ope
Uns
ettli
ng-A
tmos
pher
ic-I
mpu
ritie
s
Fum
es
Lung
-Dam
agin
g-P
artic
les
Ultr
a-V
iole
tV
isib
leIn
fra-
Red
Fly
-Ash
Mic
rosc
ope
Dus
tsS
ettli
ng-A
tmos
.-Im
pur.
Rel
ativ
e S
ize
Ch
art
of
Co
mm
on
Air
Co
nta
min
ants
Micron
0.3
Thi
s D
imen
sion
Rep
rese
nts
the
Dia
met
er o
f a H
uman
Hai
r, 10
0 M
icro
ns1
Mic
ron
= 1
mic
rom
eter
= 1
mill
iont
h of
a m
eter
Thi
s re
pres
ents
a10
mic
ron
diam
.pa
rtic
le, t
he
smal
lest
siz
evi
sibl
e w
ith th
ehu
man
eye
.
Thi
s re
pres
ents
a 0
.3
mic
ron
diam
eter
pa
rtic
le. T
his
is th
e m
ost
resp
irabl
e, lu
ng d
amag
ing
part
icle
siz
e.
0.00
010.
001
0.01
0.1
110
100
1000
1000
0
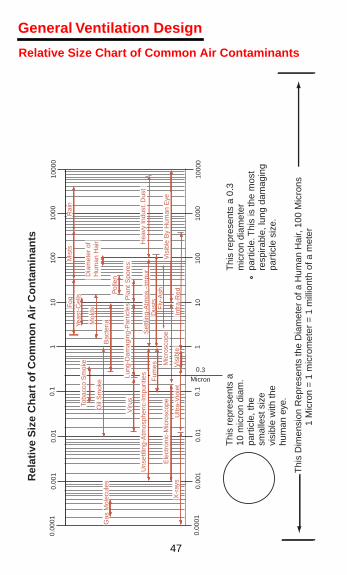
Relative Size Chart of Common Air Contaminants
47

48
Optimum Relative Humidity Ranges for Health
Bact
eri
a
Vir
use
s
Fungi
Mite
s
Resp
irato
ryIn
fect
ions1
Alle
rgic
Rhin
itis
and A
sthm
a
Chem
ical
Inte
ract
ions
Ozo
ne
Pro
duct
ion
Optim
al
Zone
De
cre
ase
in B
ar
Wid
th
Ind
ica
tes
De
cre
ase
in E
ffect
10
20
30
40
50
60
70
80
90
Pe
r C
en
t R
ela
tive
Hu
mid
ity
1IN
SU
FF
ICIE
NT
DAT
A
A
BO
VE
50
% R
.H.
Op
timu
m r
ela
tive
hu
mid
ity r
an
ge
s fo
r h
ea
lth a
s fo
un
d b
y E
.M. S
terl
ing
in "
Cri
teri
a fo
r H
um
an
Exp
osu
re t
o H
um
idity
in
Occ
up
ied
Bu
ildin
gs.
"A
SH
RA
E W
inte
r M
eetin
g, 1
985.
Op
tim
um
Rel
ativ
e H
um
idit
y R
ang
es f
or
Hea
lth
General Ventilation Design

49
100
200
300
400
500
1000
2000
3000
4000
5000
1.5
1.0
0.50.4
0.3
0.2
0.1
0.050.04
0.03
0.02
0.01
CFMSq. Ft. Damper AreaV (Velocity) =
DAMPER FACE VELOCITY -fpm
PR
ES
SU
RE
LO
SS
- In
ches
w.g
.
Damper Pressure Drop
Adapted from HVAC Systems Duct Design, Third Edition, 1990, Sheet Metal & Air Conditioning Contractor’s National Association
.
Duct Design

50
0.20.4
0.3
0.2
0.1
0.050.04
0.03
0.02
0.01
0.0050.004
0.003
0.002
0.001
Insect Screen
100
200
300
400
500
3000
4000
5000
1000
2000
1/2 in. Mesh Bird Screen
PR
ES
SU
RE
LO
SS
—in
ches
w.g
.
FACE AREA VELOCITY—fpm
0.6
Screen Pressure Drop
Adapted from HVAC Systems Duct Design, Third Edition, 1990, Sheet Metal & Air Conditioning Contractor’s National Association
.
Duct Design
51
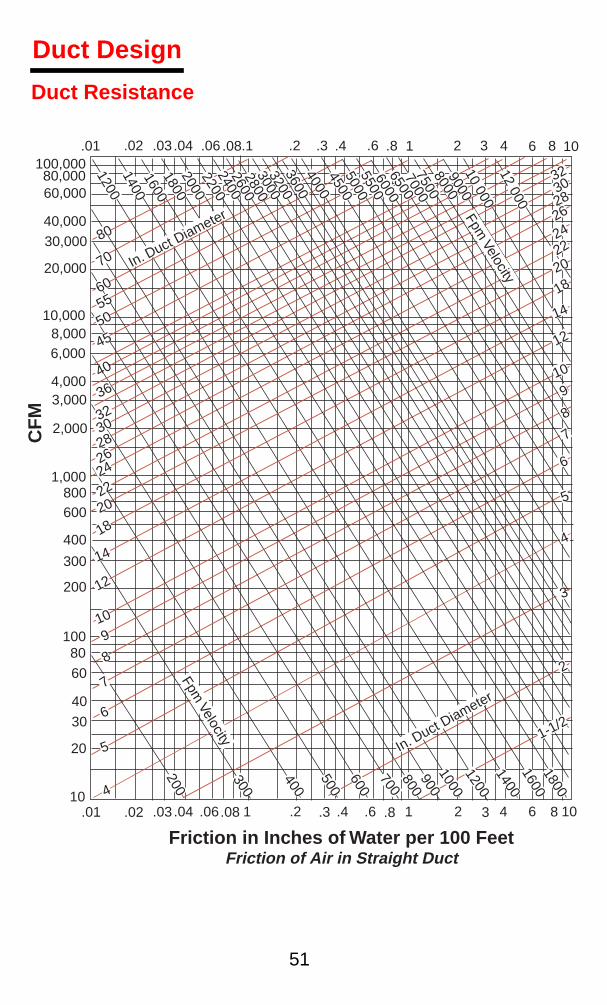
Duct Resistance
.01 .02 .03.04 .06 .08.1 .2 .3 .4 .6 .8 1 2 3 4 6 8 10100,00080,00060,000
40,00030,000
20,000
10,0008,0006,000
4,0003,000
2,000
1,000800600
400
300
200
10080
60
40
30
20
10.01 .02 .03.04 .06.08 1 .2 .3 .4 .6 .8 1 2 3 4 6 8 10
Friction in Inches of Water per 100 FeetFriction of Air in Straight Duct
CF
M
1-1/2
2
3
4
5
6
7
8
910
12
14
1820222426283032
4
5
6
7
8
910
12
14
1820222426283032
80
70
6055
50
45
40
36
In. Duct Diameter Fpm
Velocity
120014001600180020002200240026002800300032003600400045005000550060006500700075008000900010 00012 000
In. Duct D
iameter
Fpm Velocity
200
300
400
500
600
700800900
10001200140016001800
Duct Design
52
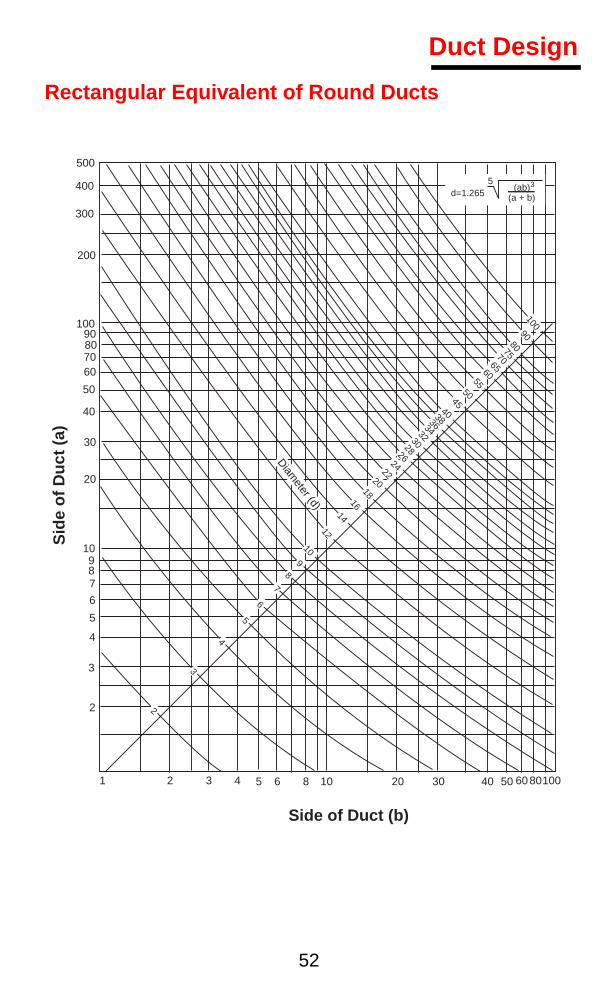
Rectangular Equivalent of Round Ducts
Sid
e o
f D
uct
(a)
Side of Duct (b)
500
400
300
200
10090807060
50
40
30
20
10987
6
5
4
3
2
1 2 3 4 5 6 8 10 20 30 40 50 6080100
2
3
4
5
6
78
9
10
1214
1618
2022
24
2628
3032
3436
3840
45
50
55
6065
70
7580
90100
d=1.2655
(ab)3
(a + b)
Diameter (d)
Duct Design

53
Typical Design Velocities for HVAC Components*
*
Adapted from ASHRAE “Pocket Guide”, 1993
Intake Louvers Velocity (FPM)
• 7000 cfm and greater 400
Exhaust Louvers
• 5000 cfm and greater 500
Panel Filters
• Viscous Impingement 200 to 800• Dry-Type, Pleated Media:
• Low Efficiency 350• Medium Efficiency 500• High Efficiency 500• HEPA 250
Renewable Media Filters
• Moving-Curtain Viscous Impingement 500• Moving-Curtain Dry-Media 200
Electronic Air Cleaners
• Ionizing-Plate-Type 300 to 500• Charged-Media Non-ionizing 250• Charged-Media Ionizing 150 to 350
Steam and Hot Water Coils
500 to 600200 min.
1500 max
Electric Coils
• Open Wire Refer to Mfg. Data• Finned Tubular Refer to Mfg. Data
Dehumidifying Coils
500 to 600
Spray-Type Air Washers
300 to 600
Cell-Type Air Washers
Refer to Mfg. Data
High-Velocity, Spray-Type Air Washers
1200 to 1800
Duct Design

54
Velocity and Velocity Pressure Relationships
For calculation of velocity pressures at velocities other than those listed above:
P
v
= (V/4005)
2
For calculation of velocities when velocity pressures are known:
Velocity
(fpm)
Velocity Pressure
(in wg)
Velocity
(fpm)
Velocity Pressure
(in wg)300 0.0056 3500 0.7637400 0.0097 3600 0.8079500 0.0155 3700 0.8534600 0.0224 3800 0.9002700 0.0305 3900 0.9482800 0.0399 4000 0.9975900 0.0504 4100 1.0480
1000 0.0623 4200 1.09971100 0.0754 4300 1.15271200 0.0897 4400 1.20691300 0.1053 4500 1.26241400 0.1221 4600 1.31911500 0.1402 4700 1.37711600 0.1596 4800 1.43641700 0.1801 4900 1.49681800 0.2019 5000 1.55861900 0.2250 5100 1.62152000 0.2493 5200 1.68572100 0.2749 5300 1.75122200 0.3017 5400 1.81792300 0.3297 5500 1.88592400 0.3591 5600 1.95512500 0.3896 5700 2.02562600 0.4214 5800 2.09722700 0.4544 5900 2.17012800 0.4887 6000 2.24432900 0.5243 6100 2.31983000 0.5610 6200 2.39653100 0.5991 6300 2.47443200 0.6384 6400 2.55363300 0.6789 6500 2.63403400 0.7206 6600 2.7157
(Vp)V=4005
Duct Design

55
U.S. Sheet Metal Gauges
*Aluminum is specified and purchased by material thickness rather than gauge.
Gauge No.Steel
(Manuf. Std. Ga.)Galvanized
(Manuf. Std. Ga.)Thick. in. Lb./ft.
2
Thick.in. Lb./ft.
2
26 .0179 .750 .0217 .90624 .0239 1.00 .0276 1.15622 .0299 1.25 .0336 1.40620 .0359 1.50 .0396 1.65618 .0478 2.00 .0516 2.15616 .0598 2.50 .0635 2.65614 .0747 3.125 .0785 3.28112 .1046 4.375 .1084 4.53110 .1345 5.625 .1382 5.7818 .1644 6.875 .1681 7.0317 .1793 7.50 — —
Gauge No.Mill Std. Thick
Aluminum*Stainless Steel
(U.S. Standard Gauge)
Thick. in. Lb./ft.
2
Thick.in. Lb./ft.
2
26 .020 .282 .0188 .787524 .025 .353 .0250 1.05022 .032 .452 .0312 1.31320 .040 .564 .0375 1.57518 .050 .706 .050 2.10016 .064 .889 .062 2.62514 .080 1.13 .078 3.28112 .100 1.41 .109 4.59410 .125 1.76 .141 5.9068 .160 2.26 .172 7.2187 .190 2.68 .188 7.752
Duct Design

56
Recommended Metal Gauges for Duct
Wind Driven Rain Louvers†
A new category of product has emerged recently called awind-driven rain louver. These are architectural louvers designedto reject moisture that are tested and evaluated under simulatedwind driven rain conditions. Since these are relatively new prod-ucts, several different test standards have emerged to evaluatethe performance of these products under severe wind and rainweather conditions. In addition, manufacturers have developedtheir own standards to help evaluate the rain resistance of theirproducts. Specifying engineers should become familiar with thedifferences in various rain and pressure drop test standards tocorrectly evaluate each manufacturer’s claims. Four test stan-dards are detailed below:
†Table from AMCA Supplement to ASHRAE Journal, September 1998.
*AMCA Louver Engineering Committee at this writing is currently updatingAMCA 500-L to allow testing of varying sizes, wind speed, and rainfallintensity and is developing a Certified Ratings Program for this productcategory.
Rectangular Duct Round DuctGreatest
DimensionU.S.ga.
B&Sga. Diameter Galv. Steel
U.S. ga.AluminumB&S ga.
to 30 in. 24 22 to 8 in. 24 2231-60 22 20 9-24 22 2061-90 20 18 25-48 20 1891-up 18 16 49-72 18 16
Dade Co. Test
Power Plant Test
AMCA 500 Test*
HEVACTest
Wind Velocitym/s (mph)
16-50(35 - 110)
22(50) 0 13.5
(30)
Rain Fall Ratemm/h (in./h)
220(8.8)
38-280(1.5 to 10.9)
100(4)
75(3)
Wet Wall WaterFlow Rate L/s (gpm)
0 0 0.08(1.25) 0
Airflow Through Louver m/s (fpm)
06.35 (1,250) Free Area Velocity
6.35 (1,250) Free Area Velocity
3.6 (700) Free Core
Area Velocity
Duct Design

57
Moisture and Air Relationships
ASHRAE has adopted pounds of moisture per pound of dry air as standard nomenclature. Relations of other units are expressed below at various dewpoint temperatures.
a
7000 grains = 1 lb
b
Compared to 70°F saturated
Normally the sensible heat factor determines the cfm required to accept a load. In some industrial applications the latent heat factor may control the air circulation rate.
Adapted from “Numbers,” by Bill Hollady & Cy Otterholm 1985.
Equiv.Dew Pt., °F
Lb H
2
0/lb dry air
Parts permillion
Grains/lb dry air
a
Percent Moisture %
b
-100 0.000001 1 0.0007 —-90 0.000002 2 0.0016 —-80 0.000005 5 0.0035 —-70 0.00001 10 0.073 0.06-60 0.00002 21 0.148 0.13-50 0.00004 42 0.291 0.26-40 0.00008 79 0.555 0.5-30 0.00015 146 1.02 0.9-20 0.00026 263 1.84 1.7-10 0.00046 461 3.22 2.9
0 0.0008 787 5.51 5.010 0.0013 1,315 9.20 8.320 0.0022 2,152 15.1 13.630 0.0032 3,154 24.2 21.840 0.0052 5,213 36.5 33.050 0.0077 7,658 53.6 48.460 0.0111 11,080 77.6 70.270 0.0158 15,820 110.7 100.080 0.0223 22,330 156.3 —90 0.0312 31,180 218.3 —
100 0.0432 43,190 302.3 —
Thus cfm = Latent heat1 Btu/h(W1 - W2) x 4840
Heating & Refrigeration

58
Properties of Saturated Steam†
†Based on “1967 ASME Steam Tables”
Temperature°F
PressurePSIA
Specific Volume Specific EnthalpySat. Vapor
Ft
3
/lbmSat. Liquid
Btu/lbmSat. VaporBtu/lbm
32 0.08859 3304.7 -0.0179 1075.540 0.12163 2445.8 8.027 1079.060 0.25611 1207.6 28.060 1087.780 0.50683 633.3 48.037 1096.4
100 0.94924 350.4 67.999 1105.1120 1.6927 203.26 87.97 1113.6140 2.8892 123.00 107.95 1122.0160 4.7414 77.29 127.96 1130.2180 7.5110 50.22 148.00 1138.2200 11.526 33.639 168.09 1146.0212 14.696 26.799 180.17 1150.5220 17.186 23.148 188.23 1153.4240 24.968 16.321 208.45 1160.6260 35.427 11.762 228.76 1167.4280 49.200 8.644 249.17 1173.8300 67.005 6.4658 269.7 1179.7320 89.643 4.9138 290.4 1185.2340 117.992 3.7878 311.3 1190.1360 153.010 2.9573 332.3 1194.4380 195.729 2.3353 353.6 1198.0400 247.259 1.8630 375.1 1201.0420 308.780 1.4997 396.9 1203.1440 381.54 1.21687 419.0 1204.4460 466.87 0.99424 441.5 1204.8480 566.15 0.81717 464.5 1204.1500 680.86 0.67492 487.9 1202.2520 812.53 0.55957 512.0 1199.0540 962.79 0.46513 536.8 1194.3560 1133.38 0.38714 562.4 1187.7580 1326.17 0.32216 589.1 1179.0600 1543.2 0.26747 617.1 1167.7620 1786.9 0.22081 646.9 1153.2640 2059.9 0.18021 679.1 1133.7660 2365.7 0.14431 714.9 1107.0680 2708.6 0.11117 758.5 1068.5700 3094.3 0.07519 822.4 995.2705.47 3208.2 0.05078 906.0 906.0
Heating & Refrigeration

59
Cooling Load Check Figures
Heating & Refrigeration
Cla
ssifi
cati
on
Occ
up
ancy
S
q. F
t/P
erso
nL
igh
tsW
atts
/Sq
.Ft.
Ref
rig
erat
ion
Sq
.Ft/
Ton
‡A
ir Q
uan
titi
es C
FM
/Sq
.Ft.
Eas
t-S
ou
th-W
est
No
rth
Inte
rnal
Lo
Hi
Lo
Hi
Lo
Hi
Lo
Hi
Lo
Hi
Lo
Hi
Apa
rtm
ent,
Hig
h R
ise
325
100
1.0
4.0
450
350
0.8
1.7
0.5
1.3
——
Aud
itoriu
ms,
Chu
rche
s, T
heat
ers
156
1.0
3.0
400
90—
——
—1.
03.
0E
duca
tiona
l Fac
ilitie
s S
choo
ls, C
olle
ges,
Uni
vers
ities
3020
2.0
6.0
240
150
1.0
2.2
0.9
2.0
0.8
1.9
Fact
orie
s-A
ssem
bly
Are
as50
253.
0†6.
0†24
090
——
——
2.0
5.5
Li
ght M
anuf
actu
ring
200
100
9.0†
12.0
†20
010
0—
——
—1.
63.
8
Hea
vy M
anuf
actu
ring
♦
300
200
15.0
†60
.0†
100
60—
——
—2.
56.
5H
ospi
tals
-Pat
ient
Roo
ms*
7525
1.0
2.0
275
165
0.33
0.67
0.33
0.67
——
Pub
lic A
reas
100
501.
02.
017
511
01.
01.
451.
01.
20.
951.
1H
otel
s, M
otel
s, D
orm
itorie
s20
010
01.
03.
035
022
01.
01.
50.
91.
4—
—Li
brar
ies
and
Mus
eum
s80
401.
03.
034
020
01.
02.
10.
91.
30.
91.
1O
ffice
Bui
ldin
gs*
130
804.
09.
0†36
019
00.
250.
90.
250.
80.
81.
8 P
rivat
e O
ffice
s*15
010
02.
08.
0—
—0.
250.
90.
250.
8—
— C
ubic
le A
rea
100
705.
0*10
.0*
——
——
—
—0.
92.
0R
esid
entia
l -La
rge
600
200
1.0
4.0
600
380
0.8
1.6
0.5
1.3
——
Med
ium
600
200
0.7
3.0
700
400
0.7
1.4
0.5
1.2
——
Res
taur
ants
- L
arge
1713
152.
013
580
1.8
3.7
1.2
2.1
0.8
1.4
M
ediu
m15
010
01.
53.
01.
11.
80.
91.
3

60
Cooling Load Check Figures (cont.)
Heating & Refrigeration
Ref
riger
atio
n an
d ai
r qu
antit
ies
for
appl
icat
ions
list
ed in
this
tabl
e of
coo
ling
load
che
ck fi
gure
s ar
e ba
sed
on a
ll-ai
r sy
stem
and
nor
mal
ou
tdoo
r ai
r qu
antit
ies
for
vent
ilatio
n ex
cept
as
note
d.
No
tes:
‡Ref
riger
atio
n lo
ads
are
for
entir
e ap
plic
atio
n.†I
nclu
des
othe
r lo
ads
expr
esse
d in
Wat
ts s
q.ft.
♦
Air
quan
titie
s fo
r he
avy
man
ufac
turin
g ar
eas
are
base
d on
sup
plem
enta
ry m
eans
to r
emov
e ex
cess
ive
heat
.*A
ir qu
antit
ies
for
hosp
ital p
atie
nt r
oom
s an
d of
fice
build
ings
(ex
cept
inte
rnal
are
as)
are
base
d on
indu
ctio
n (a
ir-w
ater
) sy
stem
.
Cla
ssifi
cati
on
Occ
up
ancy
S
q. F
t/P
erso
nL
igh
tsW
atts
/Sq
.Ft.
Ref
rig
erat
ion
Sq
.Ft/
Ton
‡A
ir Q
uan
titi
es C
FM
/Sq
.Ft.
Eas
t-S
ou
th-W
est
No
rth
Inte
rnal
Lo
Hi
Lo
Hi
Lo
Hi
Lo
Hi
Lo
Hi
Lo
Hi
Bea
uty
& B
arbe
r S
hops
4525
3.0*
9.0*
240
105
1.5
4.2
1.1
2.6
0.9
2.0
Dep
t. S
tore
s-B
asem
ent
3020
2.0
4.0
340
225
——
——
0.7
1.2
Mai
n F
loor
4516
3.5
9.0†
350
150
——
——
0.9
2.0
Upp
er F
loor
s75
402.
03.
5†40
028
0—
——
—0.
81.
2 C
loth
ing
Sto
res
5030
1.0
4.0
345
185
0.9
1.6
0.7
1.4
0.6
1.1
Dru
g S
tore
s35
171.
03.
018
011
01.
83.
01.
01.
80.
71.
3 D
isco
unt S
tore
s35
151.
55.
034
512
00.
72.
00.
61.
60.
51.
1 S
hoe
Sto
res
5020
1.0
3.0
300
150
1.2
2.1
1.0
1.8
0.8
1.2
Mal
ls10
050
1.0
2.0
365
160
——
——
1.1
2.5
Ref
rig
erat
ion
for
Cen
tral
Hea
tin
g a
nd
Co
olin
g P
lan
t
Urb
an D
istr
icts
285
Col
lege
Cam
puse
s24
0 C
omm
erci
al C
ente
rs20
0 R
esid
entia
l Cen
ters
375

Heating & Refrigeration
Heat Loss EstimatesThe following will give quick estimates of heat requirements in a building knowing the cu.ft. volume of the building and design con-ditions.
The following correction factors must be used and multiplied by the answer obtained above.
Type of Structure
Masonry Wall Insulated Steel WallIndoor Temp (F)
60° 65° 70° 60° 65° 70°BTU/Cubic Foot BTU/Cubic Foot
Single Story 4 Walls Exposed 3.4 3.7 4.0 2.2 2.4 2.6
Single StoryOne Heated Wall 2.9 3.1 3.4 1.9 2.0 2.2
Single FloorOne Heated WallHeated Space Above
1.9 2.0 2.2 1.3 1.4 1.5
Single FloorTwo Heated WallsHeated Space Above
1.4 1.5 1.6 0.9 1.0 1.1
Single FloorTwo Heated Walls 2.4 2.6 2.8 1.6 1.7 1.8
Multi-Story
2 Story 2.9 3.1 3.4 1.9 2.1 2.23 Story 2.8 3.0 3.2 1.8 2.0 2.14 Story 2.7 2.9 3.1 — — —5 Story 2.6 2.8 3.0 — — —
Corrections for Outdoor Design
Corrections for “R” Factor (Steel Wall)
Temperature Multiplier “R” Factor Multiplier+50 .23 8 1.0+40 .36 10 .97+30 .53 12 95+20 .69 14 .93+10 .84 16 .92+ 0 1.0 19 .91-10 1.15-20 1.2-30 1.46
61
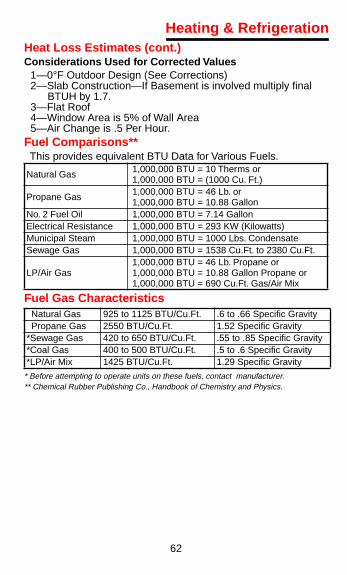
Heat Loss Estimates (cont.)Considerations Used for Corrected Values
1—0°F Outdoor Design (See Corrections)2—Slab Construction—If Basement is involved multiply final
BTUH by 1.7.3—Flat Roof4—Window Area is 5% of Wall Area5—Air Change is .5 Per Hour.
Fuel Comparisons**This provides equivalent BTU Data for Various Fuels.
Fuel Gas Characteristics
* Before attempting to operate units on these fuels, contact manufacturer.** Chemical Rubber Publishing Co., Handbook of Chemistry and Physics.
Natural Gas 1,000,000 BTU = 10 Therms or1,000,000 BTU = (1000 Cu. Ft.)
Propane Gas 1,000,000 BTU = 46 Lb. or1,000,000 BTU = 10.88 Gallon
No. 2 Fuel Oil 1,000,000 BTU = 7.14 GallonElectrical Resistance 1,000,000 BTU = 293 KW (Kilowatts)Municipal Steam 1,000,000 BTU = 1000 Lbs. CondensateSewage Gas 1,000,000 BTU = 1538 Cu.Ft. to 2380 Cu.Ft.
LP/Air Gas1,000,000 BTU = 46 Lb. Propane or1,000,000 BTU = 10.88 Gallon Propane or1,000,000 BTU = 690 Cu.Ft. Gas/Air Mix
Natural Gas 925 to 1125 BTU/Cu.Ft. .6 to .66 Specific GravityPropane Gas 2550 BTU/Cu.Ft. 1.52 Specific Gravity
*Sewage Gas 420 to 650 BTU/Cu.Ft. .55 to .85 Specific Gravity*Coal Gas 400 to 500 BTU/Cu.Ft. .5 to .6 Specific Gravity*LP/Air Mix 1425 BTU/Cu.Ft. 1.29 Specific Gravity
Heating & Refrigeration
62
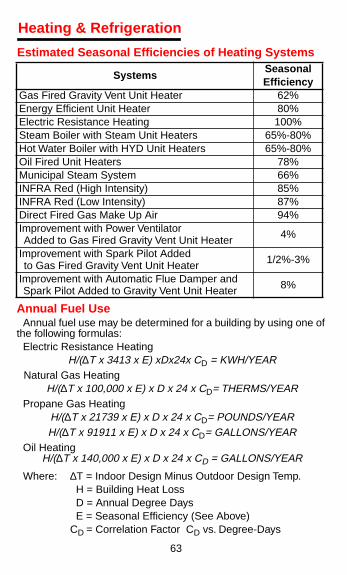
Heating & Refrigeration
63
Annual Fuel UseAnnual fuel use may be determined for a building by using one of
the following formulas:Electric Resistance Heating
H/(∆T x 3413 x E) xDx24x CD = KWH/YEARNatural Gas Heating
H/(∆T x 100,000 x E) x D x 24 x CD= THERMS/YEARPropane Gas Heating
H/(∆T x 21739 x E) x D x 24 x CD= POUNDS/YEARH/(∆T x 91911 x E) x D x 24 x CD= GALLONS/YEAR
Oil HeatingH/(∆T x 140,000 x E) x D x 24 x CD = GALLONS/YEAR
Where: ∆T = Indoor Design Minus Outdoor Design Temp. H = Building Heat Loss D = Annual Degree Days E = Seasonal Efficiency (See Above)CD = Correlation Factor CD vs. Degree-Days
SystemsSeasonal Efficiency
Gas Fired Gravity Vent Unit Heater 62%Energy Efficient Unit Heater 80%Electric Resistance Heating 100%Steam Boiler with Steam Unit Heaters 65%-80%Hot Water Boiler with HYD Unit Heaters 65%-80%Oil Fired Unit Heaters 78%Municipal Steam System 66%INFRA Red (High Intensity) 85%INFRA Red (Low Intensity) 87%Direct Fired Gas Make Up Air 94%Improvement with Power Ventilator Added to Gas Fired Gravity Vent Unit Heater 4%
Improvement with Spark Pilot Addedto Gas Fired Gravity Vent Unit Heater 1/2%-3%
Improvement with Automatic Flue Damper and Spark Pilot Added to Gravity Vent Unit Heater 8%
Estimated Seasonal Efficiencies of Heating Systems

64
1.2
1.0
0.8
0.6
0.4
0.2
0
2000
4000
6000
8000
Degree Days
Fac
tor
CD
CD
+o
-o
Annual Fuel Use (cont.)
Pump Construction TypesThe two general pump construction types are:
Bronze-fitted Pumps• cast iron body• brass impeller• brass metal seal assembly componentsUses: Closed heating/chilled water systems, low-temp
fresh water.All-Bronze Pumps
• all wetted parts are bronzeUses: Higher temp fresh water, domestic hot water, hot
process water.Pump Impeller TypesSingle Suction - fluid enters impeller on one side only.Double Suction - fluid enters both sides of impeller.Closed Impeller - has a shroud which encloses the pump vanes, increasing efficiency. Used for fluid systems free of large parti-cles which could clog impeller.Semi-Open Impeller - has no inlet shroud. Used for systems where moderate sized particles are suspended in pumped fluid.Open Impeller - has no shroud. Used for systems which have large particles suspended in pumped fluid, such as sewage or sludge systems.
Heating & Refrigeration
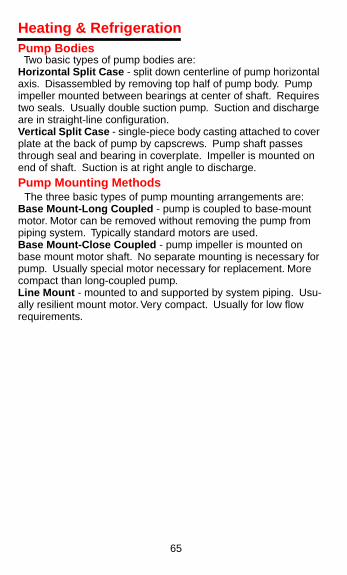
Heating & Refrigeration
Pump BodiesTwo basic types of pump bodies are:Horizontal Split Case - split down centerline of pump horizontal axis. Disassembled by removing top half of pump body. Pump impeller mounted between bearings at center of shaft. Requires two seals. Usually double suction pump. Suction and discharge are in straight-line configuration.Vertical Split Case - single-piece body casting attached to cover plate at the back of pump by capscrews. Pump shaft passes through seal and bearing in coverplate. Impeller is mounted on end of shaft. Suction is at right angle to discharge.
Pump Mounting MethodsThe three basic types of pump mounting arrangements are:
Base Mount-Long Coupled - pump is coupled to base-mount motor. Motor can be removed without removing the pump from piping system. Typically standard motors are used.Base Mount-Close Coupled - pump impeller is mounted on base mount motor shaft. No separate mounting is necessary for pump. Usually special motor necessary for replacement. More compact than long-coupled pump.Line Mount - mounted to and supported by system piping. Usu-ally resilient mount motor. Very compact. Usually for low flow requirements.
65

Heating & Refrigeration
Affinity Laws for Pumps
Adapted from ASHRAE “Pocket Handbook”, 1987.
Impeller Diameter Speed
Specific Gravity
(SG)
To Correct
forMultiply by
Constant Variable Constant
Flow
Head
BHP(or kW)
Variable Constant
Flow
Head
BHP(or kW)
Constant Variable BHP(or kW)
New SpeedOld Speed
New SpeedOld Speed
2
New SpeedOld Speed
3
New DiameterOld Diameter
New DiameterOld Diameter
2
New DiameterOld Diameter
3
New SGOld SG
66
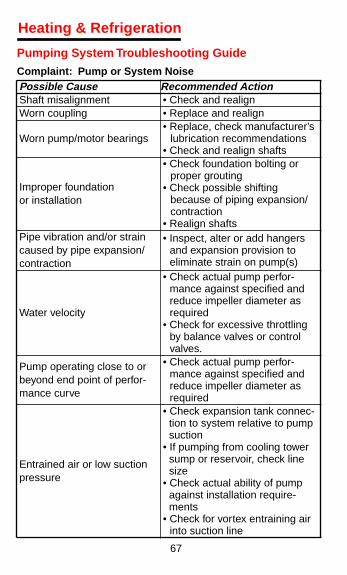
Heating & Refrigeration
67
Pumping System Troubleshooting Guide
Complaint: Pump or System NoisePossible Cause Recommended ActionShaft misalignment • Check and realignWorn coupling • Replace and realign
Worn pump/motor bearings• Replace, check manufacturer’s
lubrication recommendations• Check and realign shafts
Improper foundationor installation
• Check foundation bolting or proper grouting
• Check possible shifting because of piping expansion/contraction
• Realign shaftsPipe vibration and/or strain caused by pipe expansion/contraction
• Inspect, alter or add hangers and expansion provision to eliminate strain on pump(s)
Water velocity
• Check actual pump perfor-mance against specified and reduce impeller diameter as required
• Check for excessive throttling by balance valves or control valves.
Pump operating close to or beyond end point of perfor-mance curve
• Check actual pump perfor-mance against specified and reduce impeller diameter as required
Entrained air or low suction pressure
• Check expansion tank connec-tion to system relative to pump suction
• If pumping from cooling tower sump or reservoir, check line size
• Check actual ability of pump against installation require-ments
• Check for vortex entraining air into suction line
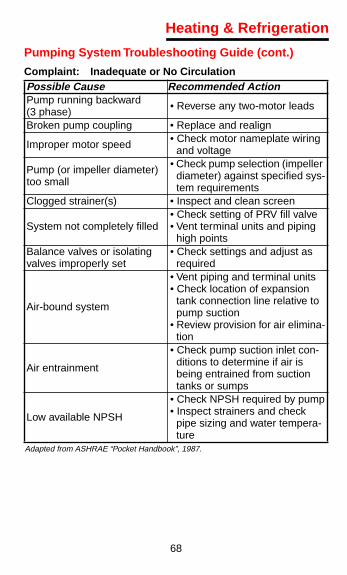
Heating & Refrigeration
Pumping System Troubleshooting Guide (cont.)
Adapted from ASHRAE “Pocket Handbook”, 1987.
Complaint: Inadequate or No CirculationPossible Cause Recommended ActionPump running backward (3 phase) • Reverse any two-motor leads
Broken pump coupling • Replace and realign
Improper motor speed • Check motor nameplate wiring and voltage
Pump (or impeller diameter) too small
• Check pump selection (impeller diameter) against specified sys-tem requirements
Clogged strainer(s) • Inspect and clean screen
System not completely filled• Check setting of PRV fill valve• Vent terminal units and piping
high pointsBalance valves or isolating valves improperly set
• Check settings and adjust as required
Air-bound system
• Vent piping and terminal units• Check location of expansion
tank connection line relative to pump suction
• Review provision for air elimina-tion
Air entrainment
• Check pump suction inlet con-ditions to determine if air is being entrained from suction tanks or sumps
Low available NPSH
• Check NPSH required by pump• Inspect strainers and check
pipe sizing and water tempera-ture
68

Heating & Refrigeration
Pump Terms, Abbreviations and Conversion Factors
Adapted from ASHRAE “Pocket Handbook”, 1987.
TermAbbrevia-
tionMultiply By To Obtain
Length l ft 0.3048 mArea A ft2 0.0929 m2
Velocity v ft/s 0.3048 m/sVolume V ft3 0.0283 m3
Flow rate 0vgpmgpm
0.22720.0631
m3/hL/s
Pressure Ppsi 6890 Papsi 6.89 kPapsi 14.5 bar
Head (total) H ft 0.3048 mNPSH H ft 0.3048 mOutput power (pump)
Powater hp (WHP)
0.7457 kW
Shaft power Ps BHP 0.7457 kWInput power (driver) Pi kW 1.0 kWEfficiency, %
Pump Ep — — —Equipment Ee — — —Electric motor Em — — —Utilization Eu — — —Variable speed drive
Fv — — —
System Efficiency Index (decimal) SEI — — —
Speed n rpmrpm
0.10470.0167
rad/srps
Density ρ lb/ft3 16.0 kg/m3
Temperature ° °F-32 5/9 °C
69

Common Pump Formulas
Water Flow and PipingPressure drop in piping varies approx as the square of the
flow:
The velocity of water flowing in a pipe is
Where V is in ft/sec and d is inside diameter, in.
Quiet Water Flows
Six fps is a reasonable upper limit for water velocity in pipes. The relationship between pressure drop and flow rate can also be expressed:
Formula for I-P UnitsHead H=psi x 2.31/SG* (ft)Output power Po = Qv x H x SG*/3960 (hp)
Shaft power
Input power Pi = Ps x 74.6/Em (kw)
UtilizationQD= design flowQA= actual flowHD= design headHA= actual head
*SG = specific gravity
Nom size 1/2 3/4 1 1-1/4 1-1/2 2 2-1/2 3 4
ID in. 0.622 0.824 1.049 1.380 1.610 2.067 2.469 3.068 4.02
d2 0.387 0.679 1.100 1.904 2.59 4.27 6.10 9.41 16.21
Nom size 1/2 3/4 1 1-1/4 1-1/2 2 2-1/2 3 4Gpm 1.5 4. 8. 14 22 44 75 120 240
Q2
Q1
2
h2 = h1 x or Q2 = Q1 xh2
h1
gpm x 0.41d2
v =
Qv x H x SG*39.6 x Ep
Ps = (hp)
Heating & Refrigeration
ηµ = 100Q HD D
Q HA A
h2h1
Q2Q1
=2
70
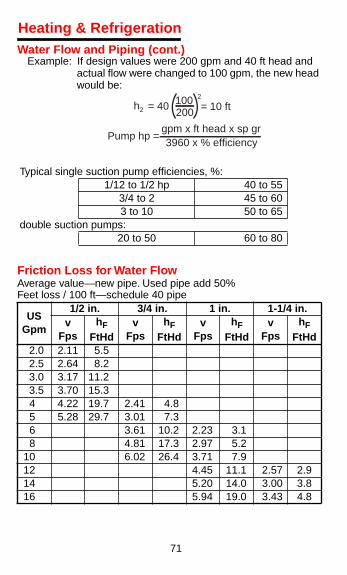
Heating & Refrigeration
71
Water Flow and Piping (cont.)Example: If design values were 200 gpm and 40 ft head and
actual flow were changed to 100 gpm, the new head would be:
Friction Loss for Water FlowAverage value—new pipe. Used pipe add 50%Feet loss / 100 ft—schedule 40 pipe
Typical single suction pump efficiencies, %:1/12 to 1/2 hp 40 to 55
3/4 to 2 45 to 603 to 10 50 to 65
double suction pumps:20 to 50 60 to 80
US Gpm
1/2 in. 3/4 in. 1 in. 1-1/4 in.v
FpshF
FtHdv
FpshF
FtHdv
FpshF
FtHdv
FpshF
FtHd2.0 2.11 5.52.5 2.64 8.23.0 3.17 11.23.5 3.70 15.34 4.22 19.7 2.41 4.85 5.28 29.7 3.01 7.36 3.61 10.2 2.23 3.18 4.81 17.3 2.97 5.2
10 6.02 26.4 3.71 7.912 4.45 11.1 2.57 2.914 5.20 14.0 3.00 3.816 5.94 19.0 3.43 4.8
h2 = 40 100200 = 10 ft
2
Pump hp =gpm x ft head x sp gr3960 x % efficiency

Heating & Refrigeration
Friction Loss for Water Flow (cont.)Adapted from “Numbers”, Bill Holladay and Cy Otterholm, 1985
US Gpm
1-1/2 in. 2 in. 2-1/2 in. 1-1/4 in.v
FpshF
FtHdv
FpshF
FtHdv
FpshF
FtHdv
FpshF
FtHd18 2.84 2.8 3.86 6.020 3.15 3.4 4.29 7.322 3.47 4.1 4.72 8.724 3.78 4.8 5.15 10.326 4.10 5.5 5.58 11.928 4.41 6.3 6.01 13.730 4.73 7.2 6.44 15.635 5.51 9.6 7.51 20.940 6.30 12.4 3.82 3.645 7.04 15.5 4.30 4.450 4.78 5.460 5.74 7.6 4.02 3.170 6.69 10.2 4.69 4.2 3 in.80 7.65 13.1 5.36 5.4 v
FpshF
FtHd100 6.70 8.2120 8.04 11.5 5.21 3.9140 9.38 15.5 6.08 5.2160 6.94 6.7180 7.81 8.4200 8.68 10.2
72

Heating & Refrigeration
Equivalent Length of Pipe for Valves and FittingsScrewed fittings, turbulent flow only, equipment length in feet.where V1 & V2 = entering and leaving velocities
and g = 32.17 ft/sec2
Adapted from “Numbers”, Bill Holladay and Cy Otterholm, 1985
FittingsPipe Size
1/2 3/4 1 1-1/4 1-1/2 2 2-1/2 3Standard 90° Ell 3.6 4.4 5.2 6.6 7.4 8.5 9.3 11
Long rad. 90° Ell 2.2 2.3 2.7 3.2 3.4 3.6 3.6 4.0
Standard 45° Ell .71 .92 1.3 1.7 2.1 2.7 3.2 3.9
Tee Line flow 1.7 2.4 3.2 4.6 5.6 7.7 9.3 12
Tee Br flow 4.2 5.3 6.6 8.7 9.9 12 13 17
180° Ret bend 3.6 4.4 5.2 6.6 7.4 8.5 9.3 11
Globe Valve 22 24 29 37 42 54 62 79
Gate Valve .56 .67 .84 1.1 1.2 1.5 1.7 1.9
Angle Valve 15 15 17 18 18 18 18 18
Swing Check 8.0 8.8 11 13 15 19 22 27
Union or Coupling .21 .24 .29 .36 .39 .45 .47 .53
Bellmouth inlet .10 .13 .18 .26 .31 .43 .52 .67
Sq mouth inlet .96 1.3 1.8 2.6 3.1 4.3 5.2 6.7
Reentrant pipe 1.9 2.6 3.6 5.1 6.2 8.5 10 13
Sudden enlargement Feet of liquid loss =
(V1 - V2)2g
2
73
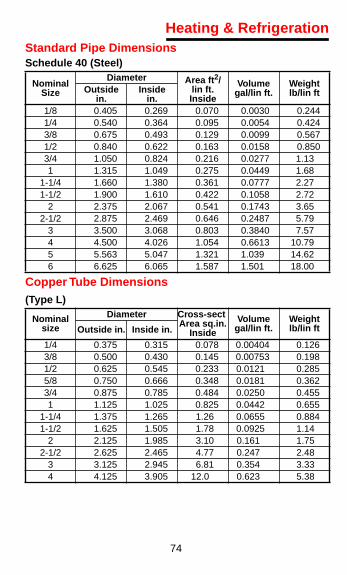
Heating & Refrigeration
Standard Pipe DimensionsSchedule 40 (Steel)Copper Tube Dimensions(Type L)
Nominal Size
Diameter Area ft2/lin ft.Inside
Volumegal/lin ft.
Weightlb/lin ftOutside
in.Inside
in.1/8 0.405 0.269 0.070 0.0030 0.2441/4 0.540 0.364 0.095 0.0054 0.4243/8 0.675 0.493 0.129 0.0099 0.5671/2 0.840 0.622 0.163 0.0158 0.8503/4 1.050 0.824 0.216 0.0277 1.131 1.315 1.049 0.275 0.0449 1.68
1-1/4 1.660 1.380 0.361 0.0777 2.271-1/2 1.900 1.610 0.422 0.1058 2.72
2 2.375 2.067 0.541 0.1743 3.652-1/2 2.875 2.469 0.646 0.2487 5.79
3 3.500 3.068 0.803 0.3840 7.574 4.500 4.026 1.054 0.6613 10.795 5.563 5.047 1.321 1.039 14.626 6.625 6.065 1.587 1.501 18.00
Nominal size
Diameter Cross-sectArea sq.in.
Inside
Volumegal/lin ft.
Weightlb/lin ftOutside in. Inside in.
1/4 0.375 0.315 0.078 0.00404 0.1263/8 0.500 0.430 0.145 0.00753 0.1981/2 0.625 0.545 0.233 0.0121 0.2855/8 0.750 0.666 0.348 0.0181 0.3623/4 0.875 0.785 0.484 0.0250 0.4551 1.125 1.025 0.825 0.0442 0.655
1-1/4 1.375 1.265 1.26 0.0655 0.8841-1/2 1.625 1.505 1.78 0.0925 1.14
2 2.125 1.985 3.10 0.161 1.752-1/2 2.625 2.465 4.77 0.247 2.48
3 3.125 2.945 6.81 0.354 3.334 4.125 3.905 12.0 0.623 5.38
74
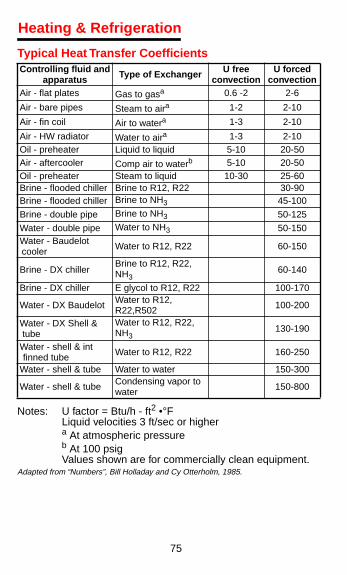
Heating & Refrigeration
Typical Heat Transfer Coefficients
Notes: U factor = Btu/h - ft2 •°FLiquid velocities 3 ft/sec or highera At atmospheric pressureb At 100 psigValues shown are for commercially clean equipment.
Adapted from “Numbers”, Bill Holladay and Cy Otterholm, 1985.
Controlling fluid and apparatus Type of Exchanger U free
convectionU forced
convectionAir - flat plates Gas to gasa 0.6 -2 2-6
Air - bare pipes Steam to aira 1-2 2-10
Air - fin coil Air to watera 1-3 2-10
Air - HW radiator Water to aira 1-3 2-10Oil - preheater Liquid to liquid 5-10 20-50Air - aftercooler Comp air to waterb 5-10 20-50Oil - preheater Steam to liquid 10-30 25-60Brine - flooded chiller Brine to R12, R22 30-90Brine - flooded chiller Brine to NH3 45-100
Brine - double pipe Brine to NH3 50-125
Water - double pipe Water to NH3 50-150Water - Baudelot cooler Water to R12, R22 60-150
Brine - DX chillerBrine to R12, R22, NH3
60-140
Brine - DX chiller E glycol to R12, R22 100-170
Water - DX Baudelot Water to R12, R22,R502 100-200
Water - DX Shell & tube
Water to R12, R22, NH3
130-190
Water - shell & int finned tube Water to R12, R22 160-250
Water - shell & tube Water to water 150-300
Water - shell & tube Condensing vapor to water 150-800
75
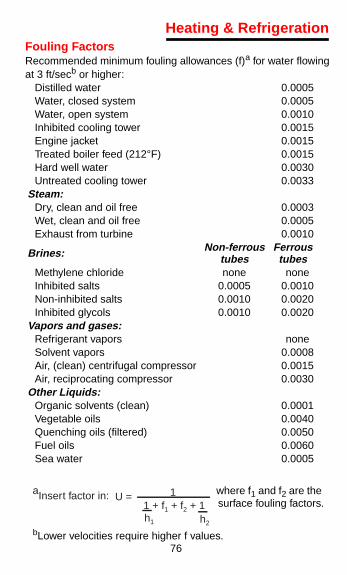
76
Fouling FactorsRecommended minimum fouling allowances (f)a for water flowingat 3 ft/secb or higher:
where f1 and f2 are the surface fouling factors.
bLower velocities require higher f values.
Distilled water 0.0005Water, closed system 0.0005Water, open system 0.0010Inhibited cooling tower 0.0015Engine jacket 0.0015Treated boiler feed (212°F) 0.0015Hard well water 0.0030Untreated cooling tower 0.0033
Steam:Dry, clean and oil free 0.0003Wet, clean and oil free 0.0005Exhaust from turbine 0.0010
Brines: Non-ferrous tubes
Ferroustubes
Methylene chloride none noneInhibited salts 0.0005 0.0010Non-inhibited salts 0.0010 0.0020Inhibited glycols 0.0010 0.0020
Vapors and gases:Refrigerant vapors noneSolvent vapors 0.0008Air, (clean) centrifugal compressor 0.0015Air, reciprocating compressor 0.0030
Other Liquids:Organic solvents (clean) 0.0001Vegetable oils 0.0040Quenching oils (filtered) 0.0050Fuel oils 0.0060Sea water 0.0005
aInsert factor in: 11 + f1 + f2 + 1h1 h2
U =
Heating & Refrigeration

Heating & Refrigeration
Cooling Tower Ratings†
Hot water - Cold water = RangeCold water - Wet bulb = Approach The Capacity Factor is a multiplier by which the capacity at anycommon assumed condition may be found if the rating at someother point is known.Factors are based on a Heat Rejection Ratio of 1.25 (15,000 Btu/hr • ton) and gpm/ton flow rate.Example: at 95-85-80, the capacity is 0.62/0.85 or 0.73 thatof the rating at 90-80-70.
Capacity is reduced as the flow rate per ton is increased.If the refrigerant temperature is below 40°F, the heat rejection willbe greater than 15,000 btu/hr • ton.
Evaporation will cause increasing deposit of solids and foulingof condenser tube unless water is bled off. A bleed of 1% of thecirculation rate will result in a concentration of twice the originalsolids (two concentrations), and 0.5% bleed will result in threeconcentrations.
Horsepower per Ton†at 100°F Condensing TemperatureVapor enters Compressor at 65°F
†Adapted from “Numbers”, Bill Holladay and Cy Otterholm, 1985
Temperatures °FHot Water Cold Water Wet Bulb Capacity Factor
90 80 70 0.8592 82 70 1.0095 85 70 1.2490 80 72 0.7492 82 72 0.8895 85 72 1.1295 85 74 1.0095 85 76 0.8895 85 78 0.7595 85 80 0.62
Refrig. Temp., F 40 20 0 -20 -40 Practical Avg. 0.87 1.20 1.70 2.40 3.20
77
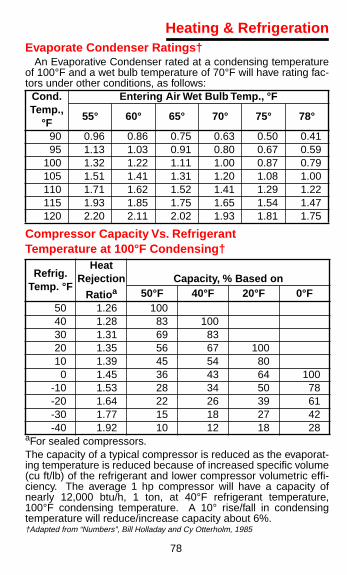
78
Evaporate Condenser Ratings†An Evaporative Condenser rated at a condensing temperature
of 100°F and a wet bulb temperature of 70°F will have rating fac-tors under other conditions, as follows:
Compressor Capacity Vs. Refrigerant Temperature at 100°F Condensing†
aFor sealed compressors.The capacity of a typical compressor is reduced as the evaporat-ing temperature is reduced because of increased specific volume(cu ft/lb) of the refrigerant and lower compressor volumetric effi-ciency. The average 1 hp compressor will have a capacity ofnearly 12,000 btu/h, 1 ton, at 40°F refrigerant temperature,100°F condensing temperature. A 10° rise/fall in condensingtemperature will reduce/increase capacity about 6%.†Adapted from “Numbers”, Bill Holladay and Cy Otterholm, 1985
Cond. Temp.,
°F
Entering Air Wet Bulb Temp., °F
55° 60° 65° 70° 75° 78°
90 0.96 0.86 0.75 0.63 0.50 0.4195 1.13 1.03 0.91 0.80 0.67 0.59
100 1.32 1.22 1.11 1.00 0.87 0.79105 1.51 1.41 1.31 1.20 1.08 1.00110 1.71 1.62 1.52 1.41 1.29 1.22115 1.93 1.85 1.75 1.65 1.54 1.47120 2.20 2.11 2.02 1.93 1.81 1.75
Refrig. Temp. °F
Heat Rejection
RatioaCapacity, % Based on
50°F 40°F 20°F 0°F50 1.26 10040 1.28 83 10030 1.31 69 8320 1.35 56 67 10010 1.39 45 54 80
0 1.45 36 43 64 100-10 1.53 28 34 50 78-20 1.64 22 26 39 61-30 1.77 15 18 27 42-40 1.92 10 12 18 28
Heating & Refrigeration

Heating & Refrigeration
79
Refrigerant Line Capacities for 134a†Tons for 100 ft. - Type L. Copper, Suction Lines, ∆t = 2°F
Refrigerant Line Capacities for R-22†Tons for 100 ft. - Type L. Copper, Suction Lines, ∆t = 2°F
*Tables are based on 105°F condensing temperature.Refrigerant temperature has little effect on discharge line size. Steel pipe has about the same capacity as Type L. copper 1/8” larger.†Adapted from ASHRAE Refrigeration Handbook 1998.
Saturated Suction Temp. °F/∆p
Discharge Lines∆t 1°F
Liquid Lines
SizeO.D.
01.00
101.19
201.41
301.66
401.93 0 ∆t 1°F
1/2 0.14 0.18 0.23 0.29 0.35 0.54 2.795/8 0.27 0.34 0.43 0.54 0.66 1.01 5.277/8 0.71 0.91 1.14 1.42 1.75 2.67 14.00
1-1/8 1.45 1.84 2.32 2.88 3.54 5.40 28.401-3/8 2.53 3.22 4.04 5.02 6.17 9.42 50.001-5/8 4.02 5.10 6.39 7.94 9.77 14.90 78.602-1/8 8.34 10.60 13.30 16.50 20.20 30.80 163.002-5/8 14.80 18.80 23.50 29.10 35.80 54.40 290.003-1/8 23.70 30.00 37.50 46.40 57.10 86.70 462.003-5/8 35.10 44.60 55.80 69.10 84.80 129.00 688.004-1/8 49.60 62.90 78.70 97.40 119.43 181.00 971.005-1/8 88.90 113.00 141.00 174.00 213.006-1/8 143.00 181.00 226.00 280.00 342.00
Saturated Suction Temp. °F/∆p
Discharge Lines∆t 1°F
Liquid Lines
SizeO.D.
-400.79
-201.15
01.6
202.2
402.9 0 ∆t 1°F
1/2 0.40 0.6 0.8 3.65/8 0.32 0.51 0.76 1.1 1.5 6.77/8 0.52 0.86 1.3 2.0 2.9 4.0 18.2
1-1/8 1.1 1.7 2.7 4.0 5.8 8.0 37.01-3/8 1.9 3.1 4.7 7.0 10.1 14.0 64.71-5/8 3.0 4.8 7.5 11.1 16.0 22.0 1022-1/8 6.2 10.0 15.6 23.1 33.1 45.6 2132-5/8 10.9 17.8 27.5 40.8 58.3 80.4 3773-1/8 17.5 28.4 44.0 65.0 92.9 128 6023-5/8 26.0 42.3 65.4 96.6 138 190 8964-1/8 36.8 59.6 92.2 136 194 268 12635-1/8 60.0 107 164 244 347 478

80
Refrigerant Line Capacities for R-502†Tons for 100 ft. - Type L. Copper, Suction Lines, ∆t = 2°F
Refrigerant Line Capacities for R-717†Tons for 100 ft. - Type L. Copper
aSchedule 80†Adapted from ASHRAE Refrigeration Handbook 1998.
Saturated Suction Temp. °F/∆p
Discharge Lines ∆t
1°F
Liquid Lines
Size∆p
-400.92
-201.33
01.84
202.45
403.18 0 ∆t 1°F
1/2 0.08 0.14 0.22 0.33 0.49 0.63 2.45/8 0.16 0.27 0.42 0.63 0.91 1.2 4.57/8 0.43 0.70 1.1 1.7 2.4 3.1 11.8
1-1/8 0.87 1.4 2.2 3.4 4.8 6.3 24.11-3/8 1.5 2.5 3.9 5.8 8.4 10.9 42.01-5/8 2.4 4.0 6.2 9.2 13.3 17.2 66.42-1/8 5.0 8.2 12.8 19.1 27.5 35.6 1382-5/8 8.8 14.5 22.6 33.7 48.4 62.8 2443-1/8 14.1 23.2 36.0 53.7 77.0 99.8 3893-5/8 21.0 34.4 53.5 79.7 114 148 5794-1/8 29.7 48.5 75.4 112 161 208 8175-1/8 53.2 86.7 135 200 287 3716-1/8 85.6 140 216 321 461 596
R-717 (Ammonia)Tons for 100 Ft. ∆p
IPS ∆pSch
-400.31
-200.49
00.73
201.06
401.46
3 2
3/4 80 2.6 3.81 2.1 3.4 5.2 7.6 13.9 106
1-1/4 40 3.2 5.6 8.9 13.6 19.9 36.5 229a
1-1/2 4.9 8.4 13.4 20.5 29.9 54.8 349a
2 9.5 16.2 26.0 39.6 57.8 106 8112-1/2 15.3 25.9 41.5 63.2 92.1 168 1293
3 27.1 46.1 73.5 112 163 298 22884 55.7 94.2 150 229 333 600 46625 101 170 271 412 601 10956 164 276 439 668 972 1771
Heating & Refrigeration

81
Horsepower (1 Ph) =Volts x Amperes x Efficiency x Power Factor
746
Miscellaneous Formulas
OHMS Law
Ohms = Volts/Amperes (R = E/I) Amperes = Volts/Ohms (I = E/R)Volts = Amperes x Ohms (E = IR)
Power—A-C Circuits
Power —D-C Circuits
Watts = Volts x Amperes ( W = EI)
746 x Output HorsepowerInput Watts
Efficiency =
Three-Phase Kilowatts = Volts x Amperes x Power Factor x 1.7321000
Three-Phase Volt-Amperes = Volts x Amperes x 1.732
Three-Phase Amperes = 746 x Horsepower1.732 x Volts x Efficiency x Power Factor
Three-Phase Efficiency = 746 x HorsepowerVolts x Amperes x Power Factor x 1.732
Single-Phase Kilowatts = Volts x Amperes x Power Factor1000
Three-Phase Power Factor = Input WattsVolts x Amperes x 1.732
Single-Phase Amperes = 746 x HorsepowerVolts x Efficiency x Power Factor
Single-Phase Efficiency = 746 x HorsepowerVolts x Amperes x Power Factor
Single-Phase Power Factor = Input WattsVolts x Amperes
Horsepower (3 Ph) = Volts x Amperes x 1.732 x Efficiency x Power Factor746
Amperes = WattsVolts
(I = W/E)
Horsepower = Volts x Amperes x Efficiency746
Formulas & Conversion Factors
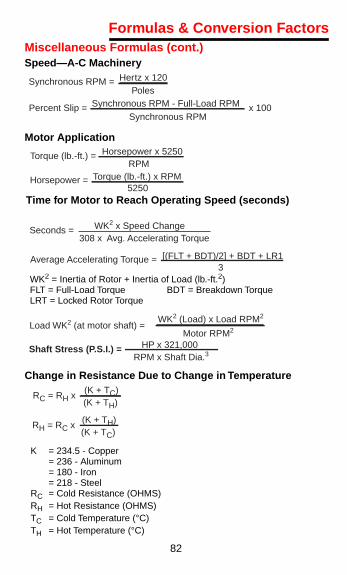
82
Miscellaneous Formulas (cont.)
Speed—A-C Machinery
Motor Application
WK
2
= Inertia of Rotor + Inertia of Load (lb.-ft.
2
)FLT = Full-Load Torque BDT = Breakdown TorqueLRT = Locked Rotor Torque
Change in Resistance Due to Change in Temperature
K = 234.5 - Copper= 236 - Aluminum= 180 - Iron= 218 - Steel
R
C
= Cold Resistance (OHMS)R
H
= Hot Resistance (OHMS)T
C
= Cold Temperature (°C)T
H
= Hot Temperature (°C)
Synchronous RPM = Hertz x 120Poles
Percent Slip = Synchronous RPM - Full-Load RPMSynchronous RPM
x 100
Torque (lb.-ft.) = Horsepower x 5250RPM
Horsepower = Torque (lb.-ft.) x RPM5250
Seconds = WK2 x Speed Change308 x Avg. Accelerating Torque
Average Accelerating Torque = [(FLT + BDT)/2] + BDT + LR13
Load WK2 (at motor shaft) =WK2 (Load) x Load RPM2
Motor RPM2
Shaft Stress (P.S.I.) = HP x 321,000RPM x Shaft Dia.3
RC = RH x (K + TC)(K + TH)
RH = RC x (K + TH)(K + TC)
Time for Motor to Reach Operating Speed (seconds)
Formulas & Conversion Factors

83
Miscellaneous Formulas (cont.)
Vibration
D = .318 (V/f) D = Displacement (Inches Peak-Peak)V =
π
(f) (D) V = Velocity (Inches per Second Peak)
A = .051 (f)
2
(D) A = Acceleration (g’s Peak)A = .016 (f) (V) f = Frequency (Cycles per Second)
Volume of Liquid in a Tank
Gallons = 5.875 x D
2
x HD = Tank Diameter (ft.)H = Height of Liquid (ft.)
Centrifugal ApplicationsAffinity Laws for Centrifugal Applications:
For Pumps
For Fans and Blowers
1 ft. of water = 0.433 PSI 1 PSI = 2.309 Ft. of water
Specify Gravity of Water = 1.0
BHP = CFM x PSI229 x Efficiency of Fan
Flow1Flow2
= RPM1RPM2
Pres1Pres2
= (RPM1)2
(RPM2)2
BHP1BHP2
= (RPM1)3
(RPM2)3
BHP = CFM x PSF33000 x Efficiency of Fan
BHP = CFM x PIW6344 x Efficiency of Fan
Temperature: °F = °C 95
+ 32 °C = (°F - 32)95
Tip Speed (FPS) = D(in) x RPM x π720
BHP = GPM x PSI x Specific Gravity1713 x Efficiency of Pump
BHP = GPM x FT x Specific Gravity3960 x Efficiency of Pump
Formulas & Conversion Factors
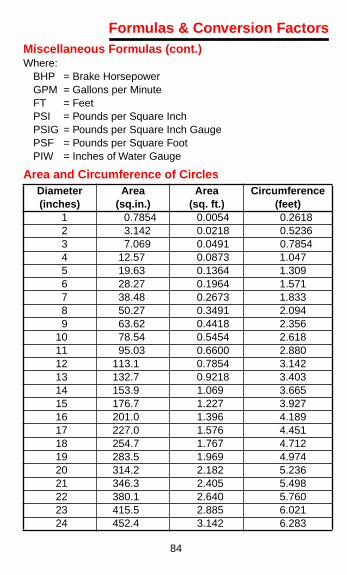
84
Miscellaneous Formulas (cont.)
Where:BHP = Brake HorsepowerGPM = Gallons per MinuteFT = FeetPSI = Pounds per Square InchPSIG = Pounds per Square Inch GaugePSF = Pounds per Square FootPIW = Inches of Water Gauge
Area and Circumference of Circles
Diameter(inches)
Area(sq.in.)
Area(sq. ft.)
Circumference(feet)
1 0.7854 0.0054 0.26182 3.142 0.0218 0.52363 7.069 0.0491 0.78544 12.57 0.0873 1.0475 19.63 0.1364 1.3096 28.27 0.1964 1.5717 38.48 0.2673 1.8338 50.27 0.3491 2.0949 63.62 0.4418 2.356
10 78.54 0.5454 2.61811 95.03 0.6600 2.88012 113.1 0.7854 3.14213 132.7 0.9218 3.40314 153.9 1.069 3.66515 176.7 1.227 3.92716 201.0 1.396 4.18917 227.0 1.576 4.45118 254.7 1.767 4.71219 283.5 1.969 4.97420 314.2 2.182 5.23621 346.3 2.405 5.49822 380.1 2.640 5.76023 415.5 2.885 6.02124 452.4 3.142 6.283
Formulas & Conversion Factors

Formulas & Conversion Factors
Area and Circumference of Circles (cont.)Diameter(inches)
Area(sq.in.)
Area(sq. ft.)
Circumference(feet)
25 490.9 3.409 6.54526 530.9 3.687 6.80727 572.5 3.976 7.06928 615.7 4.276 7.33029 660.5 4.587 7.59230 706.8 4.909 7.85431 754.7 5.241 8.11632 804.2 5.585 8.37833 855.3 5.940 8.63934 907.9 6.305 8.90135 962.1 6.681 9.16336 1017.8 7.069 9.42537 1075.2 7.467 9.68638 1134.1 7.876 9.94839 1194.5 8.296 10.2140 1256.6 8.727 10.4741 1320.2 9.168 10.7342 1385.4 9.621 10.9943 1452.2 10.08 11.2644 1520.5 10.56 11.5245 1590.4 11.04 11.7846 1661.9 11.54 12.0447 1734.9 12.05 12.3048 1809.5 12.57 12.5749 1885.7 13.09 12.8350 1963.5 13.64 13.0951 2043 14.19 13.3552 2124 14.75 13.6153 2206 15.32 13.8854 2290 15.90 14.1455 2376 16.50 14.4056 2463 17.10 14.6657 2552 17.72 14.92
85

Formulas & Conversion Factors
86
Diameter(inches)
Area(sq.in.)
Area(sq. ft.)
Circumference(feet)
58 2642 18.35 15.1859 2734 18.99 15.4560 2827 19.63 15.7161 2922 20.29 15.9762 3019 20.97 16.2363 3117 21.65 16.4964 3217 22.34 16.7665 3318 23.04 17.0266 3421 23.76 17.2867 3526 24.48 17.5468 3632 25.22 17.8069 3739 25.97 18.0670 3848 26.73 18.3371 3959 27.49 18.5972 4072 28.27 18.8573 4185 29.07 19.1174 4301 29.87 19.3775 4418 30.68 19.6376 4536 31.50 19.9077 4657 32.34 20.1678 4778 33.18 20.4279 4902 34.04 20.6880 5027 34.91 20.9481 5153 35.78 21.2182 5281 36.67 21.4783 5411 37.57 21.7384 5542 38.48 21.9985 5675 39.41 22.2586 5809 40.34 22.5187 5945 41.28 22.7888 6082 42.24 23.0489 6221 43.20 23.3090 6362 44.18 23.5691 6504 45.17 23.82
Area and Circumference of Circles (cont.)

87
Area and Circumference of Circles (cont.)
Circle FormulaWhere: A = Area
C = Circumferencer = Radiusd = Diameter
Diameter(inches)
Area(sq.in.)
Area(sq. ft.)
Circumference(feet)
92 6648 46.16 24.0993 6793 47.17 24.3594 6940 48.19 24.6195 7088 49.22 24.8796 7238 50.27 25.1397 7390 51.32 25.3998 7543 52.38 25.6699 7698 53.46 25.92
100 7855 54.54 26.18
Fraction Decimal mm Fraction Decimal mm1/64 0.01562 0.397 17/64 0.26562 6.7471/32 0.03125 0.794 9/32 0.28125 7.1443/64 0.04688 1.191 19/64 0.29688 7.5411/16 0.06250 1.588 5/16 0.31250 7.9385/64 0.07812 1.984 21/64 0.32812 8.3343/32 0.09375 2.381 11/32 0.34375 8.7317/64 0.10938 2.778 23/64 0.35938 9.1281/8 0.12500 3.175 3/8 0.37500 9.5259/64 0.14062 3.572 25/64 0.39062 9.9225/32 0.15625 3.969 13/32 0.40625 10.31911/64 0.17188 4.366 27/64 0.42188 10.7163/16 0.18750 4.763 7/16 0.43750 11.11313/64 0.20312 5.159 29/64 0.45312 11.5097/32 0.21875 5.556 15/32 0.46875 11.90615/64 0.23438 5.953 31/64 0.48438 12.3031/4 0.25000 6.350 1/2 0.50000 12.700
A(in2) = π r (in)2 = π d(in)24
A(ft2) = π d(in)2576
π r (in)2144
=
C(ft) = π d (in)12
Formulas & Conversion Factors
Common Fractions of an InchDecimal and Metric Equivalents

Common Fractions of an Inch (cont.)
Formulas & Conversion Factors
Conversion Factors
Fraction Decimal mm Fraction Decimal mm33/64 0.51562 13.097 49/64 0.76562 19.44717/32 0.53125 13.494 25/32 0.78125 19.84435/64 0.54688 13.891 51/64 0.79688 20.2419/16 0.56250 14.288 13/16 0.81250 20.63837/64 0.57812 14.684 53/64 0.82812 21.03419/32 0.59375 15.081 27.32 0.84375 21.43139.64 0.60938 15.478 55/64 0.85938 21.8285/8 0.62500 15.875 7/8 0.87500 22.225
41/64 0.64062 16.272 57/64 0.89062 22.62221/32 0.65625 16.669 29/32 0.90625 23.01943/64 0.67188 17.066 59/64 0.92188 23.41611/16 0.68750 17.463 15/16 0.93750 23.81345/64 0.70312 17.859 61/64 0.95312 24.20923/32 0.71875 18.256 31/32 0.96875 24.60647/64 0.73438 18.653 63/64 0.98438 25.0043/4 0.75000 19.050 1/1 1.00000 25.400
Multiply Length By To Obtain centimeters x .3937 = Inches fathoms x 6.0 = Feet feet x 12.0 = Inches feet x .3048 = Meters inches x 2.54 = Centimeters kilometers x .6214 = Miles meters x 3.281 = Feet meters x 39.37 = Inches meters x 1.094 = Yards miles x 5280.0 = Feet miles x 1.609 = Kilometers rods x 5.5 = Yards yards x .9144 = Meters
Decimal and Metric Equilavents
88

Conversion Factors (cont.)
Multiply Area By To Obtain
acres x 4047.0 = Square metersacreacreacrecircu
scircuhecthect
squa ssqua ssqua ssquasquasqua
squasquasqua s
Mult
cubicubicubi )cubicubicubigallogallolitersliters )ouncquar
Formulas & Conversion Factors
s x .4047 = Hectaress x 43560.0 = Square feets x 4840.0 = Square yardslar mils x 7.854x10-7 = Square inchelar mils x .7854 = Square milsares x 2.471 = Acresares x 1.076 x 105 = Square feetre centimeters x .155 = Square inchere feet x 144.0 = Square inchere feet x .0929 = Square meterre inches x 6.452 = Square cm.re meters x 1.196 = Square yardsre meters x 2.471 x 10-4 = Acresre miles x 640.0 = Acresre mils x 1.273 = Circular milsre yards x .8361 = Square meter
iply Volume By To Obtainc feet x .0283 = Cubic metersc feet x 7.481 = Gallonsc inches x .5541 = Ounces (fluidc meters x 35.31 = Cubic feetc meters x 1.308 = Cubic yardsc yards x .7646 = Cubic metersns x .1337 = Cubic feetns x 3.785 = Liters x .2642 = Gallons x 1.057 = Quarts (liquides (fluid) x 1.805 = Cubic inchests (fluid) x .9463 = Liters
89

Conversion Factors (cont.)
PounGallo
Multiply Force & Weight By To Obtain
grams x .0353 = Ounceskilognew )ounpoupoutonstons
Mul
gramnewnewoun erspoupou
Mul
BtuBtu
Mult
Btu
hors er
hors er
horskilow
Mult
degminuminu
quaquaradi
Formulas & Conversion Factors
rams x 2.205 = Poundstons x .2248 = Pounds (forceces x 28.35 = Gramsnds x 453.6 = Gramsnds (force) x 4.448 = Newton (short) x 907.2 = Kilograms (short) x 2000.0 = Poundstiply Torque By To Obtain
-centimeters x .0139 = Ounce-incheston-meters x .7376 = Pound-feetton-meters x 8.851 = Pound-inchesce-inches x 71.95 = Gram-centimetnd-feet x 1.3558 = Newton-metersnd-inches x .113 = Newton-meterstiply Energy or Work By To Obtain
x 778.2 = Foot-poundsx 252.0 = Gram-calories
iply Power By To Obtainper hour x .293 = Watts
epower x 33000.0 = Foot-pounds pminute
epower x 550.0 = Foot-pounds psecond
epower x 746.0 = Watts
90
ds are U.S. avoirdupois.ns and quarts are U.S.
atts x 1.341 = Horsepoweriply Plane Angle By To Obtainrees x .0175 = Radianstes x .01667 = Degreestes x 2.9x10-4 = Radians
drants x 90.0 = Degreesdrants x 1.5708 = Radiansans x 57.3 = Degrees
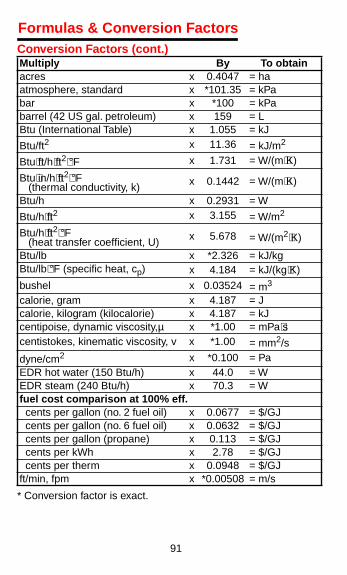
Formulas & Conversion Factors
Conversion Factors (cont.)* Conversion factor is exact.
Multiply By To obtainacres x 0.4047 = haatmosphere, standard x *101.35 = kPabar x *100 = kPabarrel (42 US gal. petroleum) x 159 = LBtu (International Table) x 1.055 = kJ
Btu/ft2 x 11.36 = kJ/m2
Btu⋅ft/h⋅ft2⋅°F x 1.731 = W/(m⋅K)
Btu⋅in/h⋅ft2⋅°F (thermal conductivity, k) x 0.1442 = W/(m⋅K)
Btu/h x 0.2931 = W
Btu/h⋅ft2 x 3.155 = W/m2
Btu/h⋅ft2⋅°F (heat transfer coefficient, U) x 5.678 = W/(m2⋅K)
Btu/lb x *2.326 = kJ/kgBtu/lb⋅°F (specific heat, cp) x 4.184 = kJ/(kg⋅K)
bushel x 0.03524 = m3
calorie, gram x 4.187 = Jcalorie, kilogram (kilocalorie) x 4.187 = kJcentipoise, dynamic viscosity,µ x *1.00 = mPa⋅scentistokes, kinematic viscosity, v x *1.00 = mm2/s
dyne/cm2 x *0.100 = PaEDR hot water (150 Btu/h) x 44.0 = WEDR steam (240 Btu/h) x 70.3 = Wfuel cost comparison at 100% eff. cents per gallon (no. 2 fuel oil) x 0.0677 = $/GJ cents per gallon (no. 6 fuel oil) x 0.0632 = $/GJ cents per gallon (propane) x 0.113 = $/GJ cents per kWh x 2.78 = $/GJ cents per therm x 0.0948 = $/GJft/min, fpm x *0.00508 = m/s
91
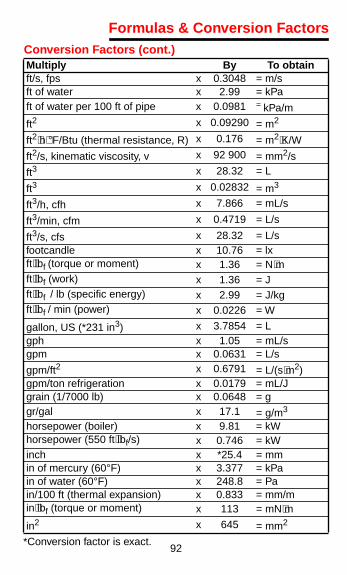
Conversion Factors (cont.)Multiply By To obtainft/s, fps x 0.3048 = m/sft of water x 2.99 = kPaft of water per 100 ft of pipe x 0.0981 = kPa/m
ft2 x 0.09290 = m2
ft2⋅h⋅°F/Btu (thermal resistance, R) x 0.176 = m2⋅K/W
ft2/s, kinematic viscosity, v x 92 900 = mm2/s
ft3 x 28.32 = L
ft3 x 0.02832 = m3
ft3/h, cfh x 7.866 = mL/s
ft3/min, cfm x 0.4719 = L/s
ft3/s, cfs x 28.32 = L/sfootcandle x 10.76 = lxft⋅lbf (torque or moment) x 1.36 = N⋅mft⋅lbf (work) x 1.36 = Jft⋅lbf / lb (specific energy) x 2.99 = J/kgft⋅lbf / min (power) x 0.0226 = W
gallon, US (*231 in3) x 3.7854 = Lgph x 1.05 = mL/sgpm x 0.0631 = L/s
gpm/ft2 x 0.6791 = L/(s⋅m2)gpm/ton refrigeration x 0.0179 = mL/Jgrain (1/7000 lb) x 0.0648 = ggr/gal x 17.1 = g/m3
horsepower (boiler) x 9.81 = kWhorsepower (550 ft⋅lbf/s) x 0.746 = kWinch x *25.4 = mmin of mercury (60°F) x 3.377 = kPain of water (60°F) x 248.8 = Pain/100 ft (thermal expansion) x 0.833 = mm/min⋅lbf (torque or moment) x 113 = mN⋅min2 x 645 = mm2
*Conversion factor is exact.
Formulas & Conversion Factors
92
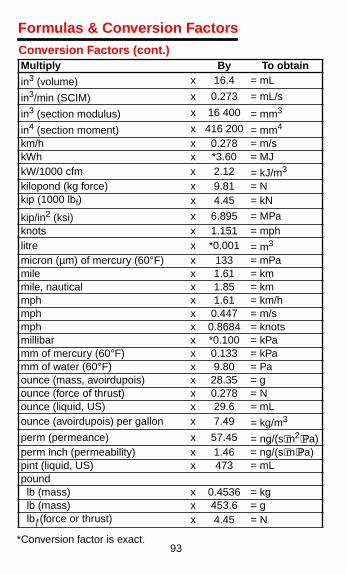
93
Conversion Factors (cont.)Multiply By To obtain
in3 (volume) x 16.4 = mL
in3/min (SCIM) x 0.273 = mL/s
in3 (section modulus) x 16 400 = mm3
in4 (section moment) x 416 200 = mm4
km/h x 0.278 = m/skWh x *3.60 = MJkW/1000 cfm x 2.12 = kJ/m3
kilopond (kg force) x 9.81 = Nkip (1000 lbf) x 4.45 = kN
kip/in2 (ksi) x 6.895 = MPaknots x 1.151 = mphlitre x *0.001 = m3
micron (µm) of mercury (60°F) x 133 = mPamile x 1.61 = kmmile, nautical x 1.85 = kmmph x 1.61 = km/hmph x 0.447 = m/smph x 0.8684 = knotsmillibar x *0.100 = kPamm of mercury (60°F) x 0.133 = kPamm of water (60°F) x 9.80 = Paounce (mass, avoirdupois) x 28.35 = gounce (force of thrust) x 0.278 = Nounce (liquid, US) x 29.6 = mLounce (avoirdupois) per gallon x 7.49 = kg/m3
perm (permeance) x 57.45 = ng/(s⋅m2⋅Pa)perm inch (permeability) x 1.46 = ng/(s⋅m⋅Pa)pint (liquid, US) x 473 = mLpound lb (mass) x 0.4536 = kg lb (mass) x 453.6 = g lbƒ(force or thrust) x 4.45 = N
*Conversion factor is exact.
Formulas & Conversion Factors

Formulas & Conversion Factors
Conversion Factors (cont.)
* Conversion factor is exact.Note:
In this list the kelvin (K) expresses temperature intervals. The degree Celsius symbol (°C) is often used for this pur-pose as well.
Multiply By To obtain lb/ft (uniform load) x 1.49 = kg/m lbm/(ft⋅h) (dynamic viscosity, µ) x 0.413 = mPa⋅s lbm/(ft⋅s) (dynamic viscosity, µ) x 1490 = mPa⋅s lbƒs/ft2 (dynamic viscosity, µ) x 47 880 = mPa⋅s lb/min x 0.00756 = kg/s lb/h x 0.126 = g/s lb/h (steam at 212°F) x 0.284 = kW
lbƒ/ft2 x 47.9 = Pa
lb/ft2 x 4.88 = kg/m2
lb/ft3 (density, p) x 16.0 = kg/m3
lb/gallon x 120 = kg/m3
ppm (by mass) x *1.00 = mg/kgpsi x 6.895 = kPaquart (liquid, US) x 0.946 = L
square (100 ft2) x 9.29 = m2
tablespoon (approx.) x 15 = mLteaspoon (approx.) x 5 = mLtherm (100,000 Btu) x 105.5 = MJton, short (2000 lb) x 0.907 = mg; t (tonne)ton, refrigeration (12,000 Btu/h) x 3.517 = kWtorr (1 mm Hg at 0°C) x 133 = Pawatt per square foot x 10.8 = W/m2
yd x 0.9144 = m
yd2 x 0.836 = m2
yd3 x 0.7646 = m3
94

95
15
20 40°
50°
50
45
4080
°
70°
35
SATURATION TEMERATURE -
°F
ENTHALPY (h) -
BTU P
ER POUND O
F DRY A
IR
30
2560
°
40
12.5
5060
70
13.0
13.5
8090
100
110
30354045505560.0
28
.026
.024
10%
Rel
ativ
e H
umid
ity
14.0
15.0
Humidity Ratio (W) - Pounds moisture per pound dry air
Dry
Bu
lb T
emp
F°
80°F
Wet
Bul
b Te
mp
Red
uce
d f
rom
AS
HR
AE
Psy
chro
met
ric
Ch
art
No
. 1
.022
.020
.018
.016
.014
.012
.010
.008
.006
.004
.002
Vol. CU FT per LB dry air 1
4.5
90% 70% 50% 30
%
AS
HR
AE
Psy
chro
met
ric
Ch
art
No
.1N
orm
al T
emp
erat
ure
Bar
om
etri
c P
ress
ure
: 29
.921
Inch
es o
f S
um
mar
yC
opy
rig
ht
1992
Am
eric
an S
oci
ety
of
Hea
tin
g, R
efri
ger
atio
n
and
Air
-Co
nd
itio
nin
g E
ng
inee
rs, I
nc.
Pyschometric Chart
Formulas & Conversion Factors

INDEX
AAffinity Laws for Centrifugal Applications 83For Fans and Blowers 83For Pumps 83
Affinity Laws for Pumps 66Air Change Method 40Air Density Factors for Altitude and Temperature 3Air Quality Method 40Airfoil Applications 5Allowable Ampaciites of Not More Than Three Insultated Conductors 24–25Alternating Current 16Annual Fuel Use 63–64Appliance Gas-Burning, Floor Mounted Type 45Area and Circumference of Circles 84–87Axial Fan Types 1BBackdraft or Relief Dampers 49Backward Inclined, Backward Curved
Applications 6Bearing Life 28Belt Drive Guidelines 26Belt Drives 26Breakdown Torque 16CCell-Type Air Washers 53Centrifugal Fan Types 1Centrifugal Fan Conditions
Typical Inlet Conditions 14Typical Outlet Conditions 14
Change in Resistance Due to Change in Temperature 82Circle Formula 87Classifications for Spark Resistant Construction 4–5
Construction Type 4Notes 4–5Standard Applications 5
Closed Impeller 64
96

INDEX
Common Fractions of an Inch 87Compressor Capacity Vs. Refrigerant Temperature at 100°F Condensing 78Conversion Factors 88–94Cooling Load Check Figures 59–60Cooling Tower Ratings 77Copper Tube Dimensions (Type L) 74DDamper Pressure Drop 49Decimal and Metric Equivalents 87–88Dehumidifying Coils 53Design Criteria for Room Loudness 35–36Double Suction 64Drive Arrangements for Centrifugal Fans 9–10Arr. 1 SWSI 9Arr. 10 SWSI 10Arr. 2 SWSI 9Arr. 3 DWDI 9Arr. 3 SWSI 9Arr. 4 SWSI 9Arr. 7 DWDI 10Arr. 7 SWSI 9Arr. 8 SWSI 10Arr. 9 SWSI 10
Duct Resistance 51EEfficiency 16Electric Coils 53Electric, Floor Mounted Type 45Electrical Appliances 46Electronic Air Cleaners 53Equivalent Length of Pipe for Valves and Fittings 73Estimated Belt Drive Loss 27Estimated Seasonal Efficiencies of Heating Systems 63Evaporate Condenser Ratings 78Exhaust Louvers 53
97

INDEX
FFan BasicsFan Selection Criteria 1Fan Types 1Impeller Designs - Axial 7
Fan Installation Guidelines 14Centrifugal Fan Conditions 14
Fan Laws 2Fan Performance Tables and Curves 2Fan Selection Criteria 1Fan Testing - Laboratory, Field 2Fan Troubleshooting Guide 15
Excessive Vibration and Noise 15Low Capacity or Pressure 15Overheated Bearings 15Overheated Motor 15
Fan Types 1Axial Fan 1Centrifugal Fan 1
Filter Comparison 46Filter Type 46
For Pumps 83Forward Curved Applications 6Fouling Factors 76Frequency Variations 23Friction Loss for Water Flow 71–72Fuel Comparisons 62Fuel Gas Characteristics 62Full Load Current 21–22
Single Phase Motors 21Three Phase Motors 22
GGas-Burning Appliances 46General Ventilation 29
98
INDEX
HHeat Gain From Occupants of Conditioned Spaces 43Typical Application 43Heat Gain From Typical Electric Motors 44Heat Loss Estimates 61–62
Considerations Used for Corrected Values 62Heat Removal Method 40High-Velocity, Spray-Type Air Washers 53Horizontal Split Case 65Horsepower 16Horsepower per Ton 77IImpeller Designs - Axial
Propeller 7Tube Axial 7Vane Axial 7
Impeller Designs - Centrifugal 5–6Airfoil 5Backward Inclined, Backward Curved 6Forward Curved 6Radial 6
Inadequate or No Circulation 68Induction Motor Characteristics 23Intake Louvers 53KKitchen Ventilation 30
Fans 30Filters 30Hoods and Ducts 30
LLocked Rotor KVA/HP 19Locked Rotor Torque 16
99

INDEX
MMiscellaneous Formulas 81–84Moisture and Air Relationships 57Motor and Drive Basics Definitions and Formulas 16Motor Application 82Motor Efficiency and EPAct 20Motor Insulation Classes 18Motor Positions for Belt or Chain Drive 13Motor Service Factors 19NNoise Criteria 32Noise Criteria Curves 34OOHMS Law 81Open Impeller 64Optimum Relative Humidity Ranges for Healt 48PPanel Filters 53Power —D-C Circuits 81Power —A-C Circuits 81Process Ventilation 29Propeller Applications 7Properties of Saturated Steam 58Pump Bodies 65Pump Construction TypesAll-Bronze Pumps 64Bronze-fitted Pumps 64
Pump Impeller Types 64Pump Mounting Methods 65
Base Mount-Close Coupled 65Base Mount-Long Coupled 65Line Mount 65
Pump or System Noise 67Pump Terms, Abbreviations, and Conversion Factors 69Pumping System Troubleshooting Guide 67–68Pyschometric Chart 95
100

INDEX
QQuiet Water Flows 70RRadialApplications 6Rate of Heat Gain Commercial Cooking Appliances in Air-Conditioned Area 45Rate of Heat Gain From Miscellaneous Appliances 46Rated Load Torque 16Recommended Metal Gauges for Ducts 56Rectangular Equivalent of Round Ducts 52Refrigerant Line Capacities for 134a 79Refrigerant Line Capacities for R-22 79Refrigerant Line Capacities for R-502 80Refrigerant Line Capacities for R-717 80Relief or Backdraft Dampers 49Renewable Media Filters 53Room Sones —dBA Correlation 33Room Type 35–36Auditoriums 35Churches and schools 35Hospitals and clinics 35Hotels 36Indoor sports activities 35Manufacturing areas 35Miscellaneous 36Offices 35Public buildings 36Residences 36Restaurants, cafeterias, lounges 36Retail stores 36Transportation 36
Rotation & Discharge Designations 11–12Rules of Thumb 31–32
101
INDEX
SScreen Pressure Drop 50Single Phase AC 16Single Phase AC Motors 17Single Suction 64Sound 31Sound Power 31Sound Power Level 31
Sound Power and Sound Power Leve 32Sound Pressure and Sound Pressure Leve 33Speed—A-C Machinery 82Spray-Type Air Washers 53Standard Pipe Dimenions Schedule 40 (Steel) 74Standard Pipe Dimensions 74Steam and Hot Water Coils 53Suggested Air Changes 41Synchronous speed 16System Design GuidelinesTTerminology for Centrifugal Fan Components 8Three Phase AC 16Three-phase AC Motors 17Time for Motor to Reach Operating Speed (seconds) 82Torque 16Tube Axial Applications 7Types of Alternating Current Motors 17–18
Three-phase AC Motors 17Types of Current Motors ??–18Typical Design Velocities for HVAC Components 53Typical Heat Transfer Coefficients 75UU.S. Sheet Metal Gauges 55Use of Air Density Factors - An Example 3
102
INDEX
VVane AxialApplications 7V-belt Length Formula 26Velocity and Velocity Pressure Relationships 54Ventilation Rates for Acceptable Indoor Air Quality 42Vertical Split Case 65Vibration 37, 83
System Natural Frequency 37Vibration Severity 38–39
Vibration Severity Chart 38Voltage 23Volume of Liquid in a Tank 83WWater Flow and Piping 70–71Wind Driven Rain Louvers 56
103