ENGINEERING CHARACTERISTICS OF KALO MATO ORGANIC SOIL...
15
________________________________________________________________________________ Majalah Ilmiah UKRIM Edisi 2/th XVI/2011 31 ENGINEERING CHARACTERISTICS OF KALO MATO ORGANIC SOIL FROM KATHMANDU ________________________________________________________________________ Handali, S 1) ., Neupane, R. 2) Upadhyay, H. B. 3) , Acharya, G. 4) 1) Dosen Tetap, Prodi Teknik Sipil, Fakultas Teknik, UKRIM 2) Doctoral Student, Saitama University, Japan 3) Deputy Chief, Research Training and Consultancy Division, Kantipur Engineering College 4) Teaching Staff, Council for Technical Teaching and Vocational Training (CTEVT), Nepal INTISARI Makalah ini memuat hasil penelitian terhadap tanah lempung organik yang banyak terdapat di Lembah Kathmandu, Nepal. Tanah yang dikenal dengan nama lokal Kalo Mato (‘tanah hitam’) bersifat sangat lunak sehingga menimbulkan persoalan bagi pembangunan di daerah tersebut. Penelitian diadakan terhadap contoh tanah yang diperoleh dari empat lokasi di Kathmandu, yaitu di Kopundole, Kalimati, Kirtipur dan Pulchowk. Kedalaman lubang bor bervariasi antara 10 m dan 30 m. Hasil-hasil pengujian tanah menunjukkan bahwa Kalo Mato dari lokasi pemboran mempunyai kadar organik yang berkisar antara 4% dan 13%. Kandungan organic dalam tanah mempengaruhi besaran indeks dan sifat konsolidasi tanah. Kadar air, batas cair, kadar pori dan indeks kompresi meningkat dengan meningkatnya kadar organik, sedangkan specific gravity dan berat unit tanah turun dengan meningkatnya kandungan organik dalam tanah. Pengujian konsolidasi jangka panjang menunjukkan kurva penurunan dengan waktu dalam skala logaritma yang berbeda dengan yang biasa dilihat dari hasil pengujian tanah non-organik, yaitu tidak jelasnya bagian dari kurva yang menunjukkan bagian dari konsolidasi primer dan sekunder. Dari bentuk kurva dapat disimpulkna bahwa cara yang biasa dilakukan untuk menentukan parameter konsolidasi berdasarkan Casagrande sebaiknya tidak diterapkan unruk maksud tersebut pada tranah Kalo Mato. Introduction Kathmandu Valley is located in the central part of Nepal, stretching 30 km in east west and 25 km in north-south directions, covering an area of about 650 square kilometers. The soil within the Valley comprises of lake sediment accumulated due to the damming of Bagmati River system as a result of the rise of the Mahabharat Range. The unconsolidated fine lacustrine deposit of silt and clay size particles is often interspersed with sand and gravel layers deposited by the rivers crisscrossing through the Valley floor at different
-
Upload
nguyencong -
Category
Documents
-
view
224 -
download
0
Transcript of ENGINEERING CHARACTERISTICS OF KALO MATO ORGANIC SOIL...

________________________________________________________________________________ Majalah Ilmiah UKRIM Edisi 2/th XVI/2011 31
ENGINEERING CHARACTERISTICS OF KALO MATO ORGANIC SOIL FROM
KATHMANDU
________________________________________________________________________
Handali, S1)
., Neupane, R.2)
Upadhyay, H. B.3)
, Acharya, G. 4)
1)
Dosen Tetap, Prodi Teknik Sipil, Fakultas Teknik, UKRIM 2)
Doctoral Student, Saitama University, Japan 3)
Deputy Chief, Research Training and Consultancy Division, Kantipur Engineering College 4)
Teaching Staff, Council for Technical Teaching and Vocational Training (CTEVT), Nepal
INTISARI
Makalah ini memuat hasil penelitian terhadap tanah lempung organik yang banyak
terdapat di Lembah Kathmandu, Nepal. Tanah yang dikenal dengan nama lokal Kalo
Mato (‘tanah hitam’) bersifat sangat lunak sehingga menimbulkan persoalan bagi
pembangunan di daerah tersebut. Penelitian diadakan terhadap contoh tanah yang
diperoleh dari empat lokasi di Kathmandu, yaitu di Kopundole, Kalimati, Kirtipur dan
Pulchowk. Kedalaman lubang bor bervariasi antara 10 m dan 30 m.
Hasil-hasil pengujian tanah menunjukkan bahwa Kalo Mato dari lokasi pemboran
mempunyai kadar organik yang berkisar antara 4% dan 13%. Kandungan organic dalam
tanah mempengaruhi besaran indeks dan sifat konsolidasi tanah. Kadar air, batas cair,
kadar pori dan indeks kompresi meningkat dengan meningkatnya kadar organik,
sedangkan specific gravity dan berat unit tanah turun dengan meningkatnya kandungan
organik dalam tanah.
Pengujian konsolidasi jangka panjang menunjukkan kurva penurunan dengan
waktu dalam skala logaritma yang berbeda dengan yang biasa dilihat dari hasil pengujian
tanah non-organik, yaitu tidak jelasnya bagian dari kurva yang menunjukkan bagian dari
konsolidasi primer dan sekunder. Dari bentuk kurva dapat disimpulkna bahwa cara yang
biasa dilakukan untuk menentukan parameter konsolidasi berdasarkan Casagrande
sebaiknya tidak diterapkan unruk maksud tersebut pada tranah Kalo Mato.
Introduction
Kathmandu Valley is located in the central part of Nepal, stretching 30 km in east
west and 25 km in north-south directions, covering an area of about 650 square kilometers.
The soil within the Valley comprises of lake sediment accumulated due to the damming of
Bagmati River system as a result of the rise of the Mahabharat Range. The unconsolidated
fine lacustrine deposit of silt and clay size particles is often interspersed with sand and
gravel layers deposited by the rivers crisscrossing through the Valley floor at different

________________________________________________________________________________ Majalah Ilmiah UKRIM Edisi 2/th XVI/2011 32
periods of time. The depth of the deposit above the bedrock varies within the Valley and
reaches up to 550m roughly at the center of the city of Kathmandu (Katel, et al, 1996).
Of particular interest from geotechnical engineering point of view is the large
presence of organic soils in Kathmandu, locally known as Kalo Mato. The name, which
literally means black soil, is derived from its colour, which is dark grey to black. The soil
was formed through the deposition in the ancient lake of the soil particles together with the
organic colloids originating from decaying plants and other organism. The occasional
encounter of decayed organic substance and outburst of gas during drilling as well as the
strong odour are some of the evidences of the organic nature of the soil. House builders in
Kathmandu dread the finding of Kalo Mato because of its very soft nature. To make matter
worst, the soil is often found at a shallow depth where footings are normally placed. No
attempt has so far been done to map the extent of Kalo Mato in Kathmandu, but from the
borehole data collected from different sites the soil is it evident that the soil is found almost
in the entire Valley, though the depth and thickness vary from location to location. In
Thapathali, Sano Thimi and Bhaktapur, for instance, the upper surface of Kalo Mato has
been discovered to start at a depth of 1 m while in Kalimati, Balkhu, Tahachal and
Gyaneshwor it starts at around 5 m depth. In Pulchowk and Ratna Park it has been found
to start at depths between 10 to 12 m. The thickness of the layer has been found to vary
from 1 m in Maharajgunj to more than 20 m in Thapathali.
An attempt to study the engineering characteristics of Kalo Mato in a systematic
manner has been conducted by the Institute of Engineering (IOE) through the thesis work
of students of the MSc. program in Geotechnical Engineering, starting in 2004. The
research work comprised of the drilling of boreholes and sampling in Kopundole, Kalimati,
Kirtipur and Pulchowk. Laboratory tests on disturbed and undisturbed samples collected
from the sites. These studies were aimed at studying the variation of the soil properties
with depth, and included the organic content, index properties, compressibility and strength
characteristics. Data from previous soil investigations on Kalo Mato in other sites
conducted by Central Material Testing Laboratory (CMTL) of IOE were incorporated in
the study.
________________________________________________________________________________ Majalah Ilmiah UKRIM Edisi 2/th XVI/2011 33
Drilling and description of Soil Samples
For the collection of samples in Kopundole, one borehole at the bank of Bagmati
River near the Bagmati Bridge was drilled to a depth of 10 m. Drilling in Kalimati was
part of a soil investigation for the construction of Head Office Building of Civil Saving and
Credit Cooperative Ltd. in Soaltee Mod. Three boreholes up to 30 m depth each were
drilled for the soil investigation project but samples from only one borehole were used for
the research. Samples from Kirtipur were collected from a borehole drilled to 10 m depth
in conjunction with soil investigation work for the construction of building belonging to the
Central Department of Rural Development, Tribhuvan University. Those from Pulchowk
were obtained from three boreholes drilled in the Engineering Campus to depth of 15 m. In
Kopundole, Kalimati and Pulchowk drilling was performed by a mechanical auger using a
truck-mounted drilling machine while in Kirtipur percussion drilling was done with Dando
drilling machine.
Disturbed samples were collected at depth intervals of 1.5 m while the undisturbed
samples were collected from intervals of about 1 m in Kopundole, 1,5 m in Kirtipur and 3
m in Kalimati. Disturbed samples were wrapped in thick plastic bags while the
undisturbed samples were collected using tube having 106 mm internal diameter and 460
mm length. All sampling tubes were properly kept in the laboratory to prevent loss of
moisture during the entire research period.
Testing Program
Samples taken from the different depths were tested to determine the organic
content, index properties, compressibility and strength. The organic content was
determined using loss on ignition method following the procedure described by ASTM D-
2974. The samples were first oven dried at 105o
C for 24 hours, then after transferred to a
muffle furnace after weighing. The furnace temperature was increased gradually until 440o
C where it was left constant for 24 hours. The weight of the organic matter is the
difference between the oven dried weight and the final weight after heating in the muffle

________________________________________________________________________________ Majalah Ilmiah UKRIM Edisi 2/th XVI/2011 34
furnace. The organic content is the ratio of the weight of organic matter and that of the dry
soil, expressed in percentage.
General Nature of the Soil
The soil profiles obtained from the test results from Kopundole, Kalimati, Kirtipur
and Pulchowk are presented in Figs.1 to 4, respectively. In all the sites the presence of
„Kalo Mato‟ was noticeable by the dark grey to black colour of the soil. In Kopundole,
Kalimati and Kirtipur, Kalo Mato was found between 2 m depth till the final depths of the
boreholes, while in Pulchowk it existed from 6 m depth till the end of the borehole at 10 m.
The organic content in all the sites combined were between 4% and 13%, with the lowest
range found in Kirtipur while the highest in Kopundole. The soils roughly fell in “Medium
Organic Soil” category designated by the Swedish Geotechnical Classification System for
organic content between 6% and 20% (Karlsson and Hansbo, 1981). NAVAC DM 7.01
(1981) classified soils with organic content between 5% and 30% as “Organic Soil”. Table
1 shows the range of soil properties of Kalo Mato obtained from the four sites. The values
of the Liquid Limit and Plasticity Index were taken from samples tested at natural
condition, i.e., without oven drying. The values revealed the typical characteristics of
organic soils in comparison to those of inorganic soils, namely low specific gravity and
density, high water content, liquid limit, void ratio and compression index.
Table 1. Soil Properties of Kalo Mato from the Four Study Areas
Soil Properties Kopundole Kirtipur Kalimati Pulchowk
Organic content,% 8.3 - 13.1 4.4 - 8.8 6.0 - 12.1 7.5 – 11.5
Specific gravity 2.29 - 2.33 2.38 - 2.55 2.41 - 2.60 2.25 – 2.45
Water content, % 95 – 145 80 - 107 40 - 89 81 – 115
Liquid limit, % 98 – 130 60 - 81 70 - 125 95 – 140
Plasticity Index, % 33 – 50 30 - 39 25 - 64 40 – 49
Bulk density, g/cm3 1.30 - 1.50 1.40 - 1.50 1.42 - 1.60 1.45 - 1.52
Dry density, g/cm3 0.50 - 1.0 0.70- 0.85 0.80 - 0.95 0.67 - 0.78
Void ratio 2.5 - 2.7 2.0 - 2.6 1.0 - 2.3 2.5 - 2.8
Compression index 1.05 – 1.20 0.86 - 1.23 0.49 -1.20 1.08 - 1.30

________________________________________________________________________________ Majalah Ilmiah UKRIM Edisi 2/th XVI/2011 35
Fig. 1 Soil Profile from the Drilling Site at Kopundole

________________________________________________________________________________ Majalah Ilmiah UKRIM Edisi 2/th XVI/2011 36
Fig. 2 Soil Profile from Drilling Site at Pulchowk
________________________________________________________________________________ Majalah Ilmiah UKRIM Edisi 2/th XVI/2011 37
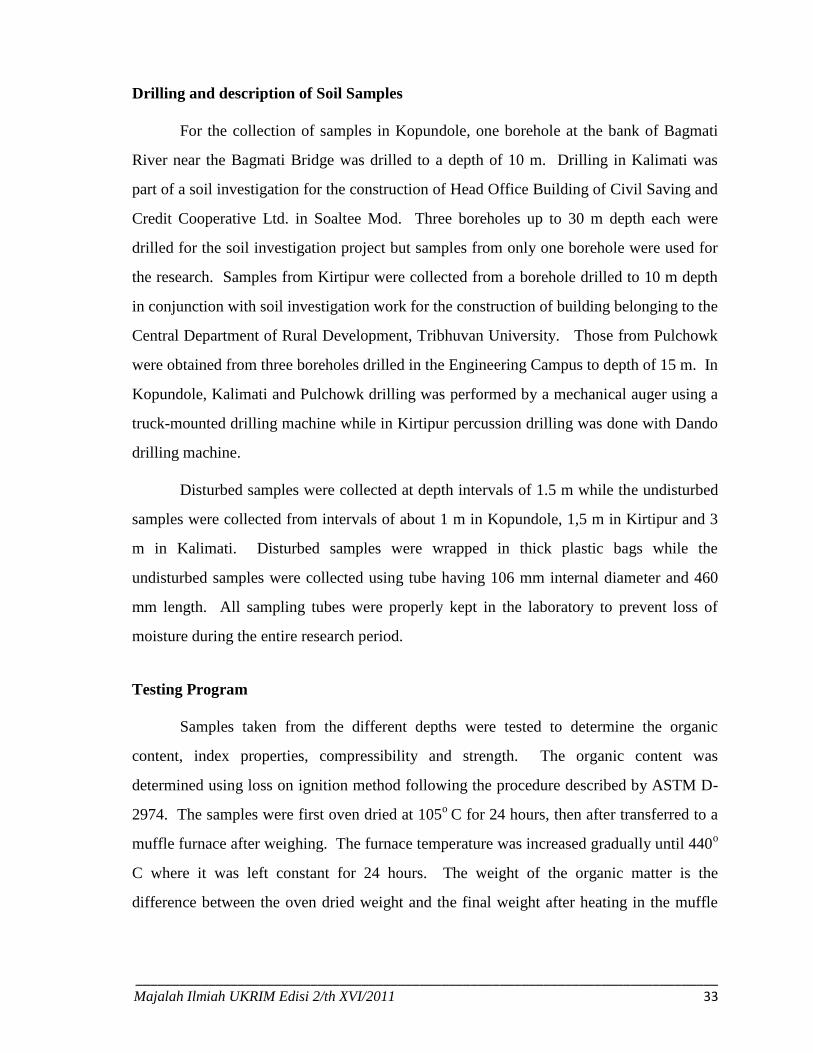
Fig. 3 Soil Profile from Drilling Site at Kalimati
________________________________________________________________________________ Majalah Ilmiah UKRIM Edisi 2/th XVI/2011 38
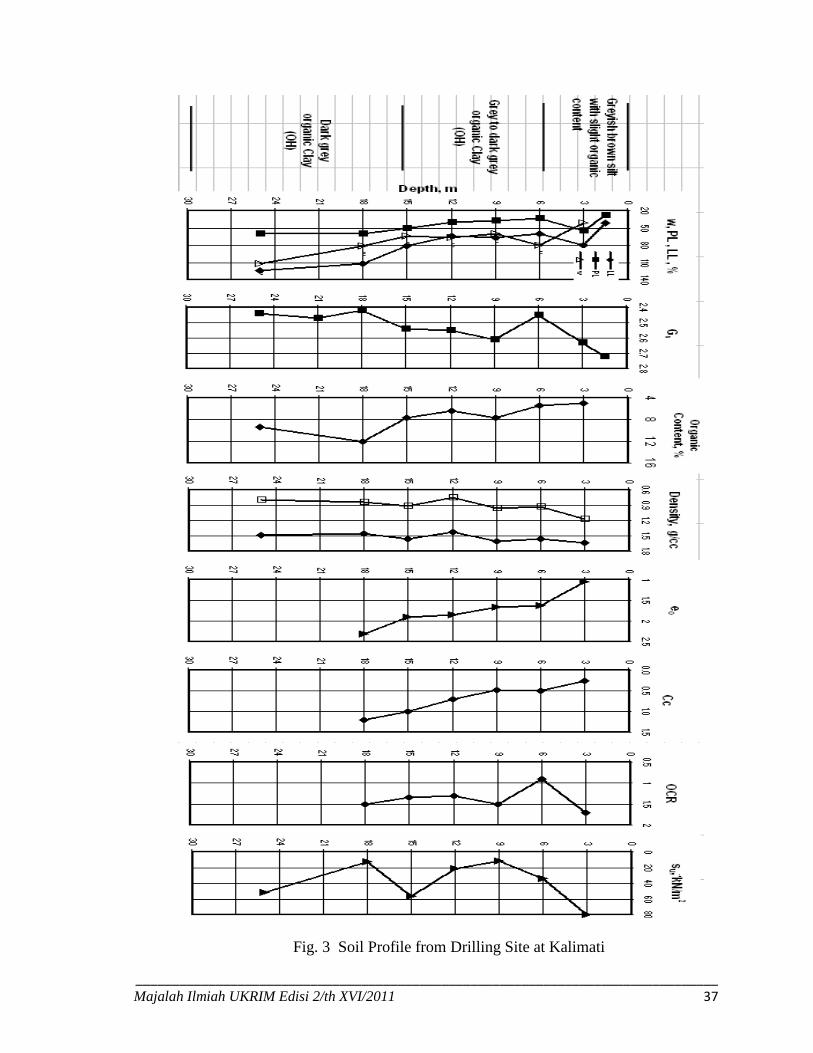
Fig. 4 Soil Profile from Drilling Site at Kirtipur
Figures 1 to 4 reveal that in the four drilling sites the organic content generally
increased with depth. Such pattern has been also been reported in some drilling sites in
Sweden though in other parts of the country the opposite pattern has been observed
(Larsson, 1990). The figures show more or less similar pattern on how the soil properties
varied with depth. Specific gravity, bulk density and dry density generally decreased with
depth while water content, Atterberg limits, in-situ void ratio and compression index
increased with depth. These patterns seemed to be related to the increase of the amount of
organic content with depth, which led to the conclusion that increasing organic content in
________________________________________________________________________________ Majalah Ilmiah UKRIM Edisi 2/th XVI/2011 39
0
0.5
1
1.5
2
2.5
3
0.1 1.0 10.0 100.0 1000.0
v, kN/m2
e
2.5m
3.5m
5.5m
8.5m
10.5m
0.00
0.50
1.00
1.50
2.00
2.50
3.00
1.0 10.0 100.0 1000.0
σv, kN/m2
e
3m
6m
9m
12m
15m
18m
0.00
0.50
1.00
1.50
2.00
2.50
3.00
0.1 1.0 10.0 100.0 1000.0
v, kN/m2
e
1.0 m
2.5 m
4.25 m
7.25 m
8.75 m
10.25 m
the soil caused decrease in specific gravity and density while at the same time it caused
increase in water content, Atterberg limits, void ratio and compression index. In an earlier
paper on Kalo Mato (Handali et all, 2007), it was shown that relationships between the
organic content and the soil properties were more or less linear.
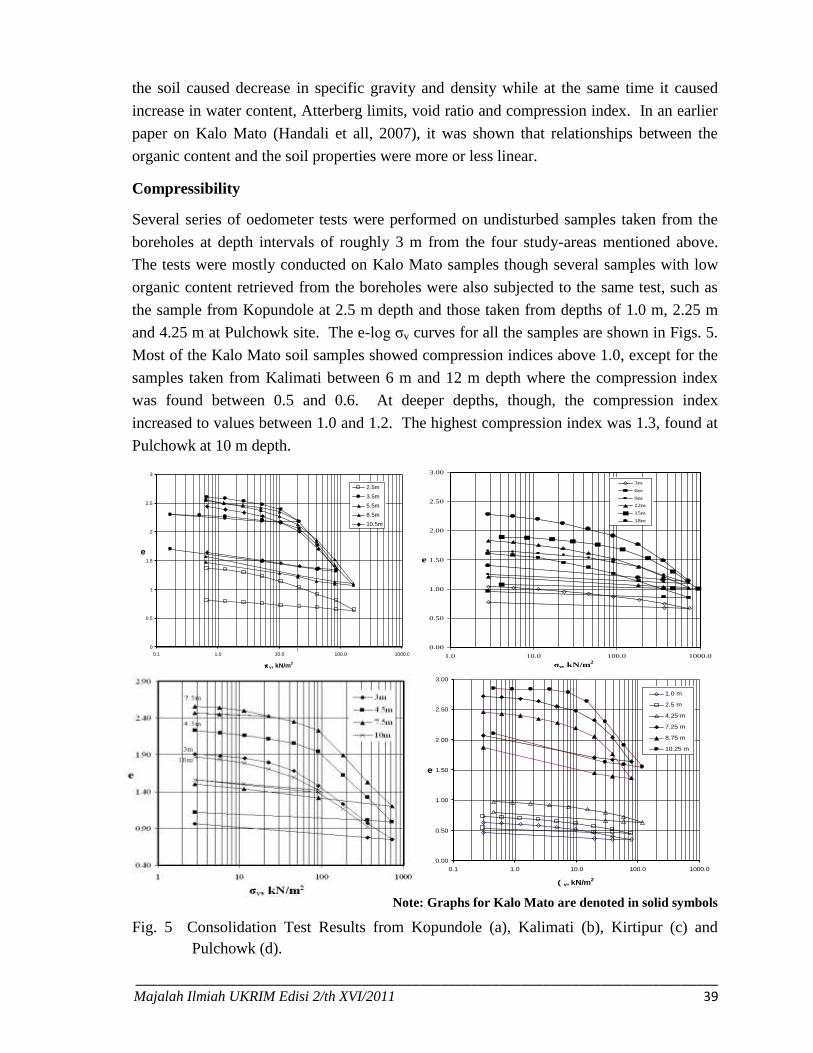
Compressibility
Several series of oedometer tests were performed on undisturbed samples taken from the
boreholes at depth intervals of roughly 3 m from the four study-areas mentioned above.
The tests were mostly conducted on Kalo Mato samples though several samples with low
organic content retrieved from the boreholes were also subjected to the same test, such as
the sample from Kopundole at 2.5 m depth and those taken from depths of 1.0 m, 2.25 m
and 4.25 m at Pulchowk site. The e-log σv curves for all the samples are shown in Figs. 5.
Most of the Kalo Mato soil samples showed compression indices above 1.0, except for the
samples taken from Kalimati between 6 m and 12 m depth where the compression index
was found between 0.5 and 0.6. At deeper depths, though, the compression index
increased to values between 1.0 and 1.2. The highest compression index was 1.3, found at
Pulchowk at 10 m depth.
Note: Graphs for Kalo Mato are denoted in solid symbols
Fig. 5 Consolidation Test Results from Kopundole (a), Kalimati (b), Kirtipur (c) and
Pulchowk (d).
________________________________________________________________________________ Majalah Ilmiah UKRIM Edisi 2/th XVI/2011 40
Long-term Settlement
Two undisturbed Kalomato samples were subjected to long-term loading to observe
their secondary compression characteristics from 1-D consolidation test. The sample was
taken from Kalimati at 6 m depth while another sample was from Kopundole at 10.5 m
depth. The dimension of the sample from Kalimati was 75 mm in diameter and 20.0 mm in
thickness, while the one from Kopundole was trimmed to 60 mm diameter and 18.80 mm
thickness. The sample from Kalimati was subjected to gradual increase of pressure from
zero to 180.42 kN/m2 at a load increment ratio of 2, and then brought to a final pressure of
360.95 kN/m2 after an interval of 48 hours. The sample from Kopundole was subjected to
the same fashion of loading up to 287.14 kN/m2 before it was subjected to the final load of
430 kN/m2. The final load was kept on the sample from Kalimati until day 163 while for
the Kopundole sample it was kept until day 194. The final pressures kept on the samples
were significantly higher than their maximum past pressures to ensure that compression
occurred in normally consolidated states. The samples were kept inundated with water at
all time.
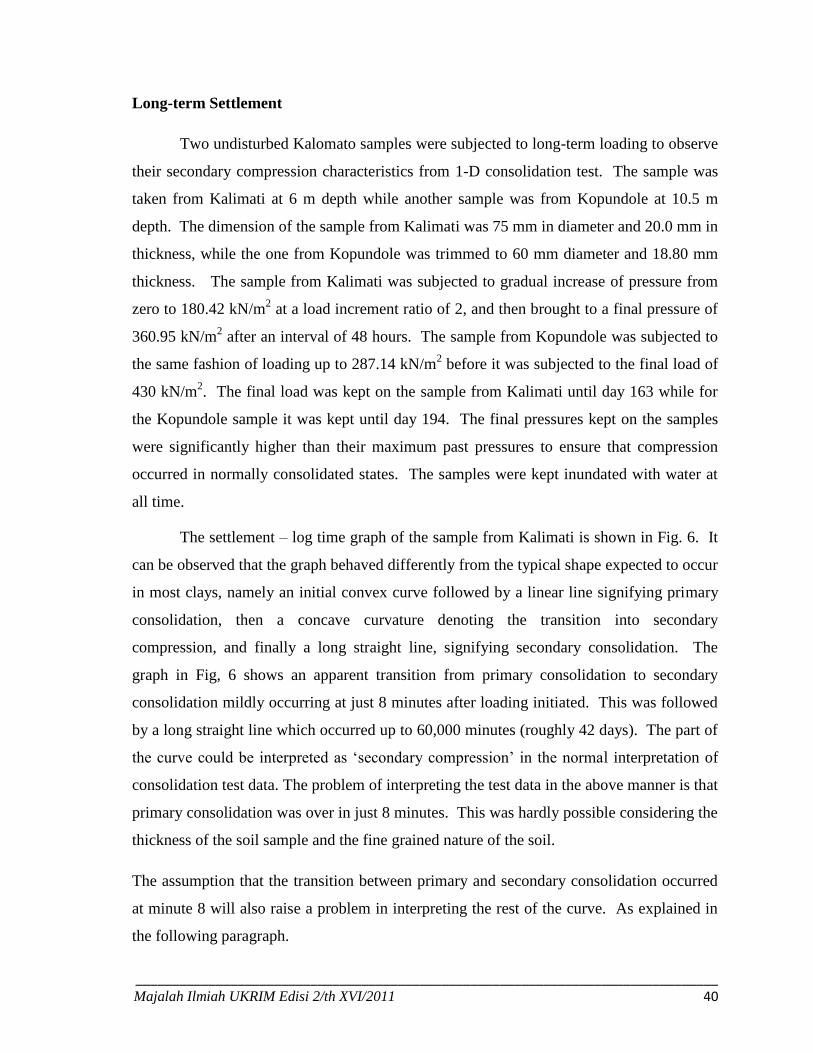
The settlement – log time graph of the sample from Kalimati is shown in Fig. 6. It
can be observed that the graph behaved differently from the typical shape expected to occur
in most clays, namely an initial convex curve followed by a linear line signifying primary
consolidation, then a concave curvature denoting the transition into secondary
compression, and finally a long straight line, signifying secondary consolidation. The
graph in Fig, 6 shows an apparent transition from primary consolidation to secondary
consolidation mildly occurring at just 8 minutes after loading initiated. This was followed
by a long straight line which occurred up to 60,000 minutes (roughly 42 days). The part of
the curve could be interpreted as „secondary compression‟ in the normal interpretation of
consolidation test data. The problem of interpreting the test data in the above manner is that
primary consolidation was over in just 8 minutes. This was hardly possible considering the
thickness of the soil sample and the fine grained nature of the soil.
The assumption that the transition between primary and secondary consolidation occurred
at minute 8 will also raise a problem in interpreting the rest of the curve. As explained in
the following paragraph.
________________________________________________________________________________ Majalah Ilmiah UKRIM Edisi 2/th XVI/2011 41
Fig. 6 Long-term Settlement Curve from Undisturbed Sample Taken from Kalimati
Drilling Site at 6 m Depth and A Possible Interpretation of Primary and Secondary
Consolidation Processes (Time in Log Scale)
________________________________________________________________________________ Majalah Ilmiah UKRIM Edisi 2/th XVI/2011 42
At minute 60,000 the linear line that was supposed to be the secondary compression
line turned downward to become another linear line with higher tangent than the earlier
part of the graph. If the earlier part of the graph was indeed that of secondary compression,
the line should continue with the same slope with the progress of time. This trend has been
an accepted fact led to the widely used formula of calculating secondary settlement with
respect to time, based on the slope of the secondary compression linear line in the
settlement-log time plot. Should the formula be used to calculate secondary settlement for
Kalo Mato using the slope of the „secondary compression line‟ in Fig. 6, the result would
be an underestimation of the real settlement. it will lead to an underestimation, because the
settlement which occurred between 60,000 and 235,000 minutes (day 163) would not be
included in the calculation. The fact that the curve turned downward at minute 60,000
meant that the linear portion before that should not be interpreted as the secondary
compression line. The same situation could be observed in Fig. 7 showing the long term
settlement of the sample from Kopundole.
The sample from Kopundole depicted a more or less linear relationship between the
first 10 and 20,000 minutes (day 14) duration of the test. Unlike the sample from Kalimati,
the sample from Kopundole did not display seemingly early transition from primary to
secondary consolidation. The curve continued on a straight line path at more or less the
same slope until minute 20,000 (day 83). Beyond that the settlement curve turned
downward into a steeper linear line up to minute 120,000 (day 83). This trend was similar
to that observed in the sample from Kalimati at minute 60,000. The linear curve in Fig. 7
was then followed by a milder straight line till the end of loading at around 280,000
minutes (day 194).
At a glance the curve appeared to resemble the normal settlement – log time curve with
minute 120,000 as the end of primary consolidation. The length of time for the sample to
reach that state, however, made it hard to conclude that the end of primary consolidation
occurred at that particular point. It appears that the conventional Casagrande method to
distinguish primary and secondary consolidations using settlement-log time plot may not
be the proper method for Kalo Mato. This also means that the determination of the
coefficient of consolidation should be determine using a different method.

________________________________________________________________________________ Majalah Ilmiah UKRIM Edisi 2/th XVI/2011 43
0
0.2
0.4
0.6
0.81
1.2
1.4
1.6
1.8
110
1001000
10000100000
1000000
Time (m
in.)
Settlement (mm)
120,000 minutes
20,000 minutes
Fig. 7 Long-term Settlement Curve from Undisturbed Sample Taken from
Kopundole Drilling Site at 10.5 m Depth. (Time in Log Scale)
________________________________________________________________________________ Majalah Ilmiah UKRIM Edisi 2/th XVI/2011 44
0
0.2
0.4
0.6
0.81
1.2
1.4
1.6
1.8
050,000
100,000150,000
200,000250,000
300,000
Time (m
in.)
Settlement
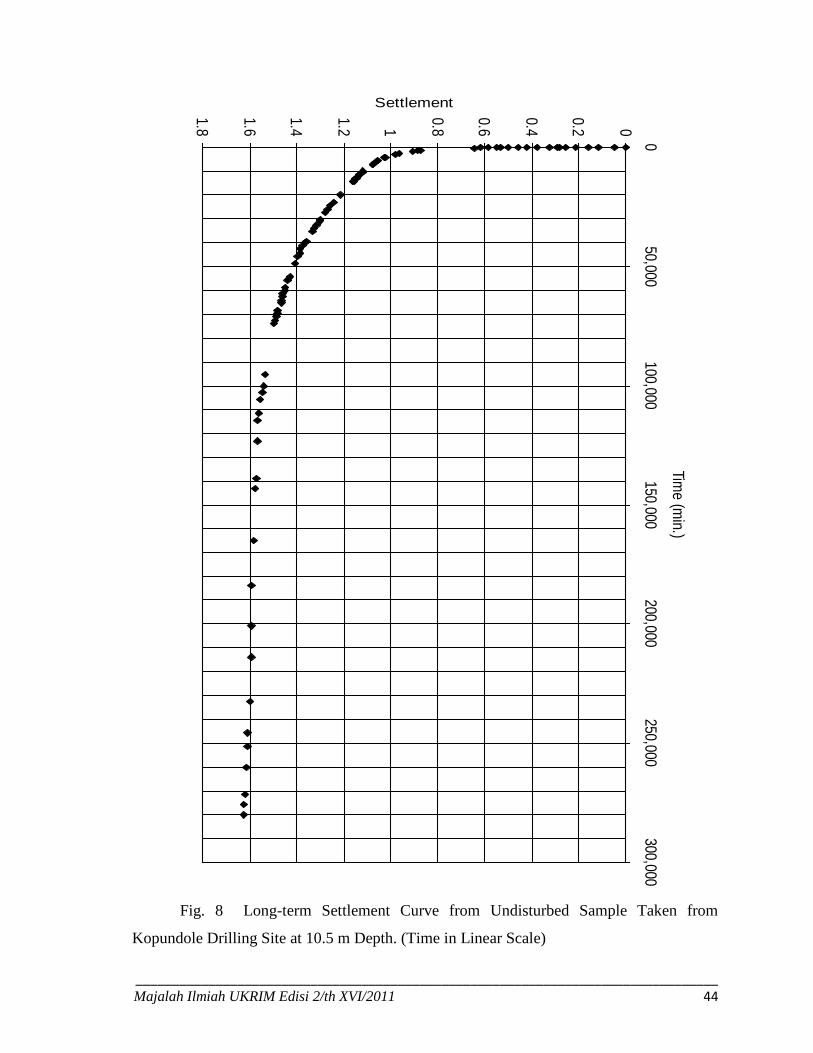
Fig. 8 Long-term Settlement Curve from Undisturbed Sample Taken from
Kopundole Drilling Site at 10.5 m Depth. (Time in Linear Scale)

________________________________________________________________________________ Majalah Ilmiah UKRIM Edisi 2/th XVI/2011 45
In Fig. 8 the same data as in Fig. 7 is presented with time plotted in linear scale. It
can be seen that the curve showed conventional shape similar to that seen in most soils, i.e.,
an initial steep linear curve and a final very mild more or less linear curve. The difference
in the shape of this curve was the very long transition between the first linear part and the
final part. The first linear part occurred between 0 to 1478 minutes (causing a settlement of
0.886 mm) could be considered to be the primary consolidation curve. The final part,
starting from minute 100,000, could be seen as the curve representing secondary
consolidation. It seemed that the method to determine the coefficient of consolidation
introduced by Taylor would be more suitable than Casagrade‟s method.
The long curvature joining these two portions of the graphs depicts the transition
between the two modes of consolidation. It can be observed that the transitional part of the
curve carried a much large share of the total settlement and spanned a significantly longer
period of time compared to those observed in inorganic soils, and could therefore not be
ignored as is often the case in treating consolidation data from inorganic soils. The
challenging task for Kalo Mato would therefore be to find the right method so that the
consolidation and settlement parameters of the soil could be determine with reasonable
accuracy.
References
Central Material Testing Laboratory (CMTL), Institute of Engineering, (2001), ”Final
Report on Soil Investigation for the Proposed University Grand Commision
Building, Tribhuvan University,” Sano Thimi, Bhaktapur,”(Unpublished Report)
Karlsson, R. And Hansbo, S. (1989), ”Soil Classification and Identification,” 1st Edition,
Stockholm, Swedish Counsil for Building Research
Katel, T.P., Upreti, B.N., and Pokhrel, G.S., (1996), “Engineering Properties of fine
grained soils of Kathmandu Valley, Nepal”, Journal of Nepal Geol. Soc. Vol.13,
PP.121-138.
Naval Facilities Engineering Command (1986), ”Soil Mechanics,” Design Manual 7.01,
Virginia