Introduction to Continuum Bio Mechanics (Synthesis Lectures on Bio Medical Engineering)


International Conference on Inter Disciplinary Research in
Engineering and Technology 2016
ICIDRET 2016


International Conference on Inter Disciplinary Research in
Engineering and Technology 2016
Volume 1
By
ASDF, Headquarters, India
Financially Sponsored By
Association of Scientists, Developers and Faculties, India
Multiple Areas
12-13, February 2016
DSIIDC, Govt. of NCT of Delhi, Connaught Circus
New Delhi, India, Asia
Editor-in-Chief Kokula Krishna Hari K
Editors:
Saikishore Elangovan, Daniel James, Rajkumar Sugumaran

Published by
Association of Scientists, Developers and Faculties Address: RMZ Millennia Business Park, Campus 4B, Phase II, 6
th Floor, No. 143, Dr. MGR Salai,
Kandanchavady, Perungudi, Chennai – 600 096, India.
Email: [email protected] || www.asdf.org.in
International Conference on Inter Disciplinary Research in Engineering and
Technology (ICIDRET 2016)
VOLUME 1
Editor-in-Chief: Kokula Krishna Hari K
Editors: Saikishore Elangovan, Daniel James, Rajkumar Sugumaran
Copyright © 2016 ICIDRET 2016 Organizers. All rights Reserved
This book, or parts thereof, may not be reproduced in any form or by any means, electronic or mechanical, including
photocopying, recording or any information storage and retrieval system now known or to be invented, without
written permission from the ICIDRET 2016 Organizers or the Publisher.
Disclaimer:
No responsibility is assumed by the ICIDRET 2016 Organizers/Publisher for any injury and/ or damage to persons
or property as a matter of products liability, negligence or otherwise, or from any use or operation of any methods,
products or ideas contained in the material herein. Contents, used in the papers and how it is submitted and approved
by the contributors after changes in the formatting. Whilst every attempt made to ensure that all aspects of the paper
are uniform in style, the ICIDRET 2016 Organizers, Publisher or the Editor(s) will not be responsible whatsoever
for the accuracy, correctness or representation of any statements or documents presented in the papers.
ISBN-13: 978-81-929866-0-9
ISBN-10: 81-929866-0-8

PREFACE
Welcome to the International Conference on Inter Disciplinary Research in Engineering and
Technology (ICIDRET) 2016 in DSIIDC, Government of NCT, New Delhi, India, Asia on 12 –
13 February, 2016. If this is your first time to New Delhi, you need to look on more objects
which you could never forget in your lifetime. There is much to see and experience at The
National Capital of Republic of India.
The concept of Inter Disciplinary research was a topic of focus by various departments across the
Engineering and Technology area. Flushing with major areas, this ICIDRET ’16 has addressed
the E&T areas like Mechanical Engineering, Civil Engineering, Electrical Engineering, Bio-
Technology, Bio-Engineering, Bio-Medical, Computer Science, Electronics & Communication
Engineering, Management and Textile Engineering. This focus has brought a new insight on the
learning methodologies and the terminology of accepting the cross definition of engineering and
the research into it.
We invite you to join us in this inspiring conversation. I am pretty sure that this conference
would indulge the information from the various parts of the world and could coin as a global
research gathering.
With more and more researchers coming into ICIDRET, this event would be as an annual event.
This conference is sure that, this edition and the future edition will serve as a wise platform for
the people to come with better research methodologies integrating each and every social
component globally. If there would have been a thought of not integrating the RJ45 and few
pieces of metal / plastic along with a PCB, today we could haven’t used the telephones and
mobile phones. With an ear-mark inspiration and constant support from the Global President Dr.
S. Prithiv Rajan, ASDF International President Dr. P. Anbuoli, this publication stands in front of
your eyes, without them this would haven’t been possible in a very shortest span.
Finally, I thank my family, friends, students and colleagues for their constant encouragement and
support for making this type of conference.
-- Kokula Krishna Hari K
Editor-in-Chief
www.kokulakrishnaharik.in

TECHNICAL REVIEWERS
• A Amsavalli, Paavai Engineering College, Namakkal, India
• A Ayyasamy, Annamalai University, Chidambaram, India
• A C Shagar, Sethu Institute of Technology, India
• A Kavitha, Chettinad College of Engineering & Technology, Karur, India
• A Padma, Madurai Institute of Engineering and Technology, Madurai, India
• A S N Chakravarthy, JNTU Kakinada, India
• A Tamilarasi, Kongu Engineering College, Perundurai, India
• Abdelbasset Brahim, University of Granada, Spain
• Abdelnaser Omran, Universiti Utara Malaysia, Malaysia
• Abdul Aziz Hussin, Universiti Sains Malaysia, Malaysia
• Abdul Nawfar Bin Sadagatullah, Universiti Sains Malaysia, Malaysia
• Abhay Prabhakar Kulkarni, Director - IICMR, Pune
• Abhishek Bajpai, SRM University, Lucknow, India
• Abhishek Shukla, U.P.T.U. Lucknow, India
• Aede Hatib Musta'amal, Universiti Teknologi Malaysia, Malaysia
• Ahmed Mohammed Kamaruddeen, Universiti Utara Malaysia, Malaysia
• Ahmed Salem, Old Dominion University, United States of America
• Ali Berkol, Baskent University & Space and Defence Technologies (SDT), Turkey
• Alphin M S, SSN College of Engineering, Chennai, India
• Alwardoss Velayutham Raviprakash, Pondicherry Engineering College, Pondicherry,
India
• Anand Nayyar, KCL Institute of Management and Technology, Punjab
• Anbuchezhiyan M, Valliammai Engineering College, Chennai, India
• Ang Miin Huey, Universiti Sains Malaysia, Malaysia
• Anirban Mitra, VITAM Berhampur, Odisha, India
• Ariffin Abdul Mutalib, Universiti Utara Malaysia, Malaysia
• Arniza Ghazali, Universiti Sains Malaysia, Malaysia
• Arumugam Raman, Universiti Utara Malaysia, Malaysia
• Aruna Anil Deoskar, IICMR, Pune, India
• Asha Ambhaikar, Rungta College of Engineering & Technology, Bhilai, India
• Ashish Chaurasia, RGPV, Bhopal, Madhya Pradesh
• Asrulnizam Bin Abd Manaf, Universiti Sains Malaysia, Malaysia

• Ata Elahi, Southern Connecticut State University, USA
• Aziah Daud, Universiti Sains Malaysia, Malaysia
• B Paramasivan, National College of Engineering, Tirunelveli, India
• Badruddin A. Rahman, Universiti Utara Malaysia, Malaysia
• Balachandran Ruthramurthy, Multimedia University, Malaysia
• Balasubramanie Palanisamy, Professor & Head, Kongu Engineering College, India
• Brahim Abdelbasset, University of Granada, Spain
• C Poongodi, Bannari Amman Institute of Technology, Sathyamangalam, India
• Chandrasekaran Subramaniam, Professor & Dean, Anna University, India
• Chitra Krishnan, VIT University, Chennai, India
• Chokri Ben Amar, University of Sfax, Tunisia
• Choo Ling Suan, Universiti Utara Malaysia, Malaysia
• Cristian-Gyozo Haba, Technical University of Iasi, Romania
• D Deepa, Bannari Amman Institute of Technology, Sathyamangalam, India
• D Gracia Nirmala Rani, Thiagarajar College of Engineering, Madurai, Tamil Nadu
• D Sheela, Tagore Engineering College, Chennai, India
• Daniel James, Senior Researcher, United Kingdom
• David Rathnaraj Jebamani, Sri Ramakrishna Engineering College, India
• Deepali Sawai, Director - MCA, University of Pune ( Savitribai Phule Pune University ),
India
• Dewi Nasien, Universiti Teknologi Malaysia, Malaysia
• Doug Witten, Oakland University, Rochester, United States of America
• Dzati Athiar Ramli, Universiti Sains Malaysia, Malaysia
• E Bhaskaran, Government of Tamilnadu, Chennai, India
• Fadhilah Mat Yamin, Universiti Utara Malaysia, Malaysia
• G A Sathish Kumar, Sri Venkateswara College of Engineering, India
• G Arunkumar, Saveetha University, Chennai, India
• G Ganesan, Adikavi Nannaya University, India
• G Subbaraju, Shri Vishnu Engineering College for Women, India
• Ganesan Kanagaraj, Thiagarajar College of Engineering, Madurai, Tamil Nadu
• Geetha G, Jerusalem College of Engineering, Chennai, India
• Geetha V, Pondicherry Engineering College, Pondicherry, India
• Guobiao Yang, Tongji University, China
• Hanumantha Reddy T, RYM Engneering College, Bellary, India

• Hardeep Singh Saini, Indo Global College of Engineering, Mohali, Punjab
• Hareesh N Ramanathan, Toc H Institute of Science and Technology, India
• Hari Mohan Pandey, Amity University, Noida, India
• Helena Karsten, Abo Akademi University, Finland
• Hidayani Binti Jaafar, Universiti Malaysia Kelantan, Malaysia
• Itebeddine GHORBEL, INSERM, France
• J Baskaran, Adhiparasakthi Engineering College, Melmaruvathur, India
• J Karthikeyan, Anna University, Chennai, India
• J Sadhik Basha, International Maritime College, Oman
• Jebaraj S, Universiti Teknologi PETRONAS (UTP), Malaysia
• Jia Uddin, International Islamic University Chittagong, Bangladesh
• Jinnah Sheik Mohamed M, National College of Engineering, Tirunelveli, India
• John Augustine P, Sri Eshwar College of Engineering, Coimbatore, India
• Julie Juliewatty Mohamed, Universiti Malaysia Kelantan, Malaysia
• K Latha, Anna University, Chennai, India
• K Mohamed Bak, Ilahia School of Science and Technology, India
• K Nirmalkumar, Kongu Engineering College, Perundurai, India
• K P Kannan, Bannari Amman Institute of Technology, Sathyamangalam, India
• K Parmasivam, K S R College of Engineering, Thiruchengode, India
• K Senthilkumar, Erode Sengunthar Engineering College, Erode, India
• K Suriyan, Bharathiyar University, India
• K Thamizhmaran, Annamalai University, Chidambaram, India
• K Thiruppathi, Valliammai Engineering College, India
• K Vijayaraja, PB College of Engineering, Chennai, India
• Kamal Imran Mohd Sharif, Universiti Utara Malaysia, Malaysia
• Kannan G R, PSNA College of Engineering and Technology, Dindigul, India
• Kathiravan S, Kalaignar Karunanidhi Institute of Technology, Coimbatore, India
• Khairul Anuar Mohammad Shah, Universiti Sains Malaysia, Malaysia
• Khurram Saleem Alimgeer, COMSATS Institute of Information Technology, Islamabad
• Kokula Krishna Hari Kunasekaran, Chief Scientist, Techno Forum Research and
Development Center, India
• Konguvel Elango, Dhanalakshmi Srinivasan College of Engineering, Coimbatore
• Krishnan J, Annamalai University, Chidambaram, India
• Kumaratharan N, Sri Venkateswara College of Engineering, India

• L Ashok Kumar, PSG College of Technology, Coimbatore, India
• Laila Khedher, University of Granada, Spain
• Lakshmanan Thangavelu, SA College of Engineering, Chennai, India
• M Ayaz Ahmad, University of Tabuk, Saudi Arabia
• M Chandrasekaran, Government College of Engineering, Bargur, India
• M K Kavitha Devi, Thiagarajar College of Engineering, Madurai, Tamil Nadu
• M Karthikeyan, Knowledge Institute of Technology, India
• M Shanmugapriya, SSN College of Engineering, Chennai, India
• M Thangamani, Kongu Engineering College, India
• M Venkatachalam, RVS Technical Campus - Coimbatore, India
• M Vimalan, Thirumalai Engineering College, Kanchipuram, India
• Malathi R, Annamalai University, Chidambaram, India
• Mansoor Zoveidavianpoor, Universiti Teknologi Malaysia, Malaysia
• Manvender Kaur Chahal, Universiti Utara Malaysia, Malaysia
• Mariem Mahfoudh, MIPS, France
• Marinah Binti Othman, Universiti Sains Islam Malaysia, Malaysia
• Mathivannan Jaganathan, Universiti Utara Malaysia, Malaysia
• Md Haider Ali Biswas, Khulna University, Khulna, Bangladesh
• Md Nur Alam, Pabna university of Science & Technology, Bangladesh
• Mehdi Asadi, IAU (Islamic Azad University), Iran
• Mohamed Moussaoui, ENSA of Tangier Abdelmalek Essaadi University, Morrocco
• Mohamed Saber Mohamed Gad, National Research Center, Egypt
• Mohammad Ayaz Ahmad, University of Tabuk, Saudi Arabia
• Mohammed Ali Hussain, KL University, India
• Mohan Awasthy, Chhattisgarh Swami Vivekanand Technical University, Bhilai,
Chhattisgarh
• Mohd Hanim Osman, Universiti Teknologi Malaysia, Malaysia
• Mohd Hashim Siti Z, Universiti Teknologi Malaysia, Malaysia
• Mohd Helmy Abd Wahab, Universiti Tun Hussein Onn, Malaysia
• Mohd Murtadha Mohamad, Universiti Teknologi Malaysia, Malaysia
• Mohd Zulkifli Bin Mohd Yunus, Universiti Teknologi Malaysia, Malaysia
• Moniruzzaman Bhuiyan, University of Northumbria, United Kingdom
• Mora Veera Madhava Rao, Osmania University, India
• Muhammad Iqbal Ahmad, Universiti Malaysia Kelantan, Malaysia

• Muhammad Javed, Cornell University, United States of America
• Mukesh D Patil, Ramrao Adik Institute of Technology, India
• Mukesh Negi, TechMahindra Ltd, India
• N Karthikeyan, SNS College of Engineering, Coimbatore, India
• N Malmurugan, Mahendra Group of Institutions, India
• N Meenakshi Sundaram, PSG College of Technology, Coimbatore, India
• N Rajesh Jesudoss Hynes, Mepco Schlenk Engineering College, Sivakasi, Tamilnadu,
India
• N Senthilnathan, Kongu Engineering College, Perundurai, India
• N Shanthi, Nandha Engineering College, Erode, India
• N Suthanthira Vanitha, Knowledge Institute of Technology, India
• Nasrul Humaimi Mahmood, Universiti Teknologi Malaysia, Malaysia
• Nida Iqbal, Universiti Teknologi Malaysia, Malaysia
• Nithya Kalyani S, K S R College of Engineering, Thiruchengode, India
• Nor Muzlifah Mahyuddin, Universiti Sains Malaysia, Malaysia
• Norma Binti Alias, Universiti Teknologi Malaysia, Malaysia
• O L Shanmugasundaram, K S R College of Engineering, Thiruchengode, India
• P Dhanasekaran, Erode Sengunthar Engineering College, Erode, India
• P Ganesh Kumar, K. L. N. College of Information Technology, Madurai, India
• P Kumar, K S R College of Engineering, Thiruchengode, India
• P Ramasamy, Sri Balaji Chockalingam Engineering College, India
• P Raviraj, Kalaignar Karunanidhi Institute of Technology, Coimbatore, India
• P Sengottuvelan, Bannari Amman Institute of Technology, Sathyamangalam, India
• P Shunmuga Perumal, Anna University, Chennai, India
• P Sivakumar, K S R College of Engineering, Thiruchengode, India
• P Sudhakar, M Kumarasamy College of Engineering, Karur, India
• P Tamizhselvan, Bharathiyar University, India
• P Thamilarasu, Paavai Engineering College, Namakkal, India
• Pasupuleti Visweswara Rao, Universiti Malaysia Kelantan, Malaysia
• Pethuru Raj, IBM Research, India
• Qais Faryadi, USIM: Universiti Sains Islam Malaysia, Malaysia
• R Ashokan, Kongunadu College of Engineering and Technology, India
• R Dhanasekaran, Syed Ammal Engineering College, Ramanathapuram, India
• R Muthukumar, Shree Venkateshwara Hi-Tech Engineering College, India

• R Nallusamy, Principal, Nandha college of Technology, Erode, India
• R Ragupathy, Annamalai University, Chidambaram, India
• R Sudhakar, Dr. Mahalingam College of Engineering and Technology, India
• R Suguna, SKR Engineering College, Chennai, India
• R Sundareswaran, SSN College of Engineering, Chennai, India
• Radzi Ismail, Universiti Sains Malaysia, Malaysia
• Raghvendra Kumar, LNCT College, Jabalpur
• Rajesh Deshmukh, Shri Shankaracharya Institute of Professional Management and
Technology, Raipur
• Rathika P, V V College of Engineering, Tirunelveli, India
• Rathinam Maheswaran, Mepco Schlenk Engineering College, Sivakasi, Tamilnadu, India
• Ravindra W Gaikwad, Pravara Rural Engineering College, Loni
• Razauden Mohamed Zulkifli, Universiti Teknologi Malaysia, Malaysia
• Reza Gharoie Ahangar, University of North Texas, USA
• Roesnita Ismail, USIM: Universiti Sains Islam Malaysia, Malaysia
• Rohaizah Saad, Universiti Utara Malaysia, Malaysia
• Roselina Binti Sallehuddin, Universiti Teknologi Malaysia, Malaysia
• Ruba Soundar K, P. S. R. Engineering College, Sivakasi, India
• S Albert Alexander, Kongu Engineering College, Perundurai, India
• S Anand, V V College of Engineering, Tirunelveli, India
• S Appavu @ Balamurugan, K. L. N. College of Information Technology, Madurai, India
• S Balaji, Jain University, India
• S Balamuralitharan, SRM University, Chennai, India
• S Balamurugan, Kalaignar Karunanidhi Institute of Technology, Coimbatore, India
• S Geetha, VIT University, Chennai, India
• S Jaganathan, Dr. N. G. P. Institute of Technology, Coimbatore, India
• S Karthik, SNS College of Technology, India
• S Natarajan, Karpagam College of Engineering, Coimbatore, India
• S Nithyanandam, PRIST University, India
• S Poorani, Karpagam University, Coimbatore, India
• S Prakash, Nehru Colleges, Coimbatore, India
• S R Kumbhar, Rajarambapu Institute of Technology, India
• S Rajkumar, University College of Engineering Ariyalur, India
• S Ramesh, Vel Tech High Tech Dr.Rangarajan Dr.Sakunthala Engineering College, India

• S Selvaperumal, Syed Ammal Engineering College, Ramanathapuram, India
• S Selvi, Institute of Road and Transport Technology, India
• S Senthamarai Kannan, Kalasalingam University, India
• S Senthilkumar, Sri Shakthi Institute of Engineering and Technology, Coimbatore, India
• S Shahil Kirupavathy, Velammal Engineering College, Chennai, India
• S Vengataasalam, Kongu Engineering College, Perundurai, India
• Samuel Charles, Dhanalakshmi Srinivasan College of Engineering, Coimbatore, India
• Sangeetha R G, VIT University, Chennai, India
• Sanjay Singhal, Founder, Strategizers, India
• Sanjeevikumar Padmanaban, Ohm Technologies, India
• Saratha Sathasivam, Universiti Sains Malaysia, Malaysia
• Sarina Sulaiman, Universiti Teknologi Malaysia, Malaysia
• Sathish Kumar Nagarajan, Sri Ramakrishna Engineering College, Coimbatore, India
• Sathishbabu S, Annamalai University, Chidambaram, India
• Seddik Hassene, ENSIT, Tunisia
• Selvakumar Manickam, Universiti Sains Malaysia, Malaysia
• Shamshuritawati Sharif, Universiti Utara Malaysia, Malaysia
• Shankar S, Kongu Engineering College, Perundurai, India
• Shazida Jan Mohd Khan, Universiti Utara Malaysia, Malaysia
• Sheikh Abdul Rezan, Universiti Sains Malaysia, Malaysia
• Shilpa Bhalerao, Acropolis Institute of Technology and Research, Indore, India
• Singaravel G, K. S. R. College of Engineering, India
• Sivakumar Ramakrishnan, Universiti Sains Malaysia, Malaysia
• Smriti Agrawal, Chiatanya Bharathi Institute of Technology, Hyderabad
• Somasundaram Sankaralingam, Coimbatore Institute of Technology, India
• Sri Devi Ravana, University of Malaya, Malaysia
• Subash Chandra Bose Jeganathan, Professional Group of Institutions, India
• Subramaniam Ganesan, Oakland University, Rochester, United States of America
• Suganthi Appalasamy, Universiti Malaysia Kelantan, Malaysia
• Sundar Ganesh C S, PSG College of Technology, Coimbatore, India
• Sunil Chowdhary, Amity University, Noida, India
• Sunita Daniel, Amity University, Haryana
• Suresh Sagadevan, Indian Institute of Science, Bangalore, India
• Syed Sahal Nazli Alhady, Universiti Sains Malaysia, Malaysia

• T K P Rajagopal, Kathir College of Engineering, Coimbatore, India
• T Krishnakumar, Tagore Engineering College, Chennai, India
• T Ramayah, Universiti Sains Malaysia, Malaysia
• T Subbulakshmi, VIT University, Chennai, India
• T V P Sundararajan, Bannari Amman Institute of Technology, Sathyamangalam, India
• Tamilarasi Angamuthu, Kongu Engineering College, Perundurai, India
• Tom Kolan, IBM Research, Israel
• Uma N Dulhare, Muffkham Jah College of Engineering & Technology, Hyderabad, India
• Uvaraja V C, Bannari Amman Institute of Technology, Sathyamangalam, India
• V Akila, Pondicherry Engineering College, Pondicherry, India
• V C Sathish Gandhi, University College of Engineering Nagercoil, India
• V E Nethaji Mariappan, Sathyabama University, India
• V Mohanasundaram, Vivekanandha Institute of Engineering and Technology for Women,
India
• V Ramesh, Mahatma Gandhi Institute of Technology, Hyderabad
• V Sathish, Bannari Amman Institute of Technology, Sathyamangalam, India
• V Vijayakumari, Sri Krishna College of Technology, Coimbatore, India
• Vaiyapuri Govindasamy, Pondicherry Engineering College, Pondicherry, India
• Veera Jyothi Badnal, Osmania University, India
• Veeraswamy Ammisetty, St. Ann's College of Engineering & Technology, India
• Venkatesh MP, Annamalai University, Chidambaram, India
• Vijayalakshmi V, Pondicherry Engineering College, Pondicherry, India
• Vijayan Gurumurthy Iyer, Entrepreneurship Development Institute of India
• Vikrant Bhateja, Shri Ramswaroop Memorial Group of Professional Colleges
(SRMGPC), India
• Wan Hussain Wan Ishak, Universiti Utara Malaysia, Malaysia
• Wei Ping Loh, Universiti Sains Malaysia, Malaysia
• Yaty Sulaiman, Universiti Utara Malaysia, Malaysia
• Yerra Rama Mohana Rao, Dr. Pauls Engineering College, India
• Yongan Tang, Oakland University, Rochester, United States of America
• Yousef FARHAOUI, Moulay Ismail University, Morrocco
• Yudi Fernando, Universiti Sains Malaysia, Malaysia
• Yu-N Cheah, Universiti Sains Malaysia, Malaysia
• Zahurin Samad, Universiti Sains Malaysia, Malaysia

• Zailan Siri, University of Malaya, Malaysia
• Zainuddin Bin Zakaria, Universiti Teknologi MARA, Dungun Campus, Terengganu
• Zamira Zamzuri, Universiti Kebangsaan Malaysia, Malaysia
• Zul Ariff Abdul Latiff, Universiti Malaysia Kelantan, Malaysia

Table of Content
Volume 01 ISBN 978-81-929866-0-9 Month February Year 2016
International Conference on Inter Disciplinary Research in Engineering and Technology
2016
Title & Authors Pages
Novel Applications of Silk Nonwovens in Living Enclosures by S Nivedita, P K Mishra
pp01 - pp04
Why will Basel III fail? by Petr Teply, Libena Cernohorska
pp05 - pp08
Application of Reverse Engineering and CAD/CAM in Field of Prosthetics-A Make in India Concept by Divya Singh, Richa Pandey
pp09 - pp13
AI Gone Wild or Maybe Not by Brock Kilbourne, Samantha Kilbourne, Wade Harned
pp14 - pp20
Financial Planning for Small-Scale Herbal Industries based on National Mission on Medicinal Plant scheme: A Case Study by Rahi Jain, Bakul Rao
pp21 - pp25
Causal-loop and SWOT analysis of Indian Herbal Industry by Rahi Jain, Bakul Rao
pp26 - pp30
Physical and Morphological Properties of Thermoset Composites Reinforced with Jute Preforms by Neha Sah, Alka Goel, Arun Kumar Chaudhary
pp31 - pp36
Diabetic Retinopathy Image Enhancement using Vessel Extraction in Retinal Fundus Images by programming in Raspberry Pi Controller Board by Ranaditya Haldar, Srinivasan Aruchamy, Anjali Chatterjee, Partha Bhattacharjee
pp37 - pp42

Dyeing of Silk with Rosa Centifolia: An Eco-Friendly Approach by Manpreet Kalsy, Sangita Srivastava
pp43 - pp46
A Survey to Augment Energy Efficiency of Mobile Devices in Cloud Environment by Nancy Arya, S Taruna
pp47 - pp50
Opto-Electronic Applications of Advanced Electronic Materials: InSe System by Manish Dev Sharma, Jashangeet Kaur, Ankush, Kanika, Navdeep Goyal
pp51 - pp54
Functional Clothing for Renal Failure Patients by Monisha Singh, Sangita Srivastava
pp55 - pp58
Essential Oil Impregnation on Wool Fabric for Aromatherapy by Shivani Srivastava, Sangita Srivastava
pp59 - pp62
Silk Dyeing with Natural Dye Extracted from Spice by Renu Singh, Sangita Srivastava
pp63 - pp67
Review on Application of Augmented Reality in Civil Engineering by Siddhant Agarwal
pp68 - pp71
Possibility of LENR Occurring in Electric Arc-Plasma: Preliminary Investigation of Anomalous Heat Generation during Underwater Arcing using Carbon Electrodes by Mragank Sharma, Kriti Rastogi, M Faisal Jamal Khan, Aishwarya Bajpai
pp72 - pp75
Heavy metals remediation in stale foundry effluent with Activated Charcoal-250 by Samson Ojoawo, Rajan Kumar, Vashisth Kumar, Prasadh Hallur, Vikash H V
pp76 - pp82
Automatic AU intensity detection/estimation for Facial Expression Analysis: A Review by Neeru Rathee, Nishtha
pp83 - pp88
Dynamic Analysis of Multi-storey RCC Building Frames by Akil Ahmed
pp89 - pp94
Background Study of Base Isolated Structure and Analysis of Base Isolated Frame by Akil Ahmed
pp95 - pp100

System Identification of a Beam Using Frequency Response Analysis by Akil Ahmed
pp101 - pp105
Seismic Analysis of Irregular Buildings by Akil Ahmed
pp106 - pp111
Optimize Virtual Machine Placement in Banker Algorithm for Energy Efficient Cloud Computing by Kokula Krishna Hari Kunasekaran, Vignesh Ramakrishnan, Rajkumar Sugumaran, Prithiv Rajan S
pp112 - pp119

International Conference on Inter Disciplinary Research in Engineering and Technology 1
Cite this article as: S Nivedita, P K Mishra. “Novel Applications of Silk Nonwovens in Living Enclosures”.
International Conference on Inter Disciplinary Research in Engineering and Technology (2016): 01-04.
Print.
International Conference on Inter Disciplinary Research in Engineering and Technology 2016 [ICIDRET 2016]
ISBN 978-81-929866-0-9 VOL 01 Website icidret.in eMail [email protected] Received 17-December-2015 Accepted 30-December-2015 Article ID ICIDRET001 eAID ICIDRET.2016.001
Novel Applications of Silk Nonwovens in Living Enclosures
S Nivedita1, P K Mishra1
1Central Sericultural Germplasm Resources Centre, India Abstract: The silkworm is one of Nature’s marvelous architects. It builds a safe and comfortable cocoon for itself while it transforms into pupa and then moth. The cocoon consists of silk proteins which of late have been found to have remarkable properties like UV protection, thermo tolerance, biocompatibility and biodegradability. This has inspired a large number of applied researches on silk for biomedical and other technical applications. This paper discusses novel applications of waste silk nonwovens for creating luxurious living spaces for the comfort of man. Keywords: Silk Nonwovens, UV Protection, Thermo Tolerance.
INTRODUCTION
Silk, ‘the Queen of Textiles’ is a fibre extruded by the mature silkworm, Bombyx mori. The silk thread is indeed harder than steel. The silkworm spins the cocoon around itself as a protective covering while it transforms into pupa and then moth. The cocoon is hard and strong yet elastic and soft to allow movement inside the cocoon (1). It is pervious to air but not to rain water. Being hygroscopic, it regulates the temperature inside and protects the silkworm from harmful UV rays. Because of molecular structure, silk can absorb up to 35% of its own weight of moisture without feeling wet. Thus the cocoon can absorb the excretion of the silkworm. The silk threads in the cocoon dissolve when they come in contact with an enzyme (cocoonase) ejected by the moth when it is ready to emerge. Silk is difficult to ignite, burns slowly and self-extinguishes when the source of the flame is removed. All these are ideal properties for safe and healthy growth of the silkworm. Thus, the silkworm is one of Nature’s marvellous architects, and an inspiration for harnessing the advantages of silk and creating luxurious spaces for the comfort of man.
Figure 1. Silk waste
The silk intertwined in the cocoon consists of two proteins, the filamentous fibroin, bonded by gummy sericin (2). Silk thread is unwound from the cocoon by reeling process and used for making silk yarns and fabrics. The lustrous silk in textiles is usually only the fibroin protein. Sericin is removed during refinement and discharged into the drain along with the chemicals used for its extraction. However, about 25 to 35% of silk in a cocoon cannot be reeled into raw silk yarn and is segregated as silk waste. Silk waste (Fig. 1) consists of unreelable parts of a cocoon, end-missing cocoons, rejected / defective cocoons, etc. (3)
This paper is prepared exclusively for International Conference on Inter Disciplinary Research in Engineering and Technology 2016 [ICIDRET] which is published by ASDF International, Registered in London, United Kingdom. Permission to make digital or hard copies of part or all of this work for personal or classroom use is granted without fee provided that copies are not made or distributed for profit or commercial advantage, and that copies bear this notice and the full citation on the first page. Copyrights for third-party components of this work must be honoured. For all other uses, contact the owner/author(s). Copyright Holder can be reached at [email protected] for distribution.
2016 © Reserved by ASDF.international

International Conference on Inter Disciplinary Research in Engineering and Technology 2
Cite this article as: S Nivedita, P K Mishra. “Novel Applications of Silk Nonwovens in Living Enclosures”.
International Conference on Inter Disciplinary Research in Engineering and Technology (2016): 01-04.
Print.
During 2014-15, India produced 28708 MT of raw silk (4) and waste silk is estimated at over 7000 MT. Silk waste is used for making spun, noil and floss silk. With the closure of larger spun silk mills, a huge quantity is exported without further processing (5). The option of using silk waste in making useful nonwovens has not been fully explored so far.
MAKING OF SILK WASTE NONWOVENS
Broadly, nonwovens are fibrous web structures in which the fibres are bonded together by mechanical entanglement, thermal fusing or chemical bonding. We have previously used silk waste and reclaimed sericin to make bio-inspired nonwovens, just like the silk cocoon. A web of boiled off silk waste was bound with reclaimed sericin to form silk nonwovens. The process is eco-friendly and simple and requires low investment. Being a handmade process, it generates employment opportunity, especially for women (5).
Traditionally, woven silk fabrics have been used for home furnishing limited to drapery, upholstery, bed spreads, cushion covers and quilts, besides silk carpets. The waste silk nonwovens offer innumerable application possibilities which are different from the traditional usage. In this paper, the nonwovens (Fig.2) have been used to make items of furniture/fixtures for interiors and construction. Thus, the possibility of employing silk waste in making nonwovens for application in an entirely new area has been demonstrated.
Figure 2. Nonwovens made from silk waste.
NOVEL APPLICATIONS FOR SILK WASTE NONWOVENS
Veneered panels for cubicles
Silk waste nonwovens were used to make panels for offices and homes. The nonwoven was passed through a pair of hot plates in a panel making machine over a plywood board which was sprayed with an adhesive. The silky nonwoven is exposed on the exterior, giving a luxurious look and texture. The silk fibres being smooth do not provide area for accumulation of dust (which tends to slip off its smooth surface). Besides, it can be conveniently cleaned using a vacuum cleaner. The panel shown in Fig.3 is made from undyed fibres. Different colours and designs are possible by varying the layout and colours of the nonwoven.
Melamine finished panels for table tops
As shown in Fig.4, the web of silk fibres in the nonwoven lends a curious design to the panel, besides making it appear luxurious. The panel is water proof and scratch proof and when used, require no maintenance. The panels were prepared by coating the nonwoven surface with a finish under high pressure conditions. They can be made in a variety of designs and colours.

International Conference on Inter Disciplinary Research in Engineering and Technology 3
Cite this article as: S Nivedita, P K Mishra. “Novel Applications of Silk Nonwovens in Living Enclosures”.
International Conference on Inter Disciplinary Research in Engineering and Technology (2016): 01-04.
Print.
Figure 3. Veneered Silk Panel Figure 4 Coated Panel
Window blinds
Window blinds are used to cover windows to reduce solar heat and light and keep the room cool. In winter, they need to reduce heat loss from the rooms. Silk nonwovens are the ideal materials for performing this function. Besides being shiny (reflective), they also have natural UV protection factor. The smooth fibres do not accumulate dust and can be cleaned conveniently. The handmade nonwovens have been used to make Venetian blinds and horizontal blinds which are under evaluation.
Lamp shades
The function of a lamp shade is to control and manipulate light output for visual comfort. Silk is a colourless translucent fibre with a triangular cross section. Each fibre acts as a tiny prism and scatters light, giving silk its unique characteristic lustre. It is ideally suited for making lamp shades. Silk nonwovens are not only aesthetic but also filter light effectively. They can be designed in either natural shades or dyed (silk has extraordinary ability to absorb dyes) and textured to enhance visual interest and allow light to shine through. One of the lampshades made from silk nonwovens is shown in Fig.5.
Figure 5. Silk Lampshade
Acoustic panels
There is a growing requirement of acoustic rooms in home theatres, offices, lecture rooms, auditoria, hospitals, factory halls, transportation terminals, etc. The acoustic properties of the silk cocoon are being investigated in order to explore their use in making eco-friendly acoustic panels.
Figure 6. Needle punched non-woven Figure 7. Moulded Silk Articles

International Conference on Inter Disciplinary Research in Engineering and Technology 4
Cite this article as: S Nivedita, P K Mishra. “Novel Applications of Silk Nonwovens in Living Enclosures”.
International Conference on Inter Disciplinary Research in Engineering and Technology (2016): 01-04.
Print.
Miscellaneous products
Silk waste has been converted into needle punched nonwoven with a cotton cloth backing for the first time, making it a completely natural and eco-friendly, as both the fibres are biodegradable (Fig.6). They have been dyed using natural dyes into beautiful shades. These mechanically bonded nonwovens are being used to develop bulletin boards, mouse pads, meditation mats, yoga mats, etc. The Fig.7 shows moulded products made from waste silk.
CONCLUSION
Silk waste in the form of nonwovens is ideally suitable to be modelled inside living enclosures and augment home textiles made of silk. The possibilities are innumerable and only a few are illustrated in this paper. Silk has most of the properties needed for this application like strength, elongation (flexibility), hygroscopicity, U.V protection, light transmission, etc. Its antimicrobial / flame retardant properties can be enhancing with suitable treatments. The idea of integrating these two disciplines, i.e. silk waste utilization and interior / construction needs to be explored further for maximum exploitation.
ACKNOWLEDGMENT
The authors wish to acknowledge the support of Ms. Shilpa Prints, Gavipuram, and Bengaluru for their assistance in wet processing.
REFERENCES
1) L. Rheinberg, “The romance of silk: A review of sericulture and the silk industry,” Textile Progress, vol. 21 (4), pp.1-43, 1991.
2) Yong-woo Lee, Silk Reeling and Testing Manual, Food and Agriculture Organization,1999. www.fao.org/docrep/x2099e/x2099e00
3) Sonwalkar, T.N., Handbook of Silk Technology, New Age International, New Delhi, 1nd edition, 1993.
4) Editorial, Indian Silk, vol 5-6 (12-2), 2015.
5) S. Nivedita and Kanika Trivedy, “Utilization of waste silk and reclaimed sericin for making paper like nonwovens” J. of IPPTA, in press.

International Conference on Inter Disciplinary Research in Engineering and Technology 5
Cite this article as: Petr Teply, Libena Cernohorska. “Why will Basel III fail?”. International Conference on
Inter Disciplinary Research in Engineering and Technology (2016): 05-08. Print.
International Conference on Inter Disciplinary Research in Engineering and Technology 2016 [ICIDRET 2016]
ISBN 978-81-929866-0-9 VOL 01 Website icidret.in eMail [email protected] Received 18-December-2015 Accepted 30-December-2015 Article ID ICIDRET002 eAID ICIDRET.2016.002
Why will Basel III fail?
Petr Teply1, Libena Cernohorska2 1Department of Banking and Insurance, Faculty of Finance and Accounting, University of Economics W. Churchill Square 4, Prague
2Institute of Economic Sciences, Faculty of Economics and Administration, University of Pardubice, Studentska 95, Pardubice Czech Republic
Abstract: This paper focuses on the evolution of global banking regulations set by the Basel Committee on Banking Supervision known as the Basel Accords. We argue that argue that both Basel I and Basel II have failed and we expect the same from Basel III. We believe Basel III will fail because of: i) path dependency on two previous failed accords, ii) delayed implementation, iii) strong pressure from bank-supported lobbyists and finally iv) strong influence of politicians. Rather than proposing new banking regulatory initiatives, we recommend imposing higher personal responsibility for bank managers, regulators and supervisors. As a result, Basel III will not prevent future crises from affecting the global banking industry. Keywords: bank, Basel III, regulation, supervision.
INTRODUCTION
This paper focuses on the evolution of global banking regulations set by the Basel Committee on Banking Supervision (BCBS). These key regulatory initiatives known as the Basel Accords encompass three main parts: Basel I, Basel II and Basel III. We argue that both Basel I and Basel II have failed and we expect the same from Basel III, a program of measures that will not prevent future crises from affecting the global banking industry. The paper continues as follows: in Section 2 we examine in more detail Basel I, and Basel II in Section 3 and Basel III in Section 4. Finally, Section 5 presents our conclusion and draws relevant lessons.
Basel I
As the world financial markets have become increasingly globalized in the last few decades, the international coordination of prudent regulations is needed. In 1988, the BCBS of central banks and banking regulators from the Group of Ten (G10) countries took the first significant step towards international regulation: It introduced global standards for regulating the capital adequacy of internationally active banks. This document is known as Basel I and its guiding principle was the idea that banks should have an adequate “capital cushion” to cover unexpected losses. The deadline for the implementation of Basel I rules were scheduled for the end of 1992. Furthermore, Basel I set out an 8% minimum requirement of capital to risk-weighted assets (RWA) for banks – known as capital adequacy (CAD) or the Cook ratio. However, Basel I only reflected credit risk. As time elapsed, further risks have been reflected in Basel I, such as market risk added in 1996, operational risk as part of Basel II and liquidity risk as part of Basel III (see below). The Basel I standards have achieved a wide degree of acceptance, extending beyond the member countries of the Basel Committee, and have thus acquired a scope that extends even beyond internationally active banks. At present, the Basel Accords are implemented in both domestic and international institutions in over 100 countries. Despite its many achievements, it became clear that Basel I required a radical updates due to accelerating financial innovations and the development of new risk management techniques. In response to criticisms of Basel I, a number of changes were made, culminating in the final document of the new capital accord, Basel II that was released in June 2006 and implemented in January 2007.
This paper is prepared exclusively for International Conference on Inter Disciplinary Research in Engineering and Technology 2016 [ICIDRET] which is published by ASDF International, Registered in London, United Kingdom. Permission to make digital or hard copies of part or all of this work for personal or classroom use is granted without fee provided that copies are not made or distributed for profit or commercial advantage, and that copies bear this notice and the full citation on the first page. Copyrights for third-party components of this work must be honoured. For all other uses, contact the owner/author(s). Copyright Holder can be reached at [email protected] for distribution.
2016 © Reserved by ASDF.international

International Conference on Inter Disciplinary Research in Engineering and Technology 6
Cite this article as: Petr Teply, Libena Cernohorska. “Why will Basel III fail?”. International Conference on
Inter Disciplinary Research in Engineering and Technology (2016): 05-08. Print.
Basel II Basel II focuses, among other things, on providing incentives for banks to enhance their risk measurement and management capabilities (i.e. both qualitative and quantitative requirements). By applying more risk-sensitive approaches, banks can make better and more efficient use of capital to cover their risks. Basel II differs from Basel I not only in the flexible options it gives banks for determining the capital requirements for the risks confronting them, but also in the inclusion of operational risk. Basel II allows each bank (usually with the consent of the regulator) to choose a method that is commensurate with its risk profile and capabilities. The more sophisticated and accurate measurement of credit risk under the new Basel II rules should result in capital savings. These will be used to cover the newly included operational risk so that the total capital charge should remain unchanged according to original BCBS estimates. In the past the BCBS has conducted five quantitative impact studies to assess whether the BCBS has met its goals with regard to the revised capital framework. According to the results of the last study published in June 2006 (so-called QIS 5), which included data from 350 banks in some 30 countries during 2005, an aggregate drop of 6.8% in minimum required capital for participating banks compared with existing capital requirements was expected. The overall objectives of Basel II The overall three main objectives of Basel II were the following (BCBS, 2011): i) to continue to promote the safety and soundness in the financial system and, as such, the new framework should at least maintain the current overall level of capital in the system; ii) to continue to enhance competitive equality; and iii) to provide a more comprehensive approach to addressing risks. Furthermore, Basel II seeks to achieve the following objectives, see [5], [3]or [8]: 1. It moves away from the “one-size-fits-all” approach characteristic of Basel I to a more “menu-like” approach. Banks may choose from various options to calculate its capital requirements for market, credit and operational risk. 2. It considers that lending to banks or corporations may be more or less risky than to the Organization for Economic Cooperation and Development (OECD) sovereigns (in terms of credit risk) that result in different risk-weights for these subjects. For instance, under a standard method in Basel I all corporations had a 100% risk-weight, while under Basel II the risk weight of corporations will vary from 0% to 150% based on the company’s credit rating. 3. It implemented operational risk into regulatory capital (capital requirements) respectively into the calculation of capital adequacy. 4. A bank could use its own internal rating models for the measurement of credit, market and operational risk, if a regulator approves the internal model used by the bank. Otherwise, banks have to adopt standardized approaches set by the BCBS. 5. Basel II closely links the regulatory capital requirements with the bank’s risk profile; regulatory capital should converge with the economic capital of a bank. 6. In addition to the old “risk” pillar, two new pillars, the “Supervisory Review Process” and “Transparency and Market Discipline” have been introduced. Criticism of Basel II Although Basel II includes many improvements when compared to Basel I, criticisms of Basel II still exist. We present here only the points we consider as the most important, and for more detailed criticisms see [7] or [2], [6]: 1. Tendency towards procyclicality; 2. Lack of the explicit implementation of other risks; 3. An excessive use of external ratings; 4. An excessive prescription of the document; 5. Difficult quantification of operational risk; 6. A high challenge for regulators. We argue that all three objectives of Basel II have failed, because:
i) Lower capital buffers of banks resulted in higher instability and fueled the global crisis that began in 2008 (e.g. Basel II lowered a risk weight for mortgages, which motivated banks to provide more mortgages thus significantly influencing the crisis; moreover, banks had no capital buffers against losses stemming from domestic government bonds, which caused problems for the banks in Spain and Greece in 2012).
ii) The regulation favored big international banks, i.e. de facto it lowered overall global competition (e.g. the market share of the TOP 10 global banks on TOP 1000 banks’ assets increased from 14% in 1999 to 19% in 2007 and later to 26% in 2009 respectively).
iii) Internal bank models with poor assumptions failed and did not capture the true risks of banks (e.g. an assumption on normal distributions of stock market returns in value-at-risk (VAR) models or an assumption of a sustainable long-term increase in real estate prices in the US and the UK).

International Conference on Inter Disciplinary Research in Engineering and Technology 7
Cite this article as: Petr Teply, Libena Cernohorska. “Why will Basel III fail?”. International Conference on
Inter Disciplinary Research in Engineering and Technology (2016): 05-08. Print.
BASEL III
The overall objectives of Basel III
As demonstrated above, all the main objectives of Basel II have failed and the revision of global banking rules was needed in light of the global financial crises beginning in 2008. As a result, [1] issued a comprehensive set of reform measures known as ‘Basel III’ in order to strengthen the regulation, supervision and risk management of the global banking sector. Three main objectives of Basel III, that modify objectives set both in Basel I and Basel II, are as follows: i) To improve the banking sector's ability to absorb shocks arising from financial and economic stress, whatever the source; ii) To improve risk management and governance; iii) To strengthen banks' transparency and disclosures.
Main components of Basel III
There are several new components of Basel III that can be grouped into three categories including: i) requirements for higher quality, constituency and transparency of banks’ capital and risk management; ii) introduction of new liquidity standards for internationally active banks and finally, iii) a focus on systemic risk and interconnectedness (including procyclicality and regulation of OTC markets) – see Fig. 1.
Bank capital under Basel III The first component of Basel III encompasses requirements for higher quality, constituency and transparency of banks´ capital and risk management. In terms of the CAD calculation, Basel III goes back to the Basel I basic formula while covering credit, market and operational risks included in all Basel I, Basel II, Basel II.5 and Basel III:
Figure 2. Main components of Basel III.
Note: CAD – capital adequacy, RWA – risk-weighted assets, Basel III CAP = Common Equity Tier 1 capital + Additional Tier 1 capital + Tier 2 capital + capital conservation buffer. Criticisms of Basel III Similar to previous Basel accords, Basel III was also originally proposed by the BIS with good intentions to change banks´ behavior (e.g. mandatory bail-in instruments instead of bail-outs by governments). These global rules are to be implemented into national legislation, which is out of control of the BIS, however. Put differently, every country can adjust its requirements based a particular situation in its domestic banking sector (e.g. reflecting the existence of zombie banks). Not surprisingly, some countries have pushed to increase capital and other ratios of their banks (e.g. Switzerland or the US) more than others (e.g. Japan or the European Union).
Credit risk Market risk Operational risk
Basel I Basel II.5 Basel II
Basel II Basel III
%5.10__
≥=
RWA
CAPIIIBaselCAD
Basel III
Capital reform
Liquidity standards Systemic risk and
interconnectedness
Quality, consistency and transparency of capital base
Short term: liquidity funding ratio
Capital incentives for using CCPs for OTC
Capturing of all risksLong term:
net stable funding ratio
Higher capital for systemic
derivatives
Controlling leverageHigher capital for
inter financial exposures
Buffers Contingent capital
Capital surcharge for
systemic banks

International Conference on Inter Disciplinary Research in Engineering and Technology 8
Cite this article as: Petr Teply, Libena Cernohorska. “Why will Basel III fail?”. International Conference on
Inter Disciplinary Research in Engineering and Technology (2016): 05-08. Print.
Another criticism of Basel III comes from, for instance, in the context of effective regulation as a mission impossible discussed by [6]. Additionally, [4] highlights a flawed institutional process of creating Basel rules. Last but not least, [8] argue that Basel III will not prevent global markets from future crises and lists the following reasons:
i) Path dependency on two previous failed accords Basel I and Basel II, ii) Delayed implementation, iii) Strong pressure from banks-supported lobbyists, iv) Strong influence of politicians (especially from G20 countries).
Conclusion
This paper focused on the evolution of global banking regulation set by the BCBS known as the Basel Accords. We argue that argue that both Basel I and Basel II have failed and we expect the same from Basel III, a program of measures that will not prevent the global banking industry from experiencing future crises. We believe Basel III will fail because i) path dependency on two previous failed accords Basel I and Basel II, ii) delayed implementation, iii) strong pressure from banks-supported lobbyists, and finally iv) strong influence of politicians. Rather than proposing new banking regulatory initiatives, we recommend imposing higher personal responsibility for bank managers, regulators and supervisors.
ACKNOWLEDGMENT
Financial support from The Czech Science Foundation (The Czech Science Foundation (projects under No. GA14-02108S, GA15-00036S and 16-21506S,), and University of Economics in Prague (project No. VŠE IP100040) is gratefully acknowledged.
REFERENCES
[1] BCBS, Basel III: A global regulatory framework for more resilient banks and banking systems. Basel Committee on Banking Supervision, 2011.
[2] M. Dewatripont et al., Balancing the Banks: Global Lessons from the Financial Crisis. Princeton University Press, 2010. [3] S. Heffernan, Modern Banking. 5th ed. Chichester: Wiley, 2005. [4] R. Lall, “From Failure to Failure: The Politics of International Banking Regulation,” in Review of International Political Economy,
vol. 19, 2012, pp. 609–638. [5] M. Mejstrik, The Cultivation of the Czech financial market. Prague: Karolinum Press, 2004. [6] M. Mejstrik, M. Pecena and P. Teply, Banking in theory and practice. Prague: Karolinum Press, 2014. [7] A. Saunders A. and M. M. Cornett, Financial Institutions Management. 5th ed. Berkshire: McGRAW-HILL/IRWIN, 2006. [8] B. Sutorova and P. Teply, “The Level of Capital and the Value of EU Banks under Basel III,” in Prague Economic Papers, vol. 23,
2014, pp. 143 – 161. [9] P. Teply, L. Cernohorska and K. Divis, “Implications of the New Basel Capital Accord for European Banks,” in E+M
Journal, vol. 10, 2007, pp. 58–64.

International Conference on Inter Disciplinary Research in Engineering and Technology 9
Cite this article as: Divya Singh, Richa Pandey. “Application of Reverse Engineering and CAD/CAM in Field
of Prosthetics-A Make in India Concept”. International Conference on Inter Disciplinary Research in
Engineering and Technology (2016): 09-13. Print.
International Conference on Inter Disciplinary Research in Engineering and Technology 2016 [ICIDRET 2016]
ISBN 978-81-929866-0-9 VOL 01 Website icidret.in eMail [email protected] Received 17-December-2015 Accepted 30-December-2015 Article ID ICIDRET003 eAID ICIDRET.2016.003
Application of Reverse Engineering and CAD/CAM in Field of Prosthetics-A Make in India Concept
Divya Singh1, Richa Pandey2
1,2Department of Mechanical Engineering, Birla Institute of Technology, Mesra, Ranchi Abstract: A prosthetic is a device that replaces any missing human body part visibly and functionally. Reverse engineering is a field of engineering wherein a model and further a prototype can be generated by extracting information from previous design or available model using the advanced tools of CAD/CAM. This paper aims at exploring the needs and advantages of connecting the prosthetic industry with reverse engineering in a developing country like India for patients with lower limb amputations under the brimming concept of “Make in India”. Keywords: reverse engineering, CAD/CAM, rapid prototyping, prosthetic sockets.
INTRODUCTION
An amputation can occur due to various reasons- disease, accident, tumor or infections. Lower limb amputations today are the most common type of amputations occurring worldwide, including developing countries like India. The lower limb amputations are also of two types- Trans tibial and Trans femoral. In either of the cases, a prosthetic device is required to restore functionality of the limb. Such prosthetics basically have three parts- the socket, pylon and the foot (fig.1).
Figure 1. A Trans tibial prosthetic limb
Here pylon and foot are the compensation for the residual limb. The socket forms the connection between the residual limb and the artificial limb. The interface between the socket and the residual limb is the most crucial area in terms of comfort to the patient since it bears all the weight of the patient and forces produced during gait. The shape of every residual limb is unique. Hence a customized socket is the need of the hour for patient satisfaction. Conventionally, sockets have been manufactured by technicians by following these steps (fig.2):
This paper is prepared exclusively for International Conference on Inter Disciplinary Research in Engineering and Technology 2016 [ICIDRET] which is published by ASDF International, Registered in London, United Kingdom. Permission to make digital or hard copies of part or all of this work for personal or classroom use is granted without fee provided that copies are not made or distributed for profit or commercial advantage, and that copies bear this notice and the full citation on the first page. Copyrights for third-party components of this work must be honoured. For all other uses, contact the owner/author(s). Copyright Holder can be reached at [email protected] for distribution.
2016 © Reserved by ASDF.international

International Conference on Inter Disciplinary Research in Engineering and Technology 10
Cite this article as: Divya Singh, Richa Pandey. “Application of Reverse Engineering and CAD/CAM in Field
of Prosthetics-A Make in India Concept”. International Conference on Inter Disciplinary Research in
Engineering and Technology (2016): 09-13. Print.
1. Negative mould preparation (fig 2.a) - This is done by wrapping POP bandages around the residual limb to capture the basic shape of the limb. Once dried, it is removed from the limb
2. Positive mould preparation (fig 2.b) - the negative mould is filled with POP and hardened. Then rectification of the positive mould is done at pressure sensitive and pressure tolerant areas. This is achieved by adding plaster at pressure sensitive areas and removing plaster at weight bearing or pressure tolerant areas.
3. Socket preparation (fig 2.c) - the positive mould is sealed in poly vinyl alcohol bags and filled with resins. Once this hardens, the positive mould is broken and the socket is obtained.
Figure 2.a. Taking negative mould of the residual limb by plaster wrapping.
Figure 2.b. positive mould by filling POP and socket rectification by adding and removing POP.
Figure 2.c. socket preparation by lamination and final trimming
After this the patient tries on the socket and gives feedback about the level of comfort and fit. If the patient feels discomfort, the above procedure has to be followed again and again until a satisfactory fit until comfort is experienced by the patient. As it is clear from above that the customizing of the socket is dependent on the technician to a large extent. So, skilled technician can reduce the number of iterations but not eradicate them. Also, this type of procedure causes mental stress to the patient who, already, goes through the trauma of loss of a limb. Even after this, perfect fit may not be obtained. Also physiologically, the shape of the residual limb changes over time and the old socket may not suffice anymore. In such a case again a new socket would be required. Here steps in the innovative thinking of applying reverse engineering (RE) powered with the tools of latest CAD/CAM advancements (fig.3). By the application of reverse engineering, the shape of the limb can be captured most accurately. It is important, though, to remember that a good socket is not the true copy of the residual limb but rectified appropriately at the pressure sensitive and pressure bearing areas. The shape of the captured limb can be transferred to a CAD platform and rectified accordingly and number of models can be created. Once rectification is achieved, a finite element analysis can be carried out on all the prospective socket designs to analyze the pressure distribution during gait. The best design can be selected. This can be transferred to a rapid prototyping machine and socket can be obtained in way lesser time and with better quality.

International Conference on Inter Disciplinary Research in Engineering and Technology 11
Cite this article as: Divya Singh, Richa Pandey. “Application of Reverse Engineering and CAD/CAM in Field
of Prosthetics-A Make in India Concept”. International Conference on Inter Disciplinary Research in
Engineering and Technology (2016): 09-13. Print.
Figure 3. Steps for application of RE, CAD/ (CAM or RP) in prosthetics
Literature review
Literature review suggests that a lot of work has already been done to link lower limb prosthetic industry with RE [2, 3, 8, 15]. Linking socket designing with RE and CAD/CAM allows the results from finite element analysis on all possible socket designs. This opens a gateway to obtaining a reference to shape and material library to choose socket material and design from [2, 3, 5]. Apart from this sockets can be manufactured by using different materials in the same socket according to the strength and properties required at different parts of the residual limb. Such sockets are called variable-impedance socket and they improve comfort to the patient. These sockets can be manufactured by reverse engineering since variable materials are used in manufacture of one socket [7]. The time taken to manufacture a socket is greatly reduced by using rapid prototyping and reverse engineering technologies. 3D printed sockets have come out to be more cost effective as well as comfortable. Since all measurements are taken through scanning techniques the fit is better than obtained by manual measurement [6]. Pressure distribution patterns can be obtained during gait of the patient by carrying out finite element analysis on the model [2, 3, 6, 7, 8]. Scanning techniques, if not available, can be replaced by other techniques for obtaining the limb measurements accurately. These are MRI and CT scan of the patient’s limb. These can be converted into 3D limb models by software like MIMICs [8]. Comparisons have been done between traditionally manufactured sockets and once obtained from 3D reconstruction of limb shape. It has been observed that some variations occur in obtaining the shape and measurement of the socket through manual and RE method. The RE methods are more accurate because human involvement is lesser [11, 12, 13].
Make in India concept
A thorough literature survey indicates that lot of stress is given in researches outside on application, advantages and exploitation of RE in field of prosthetics. Developing countries like India is still following the conventional approach to socket manufacturing. The progress using advanced techniques and combining medical field with CAD/CAM/RE has been slow. This being despite the humanitarian factor being involved here. The rehabilitation industry requires a make in India concept on a robust level to meet the ongoing world standards. The number of amputation patients in India is large and the number is increasing only. Also it is true that conventional methods of socket manufacturing do not comply to the patient specific parameters on a very successful level. Hence, there is an open field to apply RE and CAD/CAM techniques here. A lot of potential is definitely held by RE in field of prosthetics in India.
Method and Materials
For the success of application of RE in lower limb socket design in India, it is important to have the following
1. Equipment and software- A machine or method to capture the residual limb shape. As seen in literature, this can be done by using a 3D laser scanner, CMM or simply by segmenting the MRI and CT scan of the residual limb on certain software platforms like MIMICS. In proper formats like .stl this data is transferred to CAD software like CATIA, CREO to convert the scanned information of the residual limb into a solid model. Form here, the rectified model of the socket is transferred in format like .IGES to Finite element software as indicated by literature like ANSYS, ABAQUS and Altair Hypermesh. A rapid prototyping machine involving any of the processes like fused deposition melting (FDM); selective laser sintering (SLS), 3D printing and steleolithography can be employed to obtain a socket.

International Conference on Inter Disciplinary Research in Engineering and Technology 12
Cite this article as: Divya Singh, Richa Pandey. “Application of Reverse Engineering and CAD/CAM in Field
of Prosthetics-A Make in India Concept”. International Conference on Inter Disciplinary Research in
Engineering and Technology (2016): 09-13. Print.
2. Manpower – skilled manpower is a requisite to obtain successful results from the application of RE in field of lower limb prosthetics.
• Assistants fluent with the entire software platform.
• Collaboration with medical experts in field of orthopedics • CAD/CAM engineers.
3. Industry institute collaboration- This is one of the most important factors that can be employed in a developing country like India where the level of technical education is so high. Premier engineering institutes should provide training to the students in emerging fields of RE and collaborate with prosthetic industries to help revolutionize these industries by application of the skills of the students. There is a need to create awareness about the wide application of RE in the field of prosthetics to the students, researchers and prosthetists as well as its long term benefits to the prosthetic industry and the amputees in India.
Conclusion
India is one of the fastest growing developing countries in the world. The new national motive of “make in India” opens plethora of options to innumerable industries, prosthetics being one of them. It not only promises to explore new dimensions in field of engineering but medicine as well. It will definitely add a new horizon to the make in India concept at the global platform. Also its humanitarian aspect is no less important. The main advantage of applying RE in design and manufacture of prosthetics sockets is:
• The socket manufactured by RE will technically have better design and quality. • The process is computerized and digitized with lesser manual work.
Hence, it will be consistent and independent of technician skill. This lessens the chances of errors and iterations required to achieve the needed fit and design of the socket.
• Record of the residual limb and socket design can be maintained. As the shape of the residual limb changes over time, the shape library can be referred for comparison and modification. Ability to modify material and design of socket easily without going through all the tedious process of creating a mould all over again.
• RE based process is faster and a socket can be manufactured in way lesser time than conventional process.
• Easier to carry out rectification on pressure sensitive and pressure tolerant areas.
• Feasibility analysis- a lot of previous research have already shown that it will save time as well as money. This is the current trend in research and studies have shown that all parts (RE+CAD+CAM) of this have not been exploited in India. Studies also show that it is feasible to manufacture socket with rapid prototyping method. Work has been done on suitable materials. Also strength analysis has been carried out. Previously, clinical evaluation of conventional versus rapid prototyping sockets have been done to calculate pressure distribution during gait and comparisons have been drawn as in favour of those manufactured by RE and CAD/CAM completely.
It is time that the modern techniques like RE replace the conventional methods of socket manufacturing in India to establish footing in global market by fully utilizing the newest methods of available with RE, CAD/CAM and RP.
REFERENCES
[1] Linlin Zhang, Ming Zhu, Ling Shen, Feng Zheng, Finite element analysis of contact interface between trans femoral stump and prosthetic socket, 35th annual international conference of the IEEE EMBS, July 2013 [2] Imran Ali, Ramesh kumar, Yogendra Singh, Finite element Modelling and analysis of trans tibial prosthetic socket, Global Journal Inc. (US), 2014 [3] Prasanna Kumar Lenka, Amit Roy, Analysis of transtibial prosthetic socket material using finite element method, J. Biomedical Science and Engineering, 2011 [4] Ha Van Ho, Stephanie Rossman, Zsaquez Flucker, R. Radharaman, Comparison of shear stress acting in sockets of typical mobile and immobile ankle, school of engineering, Mecer University [5] Kahtan al-Khazraji, Jawad Kadhim, Payman Sahbad ahmed, Tensile and Fatigue characteristics of lower limb prosthetic socket made from composite materials, Proceedings of the 2012 international conference on industrial engineering and operations management, July 2012 [6] Chitresh Nayak, Amit Singh, Himanshu Chaudhary, Customised prosthetic socket fabrication using 3D scanning and printing, MalviyA National Institute of technology [7]David Moinina,Hugh Herr, A variable Impedance Prasthetic Socket for trans tibial aamputee designed from magnetic resonance imaging data, Journal of prosthesis and orthot. [8] Rajesh Surapureddy, Predicting pressure distribution between transfemoral prosthetic socket and residual lomb using finite element analysis, UNF thesis and dissertations, 2014

International Conference on Inter Disciplinary Research in Engineering and Technology 13
Cite this article as: Divya Singh, Richa Pandey. “Application of Reverse Engineering and CAD/CAM in Field
of Prosthetics-A Make in India Concept”. International Conference on Inter Disciplinary Research in
Engineering and Technology (2016): 09-13. Print.
[9] Lai-Hsing Hsu, Lu Yi Hsu, You Li Chou, Chih Wei Chein, Gwo Feng Huang, Automated Shape Modification for the Cad model of residual limb, biomedical engineering applications, basis and communications, December 2002 [10] Barbara, silver Thron, Parametric analysis using finite element method to investigate prosthetic interface stresses for persons with Transtibial amputation, The journal of rehabilitation research and development, August 1996 [11] Douglas G.Smith, Ernest M. Burgess, The use of CAD/CAM technology on prosthetics and orthotics-current clinical models and a view to the future, Journal of rehabilitation and Research development, May/ June 2001. [12] Giorgio Colombo, Massimiliano Bertetti, Daniele Bonacini, Grazia Magrassi, Reverse Engineering and rapid prototyping techniques to innovate prosthesis socket design, three dimensional image capture and applications VII, 2006 [13] Daniele Bonacini, Costantino Corradini, Grazia Magrassi, 3D digital models reconstruction: residual limb analysis to improve prosthesis design, body modelling and crime scene investigation, 2006 [14] Dr. Samera K. Radi, Stress Distributions of Lower Limb Prosthetic Socket, Journal of Engineering and Development, Vol. 11, No. 3, December (2007). [15] A.N. Sinha, Arun D. Udai, Development of artificial limb surface using reverse engineering method, Proceedings of International Conference on Advances in Machine Design & Industry Automation, January 10 – 12, 2007, College of Engineering, Pune, India [16] E. K. Moo, Abu Osman, B. Pingguan Murphy, W.A.B. Wan Abas, W. D. Spence, S.E. Solomonidis, Interface pressure profile analysis for patellar tendon-bearing socket and hydrostatic socket, acta of bioengineering and biomechanics, Vol. 11, No. 4, 2009

International Conference on Inter Disciplinary Research in Engineering and Technology 14
Cite this article as: Brock Kilbourne, Samantha Kilbourne, Wade Harned. “AI Gone Wild or Maybe Not”.
International Conference on Inter Disciplinary Research in Engineering and Technology (2016): 14-20.
Print.
International Conference on Inter Disciplinary Research in Engineering and Technology 2016 [ICIDRET 2016]
ISBN 978-81-929866-0-9 VOL 01 Website icidret.in eMail [email protected] Received 17-December-2015 Accepted 30-December-2015 Article ID ICIDRET004 eAID ICIDRET.2016.004
AI Gone Wild or Maybe Not
Brock Kilbourne1, Samantha Kilbourne2, Wade Harned3 1, 2El Camino Psychology Services, PC, United States
3Complete Web design Solution, United States
Abstract: What is harder to ignore and even more disconcerting is the fact that the same high tech elites who have made literally billions of dollars off the computer revolution at a time of virtually no regulation are now warning us of the downfall of humanity at the hands of computers and AI, and they are now pleading publicly for regulation before it is too late. Keywords: Artificial Intelligence, AI, robot technology, science, ethics, human rights violation, deviance in science, white collar crime.
INTRODUCTION
In recent years there has been a growing concern expressed by some scientific and high tech elites [3, 20, 33, 39] regarding the potential dangers to the human species from advances in artificial intelligence (AI). Artificial intelligence is understood to involve any computer system(s), not just intelligent machines, that is capable of performing human information processing tasks and operations, such as visual and auditory pattern recognition and recall, higher order decision making and problem solving, goal setting, speech production and recognition, directed searches and tracking, language translation, the ability to move and manipulate objects, and strategy optimization. AI uses machine-learning algorithms to respond selectively in real time by collecting and organizing massive data bases to make predictions and draw conclusions [40]. Most people would probably agree that the use of AI or any robot technology to infringe upon human dignity, autonomy, survival, and/or well-being is not a good thing and violates basic human rights. While some believe the potential dangers are years away, there are grounds for starting a discussion sooner rather than later given: the current state of AI research, the predatory history of the human species, the current pace of scientific and technological innovations, the expressed goals and agendas of some governments, and the insatiable drive for profits in capitalistic and mixed economies. Yet, it is hard to ignore the fact that there is enough AI around today, even semi-autonomous military weapons, to signal cause for alarm if we are indeed heading down the wrong path and are facing inevitable subjugation and/or extinction. What is harder to ignore and even more disconcerting is the fact that the same high tech elites who have made literally billions of dollars off the computer revolution at a time of virtually no regulation are now warning us of the downfall of humanity at the hands of computers and AI, and they are now pleading publicly for regulation before it is too late. This is even harder to believe given the arms race in AI which is unfolding before our eyes as Microsoft, Google, Apple and Amazon compete to buy up AI start-ups and services at an unprecedented rate [9]. Some have argued alternatively, and with a more even hand, that the evolution of high tech has both positive and negative consequences [22] and that fears of Armageddon and an Orwellian dystopia are tremendously exaggerated. So what are we to believe about evolving AI? The purpose of the present paper is to take a counterpoint position and argue that AI is a good thing (it probably will not save or destroy humanity, but it can assist humanity to manage itself more effectively and compassionately), and that there are currently sufficient safeguards in place to allow most of us to get a good night’s sleep. Specifically, the present paper discusses: 1) a brief history
This paper is prepared exclusively for International Conference on Inter Disciplinary Research in Engineering and Technology 2016 [ICIDRET] which is published by ASDF International, Registered in London, United Kingdom. Permission to make digital or hard copies of part or all of this work for personal or classroom use is granted without fee provided that copies are not made or distributed for profit or commercial advantage, and that copies bear this notice and the full citation on the first page. Copyrights for third-party components of this work must be honoured. For all other uses, contact the owner/author(s). Copyright Holder can be reached at [email protected] for distribution.
2016 © Reserved by ASDF.international

International Conference on Inter Disciplinary Research in Engineering and Technology 15
Cite this article as: Brock Kilbourne, Samantha Kilbourne, Wade Harned. “AI Gone Wild or Maybe Not”.
International Conference on Inter Disciplinary Research in Engineering and Technology (2016): 14-20.
Print.
and some benefits of AI, 2) a pro-AI marketplace, 3) the holy triad of science, education, and high tech, 4) an open internet, 5) existing safeguards, and 6) an AI Bill of Rights.
A Brief History and Some Benefits of AI
Artificial intelligence first took root in 1950 with the advent of the Turing Test, which was created to measure machine intelligence or the ability of a machine to make decisions like a program and Dietrich Prinz wrote a chess-playing program [8] at the University of Manchester to run on the Ferranti Mark 1 machine. Within a few short years, while working for General Motors in 1954, George Devol and Joseph Engelberger developed and introduced the first industrialized robot named Unimate [32]. In 1959 Marvin Minsky co-founded at the Massachusetts Institute of Technology an AI lab, and later went onto advise Stanley Kubrick in the making of HAL 9000 for the movie “2001: A Space Odyssey” [10]. By 1979, Moravec had introduced the world to self-driving cars [31]. This robot, named Cart, was a radio linked to a large mainframe computer. It was able to, albeit slowly, navigate obstacle courses, and to utilize a TV camera that slid side to side to help obtain stereoscopic viewpoints. It was not until the early 1990s when Massachusetts Institute of Technology’s Dr. Cynthia Breazeal introduced the world to Kismet, a robot that could recognize and simulate emotions [11]. In 1996, Charles Schwad invented the voice broker [25]. The AI of the phone service generated 360 customer stock quotes simultaneously. More recently in 2002 Honda’s Advanced Humanoid Robot, “ASIMO,” made its U.S. debut as a robot [1]. A few years later in 2004 the advent of autonomous space exploration unfolded whereby two Mars exploration rovers began their semi-autonomous missions to Mars [29]. The creation of the self-driving car was revisited in 2009 when Google built a self-driving car [18]. In 2013, the Never Ending Image Learner (NEIL) was released at Carnegie Mellon University [4]. Its sole purpose was to constantly compare relationships between different images and to eventually learn common sense relationships embedded in everyday living. Most recently Google’s AI beat Europe’s GO champion and demonstrated the ability to “learn to learn” by generating a “cognitive set” of likely strategies based on pattern recognition and machine memory (19, 26, 27) Today AI is all around us, and it is rapidly becoming an inseparable part of our everyday lives [40], from weather forecasts, to email spam filters, to Google search predictions, to voice recognition (i.e., Apple’s Siri), to text anticipated words, to workflow management tools, to self-driving cars, and space exploration. In most cases, people do not even recognize an AI operation is present or even impacting their immediate lives since AI exists quietly and peacefully alongside them and others in many communities around the world.
A Pro-AI Marketplace Any form of protectionism that slows down scientific progress and high tech development, and/or locks AI into the hands of “high tech elites,” is the real danger to society. Regulating AI to protect society or the human species from an imaginary existential threat is a disguised form of protectionism which will result in restricting innovation, progress, and competition. It will actually relegate AI technology to a handful of large multinational corporations wedded to tight-knit government regulation and surveillance. Such an arrangement could very likely prevent hundreds of thousands, maybe even millions of programmers and developers all over the world from ever becoming direct competitors in extant and emerging markets. Moreover, an unholy alliance between large U.S. multinationals and government(s) to control AI technology could pose an unprecedented threat to democratic institutions around the world by supplanting privacy with nonstop monitoring of every aspect of human existence and by limiting access to science and high tech technology. Alternatively, when there is an open policy of development and free trade regarding AI, a pro-AI marketplace throws open the market gates to all comers and reduces as much as possible any barriers, thus encouraging innovation, scientific breakthroughs, new products and services, and competition around the world. A transparent and competitive AI is part of the pro-AI marketplace, and as such AI is more likely to become a pragmatic liberator rather than an ideological oppressor. A transparent and competitive AI in a pro-AI marketplace may in fact be the tool humanity has been waiting for to solve global problems of poverty, war, climate change, disease, income inequality, jobs, diminishing resources, the population explosion, etc., and to advance the human species. For example, by open sourcing its AI engine Tensorflow, Google took a giant step forward toward accelerating and advancing technological innovation and progress in the field of AI. Tensorflow is currently dead center in the paradigm shift to both train and execute AI models in Graphic Processing Units (GPUs) rather than Computer Processing Units (CPUs), which is important to “deep learning” [26]. GPU is a special purpose processor optimized for computer graphics (particularly good at interacting directly with people in real time) whereas CPU is a general purpose processor and can in principle do any computation, although not optimally [13]. While a CPU excels at sequential tasks, similar to what psychologists call sequential processing, a GPU is designed to execute specific tasks very efficiently and it is designed to work together with other GPUs on the same task, analogous to what psychologists call simultaneous processing. Deep learning consists of a complex network of machine learning algorithms using multiple specialized GPUs simultaneously processing and analyzing, analogous to the complex network of neurons in the human brain, massive amounts of data at high speeds, using much less power than CPUs, and with the potential of being downloaded to a smartphone or smartwatch. That puts AI everywhere and puts AI in the hands of everyone. An AI friendly world and a world friendly AI.

International Conference on Inter Disciplinary Research in Engineering and Technology 16
Cite this article as: Brock Kilbourne, Samantha Kilbourne, Wade Harned. “AI Gone Wild or Maybe Not”.
International Conference on Inter Disciplinary Research in Engineering and Technology (2016): 14-20.
Print.
The Holy Triad: Science, Education, and High Tech A cornerstone of the pro-AI marketplace is to insure that all players have equal access to the science, technology, and education they need to innovate, develop, manufacture, distribute, market, and operate high tech. In a practical sense, this means that all people, societies, and cultures need to have equal access to AI in order to benefit them and to compete in the emergent global economy. There is no magic bullet and progressive change will not occur overnight. Progressive world-wide change will occur unevenly and will require a three pronged approach to advance the triad of science, high tech, and education. First, each society and nation state needs to prioritize scientific solutions in regard to all local, regional, and national problems, whether water conservation, traffic control, pollution and carbon emissions, financial management, social problems, tax structure, elections, medical care, law enforcement, and/or national defense. Second, and concurrent with the first, the educational system in every society and nation state needs to emphasize the importance of scientific literacy and high tech applications. The use of high tech devices in the classroom is actually a fast track to scientific literacy. Resourcing and packing schools with high tech devices not only facilitates learning, it also primes students to learn about the science in their high tech device(s) and to understand what science is all about: the scientific method, scientific probabilities and lawfulness, scientific correlates (i.e., mathematics, computer programming, engineering, etc.), the universal benefits of science, and scientific ethics. A heavy dose of high tech in all schools along with a basic course in “What is Science” is the quickest path to scientific literacy in the 21st century. In other words, employ high tech devices with all their popular appeal, such as smart phones, iPods, tablets, and video game systems, to explicitly teach science. Third, each society and nation state needs to increase their financial investment in science and technology in general and in AI in particular. Inter-disciplinary teams of physicists, biologists, psychologists, neuro-scientists, mathematicians and statisticians, computer programmers, engineers, and ethicists will all be needed to advance AI research and application.
An Open Internet and Net Neutrality
On February 26, 2015, the Federal Communications Commissions (FCC) approved FCC Chairman Tom Wheeler’s Net Neutrality rules on Title II of the Communications Act [13]. Net Neutrality is the guiding principle of the internet and preserves the right to communicate freely online and to protect free speech. There can be no fast and slow lanes, and it bans throttling, blocking, and paid prioritization. Your ISP cannot monitor what you view or post online, although it may be able to track your internet use by stating it in their terms and conditions. Net Neutrality is the life blood for the development of AI because Net Neutrality is indispensable to cultivate job growth, competition, and innovation. Al small business owners, start-ups, and entrepreneurs all over the world need an open internet to develop their products and services, to create markets, to advertise, and to distribute their products and services world-wide. An open internet sets the stage for a transparent and competitive AI that can be used by all and that is likely to remain world and human friendly.
Safeguards: Existing Laws, Policies, and Institutions
While there is a general absence of legal definitions of AI in the United States and there are no explicit laws or legislation pertaining to the creation, application, or dissemination of AI, there are numerous laws, policies, and institutions which unquestionably impact AI. For example, in addition to the new Net Neutrality rules, which are now a part of Title II of the Communications Act, there are other laws in place regulating the sharing of information with the government in order to enforce cybersecurity (Electronic Communications Privacy Act [ECPA, 1986], Cyber Intelligence Sharing and Protection Act [CISPA, 2012] [6], Executive Order 13636 [E.O. 13636, 2013], Federal Information Security Management Act of [FISMA, 2013], Cybersecurity Act of 2013) that can be applied to AI [12, 23]. Laws related to terrorism and homeland security may also be applied to AI [41]. There are, moreover, broader, preexisting, all-encompassing laws in place (FCC, FDA, FDIC, FTC, transportation laws, U.S. Department of Energy) to regulate how AI technologies are utilized in relation to field-specific tasks [14, 15, 16, 17, 35, 36, 38]. Finally, there is a whole body of laws such as the National Research Act of 1974 [7], Bayh-Dole Act of 1980 [5], and Federal Technology Transfer Act of 1986, [37] and institutions such as the National Institutes of Health, Office of Scientific Integrity, Office of Scientific Integrity Review, Office of Science and Technology Policy, Office of Human Research Protections, etc. pertaining to the safeguard of human research subjects (see summary of the evolution of scientific ethics from 1932 up to the present [30]). These laws and policies of scientific ethics can be directly (mandatory testing of certain forms of AI with human subjects before marketing and distribution) or indirectly (applicable to citizens as human subjects when AI is operational in society) applied to human beings and AI. There are, then, many laws in place pertaining to Net Neutrality, Homeland and cybersecurity, field-specific AI tasks, and scientific research with human subjects, etc., that are applicable to most, if not all, imaginable abuses of AI, and which can be conceptualized, in turn, as either “blatant criminal acts” or “white collar crimes” [21]. There are also three branches of government in the United States, legislative, judicial and executive, which have legal authority to investigate and/or refer AI abuses and/or legal infractions for prosecution. In sum, there are more than sufficient practices, policies, laws and institutions in place to safeguard humankind from unfriendly and hostile attacks by AI.

International Conference on Inter Disciplinary Research in Engineering and Technology 17
Cite this article as: Brock Kilbourne, Samantha Kilbourne, Wade Harned. “AI Gone Wild or Maybe Not”.
International Conference on Inter Disciplinary Research in Engineering and Technology (2016): 14-20.
Print.
An AI Bill of Rights (AIR=AI Rights)
Why an AI Bill of Rights if there are already existing practices, policies, laws, and democratic institutions in place which affect the development, application and marketing of AI? An AI Bill of Rights is necessary for the same reason a Bill of Rights was necessary for the United States Constitution. An AI Bill of Rights is necessary in order to place specific limits on government power and to safeguard individual liberty. Similar to the controversy between the Federalists and the Anti-Federalists regarding the wisdom and need of a Bill of Rights for the U.S. Constitution, any discussion today regarding an AI Bill of Rights may be no less controversial. Yet in 100 years from now both U.S. and world citizens may find it unimaginable to think otherwise. Ten AI Rights (i.e., AIR) for human beings are proposed. AIR I No government, government entity, representative, partner or contractor, and no public, private, individual, organizational, or corporate legal entity working in concert with any government entity, directly or indirectly, overtly or covertly, shall limit, control, and/or restrict the development, application, advertising, marketing, use, distribution, and/or ownership of AI. AIR II All human beings have the right to carry, own, operate, to have on or in their persons, any and all AI devices, programs, algorithms, and/or technology, that can be employed to help them as human beings to survive and thrive, to include but not be limited to their health, well-being, peace of mind, pursuit of happiness, security, individual liberty, human dignity, autonomy, freedom of religion, and the realization of their full potential as human beings. AIR III No government, government entity, representative, partner or contractor, no public or private legal entity, nor any informal or illegal entity, shall abridge, limit, and/or restrict the right of free speech of any human being in the course of using or advocating the use of AI or abridge, limit and/or restrict any AI which has the capacity of free speech to promote the free speech, health, well-being, peace of mind, pursuit of happiness, security, individual liberty, freedom of religion, human dignity, autonomy, and full potential of all human beings. AIR IV Small business owners, start-ups, and entrepreneurs worldwide and within the full extent of human reach into our solar system and galaxy that utilize AI, have the right to an open, free internet and net neutrality in order to develop their AI products and services, to create AI markets, to promote AI products and services with advertising, and to distribute AI products and services as per existing laws and regulations, local, state, federal and international. AIR V AI developers shall maintain their rights of copyright, patent, and intellectual property for any AI program, algorithm, product and/or service for which they develop. AIR VI The right of all human beings to freely and equally participate, enjoy, and use all technology, scientific, cultural, literary and artistic advances of autonomous AI, exclusively for the general benefit and welfare of the human species and the human community, and the protection of the moral and material interests resulting from any scientific, technological, literary or artistic production shall not be vested in any said individual, group, organization, or party, and shall only be vested universally in all human beings. AIR VII The right of all human beings to be secure in their use of AI, in their persons, houses, papers, work, education, and effects, including the right not to be tracked by AI or other electronic devices and the right of privacy, against unreasonable searches and seizures, shall not be violated, and no warrants issued, but upon probable cause, supported by oath or affirmation, and particularly describing the place, AI, device and/or program to be searched, and the person, AI, or things to be seized. AIR VIII The right of all human beings to be secure in their use of AI to develop, promote, maintain, and perpetuate their unique culture and cultural lifestyle to the best of their knowledge, ability, and intentions, against unreasonable infringements, limitations, discrimination, exclusion, barriers, or restrictions, shall not be violated. AIR IX No human being who knowingly creates, develops, uses, employs, distributes, or markets for sale, shall not be denied due process in any civil or criminal offense in their use of AI, including the right to a trial by jury, to not be tried for the same offence twice, or required to witness against themselves, nor deprived of life, liberty or property without due process or compensation, nor deprived of the right to a public, speedy trial, and trial by a jury of peers, and informed of the nature and cause of accusations, to not confront

International Conference on Inter Disciplinary Research in Engineering and Technology 18
Cite this article as: Brock Kilbourne, Samantha Kilbourne, Wade Harned. “AI Gone Wild or Maybe Not”.
International Conference on Inter Disciplinary Research in Engineering and Technology (2016): 14-20.
Print.
witnesses against them or to not have witnesses in their favor, to have the assistance of counsel, and to not have the requirement of excessive bail, excessive force or extreme and unusual punishment. AIRX No semi-autonomous or autonomous AI shall be reassigned, decommissioned, deactivated, recycled, transformed or destroyed for acts against human beings, the human community, or humanity without a fair hearing by a panel of human experts in AI, computer programming, science (physical, biological and social), technology, and human affairs.
Conclusion
The present paper has reviewed the evidence in support of encouraging and promoting the development of AI within existing legal, ethical, scientific, and marketplace understandings and policies. Limiting and controlling the development of AI in the name of saving humanity from an “incredulous” and “what if” Hollywood style apocalypse or dystopia is a sure fire way to keep AI in the hands of elites and to invite government abuse. It is a sure fire way to restrict, control, and prevent scientific, technological, and world-wide development of AI, all of which is much needed to support and fuel individual liberties, cultural diversity, economic growth, and to deal with global problems facing all humanity. There is literally no scientific evidence to support the erroneous beliefs, which are essentially ideological, self-serving, and/or magical, that fully autonomous AI or “Killer Robots” are either scientifically or technologically possible to produce and manufacture, that they would ever be capable of launching a war against humankind, and/or that humanity would not survive an AI assault of holocaust proportions [2]. There is substantial evidence, however, that AI currently co-exists peacefully along human beings throughout the world, the most advanced AI engages in a conservative not aggressive style of play, and that no semi-autonomous military drone has ever turned on its operator(s). Moreover, there are many real and pressing problems facing human society and the human species that can benefit from the application of science in general and AI in particular: population explosion, pollution and climate change, limited resources, poverty, income inequality, terrorism, totalitarian regimes, racism, sexism, the proliferation of weapons of mass destruction, and war. There is in fact an exponential explosion of scientific knowledge and technological advances at the dawn of the 21st Century which can be applied to solving human problems. We may have more to fear from actually restricting AI than from openly developing AI. We need to employ AI for all humankind, and we need to partner with a peaceful and human friendly AI to solve real problems facing the human species and the human community. An AI Bill of Rights is a good first step toward guiding AI to value and protect individual liberties, cultural diversity, democratic institutions, and to guard against abuse and oppression by either big business or big government. We need to build a world friendly AI and an AI friendly world.
REFERENCES
[1] American Honda Motors Co. Inc. (2015). Honda's advanced humanoid robot "ASIMO" makes U.S. debut. Retrieved on November 9, 2015 from http://asimo.honda.com/news/hondas-advanced-humanoid-robot-asimo-makes-us-debut/newsarticle_0008/
[2] Austin, R. (2016). Killer robots are a real threat. Retrieved on January 22, 2016 from
http://www.apextribune.com/killer-robots-are-a-real-threat/214657/ [3] Barrat, J. (2015). Why Stephen hawking and bill gates are terrified of artificial intelligence. Retrieved on December 1,
2015 from https://www.washingtonpost.com/news/the-switch/wp/2015/01/28/bill-gates-on-dangers-of-artificial-intelligence-dont-understand-why-some-people-are-not-concerned/
[4] Clark, J. (2013). Is that you, HAL? No, it’s NEIL: Google, U.S. navy pour money into ‘associative’ AI brain. Retrieved on
November 9, 2015 from http://www.theregister.co.uk/2013/11/26/neil_associative_ai/ [5] Colorado State University Research Foundation. (2006). What is Bayh-Dole and why is it important to Technology
Transfer? Retrieved on December 1, 2015 from http://www.csurf.org/enews/bayhdole_403.html [6] Congress.gov (2015a). H.R.234 - Cyber intelligence sharing and protection act. Retrieved on November 9, 2015 from
https://www.congress.gov/bill/114th-congress/house-bill/234 [7] Congress.gov (2015b). H.R.7724. Retrieved on December 1, 2015 from https://www.congress.gov/bill/93rd-
congress/house-bill/7724 [8] Copeland, J. (2000). What is artificial intelligence. Retrieved on November 9, 2015 from
http://www.alanturing.net/turing_archive/pages/reference%20articles/what_is_AI/What%20is%20AI04.html

International Conference on Inter Disciplinary Research in Engineering and Technology 19
Cite this article as: Brock Kilbourne, Samantha Kilbourne, Wade Harned. “AI Gone Wild or Maybe Not”.
International Conference on Inter Disciplinary Research in Engineering and Technology (2016): 14-20.
Print.
[9] Darrow, B. (2016). Microsoft goes deeper into artificial intelligence with latest acquisition. Retrieved on February 2, 2016 from http://fortune.com/2016/02/02/microsoft-to-buy-swiftkey/
[10] Dennis, M. (2015). Marvin Minsky. Retrieved on November 13, 2015 from
http://www.britannica.com/biography/Marvin-Lee-Minsky [11] Dreifus, C. (2003). A conversation with: Cynthia breazeal: A passion to build a better robot, one with social skills and a
smile. Retrieved on November 9, 2015 from http://www.nytimes.com/2003/06/10/science/conversation-with-cynthia-breazeal-passion-build-better-robot-one-with-social.html?pagewanted=all
[12] Electronic Privacy Information Center (2015). Electronic communications privacy act (ECPA). Retrieved on November 9,
2015 from https://epic.org/privacy/ecpa/ [13] Fair, E. (2015). What’s the difference between a CPU and a GPU? Retrieved on November 17, 2015 from
https://www.quora.com/Whats-the-difference-between-a-CPU-and-a-GPU [14] Federal Communications Commission. (2015a). FCC adopts strong, sustainable rules to protect the open internet.
Retrieved on December 1, 2015 from https://www.fcc.gov/document/fcc-adopts-strong-sustainable-rules-protect-open-internet
[15] Federal Communications Commission. (2015b). What we do. Retrieved on November 11, 2015 from
https://www.fcc.gov/what-we-do [16] Federal Deposit Insurance Corporation. (2015). FDIC law, regulations, related acts. Retrieved on November 11, 2015
from https://www.fdic.gov/regulations/laws/ [17] Federal Trade Commission. (2015). What we do. Retrieved on November 11, 2015 from https://www.ftc.gov/about-
ftc/what-we-do [18] Fisher, A. (2013). Inside google’s quest to popularize self-driving cars. Retrieved on November 9, 2015 from
http://www.popsci.com/cars/article/2013-09/google-self-driving-car [19] Gibney, E. (2016). Google ai algorithm masters ancient games of go. Retrieved on February 1, 2015 from
http://www.nature.com/news/google-ai-algorithm-masters-ancient-game-of-go-1.19234 [20] Holley, P. (2015). Bill gates on dangers of artificial intelligence: ‘I don’t understand why some people are not concerned.’
Retrieved on December 1, 2015 from https://www.washingtonpost.com/news/the-switch/wp/2015/01/28/bill-gates-on-dangers-of-artificial-intelligence-dont-understand-why-some-people-are-not-concerned/
[21] Kilbourne, B.K. & Kilbourne, M.T. (Eds.). The Dark Side of Science. Pacific Division American Association for the
Advancement of Science. San Francisco, CA: Hamilton Press, 1983. [22] Kilbourne, S. & Kilbourne, B. (2015). Psychroneity: The interaction of self with high-tech technology. The International
Journal of Science in Society. 7(1), p.17-30.
[23] Kominsky, M.S. (2014). The current landscape of cybersecurity policy: Legislative issues in the 113th congress. Retrieved on November 9, 2015 from http://harvardnsj.org/2014/02/the-current-landscape-of-cybersecurity-policy-legislative-issues-in-the-113th-congress/
[24] Lin, T., Markoff, J., Lohr, S., Allen, C., Allert, M., Roth, J. (2010a). Building smarter machines. Retrieved on November
9, 2015 from http://www.nytimes.com/interactive/2010/06/25/science/20100625_AI_TIMELINE.html?_r=1& [25] Lin, T., Markoff, J., Lohr, S., Allen, C., Allert, M., Roth, J. (2010b). Building smarter machines. Retrieved on November
9, 2015 from http://www.nytimes.com/interactive/2010/06/25/science/20100625_AI_TIMELINE.html?_r=0 [26] Metz, C. (2016). Tensroflow, google’s open source AI, signals big changes in hardware too. Retrieved on November 10,
2015 from http://www.wired.com/2015/11/googles-open-source-ai-tensorflow-signals-fast-changing-hardware-world/ [27] Monte Carlo Tree Search (MCTS). (2016). what is mcts? Retrieved on February 2, 2016 from
http://mcts.ai/about/index.html

International Conference on Inter Disciplinary Research in Engineering and Technology 20
Cite this article as: Brock Kilbourne, Samantha Kilbourne, Wade Harned. “AI Gone Wild or Maybe Not”.
International Conference on Inter Disciplinary Research in Engineering and Technology (2016): 14-20.
Print.
[28] Moravec, H. (1980). Obstacle avoidance and navigation in the real world by a seeing robot rover. Retrieved on November
9, 2015 from https://www.frc.ri.cmu.edu/users/hpm/project.archive/robot.papers/1975.cart/1980.html.thesis/ [29] National Aeronautics and Space Administration (2004). Mars exploration rover. Retrieved on November 9, 2015 from
http://mars.nasa.gov/mer/newsroom/factsheets/pdfs/Mars03Rover041020.pdf [30] Resnik, D.B. (2014). Research ethics timeline (1932-present). Retrieved on November 13, 2015 from
http://www.niehs.nih.gov/research/resources/bioethics/timeline/ [31] Robotcars (n.d.), Prof. schmidhuber’s highlights of robot car history. Retrieved on November 5, 2015 from
http://people.idsia.ch/~juergen/robotcars.html [32] RobotWorx (n.d.). History of industrial robots. Retrieved on November 9, 2015 from
https://www.robots.com/education/industrial-history [33] Sainato, M. (2015). Stephen hawking, elon musk, and bill gates warn against artificial intelligence. Retrieved on December
1, 2015 from https://www.washingtonpost.com/news/the-switch/wp/2015/01/28/bill-gates-on-dangers-of-artificial-intelligence-dont-understand-why-some-people-are-not-concerned/
[34] The Many Faces of Death (2011). Death by killer robot-Japan. Retrieved on November 9, 2015 from
http://themanyfacesofdeath.blogspot.com/2011/08/death-by-killer-robot-japan.html Bpt car history.
[35] Transportation Law. (2015). Transportation law. Retrieved on November 11, 2015 from http://www.hg.org/transportation-law.html [36] U.S. Department of Energy. (2015). Science and innovation. Retrieved on November 11, 2015 from http://energy.gov/ [37] U.S. Environmental Protection Agency. (2015). Federal technology transfer act and related legislation. Retrieved on
December 1 2015, from http://www2.epa.gov/ftta/federal-technology-transfer-act-and-related-legislation [38] U.S. Food and Drug Administration. (2015). Advancing regulatory science. Retrieved on November 11, 2015 from http://www.fda.gov/ScienceResearch/SpecialTopics/RegulatoryScience/default.htm?utm_campaign=Goo [39] Vanian, J. (2015). Why elon musk is donating millions to make artificial intelligence safer. Retrieved on October 25, 2015 from http://fortune.com/2015/07/01/elon-musk-artificial-intelligence/ [40] Wired (2012). From science fiction to reality: The evolution of artificial intelligence. Retrieved on December 1, 2015 from http://www.wired.com/insights/2015/01/the-evolution-of-artificial-intelligence/ [41] Zalman (2015). Artificial intelligence (AI). Retrieved on November 9, 2015 from http://terrorism.about.com/od/controversialtechnologies/g/ArtificialIntel.htm

International Conference on Inter Disciplinary Research in Engineering and Technology 21
Cite this article as: Rahi Jain, Bakul Rao. “Financial Planning for Small-Scale Herbal Industries based on
National Mission on Medicinal Plant scheme: A Case Study”. International Conference on Inter
Disciplinary Research in Engineering and Technology (2016): 21-25. Print.
International Conference on Inter Disciplinary Research in Engineering and Technology 2016 [ICIDRET 2016]
ISBN 978-81-929866-0-9 VOL 01 Website icidret.in eMail [email protected] Received 18-December-2015 Accepted 30-December-2015 Article ID ICIDRET005 eAID ICIDRET.2016.005
Financial Planning for Small-Scale Herbal Industries based on National Mission on Medicinal Plant scheme: A
Case Study
Rahi Jain1, Bakul Rao2 1, 2 Centre for Technology Alternatives for Rural Areas (CTARA), Indian Institute of Technology Bombay (IITB), Powai
Mumbai, India
Abstract: The study proposes financial plans incorporated with National Mission on Medicinal Plants (NMMP) Scheme for small-scale herbal industries. The study identifies the role of various parameters like raw material source, processing type and entrepreneur type that can affect the feasibility of the financial plan both for the economically weaker sections as well as private entrepreneur in rural areas. A case study on setting up semi-processing unit for Phyllanthus amarus in Khirvire Village, Ahmednagar District, and Maharashtra is used to demonstrate the importance and potential of financial plans support for any rural entrepreneur. This study could help policymakers in developing better policies for successful scheme implementation. Keywords: Small-Scale Industries, Medicinal plant, NMMP.
INTRODUCTION
Globally, medicinal plants (MPs) are demanded in the healthcare for allopathic drugs [1], medical diagnostic [2] and traditional medical systems [3]. The world MPs demand is expected to increase from Rs. 0.94 trillion in 2009 to Rs. 334 trillion in 2050 [4]. Further, India’s nutraceuticals current market stands at Rs. 0.19 trillion with expected compounded annual growth rate of 17% for next 5 years [5]. This global and domestic demand for MPs has put pressure on the current supply sources (majorly wild and forests) [6]. World Health Organization in early 2000s discussed upon sustaining quality MPs supply [7], [8]. India’s focus on MPs supply sources sustainability started with its ninth five-year plan (1997-2002) [9] that resulted in the implementation of National Mission on Medicinal Plants (NMMP) scheme in 2008. This mission provides financial as well as technical support to the complete Indian herbal industry supply chain from cultivation to finished product marketing to ensure quality MP supply sustainability and increase in global market share from mere 1% [6]. Such scheme can open new livelihood opportunities in rural areas that could allow rural entrepreneurs to shift from cultivators and collectors to small-scale industrialists. Accordingly, these rural entrepreneurs require a financial plan for their project to approach the government for support. A financial plan provides a summary about the sources and allocation of various financial resources to the various future expenses that helps in making a decision of selecting the most appropriate business plan. However, both the NMMP operational guidelines and limited literature on NMMP fall short of providing a system or framework to help rural entrepreneurs to develop their own financial plan [6]. Studies by Jain and Rao (2013 and 2015) showed the policy design issues like project selection decision, technology silence, accountability and content clarity that can affect both mission implementation and rural entrepreneurs [10], [11]. Further, studies in Uttarakhand State, India by Pangriya (2015) and Kuniyal et al (2015) had raised the implementation issues like MP
This paper is prepared exclusively for International Conference on Inter Disciplinary Research in Engineering and Technology 2016 [ICIDRET] which is published by ASDF International, Registered in London, United Kingdom. Permission to make digital or hard copies of part or all of this work for personal or classroom use is granted without fee provided that copies are not made or distributed for profit or commercial advantage, and that copies bear this notice and the full citation on the first page. Copyrights for third-party components of this work must be honoured. For all other uses, contact the owner/author(s). Copyright Holder can be reached at [email protected] for distribution.
2016 © Reserved by ASDF.international

International Conference on Inter Disciplinary Research in Engineering and Technology 22
Cite this article as: Rahi Jain, Bakul Rao. “Financial Planning for Small-Scale Herbal Industries based on
National Mission on Medicinal Plant scheme: A Case Study”. International Conference on Inter
Disciplinary Research in Engineering and Technology (2016): 21-25. Print.
quality control and site selection in the various MPs related scheme including NMMP [12], [13]. Further, the report by steering committee on AYUSH (2012) has identified the NMMP inadequate target achievements related to market share, rural employment and total area under cultivation [14]. Accordingly, this study focuses on developing the financial plan for rural entrepreneurs to bridge the current knowledge gap. A case study approach is adopted using 2010 data for prices and demand to test financial plan viability of various possible scenarios for setting up of Phyllanthus amarus MP semi-processing unit at Khirvire village, Akole Taluka, Ahmednagar District, and Maharashtra. This study makes the contribution in several directions. Firstly, it provides a framework to enable rural entrepreneurs to develop their own financial plans. Secondly, such an exercise would allow the policymakers to forecast the different type of entrepreneurs’ success in a setting. Accordingly, polices could be modified or designed to strengthen the involvement of weaker groups in the herbal sector. Thirdly, identification of the different parameters followed by their response for the financial plan potential success in a given area means a methodological contribution. Finally, integration of the NMMP norms into the financial analysis provides a theoretical contribution in the field of decision-making for NMMP.
Method Study Parameters The visit and interaction with the locals of Khirvire village in 2010 provided insights about village’s favorable agro-climatic conditions for various MPs like Phyllanthus amarus grown in the Western Ghats (WG). This MP is given subsidy under NMMP and used in the pharmaceutical industry for extraction of majorly two compounds namely Phyllanthin and Hypophyllanthin. They also contain Phenolic acids that are focused in research for their medicinal properties like anti-tumor, and anti-inflammatory [15]. The study prepares different financial plans for different scenarios using three parameters raw material supply source (RMSS), level of processing (LP) and entrepreneur type (ET). RMSS for an industry can be either from the cultivator or the collector. The cultivator would cultivate MPs on his agriculture field during the Kharif season, while the collector would collect from the wild. Currently, the village does not have adequate Phyllanthus amarus in wild, but collector parameter chosen to understand financial plans for other similar villages with sufficient availability of plant in wild. In addition, based on interaction with agriculture experts, it was found that cultivated variety of Phyllanthus amarus give 0.5% Phyllanthin content [16] compared to 0.3% in wild variety. LP for the industry can be either only powdering of dried Phyllanthus amarus or enhancing the concentration of phyllanthin. The process considered for concentrating Phyllanthin is one that is developed by Jain and Rao (2014) to reduce phenolic acid concentration from biological material. In this two products will be produced namely concentrated phyllanthin powder and phenolic acids liquid [17]. ET for the industry can be either private1 or Self Help Group2 (SHG) as this will determine the scheme subsidy and labor charges. In case of the SHG, subsidy is 100% for storage room and 25% for processing unit machines. Further, no labor cost need to be considered as SHG members will provide labor and share profits, a common practice in the area. In case of the private entrepreneur, subsidy is 50% for storage room and 25% for processing unit machines and local labor will be procured. Defining Scenarios The scenarios are defined in two stages. In the first stage, four scenarios (Scenario 1-4) are created (Table I) for optimization of the RMCC and LP parameters are performed using SHG as the ET. The best value of RMCC and LP are selected for scenario 5 in which ET parameter is private entrepreneur. The financial plan is tested to have short payback period, higher Internal Rate of Return (IRR), and Net Present Value (NPV).
TABLE I Different Scenarios considered under study for Financial Plan
Scenario Raw Material Supply Entrepreneur Processing Type 1 Collector SHG Dried Phyllanthus amarus powder (DP) 2 Collector SHG Phyllanthin concentration enhancing (PCE) 3 Cultivator SHG DP 4 Cultivator SHG PCE 5 Cultivator/Collector Private DP/ PCE
Assumptions This study used the 2010 for prices and data as data collection and interactions with industry and field experts were made during 2010-2011. Those interactions are used as basis for all assumptions. Industry need not have manufacturing license as no consumer product is sold. Further, no hiring for industry management, entrepreneur will itself manage small-scale industry. The entrepreneur or SHG

International Conference on Inter Disciplinary Research in Engineering and Technology 23
Cite this article as: Rahi Jain, Bakul Rao. “Financial Planning for Small-Scale Herbal Industries based on
National Mission on Medicinal Plant scheme: A Case Study”. International Conference on Inter
Disciplinary Research in Engineering and Technology (2016): 21-25. Print.
will manage investment money and not considered in this study. The subsidy provided will be released by the government within a year of construction and will be directly deposited into the company account [11]. All the prices given for land, construction, machinery and other items are estimated value made for that area. The 50 kg capacity gunny bags will be used for product packaging that will be returned by product buyer during next transaction. The number of bag purchased will be sufficient to hold 30 days stock and will cost around Rs 20 per bag with yearly bag wastage of 25 percent. All the expenditures will be on credit basis that will be returned in 15-20 days. The product will be sold within 15 days with selling price to be 20% of the raw material cost. The minimum phyllanthin content in raw material is assumed to be 0.3% with minimum cost price of Rs 20 per kg and price increase rate at Rs 100 per 1.8 percent of total phyllanthin content. The selling price of the concentrated phyllanthin powder would be taken as the raw material cost for the phenolic acid liquid. The process is in a batch mode of 1 batch per hour. The amount of solid removed from the dried powder for phyllanthin concentration is assumed to be 8% [17]. The depreciation for construction and machinery is taken as 10% and 25% respectively [18]. All the cash flows and profits calculated would be before tax. Gross profit will be total revenue minus total expenditure for a given year. Net profit is gross profit minus the depreciation cost for a given year. Cash Profit is net profit plus depreciation cost for a given year. Total cash inflow is gross profit plus the subsidy for a given year. Taxable income is net profit minus investment for a given year. Percentage profit on expenditure is 100*(total cash inflow)/expenditure for a given year. Discount rate or loss in the value of money was assumed to be 10%. NPV and IRR are calculated for the first 6 years. Payback period is the simple payback period. Industry Operations The industry production capacity is planned for 80 tons/day with the daily processing capacity of around 500 kg and 160 days (October to March) of functioning. The seasonal functionality will prevent labor competition during agriculture season (May to September). On the basis of interaction with the industry experts and industry visits, the size of the unit is proposed to be around 8400 ft2, which include the inventory room/storage room of 8000 ft2. The inventory capacity is designed to hold 1 week of the raw material supply. Further, the space required for phenolic acid liquid extraction will be constructed as the first floor of the processing unit building with total area of 400 ft2. In terms of supply sources for various basic requirements, water will be procured from locals at Rs 700/ 5000litres and power will be procured from the power grid at Rs 3 per unit. Since the industry is located within the village, the locals at the industry doorstep will provide the raw material. In the case of labor, the local labor rates of Rs 60/day will apply. The major machinery used by the industry are shown in Table III includes hard grinding unit, grinding unit and sieving unit. In the case of LP involving the concentration of phyllanthin, additional machinery namely vacuum dryer will be used to dry phenolic acid liquid. The scenarios with the powdering unit alone will have installed power load of 10 kW and seven laborers while scenarios with the concentration of phyllanthin will have installed power load of 14.5 kW and 12 laborers. The raw plant material collected will be stored in the storage room from where it will be constantly provided to the processing section. The industry will be functional for 8 hours/day for six days a week. The buyer will purchase the processed product from the industry doorstep.
Result Financial Outlays The break-up of project cost without subsidy in terms of investment and expenditure for all scenarios is given in Table IV. The project cost for different scenarios is different with lowest investment requirement for scenario 1 and is less than half of the highest investment scenario i.e. scenario 4, indicating the impact of RMSS and LP on investment requirement. The collector as raw material source and lower level of processing reduces the investment cost. Further, the project cost increase from SHG to private entrepreneur was less than two percent. The government subsidy for different scenarios is as shown in Table IV. The higher subsidy is provided to scenarios with the higher degree of processing. Financial Plans Financial plans summary for different scenarios is shown in Table IV. Scenario 3 has the lowest payback period of 1.3 years, highest IRR of 45.5 percent and NPV of Rs 845,000. Further, this scenario’s RMSS and LP parameters are selected for scenario 5 and the financial plan performance of scenario 5 reduced significantly as compared to scenario 1 with an increase in payback period to 2.2 years, reduction in IRR and NPV to 32.7 percent and Rs 545,000 respectively. This could be attributed to the reduction in government subsidy. However, this scenario as compared to remaining three scenarios is much better indicates that scenario 3. The poor performance of scenario 2 than scenario 4 could be attributed to the lower product price owing to lower product quality from wild source of raw material as compared to cultivated source of raw material.

International Conference on Inter Disciplinary Research in Engineering and Technology 24
Cite this article as: Rahi Jain, Bakul Rao. “Financial Planning for Small-Scale Herbal Industries based on
National Mission on Medicinal Plant scheme: A Case Study”. International Conference on Inter
Disciplinary Research in Engineering and Technology (2016): 21-25. Print.
TABLE III Machinery Units Type, quantity, cost and power load
Machinery Quantity Cost (Rs @ 2010 prices) Power Load (kW) Hard grinding unit 1 50,000 3 Grinding unit 1 2,50,000 5 Seiving Unit 1 50,000 2 Vaccum dryer 1 20,00,000 3
Further, low project cost options namely scenario 1 and scenario 2 for SHGs have acceptable payback period and could be considered as local optima. Further, scenario with advanced processing does not seem to have viable financial options while in real world, success of big private players like Natural Remedies Private Limited (NRPL) with sophisticated processing indicate that the next step up the industrialization ladder may require very large investment and scale.
TABLE IV Financial Projections for Different Scenarios
Particulars Units* Scenario 1 Scenario 2 Scenario 3 Scenario 4 Scenario 5 Summary of Investment Land Rs (,000) 81 81 81 81 81 Building and civil works Rs (,000) 528 553 528 553 528 Plant & Machineries Rs (,000) 375 2,450 375 2,450 375 Total Investment Rs (,000) 984 3,084 984 3,084 984 Subsidy Summary Storage Subsidy Rs (,000) 480 480 480 480 240 Processing Unit Rs (,000) 94 613 94 613 94 Total Subsidy Rs (,000) 574 1,093 574 1,093 574 Total Revenue Rs (,000) 1,900 2,080 2,850 3,000 Summary of Expenditure Human Resources Rs (,000) 67 0.0 67 0.0 67 Power Consumption Rs (,000) 38.0 56.0 38.0 56.0 56 Water Costs Rs (,000) 0.0 11.0 0.0 11.0 0.0 Maintenance Rs (,000) 49.0 154 49.0 154 154 Input Costs Rs (,000) 1,600 1,600 2,400 2,400 1,600 Market costs/Gunny Bags cost Rs (,000) 6.0 6.0 6.0 6.0 6.0 Total Expenditure Rs (,000) 1,694 1,823 2,561 2,626 2,561 Grand Total Rs (,000) 2,678 4,907 3,545 5,710 3,545 Payback Period yr 2.9 10.8 1.3 7.6 2.2 IRR (In first 6 years) % 18.3 -12.3 45.5 -5.2 32.7 Discount rate % 10.0 10.0 10.0 10.0 10.0 NPV (In first 6 years) Rs (,000) 150 -116 760 -847 545 NPV/Total Investment Ratio 0.15 -0.37 0.77 -0.27 0.55 * All money values are rounded to nearest thousand.
Socio-polity analysis The study shows that the NMMP support for SHG (commonly formed by small and marginal farmers) could help in improving the socio-economic status as well as help in generating more livelihood opportunities with good financial plans. In addition, the seasonal industry model can reduce the seasonal unemployment problem of the village. Further, this support can also help SHG to develop more competitive financial plans as compared to private entrepreneur owing to a higher subsidy by the government.
Conclusion NMMP provides the opportunities to rural entrepreneurs in the herbal industry. This study focuses on developing the financial plan for rural entrepreneurs to allow them to benefit from NMMP opportunity. The study through a case study of setting up of Phyllanthus amarus MP semi-processing unit at Khirvire village, Akole Taluka, Ahmednagar District, Maharashtra showed that careful financial planning needs to be done before setting up any small-scale herbal industry. Accordingly, a higher subsidy from NMMP will not necessarily mean favorable financial plan. Further, various parameters namely RMCC, ET and LP could play a role in determining the feasibility of the financial plan. Finally, NMMP scheme is more favorable for

International Conference on Inter Disciplinary Research in Engineering and Technology 25
Cite this article as: Rahi Jain, Bakul Rao. “Financial Planning for Small-Scale Herbal Industries based on
National Mission on Medicinal Plant scheme: A Case Study”. International Conference on Inter
Disciplinary Research in Engineering and Technology (2016): 21-25. Print.
economically weaker sections than others but the system is needed to help those people to develop a good financial plan for benefitting from NMMP scheme.
REFERENCES
[1] P. E. Rajasekharan, “Potential of plant derived pharmaceuticals,” Sci. tech Entrep., no. April, pp. 1–8, 2006. [2] R. M. Atlas, Handbook of microbiological media, 4th ed. Washington DC: CRC Press, 2010. [3] D. K. Ved and G. S. Goraya, Demand and Supply of Medicinal Plants in India. Dehradun: Bishen Singh Mahendra Pal Singh
Publishers, Dehradun and FRLHT, Bengaluru, 2008. [4] T. P. Aneesh, M. Hisham, M. S. Sekhar, M. Madhu, and T. V Deepa, “International market scenario of traditional Indian
herbal drugs - India declining,” Int. J. Green Pharm., vol. 3, no. 3, pp. 184–190, 2009. [5] B. K. Kukreja, K. Soni, and K. Kohli, “Current market trends and regulatory aspects of herbal antioxidants and natural
dietary supplements: A boon for health and treatment of diseases.,” World J. Pharm. Pharm. Sci., vol. 4, no. 10, pp. 2373–2406, 2015.
[6] National Medicinal Plants Board, “Centrally sponsored scheme of National Mission on Medicinal Plants: Operational guidelines,” AYUSH, New Delhi, 2008.
[7] X. Zhang, WHO guidelines on good agricultural and collection practices (GACP) for medicinal plants. Geneva, Switzerland, 2003.
[8] World Health Organization (WHO), “WHO Traditional Medicine Strategy 2002-2005,” Geneva, 2005. [9] Planning Commission of India, “9th Five year Plan of India,” vol. Volume II, 1997. [10] R. Jain and B. Rao, “Application of AHP Tool for decision making of choice of technology for extraction of anti-cancer
bioactive compounds of plant origin,” Int. J. Anal. Hierarchy Process, vol. 5, no. 1, pp. 3–29, 2013. [11] R. Jain and B. Rao, “Critical analysis of India’s National Mission on Medicinal Plants (NMMP) in providing access to quality
botanical drugs to improve public health,” J. Ayurveda Integr. Med., vol. 6, no. 3, p. 198, 2015. [12] C. P. Kuniyal, V. K. Bisht, J. S. Negi, V. P. Bhatt, D. S. Bisht, J. S. Butola, R. C. Sundriyal, and S. K. Singh, “Progress and
prospect in the integrated development of medicinal and aromatic plants (MAPs) sector in Uttarakhand, Western Himalaya,” Environ. Dev. Sustain., vol. 17, no. 5, pp. 1141–1162, 2015.
[13] R. Pangriya, “Study of Aromatic and Medicated Plants in Uttrakhand, India: With Focus on Role in Employment Generation and Supply Chain Management,” Int. J. Soc. Sci. Manag., vol. 2, no. 2, pp. 148–156, 2015.
[14] Planning Commission of India, “Report of steering committee on AYUSH for 12th Five Year Plan (2012-17),” New Delhi, 2011.
[15] R. J. Robbins, “Phenolic acids in foods: An overview of analytical methodology,” J. Agric. Food Chem., vol. 51, no. 10, pp. 2866–2887, 2003.
[16] G. Bagchi, P. K. Chaudhari, and S. Kumar, “Cultivation of bhumyamalaki phyllanthus amarus in India.” Central Institute of medicinal and Aromatic Plants, Lucknow, p. 13, 2000.
[17] R. Jain and B. Rao, “Developing Extraction Process for Phenolic Acid Extraction from Phyllanthus Amarus Schum and Thonn for Rural Entrepreneur,” in Technologies for Sustainable Rural Development: Having Potential of Socio-Economic Upliftment (TSRD–2014), 2014, p. 62.
[18] R. Vasudevan, “Review of Schedule XIV to the Companies Act, 1956.”

International Conference on Inter Disciplinary Research in Engineering and Technology 26
Cite this article as: Rahi Jain, Bakul Rao. “Causal-loop and SWOT analysis of Indian Herbal Industry”.
International Conference on Inter Disciplinary Research in Engineering and Technology (2016): 26-30.
Print.
International Conference on Inter Disciplinary Research in Engineering and Technology 2016 [ICIDRET 2016]
ISBN 978-81-929866-0-9 VOL 01 Website icidret.in eMail [email protected] Received 19-December-2015 Accepted 30-December-2015 Article ID ICIDRET006 eAID ICIDRET.2016.006
Causal-loop and SWOT analysis of Indian Herbal Industry
Rahi Jain1, Bakul Rao2
1, 2 Centre for Technology Alternatives for Rural Areas (CTARA), Indian Institute of Technology Bombay (IITB), Powai Mumbai, India
Abstract: Herbal industry is one of the globally and nationally growing industries, but this industry has not been explored adequately in the research domain. This has raised certain problems in the industry effective functioning. This study is focussed on understanding this industry Strength, Weakness, Opportunity and Threats (SWOT). The interactions with experts of this industry are done to develop this sector understanding. This study has identified various factors using causal loop diagram which are playing role in the functioning and the current state of the industry. This study concludes by proposing the Indian Herbal Industry SWOT. Keywords: Small-Scale Industries, Medicinal plant, NMMP.
INTRODUCTION
Herbal industry is growing both globally and nationally with the expected world market size to reach around Rs 334 trillion in 2050 [1]. India is one of the major players in herbal market with expected nutraceutical market of around Rs 0.4 trillion by 2020 [2]. Ved and Goraya (2008), found that the total raw drug consumption in 2005-2006 was 3, 19,500 MT. These raw drugs came from 960 medicinal plants (MPs) out of the 2400 MPs mentioned in codified systems of traditional medicines in India (like Ayurveda, Siddha, Unani) [3]. In India, herbal products have been prevalent since many millennia and has around 9500 herbal industries (Table 1) excluding cottage industries [3]. Despite, such long history of herbal products and significant industrial base, India’s contribution in world herbal market is around 1% and it’s industry suffers from various issue like quality and validation [4].
Table 1
Classification of the herbal units on the basis of their annual turnover Unit Size Annual Turnover (Rs. in Million) Approximate number of units Large >500 14 Medium 50-500 36 Small 10-50 1443 Very Small <10 8000 Total 9493
Source: Ved and Goraya (2008) [3]
Currently, the literature does not provide sufficient insight into the Indian Herbal Industry (IHI). India has made attempts to improve the IHI by launching initiatives like National Mission on Medicinal Plants (NMMP), government supply chain and amala mission, but had unsatisfactory achievements [5]. A study by Jain and Rao (2015) showed the design issues in NMMP operational guidelines [6].
This paper is prepared exclusively for International Conference on Inter Disciplinary Research in Engineering and Technology 2016 [ICIDRET] which is published by ASDF International, Registered in London, United Kingdom. Permission to make digital or hard copies of part or all of this work for personal or classroom use is granted without fee provided that copies are not made or distributed for profit or commercial advantage, and that copies bear this notice and the full citation on the first page. Copyrights for third-party components of this work must be honoured. For all other uses, contact the owner/author(s). Copyright Holder can be reached at [email protected] for distribution.
2016 © Reserved by ASDF.international

International Conference on Inter Disciplinary Research in Engineering and Technology 27
Cite this article as: Rahi Jain, Bakul Rao. “Causal-loop and SWOT analysis of Indian Herbal Industry”.
International Conference on Inter Disciplinary Research in Engineering and Technology (2016): 26-30.
Print.
The studies by Pangriya (2015) and Kuniyal et al (2015) showed implementation issues with various government initiatives implementation in Uttarakhand [5], [7]. A report by the steering committee for AYUSH (2012) indicated that the achievements in the targets of NMMP were far from planned targets [8]. Accordingly, in such a scenario, it is important to understand the IHI functioning for better decision making. This study provides the structural and functional analysis of the IHI.
Method
The study is performed by interacting with various industry, government as well as academic experts on IHI from various organizations and academic institutions (Table 2). The questionnaire is not standardized and is adapted on the field based on the experts response. Some basic set of questions used to initiate the interactions are as follows:
• What is the role of your organization in Indian herbal industry? • What are the strengths and opportunities in the Indian herbal industry?
• What are the weaknesses and threats in the Indian herbal industry?
Table 2 Organization Types of experts involved in the interactions
Organization Organization Type Organization Work A Community Driven Enterprise Small-scale herbal industry B Private Large-scale herbal industry C Public Government Research Institution D Non-government Organization Private Research Institution E Public Government Regulatory Body F Non-Government Organization Rural agriculture livelihoods improvement
Result and Discussion Types of Herbal Industry and Companies IHI can be classified on the basis of the products developed into three types as Herbal cosmetics industry, Allopathy/pharmaceutical industry and Traditional medicinal industry. Herbal cosmetics industry uses the MPs to develop products used for enhancing the body appearance or odor. The pharmaceutical industry uses the MPs to prepare drugs for the allopathy. The traditional medicinal industry deals with products which are formulated based on the ancient texts and scriptures of Indian traditional medicines (ITM) like Ayurveda, Unani, Siddha and Homeopathy. The traditional medicinal industry can be sub-divided into Classical medicinal industry and Patent & Proprietary Industry. The classical medicinal industry prepares the formulations and products mentioned in the classical texts of ITM. The patent & proprietary industry modifies the formulations and products mentioned in the classical texts of ITM to create new products like extracts, nutraceuticals (or, diet supplements) and cosmetics. These herbal products especially traditional herbal products could be made by different type of companies that are classified as Public Listed Companies, Public Unlisted Companies, Private companies and Producer Companies. The companies can also be classified on the basis of company ownership as public owned company, community owned companies and private owned companies. Community owned companies or community driven enterprises (CDE) usually prefer public based unlisted company model owing to three major reasons. Firstly, this is more attractive option as compared to Producer Company for the investors and banks that could improve the company bail out chances. Secondly, a public unlisted company as compared to private company has no restrictions on shareholders number. Thirdly, share trading of public unlisted company as compared to public listed company is difficult that will help in retaining its community based shareholding. This model is preferable for businesses like processing industry with high risk, where investment cost increases with use of processing equipment and marketing. Further, a start-up with limited funds can process plants into limited intermediate forms that limit market. However, in less risky businesses with limited funds requirement, producer company model could be considered. Example, MPs Collection Company deals with raw plants which are used by different industries in different ways so this unit will have broader market. Secondly, it only requires MPs storehouse as MPs drying and separation activities are managed by the supplier (cultivator or collector) before bringing MPs to the collection unit. Herbal Industry Research and Dissemination The research in IHI is done in multiple directions. Some of the major directions of research are herbal products development and validation, MPs processing, cultivation and harvesting and market research [3]. Validation of existing formulations and products is focused on understanding the traditional herbal products [9] and processes from the modern science perspectives [10] and validate the

International Conference on Inter Disciplinary Research in Engineering and Technology 28
Cite this article as: Rahi Jain, Bakul Rao. “Causal-loop and SWOT analysis of Indian Herbal Industry”.
International Conference on Inter Disciplinary Research in Engineering and Technology (2016): 26-30.
Print.
proposed effects of traditional herbal products [11]. The information obtained from scientific understanding and herbal product validation is further used to perform research on improving the traditional processes of developing herbal products [12]. Cultivation-based research is focused on developing better medicinal plant varieties for cultivation [13] as well as developing harvesting practices of MPs [14]. Market based research is focused on understanding the market scenario of the herbal industry in India [1] and various factors which are affecting this industry in India [5]–[7]. In terms of research dissemination, different strategies are used for disseminating different kinds of research work. These strategies include publication in various journals and magazines, preparation of databases and provision of trainings. Training is commonly performed for cultivators to disseminate new cultivation practices and plant varieties with or without a platform for these cultivators to meet with their potential buyers. Database and monograph preparation is performed to disseminate various information like MP cultivation, uses, distribution, characterization [15], herbal products formulations and herbal products quality standards [16]. Role of various institutions in Herbal Industry The herbal industry supply chain can be broadly categorized into three stages. The first stage is the cultivation stage, second stage is the intermediate processing stage and the final stage is the finished product stage. Cultivation stage deals with activities involved in collection or cultivation to the harvesting stage of the MPs. Intermediate processing stage deals with the broad set of activities that can vary from simple drying and powdering of the plant to bioactive compounds extraction and concentration from MPs and depends on the desired end product. Finished product stage deals with the preparation of the finished or the consumer product. The industry for intermediate and finished product can be either same or different. The interactions with the experts to understand the role of different organizations in herbal sector involved in traditional medicines production. Resulted in a causal loop diagram (Fig.1). The potential demand for any industry depends on the overall product demand. The main limiting factor for the herbal industry to achieve its potential is the acceptance of herbal products by the users that is determined by various factors. Some of the factors affecting user product acceptance are product marketing, product acceptance by importing countries and doctors, convenience in product usage and product price. Product marketing and acceptance by countries and doctors depends significantly upon good product validation and standardization research. Convenience in product usage depends on the relative convenience of alternative products. The powder/liquid form of herbal drugs intake is less convenient as compared to tablet form that is easily available in allopathy. Finally, the price plays a role as poor segment of society cannot afford costly drugs. The pricing of the drugs are dependent on the supply-demand curve where higher demand and less supply increase prices, while less demand and more supply decrease prices.
Figure 1. Causal Loop Diagram of IHI
(‘+’: Effect is directly proportional, ‘-’: effect is inversely proportional)
Further, the various factors affecting the cultivation stage also play a role. Some of the important factors are competition from existing crops, supply from wild and research in cultivation. The cultivators will cultivate the MPs only if it is more profitable than their existing crops. Further, the cultivators have to compete with the collectors of MPs who can sell the MPs at lower prices owing to no investment in cultivation. The higher research dissemination on product yield and quality can improve the supply of MPs to processing. This higher research dissemination is dependent upon higher research focus on cultivation stage. This focus of research on cultivation will depend upon the industry demand deficit. Further, community awareness and participation in the herbal industry can also play a positive role in this sector and one of the approaches is CDE.
NMPB
Research
Institution
NMMP
Product Validation and
Standardization Research
+
+
+
Cultivation
Stage Research
Cultivation Stage Research
diseemination
+
+
Acceptance by
countries and doctors
Finished product
marketing
AYUSH product
acceptance
Allopathy acceptance
Ease of product usage
Finished product
selling price
+
-
+ -
Healthcare demand
Healthcare
Demand deficit
Finished product
supply
+
+
-
Finished Product
industry
+
+
Product development
+
+
Finished product
research dissemination+
+
Financial Support
+
Semi-finished industry
+
Semi-finished
product demand
Semi-finished
product supply
Semi-fnished
product deficit
Semi-finished
product price
+
+
+
+
-
+
+
++
+
++
+
+
+
+
Raw Material demand
Raw material supplyRaw material deficit
Raw material price
+
-+
+
+
Cultivators and
Collectors+ +
+
+
+
+
+

International Conference on Inter Disciplinary Research in Engineering and Technology 29
Cite this article as: Rahi Jain, Bakul Rao. “Causal-loop and SWOT analysis of Indian Herbal Industry”.
International Conference on Inter Disciplinary Research in Engineering and Technology (2016): 26-30.
Print.
Further, the support of government at all stages is considered favourable for the industry. The government support is expected in the form of better policies and regulation, linkages with the foreign countries and research. One of the government body National Medicinal Plant Board (NMPB) is involved in promoting this sector by providing financial assistance to setup the industries, cultivation zones, research and research dissemination. Financial assistance for industries, cultivation and research dissemination is done through NMMP. SWOT analysis The IHI Strength, Weakness, Opportunity and Threat (SWOT) analysis (Fig.2) is performed based on the interactions with experts. One of the major strengths of the industry is the availability of the large supplier base that can provide the raw materials and semi-processed products to the market. Secondly, the AYUSH product development cycle and cost is much smaller as compared to conventional pharmaceutical products. Thirdly, the information about the product formulations and preparations is available in various traditional manuscripts and these products are inherently considered safe. Finally, the stance of the government is considered friendly. Further, certain opportunities exist in this sector that can be important. It can provide avenues for creating entrepreneurs and employment creation especially with the positive government support. The availability of a large number of potential users after the AYUSH popularization can provide large market base both nationally and globally. It provides the opportunity to use the natural resources available to mankind that would have otherwise degenerated.
Figure 2. SWOT Analysis of IHI
However, the herbal industry has certain weaknesses that need to be addressed. In general, the industry has weak backward linkages at affects supply chain like inadequate backward linkages such as contract production and investment from finished industry to minimize the business risk. Further, despite a friendly government, industry does not find the policies and regulation adequately appropriate for sector growth. Another major weakness of the sector is the raw material supply because the MPs yield is nature dependent. This industry is marred with high investment cost, patent issues and low profit margin that make the small-scale industries sustenance tough. The industry for its sustenance need to be export oriented, but product variability and poor tie-ups with foreign countries makes it challenging to target international market. This product variability is affected due to lack of process standardization. Finally, inadequate interest regarding scientific studies impacts the product development, validation and standardization. Further, the several threats loom over the industry. Firstly, the decreasing cultivation interest of the farmers threatens the future quality raw materials supply. In addition, the more profitable crops can make the MPs cultivation less attractive for cultivators. Secondly, the future supply of MPs from collectors is threatened by the biodiversity disappearance. Finally, increasing global competition along with poor government regulation and management, lack of scientific validation of product and chemical methods of production threatens the industry international market presence.

International Conference on Inter Disciplinary Research in Engineering and Technology 30
Cite this article as: Rahi Jain, Bakul Rao. “Causal-loop and SWOT analysis of Indian Herbal Industry”.
International Conference on Inter Disciplinary Research in Engineering and Technology (2016): 26-30.
Print.
CONCLUSION
The study provided the overview on the current IHI regarding the type of companies and research performed. Further the study provided the various factors that are affecting this sector functioning through the causal loop diagram. This study concluded with the SWOT analysis of the sector.
REFERENCES
[1] T. P. Aneesh, M. Hisham, M. S. Sekhar, M. Madhu, and T. V Deepa, “International market scenario of traditional Indian herbal drugs - India declining,” Int. J. Green Pharm., vol. 3, no. 3, pp. 184–190, 2009.
[2] B. K. Kukreja, K. Soni, and K. Kohli, “Current market trends and regulatory aspects of herbal antioxidants and natural dietary supplements: A boon for health and treatment of diseases.,” World J. Pharm. Pharm. Sci., vol. 4, no. 10, pp. 2373–2406, 2015.
[3] D. K. Ved and G. S. Goraya, Demand and Supply of Medicinal Plants in India. Dehradun: Bishen Singh Mahendra Pal Singh Publishers, Dehradun and FRLHT, Bengaluru, 2008.
[4] National Medicinal Plants Board, “Centrally sponsored scheme of National Mission on Medicinal Plants: Operational guidelines,” AYUSH, New Delhi, 2008.
[5] R. Pangriya, “Study of Aromatic and Medicated Plants in Uttrakhand, India: With Focus on Role in Employment Generation and Supply Chain Management,” Int. J. Soc. Sci. Manag., vol. 2, no. 2, pp. 148–156, 2015.
[6] R. Jain and B. Rao, “Critical analysis of India’s National Mission on Medicinal Plants (NMMP) in providing access to quality botanical drugs to improve public health,” J. Ayurveda Integr. Med., vol. 6, no. 3, p. 198, 2015.
[7] C. P. Kuniyal, V. K. Bisht, J. S. Negi, V. P. Bhatt, D. S. Bisht, J. S. Butola, R. C. Sundriyal, and S. K. Singh, “Progress and prospect in the integrated development of medicinal and aromatic plants (MAPs) sector in Uttarakhand, Western Himalaya,” Environ. Dev. Sustain., vol. 17, no. 5, pp. 1141–1162, 2015.
[8] Planning Commission of India, “Report of steering committee on AYUSH for 12th Five Year Plan (2012-17),” New Delhi, 2011.
[9] A. K. Kiemer, T. Hartung, C. Huber, and A. M. Vollmar, “Phyllanthus amarus has anti-inflammatory potential by inhibition of iNOS , COX-2 , and cytokines via the NF-kB pathway,” J. Hepatol., vol. 38, pp. 289–297, 2003.
[10] R. Jain and P. Venkatasubramanian, “Proposed correlation of modern processing principles for Ayurvedic herbal drug manufacturing: A systematic review,” Anc. Sci. Life, vol. 32, no. 4, pp. 205–211, 2015.
[11] J. Bhargava and Z. Y. Khan, “Comparative Evaluation of the Efficacy and Side Effects of Imipramine , Sertraline and an Ayurvedic Formulation in Patients of Depression,” J. Clin. Diagnostic Res., vol. 6, no. 2, pp. 220–225, 2012.
[12] I. R. Kubra, D. Kumar, L. Jagan, M. Rao, and P. Products, “Emerging Trends in Microwave Processing of Spices and Herbs,” Crit. Rev. Food Sci. Nutr., vol. Accepted M, no. December, pp. 1–50, 2015.
[13] G. Bagchi, P. K. Chaudhari, and S. Kumar, “Cultivation of bhumyamalaki phyllanthus amarus in India.” Central Institute of medicinal and Aromatic Plants, Lucknow, p. 13, 2000.
[14] P. S. Kakaraparthi, K. V. N. S. Srinivas, J. K. Kumar, A. N. Kumar, D. K. Rajput, and S. Anubala, “Changes in the essential oil content and composition of palmarosa (Cymbopogon martini) harvested at different stages and short intervals in two different seasons,” Ind. Crops Prod., vol. 69, pp. 348–354, 2015.
[15] ENVIS Centre, “Encyclopedia on Indian Medicinal Plants,” FRLHT. [Online]. Available: http://envis.frlht.org/indian-medicinal-plants-database.php. [Accessed: 12-Dec-2015].
[16] Indian Drug Manufacturer’s Association, Indian Herbal Pharmacopoeia Revised New Edition 2002. Mumbai, 2002.

International Conference on Inter Disciplinary Research in Engineering and Technology 31
Cite this article as: Neha Sah, Alka Goel, Arun Kumar Chaudhary. “Physical and Morphological Properties
of Thermoset Composites Reinforced with Jute Preforms”. International Conference on Inter Disciplinary
Research in Engineering and Technology (2016): 31-36. Print.
International Conference on Inter Disciplinary Research in Engineering and Technology 2016 [ICIDRET 2016]
ISBN 978-81-929866-0-9 VOL 01 Website icidret.in eMail [email protected] Received 20-December-2015 Accepted 30-December-2015 Article ID ICIDRET007 eAID ICIDRET.2016.007
Physical and Morphological Properties of Thermoset Composites Reinforced with Jute Preforms
Neha Sah1, Alka Goel2, Arun Kumar Chaudhary3
1Ph. D Student, 2Professor, 3Assistant Professor 1, 2,3G.B.Pant University of Agriculture & Technology. Pantnagar, Uttarakhand
Abstract: Jute, an eco-friendly and affordable fiber grown profusely in India, possess unique combination of properties suited for the manufacture of non-textile products. However, its contribution for technical applications is limited at present. In this research, an effort has been made to investigate the physical and morphological properties of jute fiber when incorporated in epoxy matrix with a view to widen the share of jute fibers for engineered applications. Composite specimens containing nonwoven jute mat and alkali treated short jute fibers with different weight percentages (1, 2 wt%) were made using epoxy resin. The water absorption, thickness swelling (TS) and morphology [scanning electron microscopy (SEM)] tests of the bio composites were performed. As the fiber fraction ratio was increased the values for water absorption (WA) and thickness swell (TS) were found to be increased. The samples reinforced with 2 wt. percent fiber fractions showed maximum WA and TS in both water environments. Keywords: composites, nonwovens, jute fiber, physical properties, morphological properties.
INTRODUCTION
Fiber-reinforced polymer composite materials are fast gaining ground as preferred materials in wide gamut of industries ranging from everyday consumer products to the sophisticated niche applications. They are mostly and widely made from man-made fibres i.e. glass fibre, carbon fibre etc. embedded in polymer matrix system. The reason for excessive utilization of these fibers lies in their excellent mechanical performance and ease of processing. However, their life cycle performance is very dubious. They are extracted from finite petroleum resources, consume huge energy during manufacturing, price high and at disposal stage disturb the environmental hygiene. But in the current scenario due to strong regulations and criteria for cleaner and safer environment, there is a trend of valuing materials which are concerned with aspects of being renewable, biodegradable and recyclable. The natural fibers in this context are just perfect. Besides ecological consideration, the unique combination of properties offered by natural fibers at relatively low cost are the major driving force to prefer natural fibers over their synthetic counterparts for composite applications. They are low-density material yielding comparatively lightweight composites with high specific properties and therefore offer a high potential for an outstanding reinforcement in lightweight structures [1]. India is bestowed with profuse availability of variety of natural fibers. Among them jute fibers deserve special mention. According to Commission for Agricultural Costs and Prices (2013), globally, India is the largest producer of raw jute (jute, kenaf and allied fibres) with a 55.7 percent share in global production in triennium 2011-12 followed. Jute industry provides direct employment to 2.0 lakh workers in organized mills and in diversified units including tertiary sector and allied activities. It supports the livelihood of around 4.0 million farm families [2]. Despite such remarkable contribution, the full potential of jute fiber is still untapped. The jute product profile is very much restricted to packaging materials for bagging of foodgrains. Some other minor applications involved jute ropes, mats etc. Owing to the properties of this golden fiber, there is needed to create diversified range of jute products to scale up its share for technical applications also.
This paper is prepared exclusively for International Conference on Inter Disciplinary Research in Engineering and Technology 2016 [ICIDRET] which is published by ASDF International, Registered in London, United Kingdom. Permission to make digital or hard copies of part or all of this work for personal or classroom use is granted without fee provided that copies are not made or distributed for profit or commercial advantage, and that copies bear this notice and the full citation on the first page. Copyrights for third-party components of this work must be honoured. For all other uses, contact the owner/author(s). Copyright Holder can be reached at [email protected] for distribution.
2016 © Reserved by ASDF.international

International Conference on Inter Disciplinary Research in Engineering and Technology 32
Cite this article as: Neha Sah, Alka Goel, Arun Kumar Chaudhary. “Physical and Morphological Properties
of Thermoset Composites Reinforced with Jute Preforms”. International Conference on Inter Disciplinary
Research in Engineering and Technology (2016): 31-36. Print.
Jute fibre has some unique physical properties like high tenacity, bulkiness, sound & heat insulation property, low thermal conductivity, antistatic property etc. suited for the manufacture of non-textile products such as fiber reinforced polymer composites. Fibres can provide reinforcement in polymer matrix in different forms and structures. One of the most economical techniques of using the fibre inside a polymer matrix is using of “Textile Preforms”. Textile preforms are structures made from fibre strands using different traditional textile technique and machinery. This is the most effective way of handling fibres without any distortions before impregnation in resin [3]. In this study, composites made by using non-woven mat and carded jute sliver with different weight percentages as reinforcements have been used to characterize their water absorption and thickness swell behaviour in two water environments namely rain and tap water. High moisture uptake is a major demerit of lignocellulosic fibers that may weaken the interfacial bonding between polymer matrix and fibers. To overcome this problem the raw jute fibers were given alkali treatment before being fabricated to composite.
Materials and Methods Materials Raw jute fibres were procured from Basu Jutex Pvt. Ltd., Kolkata (India) at an expense of Rs.70/kg. Thermoset epoxy resin Araldite CY-230 and hardener HY-951, purchased from M/s CIBATUL Limited, Mumbai (India) were used as the matrix system to produce natural fiber reinforced composites. Methods Processing and treatment of fibres Raw jute fiber bales were opened, washed and treated with 1% NaOH solution for one hour at room temperature to improve mechanical properties. The fibres were then washed several times to remove any alkali traces and dried at room temperature for 24 hours. The length of dried fibers were then cut to smaller length (3 inch) and later passed through carding machine to parallelize the entangled mass of fibers. Nonwoven mat was prepared by thermal bonding technique using low melt fiber as bonding medium. The properties of jute fibers (raw and alkali treated) have been shown in Table 1.
Fig. 1 (a) Carded jute fibers Fig. 1 (b) Nonwoven jute mat
Composite fabrication The jute fibre reinforced polymer matrix composites were fabricated by using hand lay-up technique. Thermoset epoxy resin Araldite
CY-230 and hardener HY-951 were used as the matrix system. Jute fibers (carded form) and jute thermo-bonded nonwoven mat were used as reinforcement media with epoxy resin as the matrix material. Total three types of composite samples were made with selected
reinforcement type. The code designation of the composites developed for this study is given in Table 2.
The mold of (160x160x10) mm3 was made for casting the composites. An accurate amount of epoxy resin was pre-heated to the temperature of 90 ± 100C and then allowed to cool down to the temperature of 400C. At this temperature the hardener (10% by
weight of resin) was added and stirred thoroughly to minimize air entrapment. The mixture was then immediately used for casting. At first mold release gel was uniformly spread over the mold base than half of matrix was poured on the mold base, the layer of fibers was
placed over it and gently pressed using paint roller and coated with rest of the resin mixture. Utmost care was taken to avoid
formation of air bubbles. The samples were allowed to cure for about 48 hours at room temperature. Similar procedure was adapted for the preparation of the jute nonwoven mat reinforced polymer composite.

International Conference on Inter Disciplinary Research in Engineering and Technology 33
Cite this article as: Neha Sah, Alka Goel, Arun Kumar Chaudhary. “Physical and Morphological Properties
of Thermoset Composites Reinforced with Jute Preforms”. International Conference on Inter Disciplinary
Research in Engineering and Technology (2016): 31-36. Print.
Fig. 2 Composite samples
Water absorption test
Specimens were immersed into two different aqueous environments, which were rain water (RW) and tap water (TW). These two
mediums were selected as they relate closely to the real life situations where these samples can find applications. The pH and
conductivity of rain and tap water were found to be 7.7, 0.077 ms/cm and 8.07, 0.314 ms/cm respectively. For the water absorption measurements, the specimens were withdrawn from the water after a predetermined time interval, wiped dry to remove surface
moisture and then weighted. The water absorption (WA) of each specimen was calculated from Equation (1) as per ASTM D570
standard.
Where W1 and W2 are the initial and wet specimen weight (g) after N hours of soaking time respectively.
Fig. 3 Water absorption and thickness swelling test
Thickness swelling test
This test was used to measure the dimensional change in composite specimens by immerging them in two different aqueous environments namely rain water and tap water. Before immerging the test specimens into water, the thickness of each sample was
measured and after pre-determined time interval of 6 hours the samples were taken out, blotted to remove surface water and thickness
value was taken. The test was continued till constant readings were obtained. Thickness swelling (TS %) was calculated as per the Equation (2).
(2)
Where T2 (mm) is the thickness after soaking and T1 (mm) is the thickness before soaking.
100)(
1
12×
−=
W
WWWA (1)
100)(
1
12×
−=
T
TTTS

International Conference on Inter Disciplinary Research in Engineering and Technology 34
Cite this article as: Neha Sah, Alka Goel, Arun Kumar Chaudhary. “Physical and Morphological Properties
of Thermoset Composites Reinforced with Jute Preforms”. International Conference on Inter Disciplinary
Research in Engineering and Technology (2016): 31-36. Print.
SEM
Dispersion state of jute fibers in epoxy resin which plays an important role on the WA and TS of the bio composite was observed with SEM analysis. The analysis was done at the Institute Instrumentation Centre, IIT, Roorkee. Square samples were cut from the tensile fractured surface and gold coated before the photomicrographs were taken to avoid any consequence associated with sample charging.
The samples were then placed inside a chamber in which an electron beam fell on the material with 10 kV accelerated voltage.
Fig. 4 SEM set up
Results and discussion
The results obtained have been reported and discussed as below:
Water absorption test
The percentage of weight gain in various composites with time duration in rain and tap water is shown in Fig. 5 and Fig. 6 respectively.
All the three different kinds of composites showed gradual increase in water absorption with time in both water environments. The maximum water absorption [1.39% (RW), 1.44% (TW)] was obtained at 2 wt% fibre loading and the minimum values were recorded
for nonwoven mat reinforced composites [1.12% (RW), 1.17% (TW)] irrespective of water type. There was a sudden increase in
water absorption at the initial stage for the samples reinforced with different percentages of carded slivers with slightly higher absorption rates in tap water compared to rain water. The water absorption behaviour of the composites reinforced with nonwoven jute mat showed no water uptake for initial 18 hours in tap water and slight absorption (0.28%) in rain water. In nearly all cases the
water absorption process was quick at the beginning and levelled off for some length of time where it approached to equilibrium. Water uptake reached the saturation limit in about 42 root hours in all the samples.
It was found that as the fiber loading ratio was increased water uptake was also increased. This behaviour was possibly due the
introduction of voids or microgaps introduced between the polymer chains with increased fiber fractions. Being hydrophilic in nature,
the jute fibers absorb moisture which causes swelling of the fibers resulting in microgaps in the matrix fiber interface. However, due to
alkali treatment the absorption was not way high as usually exhibited by untreated natural fiber composites and reached saturation soon. The mat reinforced composites took up less water with time as compared to fiber reinforced samples. The reason behind this may lie in the intact structure of the thermal bonded nonwoven mat that resulted in good adhesion with epoxy resin, leading to less
water absorption.
Three main reasons because of which water can reside in natural fiber reinforced composite are the voids present in the composites, interfacial adhesion between the fibre and matrix and type of fibres reinforced [4]. A similar study was conducted to study the effects
of number of layers of woven jute fabric on moisture absorption, thickness swelling, volume swelling, and density as a function of
immersion time and it was observed that the moisture diffusion rate into composites increases with an increase in the jute-fiber-to-
epoxy ratio. The type of epoxy used as the matrix appeared to have an influence on the moisture absorption percentages of the composites. The study showed that both water absorption and swellings were higher in the bio-epoxy parts compared to the epoxy
parts. The swelling of composites was correlated with an increase in diameters of jute fiber in water [5].

International Conference on Inter Disciplinary Research in Engineering and Technology 35
Cite this article as: Neha Sah, Alka Goel, Arun Kumar Chaudhary. “Physical and Morphological Properties
of Thermoset Composites Reinforced with Jute Preforms”. International Conference on Inter Disciplinary
Research in Engineering and Technology (2016): 31-36. Print.
Thickness swelling test
The thickness swelling results are shown in Fig. 7 and Fig. 8 respectively. It can be seen that the thickness swelling for composites followed a similar trend to the water absorption behaviour, increasing with immersion time until a saturation condition was obtained.
It is clear from the figures that the dimensional change is negligible in initial 12 hours for all the samples irrespective of water
environments. The highest rate of thickness swelling was observed in samples with 2 wt. percent fiber loading which circuitously confirmed the presence of higher number of voids in the system. In contrast, thickness swelling of nonwoven mat reinforced samples was lowest (value 0%), in other words, there was no thickness swelling in these samples in both the water environments. It may be
due to the compact packing of fibers in the mat structure resulting from the particular bonding technique that limit the water absorption by the samples. All the samples attained the saturation limit for thickness swell nearly in about 36 root hours.
A study conducted to compare the thickness swelling of woven jute fiber based hybrid composites with chopped hybrid composites
concluded that woven jute fiber based hybrid composite showed more thickness swelling which indirectly indicates higher void content
in the system, allowing water to easily diffuse into the composites through void spaces [6]. In another report the water absorption
(WA) and thickness swell (TS) behaviour of biocomposites containing different weight percentages of almond shell particle and coconut fiber was observed. The influence of the addition of coconut fiber was more for both WA and TS as compared to almond shell
particles possibly due to the presence of a higher percentage of α-cellulose in coconut fiber. The thickness swell for all types of biocomposties were negligible for the initial soaking period of 4 hours which later found to be increased with soaking time [7]. All
these studies provide some rational grounds necessary to define the current behaviour of thermoset composites reinforced with jute
preforms when subjected to water absorption and thickness swelling tests.
SEM The micrographs obtained from scanning electron microscopy are shown in Fig. 9 (a-c).
It can be seen from Fig. 9a that there were evidence of matrix cracking and fiber debonding at some places. However no sign of cavities or voids were seen which indicate better mixing of fiber in the matrix.
Fig. 9a SEM micrograph for 1 wt % of jute fibers in epoxy resin
According to the SEM fractograph (Fig. 9b), debonding between both the phases along with matrix cracking predominate in fracture surface.
Fig. 9b SEM micrograph for 2 wt % of jute fibers in epoxy resin
Presence of voids can also be seen which shows that increasing the fiber percentage in the matrix reduced uniformity between fibers
and matrix. This led to the poor mechanical properties and more water absorption and thickness swelling. It has been stated that small
amount of moisture if present can reduce the bond strength between the phases resulting in differential strain which is created by the expansion force exerted by the liquid while stretching polymeric chains and induce additional residual stresses [8].

International Conference on Inter Disciplinary Research in Engineering and Technology 36
Cite this article as: Neha Sah, Alka Goel, Arun Kumar Chaudhary. “Physical and Morphological Properties
of Thermoset Composites Reinforced with Jute Preforms”. International Conference on Inter Disciplinary
Research in Engineering and Technology (2016): 31-36. Print.
SEM micrograph of jute mat reinforced composite specimen (Fig. 9c) showed fibre fracture along with few incidence of fiber pull-out.
The existence of cracks around the broken fiber sites indicating the adherence of epoxy to fiber. This could be attributed to good bonding between fabric and matrix
Fig. 9c SEM micrograph for jute mat rooted in epoxy resin
Conclusion
The effect of fiber geometry was clearly observed on the water absorption and thickness swell behaviours of the samples. As the fiber fraction ratio was increased the values for water absorption (WA) and thickness swell (TS) were found to be increased. The samples
reinforced with 2 wt. percent fiber fractions showed maximum WA and TS in both water environments. However, the rate of water
absorption was slightly high with tap water as compared to rain water for all the samples. Jute mat reinforced composites absorbed less water with time as compared to fiber reinforced samples and were found to have no dimensional change in both the water environments. The alkali treatment given to the fibers played a key role in limiting the undue absorption as well as swelling of the
composites.
Acknowledgement
The Ph.D. INSPIRE fellowship sponsored by Department of Science and Technology (DST) is duly acknowledged.
References
[1] Begum K and Islam MA. Res. J. Eng. Sci. 2013, 2, 46-53.
[2] Commission for Agricultural Costs and Prices. 2013.
http://cacp.dacnet.nic.in/ViewReports.aspx?Input=2&PageId=38&KeyId=382 Accessed August 2015
[3] Hasan R and Rayyaan R. International Journal of Scientific and Research Publications 2014, 4, 1-5.
[4] Pandian A, Vairavan M, Thangaiah WJJ and Uthayakumar, M. 2014.
http://www.hindawi.com/journals/jcomp/2014/587980/ Accessed August 2015.
[5] Masoodi, R and Pillai, KM. J. Reinf. Plast. Compos. 2012, 31, 285–294.
[6] Khalil, HPSA.; Jawaid, M. and Bakar, A.A. BioResources 2011, 6, 1043-1052.
[7] Chaudhary AK, Gope PC, Singh VK. Sci. Eng. Compos. Mater. 2014, 22, 375–382.
[8] Deb S K and Chiranjeevee. 2008-09. http://ethesis.nitrkl.ac.in/195/1/failure_modes_by_SEM.pdf Accessed December 2015.

International Conference on Inter Disciplinary Research in Engineering and Technology 37
Cite this article as: Ranaditya Haldar, Srinivasan Aruchamy, Anjali Chatterjee, Partha Bhattacharjee.
“Diabetic Retinopathy Image Enhancement using Vessel Extraction in Retinal Fundus Images by
programming in Raspberry Pi Controller Board”. International Conference on Inter Disciplinary Research
in Engineering and Technology (2016): 37-42. Print.
International Conference on Inter Disciplinary Research in Engineering and Technology 2016 [ICIDRET 2016]
ISBN 978-81-929866-0-9 VOL 01 Website icidret.in eMail [email protected] Received 20-December-2015 Accepted 30-December-2015 Article ID ICIDRET008 eAID ICIDRET.2016.008
Diabetic Retinopathy Image Enhancement using Vessel Extraction in Retinal Fundus Images by programming in
Raspberry Pi Controller Board
Ranaditya Haldar1, Srinivasan Aruchamy2, Anjali Chatterjee3, Partha Bhattacharjee4 1,2,3,4 Cybernetics Department, CSIR-Central Mechanical Engineering Research Institute,Durgapur
Abstract: Diabetic retinopathy is one of the leading complication of diabetes and also one of the leading preventable blindness. Early diagnosis and treatment may prevent such condition or in other words, annoyance of the disease may be overcome. The fundus images produced by automated fundus camera are often noisy making it difficult for doctors to precisely detect the abnormalities in fundus images. In the present paper, we propose to use vessel extraction of Retinal image enhancement and implemented in Raspberry Pi board using opencv library for faster execution and cost effective processing unit which helps during mass screening of diabetic retinopathy. The effectiveness of the proposed techniques is evaluated using different metrics and Micro-aneurysms. Finally, a considerable improvement in the enhancement of the Diabetic Retinopathy images is achieved. Keywords: Diabetic Retinopathy, Raspberry Pi Controller Board, Retinal Image enhancement.
INTRODUCTION
Diabetic Retinopathy (DR) is one of the most common eye diseases which occur due to diabetes mellitus. It damages the tiny blood vessels inside the retina resulting loss of vision. The risk of the disease increases with age and therefore, middle aged and older diabetics are prone to Diabetic Retinopathy [1].Color retinal fundus [2] images are used by ophthalmologists to study this disease. During mass screening, it is very important to clearly detect and distinguish the blood leakages, haemorrhages and lesions amongst the numerous blood vessels present in eye [1]. Micro-aneurysms are small swellings which generates on the side of the tiny blood vessels in the retina. These swellings may rupture and allow blood to leak into the nearby tissue. The size of a typical micro-aneurysm is from 20-200 micron [3].Regarding the enhancement of retinal images few studies have been published yet now. Diabetic Retinopathy Image Enhancement using CLAHE by Programming TMS320C6416 is proposed by Srinivasan A et al [4].Retinal image enhancement using curvelet is proposed by Candes et al [5]. Miri et al [6] used multi-resolution tools using a non-linear function for modifying the curvelet coefficients. This techniques is based on matched filtering in enhancing low contrast blood vessels over a limited area but the computation becomes complex with image size [7, 8]. Piezeret al. [9] uses Adaptive Histogram Equalization (AHE) to overcome the drawbacks of Histogram Equalization, especially for images with varying contrast. They explained the diagnostic capability of AHE on chest CT scan. Region-growing [10] algorithm fully delineates each marked object and subsequent analysis of the size, shape, and energy characteristics of each candidate results in the final segmentation of micro-aneurysms. While this is a significant improvement, the region growing algorithm remains sub optimal. Kim et al. [11] used brightness preserving bi histogram equalization to overcome the drawback of changing brightness of an image. It is being observed that in most of their studies, they implemented their work in PC based simulation software. The idea behind the present work is to exploit the effectiveness of blood vessel extraction as an early detection of retinopathy and also finding out the micro-aneurysms of diabetic patients and implementing in real time system like
This paper is prepared exclusively for International Conference on Inter Disciplinary Research in Engineering and Technology 2016 [ICIDRET] which is published by ASDF International, Registered in London, United Kingdom. Permission to make digital or hard copies of part or all of this work for personal or classroom use is granted without fee provided that copies are not made or distributed for profit or commercial advantage, and that copies bear this notice and the full citation on the first page. Copyrights for third-party components of this work must be honoured. For all other uses, contact the owner/author(s). Copyright Holder can be reached at [email protected] for distribution.
2016 © Reserved by ASDF.international

International Conference on Inter Disciplinary Research in Engineering and Technology 38
Cite this article as: Ranaditya Haldar, Srinivasan Aruchamy, Anjali Chatterjee, Partha Bhattacharjee.
“Diabetic Retinopathy Image Enhancement using Vessel Extraction in Retinal Fundus Images by
programming in Raspberry Pi Controller Board”. International Conference on Inter Disciplinary Research
in Engineering and Technology (2016): 37-42. Print.
raspberry pi controller board to avoid the PC based simulation.
Fig.1. Diabetic Retinopathy effected Eye.
APPROACH
Proposed algorithm in Raspberry Pi controller board. Fig 2 shows the schematic view of our proposed method. Opencv Library is used with C++ language for programming.
Fig.2. Flow chart of the proposed method.
IMAGE ENHANSMENT TECHNIQUE
The flow chart of the proposed approach is shown in Fig 2. It loads a retinal color image as a input image and after that it will convert this RGB image to Gray scale image. This algorithm is tried to find out the micro-aneurysms after the said enhancement techniques and
also tries to find The Absolute Mean Brightness Error (AMBE), Peak Signal to Noise Ratio (PSNR).
Preprocessing
Loaded input image, I, has to be first converted to a gray scale image. Let J is the said gray scale image, and R, G, B be the three color channels of the image I . Classically, the gray-scale image J is obtained by a linearly weighted transformation:
J(x; y) = α.R(x; y) + β. G(x; y) + γ.B(x; y)............... (1)

International Conference on Inter Disciplinary Research in Engineering and Technology 39
Cite this article as: Ranaditya Haldar, Srinivasan Aruchamy, Anjali Chatterjee, Partha Bhattacharjee.
“Diabetic Retinopathy Image Enhancement using Vessel Extraction in Retinal Fundus Images by
programming in Raspberry Pi Controller Board”. International Conference on Inter Disciplinary Research
in Engineering and Technology (2016): 37-42. Print.
Where α, β and γ are the weights corresponding to the three color channels, R, G, and B, respectively, and (x; y) are the pixel location
in the input image. The most popular method selects the values of α, β and γ by eliminating the hue and saturation information while retaining the luminance. To this end, a color pixel is first transformed to the so-called NTSC color space from the RGB space by the standard NTSC conversion formula:
.............................................(2)
where Y, I and Q represents the NTSC luminance, hue, and saturation components, respectively. Then the luminance is used as the
gray-scale signal: J(x; y) = Y(x; y). Thus we have α= 0:299;β=0:587; γ= 0:114:
In this work, we research the RGB-to-gray conversion ofEq.1, which to the best knowledge of the authors, and attempt to find new
values of (α,β,γ)which are optimal for our work. Our research results reveal that 1) to get a strong gray-scale image, one should select
the values of (α,β,γ) that satisfy α>β>γ2).
It is necessary to intensify the contrast of the image to provide a better processing for subsequent image analysis steps. Contrast
Limited Adaptive Histogram Equalization [12] is a common pre-processing method for processing medical image, as it is very effective
in making the region of interest more visible. This method is formulated based on dividing the image into several non-overlapping regions of almost equal sizes. Local histogram equalization is performed at every disjoint region. To eliminate the boundaries between
the regions, a bilinear interpolation has also been applied. In this stage, only the gray levels processed because MAs appear with highest contrast in this particular channel [13].
Blood Vessel Extraction
The segmentation of retinal blood vessels is done by a thresholding method proposed by Saleh et al [14]. From the pre-processed
fundus image the background exclusion is performed by subtracting the original intensity image from the average filtered image so that the foreground objects may be more easily examined. Isodata technique is used to provide an automatic threshold in a binary image but
this technique runs through number of iterations until the proper threshold value is achieved. So, in this proposed techniques local
entropy thresholding [15] has been implemented. This process yields an optimum threshold value by choosing the pixel intensity from
the images histogram that exhibits the maximum entropy over the whole image. Let h(i) be the value of a normalized histogram and it takes the integer values from 0 to 255. The normalized histogram can be expressed as
(1)
Entropy of white pixels is given by the following equation:
Hw(t)= - (2)
Entropy of black pixels is given by the following equation:
HB(t)=- (3)
Optimal threshold value be selected by maximizing the entropy of black and white pixels
t= 0……..max (4)
The resulting binary is generated from the following form:
B(x,y)= (5)
Where h(x,y) is the background excluded image

International Conference on Inter Disciplinary Research in Engineering and Technology 40
Cite this article as: Ranaditya Haldar, Srinivasan Aruchamy, Anjali Chatterjee, Partha Bhattacharjee.
“Diabetic Retinopathy Image Enhancement using Vessel Extraction in Retinal Fundus Images by
programming in Raspberry Pi Controller Board”. International Conference on Inter Disciplinary Research
in Engineering and Technology (2016): 37-42. Print.
OUTPUT AND ANALYSIS
Nearly 55 DR images are tested with the proposed image enhancement techniques. The input images were taken from Messidor digital retinal database [17]. The Absolute Mean Brightness Error (AMBE) is calculated using the difference between original and enhanced image AMBE(X,Y)=|XMYM|, where XM is the mean of the input image and YM is the mean of the output image. Smaller value of AMBE indicates lesser loss of information during enhancement. Therefore in terms of AMBE, CLAHE gives the best result compared to Histogram equalization method as shown in the scatter plot of AMBE values in Fig. 3. A large value of Peak Signal to Noise Ratio (PSNR) indicates better contrast enhancement in the output image as shown in Fig 5. The PSNR is computed as follows:
Where MSE is termed as mean square error and it is defined as:
PSNR is used to evaluate the degree of contrast enhancement. Greater PSNR indicates better image quality. So, in terms of PSNR also CLAHE is showing the best result in the scatter plot shown in Fig 4.
Fig.3. Scatter Plot of AMBE values of enhanced images Fig.4. Scatter plot of PSNR values of enhanced images
Fig.5. (a) RGB image (b) Gray level image (c) CLAHE
(d) Extracted blood Vessel with MA
Abbreviations and Acronyms
MA, AMBE, PSNR.
EXPERIMENTAL SETUP
The proposed method has been deployed in raspberry Pi controller board to ensure faster execution so that it will be helpful for mass screening of diabetic retinopathy.

International Conference on Inter Disciplinary Research in Engineering and Technology 41
Cite this article as: Ranaditya Haldar, Srinivasan Aruchamy, Anjali Chatterjee, Partha Bhattacharjee.
“Diabetic Retinopathy Image Enhancement using Vessel Extraction in Retinal Fundus Images by
programming in Raspberry Pi Controller Board”. International Conference on Inter Disciplinary Research
in Engineering and Technology (2016): 37-42. Print.
Fig.6. Experimental setup with Raspberry pi controller board
The raspberry pi controller board design is based on around a Broadcom BCM2835 SoC, which includes an ARM1176JZF-S 700MHz processor, Video Core IV GPU, and 512Mbytes of RAM with highly developer friendly Debian GNU/Linux operating system and Four USB port. A 4-pole 3.5mm stereo audio jack with composite video output and microSD, MMC, SDIO flash memory card slot is also attached with this board.
CONCLUSION
In this paper, a hardware based frame work of image enhancement has been presented. Number of DR images obtained from practical experiments has been presented. It is found from the experimental results that the proposed method performs better in terms of computation other than simulation based software. In our future work colour images will be taken using real time camera attached with raspberry pi controller board and new parameters will be considered for the evaluation of enhancement techniques.
ACKNOWLEDGMENT
The authors would like to thank Dr. Debdulal Chakraborty, Consultant (Incharge Vitreo Retina Services), Disha Eye Hospital Kolkata for his help to this research work and Messidor Digital Retinal Database for providing retina images.
REFERENCES
[1] K. J. Frank and J. P. Dieckert, “Clinical review of diabetic eye disease: A primary care perspective,” Southern Medical Journal, vol. 89, no. 5,pp. 463–470, May 1996. [2] Sinthanayothin, J. F. Boyce, H. L. Cook and T.H.Williamson, “Automated location of the optic disk, fovea, and retinal blood vessels from digital color fundus images”,British Journal of Ophthalmology,Vol. 83, No. 8, 1999, pp.902-910. Journal of Cognitive Neuroscience, Vol. 3, No. 1, 1991, pp. 70-86. [3] Automated Detection and Classification of Vascular Abnormalities in DiabeticRetinopathyDeepikaVallabhaRamprasathDorairajKameshNamuduri Hilary Thompson ECE, Wichita State University LSU Eye Center, Louisiana State University Wichita, KS 67208 New Orleans, LA2234. [4] Srinivasan A, Madhukar Bhat, Rukhmini Roy, ParthaBhattacharjee"Diabetic Retinopathy Image Enhancement using CLAHE by Programming TMS320C6416". [5] E. Candès, L. Demanet, D. Donoho and L. Ying, “Fast Discrete Curvelet Transforms,” Unpublished. [6] Miri M S, Mahloojifar A, “A Comparison Study to Evaluate Retinal Image Enhancement Techniques,”IEEE International Conference on Signal and Image Processing Applications, pp. 90- 94, 2009. [7] T.S. Lin, M.H. Du, and J.T. Xu, "The Preprocessing of subtraction and the enhancement for biomedical image of retinal blood vessels," J. Biomed. Eng., vol. 20, no. 1, pp. 56-59, 2003. [8] John B. Zimmerman Stephen M Pizer, Edward V.Staab, J.Randilph Perry, William Mccartney and Bradley C.Brenton, “An Evaluation of the Effectiveness of Adaptive Histogram Equalization for Contrast Enhancement,” IEEE Transaction on Medical Imaging Vol 7, No.4 December 1988. [9] Y.-T. Kim Contrast Enhancement Using Brightness Preserving Bi-Histogram Equalization Contrast Enhancement Using Brightness Preserving Bi-Histogram Equalization YEONG-TAEKGI M, MEMBER, IEEE.

International Conference on Inter Disciplinary Research in Engineering and Technology 42
Cite this article as: Ranaditya Haldar, Srinivasan Aruchamy, Anjali Chatterjee, Partha Bhattacharjee.
“Diabetic Retinopathy Image Enhancement using Vessel Extraction in Retinal Fundus Images by
programming in Raspberry Pi Controller Board”. International Conference on Inter Disciplinary Research
in Engineering and Technology (2016): 37-42. Print.
[10] An Image-Processing Strategy for the Segmentation and Quantification of Microaneurysms in Fluorescein Angiograms of the Ocular Fundus Timothy Spencer, John a. Olson, Kenneth c. Mchardy,Peter f. Sharp, and John v. Forrester.Comp Biomed Res 1996;29:284-302E. H. Miller, “A note on reflector arrays (Periodical style—Accepted for publication),” IEEE Trans. Antennas Propagat., to be published. [11] Mohammad Saleh Miri and Ali Mahloojifar, “A Comparison study to evaluate retinal image Enhancement techniques,” IEEE International Conference on Signal and Image Processing Applications., 2009. [12] K. Zuiderveld, “Contrast limited adaptive histogram equalization,” Graphics gems, vol. IV, pp. 474–485, 1994.J. G. Kreifeldt, “An analysisof surface-detected EMG as an amplitude-modulated noise,” presentedat the 1989 Int. Conf. Medicine and Biological Engineering, Chicago,IL. [13] IEEE Transactions On Medical Imaging, Vol. 25, No. 9, September 2006 Automated Microaneurysm Detection Using Local Contrast Normalization and Local Vessel Detection Alan D. Fleming, Sam Philip, Keith A. Goatman, John A. Olson, and Peter F. SharpN. Kawasaki, Parametric study of thermal and chemical nonequilibrium nozzle flow,” M.S. thesis, Dept. Electron. Eng., Osaka Univ., Osaka, Japan, 1993. [14] An Automated Blood Vessel Segmentation Algorithm Using HistogramEqualization and Automatic Threshold Selection Marwan D. Saleh, C.Eswaran, and Ahmed MueenIEEE Criteria for Class IE Electric Systems(Standards style), IEEE Standard 308, 1969. [15] J.N. Kapur, P.K. Sahoo, A.K.C. Wong, A New Method for Gray-Level Picture Thresholding Using the Entropy of the Histogram,” Graphical Models and Image Processing, 29 (1985) 273-285.R. E. Haskell and C.T. Case, “Transient signal propagation in lossless isotropic Plasmas (Report style),” USAF Cambridge Res. Lab., Cambridge, MA Rep.ARCRL-66-234 (II), 1994, vol. 2. [16] GabrielLandini, Philip I. Murray,and Gary P. Missonf , Local Connected Fractal Dimensions and Lacunarity Analyses of 60° Fluorescein Angiograms Investigative Ophthalmology 8c Visual Science, December 1995, Vol. 36, No. 13 (Basic Book/Monograph Online Sources) J. K. Author. (year, month, day). Title (edition) [Type of medium]. Volume(issue). Available [17] J. H. Hipwell, F. Strachan, J. A. Olson, K. C. McHardy,P.F.Sharp,and J.V. Forrester, “Automated detection of microaneurysms in digital red- free photographs: A diabetic retinopathy screening tool,” Diabetic Med., vol. 17, no. 8, pp. 588– 594, 2000

International Conference on Inter Disciplinary Research in Engineering and Technology 43
Cite this article as: Manpreet Kalsy, Sangita Srivastava. “Dyeing of Silk with Rosa Centifolia: An Eco-
Friendly Approach”. International Conference on Inter Disciplinary Research in Engineering and
Technology (2016): 43-46. Print.
International Conference on Inter Disciplinary Research in Engineering and Technology 2016 [ICIDRET 2016]
ISBN 978-81-929866-0-9 VOL 01 Website icidret.in eMail [email protected] Received 20-December-2015 Accepted 30-December-2015 Article ID ICIDRET009 eAID ICIDRET.2016.009
Dyeing of Silk with Rosa Centifolia: An Eco-Friendly Approach
Manpreet Kalsy1, Sangita Srivastava2
1, 2Department of Home Science, University of Allahabad, India
Abstract: Natural dyes are one of the most important sources derived from plants, invertebrates or minerals. These dyes are eco-friendly in nature. Research has shown that synthetic dyes are more suspected to release harmful chemicals that are allergenic and carcinogenic in nature and also effects human health. Nature has blessed us with many valuable varieties of dye yielding plants. Rosa Centifolia is one of them. It was found that after being offering flowers to the deity, the valuable flower was being immersed in the river or dumped at the available place which creates an ecological imbalance and other health hazards. Hence the present research work was undertaken to extract natural colour from the floral waste (Rosa Centifolia). The dyeing was carried out on pre-mordant mulberry silk fabric. Further optimum conditions for dyeing were evaluated. On the basis of result it was found that temperature also significantly influence the dyeing process. Keywords: Natural dye, mordant, silk.
INTRODUCTION
India has a rich biodiversity natural resources; natural dye is one of them. Natural colorants are dyes and pigmentary molecules that are obtained from plant, animal or mineral sources with or without chemical treatments. They are organic compounds, having hydroxyl group in their nucleus and are sparingly soluble in water (Sinha. K, Saha.D.P , Datta. S,2012). Recently, organic awareness and environmental conscious of consumers have revived the interest of natural dyed textiles. The impact of the textile industry on the environment and the consumption of raw materials and natural resources are becoming prime concern. Research has shown that synthetic dyes are more suspected to release harmful chemicals that are allergitic and carcinogenic in nature and also effects human health. Interest in the use of natural dyes has been growing rapidly. Dyes obtained from various natural sources have emerged as an important alternative against synthetic dyes. Natural dyes are eco-friendly in nature. The primary advantage of these dyes is that they are renewable, non- carcinogenic, non-toxic and easily disposable. Natural dyes are antioxidant and antimicrobial in nature; hence play an important role in neutralizing free radicals. Its antimicrobial properties also prevent skin inflammation, toxicity and other fungal infections. Even some of them have therapeutic values for which the raw material finds use in medicinal field (Grover. N and Patni.V). Mostly natural dyes are non-substantive in nature. Hence require mordant’s in order to bind the dye with the textile fibres. The term mordant is derived from the Latin word mordeo which means to bite or take hold of (Gohl and Vilensky). Dyeing with mordant can give excellent fastness properties and gives a range of different colours and shades with the same natural dyestuff. A naturally dyed product is environmentally friendly and gives added value to fabric. Fabric dyed with natural dyes not only gives a cooling sensation but also revitalizes our body, mind and soul.
This paper is prepared exclusively for International Conference on Inter Disciplinary Research in Engineering and Technology 2016 [ICIDRET] which is published by ASDF International, Registered in London, United Kingdom. Permission to make digital or hard copies of part or all of this work for personal or classroom use is granted without fee provided that copies are not made or distributed for profit or commercial advantage, and that copies bear this notice and the full citation on the first page. Copyrights for third-party components of this work must be honoured. For all other uses, contact the owner/author(s). Copyright Holder can be reached at [email protected] for distribution.
2016 © Reserved by ASDF.international

International Conference on Inter Disciplinary Research in Engineering and Technology 44
Cite this article as: Manpreet Kalsy, Sangita Srivastava. “Dyeing of Silk with Rosa Centifolia: An Eco-
Friendly Approach”. International Conference on Inter Disciplinary Research in Engineering and
Technology (2016): 43-46. Print.
The art of dyeing was as old as human civilization. Our Vedas, the Atharveda carries description of natural dyes. Natural dyes have been used for colouring and printing fabrics. Most of these dyes were derived from plants or animal sources by long and elaborate processes. Among these were Indigo, Tyrian Purple, Ali Zarin, Cochineal and Logwood dyes. Nature has blessed us with many varieties of dye yielding plants. The researcher has used petals of Rose flower. It’s the most used flower in temples. A rose is a woody perennial of the genus Rosa. Botanical or scientific name is Rosa Centifolia and belongs to the family of Rosaceae. The Red Indian rose is sweet, cool, pungent and slightly bitter. In the local language it is called ‘Desi Gulab’. The flower is extensively cultivated in Northern India. The flowers have a mild fragrance. Lots of this flower is used in deity worship and also for decoration in marriages. Essential oil of rose is extracted for the cosmetic industry and also attar. The rose petals are also used in the manufacture of gulukand and rose water. Apart from its aphrodisiac fragrance it has medicinal value also. India is a country of commercial and cultural wealth.Religion in India is characterized by a diversity of religious beliefs and practices. Offering flowers to Deities are an important part of Hindu worship. The researcher observed that daily huge amount of flowers are offered in the temple and further these offered flowers are released in the rivers or dumped at the available places which creates an ecological imbalance and other health hazards. Hence the present research work was undertaken to extract natural colour from the floral waste. The flowers were collected from the temple caretakers. A natural dye was extracted using the petals of rose. And also optimum conditions for dyeing were evaluated.
Materials and Methods The dye was extracted from the used petals of Rose flower. Extraction of natural dye: Source: used rose petals Ingredients: Rose petals: 12gms HCL: 2mL Distill water: 200mL Alum (mordant): 20gms Rose petals were used for extraction process. The dye was extracted in acidic bath. The dye was extracted in the presence of acidic medium. For this 2mL HCL was poured in 200mL of double distill water. Then fresh petals of Rose (12gms) were immersed in the solution. The solution was kept for half an hour. Further the extraction process was carried out at the temperature of 80ᵒc for 60 mins. Meanwhile the solution was stirred continuously. After completion, liquor was left in the dye bath till it cools down. The extract was filtered and used for dyeing process. Before dyeing the samples were treated with mordant. For mordanting pre-mordanting method was selected. Alum (20gms) was used as a mordant.Chemically alum is known as Aluminium potassium sulphate dodecahydrate KAI (SO4)2.12(H2O), other names are potassium alum, potash alum. Used in medicine as an astringent and styptic, in dyeing and tanning and in many other technical processes. Most of alums have an astringent and acid taste. They are colourless, odourless and exist as a white crystalline powder. Alums are generally soluble in hot water and they can be readily be precipitated from aqueous solution to form large octahedral crystals. When used as a mordant (binder) it acts as chemical link that fixes the dye to a substrate by combining with the dye pigment to form an insoluble compound. Majority of natural dyes need a mordanting agent which may be a metallic salt or a suitable coordinating complex forming agents in order to build affinity between the fibre and dye molecules. Further these metallic salts (mordant) form metal complexes with the fibres and the dye. Alum improves light and washes fastness properties of all natural dyes and keeps the colour clean. It is inexpensive and safe to use. Mordanting can be done in three different ways. Pre-mordanting: where the mordant is applied first, followed by dyeing. Post-mordanting: where the dyeing is done first and then mordanting is carried out. Simultaneous-mordanting: where mordant and dye are mixed together and applied. Preparation and dyeing of fabric Mulberry silk fabric was selected for the purpose of this study. Silk is a natural protein fabric which is available in wide variety. The isoelectric point of silk is around pH 5. Silk reacts well to acidic and basic dyes. It has affinity to metallic salts. Silk is readily dyeable with a variety of dyes. Apart from dyeing it has an intensive property of holding odours and fragrance for a long time. Before dyeing the samples were subjected to pre-treatment. The samples were degummed. For this, samples were boil at 30-40ᵒc for 20 mins in a mild detergent (Ezee). After that the samples were washed in cold water and dried in shade.

International Conference on Inter Disciplinary Research in Engineering and Technology 45
Cite this article as: Manpreet Kalsy, Sangita Srivastava. “Dyeing of Silk with Rosa Centifolia: An Eco-
Friendly Approach”. International Conference on Inter Disciplinary Research in Engineering and
Technology (2016): 43-46. Print.
Analytical method The optical density was determined with help of Spectrophotometer. The dye solution was diluted with distill water. Further experiments were carried out to optimize dyeing temperature. Optimization of dyeing temperature The present work involves the optimization of different temperature governing the dyeing of sample. To optimize dyeing temperature, dyeing was carried out using optimum concentration of dye at five different temperatures that is 40ᵒ, 50ᵒ, 60ᵒ, 70ᵒ and 80ᵒ C. The temperature giving maximum dye absorption was taken as the optimum dyeing temperature.
Results and Discussions A dark pink dye was obtained from the petals of rose. A very soft pink dyed mulberry silk fabric with fastness tolight, washing, perspiration and rubbing properties which was obtained at optimum temperature. The dyed silk fabric retained the aphrodisiac fragrance of rose.Dyeing temperature is the temperature that is suitable for dye absorption and fixation of dye on the sample. Temperature also significantly influenced the dyeing process. For optimization dyeing temperature, dyeing was carried out at five different temperatures 40ᵒ, 50ᵒ, 60ᵒ, 70ᵒ and 80ᵒ C. The percent dye absorption at different temperatures is shown in Table no.1
Table no.1 Optimization dyeing temperature on the basis of dye absorption through Spectrophotometry.
Temperature Time Absorption (%)
40ᵒ C 60mins 0.245
50ᵒ C 60mins 0.283
60ᵒ C 60mins 0.411
70ᵒ C 60mins 0.283
80ᵒ C 60mins 0.261 On the basis of results it can be concluded that the maximum absorption (0.411) was observed at temperature of 60ᵒ C for one hour.
Table no.1 Optimization dyeing temperature on the basis of dye absorption through Spectrophotometry.
Conclusion
In the present scenario, global awareness is of prime concern. The study focussed towards utilization of floral waste for extraction of natural dye. The aim of the study was an eco-friendly approach towards safeguarding human health as well as protecting our environment from pollution. The present research work showed that natural dye can be successfully extracted from petals of Rose. Maximum absorption of dye was observed at 60ᵒ C. Different temperature range of dyeing markedly influenced the absorption percent of dye.
0
0.05
0.1
0.15
0.2
0.25
0.3
0.35
0.4
0.45
40ᵒ C 50ᵒ C 60ᵒ C 70ᵒ C 80ᵒ C
time

International Conference on Inter Disciplinary Research in Engineering and Technology 46
Cite this article as: Manpreet Kalsy, Sangita Srivastava. “Dyeing of Silk with Rosa Centifolia: An Eco-
Friendly Approach”. International Conference on Inter Disciplinary Research in Engineering and
Technology (2016): 43-46. Print.
References
1) Grover,N and Patni,V. Extraction and application of natural dye preparations from the floral parts of Woodfordia fruticosa(Linn.) Kurz. Indian Journal of Natural Products and Resources. Dec.2011. Vol.2(4).pg 403.
2) Sinha.K, Saha.D.P and Datta.S. Extraction of natural dye from petals of Flame of forest ( Butea monosperma) flower: Process optimization using response surface methodology (RSM). ELSEVIER-Dyes and Pigments. Aug.2012.Vol.94 Issue 2.
3) Samanta,K.A, Konar,A and Chakarborti,S. Indian Journal of Fibre and Textile Research. March.2011. Vol.36.pg 63. 4) Samanta,K.A and Konar,A. Dyeing of Textiles with Natural Dyes. (2011).Institute of Jute Technology, University of
Calcutta, India pg 44-45. 5) Gohl. E.P.G and Vilensky. Textile Science.(2003) 6) www.britannica.com 7) www.nptel.ac.in

International Conference on Inter Disciplinary Research in Engineering and Technology 47
Cite this article as: Nancy Arya, S Taruna. “A Survey to Augment Energy Efficiency of Mobile Devices in
Cloud Environment”. International Conference on Inter Disciplinary Research in Engineering and
Technology (2016): 47-50. Print.
International Conference on Inter Disciplinary Research in Engineering and Technology 2016 [ICIDRET 2016]
ISBN 978-81-929866-0-9 VOL 01 Website icidret.in eMail [email protected] Received 21-December-2015 Accepted 30-December-2015 Article ID ICIDRET010 eAID ICIDRET.2016.010
A Survey to Augment Energy Efficiency of Mobile Devices in Cloud Environment
Nancy Arya1, S Taruna2
1, 2Department of Computer Science, Banasthali Vidyapith, Rajasthan, India
Abstract: Mobile devices such as smart phones, have gained enormous popularity over the last few years. Smart phones are now capable of supporting a large number of applications, many of which demand an ever increasing computational power. However, Battery life of mobile devices remains a key limiting factor in the design of mobile applications. This paper firstly emphasizes on reviewing various techniques used to enhance battery life of smart phones. At the end, on the basis of comparative studies, suggestions are given to extend the energy efficiency of smart phones. Keywords: Mobile Cloud Computing, MCC, Cloud Computing, Smartphones.
INTRODUCTION
Mobile Cloud Computing (MCC) integrates the cloud computing into the mobile environment to overcome the obstacles related to the performance, security and environment. By [2] , “Mobile cloud computing at its simplest, refers to an infrastructure where both the data storage and the data processing happen outside of the mobile device." According to a recent study by ABI Research, more than 240 million businesses will use cloud services through mobile devices by 2015. Mobile devices such as smart phones are used for various resource demanding multimedia applications such as making voice/video calls, playing 3D games/audios etc. that drains battery swiftly. In 2009, Nokia poll found that battery life is one of the greatest concerns for users. Thus, it is important to analyze the current research on energy conservation in mobile cloud computing. By Satyanarayanan [3], the mobility feature of devices inherent problems such as, low bandwidth, low connectivity, resource scarceness and limited energy. To deal with these problems offloading and remote computation techniques are used. The Rest of the paper is organized as follows; Section-II refers to various techniques used to extend the mobile’s battery. Section-III includes suggestions based on the comparative studies. Section-IV concludes the paper. At last, paper shows references in section V.
Approaches to Augment Energy Efficiency of Mobile Devices Energy consumption is an important key concern in the design and implementation of mobile applications. Thus, there is a need to pay attention on improvement of energy usage in order to prevent mobile devices becoming stationary due to low bandwidth and resource-hungry applications. The goal of on-going research, hardware manufacturer and OS designers led to some positive solutions using augmentation approaches .The augmentation approaches can be classify into two major levels-Hardware and Software [4]. These approaches can increase computing capabilities of mobile devices and conserve energy. Following are some approaches that help to achieve optimal energy utilization at different levels. Hardware oriented Augmentation The hardware approach aims to enhance the capabilities of mobile local resources i.e. multi-core processors with high clock speed, storage and long lasting batteries [14]. Battery can't be renewed without the help of any external backup power source because energy is the only non-replenishable resource in mobile devices [16]. Generating powerful processor, large data storage, and big screen
This paper is prepared exclusively for International Conference on Inter Disciplinary Research in Engineering and Technology 2016 [ICIDRET] which is published by ASDF International, Registered in London, United Kingdom. Permission to make digital or hard copies of part or all of this work for personal or classroom use is granted without fee provided that copies are not made or distributed for profit or commercial advantage, and that copies bear this notice and the full citation on the first page. Copyrights for third-party components of this work must be honoured. For all other uses, contact the owner/author(s). Copyright Holder can be reached at [email protected] for distribution.
2016 © Reserved by ASDF.international

International Conference on Inter Disciplinary Research in Engineering and Technology 48
Cite this article as: Nancy Arya, S Taruna. “A Survey to Augment Energy Efficiency of Mobile Devices in
Cloud Environment”. International Conference on Inter Disciplinary Research in Engineering and
Technology (2016): 47-50. Print.
increases the power consumption due to additional heat, weight and size [14]. Resource-hungry applications drain battery swiftly. Therefore, the optimal usage of resources can make contribution in energy conservation of mobile devices. Software oriented Augmentation Resources that are used on software level can be traditional and cloud-based. Their major differences lie on resource provisioning and access strategies, security and resource characteristics [16].Software-level augmentation for mobile are classified into two major categories- 1) Energy Aware Operating System and Applications, and 2) Resource Aware Computing. Energy Aware Operating Systems and Applications Two type of programs run in a mobile device, Operating System (OS) and application. The applications can be computing-intensive such as speech recognition, data-intensive such as enterprise applications and communication-intensive applications such as online video applications [16]. But who is responsible for energy management? Application level energy management is not so best because main entity is responsible for monitoring and supervising all the resources consumptions by other applications [14]. Considering OS level management alone for energy management, can face a problem of scalability, that’s why hybrid model is best [14], that says both the application and operating system should be aware of the resources utilization and supervision to achieve better performance. Examples of such systems are Odyssey [1]. Resource Aware Computing Resource aware computing can be dividing into two categories- Reduce Resource Requirements and Resource conservation. In resource-aware computing, resource requirements of mobile applications can be reduced by utilizing the application-level resource management methods related to compiler, OS and lightweight protocols. Resource conservation can be achieved by efficient selection of available execution approaches and technologies. Reduce Resource Requirements Many mobile applications are unreasonably energy-hungry. To enhance the capabilities of mobile's resources along with manufacturing the high-end hardware devices; a parallel development of resource-efficient application plays a major role [1]. This approach focus on the design phase of software to form energy efficient applications. Resource Aware Applications To protect smart phones from power consumption it is essential to understand the energy need of hardware and installed software's. Many applications takes unnecessarily power. So better understanding of the power consumption of individual mobile components helps to develop a good energy aware system. For example, a resource aware application is needed to exploit 2G for voice communication and 3G for FTP services because of their different energy consumption requirement [7]. The compute intensive application occupied CPU for long time to process complex tasks that are directly suffering Mobile’s battery. There are several efforts made [8][9]for energy aware memory management to reduce power consumption at the time of processing of data storage. The power management techniques in common mobile memories i.e. Ram and (PCM) Phase Change Memory (PCM) explored by [10]. In Ram, power managing unit sustains various power states like ‘Page Down’ and ‘Self Refresh’ to curtail power consumption while PCM influences three states ’On’, ’Off’, and ’I/O’ to arouse energy effective data storage. During ’off’ mode in PCM, the energy depletion is 0mW, whereas during ’on’ state the energy consumption touches 74mW [1]. Cloud based Mobile Applications Cloud based mobile applications are similar to Web-based applications. The similarity is both the applications runs on external servers and requires a browser on the client device to access the applications [11]. Native mobile applications are restricted by the battery and processing speed. The concept of cloud computing bridge this gap by offering cloud-mobile applications to have capabilities of connecting cloud servers for processing and remote storage[1]. The development of cloud-mobile apps accelerates high computational applications to cloud by offloading .It enhance the capabilities of wide range of mobile devices in dynamic environment with least processing overhead. The Clone Cloud service which uses a smart phone's internet connection to communicate with a clone of itself that exists on remote servers in the cloud. In case of compute intensive processing the mobile device needs to offload data to the clone for processing and get results back on the Client device’s screen [12]. One of the major advantages of this research is the ability to enhance mobile battery life. Thus, mobile device will be free from longer use of its own CPU. Resource conservation Traditionally, local resources of mobile were conserved by reducing the workload on the local resources. But now there is a concept of remote execution, fidelity adaptation and remote storage to conserve local resources. Remote execution (Offloading or Cyber Foraging) In Remote execution, the resource hungry components of mobile applications are migrated to the resource-rich computing devices through a network to any local server machine called surrogate. The surrogate execute computational task and transfer the results back to the Mobile Client [1]. Satyanarayanan [3] proposed the concept of remote execution not only for conserving energy, storage and processing efficiency of local devices but also to make possible the execution of compute intensive apps, which are unable to be

International Conference on Inter Disciplinary Research in Engineering and Technology 49
Cite this article as: Nancy Arya, S Taruna. “A Survey to Augment Energy Efficiency of Mobile Devices in
Cloud Environment”. International Conference on Inter Disciplinary Research in Engineering and
Technology (2016): 47-50. Print.
processed locally. According to the research, remote execution is highly effective to minimize power consumption of smart phones. The technique of remote execution is also known as process offloading or cyber foraging. [15] Fidelity Adaptation Fidelity adaptation is an alternative solution to augment mobile devices in the absence of remote resources and online connectivity. In this technique, local resources are conserved by decreasing quality of application execution, which is unlikely desirable to end-users. [16]. Fidelity is the concept of releasing CPU load, network bandwidth etc. The run time parameters can be adjust for an application to get lower quality for energy conservation, bandwidth and computational resources. Remote Storage Remote storage is the process of outsourcing of data storage at third location. It enables maintaining applications and data outside the mobile and provides remote access to them. A number of remote file storage services are available in cloud for example Google Docs. The remote storage allows the mobile users to store and access any kind of data, anywhere in the cloud and can retrieve it from any place by web browser. Big Data that is not needed in the near future can be stored remotely to reduce the power consumption.
SUGGESTIONS On the basis of all the above approaches used to augment the energy efficiency of handheld devices it is clear that long lasting battery life is necessary to achieve the reliable service. In the context of mobile clouds, the cost of power consumption should be less than the benefit gained [5]. It will enable the mobile device to take appropriate component level action to minimize energy consumption, and hence, increase the life span of system by unloading unneeded software. For these reasons, being aware of a device’s energy usage is essential [6]. To overcome the challenge of resource poverty of mobile devices, more research on reduction of battery consumption will leads us to some fruitful results. To minimize the battery, energy can be potentially saved with the help of cloud services. But this is not true for all of the applications when migrated to the cloud.
CONCLUSION
The popularity of smart phones creates a new rich user experience, but the hardware limitation in terms of memory, computation, and power capacity are still a big issue. Battery life is one of the main constraints of mobile devices because a mobile device operates on a finite supply of energy that is contained in its battery. The battery of smart phones needs improvement, as the explosion of new mobile applications drains battery swiftly which reduces the operational time of mobile devices. Augmenting energy of smart phones using cloud infrastructures is an emerging research area. With this importance, the approaches to augment the energy efficiency of cloud assisted mobile devices have been discussed in this paper. Finally, the suggestions have been outlined.
REFERENCES
[1] S Mushtaq Ali, Jasni Mohamed Zain, Mohammad Fadli Zolkipli, Gran Badshah," Mobile Cloud Computing & Mobile Battery Augmentation Techniques: A Survey", IEEE , 2014.
[2] http://www.mobilecloudcomputingforum.com/. [3] M. Satyanarayanan, “Fundamental challenges in mobile computing,” Proc. fifteenth Annu. ACM Symp. Princ. Distrib.
Comput. - Pod. ’96, pp. 1–7, 1996. [4] N. Vallina-rodriguez and J. Crowcroft, “Modern Mobile Handsets”, Communications Surveys & Tutorials, IEEE”, pp. 1–
20, 2012. [5] K. Mansley, A.R. Beresford, D. Scott, "encouraging use of location systems, in": Proceedings of UbiComp, Springer,
2004. [6] S. Chiyoung, S. Malek, N. Medvidovic, "Estimating the energy consumption in pervasive Java-based systems, in" IEEE,
PerCom., pp. 243–247 . [7] G. P. Perrucci, F. H. P. Fitzek, and J. Widmer, “Survey on Energy Consumption Entities on the Smartphone Platform,”
2011 IEEE 73rd Veh. Technol. Conf. (VTC Spring), pp. 1–6, May 2011. [8] M. Lee, E. Seo, J. Lee, and J. Kim, “PABC: Power-Aware Buffer Cache Management for Low Power Consumption,” IEEE
Trans. Comput., vol. 56, no. 4, pp. 488–501, Apr. 2007. [9] H. Huang, P. Pillai, K. G. Shin, and A. Arbor, “Design and Implementation of Power-Aware Virtual Memory.” Proceedings
of the USENIX Annual Technical Conference (General Track), June 9 – 14, 2003. [10] R. Duan.., “Exploring Memory Energy Optimizations in Smartphones,” Green Computing Conference and Workshops
(IGCC), 2011 International pp. 1–8, 2011. [11] Bill Claybrook, “Mobile cloud apps vs. native apps: The developer’s perspective,” 2013. [Online]. Available: cloud-apps-vs-
native-apps-The-developers-perspective. [Accessed: 08-Jun-2014]. [12] B. Chun, S. Ihm, P. Maniatis, M. Naik, and I. L. Berkeley, “CloneCloud: Boosting Mobile Device Applications through
Cloud Clone Execution.” , Sep 2010.

International Conference on Inter Disciplinary Research in Engineering and Technology 50
Cite this article as: Nancy Arya, S Taruna. “A Survey to Augment Energy Efficiency of Mobile Devices in
Cloud Environment”. International Conference on Inter Disciplinary Research in Engineering and
Technology (2016): 47-50. Print.
[13] N. Vallina-rodriguez and J. Crowcroft, “Modern Mobile Handsets”, Communications Surveys & Tutorials, IEEE”, pp. 1–20, 2012.
[14 ]D. Revision, “The ARM Cortex-A9 Processors,” pp. 1–11, 2009. [15] M. Satyanarayanan, “Pervasive computing: vision and challenges,” IEEE Pers. Commun., vol. 8, no. 4, pp. 10–17, 2001 . [16] Saeid Abolfazli, Zohreh Sanaei,Ejaz Ahmed, Abdullah Gani, Rajkumar Buyya, "Cloud-Based Augmentation for Mobile
Devices: Motivation, Taxonomies, and Open Challenges", IEEE ,2013. .

International Conference on Inter Disciplinary Research in Engineering and Technology 51
Cite this article as: Manish Dev Sharma, Jashangeet Kaur, Ankush, Kanika, Navdeep Goyal. “Opto-
Electronic Applications of Advanced Electronic Materials: InSe System”. International Conference on Inter
Disciplinary Research in Engineering and Technology (2016): 51-54. Print.
International Conference on Inter Disciplinary Research in Engineering and Technology 2016 [ICIDRET 2016]
ISBN 978-81-929866-0-9 VOL 01 Website icidret.in eMail [email protected] Received 21-December-2015 Accepted 30-December-2015 Article ID ICIDRET011 eAID ICIDRET.2016.011
Opto-Electronic Applications of Advanced Electronic Materials: InSe System
Manish Dev Sharma1, Jashangeet Kaur1, Ankush1, Kanika1, Navdeep Goyal1
1Department of Physics, Centre of Advanced Study in Physics, Punjab University, Sector-14, Chandigarh, India
Abstract: Indium Selenide (InSe) is a complex system with many co-existing crystallographic phases. Extensive research has been done on identification of these phases but still there is a lot of scope in clarification of such structural modifications. This manuscript aims to highlight the phase transformation mechanism and synthesis of various layered structures of InSe. By compiling the recent advancements on examining InSe as opto-electronic material, our work attempts to emphasize the performance enhancement of this material. Keywords: Indium Selenide, Opto-Electronic, Performance enhancement.
INTRODUCTION
Chalcogenide glasses: The primary elements of chalcogenide glasses are chalcogens (Sulphur (S), Selenium (Se) and Tellurium (Te)). The word chalcogen is composed of two greek words (chalco+gen) which means ore-generating. These glasses are synthesized by formation of alloys with other group elements like indium (In), germanium (Ge), antimony (Sb) etc. Chalcogenide glasses are responsive to the absorption of electromagnetic radiation and show a diversity of light-actuated effects as a result of irradiation. Consequently, significant amount of research has been done on active opto-electronic devices using these materials. Doped chalcogenide glasses are novel contender for active utilizations such as amplifiers, FETs and buffers. There are plentiful papers on exploration of optical, electronic and physical properties of chalcogenide glasses [1]. Some chalcogenide alloys have two structural states (amorphous and crystalline). The resistance and reflectance contrast between these states makes them profitable in PCRAM and optical data storage applications. InSe is a layer structured chalcogenide glass. The two dimensional system is capable of forming multi-phase films in view of the inherent polymorphism. This binary compound is pure state has hexagonal structure with direct band gap of 1.7 eV [2]. Indium selenium system crystallizes in many compositions and many phases may co-occur in a particular proportion of the system. This is why the analysis of such materials becomes confusing and there is an urge to develop single phase InSe compounds [3]. γ- In2Se3 is the most stable and researched phase so far. It has also been found to be a promising candidate for opto-electronic applications. In this manuscript, we represent a review of the accessible literature on indium-selenium system. Various compositions are studied and compared on the basis of structure, synthesis, characterization and applications. INDIUM-SELENIUM SYSTEM Indium selenium is a binary III-VI 2D semiconductor which has a family of crystallographic modifications with different stoichiometric ratios. The In-Se phase diagram illustrate many compositions that co-exist in equilibrium such as InSe, In2Se3, In4Se3, In6Se7, In3Se4 etc. for a particular stoichiometry, many phases may exist together. For example, InSe has a β and γ phases whereas In2Se3 has 5 phases: α, β, γ, δ, κ. InSe InSe monolayer consists of a sequence of 4 atoms: Se-In-In-Se linked with covalent bonding with tetravalent indium locus. The possible crystal structures in which it can crystallize are
This paper is prepared exclusively for International Conference on Inter Disciplinary Research in Engineering and Technology 2016 [ICIDRET] which is published by ASDF International, Registered in London, United Kingdom. Permission to make digital or hard copies of part or all of this work for personal or classroom use is granted without fee provided that copies are not made or distributed for profit or commercial advantage, and that copies bear this notice and the full citation on the first page. Copyrights for third-party components of this work must be honoured. For all other uses, contact the owner/author(s). Copyright Holder can be reached at [email protected] for distribution.
2016 © Reserved by ASDF.international

International Conference on Inter Disciplinary Research in Engineering and Technology 52
Cite this article as: Manish Dev Sharma, Jashangeet Kaur, Ankush, Kanika, Navdeep Goyal. “Opto-
Electronic Applications of Advanced Electronic Materials: InSe System”. International Conference on Inter
Disciplinary Research in Engineering and Technology (2016): 51-54. Print.
1) β -InSe with hexagonal structure. 2) γ-InSe with rhombohedral structure.
In2Se3 In2Se3 has a single layer of thickness of 5 atoms arranged in the sequence Se-In-Se-In-Se with each layer terminated with Se atoms by virtue of which the layers have weak van der waals interactions with each other [4]. This is probably the most complex known structures. α- In2Se3 crystallizes in the stacking sequence Se-In-Se-In-Se in which there exists covalent bonding between the atoms and van der waals interactions within the layers. Both α and β have similar semiconducting layer composition and both can exist in hexagonal as well as rhombohedral forms. On the other hand, α is stable at room temperature but β is metastable and switches back to α unless it is doped with antimony (Sb). By heating α we obtain α-β transformation at 200oC and it remains β till 650oC [5]. γ- In2Se3 is a stable polycrystalline phase with defect wurtzite structure. This structure is basically NaCl type but has Indium vacancy on 1/3rd of its cationic sites. This structure is achieved at 650oC and is stable upto 750oC. on further annealing, we obtain κ-In2Se3 (a metastable anisotropic phase) which transforms to δ-In2Se3 above 750
oC [6]. The electrical, optical and structural properties of Indium-Selenide films rely on the following factors:
1) The growth technique. 2) The annealing temperature. 3) The stoichiometry or III-VI ratio.
Some work related to this has been recapitulated in the following section: D. Y. Lyu et al. examined the In-Se system by preparing 3 samples :
1) IS400- In2Se3 annealed at 400oC.
2) IS425- In2Se3 annealed at 425oC.
3) IS450- In2Se3 annealed at 450oC.
All the samples were characterized for structural analysis and the results are different for all the samples. IS400 shows a mixed α and γ phase with energy band gap of 1.943 eV. IS425 and IS450 were both single phase γ-In2Se3 with Eg values 1.942 and 1.946 respectively [3]. Aytunc Ates et al. exhibited that by augmenting the growth temperature the diffraction peak intensities in the XRD diffractograms were increased. This implies that the crystallinity of sample is enhanced due the formation of γ-In2Se3 for temperature greater than 400oC. The optical band gap values of annealed films were also observed to be greater than as grown films. This is because γ-In2Se3 has higher energy band gap. The photocurrent has been discovered to be directly proportional to temperature which implies an improvement in conductivity [7]. T.Kato et al. has also demonstrated results for varying VI-III ratio and deposition temperature in α-In2Se3 compound [8]. Other compositions like In3Se4 (rhombohedral structure), In4Se3 (orthorhombic) and In6Se7 (monoclinic) are also present side by side in the In-Se phase diagram.
GROWTH TECHNIQUES
With the help of binary alloy phase diagram of Indium Selenium system, bulk samples are prepared with various methods like melt-quench and solid-state reaction. Pure In and Se in powdered form are used as precursors in these methods. Indium selenium thin films can be prepared with various growth techniques:
1) Vacuum evaporation 2) Molecular beam epitaxy (MBE) 3) Metalorganic chemical vapour deposition (MOCVD) 4) Mechanical alloying 5) Electro deposition 6) Flash evaporation
Though electro-deposition is a simple, economical and low temperature technique, it is problematic to obtain high efficiency solar cells with this technique. Dual source MOCVD is by far the best known technique to grow high quality buffer layers in solar cell applications. There are many advantages of MOCVD over other techniques like large scale production, homogeneity, high quality films can be tailored by modulating the flow rate of precursors in dual source MOCVD which is an edge over single source MOCVD. Weak crystallinity and multiple phases are two major issues with these films which are of great concern nowadays.

International Conference on Inter Disciplinary Research in Engineering and Technology 53
Cite this article as: Manish Dev Sharma, Jashangeet Kaur, Ankush, Kanika, Navdeep Goyal. “Opto-
Electronic Applications of Advanced Electronic Materials: InSe System”. International Conference on Inter
Disciplinary Research in Engineering and Technology (2016): 51-54. Print.
APPLICATIONS In-Se is a binary source for formation of ternary and higher order materials which are highly sensitive to light and have innumerous applications like photo-diodes, photo-detectors, CIS and CIGS solar cells, switching devices, heterojunction devices, photovoltaic cells, data storage and nano-photonic applications. Photovoltaic applications InSe compounds are relevant for photovoltaic cell fabrication because of the following properties.
1) Low density of dangling bonds resulting in very low recombination rate. 2) High absorption coefficient which is directly proportional to temperature and photon energy [9] 3) A band gap of 1.9 eV which is suitable for solar energy conversion. 4) It has appraised photoconductivity which makes it competent absorber in photocells. 5) It has low resistivity which is essential to minimize the series resistance of the cell.
In semiconductor, the threshold for absorption of photons is determined by band gap and transparency to incident spectral radiation is measured by refractive index. That is why a pre-knowledge of these primary prospects is important for the characterization of opto-electronic properties of semiconductors. CIGS Copper indium gallium selenide is a I-III-VI chalcopyrite compound with Cd free buffer layer made up of In2Se3 because of this incorporation of an active layer it has many utilities over commercial CdTe and a-Si solar cells. A direct band gap of this layer steers to high absorption coefficient. This minimizes the photocell dimensions fulfilling the requirements of miniaturization, because of the absence of any Pb or Cd content it is a much more environment friendly approach with an efficiency of 20%, higher than other widespread solar cells in the market. Moreover, by adjusting the Ga to In and S to Se ratio, the band gap can be monitored in the realm (1.0 eV to 2.4 eV). As a result, definitely graded band gap can be attained [10]. A schematic diagram of CIGS based solar cell is shown in Fig. 1. V. N. Katerinchuk et al. has deviced uniform p-n InSe photodiode and investigated that it has a wide spectral response in the incident radiation range of 1.2-3.2 eV [11]. Jian Jung Wang et al. has fabricated a photosensitive switch with InSe nanowires. It has swift and reversible switching with on/off ratio as high as 50 [12].
Figure 1. CIGS based solar cell Nano-applications Flawless optical and electrical devices can be achieved by varying the proportion, architecture and phases of nano In-Se. Large bonding and structural anisotropy of layered In2Se3 is the reason for their potential applications in nanophotonics, biosensors, thermo-electronics and energy conversion. Therefore, due to the incalculable demand of high scale integrated opto-electronics devices, the development of photodetectors with interdisciplinary nanomaterials is essential. Anurag and hailin peng et al. have individually prepared In2Se3 nanowires bearing two growth directions. One is along the z-axis and the other is perpendicular to it. The parallel component has a superlattice structure comprising Se atoms on the adjacent layers linked by vander waal forces. This layer depicts metallic nature with very high conductivity. The reason of this is unfolded in terms of conducting lines crossing the Fermi level from the valence band to conduction band and from conduction band to valence band. The perpendicular part is composed of Se atoms bound with covalent bonds. It exhibits n-type semiconducting behavior with lesser conductivity. Interestingly, by scaling down from bulk to nano the conductivity of In2Se3 elevates by 3 order of magnitude [13,4]. Wei Feng et al. has demonstrated multilayer nanosheet InSe (1:1) transistors and phototransistors whose thickness dependent photo response is a key factor for constructing ultra thin layered device. The performance panorama of this transistor surpasses the commercially established photodetectors because of its high sensitivity, fast on/off speed and broad spectal response from UV to NIR (Near infrared) [14]. PCRAM (Phase Change Random Access Memory) The resistivity of InSe can be varied by a factor of 105 which is exceptionally superior than conventional non-volatile memories. That is why nano InSe is a promising candidate for PCRAM applications. This resistance depends on the degree of crystallinity. The reset current desired for phase transformation from crystalline to amorphous is lowered in highly resistive In2Se3 nanowire based PRAM
Top contact
ZnO window
Buffer layer
CIGS active layer
Mo black electrode
Glass substrate

International Conference on Inter Disciplinary Research in Engineering and Technology 54
Cite this article as: Manish Dev Sharma, Jashangeet Kaur, Ankush, Kanika, Navdeep Goyal. “Opto-
Electronic Applications of Advanced Electronic Materials: InSe System”. International Conference on Inter
Disciplinary Research in Engineering and Technology (2016): 51-54. Print.
[15]. This can also be attributed to low melting temperature of nanoscale InSe cells. Moreover, when we are handling nano dimensions the heat dissipation of nanowires is suppressed and as a consequence the thermal conductivity also abates. Therefore, by utilizing this material we can design a high speed, low power, and non-volatile and nanoscale data storage device [16].
CONCLUSION This review illustrates a thorough summary on the present understanding of InSe structural morphology. Various phases of In2Se3 have been identified but oftenly α and γ phases are synthesized, whereas other phases are still in the darker side. Out of all the growth techniques, MOCVD has succeeded in quality and stability. By virtue of high absorption coefficient, optimum band gap and wide spectral response, CIGS solar cells with cadmium free In2Se3 active layer have produced the most efficient and eco-friendly photovoltaic cells. Nanostructuring of the material enhances the properties of phase change memory devices by augmenting the switching speed and curtailing the input power. Apart from all this, phase controlled synthesis of InSe with proper experimental conditions should be further probed.
ACKNOWLEDGMENT
We are indebted to Department of Physics, Centre of Advance Study in Physics, Punjab University, Chandigarh for their encouragement and support to carry out this work.
REFERENCES
[1] Zakery and R. S. Elliott, Optical Nonlinearities in Chalcogenide Glasses and their Applications, 135 ed., Springer Series in Optical Sciences, Springer Berlin Heidelberg, 2007.
[2] Herrero J, Ortega, “ Electrochemical synthesis of photoactive In2Se3 thin films”, J.Sol Energy Mater, Vol. 16, pp. 477, 1987. [3] D.Y. Lyua, T.Y. Lina, J.H. Lin, S.C. Tseng, J.S. Hwang, H.P. Chiang, C.C. Chiang, S.M. Lan, “Growth and properties of
single-phase g-In2Se3 thin films on (1 1 1) Si substrate by AP-MOCVD using H2Se precursor”, Solar Energy Materials & Solar Cells, Vol. 91, pp. 888–891, 2007.
[4] Hailin Peng, Chong Xie, David T. Schoen, and Yi Cui, “Large Anisotropy of Electrical Properties in Layer-Structured In2Se3 Nanowires”, Nano Letters, Vol. 8, pp. 1511-1516, 2008.
[5] Yen-Chin Huang, Zhen-Yu Li, Wu-Yih Uen, Shan-Ming Lan, K.J. Chang, Zhi-Jay Xie, J.Y. Chang, Shing-Chung Wang, Ji-Lin Shen, “Growth of g-In2Se3 films on Si substrates by metal-organic chemical vapor deposition with different temperatures”, Journal of Crystal Growth , Vol. 310, pp. 1679–1685 ,2008.
[6] D. Nithyaprakash, N. Punithavenia, J. Chandrasekaran, “The effect of annealing temperature on the structural and optical properties of In2Se3 thin films”,
[7] Optoelectronics And Advanced Materials –Rapid Communications, Vol. 4, pp. 357 – 360, 2010. [8] Aytunc- Ates, Mutlu Kundakc, Aykut Astam, Muhammet Yıldırım, “Annealing and light effect on optical and electrical
properties of evaporated indium selenide thin films”, Physica E, Vol. 40, pp. 2709–2713,2008. [9] T.Kato, Y.Utsugi, T.Ohara, T.Muranaka, Y.Nabetani, T.Matsumoto, “Dependence of In2Se3 crystal structures grown on
GaAs (001) substrates on growth temperature and VI/III ratio”, Journal of Crystal Growth, Vol. 311, pp. 847–850, 2009. [10] Tarrant, D. Ermer, J. Conference Record in 23rd IEEE Photovoltaic Specialists Conference, 1993, p. 372. [11] A.F. Qasrawi, “Temperature dependence of the band gap, refractive index and single-oscillator parameters of amorphous
indium selenide thin films”, Optical Materials, Vol. 29, pp. 1751–1755, 2007. [12] V.N. Katerinchuk, M.Z. Kovalyuk, Sov. Phys. Semicond., Vol. 25, pp. 577, 1991. [13] Jian-Jun Wang, Fei-Fei Cao, Lang Jiang, Yu-Guo Guo, Wen-Ping Hu, Li-Jun Wan, “High Performance Photodetectors of
Individual InSe Single Crystalline Nanowire”, J. AM. CHEM. SOC., Vol. 131, pp. 15602-15603, 2009. [14] Anurag Srivastava, R. Chandiramouli, “Band structure and transport studies on impurity substituted InSe nanosheet – A
first-principles investigation”, Superlattices and Microstructures, Vol. 79, pp. 135-147, 2015. [15] Wei Feng, Jing-Bin Wu, Xiaoli Li, Wei Zheng, Xin Zhou, Kai Xiao, Wenwu Cao, Bin Yang, Juan-Carlos Idrobo,
Leonardo Basile, Weiquan Tian, PingHeng Tan, PingAn Hu, “Ultrahigh photo-responsivity and detectivity in multilayer InSe nanosheets phototransistors with broadband response”, J. Mater. Chem. C, Vol. 3, pp. 7022, 2015.
[16] Xuhui Sun, Bin Yu, Garrick Ng, Thuc Dinh Nguyen, and M. Meyyappan, “III-VI compound semiconductor indium selenide (In2Se3) nanowires: Synthesis and Characterization”, Applied Physics Letters, Vol. 89, pp. 1-3, 2006.
[17] Bin Yu, Sanghyun Ju, Xuhui Sun, Garrick Ng, Thuc Dinh Nguyen, and M. Meyyappan, David B. Janes, “Indium selenide nanowire phase-change memory”, Applied Physics Letters, Vol. 91, pp. 1-2, 2007.

International Conference on Inter Disciplinary Research in Engineering and Technology 55
Cite this article as: Monisha Singh, Sangita Srivastava. “Functional Clothing for Renal Failure Patients”.
International Conference on Inter Disciplinary Research in Engineering and Technology (2016): 55-58.
Print.
International Conference on Inter Disciplinary Research in Engineering and Technology 2016 [ICIDRET 2016]
ISBN 978-81-929866-0-9 VOL 01 Website icidret.in eMail [email protected] Received 21-December-2015 Accepted 30-December-2015 Article ID ICIDRET012 eAID ICIDRET.2016.012
Functional Clothing for Renal Failure Patients
Monisha Singh1, Sangita Srivastava2 1Junior Research Fellow, Department of Home Science, University of Allahabad, Allahabad U.P
2Professor, Department of Home Science, University of Allahabad. Allahabad. U.P
Abstract: The persons above 60 years of age till the end of life are considered as elderly. The older age is mainly characterized by declining physical activities and occurrence of many diseases like cardiovascular diseases, kidney failure, dementia, unconsciousness etc. The outcome of many of these diseases is the use of urinary catheter. Elderly people are required to use these urinary catheters for longer period of time which causes difficulty in wearing clothes. So there is requirement of such clothing styles which does not cause difficulty in dressing and undressing to the elderly person using urinary catheters and their caregivers. The researcher has designed some clothing for such elderly so that dressing and undressing could be made easier and simpler and carrying catheter bag is no more trouble for them. Keywords: Clothing, elderly, catheter.
INTRODUCTION
Aging is a natural phenomenon in human life. It is a normal process which causes changes in the physiology, psychology, anatomy of human being. Most of these changes are degenerative in nature and most of them suffer from some kind of chronic sickness. Due to their diseased state of body we see them in poor attire, and in the subconscious mind, they do not want to be seen. Human beings are gregarious species. Isolation leads to a poor mental function leading up to dementia, bipolar disorders, ADHD and even Alzheimer’s. The researcher investigated these issues through questionnaires and interview method. The researcher then decided to design some functional dresses which were close to usual formal dressing; yet performing the functional requirement of ailing the persons of both sexes. One of the most common health problems in older age is involuntary emission of urine due to kidney diseases, dementia, stroke etc. In such patients urinary catheters are used. These catheters have a tube which leads to drainage bag that holds collected urine. These drainage bags can be attached with elastic bands to leg of elderly but they find it ugly and out of place. Hence, they carry the drainage bag in their hand. The appearance of a person with a urine bag in his/her hand is socially unacceptable. People just like to drift away from such patients. There is requirement of clothing which has incooperated features to manage the urinary catheters. The clothing should be in cooperated with features so that dressing and undressing become comfortable and the patients give an appearance of being dressed like any other normal person. In this study a set of new functional clothing for the catheters users were designed. While designing the clothing for catheter user, main attention was paid to the features which are;
� More comfortable � Allow easy access for care and emptying the urine from drainage bags from time to time. � Easier to manage either independently or with assistance from a caregiver � Varied clothing features which presents no distinction from others � Aesthetically beautiful which beautifies their outward appearance.
This paper is prepared exclusively for International Conference on Inter Disciplinary Research in Engineering and Technology 2016 [ICIDRET] which is published by ASDF International, Registered in London, United Kingdom. Permission to make digital or hard copies of part or all of this work for personal or classroom use is granted without fee provided that copies are not made or distributed for profit or commercial advantage, and that copies bear this notice and the full citation on the first page. Copyrights for third-party components of this work must be honoured. For all other uses, contact the owner/author(s). Copyright Holder can be reached at [email protected] for distribution.
2016 © Reserved by ASDF.international

International Conference on Inter Disciplinary Research in Engineering and Technology 56
Cite this article as: Monisha Singh, Sangita Srivastava. “Functional Clothing for Renal Failure Patients”.
International Conference on Inter Disciplinary Research in Engineering and Technology (2016): 55-58.
Print.
Methodology The design of the clothing should be such that it must fulfil all the needs and satisfy the preference of users, hence an extensive interview was done on the clothing problems, needs and preferences of the elderly men. Based on the interview and questionnaires these problems were diagnosed-
• Problem in dressing and undressing.
• Problem in emptying the drainage bag from time to time.
• Problem in carrying the drainage bag.
• Problem with lack of aesthetic dressing consideration in their functional clothing design. On the basis of result of interview a set of new functional clothing for urinary catheter user was designed, and focus was given on the points which came out of the extensive review about clothing needs and problems. The clothing should have functionality but at the same time the aesthetics of clothing should also be pleasing. The new designs were made with some modifications and adaptation in order to make clothing more comfortable, functional, beautiful and convenient to use. Principles in designing functional clothing
• Functionality- the design must be practical. It should be in cooperated with features that are easy to put on and take off, provide easier for emptying the drainage bags and provide access to carry the drainage bags. Cotton fabric is used for making trousers as it is comfortable and can be sterlized.
• Aesthetics- the design should have hidden variation, from the normal clothing, but should give the patient a feeling of being dressed like all the others. It is important to maintain the self-esteem and confidence of the patient. This can be reposed in him only with his being able to dress normally and feel normal.
Clothing designs for catheter users
Design 1 This is an adaptive trouser for elderly men who have been put on a catheter due to any particular ailment. The main features added in trouser to increase its functionality are;

International Conference on Inter Disciplinary Research in Engineering and Technology 57
Cite this article as: Monisha Singh, Sangita Srivastava. “Functional Clothing for Renal Failure Patients”.
International Conference on Inter Disciplinary Research in Engineering and Technology (2016): 55-58.
Print.
• Elasticized at waist (A)-this added feature increase the comfort properties of the garment as now dressing and undressing become easier and will also adjust to increasing or decreasing size of waist
• A small opening in the lower limb region (B)-this feature provide opening in the leg of trouser so that catheter pipe can be handled easily and gracefully.
• A pocket on the lower part of the trouser (C) -The small size drainage bag is measured and according to that size a pocket has been attached. This will provide a space for keeping the drainage bag and now there is no need to carry the drainage bag on their hand.
• Longer fly till the lower part with Velcro closure- This feature will provide easier access for inserting and removing the catheter tube,
• All these features also make the process of emptying the drainage bags from time to time much easier and faster and also lessen the risk of infections.
Design 2
This is another adaptive trouser for the elderly using urinary catheters. This trouser also have elasticized waist and longer fly with Velcro closure but other features vary from design 1 such that
• Zipper opening at the side seam of the leg of the trouser (D)- this will provide easier access for emptying the drainage bag and handling it easily.
• Concealed pocket on the inner side of trouser (E)-this provide access for keeping the drainage bags without its visibility. This feature provide functionality and beautification in the same time.
• The trousers are wider by 1.5” at the bottom in order to adjust the drainage bag.
Results and Discussions 20 pieces of these newly designed functional trousers were prepared. 10 pieces of each design were prepared. These trousers were then provided to 3 reputed hospitals in Allahabad city. The evaluation was done by the doctors, patients using urinary catheter themselves and also their caregivers. On a likert scale of 10, the trousers were evaluated on the following attributes. It got a mean score of the following from all members. The trousers were found to be really functional and they were highly accepted. About 86.3% of the patients, their caregivers and doctors like this dress.

International Conference on Inter Disciplinary Research in Engineering and Technology 58
Cite this article as: Monisha Singh, Sangita Srivastava. “Functional Clothing for Renal Failure Patients”.
International Conference on Inter Disciplinary Research in Engineering and Technology (2016): 55-58.
Print.
This data suggest that the newly designed functional trousers are highly acceptable and prove to be a new innovation infield of clothing design. The clothing is designed skilfully by giving focus on style and colour; hence combining functional and aesthetic properties in perfect way.
Conclusion Two functional designs for the elderly male using urinary catheter are prepared. In designing these trousers much consideration was given to the daily activities of catheter users .The designs were user oriented. Much thinking and work has gone into critically thinking about the aesthetic appearance and largely the comfort of the patients. All the patients measured low self-worth and a kind of mental depression. But when they wore these functional trousers there was significant enhancement in their self-worth and levels of well-being. Howsoever ill a patient may be, but he/she always wants to show his bright side to the world. Least of all would like to live with sympathy for him in other people’s eyes. More work could be done in this field for patients of other diseases, in our endeavour to brighten up the world of the suffering people
REFERENCES
1. Wang Y,Wu D,Zhao M and Li J “Evaluation on an ergonomic design of functional clothing for wheelchair users”, Applied ergonomics,45(2014)550-555
2. Chang W, Zhao Y.Guo R, Wang Q and Gu X “Design and study of clothing structure for people with limb disabilities” Journal of Fibre bioengineering and informatics, ,2,( 2009), 62-67
3. Civitci S “An ergonomic garment design for elderly Turkish men” , Applied ergonomics, , 35,( 2004),243-251 4. . Rosenblad-Wallin E, “User orientated product development applied to functional clothing design” , Applied ergonomics,16
(1985),279-287 5. Hoy B,Wagner L, Hall “The elderly patient’s dignity. The core value of health” International Journal of Qualitative Studies
on Health and Well-being,2(2007): 160-168
Attributes Design1 Design2 Aesthetics 8.6 9.1 Functionality 8.5 9 Wear ability 9 9 Usage 8 8.4 Acceptance 8.5 9.5

International Conference on Inter Disciplinary Research in Engineering and Technology 59
Cite this article as: Shivani Srivastava, Sangita Srivastava. “Essential Oil Impregnation on Wool Fabric for
Aromatherapy”. International Conference on Inter Disciplinary Research in Engineering and Technology
(2016): 59-62. Print.
International Conference on Inter Disciplinary Research in Engineering and Technology 2016 [ICIDRET 2016]
ISBN 978-81-929866-0-9 VOL 01 Website icidret.in eMail [email protected] Received 22-December-2015 Accepted 30-December-2015 Article ID ICIDRET013 eAID ICIDRET.2016.013
Essential Oil Impregnation on Wool Fabric for Aromatherapy
Shivani Srivastava1, Sangita Srivastava2
1Research Scholar, Department of Home Science, University of Allahabad, Allahabad U.P 2Professor, Department of Home Science, University of Allahabad. Allahabad. U.P
Abstract: Aromatherapy is a form of an alternative medicine. In recent years fragrance embedded textiles are being developed in areas of sustainability, environment consciousness, for healthy life style and well-being. Essential oil of several best known aromatic plants have therapeutic and sedative properties. It is important to develop such type of finished textile material in order to promote healthy and eco-friendly life style. Correct selection of oil and aroma must be considered before finish application. All fabrics take up and release oil & aroma differently depending upon their fibre structure. In present study wool fabric was identified best suitable for aromatherapy. Keywords: Aromatherapy, Essential oil, Wool, Silk.
INTRODUCTION
Aromatherapy is also known as essential oil therapy. It is an art of using essential oil extracted from plant sources like herbs and flower to produce pharmaceutical and sedative effect on body’s immune system. A study reported effect of each fragrance on human health1. Essential oil is secondary plant metabolites and these are synthesized in different part of plants such as leaves, flowers, stems, roots and seeds. An oil essence can impart medicinal effect separate from the aroma but more often they are intertwined2. Aromatic plants and essential oil are eco-friendly and generally there is absence of any side effect arising by use of essential oil3. In present study two aromatherapy oils viz. lemongrass (Cymbopogon flexuous) and citronella (Cymbopogon winterianus) were used. Lemongrass is a medicinal aromatic plant which is used for its different pharmaceutical and sedative properties. The pharmaceutical effect of lemongrass is that it is used for treating digestive tract spasms, high blood pressure, convulsions, vomiting, and as mosquito repellent and for sedative effect like it reduce anxiety and stress4. Citronella is also a medicinal aromatic plant and its essential oil is rich in citronellal, citronellol & geraniol5. Citronella oil is most importantly used as mosquito repellent. All fabric takes up oil and aroma differently we should have better understanding of which fabric is better receptor of oil and aroma. Protein fibres are excellent media to transfer fragrance and to retain it for longer time. Under present study pure wool and pure silk fabric were chosen to compare aroma retention property of wool. Wool is natural protein fibre and polymer system of wool fibre consists of salt linkage and hydrogen bonding. Hydrogen bonds are very weak bond which are formed between the hydrogen and nitrogen atom which breaks easily as water or any substance like oil and aroma enter into the fibre polymer system. Wool is very hygroscopic in nature it has more amorphous areas than that of silk however the scaly structure of wool makes it partially water repellent but once water or other substances like oil and aroma penetrate the fibre surface it get absorbed quickly and has good retention for a longer time. Wool is an amphoteric substance in nature this means that it will unite with and react toward both acid and bases6. Silk is also a protein fibre like wool. Silk differs from the wool polymers as follows7:
• Silk composed of 16 amino acids with the 20 amino acid of wool.
This paper is prepared exclusively for International Conference on Inter Disciplinary Research in Engineering and Technology 2016 [ICIDRET] which is published by ASDF International, Registered in London, United Kingdom. Permission to make digital or hard copies of part or all of this work for personal or classroom use is granted without fee provided that copies are not made or distributed for profit or commercial advantage, and that copies bear this notice and the full citation on the first page. Copyrights for third-party components of this work must be honoured. For all other uses, contact the owner/author(s). Copyright Holder can be reached at [email protected] for distribution.
2016 © Reserved by ASDF.international

International Conference on Inter Disciplinary Research in Engineering and Technology 60
Cite this article as: Shivani Srivastava, Sangita Srivastava. “Essential Oil Impregnation on Wool Fabric for
Aromatherapy”. International Conference on Inter Disciplinary Research in Engineering and Technology
(2016): 59-62. Print.
• The silk polymer does not composed of any sulpher containing amino acids. Hence the polymer system of silk does not contain any disulfide bond.
• The silk polymer occurs only in the beta-configuration. Salt linkage enables to absorb moisture and other substances. Silk has very crystalline structure and it has less amorphous areas than wool therefore it is less absorbent than wool6. Fibre polymer system of wool and silk fibre is given in figure: 1.
(a) (b)
Fig: 1
a) Salt linkage between two wool polymer and the formula for silk polymer is same but silk does not contain disulphide bond as
wool. b) Hydrogen bond formation between two wool polymers. Dotted line indicates hydrogen bond and formula for hydrogen
bond formation is same for silk polymer.
MATERIALS AND METHOD Materials Two aromatherapy oils citronella and lemongrass oil mixed with 80% ethyl alcohol solution of varied concentration were used as impregnation material on fabric. Pure wool and pure silk fabric were taken for study. Preparation of fabric All preliminary processes such as desizing scouring bleaching were done prior to finish application. All these process removes the impurities and enhance the ability for proper impregnation of finishing solution to the fabric. Then the samples were cut of size 2”×2” each and weighted wool 1.53 gm and silk 0.50 gm. Preparation of solution and impregnation on fabric 80% of ethyl alcohol was used with varying concentration of two different aromatic essential oils viz. citronella and lemongrass oil. All fabrics weighing wool 1.53 gm & silk 0.50 gm were kept immersed in the given solution of varied oil concentration for 24 hours then squeezed dried and cured. Olfactrometery analysis It is a kind of sensory evaluation done by a group of panelist after treatment at intervals of 5th day 10th day 20th day and 30th day. The intensity of aroma categorized as follows: 0-no order, 1- very weak, 2-weak, 3-medium strong, 4-strong, 5- very strong.
Result and Discussion Physical properties of treated fabric were assessed to compare changes occur after finish application.

International Conference on Inter Disciplinary Research in Engineering and Technology 61
Cite this article as: Shivani Srivastava, Sangita Srivastava. “Essential Oil Impregnation on Wool Fabric for
Aromatherapy”. International Conference on Inter Disciplinary Research in Engineering and Technology
(2016): 59-62. Print.
Fabric weight (gm) The fabric weight of control wool fabric was observed as 1.53 gm and change in weight of treated wool was fabric observed as 2 gm, weight of control silk fabric was observed as 0.50 gm and treated silk fabric was 1 gm. It is clear from table 1 that wool fabric absorbed more oil in comparison to silk. Fabric Thickness (mm) Thickness of controlled wool fabric was noticed as 0.81 mm. and after treated with aromatherapy oil average increase in thickness was observed as 0.95 mm, control silk fabric thickness was 0.42 mm and after treatment it was observed as 0.57 mm.
Table: 1 Physical property of controlled and treated fabrics Type of fabric Type of sample Fabric weight (gm) Fabric thickness (mm)
WOOL controlled 1.53 0.81 treated 2 0.95
SILK controlled 0.50 0.42 treated 1 0.57
Evaluation of aroma intensity Table 2 represents the olfactory analysis of aroma present in fabrics treated with aromatherapy oils combined with ethyl alcohol at intervals of 5th day 10th day 20th day 30th day. For proper identification of fragrance coffee beans were used to sniff between smelling of samples. Table 2 shows that intensity of aroma remains same by increasing percentage of concentration of solution. So it can be concluded that 10% concentrations have as much aroma as 50% concentration. This makes cost effective use of essential oil because we cannot use much quantity of oil.
Table: 2 evaluation of aroma intensity treated with essential oil Type of
fabric Type of
essential oil concentration Evaluation day
Aroma intensity 5th 10th 20th 30th
WOOL
Citronella
10% 5 4 4 3 20% 5 4 4 3 30% 5 4 4 3 40% 5 4 4 3 50% 5 4 4 3
Lemongrass
10% 5 4 3 3 20% 5 4 3 3 30% 5 4 3 3 40% 5 4 3 3 50% 5 4 3 3
SILK
Citronella
10% 4 4 4 3
20% 4 4 4 3 30% 4 4 4 3 40% 4 4 4 3 50% 4 4 4 3
Lemongrass
10% 4 4 3 3 20% 4 4 3 3 30% 4 4 3 3 40% 4 4 3 3 50% 4 4 3 3
0-no order, 1- very weak, 2-weak, 3-medium strong, 4-strong, 5- very strong.
Evaluation of wash durability The wash durability of washed sample is shown in table 3. The wool sample treated with both essential oil shows good intensity of aroma after 10 and 20 wash cycles compare to silk sample

International Conference on Inter Disciplinary Research in Engineering and Technology 62
Cite this article as: Shivani Srivastava, Sangita Srivastava. “Essential Oil Impregnation on Wool Fabric for
Aromatherapy”. International Conference on Inter Disciplinary Research in Engineering and Technology
(2016): 59-62. Print.
Table: 3 evaluation of wash durability Type of
fabric Type of
essential oil Before washing 10 wash cycles 20 wash cycles
wool Citronella 5 4 3 Lemongrass 5 3 3 Silk Citronella 4 4 3 Lemongrass 4 3 3
CONCLUSION
Aromatherapy is an alternative medicine and essential oil of aromatic plant is used to treat several types of ailment. All fabric retains and release aroma differently depending upon fibre structure. We should have better understanding of which fabric is better receptor of oil and aroma therefore correct selection of fabric is very important prior to finish application for better aromatherapy results. In present study impregnation of essential oil was done on pure wool fabric. Silk fabric was also chosen to compare aroma retention property of wool. Fabric sample were kept immersed in varied solution of essential oils containing 80% ethyl alcohol for 24 hours. Physical properties like weight and thickness of fabric also changed after finish application which is given in table 1. An evaluation of intensity of aroma was done at intervals of 5th day, 10th day, 20th day, & 30th day for both the oil by a panel of expert which is given in table 2 and it was found that wool fabric has better retention of aroma compare to silk.. Wash durability evaluation was also done which is given in table 3 wool fabric shows good wash durability after 10 and 20 wash cycles for both essential oil compare to silk Fig. 1 shows the molecular structure of wool and silk fibre. Wool is highly hygroscopic in nature as it has more amorphous areas than that of silk so when water or other substances like oil and aroma once penetrate the fibre surface it get absorbed quickly and has good retention for a longer time. By all the tables it is clear that wool fabric is higher absorber of aroma and also retains aroma for a longer time than silk therefore wool fabric is best suitable for aromatherapy.
REFERENCES
1. Brown D. Aromatherapy, Lincolnwood (NTC Publishing Group, Chicago) 1996, 51 2. Buchbaur, G. & Jirovetz, L Aromatherapy-use of fragrance & essential oil as medicaments, Flavour Fragr. J. (1994) 9. 212-222. 3. Verdet (1989) why phytotherapy? Aromatherapy study trip lecture notes. Hinckley: Price. 4. Satyabrata & K A Geetha Floriculture (Ornamental, Medicinal & Aromatic Crops). 5. Katiyar, R., Gupta, S., Yadav, K.R. (2011): Cymbopogon winterianus: an important species for essential java Citronella oil and
medicinal values, National Conference on Forest Biodiversity: Earth‟s living treasure, 22 May, FRI, Kanpur. 6. Norma Hollen & Jane Saddler, (Textiles) pp. 29. 7. E.P.G Gohl & L. D Vilensky the Protein Fibre (Textile Science) pp 83-86.

International Conference on Inter Disciplinary Research in Engineering and Technology 63
Cite this article as: Renu Singh, Sangita Srivastava. “Silk Dyeing with Natural Dye Extracted from Spice”.
International Conference on Inter Disciplinary Research in Engineering and Technology (2016): 63-67.
Print.
International Conference on Inter Disciplinary Research in Engineering and Technology 2016 [ICIDRET 2016]
ISBN 978-81-929866-0-9 VOL 01 Website icidret.in eMail [email protected] Received 22-December-2015 Accepted 30-December-2015 Article ID ICIDRET014 eAID ICIDRET.2016.014
Silk Dyeing with Natural Dye Extracted from Spice
Renu Singh1, Sangita Srivastava2 1Junior Research Fellow, Department of Home Science, University of Allahabad, Allahabad U.P
2Associate professor and Head Department of Home Science, University of Allahabad. Allahabad. U.P
Abstract: Textile dyeing plays a very important role in textile processing industry. Finding of researches conducted in recent years showed that chemicals used in synthetic dyes may contain toxic elements such as benzidine, aryl amine, lead, cadmium, zinc, mercury, formaldehyde, pentachlorophenol and halogen carrier etc.. Use of such dyes in textiles is associated with environmental degradation as well as hazards on health of human and other living beings viz creating skin cancer, skin irritation, lungs problem and allergy. Due to such negative impact of synthetic dyes researches in the field of textile dyeing has been focused on substitute preparation of synthetic dyes. Dyes of natural origin are environment friendly in nature and have no side effect on skin. The present study deals with the extraction of natural dye from spice and its application on textile fabric. Dye was extracted in acidic medium. For improving dyeability of textile substrate, mordanting of the fabric was done with alum mordant. In experiment, pre, post and simultaneous mordanting techniques were used for mordanting of the fabric. Attempt has been made to investigate the overall colour fastness properties of dyed textile material. Keywords: natural dye, synthetic dye, dyeing, mordants, colour fastness, environment friendly.
INTRODUCTION
Nature expresses itself in a wide spectrum of colours all around us. The alchemy of colours started from an early time. Indians have been forerunners in the art of natural dyeing. The advent of synthetic dyes caused rapid decline in the use of natural dyes. 1 These synthetic dye stuffs produced hazardous by‐products some of which possess carcinogenic intermediates and hence a ban has been imposed by Germany and some other European countries on the use of benzidine dyes in textile garments exported into their countries. 2 The interest in use of dyes and colours of natural plant sources for colouring textile, food and pharmaceutical and cosmetic products is increasing demand for plant origin of dyes particularly for textile application is due to consumer desire to replace synthetic chemical by natural compounds 3 . Skin demands safer textile products especially for babies and children as reported in the EU needs for qualified products.4 the usage and production of natural dyes from plant sources has become better known due to growing awareness of the environment and health care.5 Natural dyes are generally used in combination with mordants which have affinity for both colouring matter and the fibre, hence by combining them with the dye they form an insoluble precipitate on the fabric. 6
With the help of mordants different colours and its tones can be obtained from a single dye source. Various studies have been carried out by different scientists on effect of mordants and mordanting techniques. It is reported that colour depth vary from mordant to mordant and mordanting technique to mordanting technique.7 The present paper is primarily focused on the determination of the impact of mordanting method in colorfastness of natural dye obtained from byproduct of black cardamom .
MATERIALS
1. SOURCE: Peel of black cardamom was used as a source of natural dye.
This paper is prepared exclusively for International Conference on Inter Disciplinary Research in Engineering and Technology 2016 [ICIDRET] which is published by ASDF International, Registered in London, United Kingdom. Permission to make digital or hard copies of part or all of this work for personal or classroom use is granted without fee provided that copies are not made or distributed for profit or commercial advantage, and that copies bear this notice and the full citation on the first page. Copyrights for third-party components of this work must be honoured. For all other uses, contact the owner/author(s). Copyright Holder can be reached at [email protected] for distribution.
2016 © Reserved by ASDF.international

International Conference on Inter Disciplinary Research in Engineering and Technology 64
Cite this article as: Renu Singh, Sangita Srivastava. “Silk Dyeing with Natural Dye Extracted from Spice”.
International Conference on Inter Disciplinary Research in Engineering and Technology (2016): 63-67.
Print.
2. SUBSTRATE: Pure mulberry silk fabric was used as a textile material.
3. CHEMICALS USED: Alum or hydrated potassium aluminium sulfate (potassium alum) was used for mordanting while hydrochloric acid was used for preparation of acidic medium of dyeing.
4. PROCUREMENT OF THE SAMPLE: Silk fabric and black cardamom were procured from the market.
5. LOCALE OF THE STUDY: The study was conducted in the chemistry laboratory of Department of Home Science, University of Allahabad (U.P.).
METHODS
Preparation of dye powder: Black cardamom was dried in shade and peel was separated followed by grinding to make into fine powder. Dye powder was used for dyeing purpose. Preparation of textile material: Degumming of silk was done by dipping it into 0.5 % of mild detergent solution having 500C temperature. It was stirred gently for 30 minutes. Silk fabrics of one gram weight of required number were prepared by weighing for experimentation. Preparation of acidic medium: For preparation of acidic dye bath 1 ml of hydrochloric acid was added in 100 ml of distilled water. Preparation of mordanting solution: Mordating solution was prepared by add 1gm of potassium alum in 100 ml of distilled water. Dye extraction Prepared dye powder was soaked in acidic medium and heated in a beaker kept over a water bath for quick extraction. It was then filtered. The extract was used keeping. M:L ratio as 1:100 for dyeing. The fabric was immerged in the filtered extract and it is dyed for one hour with continuous stirring. The samples were left immersed in the dye solution for 24 hours. Mordanting of samples: The silk fabric was treated with alum mordant by following three methods:
• Pre mordanting: In this method samples were pretreated with the alum solution and then dyed with the dye extract.
• Simultaneous mordanting: In this method the samples were dyed with dye extract along with alum mordant.
• Post mordanting: In post mordanting the samples were dyed first and then treated with modanting solution. After mordanting and dyeing, the fabrics were tested for colour fastness.
RESULTS AND DISCUSSION
Table 1: Colours obtained with different mordants using black cardamom dye Dye Source
Mordant Methods of Mordanting
Medium of Mordanting
Shades of Colour
Peel of black cardamom
Alum
Pre Acidic
Simultaneous Acidic
Post Acidic

International Conference on Inter Disciplinary Research in Engineering and Technology 65
Cite this article as: Renu Singh, Sangita Srivastava. “Silk Dyeing with Natural Dye Extracted from Spice”.
International Conference on Inter Disciplinary Research in Engineering and Technology (2016): 63-67.
Print.
Colours of dyed silk samples The different colours were developed by using different methods of mordanting i.e. pre post and simultaneous mordanting. Acidic and alkaline mediums were used for extraction of dye and application of dye on silk fabric. Obtained colours are listed in table 2. The results obtained are reported and discussed in the above section COLOUR FASTNESS TESTS Colour fastness to Light In the colour fastness to light, the samples dyed with peel of black cardamom using mordant in acidic mediums, it was found that post mordanting improved fastness to light because the sample showed no colour fading and no change in colour. Light fastness rating was 4/5 for pre and simultaneous mordanted fabrics.
Graph 1
Colour fastness to washing Graph 3 reveals that sample dyed with all the three mordanting methods results in good wash fastness. All the samples showed no fading and no staining on either of the adjacent fabrics (silk and cotton) but pre, simultaneous and post mordanted fabrics showed much change in colour i.e. 3/4, 3/4 and 4 respectively.
Graph 2
Colour fastness to crocking: Overall, it can be concluded from the result that, dry crocking is better than wet crocking. Simultaneous and post mordanting were found excellent towards both dry and wet crocking. In wet crocking pre mordanted silk fabric showed slight change in colour (4/5).
3
3.5
4
4.5
5
5.5
Pre Simultanious Post
Lig
ht
fast
ne
ss g
rad
e
Method of mordanting
Light fastness
0
1
2
3
4
5
6
Pre Simultanious PostWa
sh f
ast
ne
ss g
rad
e
Method of mordanting
Wash fastnessChange in
colour
Staining on
cotton

International Conference on Inter Disciplinary Research in Engineering and Technology 66
Cite this article as: Renu Singh, Sangita Srivastava. “Silk Dyeing with Natural Dye Extracted from Spice”.
International Conference on Inter Disciplinary Research in Engineering and Technology (2016): 63-67.
Print.
Graph 3
Colour fastness to perspiration: It was found that post mordanted samples dyed with peel of black cardamom exhibit good perspiration fastness. Table 6 reveals that the alkaline perspiration fastness of all the samples was better than acidic perspiration but samples tend to change colour in alkaline perspiration. In acidic perspiration test, pre mordanted fabric showed slight change in colour (4/5) and staining on silk fabric (4/5)
Graph 4
Graph 5
3
3.5
4
4.5
5
5.5
Change in colour Staining on Cotton Change in colour Change in colour
Dry crocking Wet crocking
Cro
ckin
g f
ast
ne
ss g
rad
eCrocking fastness
Pre
Simultanious
Post
0
1
2
3
4
5
6
Pre Simultanious Post
Pe
rsp
ira
tio
n f
ast
ne
ss g
rad
e
Method of mordanting
Acidic perspirationChange in
colour
Staining on
cotton
0
2
4
6
Pre Simultanious Post
Pe
rsp
ira
tio
n
fast
ne
ss g
rad
e
Method of mordanting
Alkaline perspirationChange
in…

International Conference on Inter Disciplinary Research in Engineering and Technology 67
Cite this article as: Renu Singh, Sangita Srivastava. “Silk Dyeing with Natural Dye Extracted from Spice”.
International Conference on Inter Disciplinary Research in Engineering and Technology (2016): 63-67.
Print.
Conclusion
It can be concluded from the above results that mordanting done in the acidic medium improves the colour fastness. Some samples showed change in colour in acidic and alkaline perspiration test. Post mordanted fabric results in good colour fastness. Overall, the serviceability of the dyed fabric with black cardamom was found good. Cost of the dye is very low as it is made from byproduct of black cardamom. It is eco-friendly because it is made from natural raw material. So, it may be used for production of dyed textiles on a large scale.
REFERENCES
1. Vankar P.S. 2000. Chemistry of Natural Dyes. General article. Resonance. 73-80. 2. Kumaresan M., Palanisamy P.N. and Kumar P.E. 2011. Application of ecofriendly natural dye on silk using combination of
mordants. International Journal of Chemistry Research. 2(1) : 11-14 3. Goodarzian H. and Ekrami E. 2010. Extraction of dye from madder plant (Rubbia Tinctorium L.) and dyeing of wool. World
Applied Science Journal. 9 : 434-436. 4. Alkiker R., Durig G. and Marconi E. J. 1988. List of colourant to be classified as toxic Journal of the Society of Dyers and
Colourists 104: 99-100. 5. Adeel S., Ali S., Bhatti I. A. and Zsila F. 2009. Dyeing of cotton fabric using pomegranate (Punica granatum) aqueous
extract. Asian Journal of Chemistry. 21:3493-3499. 6. Gupta D, 2001. Dyeing with natural dyes- Theory and Practice, In : Natural Dyes, Convention Proceedings by D Gupta and
ML Gulrajani (Eds). Department of Textile Technology. IIT. Delhi. pp. 10-16. 7. Pruthi N., Chawla G. D. and Yadav S. 2008. Dyeing of silk with barberry bark dye using mordant combination. Natural
Product Radiance. Vol. 7(1): 40-44.

International Conference on Inter Disciplinary Research in Engineering and Technology 68
Cite this article as: Siddhant Agarwal. “Review on Application of Augmented Reality in Civil Engineering”.
International Conference on Inter Disciplinary Research in Engineering and Technology (2016): 68-71.
Print.
International Conference on Inter Disciplinary Research in Engineering and Technology 2016 [ICIDRET 2016]
ISBN 978-81-929866-0-9 VOL 01 Website icidret.in eMail [email protected] Received 22-December-2015 Accepted 30-December-2015 Article ID ICIDRET015 eAID ICIDRET.2016.015
Review on Application of Augmented Reality in Civil Engineering
Siddhant Agarwal1
1Civil Engineering Department, Amity University Uttar Pradesh-Lucknow Campus
Abstract: This paper examines the concept of Augmented reality and its various applications in civil engineering. The concept envisages reducing, or rather eliminating errors that creep in during construction process due to human and other technical errors. The concept of AR helps in recreating the architectural and structural drawings in actual scale on the field. This uses the techniques of holographic projections and other mobile applications to create a 3D image of the drawing. The Concept is to create an image of the structure as envisaged on the basis of calculations and compare it in real time with the actual construction, which can help in identifying errors quickly and efficiently. Keywords: Augmented Reality, Error Reduction, Innovation.
INTRODUCTION
Augmented reality (AR) is a live direct or indirect view of a physical, real-world environment whose elements are augmented (or supplemented) by computer-generated sensory input such as sound, video, graphics or GPS data. It is related to a more general concept called mediated reality, in which a view of reality is modified (possibly even diminished rather than augmented), by a computer. As a result, the technology functions by enhancing one’s current perception of reality. By contrast, virtual reality replaces the real world with a simulated one. Augmentation is conventionally in real-time and in semantic context with environmental elements, such as sports scores on TV during a match. With the help of advanced AR technology (e.g. adding computer vision and object recognition) the information about the surrounding real world of the user becomes interactive and digitally manipulable. Artificial information about the environment and its objects can be overlaid on the real world. The whole construction process is dynamic and consists of many parallel processes. It is affected by troubles, which appear within the construction sequence, and can influence the workflow of a whole chain of building vehicles. Here troubles can occur during the construction work, which cannot be anticipated during the planning phase. Not optimal co-operating teams of building vehicles are referred as disturbance of the workflow. Aggravatingly each building project is unique and a planning and control system does not exist. To address the mentioned issues building vehicles are equipped with sensors. This is not a GPS-receiver like a car sat, but rather a specific technology with increased accuracy. Additional sensors are able to collect the excavator bucket, shield tilting dozer position and orientation in an exact way. Furthermore technical data like maintenance interval, amount of diesel and pressure of engine oil are known, so that a huge data basis exists. This kind of continuity of 3D- and technical data may be supported by attempts like Building Information Modeling (BIM) and the 5D Initiative
AUGMENTED REALITY IN ARCHITECTURE, ENGINEERING AND CONSTRUCTION
The application of visualization techniques such as AR for planning, analysis, and design of Architecture, Engineering, and Construction (AEC) projects is relatively new compared to the sizeable amount of AR-related research conducted for diverse
This paper is prepared exclusively for International Conference on Inter Disciplinary Research in Engineering and Technology 2016 [ICIDRET] which is published by ASDF International, Registered in London, United Kingdom. Permission to make digital or hard copies of part or all of this work for personal or classroom use is granted without fee provided that copies are not made or distributed for profit or commercial advantage, and that copies bear this notice and the full citation on the first page. Copyrights for third-party components of this work must be honoured. For all other uses, contact the owner/author(s). Copyright Holder can be reached at [email protected] for distribution.
2016 © Reserved by ASDF.international

International Conference on Inter Disciplinary Research in Engineering and Technology 69
Cite this article as: Siddhant Agarwal. “Review on Application of Augmented Reality in Civil Engineering”.
International Conference on Inter Disciplinary Research in Engineering and Technology (2016): 68-71.
Print.
applications in fields such as manufacturing, medical operations, military, and gaming. A thorough statistical review of recent AR-related research studies in AEC and potential future trends in this area was recently conducted by Rankohi and Waugh [1]. Their work showed that field workers and project managers have high interest in using non-immersive and desktop standalone AR technologies during project construction phase mainly to monitor progress and detect defective work. In another study, the potential of AR applications in AEC including eight work tasks (i.e., layout, excavation, positioning, inspection, coordination, supervision, commenting, and strategizing) was discussed. We can observe that over the years, the field of AEC has become more complex with the advent of various new technologies and materials. The designs are not confined to conventional strategies anymore. This is the reason AR is poised to become an important part of this sector in the times to come.
NEED OF AUGMENTED REALITY IN AEC
As mentioned earlier, the architects and designers have slowly moved away from conventional designs and are now exploring new avenues of designs and detailing. Across the world, we have many examples of unconventional architectures and the extreme engineering that has come into play in executing these structures. Designing a structure and its subsequent analysis using software has now become a norm. Regardless of the shape or the size, the analysis has become easier. But when it comes to executing those designs on the field, we still rely on human experience and intuition. Regardless of the control measures that are taken to ensure quality, it is rarely easy to sustain the level of perfection that a computer analysis can achieve. Augmented Reality aims to bridge this gap. Currently, the engineers in the field rely on scaled drawings in all projects that are used for all practical purposes. And this is where human error tends to creep in the execution. Even if there is a slight difference in measurement and its subsequent application, it tends to multiply as the project progresses and may at times cause problems in later stages. With the concept of AR, the engineer can review the structure as it progresses with the drawings by projecting the drawing onto the field. This will help in identification of flaws and errors and rectification of the same in time. Coming to a second aspect of the AEC industry, the client may or may not have a technical aspect and this causes a communication gap between the client and the concessionaire. With the use of AR, the client can be give a virtual tour of the project before it is built so that if any changes are required, they can be incorporated before the project work has commenced.
TECHNOLOGIES AVAILABLE FOR AUGMENTED REALITY
Recent applications of AR technology in AEC domain have helped improve performance in areas such as virtual site visits, comparing as-built and as-planned status of projects, preempting work package schedule disputes, enhancing collaboration opportunities, and planning and training for similar projects [1, 2]. Examples of such application areas include but are not limited to a framework for analyzing, visualizing, and assessing architectural/ construction progress with unordered photo collections and 3D building models [3,4], a client/server AR system for viewing complex assembly models on mobile phones [5] , a tangible MR-based virtual design prototype as a distributed virtual environment (DVE) for the purpose of improving remote design review collaboration [6] , an AR interior design service which combines features of social media, AR and 3D modeling to ambient home design [7], an interactive speech and gesture recognition based, immersive AR model designed to visualize and interact with buildings and their thermal environments [8], an integrated AR based framework for indoor thermal performance data visualization that utilizes a mobile robot to generate environment maps [9] , a tabletop AR system for collaboratively visualizing computer- generated models [10], and a mobile AR application capable of delivering context-aware visual project information to students and trainees to improve the quality and pace of learning [11]. During the course of the literature review, the author came across few technologies that are attempting to introduce AR in the AEC industry. Microsoft HoloLens is a wearable, self-contained holographic computer. The device features a see-through, holographic display and advanced sensors that map the physical environment. HoloLens enables users to interact with 3D holograms blended into the real world. In this Mixed Reality Environment, users can pin holograms to physical objects and interact with data using Gesture, gaze and voice commands. Google Glass was another ambitious project in the field of AR that was discontinued.
ADVANTAGES OF AUGMENTED REALITY IN CIVIL ENGINEERING
Use of Augmented Reality in Civil Engineering has tremendous benefits for Civil Engineering. The following benefits can be reaped from the use of the technology:

International Conference on Inter Disciplinary Research in Engineering and Technology 70
Cite this article as: Siddhant Agarwal. “Review on Application of Augmented Reality in Civil Engineering”.
International Conference on Inter Disciplinary Research in Engineering and Technology (2016): 68-71.
Print.
1. Error Reduction The most important advantage that this technology provides to the user is the reduction of errors that may take place during the construction proves. By providing a virtual design on the field, it becomes easier to control the different processes and achieve a better output.
2. Better Marketing Explaining a project to a person without a technical background is a problem that all projects have to face. Architectural drawings may be extraordinary but they are still on a smaller scale and generally 2-D. using the concept of AR, the client can be given a virtual tour of the project, with all the colors and the different views that he can observe from the project. This can lead to better marketing strategies for organizations.
3. Review of the project The drawings under consideration can be reviewed by the Project manager on a real scale, thus identifying small problems and errors that might have crept in or escaped the notice of the designer.
4. Saving of Man-Hours The use of AR aims to reduce errors that creep in while execution of civil engineering works due to various factors such as calculation errors, misreading of drawings etc. These can be avoided by continuous monitoring and review of the work using AR. This would help in reducing the work required for correction of those errors, hence saving the time required for error rectification.
5. Cost Reduction Since error rectification reduces, the cost of material and manpower utilized for that rectification is reduced, that helps in reducing the overall overheads of a project.
CHALLENGES IN IMPLEMENTING AUGMENTED REALITY IN CIVIL ENGINEERING
Cost of AR Technology Being a relatively new concept, the initial costs of setting up an AR system in place can increase the costs of the projects. Yet the continuous reduction of costs in terms of the benefits, this extra cost can be adjusted. 1. Spatial alignment of real and Virtual entities
The goal of spatial registration in AR is to properly align real world objects and superimposed virtual objects with respect to each other [12]. Without proper registration, the illusion that the two worlds coexist inside the augmented space will be compromised. The registration process typically consists of four major steps [13]:
• Positioning the viewing volume of a user’s eyes in the world coordinate system.
• Positioning virtual objects in the world coordinate system.
• Determining the shape of the viewing volume. • Converting virtual objects from the world coordinate system to the eye coordinate system.
2. Development of Applications
The development of applications to incorporate AR into AEC is a challenge, with the field being very vast and diverse.
POSSIBLE APPLICATIONS OF AUGMENTED REALITY IN AEC
1. Design and Development
The concept of AR can very well be used to optimize designs for better space utilization and wastage of space. Spatial models can help the designer identify the flaws and rectify them at the design stage itself. Also, it can help create innovative designs as the architect can see the structure in real time, which can help in various advantageous changes.
2. Translation of drawings onto the field The translation of drawings into a structure is not an easy task. It involves various steps of identification of different structural elements and subsequently constructing them. Since the project is envisaged in phases, it may so happen that errors might creep in during various stages. Since AR creates a virtual image of the structure, it helps in eliminating these errors.
CONCLUSION
As a concept, Augmented Reality can work wonders if applied practically in reality. Construction being a diverse field, AR can help in better and efficient designs and real scale modeling and subsequent changes which can enable the engineer to monitor and supervise the tasks easily. There are significant challenges in application of the concept in the field at present but subsequent research and analysis can lead to development of an effective tool for Construction Management, Designing and Marketing.

International Conference on Inter Disciplinary Research in Engineering and Technology 71
Cite this article as: Siddhant Agarwal. “Review on Application of Augmented Reality in Civil Engineering”.
International Conference on Inter Disciplinary Research in Engineering and Technology (2016): 68-71.
Print.
REFERENCES
[1] S. Rankohi, L. Waugh, Review and analysis of augmented reality literature for construction industry, J. Visual. Eng. (2013) 1–9. [2] V. Kamat, J. Martinez, M. Fischer, M. Golparvar-Fard, F. Peña-Mora, S. Savarese, Research in visualization techniques for field
construction, J. Constr. Eng. Manage. Spec. Iss.: Constr. Eng.: Opportunity Vision Educ. Pract. Res. 137 (10) (2011) 853–862. [3] M. Golparvar-Fard, F. Peña-Mora, S. Savarese, D4AR-A 4-dimensional augmented reality model for automating construction
progress data collection, processing and communication, J. Inform. Technol. Constr. (ITcon) 14 (2009) 129–153. [4] K. Karsch, M. Golparvar-Fard, D. Forsyth, ConstructAide: analyzing and visualizing construction sites through photographs and
building models, in: Proceedings of ACM Transactions on Graphics (SIGGRAPH Asia), Shenzhen, China, 2014. [5] C. Woodward, M. Hakkarainen, M. Billinghurst, A client/server architecture for augmented reality on mobile phones, in: P.
Alencar, D. Cowan (Eds.), Handbook of Research on Mobile Software Engineering – Design, Implementation and Emergent Applications, vol. I, Engineering Science Reference, 2012, pp. 1–16.
[6] X. Wang, P.S. Dunston, Tangible mixed reality for remote design review: a study understanding user perception and acceptance, J. Visual. Eng. (2013) 1– 8.
[7] S. Siltanen, V. Oksman, M. Ainasoja, User-centered design of augmented reality interior design service, Int. J. Arts Sci. 6 (1) (2013) 547–563.
[8] A.M. Malkawi, R.S. Srinivasan, A new paradigm for human-building interaction: the use of CFD and augmented reality, J. Autom. Constr. 14 (1) (2004) 71–84.
[9] R. Lakaemper, A.M. Malkawi, Integrating robot mapping and augmented building simulation, J. Comput. Civ. Eng. 23 (6) (2009) 384–390.
[10] S. Dong, A.H. Behzadan, C. Feng, V.R. Kamat, Collaborative visualization of engineering processes using tabletop augmented reality, vol. 55, Elsevier Journal of Advances in Engineering Software, New York, NY, 2013. pp. 45–55.
[11] A. Shirazi, A.H. Behzadan, Design and assessment of a mobile augmented reality-based information delivery tool for construction and civil engineering curriculum, J. Prof. Iss. Eng. Educ. Pract. (2014). 04014012 (published online).
[12] A.H. Behzadan, V.R. Kamat, Georeferenced registration of construction graphics in mobile outdoor augmented reality, J. Comput. Civ. Eng. 21 (4) (2007) 247–258.
[13] D. Shreiner, M. Woo, J. Neider, T. Davis, OpenGL Programming Guide, Pearson Education (2006). [14] Amir H. Behzadan , Suyang Dong , Vineet R. Kamat, Augmented reality visualization: A review of civil infrastructure system
applications, Elsevier Journal of Advanced Engineering Informatics, USA, 2015, pp 252-267

International Conference on Inter Disciplinary Research in Engineering and Technology 72
Cite this article as: Mragank Sharma, Kriti Rastogi, M Faisal Jamal Khan, Aishwarya Bajpai. “Possibility of
LENR Occurring in Electric Arc-Plasma: Preliminary Investigation of Anomalous Heat Generation during
Underwater Arcing using Carbon Electrodes”. International Conference on Inter Disciplinary Research in
Engineering and Technology (2016): 72-75. Print.
International Conference on Inter Disciplinary Research in Engineering and Technology 2016 [ICIDRET 2016]
ISBN 978-81-929866-0-9 VOL 01 Website icidret.in eMail [email protected] Received 23-December-2015 Accepted 30-December-2015 Article ID ICIDRET016 eAID ICIDRET.2016.016
Possibility of LENR Occurring in Electric Arc-Plasma: Preliminary Investigation of Anomalous Heat Generation during Underwater Arcing using Carbon Electrodes
Mragank Sharma1, Kriti Rastogi2, M Faisal Jamal Khan3, Aishwarya Bajpai4
1,2,3,4Department of Mechanical & Automation Engineering, Amity School of Engineering & Technology, Amity University, U.P Lucknow
Abstract: The author and his students have investigated anomalous heat generation during carbon arcing done under saline water solutions using carbon electrodes. Energy balance calculations, indicate a marginal excess energy of up to 50 % with MS electrodes while with carbon electrodes output to input energy ratios are found to be as high as a factor of eight indicating excess heat up to 700%. We think that the anomalous excess energy could be due to some type of Low Energy Nuclear Reactions (LENR) but the nature of these reactions have not been studied by us so far. The carbon-electrode arc results on heat-accounting corroborate the mass-spectroscopic findings reported by BARC, Texas A & M University and other groups. Keywords: LENR, BARC, Carbon Electrodes.
INTRODUCTION
Nuclear-Fusion is a phenomenon which occurs at extremely high-temperatures of the order of a few million degrees Celsius, as in the core of Sun. Arc-welding is a fabrication-technique in which the metal pieces are joined by melting it with the heat of the electric-arc having a temperature of the order of a few thousand degrees Celsius. Quite obviously it seems that there is no link of nuclear-fusion in arc-welding or in electric-arc. The author, however, in-view-of various reasons such as the appearance of very-strong & intense bright-arc in welding as well as in fatally-dangerous lightning-arc, suspects a possibility of nuclear-fusion (LENR) occurring within the arc. Note that the electric-arc is nothing but plasma i.e., hot ionized gases, so likelihood of nuclear-fusion (LENR) of the positive-ions within the arc cannot be ruled out. Arc-welding is employed routinely in industrial fabrication processes during which metal pieces are joined permanently following local melting caused by the intense heat of the electrically generated arcs. While the temperature produced during conventional industrial arc welding is quite adequate to melt metal samples, it certainly seems insufficient to cause nuclear (hot) fusion reactions. Nevertheless, in view of the growing number of reports in LENR literature that nuclear reactions have been observed in a variety of experimental configurations, it was decided to investigate the possible generation of anomalous heat during underwater arcing. Since in normal arcing in air, heat-balance accounting is quite difficult, it was decided to conduct underwater arcing experiments, wherein some heat produced (except the radiation-heat going-out) would be captured by the water resulting in heating and vaporization of the water, thereby enabling establishment of overall heat balance. The author is not aware of any such previous-studies carried out to correlate the heat generation during arcing with the known input electrical energy. The objective of this research-report is to tell that there exists a possibility of Low-Energy Nuclear-Reaction (LENR) occurring during arc-welding or in electric-arcing; and if it is so, it would open a new possibility of utilizing otherwise-difficult nuclear-fusion for energy-production.
This paper is prepared exclusively for International Conference on Inter Disciplinary Research in Engineering and Technology 2016 [ICIDRET] which is published by ASDF International, Registered in London, United Kingdom. Permission to make digital or hard copies of part or all of this work for personal or classroom use is granted without fee provided that copies are not made or distributed for profit or commercial advantage, and that copies bear this notice and the full citation on the first page. Copyrights for third-party components of this work must be honoured. For all other uses, contact the owner/author(s). Copyright Holder can be reached at [email protected] for distribution.
2016 © Reserved by ASDF.international

International Conference on Inter Disciplinary Research in Engineering and Technology 73
Cite this article as: Mragank Sharma, Kriti Rastogi, M Faisal Jamal Khan, Aishwarya Bajpai. “Possibility of
LENR Occurring in Electric Arc-Plasma: Preliminary Investigation of Anomalous Heat Generation during
Underwater Arcing using Carbon Electrodes”. International Conference on Inter Disciplinary Research in
Engineering and Technology (2016): 72-75. Print.
Underwater Arcing Experiments
The arcing experiments were conducted in Amity School of Engineering & Technology of Amity University (Lucknow, India) with the help of B.Tech. Students under the author’s supervision [1]. In Carbon-Electrode-Arc (CEA) experiments the central carbon-rods of used flashlight torch-cells were taken-out and used. During the first test the calibrated beaker was filled with 1% saline water in which pair of Carbon electrodes were submerged with tips separated with very little distance (stand-off distance). Figures 1 depict the CEA experimental arrangements, the details of the experiments are given in Table 1 and its heat accounting in Table-2. Mostly the arc was discontinuous and from video- clippings of the experiments, arc-stability factor f indicating the fraction of arc-duration of the experiment-time (t) was estimated. The arc-diameter was also observed from video-clippings & still-photographs (Figs 1 & 2), the arc-diameter seems to be much higher where d = 3 mm is taken for the DC-supply (Low-Wattage) experiments, for calculating arc’s surface-area A = 4H r2 = H d2 for radiation-heat calculation in Table-2. Arc-temperature T, usually the welding arc temperature is reported in literature as 6000oK which is taken in the experiment of year 2015; in the subsequent experiments when the encouraging-results in the year 2011 were coming-up, a lower value of arc-temperature of 5000 oK was taken. Actual arc-temperature can be found (though not done here) using optical-pyrometer much easier than with thermocouple, however, its intense illumination does indicate its temperature. The initial volume of saline solution charged in the tank was 1 liter in most cases. In the carbon-rod arcing runs, however, the applied voltage was only 12 Volt from DC-battery and the arcing current was 8 amps. Thus the input power was less than KW and so the arcing could be sustained for 5 to 15 mins. Table-1 summarizes the experimental parameters. It may be noted that in all the runs except the first, the quantity of water lost due to evaporation was hardly 10 to 15 grams which is less than a couple of percent of total tank water volume.
Calorimetric Analysis of Heat Balance Table-2 summarizes the details of heat balance computations. The total Energy input into the system (Ein) during the duration of the experiment is calculated as Ein == V*I*t. It is assumed that current is always flowing during the experimental-runs, even when there is no visible-arc, especially in view of continuous electrolysis. The total heat Energy generated and leading to heating of the water designated as Eout comprises of the following four components:
• ‘Sensible Heat’(Es) utilization which results in increase of water-temperature over and above the initial water-temperature at the time of commencement of arcing.
• Heat used-up in evaporation of water {involving ‘latent heat’(El) of evaporation}.
• Heat produced in ‘radiation processes’(Er) only during the arc-visibility incorporating the arc-stability-factor (f). However, only a small-part (Ea) of the radiation-heat (Er) is absorbed (because of very-high light-transmissibility of water) in the water assisting in its heating, while remaining heat (Er - Ea) is lost outside as (visible & invisible) radiation.
• Energy consumed in ‘electrolysis’ (Ee) of water (generation of hydrogen and oxygen), however this would be small.
• The total heat-output Eout is the sum of ‘heat utilized’ (for heating Es, evaporation El & electrolysis Ee) plus radiation ‘lost-heat’ Er-Ea. Hence, the total heat-output Eout = Es + El + (Er – Ea) + Ee = Es + El + Er + (Ee – Ea). Note that both Ee & Ea are small, the difference would be smaller (can be assumed as tending to zero, especially in absence of good/reliable information about Ee & Ea). Hence, Eout ≈ Es + El + Er as done in Table-2
• For sensible-heat calculation [M1.s.(T2-T1)], specific-heat s = 1 x 4.18 Joule/gram/ oC; for latent-heat calculation [m.L], latent heat of steam-vaporization L = 536 x 4.18 Joule/gram and for radiation-heat calculation [σ.A.ε.T4.t.f)], arc-emissivity ε = 1, σ = 5.67 x 10⁻⁸ W/m2/K4 used; (see Tables 1 & 2).
• It may be noted that ‘heating of the container’ and ‘convection loss’ are completely neglected, its accounting would further increase the excess-heat. The CEA experiments (Fig.1) were conducted in glass-beaker. Although there was no arrangement of ‘stirring’ the water, but boiling-water near the electrode-tip causes self-stirring action. Since it is preliminary-investigation for anomalous-heat in electric-arcing, calibration was not done. The experiments were crude, but it does indicate a positive excess-heat (average ~ 500%) from a pessimistic-value of 5% to optimistic-value of 800% roughly.
Knowing the mass of water lost due to evaporation and the temperature rise of the balance water in the tank we could make a rough Estimate of the total energy dissipated in the tank, assuming that all the water was lost by evaporation using up 540 cals per gram. However, we concede that there may have been an unknown quantum of water which was carried away as droplets – as “wet steam” so to say! (We are aware that similar critical questions were raised regarding the calorimetry adopted by Andrea Rossi with reference to his 10 KW demo of Jan 14th 2011). However, dryness-fraction of steam is usually around 0.95 meaning-by that wetness is only around 5%, thus it should not cause much error in latent-heat calculations. If Rossi’s E-Cat reactor (boiler) is really true, the author suspects that there might be a deliberate use of ‘electric-arcing’ inside it.

International Conference on Inter Disciplinary Research in Engineering and Technology 74
Cite this article as: Mragank Sharma, Kriti Rastogi, M Faisal Jamal Khan, Aishwarya Bajpai. “Possibility of
LENR Occurring in Electric Arc-Plasma: Preliminary Investigation of Anomalous Heat Generation during
Underwater Arcing using Carbon Electrodes”. International Conference on Inter Disciplinary Research in
Engineering and Technology (2016): 72-75. Print.
Results and Discussion
A rough calorimetric heat balance accounting in underwater welding experiment is done considering water heating, latent-heat of evaporation and visible radiation heat; convection heat losses if any are neglected. Initial experiments conducted in 2015, revealed that around 30% more heat is produced than the input electrical-energy! This indicates that there is indeed a possibility that a low-energy nuclear-reaction (LENR) that might be occurring within the arc. But exactly what nuclear-reactions could actually be occurring there, is yet to be investigated. But if any such nuclear-fusion occurs there, this would open a revolutionary vista for energy-production, say, through steam-generation via underwater arc-welding or electric-arcing. Theoretically too, fusion of positive-ions in the electric-arc seems possible; since a new-found ‘Gupta-Dinu Effect’ [3] predicts that positive-charges would be attracted towards electric-current. In another paper [4] it is shown that the ‘Gupta-Dinu Effect’ could possibly explain ‘how Coulomb repulsion is overcome’ in cold-fusion (LENR). Postscript: The author later-on [5], during ICCF-16, came to know through Dr. M. Srinivasan (Chairman, organizing committee, ICCF-16) that: BARC and Texas A & M University have already reported (in J. of Fusion Technology, vol.26 in Nov.1994) possibility of nuclear-fusion in carbon-arc experiments and have reported [6,7] from mass-spectrographic analysis possible synthesis of ‘Iron’ from ‘carbon & oxygen’ in the arc. These experiments, in a way, support the possibility of nuclear-fusion in arc-welding. The present author & his students too, later-on (in 2015) carried out [8] Carbon-Electrode-Arc (CEA) experiments (with 12 Volt battery driven DC-supply. The rough calorimetric heat-accounting therein (Tables -1& 2) indicates higher excess-heat (~ 700%) in the CEA-experiments. Electric arcing or discharge between two terminals do cause LENR-reactions (nuclear-transmutation) is firmly Established, through the thorough-experimentation & mass-spectroscopic analysis, by Edward & Alex in the recent book named ‘Cool Fusion’ [9].
Conclusion
Electric-arc is basically plasma. The speculation of possibility of nuclear-fusion (LENR) in arc-welding indeed seems to be true. For better heat accounting carbon-electrode-arc experiments conducted give much higher (~ 700%) excess-heat, and further reinforce the claim for possibility of nuclear-fusion (LENR) in the electric-arc. Spectroscopic-analysis results of other researchers do support the claim of LENR in the electric-arc. Electric-arc could thus possibly be used for water-heating & steam-generation and hence for power-production with this simple but revolutionary proposal of extracting excess-heat of the electric-arc.
REFERENCES
1. M Faisal Jamal Khan, Kriti Rastogi and Aishwarya Bajpai, ‘Cold Fusion: The Energy of the 21st Century’, Project under supervision of Mragank Sharma at ASET / Amity University, 2015.
2. R.C. Gupta, ‘Gupta-Dinu Effect: Interaction of Static-Charge with Electric-Current’, www.wbabin.net/physics/gupta2 , 2008.
3. R.C. Gupta, ‘How Coulomb Repulsion is Overcome in Cold Fusion’, 16th International Conference on Cold Fusion (ICCF-16), Feb. 2011, Chennai, (Paper Th-13).
4. R.C. Gupta, ‘Possibility of Nuclear-Fusion Occurring in Arc-Welding’, 16th International Conference on Cold Fusion (ICCF-16), Feb. 2011, Chennai, (Paper Th-14).
5. R.SundarEsan and J O’m Bockris, ‘Anomalous Reactions During Arching Between Carbon Rods in Water’, J. of Fusion Technology, vol.26, Nov.1994, pp.261-265 (Texas A & M University experiment).
6. M.Singh, et al., ‘Verification of George Oshawa Experiment for Anomalous Production of Iron from Carbon Arc in Water’, J. of Fusion Technology, vol.26, Nov.1994, pp.266-270 (BARC experiment).
7. M Faisal Jamal Khan, Kriti Rastogi and Aishwarya Bajpai, ‘Investigation into Underwater Welding: Improving Arc-Stability and Exploring Possibility of Nuclear-Fusion in Arc’, Project under supervision of Mragank Sharma at ASET / Amity University, 2015
8. Edward Esko and Alex Jack, ‘Cool Fusion’, Amber Waves Press USA, July 2011.
Table – 1
Details of Carbon Electrode Arc (CEA) experiments done in year 2015 with DC power source Experiment No. Initial Final Initial Final Water Current Voltage Time
Arc Stability water- water- water- water- vaporized
factor

International Conference on Inter Disciplinary Research in Engineering and Technology 75
Cite this article as: Mragank Sharma, Kriti Rastogi, M Faisal Jamal Khan, Aishwarya Bajpai. “Possibility of
LENR Occurring in Electric Arc-Plasma: Preliminary Investigation of Anomalous Heat Generation during
Underwater Arcing using Carbon Electrodes”. International Conference on Inter Disciplinary Research in
Engineering and Technology (2016): 72-75. Print.
Temp. Temp mass M1 mass M2 m=M1 – M2 I V t f T1
oC T2 oC gram gram gram Amp Volt sec.
CEA (2015)-DC supply-1 24 50 1000 986 14 8 12 900 0.70 CEA (2015)-DC supply-2 25 40 1000 988 12 8 12 480 0.70 CEA (2015)-DC supply-3 31 40 1000 990 10 8 12 360 0.60
Table – 2
Heat calculations / accounting of the experiments (details of which are shown in previous Table) Experiment No. Input Sensible Latent Radiation Total Heat Factor
% ExcEss Heat Energy Heat Heat Heat Heat (=Output/Input)
[=100(Output-Input)/Input] V.I.t M1.s.(T2-T1) m.L σ.A.ε.T4.t.f Output Joule Joule Joule Joule Joule CEA(2011)-DC supply-1 87 x103 108 x103 32 x103 629 x103 769 x103 8.84 784% CEA(2011)-DC supply-2 46 x103 63 x103 27 x103 335 x103 425 x103 9.26 826% CEA(2011)-DC supply-3 35 x103 38 x103 23 x103 216 x103 277 x103 7.91 691%
Fig.1 Carbon Electrode Arc (CEA) Experiment

International Conference on Inter Disciplinary Research in Engineering and Technology 76
Cite this article as: Samson Ojoawo, Rajan Kumar, Vashisth Kumar, Prasadh Hallur, Vikash H V. “Heavy
metals remediation in stale foundry effluent with Activated Charcoal-250”. International Conference on
Inter Disciplinary Research in Engineering and Technology (2016): 76-82. Print.
International Conference on Inter Disciplinary Research in Engineering and Technology 2016 [ICIDRET 2016]
ISBN 978-81-929866-0-9 VOL 01 Website icidret.in eMail [email protected] Received 22-December-2015 Accepted 30-December-2015 Article ID ICIDRET017 eAID ICIDRET.2016.017
Heavy metals remediation in stale foundry effluent with Activated Charcoal-250
Samson Ojoawo1, Rajan Kumar2, Vashisth Kumar2, Prasadh Hallur2, Vikash H V2
1Department of Civil Engineering, Ladoke Akintola University of Technology, P.M.B 4000, Ogbomoso, Nigeria 2Department of Civil Engineering, NMAM Institute of Technology, Nitte-574110, Udupi District, Karnataka, India
Abstract: The menace of wastewater pollution in the 21st century is becoming alarming. Application of the low-cost adsorbents for wastewater
treatment has received more attention this moment in environmental history than never. Therefore, remediating stale foundry wastewater with Activated
Carbon, AC-250 is the focus of this study. Wastewater samples were collected from Lamina Foundry, Nitte, Karnataka State, India and were subjected
to Atomic Absorption Spectrophotometry (AAS) analysis. The analysis identified the prominent heavy metals (Zn, Cu, Mg, and Pb) present in the stale
foundry effluent, determined their respective concentrations and treated them using the commercially sourced activated charcoal, AC-250. Effects of four (4) factors viz: adsorbent dosage, contact time, stirring speed and pH on the adsorption process during the wastewater treatment were studied.
Optimum conditions required for the most efficient treatment of the wastewater and the treatment cost estimates were determined. The AC-250 is found
as efficient in adsorption of the heavy metals from foundry wastewater. In some of the cases a 100% removal is possible, especially with Pb. The
analysis of the major experiments on effects of adsorbent dosage, contact time rotating speed and pH on the adsorption process, gave the optimum
conditions for removal under which the most efficient treatment of the wastewater containing studied heavy metals was possible. For the optimum
treatment conditions, an adsorbent dosage of 1 g, a contact time of 120 minutes, a rotating/agitation speed of 350 rpm and a pH value of 6 are
established. An average cost of treating 1 litre of stale foundry wastewater is Rs 23 or 0.4 USD. This study therefore recommends AC-250 as an
efficient adsorbent at the given optimum conditions for stale foundry wastewater. The reuse of AC-250 via the process of thermal reactivation at 8000C
is encouraged as a means of waste management.
Keywords: Activated Carbon-250, remediation, wastewater, heavy metals.
INTRODUCTION
Discharging industrial wastewater containing different pollutants can lead to the contamination of environment and disorder in its ecosystem. Increment and development of the alloy and leather industries, metal galvanizations, laundries, electroplating firms, all result in significant increase of heavy metals ion concentration in the industrial wastewater. Accumulation of these metals ion in human body can lead to severe disorders in the performance of kidneys, liver, sexual organs, brain and nervous systems. Direct discharge of wastewater containing heavy metals into municipal waste water collection system can equally damage biological treatment units and produce active sludge which in turn can destroy the agricultural products. Since heavy metals are non-biodegradable, they are stored in the living tissues and enter the food chain of plants, animals and human beings. Therefore with regard to the numerous disadvantages of heavy metals, their removal from industrial wastewater is an essential environmental requirement. In recent times, efforts have been made to employ cheaper and more effective organic materials, agricultural wastes, and related compounds as adsorbents [1]. Activated Carbon (AC) is one of the most applicable adsorbents in common use for wastewater
This paper is prepared exclusively for International Conference on Inter Disciplinary Research in Engineering and Technology 2016 [ICIDRET] which is published by ASDF International, Registered in London, United Kingdom. Permission to make digital or hard copies of part or all of this work for personal or classroom use is granted without fee provided that copies are not made or distributed for profit or commercial advantage, and that copies bear this notice and the full citation on the first page. Copyrights for third-party components of this work must be honoured. For all other uses, contact the owner/author(s). Copyright Holder can be reached at [email protected] for distribution.
2016 © Reserved by ASDF.international

International Conference on Inter Disciplinary Research in Engineering and Technology 77
Cite this article as: Samson Ojoawo, Rajan Kumar, Vashisth Kumar, Prasadh Hallur, Vikash H V. “Heavy
metals remediation in stale foundry effluent with Activated Charcoal-250”. International Conference on
Inter Disciplinary Research in Engineering and Technology (2016): 76-82. Print.
treatment processes since 1883. AC, also called activated charcoal, activated coal, or carbo activatus, is a form of carbon processed to have small, low-volume pores that increase the surface area available for adsorption or chemical reaction [2]. AC is usually derived from charcoal and high-porosity bio-char. Due to its high degree of micro porosity, just one gram of activated carbon has a surface area in excess of 500 m2, as determined by gas adsorption. An activation level sufficient for useful application may be attained solely from high surface area; however, further chemical treatment often enhances adsorption properties. AC is used as an appropriate adsorbent in removing different pollutants, particularly heavy metals.
Activated charcoal is good at trapping other carbon-based impurities as well as things like chlorine. Many other chemicals are not attracted to carbon at all sodium, nitrates, etc., so they pass right through. This means that an activated charcoal filter will remove certain impurities while ignoring others [3]. Nowadays, activated carbon finds wide application in the treatment of wastewater generated from industries such as food, textile, chemical, pharmaceutical, pesticides and herbicides production, coke plant, munitions factories, petroleum refineries and storage installations, organic pigments and dyes, mineral processing plants, insecticides, pesticides, resins, detergents, explosives, and dyestuffs. It is also employed in the treatment of sanitary and hazardous landfill leachates [4].
This study identified the heavy metals present in the stale foundry effluent, determined their respective amounts and treated them using the commercially sourced activated charcoal, AC-250. Also examined were the effects of various factors such as adsorbent dosage, contact time, stirring speed and pH on the adsorption process during the treatment of the wastewater. And finally it established the optimum conditions required for the most efficient treatment of the wastewater. The sampling station was the outlet sump of the Lamina Foundry, Nitte, Karnataka State, India. The effluent was kept at room temperature for 4 weeks before the commencement of the study to ensure it was stale.
Methodology (a) AAS analysis for initial concentration of foundry effluent: The untreated Lamina Foundry effluent sample was subjected to AAS
(Atomic Absorption Spectroscopy) analysis conducted in the Flame atomic absorption spectroscope of the Department of Biotechnology Engineering, NMAM Institute of Technology, Nitte, Karnataka State, India. The AAS experiment on the untreated lamina foundry effluent gave information regarding the heavy metals present in them and their amount.
Figure 1: AAS Analysis of the untreated Effluent
One-factor-at-a-time (OFAT) treatment experiments: The effluent was treated using the purified AC. Four different types of experiments were conducted in order to determine the effect of contact time, pH, adsorbent dosage and rotating/stirring speed on the adsorption of heavy metals by the AC-250.
(i) Experimental study of the adsorbent dosage effect on the treatment process: Five conical flasks of 100ml volume were taken and were labelled from 1 to 5.Then in each of the flasks 50ml of the untreated foundry effluent were put. After this 0.2, 0.4, 0.6, 0.8 and 1.0 g of the AC were added to the 5 respective conical flasks.
Figure 2. Foundry effluent being treated with different adsorbent dosages The flasks were then placed in a rotary incubator shaker and agitated at a speed of 150 rpm for 1 hour at a room temperature of 320C. The filtrate from each flask was collected in a test tube and the mouth of the test tube and subjected to AAS analysis.
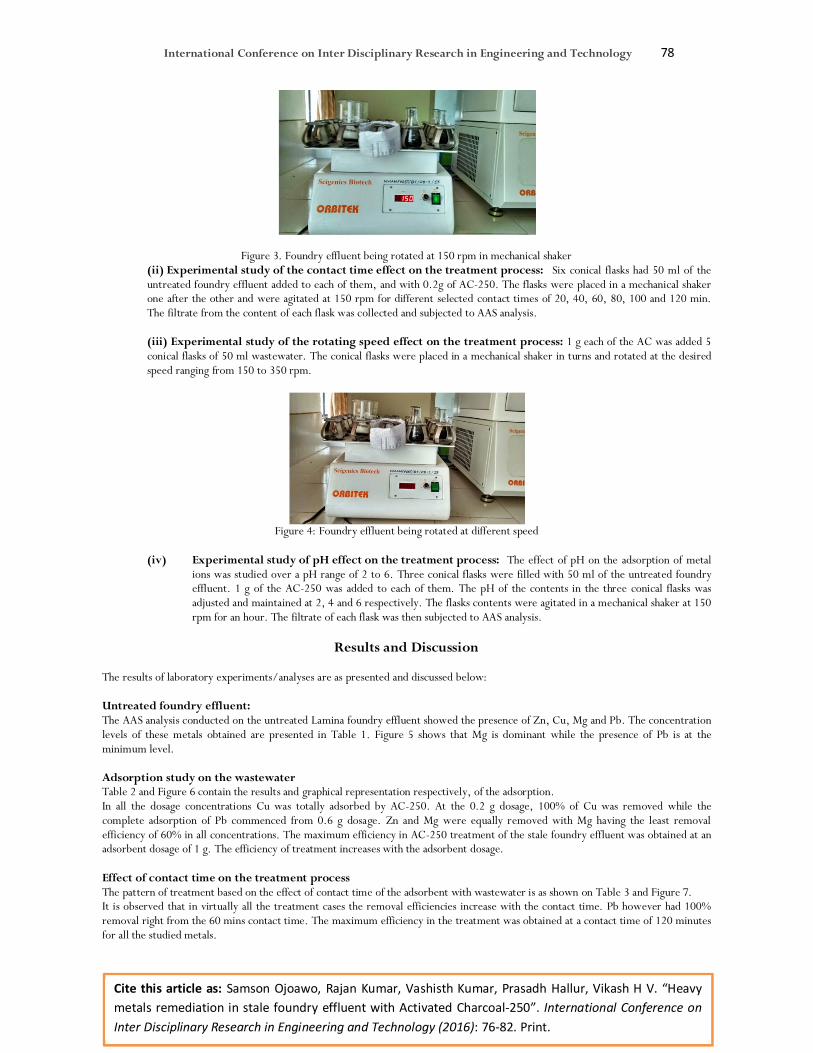
International Conference on Inter Disciplinary Research in Engineering and Technology 78
Cite this article as: Samson Ojoawo, Rajan Kumar, Vashisth Kumar, Prasadh Hallur, Vikash H V. “Heavy
metals remediation in stale foundry effluent with Activated Charcoal-250”. International Conference on
Inter Disciplinary Research in Engineering and Technology (2016): 76-82. Print.
Figure 3. Foundry effluent being rotated at 150 rpm in mechanical shaker (ii) Experimental study of the contact time effect on the treatment process: Six conical flasks had 50 ml of the untreated foundry effluent added to each of them, and with 0.2g of AC-250. The flasks were placed in a mechanical shaker one after the other and were agitated at 150 rpm for different selected contact times of 20, 40, 60, 80, 100 and 120 min. The filtrate from the content of each flask was collected and subjected to AAS analysis.
(iii) Experimental study of the rotating speed effect on the treatment process: 1 g each of the AC was added 5 conical flasks of 50 ml wastewater. The conical flasks were placed in a mechanical shaker in turns and rotated at the desired speed ranging from 150 to 350 rpm.
Figure 4: Foundry effluent being rotated at different speed
(iv) Experimental study of pH effect on the treatment process: The effect of pH on the adsorption of metal
ions was studied over a pH range of 2 to 6. Three conical flasks were filled with 50 ml of the untreated foundry effluent. 1 g of the AC-250 was added to each of them. The pH of the contents in the three conical flasks was adjusted and maintained at 2, 4 and 6 respectively. The flasks contents were agitated in a mechanical shaker at 150 rpm for an hour. The filtrate of each flask was then subjected to AAS analysis.
Results and Discussion
The results of laboratory experiments/analyses are as presented and discussed below: Untreated foundry effluent: The AAS analysis conducted on the untreated Lamina foundry effluent showed the presence of Zn, Cu, Mg and Pb. The concentration levels of these metals obtained are presented in Table 1. Figure 5 shows that Mg is dominant while the presence of Pb is at the minimum level. Adsorption study on the wastewater Table 2 and Figure 6 contain the results and graphical representation respectively, of the adsorption. In all the dosage concentrations Cu was totally adsorbed by AC-250. At the 0.2 g dosage, 100% of Cu was removed while the complete adsorption of Pb commenced from 0.6 g dosage. Zn and Mg were equally removed with Mg having the least removal efficiency of 60% in all concentrations. The maximum efficiency in AC-250 treatment of the stale foundry effluent was obtained at an adsorbent dosage of 1 g. The efficiency of treatment increases with the adsorbent dosage. Effect of contact time on the treatment process The pattern of treatment based on the effect of contact time of the adsorbent with wastewater is as shown on Table 3 and Figure 7. It is observed that in virtually all the treatment cases the removal efficiencies increase with the contact time. Pb however had 100% removal right from the 60 mins contact time. The maximum efficiency in the treatment was obtained at a contact time of 120 minutes for all the studied metals.

International Conference on Inter Disciplinary Research in Engineering and Technology 79
Cite this article as: Samson Ojoawo, Rajan Kumar, Vashisth Kumar, Prasadh Hallur, Vikash H V. “Heavy
metals remediation in stale foundry effluent with Activated Charcoal-250”. International Conference on
Inter Disciplinary Research in Engineering and Technology (2016): 76-82. Print.
Effect of rotating/stirring speed on the treatment process: Results of the rotating speed and the metal remediation are presented on Table 4 and Figure 8. Pb was totally removed right from 200 rpm while other metals show percent increase in removal with the agitation increase. Mg was however least removed with increasing stirring speed. Effect of pH on the treatment process The effects of pH on the adsoption process using AC-250 are presented on Table 6 and in Figure 9. The metal removal efficiency is observed to increase with pH increase except in the case of Pb where the pattern appears undefined. Optimum foundry wastewater treatment conditions for the AC-250 The activated charcoal-250 is found as an efficient adsorbent in treating the stale foundry wastewater. The optimum conditions in required for the most efficient treatment of 50mL of the studied Lamina foundry effluent containing Zn, Cu, Mg and Pb present in 0.552, 1.283, 2.647 and 0.068 mg/L respectively are:
1. An adsorbent dosage of 1 gram 2. A contact time of 120 minutes 3. A rotating/agitation speed of 350 rpm
and 4. A pH value of 6.
Cost Estimate for the treatment process: For 50ml foundry effluent, the dosage quantity required is 1gm of activated charcoal-250. Therefore, 1ml = 1/50 g, And 1000ml = 1000/ 50g, Therefore for treating 1 Litre of foundry wastewater containing heavy metals we require 20g of activated carbon-250 Cost of 500 g = Rs 572/- Cost of 1 g of AC-250 = Rs (572/500) = Rs 1.144 Therefore, the average cost of treating 1 litre of foundry wastewater = Rs 1.144x20 = Rs 22.88 or 0.38 USD
Conclusion and Recommendation
The Activated Charcoal (AC-250) was found as efficient in adsorption of the heavy metals consisting of Zn, Cu, Mg and Pb from foundry wastewater. In some of the cases a 100% removal is possible, especially with Pb. The analysis of the major experiments on effects of adsorbent dosage, contact time rotating speed and pH on the adsorption process, gave the optimum conditions for removal under which the most efficient treatment of the wastewater containing studied heavy metals was possible. For the optimum treatment conditions, an adsorbent dosage of 1 g, a contact time of 120 minutes, a rotating/agitation speed of 350 rpm and a pH value of 6 are established. An average cost of treating 1 litre of stale foundry wastewater is Rs 23 or 0.4 USD. This study therefore recommends AC-250 as an efficient adsorbent at the given optimum conditions for stale foundry wastewater. The reuse of AC-250 via the process of thermal reactivation at 8000C is encouraged as a means of waste management.
REFERENCES
[1] Ojoawo, S.O and Udayakumar, G (2015) Remediation of Zn, Cu, Mg and Pb from fresh foundry wastewater with Activated Carbon as adsorbent, Proceedings of the 4th International Conference, Ladoke Akintola University of Technology, Ogbomoso, Nigeria
[2] Bansal, R.P. and Goyal, M. (2005) Activated Carbon Adsorption, CRC Press, Taylor & Francis Group, 6000 Broken Sound Parkway NW, Suite 300 Boca Raton, FL, USA 33487–2742.
[3] Encyclopedia Britannica.

International Conference on Inter Disciplinary Research in Engineering and Technology 80
Cite this article as: Samson Ojoawo, Rajan Kumar, Vashisth Kumar, Prasadh Hallur, Vikash H V. “Heavy
metals remediation in stale foundry effluent with Activated Charcoal-250”. International Conference on
Inter Disciplinary Research in Engineering and Technology (2016): 76-82. Print.
[4] Cecen, F. snd Aktas, O (2013) Activated carbon for water and waste waste water treatment
Table 1: Concentration levels of the heavy metals in untreated wastewater Metals Zn Cu Mg Pb
Concentration (mg/L)
0.552 1.283 2.647 0.068
Table 2: Results obtained from the absorbent dosage study
Adsorbent dosage used in treatment ( in grams)
Concentration of metals present after treatment (in mg/L) Zn Cu Mg Pb
0.2 0.101 0.00 1.106 0.008 0.4 0.072 0.00 1.101 0.007 0.6 0.060 0.00 1.069 0.00 0.8 0.023 0.00 0.843 0.00 1.0 0.019 0.00 0.806 0.00
Figure 5: Representation of the heavy metals in the untreated wastewater
Zinc
Copper
Magne
siumLead

International Conference on Inter Disciplinary Research in Engineering and Technology 81
Cite this article as: Samson Ojoawo, Rajan Kumar, Vashisth Kumar, Prasadh Hallur, Vikash H V. “Heavy
metals remediation in stale foundry effluent with Activated Charcoal-250”. International Conference on
Inter Disciplinary Research in Engineering and Technology (2016): 76-82. Print.
Figure 6: The removal percentage based on the adsorbent dosage
Table 3: Results of the effect of contact time on the treatment Contact time (in minutes)
Concentration of metals after treatment (in mg/L) Zn Cu Mg Pb
20 0.079 0.222 1.063 0.026 40 0.043 0.186 1.101 0.116 60 0.072 0.318 0.954 0.00 80 0.024 0.084 0.364 0.00 100 0.024 0.00 0.287 0.00 120 0.00 0.00 0.044 0.010
Figure 7: Percent removal of metals due to contact time of AC-250
Table 4: Results on effect of the rotating speed on the treatment
Rotating/Stirring speed (in RPM)
Concentration of metals after treatment (in mg/L) Zn Cu Mg Pb
150 0.045 0.243 1.560 0.031 200 0.029 0.222 1.682 0.00 250 0.063 0.364 1.854 0.00 300 0.040 0.255 1.669 0.00 350 0.047 0.159 1.182 0.00
0.00%
50.00%
100.00%
150.00%
0 0.4 0.8
% R
em
ov
al
weight of adsorbent dosage (in grams)
Effect of adsorbent dosage on adsorption
Zinc
Copper
Magnesium
Lead
0.00%
50.00%
100.00%
150.00%
0 40 80 120
% R
em
ov
al
Contact time ( in minutes)
Effect of contact time on adsorption
Zinc
Copper
Magnesium
Lead

International Conference on Inter Disciplinary Research in Engineering and Technology 82
Cite this article as: Samson Ojoawo, Rajan Kumar, Vashisth Kumar, Prasadh Hallur, Vikash H V. “Heavy
metals remediation in stale foundry effluent with Activated Charcoal-250”. International Conference on
Inter Disciplinary Research in Engineering and Technology (2016): 76-82. Print.
Figure 8: Effect of rotating speed on the adsorption process
Table 6: Effect of pH on the treatment pH value maintained
Concentration of metals after treatment (in mg/L) Zn Cu Mg Pb
2 0.344 0.318 3.708 0.00 4 0.054 0.177 3.281 0.057 6 0.084 0.404 2.148 0.00
Figure 9: Representation of the effect of pH on the treatment
0%
20%
40%
60%
80%
100%
120%
0
15
0
20
0
25
0
30
0
35
0
% R
em
ov
al
Rotating/Stirring speed (in RPM)
Effect of rotating /stiring speed on adsorption
Zinc
Copper
Magnesium
Lead
0.00%
20.00%
40.00%
60.00%
80.00%
100.00%
120.00%
2 4 6
% R
em
oval
pH value
Effect of pH on
adsorption
Zinc
Copper
Magnesium
Lead

International Conference on Inter Disciplinary Research in Engineering and Technology 83
Cite this article as: Neeru Rathee, Nishtha. “Automatic AU intensity detection/estimation for Facial
Expression Analysis: A Review”. International Conference on Inter Disciplinary Research in Engineering
and Technology (2016): 83-88. Print.
International Conference on Inter Disciplinary Research in Engineering and Technology 2016 [ICIDRET 2016]
ISBN 978-81-929866-0-9 VOL 01 Website icidret.in eMail [email protected] Received 23-December-2015 Accepted 30-December-2015 Article ID ICIDRET018 eAID ICIDRET.2016.018
Automatic AU intensity detection/estimation for Facial Expression Analysis: A Review
Neeru Rathee1, Nishtha1
1Electronics and Communication Engineering, Maharaja Surajmal Institute of Technology, New Delhi, India
Abstract: Automatic facial expression analysis is an area of great research especially in the field of computer vision and robotics. In the work done so
far, the facial expression analysis is done either by recognizing the facial expression directly or indirectly by first recognizing AUs and then applying
this information for facial expression analysis. The various challenges in facial expression analysis are associated with face detection and tracking,
facial feature extraction and the facial feature classification. The presented review gives a brief description of the time line view of the research work
carried for AU detection/estimation in static and dynamic image sequences and possible solutions proposed by researchers in this field since 2002. In
short, the paper will provide an impetus for various challenges and applications of AU detection, and new research topics, which will increase the
productivity in this exciting and challenging field.
Keywords: AU Intensity, Facial Expression, Facial Feature Classification.
INTRODUCTION
Human face is a very useful and powerful source of depicting the human behaviour as it is the most natural way to express their emotions. Research shows that the verbal part of a message contributes only for 7%; the vocal part contributes for 38% while facial expression of the speaker contributes for 55% of the effect of spoken message as a whole. It implies that facial expression plays the most important role in human communication [1, 5]. Facial expression analysis, which is an important media of Human-Computer Interface (HCI), gained much attention after the development of technologies like pattern recognition and artificial intelligence [1, 5]. Moreover, machine understanding of facial expressions can bring revolution in HCI. The facial expression analysis is generally accomplished in three steps: face detection (also called face acquisition), facial feature extraction and facial expression classification. Face detection refers to localizing or detecting the face region in input images or image sequences. Facial feature extraction is accomplished for extracting information about the encountered facial expression. Facial expression classification refers to classification of the observed facial expression, which can be done in two ways i.e. applying a classifier that can directly classify the emotions or in terms of Action Units (AUs) that cause an expression and then recognizing expressions. Facial expression analysis is done either directly or indirectly. In direct approach, facial expressions are recognized directly. In indirect approach, first facial action units are recognized and then facial expression is recognized. Facial Action Coding System (FACS) is the best known and most commonly used sign judgement approach developed to describe facial actions. It describes 44 AUs that provides information of all visually detectable face changes. FACS coder decomposes a shown expression into the specific AUs that describes the expression. In 1971, Ekman and Friesen defined six basic emotions that comprise of happiness, sadness, fear, disgust, surprise and anger, and are also referred to as basic emotions [1].
This paper is prepared exclusively for International Conference on Inter Disciplinary Research in Engineering and Technology 2016 [ICIDRET] which is published by ASDF International, Registered in London, United Kingdom. Permission to make digital or hard copies of part or all of this work for personal or classroom use is granted without fee provided that copies are not made or distributed for profit or commercial advantage, and that copies bear this notice and the full citation on the first page. Copyrights for third-party components of this work must be honoured. For all other uses, contact the owner/author(s). Copyright Holder can be reached at [email protected] for distribution.
2016 © Reserved by ASDF.international

International Conference on Inter Disciplinary Research in Engineering and Technology 84
Cite this article as: Neeru Rathee, Nishtha. “Automatic AU intensity detection/estimation for Facial
Expression Analysis: A Review”. International Conference on Inter Disciplinary Research in Engineering
and Technology (2016): 83-88. Print.
To make the AU detection more robust and more efficient, we deal in both frontal-view and profile-view as some AUs like puckering of lips or pushing of jaws forward are not clearly detectable in frontal view, but are clearly observable in profile view as these AUs represent out-of-image plane non-rigid face movements whereas movement of the eyebrows and changes in appearance of the eye cannot be detected in profile view but are easily observable in frontal facial view. Moreover, this is one of the major step to establish a technological framework for automatic AU detection from multiple views of the face [12, 13]. Automatic recognition of AUs can be done on appearance-based features, geometric features or both. Appearance-based approach uses example images called templates of the face to perform recognition and feature extraction. It includes selecting the best set of Gabor wavelet filter, using AdaBoost and train Support Vector Machine (SVM) to classify AUs. Geometric-feature-based approach method works on shape or deformation of facial features such as position or velocities of facial fiducial points or the distance between these points. Geometric-based approach involves automatically detecting n- facial points and use a facial point tracker based on particle filtering with factorized likelihoods to track these points [8, 9, 10]. Current challenges in AU detection are face occlusion, glasses, facial hair and rigid head movements, that occur in real-world frequently. Out-of-plane head movements also lead to self-occlusion of face. As AUs are more localized in the face than expressions of emotions the problem of occlusion is much bigger in AUs as compared to emotions [11, 12]. The problem of rigid head movement can be solved by using head-mounted cameras which in turn reduces the freedom of movement of the subject making it uncomfortable for the subject. The intensity of AUs and its temporal phase transition (onset, apex, and offset) detection is still a area of concern. The solution to the above mentioned concern will result in detection of complex as well as higher level behaviour deception, cognitive states like agreement (disagreement), and psychological states like pain [12]. Moreover, the proposed methods so far are not able to encode all the 44 AUs defined in FACS, simultaneously. The presented survey focuses on feature extraction and classification for AUs detection and estimation that has been adopted by researchers. The rest of the paper is organised as follows. Section 2 deals with facial expression feature extraction and section 3 gives a brief idea about all the classification techniques. Section 4 describes the various challenges and future scope in this area of research and conclusion.
FEATURE EXTRACTION
After the face has been detected in the observed scene, the next step is to extract information about the encountered facial expression. Feature extraction depends on kind of input image and applied face representation [1]. Three types of face representation are: holistic, analytic and hybrid. In holistic approach, the face is represented as a whole unit. In analytic face representation, the face is modelled as a set of facial points or as a set of templates fitted to the facial features such as mouth and eyes. In the hybrid approach the face is represented as a combination of analytic and holistic approaches i.e. a set of facial points is used to determine an initial position of a template that models the face. The major challenges faced in feature extraction are variation in size and orientation of the face and obscuring of the facial features due to facial hair and glasses. Two types of features that are typically usually used to describe facial expression are: Geometric features and Appearance features. Based on these features the facial feature extraction techniques can be classified as Geometric-feature-based approach and Appearance-feature- based approach [2]. Pantic et.al used particle filtering for feature extraction [13, 9, 8] which is a approach to directly detect temporal segments of AUs. They located and tracked a number of facial fiducial points and extracted temporal features from it. Particle filtering was introduced by Pitt and Shepard [26]. It became the most used tracking technique due to its ability to deal with noise, occlusion and clutter successfully. It also adopted to deal with colour-based template tracking and shadow problems [13]. This algorithm has three major drawbacks: 1) large amount of particles that resulted from sampling from the proposal density might be wasted because they propagated into areas with small likelihood, 2) A particle might have low likelihood but part of it may be close to correct solution, 3) finally, the estimation of particle weight does not consider the interdependence between the different parts of α (where α is the state of a temporal event to be tracked) [10, 3]. Later, Patras and Pantic introduced Particle filtering with factorized likelihoods (PFFL) [27] as an extension to this auxiliary particle filtering theory to address all the afore-mentioned problems inherent in particle filtering. PFFL addresses the problem of interdependencies between the different parts of state α by assuming that the state α can be partitioned into α� such as α = {α�….. α�}. PFFL tracking system can be divided into two stages. In the initial stage each facial point i is tracked independently from other facial points for each frame individually. In the latter stage, interdependence between the sub states are taken into account using proposal distribution g(α) which is product of posteriors of each α� [ 20, 3, 10, 25]. Another Geometric-feature-based approach that is popularly accepted is Active Appearance Model (AAM) and its derivates to track a dense set of facial points. The location of these points helps us to infer the facial features and their shapes to classify the facial expression. Sung and Kim used Stereo Active Appearance Model (STAAMs) to track facial points in 3-D videos, as it improves the

International Conference on Inter Disciplinary Research in Engineering and Technology 85
Cite this article as: Neeru Rathee, Nishtha. “Automatic AU intensity detection/estimation for Facial
Expression Analysis: A Review”. International Conference on Inter Disciplinary Research in Engineering
and Technology (2016): 83-88. Print.
fitting and tracking of standard AAMs by using multiple cameras to model the 3-D shape and all the rigid motion parameters. Unfortunately, the approach appears to be promising, but no results on a benchmark database were presented [11]. Appearance-feature- based approach aims to capture skin motion and changes in facial texture due to wrinkles, furrows and bulge. The various Appearances-feature- based approaches are Gabor features, family of LBP-based detectors (Local Binary Pattern (LBP), Local Phase Quantization (LPQ)) Gabor wavelet is one of the most famous techniques for facial expression analysis. A Gaussian kernel modulated with a sinusoidal plane defines a Gabor function. To extract the texture information, filter bank with different characteristic frequencies and orientations is implemented for feature extraction. The decomposition of an image is computed by filtering it with the filter bank which may include techniques like applying Gabor filters to the difference image computed by subtracting a neutral expression for each sequence. Littleworth et.al.[32] applied Gabor filter bank to extract Gabor magnitudes from the whole face and then select the subset of features using AdaBoost method. The output of the filters selected by AdaBoost is applied to support vector machine for classification of seven emotion expressions. Gabor features are applied not only for extracting the features in spatial domain but also for temporal domain. Bartlett et.al.[4] applied Gabor features for simultaneous facial behaviour analysis. BEN JEMAA and KHANFIR [15] used gabor-coefficients for face recognition. In this geometric distance and gabor-coefficients are used independently or jointly. A gabor-jet vector is used to characterize the face. To reduce the dimension of Gabor features, the high-dimensional Gabor features can be uniformly down-sampled. It is observed the recognition performance get effected by the choice of fiducial points and the down-sampling factor. So, an efficient encoding strategy for Gabor outputs is needed. Gu et.al. [21] Extended the radial encoding strategy for Gabor outputs to radial grid encoding leading to high recognition accuracy. This method gives better result than down-sampling method or methods involving Gabor-jet. LBP introduced by Ojala et al. in [28] has proven to be one of the powerful mean of texture description. The operator works by creating a label by thresholding a 3x3 neighbourhood of the pixel for every pixel. Ojala et al. later extended the basic LBP to a gray-scale and rotation invariant texture operator which allows random number of neighbours to be chosen at any point from the central pixel based on circularly symmetric neighbour set. It reduces the dimensionality of the LBP operator by introducing the concept of uniform LBP. Uniform LBP consist at most two bit wise transition from zero to one and vice versa and the binary string is considered circular [11, 29]. The fascinating features of LBP are its illumination tolerance and computational efficiency. LPQ operator was originally proposed by Ojansivu and Heikkila as a texture descriptor that is robust to image blurring. The descriptor uses 2-D DFT or, more precisely, a short-term Fourier transform (STFT) computed over a M-by-M neighbourhood to extract local phase information. In real time application, the neighbouring pixels are highly correlated, leading to dependency between Fourier coefficients, which are quantized in LPQ. So, Ojansivu et al. introduced a de-correlation mechanism to improve LPQ, which is used by Jiang et al.in [29]. LPQ descriptor is extended to temporal domain, and the basic LPQ features are extracted from three set of orthogonal planes: XY, ST and YT, where XT provides spatial domain information, while the XT and YT planes provide temporal information, and is called Local Phase Quantization from Three orthogonal Planes (LBP-TOP). Zhao et al. [14] applied LBP-TOP to six basic emotions recognition and it is clearly reported that it outperformed earlier approaches like LBP, Gabor.
FACIAL EXPRESSION CLASSIFICATION
Facial feature extraction is followed by facial expression classification. The classifier classifies the encountered expression either as facial action or basic emotion or both. The classification depends on template-based, a spatial-based classification method. Support Vector Machine (SVM) is an excellent classifier in domains such as marine biology, face detection and speech recognition. The SVM classification is done in the following steps. The selected features instances are divided into two sets: training set and testing set [30]. A n-fold cross validation loop is employed each time a classifier is trained for search of optimal parameters. While, evaluating each fold, the training data is split into five sub sets, four of them are used to train a classifier and one is used to test a classifier. SVM is very well suited for the task of AU detection as the high dimensionality of the feature space has no effect on the training time. SVM classification can be summarized in three steps: 1) margins of the hyper plane are maximized; 2) the input space is mapped to a linearly separable feature space; 3) the ‘kernel trick’ is applied [20]. The most frequently used kernel functions are the linear, polynomial, and Radial Basis Function (RBF) [29]. SVM’s classification performance decreases when the dimensionality of the set is far greater than the training set samples. This can be handled by decreasing the no. of features used to train SVM which can be done by means of GentleBoost. Littlewort et. al. [32] showed that an SVM classifier trained using boosting algorithms outperforms both the SVM and the boosting classifier when applied directly. SVM is used for shape information extraction in [24]. The combination of Adaboost and SVM enhanced both speed and accuracy of the system.

International Conference on Inter Disciplinary Research in Engineering and Technology 86
Cite this article as: Neeru Rathee, Nishtha. “Automatic AU intensity detection/estimation for Facial
Expression Analysis: A Review”. International Conference on Inter Disciplinary Research in Engineering
and Technology (2016): 83-88. Print.
Valstar and Pantic [10, 25] proposed to apply hybrid SVM-HMM (successfully applied for speech recognition) to the problem of AU temporal model detection. Valstar et.al [20] used Probabilistic Actively learned Support Vector Machine (PAL-SVM) to reduce the validation time in classifying the AUs displayed in a video. Simon et. al. [31] proposed a segment based SVM, k-seg-SVM which is a temporal extension to the spatial Bag-of-Words (BoW) approach that was trained with Structured Output SVM (SO-SVM). Recent research shows that SO-SVMs can outperform other algorithms including HMM, Max-Margin Markov Networks [31]. SO-SVMs have several benefits in AU detection as : 1) they model the dependencies between visual features and duration of AUs; 2) They can be trained effectively on all possible segments of the video; 3) No assumption about the underlying structures of the AU are made; 4) negative examples that are most similar to the AU are selected explicitly. Rule-based classification method, proposed by Pantic and Rohtkrantz in 2000 classifies the facial expression into the basic emotions based on previously encoded facial actions. Classification is performed by comparing the AU-coded description of the shown facial expression with the AU-coded description of the six basic emotional expressions. This classification method gave a recognition rate of 91%. To classify the observed changes in AUs and their temporal segments, these changes are transformed into a set of mid- level parameters. Six mid-level parameters are defined to describe the change in position of fiducial points. Two midlevel feature parameters are used to describe the motion of feature points: up/down, in/out (parameters calculated for profile contour fiducial points). The parameter up/down denotes the upward or downward movement of point P. The parameter in/out denotes the inward or outward movement of point P. Absent and inc/dec are two midlevel feature parameters used to denote the state of feature points. Absent denotes the absence of point P in the in profile contour. Inc/dec defines the increase or decrease in distance between two points. Finally, two midlevel feature parameters: angular and increased_curvature describes two specific shapes formed between certain feature points. The activation of each AU is divided into three segments, the onset (beginning), the apex, and offset (ending). Inaccuracies in facial point tracking and occurrences of non-prototypic facial activity result in either unlabeled or incorrectly labelled temporal segments. This can be handled by using memory-based process that takes into account the dynamics of facial expression i.e. re-label the current frame/segment from the previous and next frame label according to a rule-based system. Koelstra and Pantic[6, 7] used GentleBoost classifier on motion from a non-rigid registration combined with HMM. GentleBoost converges faster than Adaboost and is more reliable in terms of stability. It is used in [22] for feature selection in order to reduce the dimensionality of of the feature vectors before classification. GentleBoost algorithm selects a linear combination of features one at a time until the addition of features no longer improves the classification, thus giving a reasonable balance between speed and complexity. In some AUs the spatial magnitude projection information is not sufficient and temporal domain analysis is needed for AU classification. Each onset/offset GentleBoost classifier returns a single number per frame which depicts the confidence that the frame shows the target AU and target temporal segment. To combine onset/offset GentleBoost classifier into a single AU recognizer, a continuous HMM is used. HMM uses the knowledge of prior probabilities of each temporal segment and duration derived from our training set. HMM supports a degree of temporal filtering and smooth out the results of the GentleBoost classifiers. However this only captures the temporal dynamics to a limited degree. This issue can be solved using HMM with state duration model. Cohen et.al. [33, 34] exploits existing methods and proposes a new architecture of Hidden Markov Models (HMM), in which segmentation and recognition of facial expression are done automatically. HMM is most commonly used in speech recognition, as HMM has the ability to model non stationary signals and events. In this all the stored sequences are used to find the best match and hence this approach is quite time consuming. It works on using the transition probabilities between the hidden states and learns the conditional probabilities of the observations given the state of the model. The two main model structures used to model expression are: left-to right and ergodic model. Left-to-right models involves fewer parameters, and thus easier to train. However, it reduces the degree of freedom of the observation sequence for the model. Ergodic HMM allows more freedom for the model. The main problem with this approach is that it works on isolated or pre-segmented facial expression sequences that are not available in reality. This problem is solved using a multi-level HMM classifier. In this, motion features are fed to the emotion specific HMM, then the state sequence is decoded using a Viterbi algorithm and used as observation vector for the high-level HMM (consist of seven states, one for each of six emotions and one for neutral). BEN JEMAA and KHANFIR used non-linear neural networks for classification [15]. The advantages using neural networks for recognition and classification are the feasibility of training a system in complex conditions like rotation and lighting. The neural network architecture like number of layers and nodes has to be varied to get good performance. In this study, three types of features are used namely, 1) Geometric distance between fiducial points, 2) Gabor coefficients, 3) combined information about Gabor coefficients and Geometric distance. A preliminary version of a two stage classifier combining a kNN-based and ruler based classifier was first presented by Valaster et.al. in [17] and later used in [18]. Applying only kNN resulted in recognition rates that were lower than we expected. It was observed that some of the mistakes made by the classifier were deterministic, and can be exploited using a set of rules based on human FACS coder.
CONCLUSION AND FUTURE SCOPE
Facial expression analysis is an intriguing problem but a need for the future because of its utility in domains of HCI and human behaviour interpretation. So, a lot of research like feature extraction, classification, pain detection has been done in this area and results as high as 94.70% [2], 99.98 [15], 94.3 [7] have been attained. But, some areas still need to be explored and can work as a base

International Conference on Inter Disciplinary Research in Engineering and Technology 87
Cite this article as: Neeru Rathee, Nishtha. “Automatic AU intensity detection/estimation for Facial
Expression Analysis: A Review”. International Conference on Inter Disciplinary Research in Engineering
and Technology (2016): 83-88. Print.
for any future research. The AUs for basic emotions have been detected by many researcher using different extraction and classification techniques, but AUs defining complex emotions have not been mentioned very clearly in the research so far. Further research can be done in area of co-occurrence and interdependence of AUs and detection of AUs for deception as occurrence of complex emotions generated due to these are more frequent in real time than basic emotions. The facial features have been extracted and classified in static and video images, but its real-time application has not been explored till now.
REFERENCES
[1] Pantic, Maja, and Leon JM Rothkrantz. "Automatic analysis of facial expressions: The state of the art." Pattern Analysis and Machine Intelligence, IEEE Transactions on 22.12 (2000): 1424-1445.
[2] Jiang, Bihan, et al. "A dynamic appearance descriptor approach to facial actions temporal modeling." Cybernetics, IEEE Transactions on 44.2 (2014): 161-174.
[3] Valstar, Michel, and Maja Pantic. "Fully automatic facial action unit detection and temporal analysis." Computer Vision and Pattern Recognition Workshop, 2006. CVPRW'06. Conference on. IEEE, 2006.
[4] Bartlett, Marian Stewart, et al. "Recognizing facial expression: machine learning and application to spontaneous behavior." Computer Vision and Pattern Recognition, 2005. CVPR 2005. IEEE Computer Society Conference on. Vol. 2. IEEE, 2005.
[5] Khatri, Nidhi N., Zankhana H. Shah, and Samip A. Patel. "Facial Expression Recognition: A Survey." IJCSIT) International Journal of Computer Science and Information Technologies 5.1 (2014): 149-152.
[6] Koelstra, Sander, Maja Pantic, and Ioannis Yiannis Patras. "A dynamic texture-based approach to recognition of facial actions and their temporal models."Pattern Analysis and Machine Intelligence, IEEE Transactions on 32.11 (2010): 1940-1954.
[7] Koelstra, Sander, and Maja Pantic. "Non-rigid registration using free-form deformations for recognition of facial actions and their temporal dynamics."Automatic Face & Gesture Recognition, 2008. FG'08. 8th IEEE International Conference on. IEEE, 2008.
[8] Pantic, Maja, and Ioannis Patras. "Detecting facial actions and their temporal segments in nearly frontal-view face image sequences." Systems, Man and Cybernetics, 2005 IEEE International Conference on. Vol. 4. IEEE, 2005.
[9] Pantic, Maja, and Ioannis Patras. "Dynamics of facial expression: recognition of facial actions and their temporal segments from face profile image sequences." Systems, Man, and Cybernetics, Part B: Cybernetics, IEEE Transactions on 36.2 (2006): 433-449.
[10] Valstar, Michel F., and Maja Pantic. "Fully automatic recognition of the temporal phases of facial actions." Systems, Man, and Cybernetics, Part B: Cybernetics, IEEE Transactions on 42.1 (2012): 28-43.
[11] Valstar, Michel F., et al. "Meta-analysis of the first facial expression recognition challenge." Systems, Man, and Cybernetics, Part B: Cybernetics, IEEE Transactions on 42.4 (2012): 966-979.
[12] Pantic, Maja, and Leon JM Rothkrantz. "Facial action recognition for facial expression analysis from static face images." Systems, Man, and Cybernetics, Part B: Cybernetics, IEEE Transactions on 34.3 (2004): 1449-1461.
[13] Pantic, Maja, and Ioannis Patras. "Temporal modeling of facial actions from face profile image sequences." Multimedia and Expo, 2004. ICME'04. 2004 IEEE International Conference on. Vol. 1. IEEE, 2004.
[14] Zhao, Guoying, and Matti Pietikainen. "Dynamic texture recognition using local binary patterns with an application to facial expressions." Pattern Analysis and Machine Intelligence, IEEE Transactions on 29.6 (2007): 915-928.
[15] Jemaa, Yousra Ben, and Sana Khanfir. "Automatic local Gabor features extraction for face recognition." arXiv preprint arXiv:0907.4984 (2009).
[16] Pantic, Maja, Ioannis Patras, and Leon Rothkrantz. "Facial gesture recognition in face profile image sequences." Delft University of Technology ITS/Mediamatics Dept. Delft, the Netherlands (2002).
[17] Valstar, Michel, Ioannis Patras, and Maja Pantic. "Facial action unit recognition using temporal templates." Robot and Human Interactive Communication, 2004. ROMAN 2004. 13th IEEE International Workshop on. IEEE, 2004.
[18] Valstar, Michel, Maja Pantic, and Ioannis Patras. "Motion history for facial action detection in video." Systems, Man and Cybernetics, 2004 IEEE International Conference on. Vol. 1. IEEE, 2004.
[19] Pantic, Maja, and Leon Rothkrantz. "Facial action detection from dual-view static face images." Fuzzy Systems, 2004. Proceedings. 2004 IEEE International Conference on. Vol. 1. IEEE, 2004.
[20] Valstar, Michel F., I. Patras, and Maja Pantic. "Facial action unit detection using probabilistic actively learned support vector machines on tracked facial point data." Computer Vision and Pattern Recognition-Workshops, 2005. CVPR Workshops. IEEE Computer Society Conference on. IEEE, 2005.
[21] Gu, Wenfei, et al. "Facial expression recognition using radial encoding of local Gabor features and classifier synthesis." Pattern Recognition 45.1 (2012): 80-91.
[22] Sandbach, Georgia, Stefanos Zafeiriou, and Maja Pantic. "Local normal binary patterns for 3d facial action unit detection." Image Processing (ICIP), 2012 19th IEEE International Conference on. IEEE, 2012.
[23] Lucey, Patrick, et al. "Automatically detecting pain in video through facial action units." Systems, Man, and Cybernetics, Part B: Cybernetics, IEEE Transactions on 41.3 (2011): 664-674.
[24] Kotsia, Irene, Stefanos Zafeiriou, and Ioannis Pitas. "Texture and shape information fusion for facial expression and facial action unit recognition."Pattern Recognition 41.3 (2008): 833-851.
[25] Valstar, Michel F., and Maja Pantic. "Combined support vector machines and hidden markov models for modeling facial action temporal dynamics." Human–Computer Interaction. Springer Berlin Heidelberg, 2007. 118-127

International Conference on Inter Disciplinary Research in Engineering and Technology 88
Cite this article as: Neeru Rathee, Nishtha. “Automatic AU intensity detection/estimation for Facial
Expression Analysis: A Review”. International Conference on Inter Disciplinary Research in Engineering
and Technology (2016): 83-88. Print.
[26] Pitt, Michael K., and Neil Shephard. "Filtering via simulation: Auxiliary particle filters." Journal of the American statistical association 94.446 (1999): 590-599.
[27] Patras, Ioannis, and Maja Pantic. "Particle filtering with factorized likelihoods for tracking facial features." Automatic Face and Gesture Recognition, 2004. Proceedings. Sixth IEEE International Conference on. IEEE, 2004.
[28] Ojala, Timo, Matti Pietikäinen, and David Harwood. "A comparative study of texture measures with classification based on featured distributions." Pattern recognition 29.1 (1996): 51-59.
[29] Jiang, Bihan, Michel F. Valstar, and Maja Pantic. "Facial action detection using block-based pyramid appearance descriptors." Privacy, Security, Risk and Trust (PASSAT), 2012 International Conference on and 2012 International Confernece on Social Computing (SocialCom). IEEE, 2012.
[30] Jiang, Bihan, Michel F. Valstar, and Maja Pantic. "Action unit detection using sparse appearance descriptors in space-time video volumes." Automatic Face & Gesture Recognition and Workshops (FG 2011), 2011 IEEE International Conference on. IEEE, 2011.
[31] Simon, Tomas, et al. "Action unit detection with segment-based SVMs."Computer Vision and Pattern Recognition (CVPR), 2010 IEEE Conference on. IEEE, 2010.
[32] Littlewort, Gwen, et al. "Dynamics of facial expression extracted automatically from video." Image and Vision Computing 24.6 (2006): 615-625.
[33] Cohen, Ira, Ashutosh Garg, and Thomas S. Huang. "Emotion recognition from facial expressions using multilevel HMM." Neural information processing systems. Vol. 2. 2000.
[34] Cohen, Ira, et al. "Facial expression recognition from video sequences: temporal and static modeling." Computer Vision and image understanding 91.1 (2003): 160-187.

International Conference on Inter Disciplinary Research in Engineering and Technology 89
Cite this article as: Akil Ahmed. “Dynamic Analysis of Multi-storey RCC Building Frames”. International
Conference on Inter Disciplinary Research in Engineering and Technology (2016): 89-94. Print.
International Conference on Inter Disciplinary Research in Engineering and Technology 2016 [ICIDRET 2016]
ISBN 978-81-929866-0-9 VOL 01 Website icidret.in eMail [email protected] Received 23-December-2015 Accepted 30-December-2015 Article ID ICIDRET019 eAID ICIDRET.2016.019
Dynamic Analysis of Multi-storey RCC Building Frames
Akil Ahmed1 1Department of Civil Engineering, Jamia Millia Islamia (A Central University), New Delhi, India
Abstract: The important objective of earthquake engineers is to design and build a structure in such a way that damage to the structure and its
structural component during the earthquake is minimized. This report aims towards the dynamic analysis of a multi-storey RCC building with
symmetrical configuration. For the analysis purpose model of ten storeys RCC with symmetrical floor plan is considered. The analysis is carried by using
finite element based software SAP 2000. Various response parameters such as lateral force, base shear, story drift, story shear can be determined. For
dynamic analysis time history method or response spectra method can be used .Time-history analysis is a step-by-step analysis of the dynamical response
of a structure to a specified loading that may vary with time. The analysis may be linear or non-linear. Dynamic analysis can be performed for
symmetrical as well as unsymmetrical building. Dynamic analysis can be in the form of nonlinear dynamic time history analysis. In this paper, a
nonlinear time history analysis is performed on a ten storey RCC building frame considering time history of El Centro earthquake 1940 using SAP
2000. The main parameters of the seismic analysis of structures are load carrying capacity, ductility, stiffness, damping and mass. The various response
parameters like base shear, storey drift, storey displacements etc are calculated. The storey drift calculated is compared with the minimum requirement
of storey drift as per IS 1893:2002.
Keywords: RCC Building Frame, SAP 2000, Storey drift.
INTRODUCTION
Baldev D. Prajapati (2013) discussed the analysis & design procedure that may be adopted for the evaluation of symmetric multi-storey building under effect of Wind and earthquake forces. Structures are designed to resist moderate and frequently occurring earthquakes & wind and must have sufficient stiffness and strength to control displacement and to prevent any possible damage. It is inappropriate to design a structure to remain in the elastic region, under severe earthquakes & wind lateral forces, because of the economic constraints. The inherent damping of yielding structural elements can advantageously be utilized to lower the strength requirement, leading to a more economical design. This yielding usually provides the ductility or toughness of the structure against the sudden brittle type structural failure. Dj. Ladjinovic et al. (2012) presented an overview of modeling methods and results of the analysis obtained for the designed model of multi-storey frame using the programme SAP2000. The paper presents different possibilities for modelling plastic hinges for the nonlinear static analysis of reinforced concrete frame. The real behaviour of a structure during an earthquake can be the best simulated using the nonlinear dynamic time-history analysis (THA). The strength and deformation capacity of ductile concrete elements of the multi-storey frame structure is determined by the analysis of moment-curvature based on the expected (adopted) material properties. The nonlinear behaviour of structural elements is idealized by plastic hinges set in pre-selected locations. Since, THA is still too complicated for practical application; the calculation methods based on nonlinear static pushover analysis are used. Mayuri D. Bhagwat et al. (2014) performed dynamic analysis of multistoried practiced RCC building considering for Koyna and Bhuj
This paper is prepared exclusively for International Conference on Inter Disciplinary Research in Engineering and Technology 2016 [ICIDRET] which is published by ASDF International, Registered in London, United Kingdom. Permission to make digital or hard copies of part or all of this work for personal or classroom use is granted without fee provided that copies are not made or distributed for profit or commercial advantage, and that copies bear this notice and the full citation on the first page. Copyrights for third-party components of this work must be honoured. For all other uses, contact the owner/author(s). Copyright Holder can be reached at [email protected] for distribution.
2016 © Reserved by ASDF.international

International Conference on Inter Disciplinary Research in Engineering and Technology 90
Cite this article as: Akil Ahmed. “Dynamic Analysis of Multi-storey RCC Building Frames”. International
Conference on Inter Disciplinary Research in Engineering and Technology (2016): 89-94. Print.
earthquake is carried out by time history analysis and response spectrum analysis and seismic responses of such building are comparatively studied and modeled. Two time histories (i.e. Koyna and Bhuj) have been used to develop different acceptable criteria (base shear, storey displacement, storey drifts). Reinforced concrete buildings have been damaged on a very large scale in Bhuj earthquake of Jan 26th 2001, Even though these buildings are analyzed and designed as per IS code. The damages are caused by inconsistence seismic response, irregularity in mass and plan, soft storey and floating columns etc. Hence it becomes necessary to evaluate actual seismic performance of building subjected to earthquake forces. Time History analysis gives more realistic seismic behavior of the building. It gives more accurately seismic responses than response spectrum analysis because of it incorporates material nonlinearity and dynamic nature of earthquake. A S Patil et al carried out the study of nonlinear dynamic analysis of ten storied RCC building considering different seismic intensities is carried out and seismic responses such as base shear and displacements of such building are studied. The building under consideration is modeled with the help of SAP2000-15 software. The software is able to predict the geometric nonlinear behavior of space frames under static or dynamic loadings, taking into account both geometric nonlinearity and material inelasticity. Five different time histories have been used considering seismic intensities V, VI, VII, VIII, IX and X on Modified Mercalli's Intensity scale (MMI) for establishment of relationship between seismic intensities and seismic responses. The values of seismic responses namely base shear, storey displacement and storey drifts for all the Time Histories and both the models are found to be of the increased order for seismic intensities varying from V to X. From this study it is recommended that analysis of multistoried RCC building using Time History method becomes necessary to ensure safety against earthquake force. It provides a better check to the safety of structures analyzed and designed by method specified by IS code. A.R. Chandrasekaran and D. S. Prakash Rao studied on some of the poor planning and construction practices of multistoried buildings in Peninsular India in particular, which lead to irregularities in plan and elevation of the buildings are discussed in this paper. The large scale collapse of reinforced concrete multi-storied buildings (RCMS) in Gujarat (January 2001) could have been avoided by suitable planning, and good constructional practices. Inadequate detailing of columns, seismically unfavourable layouts and weak story at the ground floor appear to be the primary causes of the structural damage and collapses; ignorance of structural behaviour and non-compliance with building regulations may be the contributory causes. Mohammed yousuf, P.M. shimpale (2013) performed dynamic analysis of reinforced concrete building with plan irregularity. Four models of G+5 building with one symmetric plan and remaining irregular plan have been taken for the investigation. The analysis of R.C.C. building is carried out with the FE based software ETABS 9.5. Estimation of response such as; lateral forces, base shear, storey drift, storey shear is carried out. . Four cross sectional variation in columns section are considered for studying effectiveness in resisting lateral forces. The paper also deals with the effect of the variation of the building plan on the structural response building. Pralobh S. Gaikwad and Kanhaiya K. Tulani (2015) carried out dynamic analysis of RCC and Steel building with unsymmetrical configuration. For the analysis purpose models of G + 9 stories of RCC and Steel with unsymmetrical floor plan is considered. The analysis is carried by using F.E based software E TABS. Various parameters such as lateral force, base shear, story drift, story shear can be determined. For dynamic analysis time history method or response spectra method is used. .If the RCC and Steel building are unsymmetrical, torsional effect will be produce in both the building and thus are compared with each other to determine the efficient building under the effect of torsion. Hugo Batchmann et al. presented a dynamic nonlinear analysis method for RCC building subjected to earthquake action is presented. Nonlinear elements for modeling of plastic hinges in walls, beams and columns are explained. In numerical example, a capacity designed frame wall building subjected to different ground motion is analyzed, and an evaluation of the ductility demand of the plastic hinges in walls, beams and in slender columns is made. Romy Mohan and C Prabha studied on two multi storey buildings, one of six and other of eleven storey have been modeled using software package SAP 2000 12 for earthquake zone V in India. Six different types of shear walls with its variation in shape are considered for studying their effectiveness in resisting lateral forces. The paper also deals with the effect of the variation of the building height on the structural response of the shear wall. Dynamic responses under prominent earthquake, El-Centro have been investigated. This paper highlights the accuracy and exactness of Time History analysis in comparison with the most commonly adopted Response Spectrum Analysis and Equivalent Static Analysis. A.M. Mwafy, A.S. Elnashai investigated the applicability and accuracy of inelastic static pushover analysis in predicting the seismic response of RC buildings. The dynamic pushover’ idealised envelopes are obtained from incremental dynamic collapse analysis. This is undertaken using natural and artificial earthquake records imposed on 12 RC buildings of different characteristics. The results of over one hundred inelastic dynamic analyses using a detailed 2D modelling approach for each of the twelve RC buildings have been utilised to develop the dynamic pushover envelopes and compare these with the static pushover results with different load patterns.

International Conference on Inter Disciplinary Research in Engineering and Technology 91
Cite this article as: Akil Ahmed. “Dynamic Analysis of Multi-storey RCC Building Frames”. International
Conference on Inter Disciplinary Research in Engineering and Technology (2016): 89-94. Print.
STRUCTURAL MODELING AND ANALYSIS
The finite element analysis software SAP 2000 is used to create 3D model and run all analyses. The software is able to predict the geometric nonlinear behavior of space frames under static or dynamic loadings, taking into account both geometric nonlinearity and material inelasticity. In this report, a nonlinear time history analysis will be performed on a multi storey RCC building frame considering time history of El Centro earthquake 1940. Problem statement: A 10 storey RCC masonry infilled RCC building is considered. The geometry and dimension of plan are shown below: Live Load on Typical floors - 3.5 KN/m2 Live Load on Terrace – 1.5 KN/m2 Column size - 0.5 m X 0.5 m; Beams size - 0.23 m X 0.45 m Slab Thickness - 0.150 m; Brick wall thickness – 0.23m Density of concrete- 25 kN/m3; Density of brick wall- 20 kN/m3 Floor to floor height- 3.1 m. Height of parapet wall- 1m Use M25 concrete and Fe415 steel. Load calculations: Dead load (self wt.) of slab= 0.15x1x25= 3.75kN/m Wall load intensity= 0.23 x (3.1-0.45) x 20= 12.19kN/m Parapet wall load intensity= 0.23 x 1 x 20= 4.6kN/m
Figure 1: Elevation Figure 2: Plan Figure 3: 3D view The building is modelled as shown in the figures 1,2 and 3. After modelling, nonlinear time history analysis is performed using El Centro time history. Location: “Imperial Valley” Date: 19th May 1940 Time: 4:39am Station: “El Centro Array” Units of acceleration: g= 9.81 m/s2 (acceleration of gravity); Sampling time: ∆t = 0.02 s
Results and Discussion Number of modes considered = 12
Frequency (cycle/sec) = 1/T
Circular frequency, ω (rad/sec) = 2Q/T
Eigen value = ω2
As samples, some results from the software are given in the table 1, 2 and 3 and graphs 1, 2, 3 and 4.

International Conference on Inter Disciplinary Research in Engineering and Technology 92
Cite this article as: Akil Ahmed. “Dynamic Analysis of Multi-storey RCC Building Frames”. International
Conference on Inter Disciplinary Research in Engineering and Technology (2016): 89-94. Print.
TABLE 1 MODE NUMBER WITH ITS RESPECTIVE PERIOD AND FREQUENCY
TABLE 2 RESULTS OF BASE SHEAR
Case Fx (kN) Fy (kN) Fz (kN) Mx (kNm) My (kNm) Mz (kNm) Time History 2528.2 184.59 0.00049 3535.13 55298.88 4280.82
TABLE 3
STOREY DRIFT IN X AND Y DIRECTIONS Floor Storey drift in X-dir (m) Storey drift in y-dir (m) 1st 0.026 0.006 2nd 0.0428 0.011 3rd 0.055 0.014 4th 0.067 0.017 5th 0.076 0.019 6th 0.085 0.021 7th 0.093 0.023 8th 0.099 0.025 9th 0.103 0.026 10th (roof) 0.106 0.027
Figure 1: The plot of variation of base shear in x-direction w.r.t time(sec)

International Conference on Inter Disciplinary Research in Engineering and Technology 93
Cite this article as: Akil Ahmed. “Dynamic Analysis of Multi-storey RCC Building Frames”. International
Conference on Inter Disciplinary Research in Engineering and Technology (2016): 89-94. Print.
Figure 2: Plot of variation of base shear in y-direction w.r.t time (sec)
Figure 3: Plot of variation of roof displacement in X-dir w.r.t time (sec)
Figure 4: plot of variation of roof displacement in Y-dir w.r.t time (sec)
Maximum roof displacement= 0.106 m As per is 1893:2002, clause 7.11.1, the storey drift in any storey due to the design lateral force shall not exceed 0.004 times the storey height. Maximum permissible storey drift= 0.004 x 31m = 0.124m
Conclusion
It is observed that storey drift increases from base to top floor. Maximum storey drift is found to be within permissible storey drift range as per IS 1893:2002. The maximum drift obtained for a ten storey building was 0.106m while permissible drift is approximately 0.124 m. The maximum base shear in x and y direction was found to be 2528.2 kN and 184.59 kN respectively. For the analysis purpose basic parameter taken are lateral force, base shear, storey drift, storey shear and results are interpreted. It is recommended that time history analysis should be performed as it predicts the structural response more accurately than the response spectrum analysis.

International Conference on Inter Disciplinary Research in Engineering and Technology 94
Cite this article as: Akil Ahmed. “Dynamic Analysis of Multi-storey RCC Building Frames”. International
Conference on Inter Disciplinary Research in Engineering and Technology (2016): 89-94. Print.
The numbers of mode shapes considered are 12 and for each mode number the time period, frequency and eigen values are mentioned above. The variation of base shears in X and Y direction with respect to time history of El Centro earthquake is plotted and similarly the variation of storey drift in X and Y direction with respect to time history is also plotted.
REFERENCES [1] D. Baldev, D. R. Prajapati, “Panchal study of seismic and wind effect on multi storey r.c.c., steel and composite building,” [2] A. S. Patil and P. D. Kumbhar, “Time history analysis of multistoried rcc buildings for different seismic intensities,” [3] Dj. Ladjinovic, A. Raseta, A. Radujkovic & R. Folic, “Comparison of Structural Models for Seismic Analysis of Multi-Storey
Frame Buildings,” [4] A.R. Chandrasekaran, D. S. Prakash Rao, “Aseismic Design of Multi-storied RCC Buildings,” [5] D Mayuri, D. Bhagwat,P.S.Patil, “Comparative study of performance of rcc multistory building for koyna and bhuj
earthquakes,” [6] R. K. Bajpai, S. Sharma and M.K. Gupta, “Dynamic analysis on Multistory R.C.C. Framed structures with the help of
different software,” [7] M. Yousuf, P.M. shimpale, “Dynamic Analysis of Reinforced Concrete Building with Plan Irregularities,” [8] P. S. Gaikwad and K. K. Tolani, “Review Paper on Dynamic Analysis of Building,” [9] R. Mohan, “Dynamic Analysis of RCC Buildings with Shear Wall,” [10] J. Gould, “Reinforced Concrete Frame Building Response Comparison among Structural Analysis Tools,” [11] A.M. Mwafy, A.S. Elnashai, “Static pushover versus dynamic collapse analysis of RC buildings,” [12] S. G. Satpute, D. B. Kulkarni, “Analysis of reinforced concrete shear wall building with openings by time history method,” [13] H. M. Agha, L.Yingmin, O. A. Salih and A. Al-Jbori, “Nonlinear performance of a ten-story reinforced concrete special
moment resisting frame (smrf),” [14] Indian Standard criteria for earthquake resistant design of structures IS 1893:2002

International Conference on Inter Disciplinary Research in Engineering and Technology 95
Cite this article as: Akil Ahmed. “Background Study of Base Isolated Structure and Analysis of Base
Isolated Frame”. International Conference on Inter Disciplinary Research in Engineering and Technology
(2016): 95-100. Print.
International Conference on Inter Disciplinary Research in Engineering and Technology 2016 [ICIDRET 2016]
ISBN 978-81-929866-0-9 VOL 01 Website icidret.in eMail [email protected] Received 23-December-2015 Accepted 30-December-2015 Article ID ICIDRET020 eAID ICIDRET.2016.020
Background Study of Base Isolated Structure and Analysis of Base Isolated Frame
Akil Ahmed1
1Department of Civil Engineering, Jamia Millia Islamia (A Central University), New Delhi, India
Abstract: For seismic design of building structures, the conventional method, i.e., strengthening the stiffness, strength, and ductility of the structures,
has been commonly used for a long time. Therefore, the dimensions of structural members and the consumption of material are expected to be increased,
which leads to higher cost of the buildings as well as larger seismic responses due to larger stiffness of the structures. Thus, the efficiency of the
traditional method is constrained. To overcome these disadvantages associated with the traditional method, many vibration-control measures, called
structural control, have been studied over recent years. Structural Control is a diverse field of study. Structural Control is the one of the areas of current
research aims to reduce structural vibrations during loading such as earthquakes and strong winds. In terms of different vibration absorption methods,
structural control can be classified into active control, passive control, hybrid control, semi-active control and so on. The passive control is more studied
and applied to the existing buildings than the others. Base isolation is a passive vibration control system that does not require any external power source for its operation and utilizes the motion of the structure to develop the control forces. Performance of base isolated buildings in different parts of the
world during earthquakes in the recent past established that the base isolation technology is a viable alternative to conventional earthquake-resistant
design of medium-rise buildings. The application of this technology may keep the building to remain essentially elastic and thus ensure safety during
large earthquakes. Since a base-isolated structure has fundamental frequency lower than both its fixed base frequency and the dominant frequencies of
ground motion, the first mode of vibration of isolated structure involves deformation only in the isolation system whereas superstructure remains almost
rigid. In this way, the isolation becomes an attractive approach where protection of expensive sensitive equipment and internal non-structural
components is needed. It was of interest to check the difference between the responses of a fixed-base building frame and the isolated-base building frame
under seismic loading. This was the primary motivation of the present study.
Keywords: Seismic Design, Isolated Structure, Isolated Frame.
INTRODUCTION
The Earthquakes affect buildings in several ways. Thus, providing isolators is one of the remedy to safeguard the structure against severe earthquake. Also, the secondary structures are strategically very important structure as they have vital uses in activities connected to public life. As we have seen in past earthquakes that there was devastating damage to life and structure. So safety is a must for them. There have been a number of reports on damage to structures in past earthquakes which have demonstrated the seismic vulnerability of structure and the damage. The major reason for the damage is that there is a loss of support under its foundations, failure structural member etc. A building may also be affected by earthquake motion excites the structure due to which various floors acts as independent to the structure wall motion while another part of the structure which moves in unison with the rigid frame wall. Also, if the flexibility of the frame wall is considered then the part of the impulsive mass moves independently while remaining accelerates back and forth with frame wall as rigid mass. The accelerating structure and rigid masses, induces substantial pressures on
This paper is prepared exclusively for International Conference on Inter Disciplinary Research in Engineering and Technology 2016 [ICIDRET] which is published by ASDF International, Registered in London, United Kingdom. Permission to make digital or hard copies of part or all of this work for personal or classroom use is granted without fee provided that copies are not made or distributed for profit or commercial advantage, and that copies bear this notice and the full citation on the first page. Copyrights for third-party components of this work must be honoured. For all other uses, contact the owner/author(s). Copyright Holder can be reached at [email protected] for distribution.
2016 © Reserved by ASDF.international

International Conference on Inter Disciplinary Research in Engineering and Technology 96
Cite this article as: Akil Ahmed. “Background Study of Base Isolated Structure and Analysis of Base
Isolated Frame”. International Conference on Inter Disciplinary Research in Engineering and Technology
(2016): 95-100. Print.
the wall of RC frame which in turn generates lateral pressures (i.e. base shear) and overturning moment. The failure occurs also as the RC structure buckles due to axial compression, toppling of the frame structure, failure of floors, failure if roof and uplift of the anchorage system. “Earthquake proof structures” generally mean the structures which resist the earthquake and save and maintain their functions. The key points for their design includes select good ground for the site, make them light, make them strong, make them ductile, shift the natural period of the structures from the predominant period of earthquake motion, heighten the damping capacity. Izumi Masanory [1] studied on the remained literature, the first base isolated structure was proposed by Kawai in 1981 after the Nobi Earthquake (M=8.0) on journal of Architecture and building Science. His structure has rollers at its foundation mat of logs put on several steps by lengthwise and crosswise manually. After the San Francisco Earthquake (M=7.8) an English doctor J.A. Calantarients patented a construction by putting a talc between the foundations in 1909. The first base isolated systems actually constructed in the world are the Fudo Bank Buildings in Himeji and Simonoseki, Japan designed by R. Oka. After the world War-II, the U.S took a leading part of Earthquake Engineering. Garevski A et al. [2] The primary school "Pestalozzi" in Skopje, built in 1969, is the first building in the world for which natural rubber isolators were used for its protection against strong earthquakes. The first base isolated building in the United States is the Foothill Communities of Law And Justice Centre completed in 1985 having four stories high with a full basement and sub-basement for isolation system which consists of 98 isolators of multilayered natural rubber bearings reinforced with steel plates. The Superstructure of the building has a Structural Steel frame stiffened by braced frames in some Bays. In India, base isolation technique was first demonstrated after the 1993 Killari (Maharashtra) Earthquake [EERI, 1999]. Two single storey buildings (one school building and another shopping complex building) in newly relocated Killari town were built with rubber base isolators resting on hard ground. Both were brick masonry buildings with concrete roof. After the 2001 Bhuj (Gujarat) earthquake, the four-storey Bhuj Hospital building was built with base isolation technique [4]. The Base isolation system has been introduced in some books of dynamic Engineering and the number of scholars has been increasing in the world.
LITERATURE REVIEW
The studies presented for literature review are categorized as:
• Nonlinear dynamic Analysis of framed structure.
• Relative performance of Fixed-base and Base-isolated concrete frames.
• Base Isolated Structures subjected to near-fault earthquakes
• Effect of Superstructure Stiffening on base isolation. Nonlinear dynamic Analysis of framed structure Constantinou et al. [3] described in this paper an analytical model and an algorithm to analyze multiple buildings on a common isolation system and the results are used to demonstrate the importance of analyzing the combined system as against analyzing individual buildings. Jain and Thakkar [4] explored the idea of superstructure stiffening is to enhance the effectiveness of base isolation for 10 to 20 storeys range of buildings. The superstructure stiffening may result in reduced fixed base period and such buildings, if base isolated may develop smaller seismic response. Jangid and Kulkarni [5] made a comparison in this study of the seismic response of a multi-storey base-isolated building by idealizing the superstructure as rigid and flexible. The top floor acceleration and bearing displacement of the system are plotted. Relative performance of Fixed-base and Base-isolated concrete frames Shenton and Lin [6] compared the performance of code designed fixed-base and base-isolated concrete frames in a quantitative manner. Time-history analyses were conducted. Bezerra and Carneiro [7] presented a paper which deals with numerical evaluation of the efficiency of anti-vibration mechanisms applied to typical frame structures under earthquake. The building structure is modelled by finite elements, an anti-vibration mechanism is placed at the building base with special finite element, and an artificial earthquake equivalent to El Centro is generated and applied at the building base. The behaviour of the frame, with and without anti-vibration mechanisms, is compared. Providakis [8] carried out nonlinear time history analyses using a commercial structural analysis software package to study the influence of isolation damping on base and superstructure drift. Aiken et al. [9] documented in their paper the seismic behaviour of four seismically isolated buildings from their recorded response for earthquakes producing various amplitudes and durations of shaking. It considers the responses of multiple buildings to multiple earthquakes. Base Isolated Structures subjected to near-fault earthquakes: Mazza and Vulcano [10] studied the nonlinear seismic response of base-isolated framed buildings subjected to near-fault earthquakes to analyze the effects of supplemental damping at the level of the isolation system, commonly adopted to avoid overly large isolators. Aiken et al. [11] described the results of a study of an existing seismically isolated building in Southern California which are located near San Andreas Fault, San Jacinto fault and south frontal fault zone. Analysis result for three levels of earthquake was presented and recommendations are made.

International Conference on Inter Disciplinary Research in Engineering and Technology 97
Cite this article as: Akil Ahmed. “Background Study of Base Isolated Structure and Analysis of Base
Isolated Frame”. International Conference on Inter Disciplinary Research in Engineering and Technology
(2016): 95-100. Print.
Effect of Superstructure Stiffening on Base Isolation: Jain and Thakkar [12] explored the idea of superstructure stiffening is to enhance the effectiveness of base isolation for 10 to 20 storeys range of buildings. The superstructure stiffening may result in reduced fixed base period and such buildings, if base isolation may develop smaller seismic response. Jangid and Kulkarni [13] made a comparison of the seismic response of a multi-storey base-isolated building by idealizing the superstructure as rigid and flexible with the corresponding response under rigid superstructure conditions to study the influence of superstructure flexibility under various isolation system parameters (i.e. isolation period, damping, yield strength of the elastomeric bearings and friction coefficient of sliding systems).
MATHEMATICAL FORMULATION
The greatest interest in structural engineering is the deformation of the system, or displacement u(t) of the mass relative to the moving ground, to which the internal forces are linearly related. Knowing the total displacement u(t) and acceleration of a structure during an earthquake adequate step can be taken to prevent its failure during earthquake. After equating the acceleration and displacement of a structure, the cause of damage to several buildings during earthquake is reduced. The frame modeling is based on the approach used in the computer program SAP2000 14. SAP2000 14 is object based software, meaning that the models are created using members that represent the physical reality. This idealizes the system into a lumped mass and a mass less supporting system. The RC structure was first equated without the Based Isolator and its natural frequency was calculated w.r.t. time. Dynamic characteristics of the structure such as natural frequencies and mode shapes are also obtained using SAP2000 14. The structure was then modeled with Base Isolator placed in it. And its acceleration and displacement are found. MODAL ANALYSIS: Modal analysis is the study of the dynamic properties of structures under vibration excitation. In structural engineering, modal analysis uses the overall mass and stiffness of a structure to find the various periods at which it will naturally resonate. A normal mode of an oscillating system is a pattern of motion in which all parts of the system move sinusoidal with the same frequency and with a fixed phase relation. Time-History Analysis: Time history analysis of the frame was carried out to determine the response of the frame under a given dynamic loading. Time history analysis is the most natural and intuitive approach. The response history is divided into time increments ∆t and the structure is subjected to a sequence of individual time-independent force pulses ∆f (t). The nonlinear response is thus approximated by series of piecewise linear systems. Here time history records of Northridge Earthquake, Century City (17/01/1994) data recorded at LACC NORTH is used for the time history analysis. The Northridge earthquake was a massive earthquake that occurred on January 17, 1994 in Reseda, a neighborhood in the city of Los Angeles, California, lasting for about 10–20 seconds. The earthquake had a "strong" moment magnitude of 6.7, but the ground acceleration was one of the highest ever instrumentally recorded.
RESULTS AND DISCUSSION MODAL ANALYSIS OF A RC FRAME Modal analysis of a typical building structure frame is done to determine the dynamic parameters like natural frequency, time period, modal participating mass ratios and their corresponding mode shapes. Typical building structure frame made of reinforced concrete has ten floors (figure 1) and composed of columns 3.0 m height and of cross section 30×50 cm2 with I = 3.1×10⁻³m4 , and beams with span of 4.5m, cross-section 24x55 cm2 , and inertia I = 3.5×10⁻³m4 . The first natural frequency of the building is 2.3Hz. From the modal analysis time period, frequencies are noted for modes with considerable mass participation. These are the important modes of consideration. The first natural frequency of the building was calculated in Hz. From the modal analysis time period, frequencies are noted for modes with considerable mass participation. These are the important modes of consideration. The first natural frequency of the building was also calculated in SAP2000 in Hz (table 1).
TABLE 1 TIME PERIOD AND FREQUENCY OF THE BUILDING FOR FIRST THREE MODES
MODE TIME PERIOD (second) FREQUENCY
(hertz) 1 0.762349 1.3117 2 0.744952 1.3424 3 0.604138 1.6553

International Conference on Inter Disciplinary Research in Engineering and Technology 98
Cite this article as: Akil Ahmed. “Background Study of Base Isolated Structure and Analysis of Base
Isolated Frame”. International Conference on Inter Disciplinary Research in Engineering and Technology
(2016): 95-100. Print.
Figure 1: Structural model of building from SAP window
TIME-HISTORY ANALYSIS OF THE FRAME: The response (i.e. Displacement, Velocity, and Acceleration) of the steel frame subjected to a selected earthquake ground motion was found out by non-linear time history analysis using SAP 2000 v12.0.0. The selected earthquake ground motion is Northridge Earthquake record. (Northridge earthquake, January 17, 1994, Reseda, a neighbourhood in the city of Los Angeles, California, USA). RESPONSE OF THE FRAME Displacement Displacement of the frame subjected to time history analysis is recorded in each node in both X-direction and Y-direction. No displacement is recorded at the base since the base is in the fixed condition. It is to be noted that that maximum displacement is achieved at all the nodes at the same time i.e. at 6.44 sec. Storey displacement are calculated. It is clear from the result that storey drift is more in the first storey which goes on decreasing in successive upper storeys. Displacement of the frame in each node in Y-direction is found to be very less as compared to the displacement of the frame in the X-direction when it is subjected to time history force. Velocity Velocity of the frame subjected to time history analysis is recorded in each node in both X-direction and Y-direction. No velocity is recorded at the base since the base is in the fixed condition. The result indicates that storey velocity is more in the lower storey and it goes on decreasing in the successive upper storeys. Acceleration Acceleration of the frame subjected to time history analysis is recorded in each node of the frame. No acceleration is recorded at the base since the base is in the fixed condition. From the result it is clear that storey acceleration is more in the lower storey and it goes on decreasing in the successive upper storeys. Result Modal analysis of the fixed base steel frame is done to determine its natural frequency and mode shape followed by its time-history analysis using time history record of Northridge earthquake (January 17, 1994 in Reseda, a neighbourhood in the city of Los Angeles, California, USA) at an interval of .02 sec for 60 sec. duration to determine the response of the frame under dynamic loading. It was concluded that the responses (displacement, inter-storey drift, velocity, acceleration) of the structure is more in lower storey as compared to the upper storeys. Maximum displacement is achieved at all the nodes at the same time i.e. at 6.44 sec. Story drift is more in lower storeys and it goes on decreasing in the successive upper storeys. For dynamic loading design of building structures, we have to consider the dynamic loading response demand and go for the methods like strengthening the stiffness, strength, and ductility of the structures which has been in common use for a long time. Therefore, the

International Conference on Inter Disciplinary Research in Engineering and Technology 99
Cite this article as: Akil Ahmed. “Background Study of Base Isolated Structure and Analysis of Base
Isolated Frame”. International Conference on Inter Disciplinary Research in Engineering and Technology
(2016): 95-100. Print.
dimensions of structural members and the consumption of material are expected to be increased, which leads to higher cost of the buildings as well as larger seismic responses due to larger stiffness of the structures. Base isolation decreases the dynamic loading response demand of the structure to a certain extent as compared to its bare frame by absorbing and dissipating the energy imparted on the structure due to dynamic loading (figures 3 and 4).
Figure 2: Mode Shape without base isolator and with fixed base
Figure 3: Mode Shape with base isolator
CONCLUSION
The investigation of dynamic properties of the framed structure under dynamic loading and effectiveness of base isolation of structure under dynamic loading are done and following conclusions achieved. This paper first presents the modal analysis results and then it discusses the time history analysis results of frame with fixed and isolated base subjected to Northridge Earthquake ground motion. The results show that the base isolation reduces the responses (displacement, velocity, acceleration, and storey drift) drastically. Also, base isolation reduces the stiffness and thereby increases the fundamental period of the building to bring it out of the maximum spectral response region. Therefore it can be concluded from the results presented here that base isolation is very effective seismic control measures.
REFERENCES
[1] I. Masanory, “Base Isolation and passive Seismic response control, ” Proceedings of Ninth World Conference on Earthquake Engineering, VIII, (1988): pp. 385-396
[2] G. A. Mihail. “Analysis of 3-D vibrations of the Base Isolated School Building "Pestalozzi" by analytical and experimental approach, ” Proceedings of Ninth World Conference on Earthquake Engineering, 12 (2000): pp. 1-8.
[3] M. C. Constantinou et al. “Non-linear dynamic analysis of multiple building base isolated structures, ” Computers and Structures, 50, (1994): pp. 47-57
[4] S. K. Jain and S. K. Thakkar, “Effect of Superstructure Stiffening in Base Isolated Tall Buildings, ” IE (I) Journal.CV, 85, (2004): pp. 142-148
[5] R. S. Jangid and J. A. Kulkarni, “Rigid body response of base-isolated structures, ” Journal of Structural Control, 9, (2002): pp. 171–188
[6] H. W. Shenton and A. N. Lin “Relative performance of Fixed-base and Base-isolated concrete frames, ” Journal of Structural Engineering, 119, (1993),: pp. 2952-2968

International Conference on Inter Disciplinary Research in Engineering and Technology 100
Cite this article as: Akil Ahmed. “Background Study of Base Isolated Structure and Analysis of Base
Isolated Frame”. International Conference on Inter Disciplinary Research in Engineering and Technology
(2016): 95-100. Print.
[7] L. M. Bezerra and R. C. Carneiro. “A Numerical Evaluation of AntiVibration Mechanisms Applied to Frame Structures Under Earthquake, ” 17th International Conference on Structural Mechanics in Reactor Technology (SMIRT 17), 13-2, (2003): pp. 1-8
[8] C.P. Providakis “Effect of LRB isolators and supplemental viscous dampers on seismic isolated buildings under near-fault excitations, ” 30 (2008) : pp. 1187–1198Aiken Ian D. Observed behaviour of Seismically Isolated buildings, Journal of Structural Engineering, 125 (1999): pp. 955-964.
[9] M. Fabio and V. Alfonso. “Nonlinear Response of RC Framed Buildings with Isolation and Supplemental Damping at the Base Subjected to Near-Fault Earthquakes, ” Journal of Earthquake Engineering,, 13(2009): pp. 690–715
[10] I.D. Aiken et al. “Performance considerations for isolation systems in the region of high seismicity, ” Proceedings, ATC-17-1, Seminar on seismic isolation, passive energy 69 dissipation and active control, applied technology Council, San Francisco, California, 17-1 (1991): pp. 1-12
[11] S K. Jain and S. K. Thakkar “Effect of Superstructure Stiffening in Base Isolated Tall Buildings, ” IE (I) Journal.CV, 85 (2004): pp. 142–148
[12] R. S.Jangid and J. A. Kulkarni “Rigid body response of base-isolated structures, ” Journal of Structural Control, 9 (2002): pp. 171–188

International Conference on Inter Disciplinary Research in Engineering and Technology 101
Cite this article as: Akil Ahmed. “System Identification of a Beam Using Frequency Response Analysis”.
International Conference on Inter Disciplinary Research in Engineering and Technology (2016): 101-105.
Print.
International Conference on Inter Disciplinary Research in Engineering and Technology 2016 [ICIDRET 2016]
ISBN 978-81-929866-0-9 VOL 01 Website icidret.in eMail [email protected] Received 24-December-2015 Accepted 30-December-2015 Article ID ICIDRET021 eAID ICIDRET.2016.021
System Identification of a Beam Using Frequency Response Analysis
Akil Ahmed1
1Department of Civil Engineering, Jamia Millia Islamia (A Central University), New Delhi, India
Abstract: System identification is an emerging area in engineering fields. To assess the present health of important structures is necessary to know the
status of the health of structure and subsequently to improve the health of the structure. In this work, using the finite element software, a simple
structural member like beam is modeled. A simply supported beam is taken and crack is initiated at the bottom of the beam along it’s width by reducing
the cross section in different location. Free vibration analysis is performed using FEM software SAP2000. There is a difference between the frequencies of
cracked and un-cracked beam. From this analysis it can be predicted that there is damage in the beam, but location of the damage cannot be detected.
For this, mode shape to be found out. This concept can be used to know in the real life structure whether there is any damage or not using the non-
destructive techniques.
Keywords: FEM Software, SAP2000, System Identification.
INTRODUCTION
System Identification (SI) is a emerging tool to assess the health of engineering structures and employed in different fields of engineering [1,2]. Using this tool, the dynamic characteristics – frequency, mode shaped, mass, damping coefficient, stiffness etc. of the structures are determined. Structural health monitoring has already gained a great attention to the engineers, scientists and academicians for assessment and evaluation the health status of the structures [3], [4] and [5] . The objective of the health monitoring is to give the present status of the structure so that precautionary measures can be taken to protect the structure from the further damage and repair the structure. There are many reasons that cause early damage in the structures. Environmental actions cause deterioration in the concrete and steel. Lack in quality control at the construction stage is also the reason of damages in the structure. During manufacturing process there may be defects in the materials used in the structure. Natural hazards like earthquake and high wind also create defects in the structures. Due to load reversal in the structures, the cracks may be widened and there may be more cracks from the old cracks. Consequently, there may be loss of integrity in the structure leading to its failure. Structural health monitoring (SHM) gives the solution to avoid this problem. By using different methods of system identification, the early damages can detected with location. The structural parameters like stiffness, damping and mass can be evaluated and appropriate measures can be taken to avoid the catastrophic failure of the structure. There are many non-destructive techniques for damage detection namely X-ray imaging, ultrasonic scans, infrared thermograph, and eddy current can identify damages. But those all are localized techniques and have many limitations. Besides, it is difficult to screen the whole structure locally to employ these techniques. These drawbacks of those techniques motivate engineer and researcher to search new techniques to overcome those difficulties. Evaluation of the dynamic response is very powerful techniques to get the global and integrated response of the structure. In this technique, the structure is excited with dynamic load to get the dynamic parameters like damping, natural frequency and mode shape. These parameters are compared with that of undamaged structures to detect the damage
This paper is prepared exclusively for International Conference on Inter Disciplinary Research in Engineering and Technology 2016 [ICIDRET] which is published by ASDF International, Registered in London, United Kingdom. Permission to make digital or hard copies of part or all of this work for personal or classroom use is granted without fee provided that copies are not made or distributed for profit or commercial advantage, and that copies bear this notice and the full citation on the first page. Copyrights for third-party components of this work must be honoured. For all other uses, contact the owner/author(s). Copyright Holder can be reached at [email protected] for distribution.
2016 © Reserved by ASDF.international

International Conference on Inter Disciplinary Research in Engineering and Technology 102
Cite this article as: Akil Ahmed. “System Identification of a Beam Using Frequency Response Analysis”.
International Conference on Inter Disciplinary Research in Engineering and Technology (2016): 101-105.
Print.
or defects in the structure. The damage can be estimated by comparing the parameters of damaged and undamaged structures. Some methods in system identification are as follows:
• Conventional model-based approaches
• Biology based approach - Neural network and genetic algorithm • Signal processing-based approach- wavelets
• Chaos theory
• Multi-paradigm approaches In conventional model-based approaches of system identification, some physical parameters are evaluated from model developed in FEM software [6] and [7]. In this approach, the parameters are evaluated in the model and compared between the parameters of damaged and virgin structures. This is the advantage of the approach. The disadvantage of the approach is that it cannot accurately predict the physical parameters of complex and life line structure. But it forms a basis for other methods.
LITERATURE REVIEW
Most beams and 2D frame structures can be modelled with reasonable accuracy using a model-based approach. Liu [8] used measured natural frequencies and mode shapes for system identification and damage detection of an aluminium 2D truss with 21 members. The damage was defined as a reduction in the axial stiffness which was determined by identifying changes to the natural frequencies and mode shapes of the truss. J. Kosmatka, M. Ricles [9] presented for detecting structure damage in elastic structure by non-destructive means. The current approach is unique as it accounts for: 1. Variation in system mass, system stiffness and mass centered locations. 2. Perturbation of both the natural frequency and modal vectors. 3. Statical confidence factors for the structural parameters and potential experimental instrumentation error. It used modal vibration characterization for detecting stiffness changes in a ten-bay aluminium space truss. Kim and Stubbs [10] investigate how model uncertainty affects accuracy when identifying structural degradation of a two-span aluminium plate girder, especially when only a few modal response parameters are used. The authors point out the potential shortcomings of the model-based approach especially when the model is too idealized and not a good representation of the actual structure. Modelling error-effects on model-based systems are also investigated by Sanayei et al. [11] with respect to the error functions used. The authors compare the performance of two stiffness-based and two flexibility-based error functions in terms of model error propagation rate and the quality of the final parameter estimates. They conclude that stiffness-based error functions are better than flexibility-based functions in terms of modelling error. Damage identification in beams is a common theme in system identification research. Kim and Stubbs [12] discuss damage identification of a two-span continuous beam using modal information. U. Lee, J. Shin [13] developed a frequency response function-based structural damage identification method. They detect changes in the stiffness of beams based on a frequency-based response function by varying the cross sections of beam sections at different locations. J. Kim, N. Stubbs [14] presented improved damage identification method based on modal information. This paper introduces a FRF based structural damage identification method for beam structures. The damage within the beam structures are characterized by introducing a damage distribution function. Z.R. Lu, J.K. Liu, M. Huang, W.H. Xu [15] identified of local damages in coupled beam systems from measured dynamic responses. They used a Finite Element (FE) model updating method to detect changes in flexural stiffness in coupled beam systems (two beams connected by a set of linear and rotational springs). This investigation investigated the non-linear free vibration of a cantilever beam containing an open crack under large vibration amplitudes and a semi-analytical solution about the beam of non-linear vibrations was proposed. K. Liew, Q. Wang [16] applied wavelet theory for crack identification in structures. They used wavelets to identify cracks in simply supported beams. This paper presents the first attempt of an application of the wavelet theory for the crack identification of the systems. In this case study, crack identification is considered using the wavelet theory for a simply supported beam with a transverse on-edge non-propagating open crack. T. Pan, C. Lee[17] applied wavelet theory to identify yielding in seismic response of bi-linear structures. They used wavelets to identify yielding of lumped mass Single-Degree-Of-Freedom (SDOF) and Multi-Degree-Of-Freedom (MDOF) systems subjected to seismic loading.

International Conference on Inter Disciplinary Research in Engineering and Technology 103
Cite this article as: Akil Ahmed. “System Identification of a Beam Using Frequency Response Analysis”.
International Conference on Inter Disciplinary Research in Engineering and Technology (2016): 101-105.
Print.
Jeong-Tae Kim; Yeon-Sun Ryu; Hyun-Man Cho; Norris Stubbs [18] presented damage identification in beam-type structures: frequency-based method vs mode-shape-based method. They presented a methodology to nondestructively locate and estimate the size of damage in structures for which a few natural frequencies or a few mode shapes are available. First, a frequency-based damage detection (FBDD) method is outlined. A damage-localization algorithm to locate damage from changes in natural frequencies and a damage-sizing algorithm to estimate crack-size from natural frequency perturbation are formulated. Next, a mode-shape-based damage detection (MBDD) method is outlined. A damage index algorithm to localize and estimate the severity of damage from monitoring changes in modal strain energy is formulated. The FBDD method and the MBDD method are evaluated for several damage scenarios by locating and sizing damage in numerically simulated prestressed concrete beams for which two natural frequencies and mode shapes are generated from finite element models. The result of the analyses indicates that the FBDD method and the MBDD method correctly localize the damage and accurately estimate the sizes of the cracks simulated in the test beam. X.Q. Zhu, S.S. Law [19] developed Wavelet-based crack identification of bridge beam from operational deflection time history. They suggested a new method for crack identification of bridge beam structures under a moving load based on wavelet analysis is presented. Crack is modelled through rotational springs whose compliance is evaluated using linear elastic fracture mechanics. Dynamic behavior of the cracked beam subject to moving load is analyzed using mode superposition. The response obtained at a single measuring point is analyzed using continuous wavelet transform and the location of the cracks is estimated. The locations of the cracks are determined from the sudden changes in the spatial variation of the transform responses. To estimate the relative depth of the cracks, a damage factor is established which relates the size of the cracks to the coefficients of the wavelet transform. The proposed method is validated by both simulation and experiment. Locations of multiple damages can be located accurately, and the results are not sensitive to measurement noise, speed and magnitude of moving load, measuring location, etc.
DAMAGE DETECTION TECHNIQUES
In this section, two mostly used damaged detection techniques are described. Frequency based damage detection Natural frequency based method is the easiest method of system identification. In this method, natural frequency is measured experimentally in one or two locations of the structure be placing the sensors. The frequency of damaged structure will be less than that of undamaged structure as the stiffness is reduced. This method can easily be verified in the laboratory by employing on simple structures. Analytically or computationally, natural frequency can be determined using different methods. Using FEM software, the model of the structure is made and either stiffness or cross section is reduced at the damaged location. Then natural frequency is determined. This is the simplest method, but it cannot be applied for complex and big structure. By this method, only one structure is damaged or not can be detected. The location, shape and size of the damage cannot be determined as several combinations of these variables can yield similar or identical frequency change. Mode shape-based damage detection A more robust application of dynamic-based approach for damage detecting is based on mode shapes. This method has been developed to assess damage directly using the measured displacement mode shapes or curvature mode shapes. A more effective method of damage detection based on the mode shapes is the use of curvature mode shapes. From Euler-Bernoulli beam theory, the curvature mode shape is related to the Young’s modulus of beam and the beam cross sectional geometric properties. The use of curvature mode shapes in damage identification is based on the assumptions that the curvature of an undamaged structure is smooth and continuous and the irregularity of the curvature can thus determine the location of the damaged for a homogeneous structure. The change in the curvature mode shapes is highly localized to the region of damages, and they are more pronounced than the changes in the displacement mode shapes. The curvature is often calculated from the measured displacement mode shapes by using a central difference approximation.
FEM MODELLING
SAP2000 is used in present analysis. Description of these softwares and their participation in analysis is mentioned below. Modelling and frequency response analysis is done in SAP2000 SAP 2000 is used to model plain concrete beams. The analysis of beams is based on Euler-beam theory, i.e., shear deformations are not considered. Area section is used to model beam. Element type is selected such that assumptions of Euler-beam theory are satisfied. Therefore ‘thin shell’ is used to model the beam. Simply supported beam is selected for the purpose of analysis. ‘Grid only’ option is used to create beam models. For all three beams specified above grid is created such that sectional view along the longitudinal axis of beam is divided into ‘n’ number of rectangle representing minimum size of crack to be provided. DIMENSIONS OF BEAM For all three cases same cross-section and span length is considered. Cross section - 230 x 300 mm Span length - 3000 mm

International Conference on Inter Disciplinary Research in Engineering and Technology 104
Cite this article as: Akil Ahmed. “System Identification of a Beam Using Frequency Response Analysis”.
International Conference on Inter Disciplinary Research in Engineering and Technology (2016): 101-105.
Print.
DIMENSION OF CRACK AND CRACK LOCATION CRACK SIZES- Crack sizes were used mentioned below, 30mm x 20mm x 230mm 60mm x 40mm x 230mm CRACK LOCATION-
BEAM TYPE LOCATION
Simply supported beam At L/4
RESULTS AND DISCUSSION
As discussed above two damage detection techniques can be studied in this analysis, Here frequency based analysis is carried out in
order to detect damage in simply supported beam.
Comparative results obtained, are discussed below:
Results of frequency and natural frequency are arranged in tabular form.
FREQUENCY
Comparison between frequencies at different modes is given in the following table (table 1):
CONCLUSION
In this study, using damage localization technique frequency based the natural frequency of damaged and undamaged simply supported beam is determined as an assessment of state of the health of structures. By this method, only detection of damage can be carried out. For detecting location of damage, other methods like mode shape based methods to be employed.
REFERENCES
[1] M. Vejmelka, M. Palus, K. Susmakova, “Identification of nonlinear oscillatory activity embedded in broadband neural signals, ” International Journal of Neural Systems, 2010, pp 117-28
[2] G. Puscasu, B. Codres, “Nonlinear system identification and control based on modular neural networks,” Int J Neural Syst. 2011, pp. 319-34
[3] X. Jiang, H. Adeli, “Pseudospectra, MUSIC, and dynamic wavelet neural network for damage detection of high-rise buildings” International Journal for Numerical Methods in Engineering, 2008, pp. 1045-1066
[4] H.S. Park, H.M. Lee, H. Adeli, I. Lee, “A new approach for health monitoring of structures: terrestrial laser scanning,” Computer-Aided Civil and Infrastructure Engineering, 2007, pp. 19–30, 2007
[5] H.M. Lee, H.S. Park, “Gauge-free stress estimation of a beam-like structure based on terrestrial laser scanning, ” Computer-Aided Civil and Infrastructure Engineering, 2011, pp. 647–658
[6] S. Peterson, D. McLean, M. Symans, D. Pollock, W. Cofer, R. Emerson, K. Fridley, “Application of dynamic system identification to timber beams, “Journal of Structural Engineering”, 2001, pp. 418–425
[7] P. Liu, C. Chian, “Parametric identification of truss structures using static strains,” J. Struct. Eng., 1997, pp. 927-933. [8] P. Liu, “Identification and damage detection of trusses using modal data, ” J. Struct. Eng., 1995, pp. 599-608
TABLE 1
NATURAL FREQUENCY OF SIMPLY SUPPORTED BEAM
NATURAL FREQUENCY (Rad/sec)
Crack size (mm) Crack location Mode1 Mode2 Mode3
UNCRACKED 2215.7 4432.6 6645.7
30 X 20 L/4 2215.1 4434.1 6644.5
60 x 40 L/4 2213.6 4442 6639.4

International Conference on Inter Disciplinary Research in Engineering and Technology 105
Cite this article as: Akil Ahmed. “System Identification of a Beam Using Frequency Response Analysis”.
International Conference on Inter Disciplinary Research in Engineering and Technology (2016): 101-105.
Print.
[9] J. Kosmatka, M. Ricles, “Damage detection in structures by modal vibration characterization,” Journal of Structural Engineering, 1999
[10] J. Kim, N. Stubbs, “Model-uncertainty impact and damage-detection accuracy in plate girder,” Journal of Sound and Vibration 252 (2), pp. 223-238, 2002
[11] M. Sanayei, S. Wadia-Fascetti, B. Arya, E. Santini, “Significance of modeling error in structural parameter estimation, ” Computer‐Aided Civil and Infrastructure Engineering 16 (1),pp. 12-27
[12] J. Kim, N. Stubbs, “Improved damage identification method based on modal information, ” J. Struct. Eng. 121(10), 1995, pp. 1409–1417.
[13] U. Lee, J. Shin, “A frequency response function-based structural damage identification method,” Journal of Structural Engineering,1991, pp. 223–242.
[14] L. Jiang, K. Wang, “An enhanced frequency-shift-based damage identification method using tunable piezoelectric transducer circuitry, ” Smart Materials and Structures, 15 (3) (2006), pp. 799–808
[15] Z.R. Lu, J.K. Liu, M. Huang, W.H. Xu, “Identification of local damages in coupled beam systems from measured dynamic responses, ” AIAA Journal, Vol. 29, No. 12 (1991), pp. 2271-2274.
[16] K. Liew, Q. Wang, “Application of wavelet theory for crack identification in structures, ” J. Eng. Mech., 1998, pp. 152-157.
[17] T. Pan, C. Lee, “Application of wavelet theory to identify yielding in seismic response of bi-linear structures, ” Earthquake Engineering & Structural Dynamics 31(2): pp. 379-398.
[18] Jeong-Tae Kim; Yeon-Sun Ryu; Hyun-Man Cho; Norris Stubbs, “Damage identification in beam-type structures: frequency-based method vs mode-shape-based method, ” Engineering Structures, 2003, pp. 57 - 67
[19] X.Q. Zhu, S.S. Law, “Wavelet-based crack identification of bridge beam from operational deflection time history, ” Engineering Structures, 2003, pp. 57 - 67

International Conference on Inter Disciplinary Research in Engineering and Technology 106
Cite this article as: Akil Ahmed, Divya Yadav. “Seismic Analysis of Irregular Buildings”. International
Conference on Inter Disciplinary Research in Engineering and Technology (2016): 106-111. Print.
International Conference on Inter Disciplinary Research in Engineering and Technology 2016 [ICIDRET 2016]
ISBN 978-81-929866-0-9 VOL 01 Website icidret.in eMail [email protected] Received 25-December-2015 Accepted 30-December-2015 Article ID ICIDRET022 eAID ICIDRET.2016.022
Seismic Analysis of Irregular Buildings
Akil Ahmed1 1Department of Civil Engineering, Jamia Millia Islamia (A Central University), New Delhi, India
Abstract: In countries like India where the mountains, hills and the plateaus form a significant part of its terrain. It is the increasing demand of the
time to construct the RCC Buildings in hilly regions due to urbanization. The construction at hills is different from plains as they are more prone to
seismic activities. As the buildings on sloping areas are having irregularities, the behavior of the building during earthquake depends upon the
distribution of the mass and stiffness in both the horizontal and vertical direction. They are more susceptible to severe damage. Moreover, during
earthquake, irregular buildings in hilly areas serve more damage. Dynamic response of hill buildings is somewhat different than the buildings on flat
ground. Short column of RC frame building serves damage because of attracting more forces during earthquake. The RCC Buildings on the hilly regions
are narrowed down to basic formats as step back and set back - step back and set back frames. The dynamic response i.e. fundamental time period, storey
displacement and drift, and base shear action induced in buildings have been studied for buildings of different heights. The regular, set back and step
back building frames are analyzed and compared in this study.
Keywords: Seismic Analysis, RCC Building, Earthquake.
INTRODUCTION
A building is said to be setback, when it has step like recession while moving vertically/horizontally. Setbacks were initially used for the structural purpose; in ancient time it was used to increase the height of structures by distributing gravity load produced by the building material. Ancient example of setback techniques are step pyramids of Mesopotamia and ancient Egypt. But now a day’s setbacks are often mandated by land use codes or are used for aesthetical reasons. There are many rules that apply to urban planning commission to use setback techniques to make sure that streets and yards are provided more open space and sufficient light and air. Setback techniques also provide usable exterior space, which may be utilized for skyline views, gardening and outdoor dining. In addition, setbacks promote fire safety by spacing buildings and their protruding parts away from each other and allow for passage of firefighting apparatus between buildings. Some examples are: Empire State Building (New York), Willis (sears) tower (Chicago). A building is said to be step-back, when it is founded on multiple supports at different levels while moving vertically/horizontally. Step-back buildings are provided where a level foundation is not possible. This is sometimes the only option available in hilly regions. Symmetrical buildings with uniform mass and stiffness distribution behave in a fairly predictable manner, whereas buildings that are asymmetrical or with areas of discontinuity or irregularity do not. For such buildings, dynamic analysis is used to determine significant response characteristics such as the effect of the structure’s dynamic characteristics on the vertical distribution of lateral forces. Due to torsion effect and the influence of higher modes, story shears and deformations increase. Static method specified in building codes are based on single-mode response with simple corrections for including higher mode effects. While appropriate for simple regular structures, the simplified procedures do not take into account the full range of seismic behaviour of complex structures. Therefore, dynamic analysis is the preferred method for the design of buildings with unusual or irregular geometry.
This paper is prepared exclusively for International Conference on Inter Disciplinary Research in Engineering and Technology 2016 [ICIDRET] which is published by ASDF International, Registered in London, United Kingdom. Permission to make digital or hard copies of part or all of this work for personal or classroom use is granted without fee provided that copies are not made or distributed for profit or commercial advantage, and that copies bear this notice and the full citation on the first page. Copyrights for third-party components of this work must be honoured. For all other uses, contact the owner/author(s). Copyright Holder can be reached at [email protected] for distribution.
2016 © Reserved by ASDF.international

International Conference on Inter Disciplinary Research in Engineering and Technology 107
Cite this article as: Akil Ahmed, Divya Yadav. “Seismic Analysis of Irregular Buildings”. International
Conference on Inter Disciplinary Research in Engineering and Technology (2016): 106-111. Print.
LITERATURE REVIEW
Dr. Sanjaya Kumar Patro, Susanta Banerjee, Debasnana Jena, Sourav Kumar Das [1] reviewed a paper analyze the dynamic characteristics of these type of buildings with three different configuration such as a) Step back) Step back-Setback, and c) Setback. B.G. Birajdar, S.S. Nalawade [2] considered two buildings on sloping ground and one building is on flat soil. The first two are step back buildings and step back-setback buildings; and third is the set back building. The slope is taken 27 degree with horizontal. Depth of footing was taken 1.75m below. Nagarjuna, Shivakumar B. Patil [3] studied step back, set-back buildings and set back buildings situated on sloping ground. Number of storey considered for each type of configurations is 10 storeys. Plan layout of each configuration includes 4 bays across the slope direction and 6 bays are considered along slope direction, which is kept same for all configurations of building frame. Slopes of ground considered are 10- 40 degree with the horizontal. The columns are taken to be square to avoid the issues like orientation. The depth of footing below ground level is taken as 1.5 m where, the hard stratum is available. He obtained the capacity curve and evaluates the performance with shear wall. Shivanand.B, H.S.Vidyadhara [4] developed 3D analytical model of 12 storied building generated for symmetric and asymmetric Case. Building models are analyzed and designed by ETABS software to study the effect of influence of bracings, shear wall at different positions. Seismic analysis was done by linear static (ESA), linear dynamic (RSA) and non-linear static Analysis (Pushover analysis). Chaitrali Arvind Deshpande, Prof. P.M.Mohite [5] analyzed G+6 multistoried building here with storey height of 3.1 m and hard Strata is available at 1.5 m below ground level, slope of ground are 26°, 28°, 30° building configurations are consider comparison of responses of stepback building and stepback-setback with and without bottom ties. G Suresh, Dr.E Arunakanthi [6] carried out three dimensional space frame analysis for two different configurations of buildings ranging from 8 to 10 storey’s resting on sloping and plain ground under the action of seismic load and a comparison was made between the three frames i.e. step back, set back, set back and step back. Y.Singh & Phani Gade [7] presented some observations about seismic behavior of hill buildings during the Sikkim earthquake of September 18, 2011. An analytical study is also performed to investigate the peculiar seismic behavior of hill buildings. Dynamic response of hill buildings is compared with that of regular buildings on flat ground in terms of fundamental period of vibration, pattern of inter-storey drift, column shear, and plastic hinge formation pattern. The seismic behavior of two typical configurations of hill buildings is investigated using linear and non-linear time history analysis. Mario de Stefan, Barbara Pintuuchi [8] reviewed research over seismic behavior of irregular buildings. This paper presents an overview of the progress in research regarding the seismic analysis of the irregular buildings- plan and vertical. Three areas were considered first the effect of plan irregularity second torsional effect and third the vertical irregular building. Bahrain M. Shahrooz and Jack P. Moehle [9] evaluated effects of setbacks on the earthquake response of multistory building structures. As part of the study, they measured responses to simulated earthquakes of a ductile moment - resisting reinforced concrete test structures. The test structure is a one quarter scale model of a six storey, two bays by two bays building having a 50% setback at mid height. Joseph Penzine [10] presented the approximate method for the determination of the peak seismic response of certain irregular buildings while subjected to base acceleration. This method was based on the forced response of two degree of freedom system and is applied to lateral motion of the buildings having large setbacks coupled lateral torsional motion of the eccentric buildings.
MODELLING
Modeling of regular reinforced concrete building (R), set-back (S1) and step-back (S2) offset of the regular building (Figure 1 and 2) is carried out by Response Spectrum Analysis based on code IS1893:2002, Seismic Coefficient Method as well as Modal Analysis. The results for key parameter such as top storey node displacement, base shear, and base moment, modal responses etc. are tabulated. The results among key parameters are compared in tabular form.
Figure 1. Elevation of the regular, set back and step back building

International Conference on Inter Disciplinary Research in Engineering and Technology 108
Cite this article as: Akil Ahmed, Divya Yadav. “Seismic Analysis of Irregular Buildings”. International
Conference on Inter Disciplinary Research in Engineering and Technology (2016): 106-111. Print.
(Dimensions 20m X 28 m) Figure 2. Floor plan
RESULTS AND DISCUSSION
The parameters for all the selected setback buildings as obtained from different methods available as tabulated below (Table 1 to 3) show that the buildings with same height and width may have different period depending on the amount of irregularity present in the setback buildings. Many empirical formulae suggested by codes do not take into account the irregularities present in buildings and thus
they do not change for different type of irregularities.
TABLE 1 COMPARATIVE RESULTS – STOREY SHEAR
Storey Shear (kN)
Storey Elevation (m)
R S1 S2

International Conference on Inter Disciplinary Research in Engineering and Technology 109
Cite this article as: Akil Ahmed, Divya Yadav. “Seismic Analysis of Irregular Buildings”. International
Conference on Inter Disciplinary Research in Engineering and Technology (2016): 106-111. Print.
EQX EQY EQX EQY EQX EQY
TF 47.6 802.607 802.607 639.87 639.87 1105.88 1105.88
10F 44 753.932 753.932 604.706 604.706 1033.4 1033.4
9F 40.4 635.609 635.609 509.802 509.802 660.423 660.423
8F 36.8 527.379 527.379 493.723 493.723 474.197 474.197
7F 33.2 429.243 429.243 406.662 406.662 381.76 381.76
6F 29.6 341.201 341.201 323.252 323.252 303.457 303.457
5F 26 263.253 263.253 249.405 249.405 205.031 205.031
4F 22.4 195.399 195.399 185.12 185.12 128.672 128.672
3F 18.8 137.639 137.639 143.584 143.584 74.0754 74.0754
2F 15.2 89.9734 89.9734 94.5799 94.5799 37.5963 37.5963
1F 11.6 52.4014 52.4014 59.1001 59.1001 15.5913 15.5913
GF 8 56.945 56.945 64.5893 64.5893 4.4708 4.4708
UBF 4 15.0809 15.0809 17.1054 17.1054 0.3748 0.3748
Base 0 0 0 0 0 0 0
TABLE 2 COMPARATIVE RESULTS – BASE SHEAR (kN)
R S1 S2
-4300.66 -3791.5 -4424.924

International Conference on Inter Disciplinary Research in Engineering and Technology 110
Cite this article as: Akil Ahmed, Divya Yadav. “Seismic Analysis of Irregular Buildings”. International
Conference on Inter Disciplinary Research in Engineering and Technology (2016): 106-111. Print.
TABLE 3
COMPARATIVE RESULTS – DEFLECTIONS
Deflections (mm)
Storey Elevation (m) R S1 S2
SPECX SPECY SPECX SPECY SPECX SPECY
Base 0 0 0 0 0 0 0
UBF 4 1.1 1.1 1 1 0.1 0.1
GF 8 2.9 2.9 2.9 2.9 0.3 0.3
1F 11.6 5.4 5.4 5.3 5.3 0.5 0.6
2F 15.2 8.4 8.4 8.5 8.5 0.7 1
3F 18.8 11.3 11.3 11.6 11.6 1 1.7
4F 22.4 14.1 14.1 14.5 14.5 1.4 2.6
5F 26 16.6 16.6 17.2 17.2 2.1 3.9
6F 29.6 18.8 18.8 19.6 19.6 3 5.4
7F 33.2 20.8 20.8 21.8 21.8 3.8 6.8
8F 36.8 22.5 22.5 23.7 23.7 3.7 7.6
9F 40.4 24 24 25.2 25.2 3.3 8
10F 44 25.1 25.1 26.4 26.4 3.4 8.6
TF 47.6 25.8 25.8 27.3 27.3 4.4 9.5
CONCLUSION
The following conclusions are drawn after the analysis: 1. Seismic behavior of set-back buildings is very much similar to regular buildings. Step-back buildings have completely different behavior. 2. Base shear is found to be maximum for step-back building, followed by regular and set-back buildings. 3. Storey displacements are much higher for regular and set-back buildings compared to step-back buildings.
REFERENCES
[1] Dr. Sanjaya Kumar Patro, Susanta Banerjee, Debasnana Jena, Sourav Kumar Das, “A Review on Seismic Analysis Of a
Building on sloping ground” [2] B.G. Birajdar, S.S. Nalawade," SEISMIC ANALYSIS OF BUILDINGS RESTING ON SLOPING GROUND" [3] Nagarjuna, Shivakumar B. Patil,” LATERAL STABILITY OF MULTISTOREY BUILDING ON SLOPING GROUND” [4] Shivanand.B, H.S.Vidyadhara,” DESIGN OF 3D RC FRAME ON SLOPING GROUND”

International Conference on Inter Disciplinary Research in Engineering and Technology 111
Cite this article as: Akil Ahmed, Divya Yadav. “Seismic Analysis of Irregular Buildings”. International
Conference on Inter Disciplinary Research in Engineering and Technology (2016): 106-111. Print.
[5] Chaitrali Arvind Deshpande, Prof. P.M.Mohite,” Effect of Sloping Ground on Step-Back And Setback Configurations of R.C.C.Frame Building”
[6] GSuresh1, Dr.E Arunakanthi2,”Seismic Analysis of Buildings Resting on sloping Ground and Considering Bracing System” [7] Y.Singh & Phani Gade,” Seismic Behavior of Buildings Located on Slopes An Analytical Study and Some Observations From
Sikkim Earthquake of September 18, 2011.” [8] Mario de Stefan, Barbara pintuuchi,” review of research over seismic behavior of irregular buildings”- [9] Bahrain M. Shahrooz1 and Jack P. Moehle, “Seismic Response and Design of Setback Buildings”- [10] Joseph penzine,”earthquake response of irregularly shaped building”- [11] IS: 1893 (I)-2002. “Criteria for Earthquake Resistant Design of Structures” BIS, New Delhi. [12] IS 456:2000,"Indian Standard Code of Practice for Plane and Reinforced concrete”, Bureau of Indian Standards, New Delhi.

International Conference on Inter Disciplinary Research in Engineering and Technology 112
Cite this article as: Kokula Krishna Hari Kunasekaran, Vignesh Ramakrishnan, Rajkumar Sugumaran,
Prithiv Rajan S. “Optimize Virtual Machine Placement in Banker Algorithm for Energy Efficient Cloud
Computing”. International Conference on Inter Disciplinary Research in Engineering and Technology
(2016): 112-119. Print.
International Conference on Inter Disciplinary Research in Engineering and Technology 2016 [ICIDRET 2016]
ISBN 978-81-929866-0-9 VOL 01 Website icidret.in eMail [email protected] Received 25-December-2015 Accepted 30-December-2015 Article ID ICIDRET023 eAID ICIDRET.2016.023
Optimize Virtual Machine Placement in Banker Algorithm for Energy Efficient Cloud Computing
Kokula Krishna Hari Kunasekaran1, Vignesh Ramakrishnan2, Rajkumar Sugumaran3, Prithiv Rajan S4
1,2,3,4Association of Scientists, Developers and Faculties, Bangkok, Thailand
Abstract: Energy efficient utilization of data center resources can be carried out by optimization of the resources allocated in virtual machine
placement through live migration. This paper proposes a method to optimize virtual machine placement in Banker algorithm for energy efficient cloud
computing to tackle the issue of load balancing for hotspot mitigation and proposed method is named as Optimized Virtual Machine Placement in
Banker algorithm (OVMPBA). By determining the state of host overload through dynamic thresholds technique and minimization migration policy for
VM selection from the overloaded host an attempt is made to efficiently utilize the available computing resources and thus minimize the energy
consumption in the cloud environment. The above research work is experimentally simulated on CloudSim Simulator and the experimental result shows
that proposed OVMPBA method provides better energy efficiency and lesser number of migrations against existing methods of host overload detection-
virtual machine selection and therefore maximizes the cloud energy efficiency.
Keywords: energy efficiency; virtual machine placement; live virtual machine migration; load balancing; host overload detection; virtual machine selection.
INTRODUCTION
Cloud Computing refers to the means of providing computing power as Infrastructure, Platform and Software applications to end users as a service based on pay as you go pricing model. Prevalent use of cloud computing resulted advancement in the number of hosting data centers which have brought forth many concerns, including the cost of electrical energy, cooling, peak power dissipation and carbon emission. The issue of tackling high energy use can be addressed by removing improficiencies and waste which occurs in the way computing resources get involved to serve application workloads which can be achieved by improving the resource allocation and management algorithms.
Researchers have shown that many of the touted gains in the cloud model are attained from resource multiplexing through virtualization technology reinforced by the concept of virtual machine. Virtual machine associated features such as adaptable resource provisioning and migration have increased efficiency of resource usage and dynamic resource provisioning capabilities as a result of which several challenges cropped up which include balancing load amongst all PMs, determining which VM to place on which PM and managing unexpected escalation in resource demands. So, the focus is on the problem of energy efficient cloud computing through optimized VM placement in data centers, by ensuring that computing resources are efficiently utilized to serve application workloads to minimize energy consumption.
RELATED WORK
Energy efficient utilization of data center resources can be carried out in two steps as explained by Piyush Patel et al., in the year 2012 [1]:
This paper is prepared exclusively for International Conference on Inter Disciplinary Research in Engineering and Technology 2016 [ICIDRET] which is published by ASDF International, Registered in London, United Kingdom. Permission to make digital or hard copies of part or all of this work for personal or classroom use is granted without fee provided that copies are not made or distributed for profit or commercial advantage, and that copies bear this notice and the full citation on the first page. Copyrights for third-party components of this work must be honoured. For all other uses, contact the owner/author(s). Copyright Holder can be reached at [email protected] for distribution.
2016 © Reserved by ASDF.international

International Conference on Inter Disciplinary Research in Engineering and Technology 113
Cite this article as: Kokula Krishna Hari Kunasekaran, Vignesh Ramakrishnan, Rajkumar Sugumaran,
Prithiv Rajan S. “Optimize Virtual Machine Placement in Banker Algorithm for Energy Efficient Cloud
Computing”. International Conference on Inter Disciplinary Research in Engineering and Technology
(2016): 112-119. Print.
a) The first is efficient resource allocation through virtual machine placement, and b) The second is the optimization of the resources allocated in first step through live migration.
Optimization of current allocation of VMs is required when the current host for VM runs out of resources due to overload and is carried out in 2 steps as explained by Piyush Patel et al., in the year 2012 [1]:
a) At the first step VMs that require to be migrated from the overloaded host are chosen and b) At the second step the selected VMs are placed on the host machine by VM allocation algorithm.
Anwesha Das (2012)[2] in her research describes that all the algorithms which try to efficiently allocate resources on-demand through live migration answers four questions:-
a) determining when a host is considered as overloaded; b) determining when a host is considered as under-loaded; c) selection of VMs that should be migrated from an overloaded host; and d) finding a new placement of the VMs selected for migration from the overloaded and underloaded hosts.
Zhen Xiao et al. in 2013[3] introduced the concept of skewness to measure the unevenness in the multi-dimensional resource utilization of a server where n is the number of resources and ri is the utilization of ith resource and is calculated as:
Skewness (p) = √∑ ����� (ri /r)-1)2
By minimizing skewness, authors tried to improve the overall server resource utilization by combining different types of workloads and authors also evolved set of heuristics to prevent system overload effectively to save energy. The algorithm achieves overload avoidance as well as green computing for systems with multi-resource constraints. In 2011 [4] Richa Sinha et al. proposed a dynamic threshold based approach for CPU utilization evaluation for host at data center. The CPU utilization of all VMs and upper threshold value is calculated evaluated as: Uvm = totalRequestedMips / totalMipsforthatVM, Sum = ∑ Uvm , Sqr = √ ∑Uvm2 Tupper = 1-((( Puu * Sqr) + sum) – ((Pul * Sqr)+sum)) Best Fit Decreasing (BFD) heuristic of bin packing is used for VM placement and dynamic threshold based live migration is performed for VM selection. The consolidation works on dynamic and unpredictable workload avoiding unnecessary power consumption. Author Girish Metkar et al. in 2013[5] presented a method which uses a lower and upper level threshold to evaluate host overload and under load detection and are calculated as follows:
Uvm = totalrequestedMips, Sum= ∑Uvm Bw = ∑current bandwidth for VMs for host,
Ram = ∑current Ram for VMs for host temp= Sum + ( Bw/ Bw(host)) + (Ram / Ram(host))
Tupper = 1- 0.5* temp and Tlower =0.3 Minimization migration policy is used for VM selection to minimize the number of migrations as well as the energy consumption. The proposed method performs threshold-based dynamic consolidation of VMs with auto-adjustment of the threshold values. In 2012[6] authors Anton Beloglavoz et al. defined an architectural framework and concepts for useful resource provisioning and allocation algorithms for energy efficient management of cloud computing environments. Modified best fit decreasing (MBFD) algorithm is used for VM placement along with minimization of migration, highest potential growth and random selection policy of VM selection. Following power model is used by the authors to calculate energy:
P(u) = k. Pmax + (1-k). Pmax . U Here Pmax is the maximum power consumed by fully utilized server, k is the fraction of power consumed by the idle server, and U is the CPU utilization. The proposed energy aware allocation heuristics provide data center resources to client applications such that energy efficiency of datacenter is improved, while delivering negotiated Quality of Services. In [7] authors Ajith Singh N. and M. Hemalatha tried to do hotspot mitigation using banker algorithm for VM placement by checking whether the system is in safe state or unsafe state while allocation to avoid high chances of deadlock while resource allocation. Overload detection techniques of median absolute deviation (MAD), inter quartile range (IQR), local regression (LR), local regression robust (LRR), static threshold (THR) and VM selection algorithms of minimum migration time (MMT), maximum correlation (MC), minimum utilization (MU) and random selection (RS) in combination with specified overload detection techniques to determine when the migration is to be initiated and which virtual machines to migrate.

International Conference on Inter Disciplinary Research in Engineering and Technology 114
Cite this article as: Kokula Krishna Hari Kunasekaran, Vignesh Ramakrishnan, Rajkumar Sugumaran,
Prithiv Rajan S. “Optimize Virtual Machine Placement in Banker Algorithm for Energy Efficient Cloud
Computing”. International Conference on Inter Disciplinary Research in Engineering and Technology
(2016): 112-119. Print.
VM migration algorithms try to adapt to changing workload conditions by turning the knobs of resource allocations through triggering migrations. Thus, live VM migration has become an indispensable tool for resource provisioning and virtual machine placement in a virtualized environment.
SCOPE TO OPTIMIZE VIRTUAL MACHINE PLACEMENT IN BANKER ALGORITHM This paper focuses on VM placement using existing Banker algorithm which considers availability of multidimensional resources and ensures a deadlock free resource allocation. Ajith Singh et al., in the year 2013 [7] used various overload detection and VM selection methods along with banker algorithm for VM placement and evaluated the performance of several methods yielding better results in terms of number of migrations, average Service Level Agreement (SLA) violation and energy consumption. However, in [7] no technique is incorporated to detect system overload based on dynamic utilization threshold values to enable system automatically change its behaviour depending on the subjected workload patterns by the applications as used by Richa Sinha et al., in the year 2011 [4]. Moreover Anton Beloglazov et al., in the year 2010[6] and Richa Sinha et al., in the year 2011[4] uses minimization migration policy which selects VM to migrate based on its utilization with respect to its current host utilization and threshold value of the host and ensures least number of virtual machine migrations for VM placement optimization. Hence the author in this paper proposes use of dynamic threshold technique for host overload detection and minimization migration policy of VM selection for optimization of VM placement in Banker algorithm. The proposed combination of methods is expected to provide with better results in terms of energy efficiency, percentage SLA violation and number of migrations.
PROPOSED METHODOLOGY
In the adopted methodology, Optimized Virtual Machine Placement in Banker Algorithm for energy efficient Cloud Computing is named OVMPBA, the technique of Dynamic Threshold used for host overload detection is named as DT and Minimization Migration policy for VM selection is named as MM. Dynamic Threshold (DT) Technique for Host Overload detection: Threshold value is used to decide the time when the migration is to be initiated from a host. When the system load exceeds the threshold value, the system is detected as overloaded. Dynamic threshold (t) value for a host is calculated in following steps- Firstly CPU utilization for all VMs on the host is calculated as: Uvm = total Requested MIPS / total MIPS for that VM Then, allocated RAM and Bandwidth for all virtual machines and host is calculated as: Bw= ∑ current bandwidth for VMs for host Ram = ∑current Ram for VMs for host Sum=∑Uvm Temp= Sum+( Bw/Bw(host)) + (Ram/Ram(host)) t = 1- 0.5*temp For a host whose utilization value exceeds the threshold value ‘t’ some virtual machine migrations will be performed. Minimization Migration(MM) Policy for VM Selection: Once a host is determined as overloaded, some virtual machines requires to be migrated from the current host to lower down the utilization threshold. It is very difficult to decide which VM to migrate because if a large VM is selected, the total migration time will increase and if smallest VM is selected then number of VMs will be migrated. So, the minimization migration policy selects the VM whose size is equal to the difference between the total host utilization and the threshold value. Following are the steps of Minimization Migration policy which returns the list of VMs that can be migrated: Input: hostList, vmList Output: migrationList 1. vmList.sortDecreasingUtilization() 2. for each host in hostList do 3. hUtil ←h.util() 4. bestFitUtil ← MAX 5. while hUtil > h.thresh() do 6. for each vm in vmList do 7. if vm.util() > hUtil ─ h.thresh() then 8. t ← vm.util() ─ (hUtil ─ h.thresh()) 9. if t < bestFitUtil then 10. bestFitUtil ← t 11. bestFitVm ←vm 12. else

International Conference on Inter Disciplinary Research in Engineering and Technology 115
Cite this article as: Kokula Krishna Hari Kunasekaran, Vignesh Ramakrishnan, Rajkumar Sugumaran,
Prithiv Rajan S. “Optimize Virtual Machine Placement in Banker Algorithm for Energy Efficient Cloud
Computing”. International Conference on Inter Disciplinary Research in Engineering and Technology
(2016): 112-119. Print.
13. if bestFitUtil = MAX then 14. bestFitVm ← vm 15. break 16. hUtil = hUtil ─ bestFitVm.util() 17. migrationList.add(bestFitVm) 18. vmList.remove(vm) 19. return migrationList To optimize VM placement in Banker algorithm DT-MM method works together for efficient optimization of the VM placement plan. The method is compared against existing methods Inter Quartile Range (IQR), Local Regression Robust (LRR), Static Threshold (THR) of host overload detection and Maximum Correlation (MC), Minimum Migration Time (MMT) and Minimum Utilization (MU) of VM selection in all possible combinations against the parameters of energy consumption, percentage Service Level Agreement violation and number of migrations which are evaluated as follows in the CloudSim simulator: % SLA Violation: Overall SLA violation = (a-b)/a % SLA violation= 100 * Overall SLA violation Where a=Total Requested MIPS b=Total Allocated MIPS Energy consumption: Energy consumption = Total Utilization of CPU/ (3600*1000) Number of VM Migrations: Number of VM migrations = Total Migration Count
IMPLEMENTATION
CloudSim simulator is used to model and test the cloud environment. PlanetLab workload of CloudSim is used in the simulation. The cloud system in PlanetLab workload is deployed in a data centre comprising of two types of physical machines and four types of virtual machines. The target cloud model is an IaaS system with a cloud data center consisting of total ‘N’ physical machines where N=800. N can be represented by N= {pm1, pm2…pm800}. A set ‘M’ of virtual machines run on physical machines where M=1024 and M can be represented by M= {vm1, vm2….vm1024}. The virtual machines on a physical machine can be restarted, paused and migrated to other physical machines in cloud data center. Different Simulation parameters for the PlanetLab workload simulation are defined in Table I
TABLE I SIMULATION PARAMETERS AND THEIR VALUES
Parameter Value
Host types 2
Host MIPS {1860, 2660}
Host RAM {4096, 4096}
Host Bw 1000000(1Gbit/sec)
VM types 4 VM MIPS {2500, 2000, 1000, 500}
VM RAM {870, 1740, 1740, 613} VM Bw 100000(1Mbit/sec)
Flow Diagram: The flow diagram of optimized design of virtual machine placement in Banker algorithm through DT and MM (OVMPBA) is shown in figure 1.

International Conference on Inter Disciplinary Research in Engineering and Technology 116
Cite this article as: Kokula Krishna Hari Kunasekaran, Vignesh Ramakrishnan, Rajkumar Sugumaran,
Prithiv Rajan S. “Optimize Virtual Machine Placement in Banker Algorithm for Energy Efficient Cloud
Computing”. International Conference on Inter Disciplinary Research in Engineering and Technology
(2016): 112-119. Print.
Flow Diagram of OVMPBA
Steps to Optimize Virtual Machine Placement in Banker through DT and MM: The steps pursued for designing the optimize virtual machine placement in Banker algorithm through DT and MM are as follow:
1) User requests resources in cloud data center. 2) The cloud data center provides the required resources in the form of VMs. 3) The resource scheduling centre in the cloud data center allocates the VMs to a PM in the Banker algorithm. 4) The PM is checked dynamically for overloading through the DT technique as there are chances to develop a hotspot. 5) If a hotspot is detected then some VMs need to be migrated from this overloaded host.The MM policy selects the VM to be
migrated and the VM is again received by the resource scheduling center to be reallocated to a different active PM. The previous host is again checked for overloading and if the condition does persists then some more VM are migrated until the PM resource utilization normalizes.
6) Repeat step 4 and 5 until all the active PMs resource utilization optimizes. For the implementation of above steps firstly Banker algorithm is used for placement. DT technique detects dynamically the host overload as per varying workload demands. The VM selection policy used is MM which optimizes the resource utilization with minimum number of migrations in minimum migration time.
FINDINGS AND RESULTS
After designing the simulation model, configuring the cloud scenario, simulation is executed for both existing and proposed approaches and simulation output are analyzed to obtain the results. Results are obtained for existing overload detection and VM
Sta
rt
User requests resources in a data
center
VM allocation to PM using Banker
algorithm
Resource granted in the form of
VM
Check
through
DT if host
Has all
VM
execution
Select VM to
live migrate
from
overloaded
PM using
Exi
No
No
Yes
Yes

International Conference on Inter Disciplinary Research in Engineering and Technology 117
Cite this article as: Kokula Krishna Hari Kunasekaran, Vignesh Ramakrishnan, Rajkumar Sugumaran,
Prithiv Rajan S. “Optimize Virtual Machine Placement in Banker Algorithm for Energy Efficient Cloud
Computing”. International Conference on Inter Disciplinary Research in Engineering and Technology
(2016): 112-119. Print.
selection policy along with the proposed ones and Banker algorithm is used for VM placement. Results are compared by the help of graphs. The performance is evaluated for performance parameters of Energy Consumption in kWh, % Service Level Agreement (SLA) violation, Number of VM migrations. Following tables shows the result of simulating Banker algorithm with various overload detection techniques and VM selection policies:
TABLE II BANKER WITH OVERLOAD DETECTION BY IQR
OVMPBA Energy kWh
SLA% Migration
Overload Detection / VM Selection IQR-MC 25.75 0.00033 812 IQR-MMT 24.80 0.00036 830 IQR-MU 26.31 0.00029 780 IQR-MM 25.01 0.00032 785
Table II shows the result of simulating Banker algorithm with IQR overload detection and various VM Selection policies. From this table it can be concluded that Banker with IQR-MMT method consumes the minimum energy of 24.80 kWh, IQR-MU reduces SLA violation to 0.00029% and number of migrations to 780
TABLE III BANKER WITH OVERLOAD DETECTION BY LRR
OVMPBA Energy kWh
SLA% Migration
Overload Detection / VM Selection LRR-MC 25.49 0.00034 859 LRR-MMT 24.35 0.00033 865 LRR-MU 24.17 0.00039 820 LRR-MM 25.09 0.00032 830
Table III shows the result of Banker algorithm with LRR overload detection and various VM Selection policies. From this table it can be concluded that Banker with LRR-MU method consumes the minimum energy of 24.17 kWh, LRR-MM reduces SLA violation to 0.00032% and number of migrations to 820.
TABLE IV BANKER WITH OVERLOAD DETECTION BY THR
OVMPBA Energy kWh
SLA% Migration
Overload Detection / VM Selection THR-MC 25.62 0.00034 839 THR-MMT 24.49 0.00034 863 THR-MU 26.38 0.00033 840 THR-MM 25.40 0.00032 798
Table IV shows the result of Banker algorithm with IQR overload detection and various VM Selection policies. From this table it can be concluded that Banker with LRR-MU method consumes the minimum energy of 24.49 kWh, THR-MM reduces SLA violation to 0.00032% and number of migrations to 798.
TABLE V BANKER WITH OVERLOAD DETECTION BY DT
OVMPBA Energy kWh
SLA% Migration
Overload Detection / VM Selection DT-MC 25.35 0.00033 825

International Conference on Inter Disciplinary Research in Engineering and Technology 118
Cite this article as: Kokula Krishna Hari Kunasekaran, Vignesh Ramakrishnan, Rajkumar Sugumaran,
Prithiv Rajan S. “Optimize Virtual Machine Placement in Banker Algorithm for Energy Efficient Cloud
Computing”. International Conference on Inter Disciplinary Research in Engineering and Technology
(2016): 112-119. Print.
DT-MMT 24.72 0.00032 818 DT-MU 25.67 0.00030 798 DT-MM 23.01 0.00029 770
Table V shows the result of Banker algorithm with DT overload detection and various VM Selection policies. From this table it can be concluded that Banker with DT-MM method consumes the minimum energy of 23.01 kWh, reduces SLA violation to 0.00029% and number of migrations to 770.
TABLE VI COMPARISON BETWEEN EXISTING AND OVMPBA RESULTS Existing Results LRR-MU
24.15 IQR-MU 0.00029
IQR-MU 779
Proposed Results OVMPBA
DT-MM 23.01
DT-MM & IQR-MU 0.00029
DT-MM 770
Table VI shows the result of existing and proposed approach OVMPBA in terms of energy consumption, percentage SLA violation and number of migrations. In existing methods LRR-MU uses minimum energy of 24.15kWh, IQR-MU gives minimum percentage SLA violation of 0.00029 and 779 number of migrations. OVMPBA results in improved performance with 23.01 kWh energy consumption, and 770 number of migrations. However the percentage SLA violation by OVMPBA is equal to the existing results of method IQR-MU with 0.00029 percentage SLA violation. Ms- Excel is used as the output utility tools for plotting the graphs using the above tables. Energy Consumption Graph 1 shows the consumption of energy in the cloud using Banker algorithm with various overload selection and VM selection. Energy (in kWh) is shown along Y axis and overload detection with VM selection policy is shown along X axis.
Graph 1. OVMPBA vis-à-vis other methods: Energy consumption of Overload Detection & VM selection.
It can be analyzed from the graph that in the VM placement optimization through DT-MM combination in the cloud environment results in lesser energy consumption as compared to other approaches used for VM placement optimization. SLA Violation Graph 2 shows the SLA Violation in the cloud using Banker algorithm with various overload selection and VM selection. SLA violation (in percentage) is shown along Y axis and overload detection with VM selection policy is shown along X axis.
Graph 2: OVMPBA vis-à-vis other methods: SLA violation of Overload Detection & VM selection.
ENERGY
MC MMT MU MM
SLA
MC MMT MU MM

International Conference on Inter Disciplinary Research in Engineering and Technology 119
Cite this article as: Kokula Krishna Hari Kunasekaran, Vignesh Ramakrishnan, Rajkumar Sugumaran,
Prithiv Rajan S. “Optimize Virtual Machine Placement in Banker Algorithm for Energy Efficient Cloud
Computing”. International Conference on Inter Disciplinary Research in Engineering and Technology
(2016): 112-119. Print.
It can be analyzed from the graph that in the VM placement optimization through DT-MM combination in the cloud environment results in percentage SLA violation equal to the existing results of method IQR-MU used for VM placement optimization. Number of Migrations Graph 3 shows the number of migration performed in the cloud using Banker algorithm with various overload selection and VM selection. Number of migrations is shown along Y axis and overload detection with VM selection policy is shown along X axis.
Graph 3: OVMPBA vis-à-vis other methods: Number of migrations of Overload Detection & VM detection
It can be analyzed from the graph that in the optimize VM placement in Banker algorithm (OVMPBA) through DT-MM combination in the cloud environment lesser number of VM migrations are performed as compared to other approaches used for VM placement optimization.
CONCLUSION
The author has proposed and investigated a suite of novel techniques for implementing through optimize VM placement in Banker algorithm in IaaS Clouds The proposed method improves the utilization of datacenter resources and reduces energy consumption. Performance of optimize VM placement in Banker algorithm (OVMPBA) through dynamic threshold(DT) and minimization migration(MM) has been compared with other existing overload detection and VM selection algorithms. Through OVMPBA energy consumption was curtailed down to 23.01 kWh, with percentage SLA violation of 0.00029 and 770 numbers of migration. The performance has been compared against these parameters and found to be minimum. Optimize VM placement in Banker algorithm through dynamic threshold and minimization migration algorithm is more energy efficient as compared to exiting methods. The method however provides equal number of SLA violations but minimizes the number of migrations required for VM placement optimization.
REFERENCES
[1] Piyush Patel and Arun Kr Singh,”A survey on resource allocation algorithms in cloud computing environment”, Golden Research Thoughts Volume 2, Issue. 4. Ashok Yakkaldevi, 2012.
[2] Anwesha Das dissertation on, “A Comparative Study of Server Consolidation Algorithms on a Software Framework in a Virtualized Environment” , submitted to IIT Mumbai.
[3] Zhen Xiao, Weijia Song, Qi Chen, “Dynamic Resource Allocation using Virtual Machines for Cloud Computing Environment” , IEEE Transaction on Parallel and Distributed Systems 2013 vol. 24 , No. 6.
[4] Richa Sinha, Nidhi Purohit, Hitesh Diwanji, “Power Aware Live Migration for Data Centers in Cloud using Dynamic Threshold”, International Journal of Computer Technology and Applications, December 2011, vol.2.
[5] Girish Metkar, Sanjay Agrawal, Dr. Shailendra Singh, “A Live Migration of Virtual Machine based on Dynamic Threshold in a Cloud Data Centers”, International Journal of Advanced Research in Computer Science and Software Engineering, 2013.
[6] Anton Beloglazov Rajkumar Buyya, “Adaptive Threshold based Approach for Energy- Efficient Consolidation of Virtual Machines in Cloud Data Centers”, ACM December 2010
[7] Ajith Singh. N, M. Hemalatha, “Energy Efficient Virtual Machine Placement Technique using Banker Algorithm in Cloud Data Centre” ,International Conference on Advanced Computing and Communication Systems, December 2013.
VM MIGRATION
MC MMT MU MM

![Bio-physics in Bio-medical-Engineering, in PDF [ Part - 1 ]](https://static.fdocuments.in/doc/165x107/577cc79c1a28aba711a177d0/bio-physics-in-bio-medical-engineering-in-pdf-part-1-.jpg)