Engine Analyzer Series Wideband Oxygen Sensor Installation ... · Engine Analyzer Series Wideband...
39
Engine Analyzer Series Wideband Oxygen Sensor Installation and Instruction Manual For DFI part numbers: 77062, 77062N, 77062S, 77063
Transcript of Engine Analyzer Series Wideband Oxygen Sensor Installation ... · Engine Analyzer Series Wideband...
Engine Analyzer Series Wideband Oxygen Sensor
Installation and Instruction Manual
For DFI part numbers: 77062, 77062N, 77062S, 77063
1
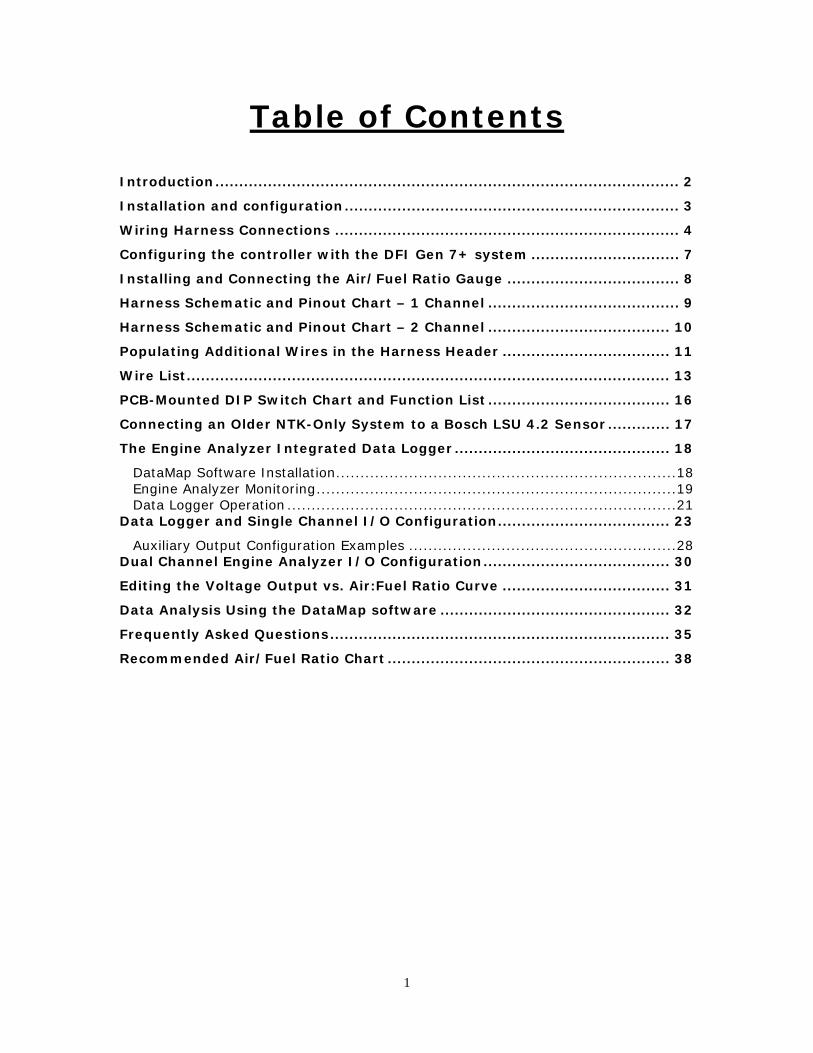
Table of Contents
Introduction................................................................................................. 2 Installation and configuration...................................................................... 3 Wiring Harness Connections ........................................................................ 4 Configuring the controller with the DFI Gen 7+ system ............................... 7 Installing and Connecting the Air/Fuel Ratio Gauge .................................... 8 Harness Schematic and Pinout Chart – 1 Channel ........................................ 9 Harness Schematic and Pinout Chart – 2 Channel ...................................... 10 Populating Additional Wires in the Harness Header ................................... 11 Wire List..................................................................................................... 13 PCB-Mounted DIP Switch Chart and Function List ...................................... 16 Connecting an Older NTK-Only System to a Bosch LSU 4.2 Sensor ............. 17 The Engine Analyzer Integrated Data Logger............................................. 18
DataMap Software Installation......................................................................18 Engine Analyzer Monitoring..........................................................................19 Data Logger Operation ................................................................................21
Data Logger and Single Channel I/O Configuration.................................... 23 Auxiliary Output Configuration Examples .......................................................28
Dual Channel Engine Analyzer I/O Configuration....................................... 30 Editing the Voltage Output vs. Air:Fuel Ratio Curve ................................... 31 Data Analysis Using the DataMap software ................................................ 32 Frequently Asked Questions....................................................................... 35 Recommended Air/Fuel Ratio Chart ........................................................... 38

2
Engine Analyzer Series Wideband Oxygen Sensor
Introduction Congratulations on the purchase of your new Accel DFI “Engine Analyzer Series” wideband oxygen sensor kit! This system uses the latest available technology to offer unparalleled accuracy, repeatability, and reliability. The durable water resistant enclosure and harness assembly make it an ideal choice for installation under the hood or under the chassis. All Engine Analyzer Series kits include integrated Data Logging functions, and are available with a host of options and configurations to suit virtually any application. The following is a list of available part numbers in the Engine Analyzer Series along with the associated parts and configurations for each number:
77062 – includes electronic control module, wiring harness, and sensor. 77062N - includes electronic control module and wiring harness. This kit does
not contain a sensor. Optional sensors are available under part number 77065 (Lab grade) O2 sensor or a 77061 (Standard grade) sensor. The unit is configurable for both types.
77062S - includes electronic control module, wiring harness, and sensor described above along with a single 2 1/16” digital air/fuel ratio gauge.
77063 - includes electronic control module, wiring harness, and (2) sensors can be connected simultaneously for monitoring air/fuel ratio information in dual exhaust applications.
77063S – includes one 2 1/16” digital air/fuel ratio gauge. This gauge features an easy-to-read digital display and multi-color LED sweep gauge for readability at a glance.
This manual contains instructions and wiring schematics for each part number listed above.

3
Installation and configuration Read over this entire document before beginning installation! Securely mount the controller to a location within 36 inches of the oxygen sensor location. The controller may be located inside the car or in the engine compartment. The controller unit is water-resistant, but it is not waterproof. If you are mounting the controller in the engine compartment, select a location with minimal exposure to water as a safeguard. Route the wiring well away from any moving parts or extreme heat sources like header pipes, etc. Connect the harness as per the diagrams in this manual. If your exhaust system doesn’t already have a fitting in place for an oxygen sensor, one must be welded in place. A fitting has been included with the kit. If you need to weld this fitting in place, be certain to weld all the way around the outside of the fitting to prevent any air leaks. The optimum location for the oxygen sensor is in the collector of a header or exhaust manifold. Put anti-seize on threads and be careful not to get any on the element of the sensor. Note: For 77063 users, 2 oxygen sensors and 2 oxygen sensor fittings are included in the kit. Each fitting should be properly welded into each side of the exhaust system. In turbocharged applications, the sensor must be in the downpipe, not in the collector. The high heat and pressure found in the collector of a turbocharged car will impact the accuracy of the sensor and will drastically reduce the life expectancy of the sensor. In any application, avoid installing the sensor in the short-side radius of a bend in the exhaust tubing. Also, try to mount the sensor in a location that offers some protection from damage caused by debris or other objects in the roadway.

4
Wiring Harness Connections
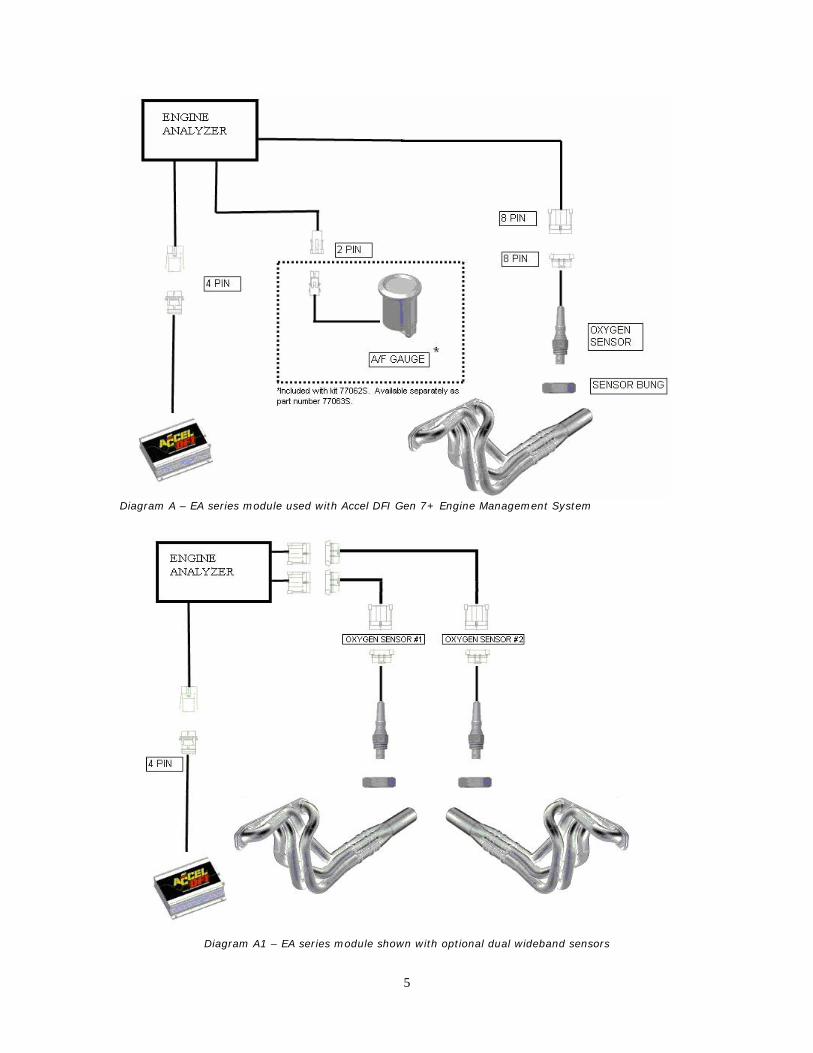
Connect the 8 pin connector in the main harness to the female end of each O2 sensor harness.
If you purchased kit number 77062S, your kit includes a 2 1/16” digital air/fuel ratio gauge. Locate the 2-pin gray connector in the gauge harness, and connect it to the supplied connector and wiring for the main harness. If your kit did not include this gauge, it is available separately through your Accel DFI dealer. The part number for this kit is 77063S.
If you are connecting the control module to an Accel DFI Generation 7+ system, the 4 pin square male connector in the main harness will have a corresponding female connector in the Generation 7 system harness labeled as “HEGO”. These connectors should be joined as per diagram A.
If you are using the system as a standalone air/fuel ratio meter, refer to diagram B.
If you are using the system with another manufacturer’s engine management system, refer to diagram C.
If you have a dual exhaust system and are using the 77063 dual wideband controller, please refer to diagram A1.
5
Diagram A – EA series module used with Accel DFI Gen 7+ Engine Management System
Diagram A1 – EA series module shown with optional dual wideband sensors

6
Diagram B –EA series module used as a standalone air/fuel ratio meter
Diagram C – EA series module used with engine management system other than Accel DFI

7
Configuring the controller with the DFI Gen 7+ system Once the Engine Analyzer Series controller is properly connected to your Gen 7+ system per the above diagram, you must make a few quick changes to the configuration of your Gen 7+ ECM for it to operate properly. Refer to Diagram D and perform the following steps:
Run the CalMap software program and go online with your ECM. Once online, go to the Controls Configuration Editor. This can be accessed
through the pulldown menus by selecting Configuration and then Controls. The keyboard shortcut to access this screen is Ctrl-C.
Once in the Controls screen, set the Exhaust Feedback Sensor to UEGO. Set the Wideband O2 Sensor Type to DFI Type 2 – All Applications.
(DFI Type 2 and Type 3 UEGO kits use the Type 2 Setting in software) If you wish to run your engine in closed loop mode, set the Closed Loop
Fueling setting to Enabled. It is recommended to initially set the Strategy Adjustment switch to Auto.
Please refer to the Gen 7+ operation manual for additional information on this setting.
It is recommended to initially set the O2 Feedback Processing Delay switch to Off. Please refer to the Gen 7+ operation manual for additional information on this setting.
Diagram D – Wideband Oxygen Sensor Settings are located at the bottom portion of this screen in CalMap.

8
Installing and Connecting the Air/Fuel Ratio Gauge Locate the three wires on the back side of the air/fuel ratio gauge. The following table outlines each of the connections necessary to operate the DFI air/fuel ratio gauge with the Engine Analyzer series wideband controller. Wire color Function Connect to Red Gauge power Switched +12V source Black Gauge ground Main ground source for wideband controller Gray Signal input Gauge output wire on wideband controller
The gauge can be mounted in a 2 1/16” hole or gauge pod. Mounting
hardware is included for panel-mount installations. It is important to connect the black gauge ground wire to the same grounding
point as the main ground wire for the controller. This is necessary to prevent ground loops that could cause the gauge reading to be incorrect. The main ground for the controller is on pin C of the 4-pin connector labeled “0-5V output” in the wideband controller harness.
Connect the gray wire on the gauge to the gray wire coming from pin 9 on the wideband controller.
The red power wire should be connected to a switched +12V source. The Accel DFI air/fuel ratio gauge is designed specifically to operate with this controller. The multi-color LED sweep display around the perimeter of the gauge face is specially calibrated to provide instant feedback to the driver by changing colors as the air/fuel ratio range varies. Even if the driver’s attention can’t be focused on the numbers in the gauge, the color of the LED on the sweep display will immediately alert the driver if the air/fuel ratio is out of the intended range. The gauge output from the wideband controller produces a voltage that is equal to the air/fuel ratio being measured. For example, a 12.8 volt signal means that the air/fuel ratio is 12.8:1. If you choose to use a different gauge, you may only use a self-powered digital voltmeter. Analog voltmeters or gauges will not operate correctly with this controller.
9
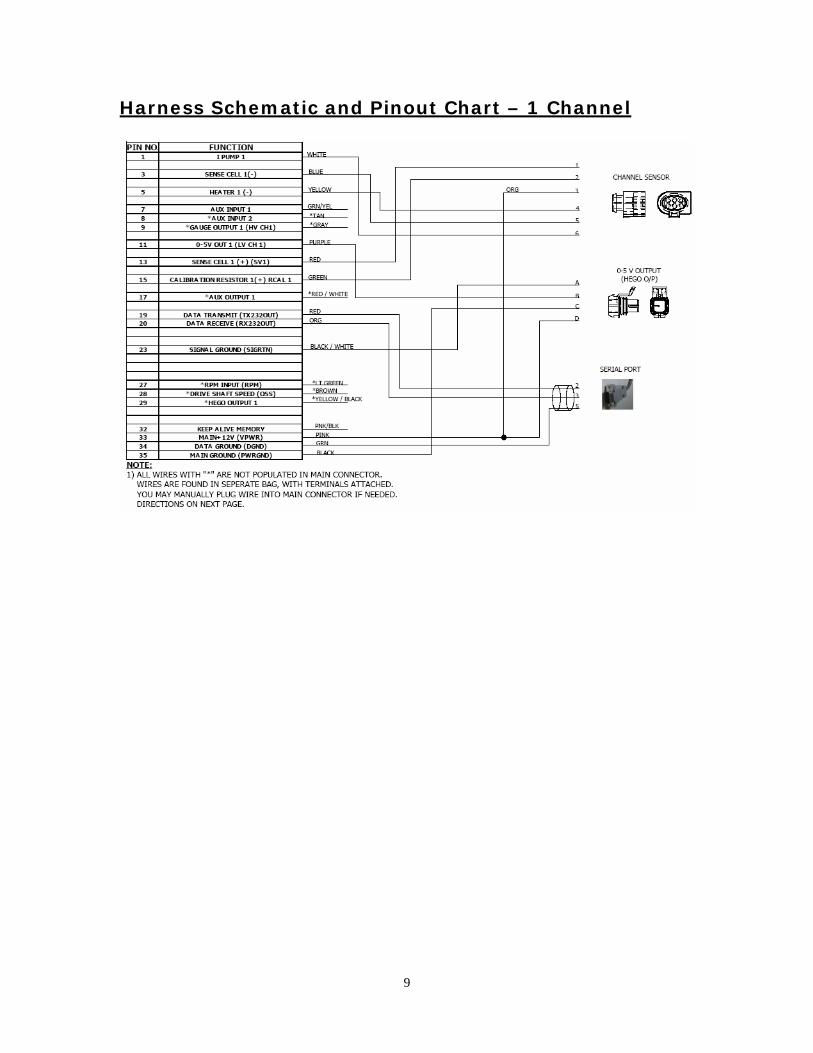
Harness Schematic and Pinout Chart – 1 Channel
10
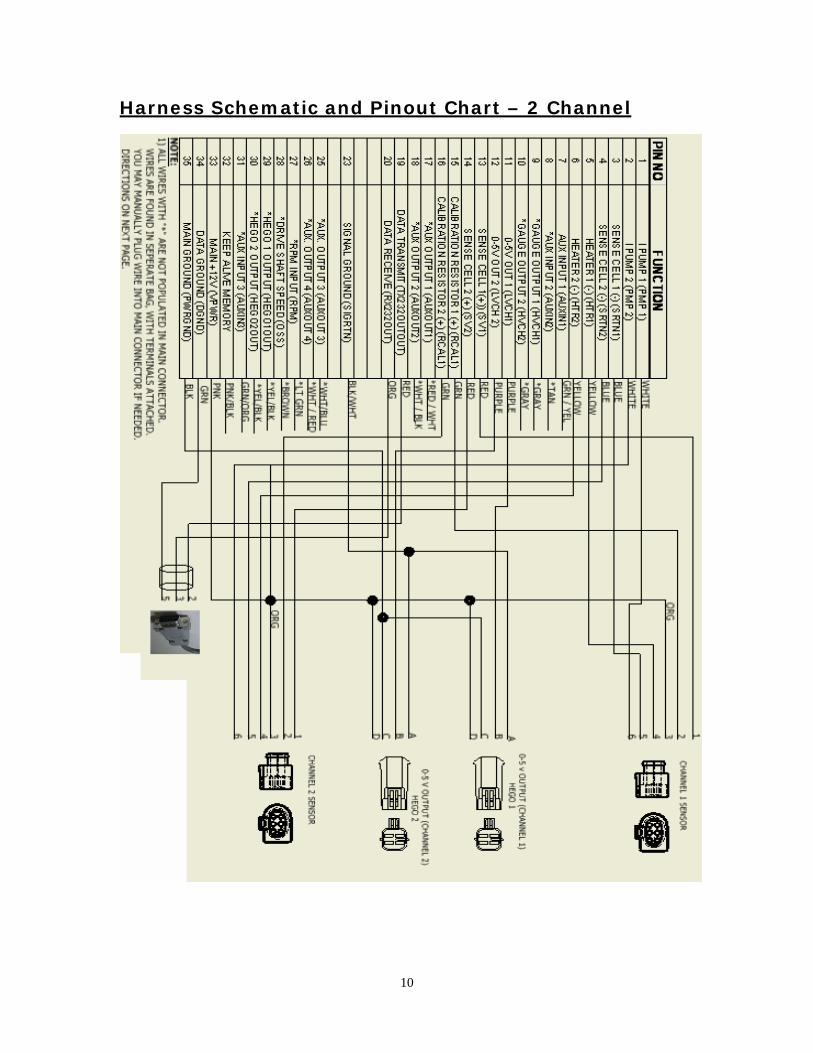
Harness Schematic and Pinout Chart – 2 Channel

11
Populating Additional Wires in the Harness Header 1.) Release the two tabs on the sides of the connector retainer.
2.) Slide the wire retainer away from the connector. It does not need to be removed.

12
3.) Insert the wire into the proper location on the connecter. The wire pin locations are marked on the back and sides of the connector.
4.) Push the wire retainer back down in order to lock the wires into place.
13
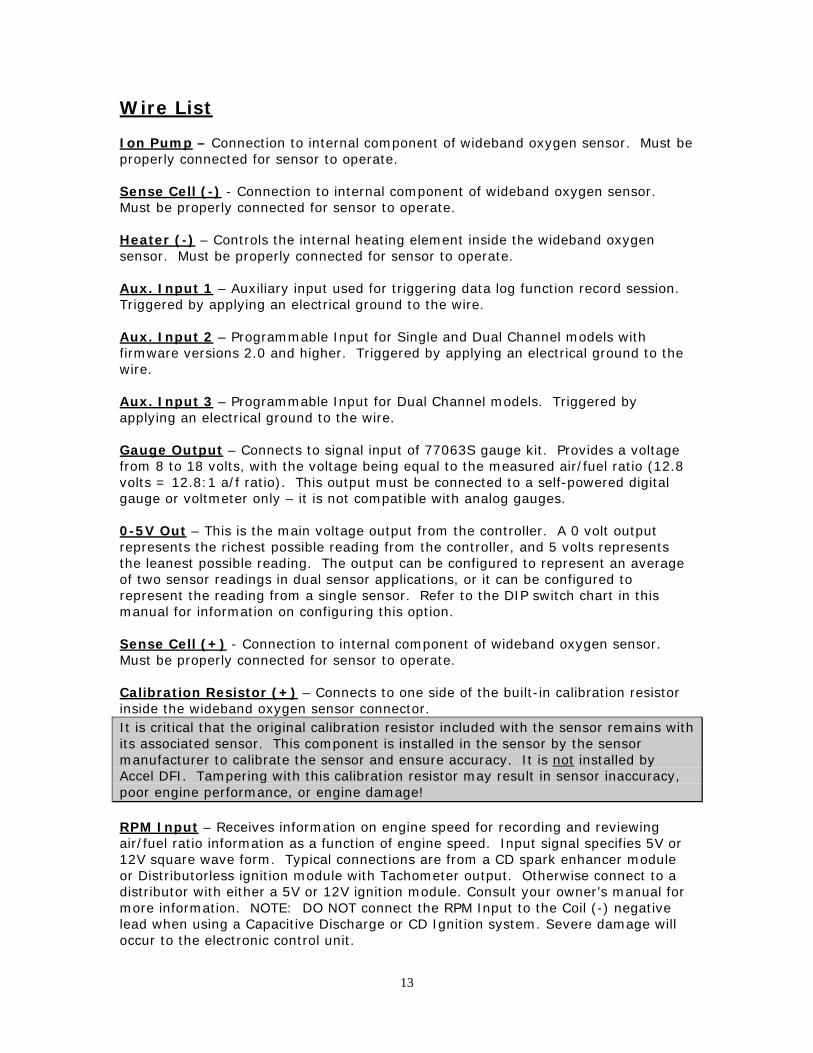
Wire List Ion Pump – Connection to internal component of wideband oxygen sensor. Must be properly connected for sensor to operate. Sense Cell (-) - Connection to internal component of wideband oxygen sensor. Must be properly connected for sensor to operate. Heater (-) – Controls the internal heating element inside the wideband oxygen sensor. Must be properly connected for sensor to operate. Aux. Input 1 – Auxiliary input used for triggering data log function record session. Triggered by applying an electrical ground to the wire. Aux. Input 2 – Programmable Input for Single and Dual Channel models with firmware versions 2.0 and higher. Triggered by applying an electrical ground to the wire. Aux. Input 3 – Programmable Input for Dual Channel models. Triggered by applying an electrical ground to the wire. Gauge Output – Connects to signal input of 77063S gauge kit. Provides a voltage from 8 to 18 volts, with the voltage being equal to the measured air/fuel ratio (12.8 volts = 12.8:1 a/f ratio). This output must be connected to a self-powered digital gauge or voltmeter only – it is not compatible with analog gauges. 0-5V Out – This is the main voltage output from the controller. A 0 volt output represents the richest possible reading from the controller, and 5 volts represents the leanest possible reading. The output can be configured to represent an average of two sensor readings in dual sensor applications, or it can be configured to represent the reading from a single sensor. Refer to the DIP switch chart in this manual for information on configuring this option. Sense Cell (+) - Connection to internal component of wideband oxygen sensor. Must be properly connected for sensor to operate. Calibration Resistor (+) – Connects to one side of the built-in calibration resistor inside the wideband oxygen sensor connector. It is critical that the original calibration resistor included with the sensor remains with its associated sensor. This component is installed in the sensor by the sensor manufacturer to calibrate the sensor and ensure accuracy. It is not installed by Accel DFI. Tampering with this calibration resistor may result in sensor inaccuracy, poor engine performance, or engine damage! RPM Input – Receives information on engine speed for recording and reviewing air/fuel ratio information as a function of engine speed. Input signal specifies 5V or 12V square wave form. Typical connections are from a CD spark enhancer module or Distributorless ignition module with Tachometer output. Otherwise connect to a distributor with either a 5V or 12V ignition module. Consult your owner’s manual for more information. NOTE: DO NOT connect the RPM Input to the Coil (-) negative lead when using a Capacitive Discharge or CD Ignition system. Severe damage will occur to the electronic control unit.

14
Driveshaft Speed (VSS) Input – Receives information from a speed sensor located on the driveshaft. Multiple tooth sensors can be used to increase resolution and accuracy by adjusting the Number of Pulses/Revolution setting located in the configuration page of the DataMap software. A Hall Effect type (3-wire), or Variable Reluctance-IPU type (2-wire) sensor can be used with this controller by setting Dipswitch #6 on the Printed Circuit Board to the appropriate position. See Driveshaft Signal type on Page 13 of this manual to properly configure this feature. HEGO Output – Mimics the output of a conventional narrow-band oxygen sensor. A 0.1 volt output is the leanest possible reading, and a 0.9 volt output is the richest possible reading. Main +12V – Voltage source for the controller. This wire should be connected to a switched +12V source for the controller to operate. If you are NOT connecting this controller to an Accel DFI Gen 7+ Engine Management system, it is recommended to install a 30-amp fuse on this line for short circuit protection. Note that on some models, this input must remain powered until data is read from the integrated internal data logger or else the stored data will be lost. Heater +12V – Power source for the heater element inside the oxygen sensor, must be properly connected for sensor to operate. For units with Firmware versions 2.0.0 and higher, this wire is replaced by the Keep-Alive Voltage Input, and heater voltage is drawn from the Main +12 Volt input. Keep-Alive Voltage Input – Connect this wire to an auxiliary voltage source to retain the contents of the Data Logger memory after the Main +12 Volt input is switched off. Any logged data will be preserved as long as at least 9 volts are supplied to this input, regardless of the state of the Main +12 Volt input line. Dual Channel models are also equipped with a memory backup that allows the Data Logger to retain the contents of its memory after the device is disconnected from any main or auxiliary voltage supply. Data can be retained for approximately 48 hours before power must be reapplied to the Keep-Alive input wire. Single Channel units with Firmware versions less than 2.0.0 cannot fully use the Keep-Alive Voltage input wire. In those units, the keep-alive wire is internally tied to the Main +12 Volt input. You must keep those units fully powered until the logged data can be downloaded to your computer. Connection of this wire to a +12 volt supply may require a 1N4007 (or equivalent) Diode to be placed inline with the Main +12 Volt supply wire to prevent back feeding of voltage to the switched source. Place the Diode with the negative side pointing toward the Engine Analyzer module. Data Ground – Ground source for the communication circuit between the controller and the laptop PC being used to configure it. Main Ground – Ground source for the controller’s main power supply. If not connecting this controller to an Accel DFI Generation 7+ Engine Controller harness, make sure to connect this wire to an adequate ground source. As with any electronic equipment in your car, the negative battery terminal is the recommended grounding point. Inadequate grounding of electronic equipment such as this can result in equipment malfunction or damage!

15
Note: All input and output drivers are active low. For example, in order to trigger data logging, the input wire (AuxIn1, Pin 7, Color: Green with Yellow trace) will be activated by switching the input wire to a ground source. Similarly, any output wire should be connected to the ground trigger of a relay for proper operation.

16
PCB-Mounted DIP Switch Chart and Function List There is a Dipswitch mounted on the circuit board of the Engine Analyzer that can be used to quickly configure the sensor for customized operation. The Dipswitch is located at the back of the circuit board, and can be easily accessed by removing the rear endplate of the enclosure. The function of each switch is defined in the following table.
Switch Function Description
1 Sensor Type Select On = NTK Off = Bosch
2, 3, 4 NOT USED
5 Driveshaft Signal Type On = 2-wire Magnetic Pickup Off = 3-wire Hall-Effect/Square Wave
6 Not Used MUST BE OFF FOR PROPER OPERATION 7, 8 Not Used
Switch 1 – Sensor Type Select For Engine Analyzer models with firmware version(s) 2.0.0 and higher, put this switch in the ON position if you are using an NTK wideband sensor. Put this switch in the OFF position if you are using a Bosch wideband sensor. For Engine Analyzer models with firmware version 1.0.2 and higher, but less than 2.0.0, the sensor type selection is done on the configuration screen of the DataMap software, and the dipswitch setting has no meaning. Switches 2, 3, 4, – Not Used The Functions of these switches will be determined in the future. Switch 5 – Driveshaft Signal Type In the ON position, the wideband controller will accept a magnetic pickup signal input from a driveshaft speed sensor. This type of sensor is generally identifiable by its 2-wire pickup. In the OFF position, the wideband controller will accept a hall-effect or square wave signal input from a driveshaft speed sensor. This type of sensor is generally identifiable by its 3-wire pickup. Switches 6, 7 & 8 – Not Used To be determined. These switches must be in the OFF position for the Engine Analyzer to function properly.
17
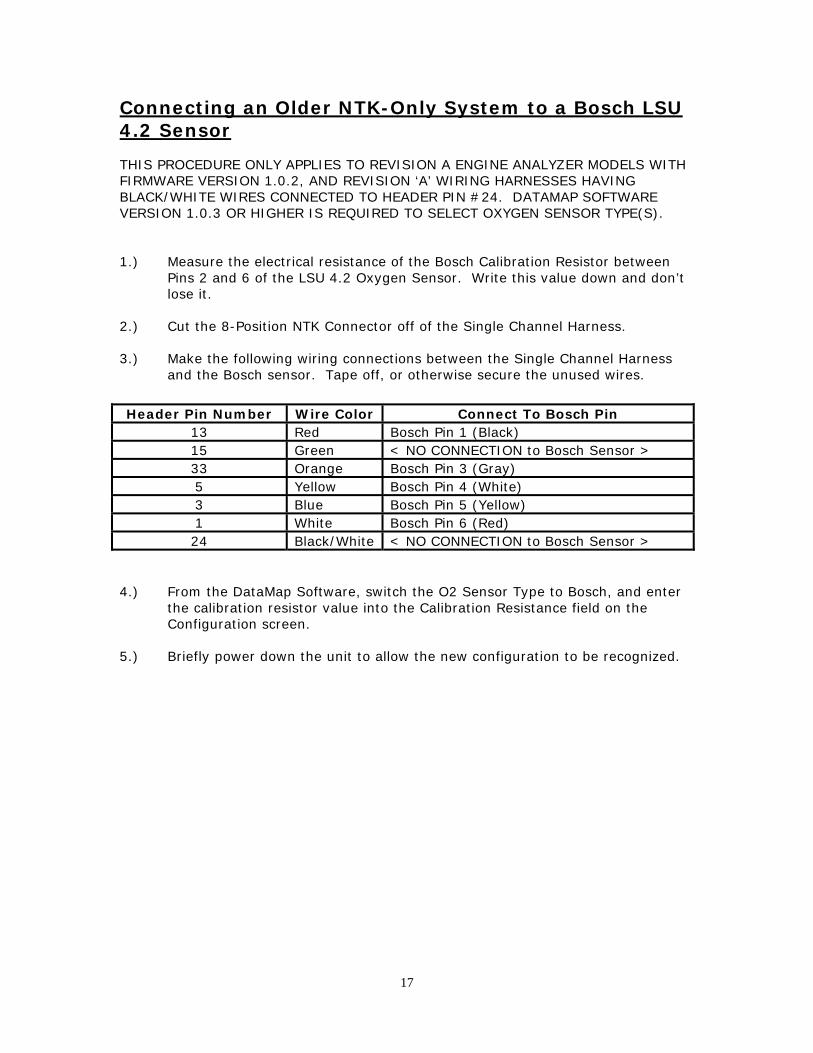
Connecting an Older NTK-Only System to a Bosch LSU 4.2 Sensor THIS PROCEDURE ONLY APPLIES TO REVISION A ENGINE ANALYZER MODELS WITH FIRMWARE VERSION 1.0.2, AND REVISION ‘A’ WIRING HARNESSES HAVING BLACK/WHITE WIRES CONNECTED TO HEADER PIN #24. DATAMAP SOFTWARE VERSION 1.0.3 OR HIGHER IS REQUIRED TO SELECT OXYGEN SENSOR TYPE(S).
1.) Measure the electrical resistance of the Bosch Calibration Resistor between Pins 2 and 6 of the LSU 4.2 Oxygen Sensor. Write this value down and don’t lose it.
2.) Cut the 8-Position NTK Connector off of the Single Channel Harness. 3.) Make the following wiring connections between the Single Channel Harness
and the Bosch sensor. Tape off, or otherwise secure the unused wires.
4.) From the DataMap Software, switch the O2 Sensor Type to Bosch, and enter
the calibration resistor value into the Calibration Resistance field on the Configuration screen.
5.) Briefly power down the unit to allow the new configuration to be recognized.
Header Pin Number Wire Color Connect To Bosch Pin 13 Red Bosch Pin 1 (Black) 15 Green < NO CONNECTION to Bosch Sensor > 33 Orange Bosch Pin 3 (Gray) 5 Yellow Bosch Pin 4 (White) 3 Blue Bosch Pin 5 (Yellow) 1 White Bosch Pin 6 (Red) 24 Black/White < NO CONNECTION to Bosch Sensor >
18
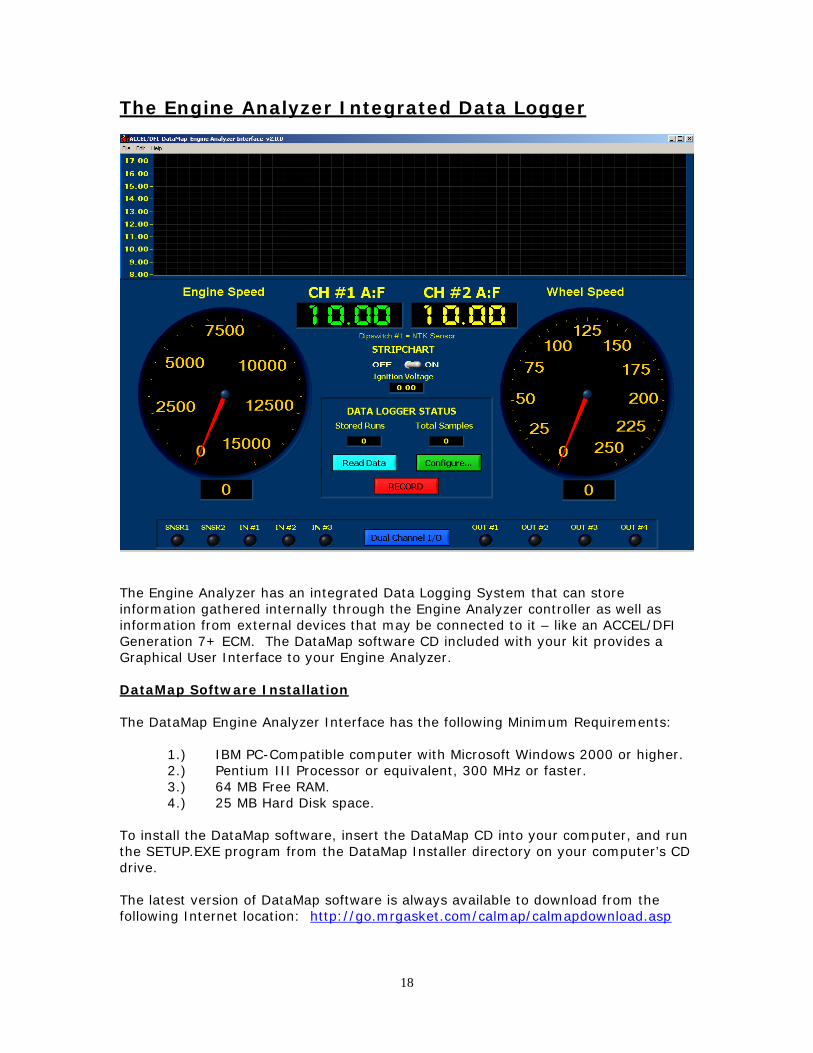
The Engine Analyzer Integrated Data Logger
The Engine Analyzer has an integrated Data Logging System that can store information gathered internally through the Engine Analyzer controller as well as information from external devices that may be connected to it – like an ACCEL/DFI Generation 7+ ECM. The DataMap software CD included with your kit provides a Graphical User Interface to your Engine Analyzer. DataMap Software Installation The DataMap Engine Analyzer Interface has the following Minimum Requirements:
1.) IBM PC-Compatible computer with Microsoft Windows 2000 or higher. 2.) Pentium III Processor or equivalent, 300 MHz or faster. 3.) 64 MB Free RAM. 4.) 25 MB Hard Disk space.
To install the DataMap software, insert the DataMap CD into your computer, and run the SETUP.EXE program from the DataMap Installer directory on your computer’s CD drive. The latest version of DataMap software is always available to download from the following Internet location: http://go.mrgasket.com/calmap/calmapdownload.asp
19
Engine Analyzer Monitoring The DataMap software’s main screen provides a monitoring and control interface to your Engine Analyzer. Air:Fuel Ratio, Engine Speed, Vehicle Speed, Ignition Voltage, and several other parameters are easily read from the real-time readouts. The following is a quick description of the way data values are displayed on the screen.
Stripchart: This is an electrical simulation of a paper stripchart recorder commonly used for data analysis. Air:Fuel Ratio(s), Engine Speed, and Vehicle speed are shown on the chart in real time, and remain on the screen for several seconds to make analysis of their data as easy as possible. The switch in the center of the screen can be used to pause and restart the display.
Engine RPM: The large gauge on the left side of the screen displays the engine speed measured on the Engine Analyzer’s RPM Input wire. Values are displayed with a resolution of 1 RPM.
Vehicle Speed: The large gauge on the right side of the screen displays the vehicle speed as measured by the Engine Analyzer’s VSS Input wire. Values are displayed with a resolution of 1 MPH.
Ignition Voltage: The ignition voltage measured across the heating element of the Channel 1 Oxygen Sensor is displayed numerically in the center of the screen. Note that this display may only be accurate when an oxygen sensor is connected to the Engine Analyzer. Oxygen Sensor Status: Two LED indicators on the lower left side of the screen, SNSR1 and SNSR2, represent the current states of the 2 Oxygen sensors that can be connected to your engine analyzer. The colors are defined as follows:
Black: Sensor is not enabled.
Red: Sensor is beginning the warm up procedure.
Orange: Sensor voltage is as expected. Sensor is continuing to warm up, and the Calibration Resistance is being measured.
Green: Sensor is warmed up, calibrated, and operating properly.
If one or more of your sensors fails to operate properly, the color of the LED may provide some clues as to what is happening. For example, a sensor with a damaged sense cell won’t get past the initial warm up procedure and should keep the status LED Red.

20
Input/Output Status Indicators: The current state of each input and output line on the Engine Analyzer is represented by a virtual LED on the bottom of the screen. The LED is lit RED when I/O line is active, and shown as black when the I/O state is not active. Data Logger Status: The number of stored logging sessions, and total number of data samples are shown in the center of the screen.

21
Data Logger Operation The Data Logger can be used to record internal data generated by the Engine Analyzer and the optional data inputs built into it. Basic logger operation will allow you to record the following 4 or 5 internal channels:
• Engine Analyzer Air-to-Fuel Ratio(s) – Single or Dual Channel Models • Engine Speed (via the external Engine Speed Input) • Wheel Speed (via the external Output Shaft Speed Input) • Driveshaft Pulse Counts (as a function of the external OSS Input)
The Engine Analyzer can also be connected to a ACCEL/DFI Generation 7+ Engine Control Module via the external serial data link. You must connect the Engine Analyzer to your Generation 7+ ECM using the included adapter that will plug in to both the Engine Analyzer Serial Data Cable, and the CalMap data cable used with the ECM. The Engine Analyzer is only compatible with Generation 7+ Engine Control Modules having a firmware revision of 3.2 or higher. When connected to a Generation 7+ Engine Control Module, the following 16 data channels are automatically recorded:
• Air-to-Fuel Ratio (selectable from the ECM or the Engine Analyzer) • Engine Speed (selectable from the ECM or the Engine Analyzer) • Wheel Speed (via the Engine Analyzer Output Shaft Speed Input) • Driveshaft Pulse Counts (a function of the Engine Analyzer OSS Input) • Manifold Absolute Pressure • Throttle Position % • Ignition Timing Advance • Ignition Knock Retard • Fuel Injector Maximum Pulse Width • Fuel Injector Maximum Duty Cycle • Engine Coolant Sensor Temperature • Intake Air Sensor Temperature • Ignition Voltage Level • Closed Loop Fuel Correction Percentage • MST Sensor Input Voltage • Engine Outputs Status (Fuel Pump, TCC Output, Nitrous State…)
It is recommended that a switch be installed between the Data Logging Enable Input (Auxiliary Input #1) wire and an electrical ground source. Each time the Data Logging Enable input is connected to the electrical ground source, data logging will begin. The Engine Analyzer will continue to record data as long as the Data Logging Enable input remains connected to the electrical ground source. When the Data Logging Enable input is disconnected from electrical ground, Data Logging will stop. When the Data Logger is configured to record only internal data channels, the Red RECORD button on the screen can be used to override the Data Logging Enable Input. This button will not function when the Data Logger is configured to record Gen 7+ ECM data. A new logging session (Run) will begin the next time that the Data Logging input is grounded. In this way, multiple Data Logging sessions may be stored in memory until the onboard memory in the Engine Analyzer has been filled. Optionally, a

22
looped recording mode can be enabled which will continuously store the last several minutes of data inside the logger. The length of recording time depends on the sample rate selected. When recording Generation 7+ ECM data, the logger will continuously retain over 20 minutes of recorded data. When data is stored in the Engine Analyzer, the main screen of the DataMap software will show a Number of Runs of at least 1, and the actual number of data samples contained in the logger memory. To retrieve the data from the logger, press the READ DATA button on the screen. You will then be prompted to enter a custom file name for the data file(s) to be created from the logged data. If multiple Runs are present in the logger, the DataMap software can be configured to automatically create different files for each run. Filenames are created based on the filename that was entered and the current time and date settings of your computer in the format of [NAME]_mmddyyyy_hhmmss.log. If multiple runs are present, -RUN1, -RUN2… etc are appended to the file names as each data run is read from the logger to create filename(s) of the format [NAME]_mmddyyyy_hhmmss-RUN1.log. Note that on Engine Analyzer models with Firmware Versions LESS THAN 2.0.0, the contents of the Data Logger will be lost if power is removed from the Engine Analyzer before the data is read from it. It may be a good idea to install a separate power switch for the Engine Analyzer that can temporarily keep power applied to the module after the ignition has been switched off.

23
Data Logger and Single Channel I/O Configuration
The DataMap software Configuration Screen is used to configure the internal Data Logger and all associated external input/output functions within the Single Channel Engine Analyzer models. Press the CTRL + C keys, or select File->Configure Data Logger to see the Single Channel Configuration screen. The following elements are configurable via the Single Channel Configuration screen: Oxygen Sensor Type – Bosch or NTK (Firmware Version 1.0.2 or higher) This switch selects between the two different oxygen sensors that the DFI Engine Analyzer is capable of operating. Use the NTK position when connected to an NTK L1H1 (or equivalent) sensor. Use the Bosch position when connected to a Bosch LSU 4.2 (or equivalent) sensor. When connected to a Bosch sensor, you must manually measure the calibration resistor within the connector, located between pins 2 and 6. Enter this value into the Calibration Resistance field. Note that Bosch sensor compatibility requires Engine Analyzer firmware v1.0.2 or higher. For Engine Analyzer Models with Firmware Version 2.0.0 and Higher, this software switch has no function, and is replaced by Dipswitch #1 located on the rear of the circuit board. Data Logging – Enable / Disable Use this switch to Enable or Disable the integrated Data Logger. When this switch is set to DISABLED, no data logging will occur. When this switch is set to ENABLED,

24
data logging will occur anytime the Data Logging Input (Auxiliary Input #1) is connected to an electrical ground source. Logging will stop when the input is disconnected from the electrical ground source. Logger Data Source If your Engine Analyzer is connected to an ACCEL/DFI Generation 7+ ECM, and you want to record internal data values from within the ECM, set this switch to RECORD GEN 7+ ECM DATA. Set this switch to INTERNAL DATA CHANNELS ONLY if you do not want to record data from an ECM. Setting this switch improperly will cause the logger to record data improperly, or to not record any at all. If you see instances of a data run being recorded with 0 data samples stored in the logger, this switch was probably set wrong – or the data cable was connected improperly (or not at all) to the Gen 7+ ECM. Log File Creation When this switch is in the NEW LOG FILE FOR EACH RUN, data will be downloaded from the Data Logger and stored in separate files for each run that was recorded. The file names will have _RUN1, _RUN2… appended to the end of their names in order to distinguish one run from another. When this switch is in the STORE ALL DATA IN ONE FILE position, all the data samples stored in the Data Logger will be downloaded into a single data file. Logging Mode When this switch is in the BACKGROUND – CONTINUOUS RECORDING position, only 1 data logging session may be stored in memory at a time. However, if the length of the recording session exceeds the capacity of the data logger, data recording continues with the oldest data in the logger memory being overwritten with newest data. This allows data to be recorded in a continuous loop as long as the Data Logging Enable input is activated. Upon deactivation, the last several minutes of data will always remain in the logger’s memory. See below for a table of the available recording time based on the available data recording rates. This feature is useful for troubleshooting intermittent engine problems. Data recording can be stopped once an intermittent event has occurred, allowing the data recorded during the period of time leading up to the condition to be retained in the logger memory. This permits easy analysis of the conditions leading up to the problem. Setting this switch to the MANUAL – RECORD UNTIL MEMORY IS FULL position will cause the Data Logger to record data only until the internal memory becomes full. See the table below for a list of recording times vs. data recording rates. RPM Data Source When recording Generation 7+ ECM data, this switch controls the source of the Engine Speed data channel. Setting this switch to the GEN 7+ ECM position will cause the Data Logger to record the RPM input from your ECM. Setting this switch to the EXTERNAL RPM INPUT WIRE position will read engine speed values from the RPM input wire on the Data Logger. You must supply a 5 Volt square wave signal to the input wire in order for the Data Logger to read engine speed.
25
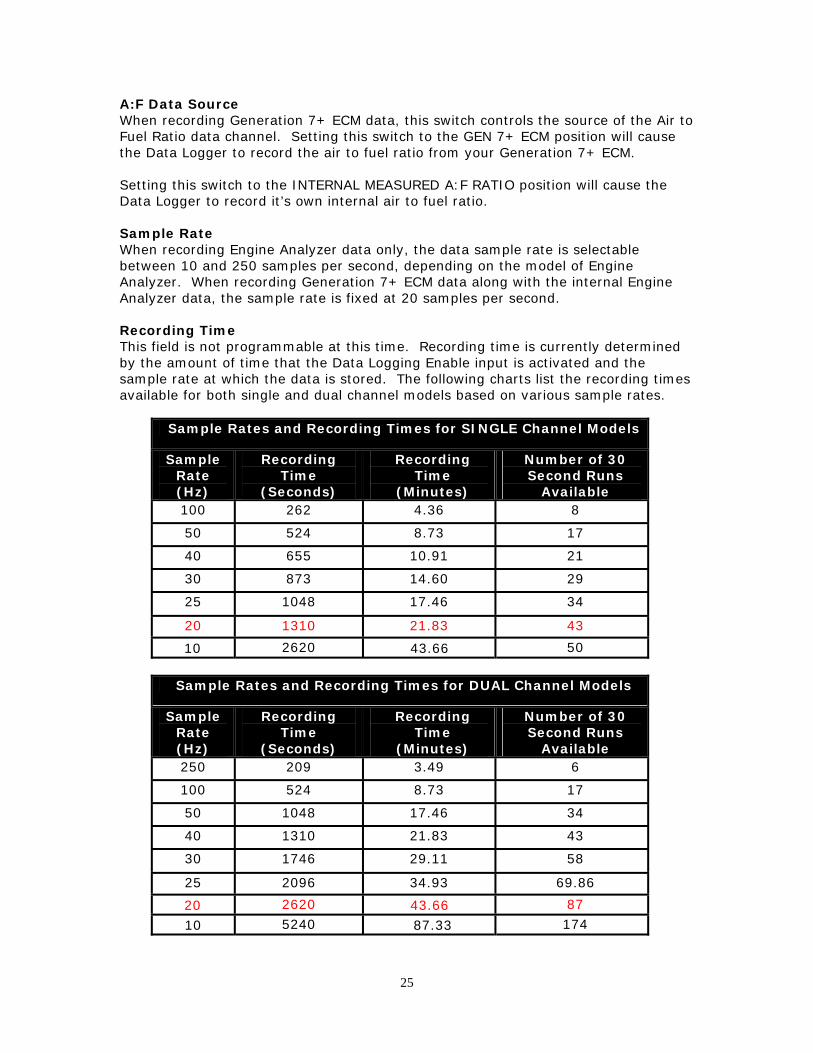
A:F Data Source When recording Generation 7+ ECM data, this switch controls the source of the Air to Fuel Ratio data channel. Setting this switch to the GEN 7+ ECM position will cause the Data Logger to record the air to fuel ratio from your Generation 7+ ECM. Setting this switch to the INTERNAL MEASURED A:F RATIO position will cause the Data Logger to record it’s own internal air to fuel ratio. Sample Rate When recording Engine Analyzer data only, the data sample rate is selectable between 10 and 250 samples per second, depending on the model of Engine Analyzer. When recording Generation 7+ ECM data along with the internal Engine Analyzer data, the sample rate is fixed at 20 samples per second. Recording Time This field is not programmable at this time. Recording time is currently determined by the amount of time that the Data Logging Enable input is activated and the sample rate at which the data is stored. The following charts list the recording times available for both single and dual channel models based on various sample rates.
Sample Rates and Recording Times for SINGLE Channel Models
Sample Rate (Hz)
Recording Time
(Seconds)
Recording Time
(Minutes)
Number of 30 Second Runs
Available 100 262 4.36 8
50 524 8.73 17
40 655 10.91 21
30 873 14.60 29
25 1048 17.46 34
20 1310 21.83 43
10 2620 43.66 50
Sample Rates and Recording Times for DUAL Channel Models
Sample Rate (Hz)
Recording Time
(Seconds)
Recording Time
(Minutes)
Number of 30 Second Runs
Available 250 209 3.49 6
100 524 8.73 17
50 1048 17.46 34
40 1310 21.83 43
30 1746 29.11 58
25 2096 34.93 69.86
20 2620 43.66 87
10 5240 87.33 174
26
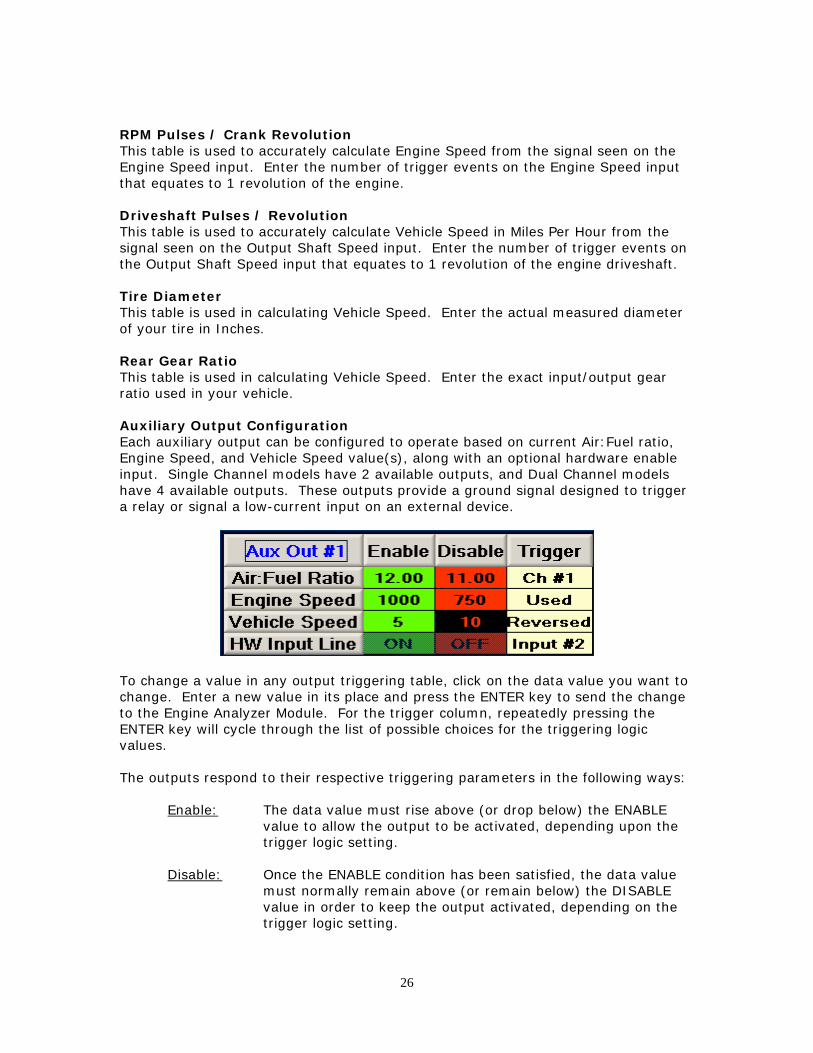
RPM Pulses / Crank Revolution This table is used to accurately calculate Engine Speed from the signal seen on the Engine Speed input. Enter the number of trigger events on the Engine Speed input that equates to 1 revolution of the engine. Driveshaft Pulses / Revolution This table is used to accurately calculate Vehicle Speed in Miles Per Hour from the signal seen on the Output Shaft Speed input. Enter the number of trigger events on the Output Shaft Speed input that equates to 1 revolution of the engine driveshaft. Tire Diameter This table is used in calculating Vehicle Speed. Enter the actual measured diameter of your tire in Inches. Rear Gear Ratio This table is used in calculating Vehicle Speed. Enter the exact input/output gear ratio used in your vehicle. Auxiliary Output Configuration Each auxiliary output can be configured to operate based on current Air:Fuel ratio, Engine Speed, and Vehicle Speed value(s), along with an optional hardware enable input. Single Channel models have 2 available outputs, and Dual Channel models have 4 available outputs. These outputs provide a ground signal designed to trigger a relay or signal a low-current input on an external device.
To change a value in any output triggering table, click on the data value you want to change. Enter a new value in its place and press the ENTER key to send the change to the Engine Analyzer Module. For the trigger column, repeatedly pressing the ENTER key will cycle through the list of possible choices for the triggering logic values. The outputs respond to their respective triggering parameters in the following ways:
Enable: The data value must rise above (or drop below) the ENABLE value to allow the output to be activated, depending upon the trigger logic setting.
Disable: Once the ENABLE condition has been satisfied, the data value
must normally remain above (or remain below) the DISABLE value in order to keep the output activated, depending on the trigger logic setting.

27
Trigger: The logic in which the enable and disable values are used to satisfy the triggering conditions.
NOT USED: The data source in the current row of the table is not
used as a triggering parameter for the current output. USED: The data value in the current row is expected to rise to
or above the ENABLE value to activate the output, and remain above the DISABLE value in order to keep the output active. The ENABLE value should be higher than the DISABLE value.
REVERSED: The data value is expected to drop to or below the
ENABLE value to activate the output, and remain below the DISABLE value in order to keep the output active. In this case, the ENABLE value should be lower than the DISABLE value.
CH1 or CH2: For Dual Channel models, the Air:Fuel ratio from either
channel may be used as a trigger value. The logic may also be reversed for each channel by setting this field to CH1_REVERSED or CH2_REVERSED.
Input #X: The selected Hardware Input must be active (connected
to an electrical ground) to allow the output to be activated. Auxiliary Inputs 1, 2, or 3 may be used to control any of the Auxiliary Outputs.
The following Data Sources may be used to enable or disable any Auxiliary Output:
Air:Fuel Ratio: Uses the data values from Internal Channel 1 or Channel
2 to trigger an output. Engine Speed: Uses the Internal Engine Speed value to trigger an
output. Vehicle Speed: Use the Internal Vehicle Speed value to trigger an
output.
Hardware Input: Hardware Input Lines 1-3 may be used to enable/disable each Auxiliary Output. Press the ENTER key repeatedly to cycle through the list of available Hardware Input Lines. Each Hardware Input is activated by applying an electrical ground to its respective input wire.
28
Auxiliary Output Configuration Examples 1.) Shift Light Output @ 6000 RPM:
To configure Auxiliary Output #1 for use as a shift light controller, we need to set up the desired RPM activation window through the DataMap software. For a shift light application, we don’t need to be concerned with the Air:Fuel ratio, vehicle speed, or the state of any hardware input lines. Use the following steps to set up a shift light control on Auxiliary Output #1 using the configuration table in the DataMap software: 1.) Click in the TRIGGER column of the Air:Fuel Ratio row. Press the
ENTER key repeatedly until NOT USED is displayed. This will allow the output to be activated independently of the measured Air:Fuel ratio value.
2.) Click in the TRIGGER column of the Engine Speed row. Press the ENTER key repeatedly until USED is displayed. This will allow the output to be activated only when the Engine Speed ENABLE and DISABLE parameters are satisfied.
3.) Click in the TRIGGER column of the Vehicle Speed row. Press the ENTER key repeatedly until NOT USED is displayed. This will allow the output to be activated independently of the measured Vehicle Speed value.
4.) Click in the TRIGGER column of the HW Input Line row. Press the ENTER key repeatedly until NOT USED is displayed. This will allow the output to be activated independently of the state of any hardware input line(s).
5.) Click in the ENABLE column of the Engine Speed row. Enter 6000 and press the ENTER key. This will cause the output to be activated when the measured engine speed rises to or goes above 6000 RPM.
6.) Click in the DISABLE column of the Engine Speed row. Enter 5800 and press the ENTER key. The Disable speed must be lower than the Enable Speed value to prevent the output from oscillating when the actual engine speed is close to the ENABLE value. This will cause the output to be deactivated once the measured Engine Speed drops below 5800 RPM.
29
2.) Lean Alarm Output @ Channel 1 13.50 AFR above 3500 RPM:
A lean alarm output would be used to signal a lean condition while the vehicle is being driven. Typically, you would only be concerned about a lean condition while the engine is being driven under load, and above a critical Engine Speed value. 1.) Click in the TRIGGER column of the Air:Fuel Ratio row. Press the
ENTER key repeatedly until the Ch #1 is displayed. This will allow the output to be activated when the measured Air:Fuel ratio value of Channel #1 rises above a given value.
2.) Click in the TRIGGER column of the Engine Speed row. Press the ENTER key repeatedly until USED is displayed. This will allow the output to be activated only if the Engine Speed ENABLE and DISABLE parameters are satisfied.
3.) Click in the TRIGGER column of the Vehicle Speed row. Press the ENTER key repeatedly until NOT USED is displayed. This will allow the output to be activated independently of the measured Vehicle Speed value.
4.) Click in the TRIGGER column of the HW Input Line row. Press the ENTER key repeatedly until NOT USED is displayed. This will allow the output to be activated independently of the state of any hardware input line(s).
5.) Click in the ENABLE column of the Air:Fuel Ratio row. Enter 13.50 and press the ENTER key. This will allow the output to be activated only when the measured Air:Fuel Ratio on Channel #1 rises to or above 13.50:1.
6.) Click in the DISABLE column of the Air:Fuel Ratio row. Enter 13.00 and press the ENTER key. This value must be lower than the Air:Fuel Ratio entered for the ENABLE value to prevent oscillation. This will cause the output to be deactivated once the measured Air:Fuel Ratio on Channel #1 drops back below 13.00:1.
7.) Click in the ENABLE column of the Engine Speed row. Enter 3500 and press the ENTER key. This will allow the output to be activated only when the measured engine speed rises to or above 3500 RPM.
8.) Click in the DISABLE column of the Engine Speed row. Enter 3300 and press the ENTER key. This speed must be lower than the Engine Speed Enable value to prevent oscillation. This will cause the output to be deactivated once the measured Engine Speed drops below 3300 RPM.
30
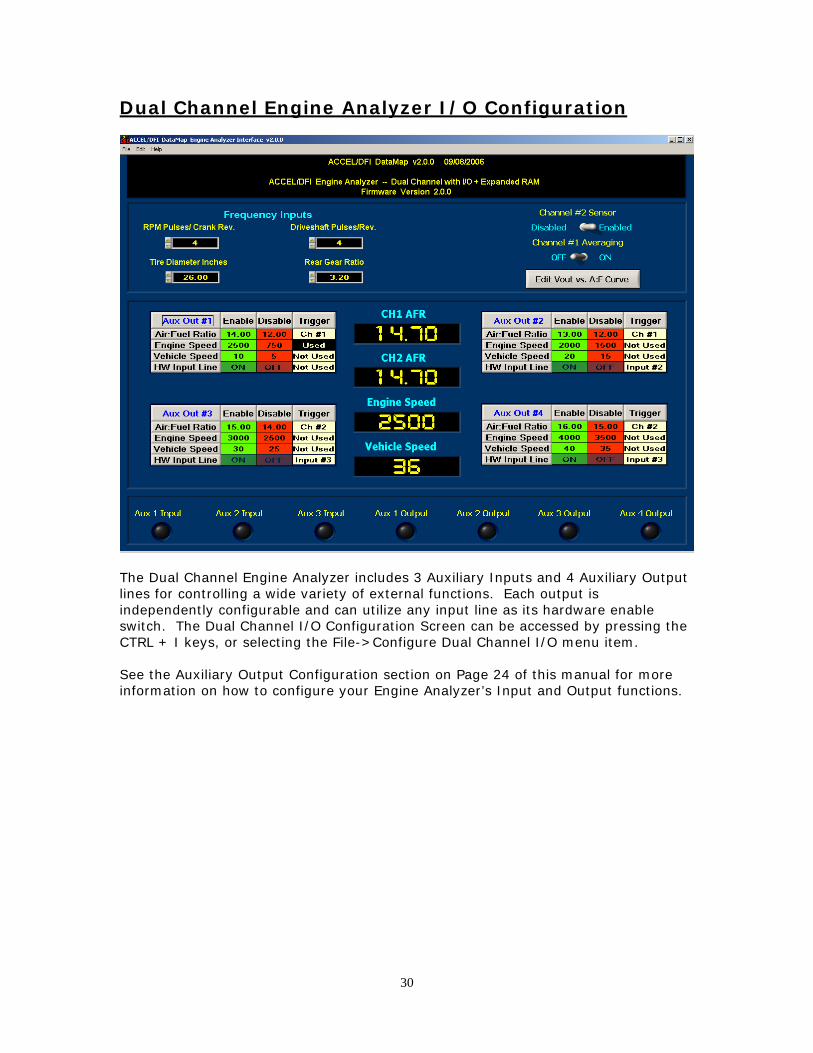
Dual Channel Engine Analyzer I/O Configuration
The Dual Channel Engine Analyzer includes 3 Auxiliary Inputs and 4 Auxiliary Output lines for controlling a wide variety of external functions. Each output is independently configurable and can utilize any input line as its hardware enable switch. The Dual Channel I/O Configuration Screen can be accessed by pressing the CTRL + I keys, or selecting the File->Configure Dual Channel I/O menu item. See the Auxiliary Output Configuration section on Page 24 of this manual for more information on how to configure your Engine Analyzer’s Input and Output functions.

31
Editing the Voltage Output vs. Air:Fuel Ratio Curve
To edit the 0-5 volt output curve vs. Air:Fuel Ratio, press the Edit Vout vs AFR curve button on either of the I/O configuration screens. Note that this is a Pro-Only feature, and the curve will not be accessible unless you have a USB cable connection to your Engine Analyzer that includes an integrated ACCEL/DFI Professional Powerkey. Follow the on-screen directions to create your desired voltage output vs. Air:Fuel ratio curve.

32
Data Analysis Using the DataMap software
The DataMap software includes a 16-channel graph for displaying and analyzing the data recorded by your Engine Analyzer. From the File menu, select File->Graph Log File, or press the Analyze button after reading data from your Engine Analyzer to enter the DataMap Analysis screen. Once data is loaded from a file, it is displayed graphically on the screen, and numerically along the left side of the display. The names of the data channels are displayed along with their numerical values at the location of the vertical yellow cursor on the graph. The current time at the location of the cursor, total length of the log file, current sample number, and total number of samples are displayed underneath the channel data display. Finally, calculations are made on each data channel when the data is loaded from the log file. Clicking on a channel name will display the channel minimum, maximum, average, and maximum change values for each that channel. Use the arrow keys on your keyboard or the mouse to change the location of the yellow cursor on the data graph. Moving the cursor to a new data point will update the numerical displays with the current data values at that point. Pressing SHIFT and the cursor keys will move the cursor 10 data points to the right or left. Pressing the CTRL and cursor arrow keys at the same time will shift the position of the active trace within the confines of the data graph.

33
Right Clicking on the Data Graph or selecting Graph Data from the Edit menu brings up the data manipulation menu for the graph. The menu contains the following options: Export Data to CalMap Log File Use this item to create a data log file that can be read by the ACCEL/DFI CalMap Gen 7+ software program. You can open the log file within CalMap, and use it like any other data file to aid in the calibration of ACCEL/DFI Generation 7 Engine Control Modules. Set Time = 0 to Current Point This will reset the numerical timer so that it is equal to 0.00 seconds at the current position of the yellow graph cursor. Set Time = 0 to Start of File This will reset the numerical timer so that it is equal to 0.00 seconds at the start of the logged data. Zoom In This will increase the resolution of the graphed data by reducing the number of horizontal data points displayed on the graph. Zoom Out This will decrease the resolution of the graphed data by increasing the number of horizontal data points displayed on the graph. A maximum of 500 data points can be shown on the graph at once. Set New Starting Point This will set the starting point of the logged data to the current position of the yellow graph cursor. A vertical green cursor will be placed at the new starting point. Set New Ending Point This will set the ending point of the logged data to the current position of the yellow graph cursor. A vertical red cursor will be placed at the new ending point. Save Data from Start Point to End Point This will create a new log file containing only the data samples between the Start Point and End Point Cursors. Add New File as Overlay This will allow you to overlay a second log file on top of the first file in order to graphically and numerically compare the two data files. Selecting this option brings up a file dialog prompt where you can select the second data file to be overlaid on the data graph. When a second file has been graphed, pressing the CTRL and cursor arrow keys at the same time will shift the position of the active trace in order to allow you to precisely align the data from the two files. Show Data for Trace #1 If a second data file is overlaid on the graph, selecting this option will cause the numeric display to show data from Trace #1, the original log file that was displayed on the analysis graph.

34
Show Data for Trace #2 If a second data file is overlaid on the graph, selecting this option will cause the numeric display to show data from Trace #2, the second log file that was overlaid on the analysis graph. Show Difference Data (Trace #2 – Trace #1) If a second data file is overlaid on the graph, selecting this option will cause the numeric display to show differences in the two files, shown as (Trace #2 – Trace #1). Right Clicking on the Numerical Display Table brings up a channel editing menu which contains the following options: Show/Hide Channel This menu option will toggle the visibility of the currently selected channel. If the channel is currently displayed on the graph, it will be hidden. If it is not displayed on the graph, the graph will be redrawn with the current active channel displayed. Show/Hide ALL Channels This option will toggle the visibility of ALL the data channels drawn on the graph. If any channels are displayed, this menu item will hide all the channels. If no channels are visible, the graph will be redrawn with all the channels displayed. Edit Channel This menu option will allow you to edit the limits for each data channel, change the trace color for each channel, and hide the channel if you do not want it to be displayed on the graph. Changing the Minimum/Maximum and Slope/Offset values for a data channel offers the ability to individually magnify the data values for each channel on the analysis graph. For example, if your recorded engine speed was never greater than 6000 RPM, it would be a good idea to change the maximum value from the default of 12750 RPM to 6500 RPM. This would cause the Engine Speed data trace to span almost the entire vertical range of the graph, multiplying the resolution of the signal for analysis purposes. Use the Save Cfg… button at the lower left of the screen to save your current channel configuration to a file. Use the Load Cfg button to load a preset configuration and apply it to the current log data being analyzed. Use the Make Default button to save the current configuration as your default configuration. [Data Channels] These will be one menu item for each channel of data that has been recorded by the Engine Analyzer. To change the data source for the currently selected channel, simply pick another data source and the new data will be displayed in the current position on both the numeric table and the data graph.

35
Frequently Asked Questions What is the difference between closed loop mode and open loop mode?
In Open Loop mode, an oxygen sensor may be used for monitoring air/fuel ratio information. However, in open loop mode, if the measured air/fuel ratio deviates from the targeted air/fuel ratio, no corrections are made to the amount of fuel being injected.
In Closed Loop mode, an oxygen sensor may be used for monitoring
purposes as well. However, in closed loop mode, if the measured air/fuel ratio deviates from the targeted air/fuel ratio, the fuel injection system will automatically increase or decrease fuel delivery to align the measured air/fuel ratio with the targeted air/fuel ratio.
Why do I sometimes get very lean air/fuel ratio readings even if the car is obviously running very rich?
In many cases, this is due to exhaust reversion. Exhaust reversion is common in high performance applications where large camshafts and large diameter exhaust systems are used. At low engine speeds, particularly at idle, the airflow in the exhaust stream repeatedly changes direction. This can actually pull outside air into the exhaust system, causing the oxygen sensor to register a falsely lean condition. Open header exhaust systems are the most prone to this. If this happens in your application, it is advisable to disable closed loop correction at low engine speeds. As the engine speed and load increases, the amount of reversion in the exhaust system will decrease. Exhaust reversion has little or no impact on oxygen sensor readings at wide-open throttle. If you obtain normal air/fuel ratio readings at WOT but not at idle or cruise, this is the likely culprit.
Air leaks in the exhaust system can cause false lean readings. Outside air is drawn into the exhaust stream through leaks in gaskets, welds, slip joints, rust holes, or cracks. If you have any exhaust system leaks, they must be sealed to ensure proper operation of the oxygen sensor.
Inspect the sensor for any obvious physical damage. You can check the sensor for a broken heating element by holding the sealing washer in place and shaking the sensor. Much like a light bulb, the element will rattle inside the unit if it is broken.
If the sensor appears to be heavily coated in carbon or oil, it may have failed due to contamination. Contact your Accel DFI Engine Management Installation Center (EMIC) for further information on troubleshooting or replacing the sensor.
Is this system compatible with leaded gasoline?
This system is compatible with leaded gasoline. Oxygen sensor manufacturers state that the presence of lead in the fuel system will substantially reduce the life expectancy of an oxygen sensor. However, there are many racers who have received several years of service from a single oxygen sensor.

36
Is this system compatible with methanol or ethanol?
This system is compatible with methanol and ethanol fuels. While this system will accurately measure air/fuel ratio information with these fuels, most engine management systems will only display gasoline air/fuel ratios.
Why do I keep seeing 1 Stored Run with 0 Data Samples in the Data Logger?
When your Data Logger is configured to record Data from a Generation 7+ ECM, the serial communications cable must be properly connected to the CalMap Data Cable from the ECM through the supplied adapter in order for data to be recorded properly. If the Data Logger is activated without the proper serial data connection to the ECM, the Data Logger will increment the number of runs stored in memory, but will be unable to store any data samples due to the improper or missing serial data connection.
Make sure the Engine Analyzer’s serial data cable is connected to the CalMap Communications cable using the adapter provided with your Engine Analyzer kit. The connection must be made with that or an electrically similar adapter in order for the devices to properly communicate with each other.
What contaminants can damage the oxygen sensor?
One of the most common causes of oxygen sensor failure is contamination from engine oil in the exhaust. This is usually the result of excessive amounts of crankcase blow-by or leaking turbocharger oil seals. Excessive carbon buildup from rich fuel mixtures is another common cause of premature oxygen sensor failure. Engine coolant in the exhaust system can also damage oxygen sensors, particularly if there is antifreeze in the cooling system. Uncured silicone vapors can damage oxygen sensors. If you use silicone to seal your exhaust system, the silicone should be allowed to cure overnight before installing the sensor in the exhaust.
This system reads much richer/leaner than another wideband controller that I use. Which one is correct?
Accel DFI wideband control systems are measured against state-of-the-art laboratory control systems and are accurate to within .1 AFR across the entire operating range. Also, every system that is shipped from Accel DFI is tested and calibrated on a sophisticated testing machine. The tester calibration, in turn has been validated on an actual running engine under multiple running conditions to ensure accuracy and functionality. In addition, this test equipment is also verified against specialized test gas samples. While most systems offer accuracy at near-stoichiometric air/fuel ratios, the Accel DFI system provides unparalleled accuracy at the much richer air/fuel ratios needed at high power levels.
In turbocharged applications, where should the oxygen sensor be located?
The oxygen sensor should be mounted in the downpipe, not in the collector. The sensor should be at least 8 inches from the turbocharger. The extreme heat and exhaust system backpressure found in the collector(s) of a

37
turbocharged engine can cause inaccurate air/fuel ratio readings and lead to premature failure of the sensor.

38
Recommended Air/Fuel Ratio Chart The following chart may be used as a guideline for baseline tuning of your engine. The values specified in this chart should provide reasonably safe starting points when beginning an engine calibration. Once you have tuned your engine to run at or near these values, you can experiment to see how small changes in fueling impact power, economy, and drivability. If you have any questions or concerns about these values or how your combination will work with these values, you should consult your engine builder or a professional tuner before you begin. Such factors as fuel octane rating, air temperature, ignition timing, exhaust configuration, cam profile, compression ratio, and combustion chamber design all have an impact on the “ideal” air/fuel ratio for your application. This chart should be considered a guideline ONLY. In addition to air/fuel ratio information, you should monitor engine temperature, listen for spark knock, and read the spark plugs to determine a fuel setting that is safe and appropriate.
Suggested A/F Ratios Engine Type
Idle Cruise WOT Stock - little or no modification to engine, 87 octane gasoline
14.7:1 14.7:1 12.5:1
Street/Strip engine – naturally aspirated, performance
camshaft and exhaust, 10.0-11.0 compression, premium
pump gasoline
14.2:1 14.0:1 12.8:1
Race engine – naturally aspirated, high lift/duration
cam, 12:1 or higher compression, high-flow heads
and exhaust, high octane racing fuel
13.5:1 13.5:1 13.0:1
Turbocharged/supercharged – stock or mild performance, 6 to 8 psi boost, premium pump
gasoline
14.2:1 13.8:1 12.3:1
Turbocharged/supercharged – street/strip performance, 10 to 15 psi boost, intercooler,
pump gas with octane booster or race gas mix
14.0:1 14.0:1 12.0:1
Turbocharged/supercharged – race configuration, 20-30 psi
boost, intercooled, high octane race fuel
13.0:1 13.0:1 11.5:1
Turbocharged/supercharged – race configuration, 20-30 psi boost, NON-INTERCOOLED,
high octane race fuel
13.0:1 13.0:1 11.0:1