
Lecture 15: Time Varying Covariates Time-varying covariates.

FACULTY OF ENGINEERING AND SUSTAINABLE DEVELOPMENT Department of Building, Energy and Environmental Engineering
Energy mapping of public buildings
A case study at Älvkarlebyhus
Kieran Crowley
2016
Student thesis, Master degree (one year), 15 HE Energy Systems
Master Programme in Energy Engineering, Energy Online
Course
Supervisor: Roland Forsberg, Examiner: Taghi Karimipanah


1
Preface I would like to thank my company supervisor Håkan Karlsson for providing information and
support during my time at Älvkarlebyhus. I would also like to thank the staff of Älvkarlebyhus
for making me feel welcome and relaxed at the office. I would also like to thank to my
supervisor from the college Roland Forsberg with his guidance and support I would have not
been able to complete this thesis and I also like to extend a thanks to all the staff at HIG involved
in the energy online masters as it’s been a very pleasant experience studying on line.
Final I would like to thank my family and friends who supported and encouraged me throughout
my studies.
2
Abstract The aim of this report is to identify all energy systems in the Skutskärs Vårdcentral and
Folktandvården building, Centralgatan 12 building and the Library building to be studied in this
report and carry out an investigation on whether the energy systems efficiency may be increased
by improving on the elements or factors that affect the energy systems.
A model of the buildings energy systems were created in Microsoft excels using the steady state
method and modifying it to calculate an average heating session. Average monthly temperatures
calculated over a thirty year period were used to calculate heat loss due to transmittance,
infiltration and ventilation. Internal heat gains and losses were included in this model. Where
calculation for heat gains or losses was to complex or the required data was not available rule of
thumb was used.
Once results were gained it was seen that the greatest area of loss of heat was from the building
structure by transmittance of heat through the materials. An investigation was carried out to
reduce the heat loss due to transmittance. Both solution involved adding insulation to the wall
and top ceiling in both solution the insulation level was varied to show how much energy could
be saved by varying the thickness of insulation. It was found in both solution that the energy
saving ranged from 9% to 13%. Go to section 4.6 for details in improvements. Unfortunately
quotes for material and labour for each method could not be obtained and without quotes a
recommendation to which to invest in cannot be given. The Älvkarlebyhus management should
use the areas of the external wall and ceiling area provided in appendix A to obtain quotes from
respected companies in Sweden. The areas in appendix A should be double checked before
looking for quotes to ensure accuracy in obtaining quotes. This was tried by the author but failed
for the following reasons:
Companies would not respond to e-mails
Also when searching for Swedish companies online there web site was in Swedish and no
English option to read the material on the site was available. Meaning the author could
not gain the required information needed to calculate cost.
The third solution involved lowering the internal temperature of the building. When the internal
temperature was lowered to 17°C and 15°C reduction in energy usage by 10.95% and 16.82%
was seen respectively.
No other area where improvements could be carried out for the following reasons:
The heat pump combined with the district heating and the use of heat recovery devices
makes the energy system providing heat for hot water and the heating system highly
efficient. There are no improvement worth the financial cost and the interruption to the
occupants of the buildings.
On Visual inspection the equipment was maintained to a high standard avoiding the need
to create a maintenance schedule.
Insulation on pipes and ducts coming and going from plant rooms to the building were to
a high standard. No repairs or improves are needed.
The lighting system is an area where energy can be reduced to justify the cost of
installing more energy efficient lights and better controls. An experienced person should
investigate this as it requires specify knowledge and experience to select the suitable
3
lighting system to reduce cost. Implementing lights with the wrong controls system can
cause poor lighting levels in the building and health problems such as headaches for the
occupants. It may also increase the energy consumption of the building if the wrong
lighting fixtures and controls were selected.
A cheap and easily technique to implement would to advice the occupants of the building to turn
off equipment and lights when are not needed. Hanging signs by exits of room as a reminder.
This seems obvious but as the author carried out a visual inspection of the buildings concerned in
this report it was noted that lights were left on in areas no one was to be seen. The same was seen
for equipment such as computers.
The insulation levels for the walls and ceiling should be increased to improve heat loss due to
transmittance. Improving insulation would also decrease the heat loss due to infiltration. There is
no reliable way of calculating the percentage of reduction as using the results from a pressure test
is the only reliable way of calculating heat loss from infiltration once the improvements have
been carried out. Also to compare before and after the improvements a pressure test would have
to be done before any improvements are carried out to make an accurate comparison.
The buildings in this report relies heavily on electricity for providing lighting, heating and
ventilation. For this reasons it is recommended that a feasibility study be carried whether PV
solar panels or wind turbines could produce electricity for the buildings studied in this report.
The advantages and disadvantages of PV panels and wind turbines are covered in the conclusion
section of this report.
Älvkarlebyhus can be proud that the building in this thesis releases no CO2 or other harmful
greenhouse gases as the greenhouses gases released from the production of the district heating
system and electricity suppliers are taken into account by the suppliers of these energy sources.
Making them an environmentally friendly building.
4
Table of Contents
1. Introduction ................................................................................................................................. 5
2. Theory ......................................................................................................................................... 7 2.1 Energy mapping .................................................................................................................... 7 2.2 Steady state conditions .......................................................................................................... 7
2.3 Internal gains ......................................................................................................................... 8 2.4 Infiltration gains .................................................................................................................... 8 2.5 Solar gains ............................................................................................................................. 9 2.6 Thermal transmittance losses .............................................................................................. 10 2.7 Ventilation ........................................................................................................................... 11
2.8 Heat recovery ...................................................................................................................... 13 2.9 Passive design ..................................................................................................................... 13
2.10 Creating or using a model ................................................................................................. 14 2.11 Controls of the system ...................................................................................................... 14 2.12 Reference data ................................................................................................................... 16
3. Method ...................................................................................................................................... 17
4. Process and results .................................................................................................................... 29 4.1 Skutskärs Vårdcentral, Folktandvården building ................................................................ 29 4.2 Library ................................................................................................................................. 34
4.3 Centralgatan 12 building ..................................................................................................... 36 4.4 Energy balance for all three building. ................................................................................. 38
4.5 Visual inspection ................................................................................................................. 39 4.6 Improvements ..................................................................................................................... 41
Solution 1 .............................................................................................................................. 41 Solution 2 .............................................................................................................................. 42
Solution 3 .............................................................................................................................. 43 Solution 4 .............................................................................................................................. 43
5. Discussion ................................................................................................................................. 45
6. Conclusions ............................................................................................................................... 49
7. References ................................................................................................................................. 51
8. Appendices ................................................................................................................................ 53
8.1 Appendix A: Areas to be used for quotes. .......................................................................... 53
8.2 Appendix B: Flow chart ...................................................................................................... 54 8.3 Appendix C: Inputs and calculations for Skutskärs Vårdcentral, Folktandvården building.
................................................................................................................................................... 55 8.4 Appendix D: Inputs and calculations for Library building. ................................................ 74 8.5 Appendix E: Inputs and calculations Centralgatan 12 building. ......................................... 90
8.6 Appendix F: Heating input by heating system. ................................................................. 108
5
1. Introduction
Due to global warming becoming more of an international issue. Energy usage in modern society
is a concern for all governments and citizens. This is why governments are now setting new
building standards to reduce the energy usage and to cut down on greenhouse gases emissions of
it’s nation by using more energy from renewable source’s, better control systems to ensure the
systems are not operating when not needed, upgrading current building and energy systems
structures and more efficient equipment. Governments also agree to international or EU policy
and directives to reduce energy consumption and greenhouse gasses emissions by a certain
percentage. Building standards are set to make these targets possible such agreements are made
legally bidding and penalties may occur by any country that failed to meet its agreed target. An
example of such a policy is the Energy efficiency policy in Europe where EU member country
that agreed to the policy has to achieve the following targets by the year 2020:
Increase energy systems efficiency by 20%.
Reduce greenhouse gasses by 20%
Increase energy from a renewable source by 20%
The figures above may differ from country to country depending on the renewable resources
available to utilize and the current economy situation of the country.
The push from governments for more energy efficient building and an energy system with the
lowest impact on the environment has companies concerned about their corporate image. One
way of improving corporate image is to invest in low energy systems with low level of
greenhouse gas emissions for any buildings belonging to the company. This is achieved a
number ways and there’s no one solution for all building as key factors that affect the energy
systems for buildings will change from building to building. Energy mapping helps to identify
the building energy systems and creates an energy balance of the gains and loss of the factors
that affect the energy systems. This can help to identify key areas where the energy usage could
be improved on and to reduce CO2 emissions according to a English study “The energy use
within buildings for heating and lighting, etc, accounts for more than 40% of the CO2 released
to the atmosphere in the UK” 1. It can also help to keep track of the energy system performance
over a period of time. A sudden fall in performance may indicate part of the systems is
experiencing a fault or has stopped operating completely and slow decline may indicate poor
maintenance issues.
The aim of this report is to use energy mapping to reduce the energy consumption for the
Skutskärs Vårdcentral, Folktandvården building and Centralgatan 12 building and the Library
building managed by Älvkarlebyhus with the hope of better thermal comfort and to see a
decrease in energy usage in each building. It is important to gather all information required for
the thesis form reliable sources as incorrect information can have serious impact on the results
and conclusion of the report. The information required for this project came from engineering
documents to assist in ensuring the proper steps were taking when calculations and when making
key decisions that have a major effect on the outcome of the project. The supervisor also gave
some documents that were required to perform calculations others were gained by the author’s
time in college. Älvkarlebyhus supplied information about the building and its energy system as
they were required too.
1 Ref GPG 303 The designer’s guide to energy-efficient buildings, page 6

6

7
2. Theory To explain the theory involved in this paper each topic will be given a sub heading of its own
and a description given of what it is and how it affects the work done in this paper.
2.1 Energy mapping Having a good methodology process in place is critical for the success of any project. This is
where energy mapping comes into play. It sets out a plan of action for the person carrying out the
work and if followed the greater the chance for success. The first step in this process is
identifying all energy suppliers for example Electricity and the district heating suppliers. The
second step is to identify which system will use the energy been supplied. The third step is to
create a flow chart to give a visual aid to represent of the overall energy system of the building.
With the help of the flow chart the factors that affect each sub energy systems can be identified
for example the following factors affect the heating system:
1. Design room temperature.
2. U-values of the building envelope.
3. The internal gains from people, equipment, lighting system and solar gains.
4. Air tightness of the building.
5. Ventilation requirements.
6. Outside temperature.
2.2 Steady state conditions The steady state method calculates the energy loss and input in an energy system for one
moment in time. This method is used when sizing equipment for the buildings energy systems
for example the size of the pipes for the hot water distribution system and heat emitters for the
heating system. The method can be modified to calculate the energy balance of a building over a
period of time by one main technique described below:
1. If a weather data file is available the time steps in which the temperature was measured
on a daily basis can be used as steady state condition to calculate the energy balance at
that point. It’s important for each steady state condition to be multiplied by the length of
time between time steps in order to account for the time missing between measurements
to produce more accurate results. Care must be taken when using this process as the
results may not represent typical heating session. If a weather data file is used during a
time were the weather condition behaved to an extreme manner the results will be over or
under estimated. This can be avoided by averaging weather conditions over a period of
time. 30 years is the preferred length of time among engineers. But if the data for that
length of time is not available or too expensive to purchases a shorter period is
acceptable.
The above method will be used but with two changes the first change, no data files where
available so average temperature for a month will be used. The average temperature for each
month was calculated over a period of 30 years which makes it a reliable and accurate. The
second change, Since average temperature for the month is used only one steady state condition
will be calculated then converted into kW*h by dividing the results by 1000 to convert into kW
and then by the operational hours of the equipment to gain kW*h. Once this is achieved the
energy balance can be create and the investigation on how to improve the system can begin.
8
2.3 Internal gains Internal gains are the heat gains in a building that come the following:
People give off heat when carry out an activity. The amount of heat released depends on
the level of activity the person is doing for a seated person it is said that they release
115W (ASHRAE Handbook 2005)2 of heat compared to when someone is working out in a
gym they give out 585W (ASHRAE Handbook 2005)2 of heat. The comparison above
shows how important it’s to select the right activity when including heat gains from
people as the wrong choice could have a serious impact on the results in fact the above
example shows if the wrong activity is picked the calculation will be off by a factor of
5.1. Another important factor to get right is the amount of people within the space
concerned. As the heat gain from people will be multiplied by all people within the space
will be included in the calculation.
Equipment within the building can contribute to internal heat gains mainly in office and
industry building. For domestic homes they usually not considered as they usually have a
small or no impact on the heating load. Heat gains from equipment can be found in
engineering documents and on the equipment manuals. Equipment such as computers and
data storage device or any device for keeping food cold should be included.
Lighting system in a building converts all electricity into heat. Heat gains from lights can
be found in engineering documents given in the form of watts per square meter. There is
a lot of potential in reducing the energy demand of a building from the lighting system by
installing more efficient lights and better controls.
2.4 Infiltration gains All building materials allow a certain amount of outside air to pass through it into the building.
Air also enters the building through gaps or cracks in the external structure of the building.
Where doors and window are fixed to the external wall air may pass through more easily around
gaps in frames of the doors and windows as they may have not be sealed correctly. The amount
of air passing through the frame and seals depends on the ability of the crafts man fitting the
doors and window. The infiltration through these gaps or cracks will differ from building to
building. This is mostly wind driven process but other factors may contribute to this such as air
pressure and difference in external and internal temperatures. Depending on wind direction and
wind velocity different parts of the building will experience different infiltration gains. This is
difficult to calculate or create a model to account for this. The only accurate way to gain accurate
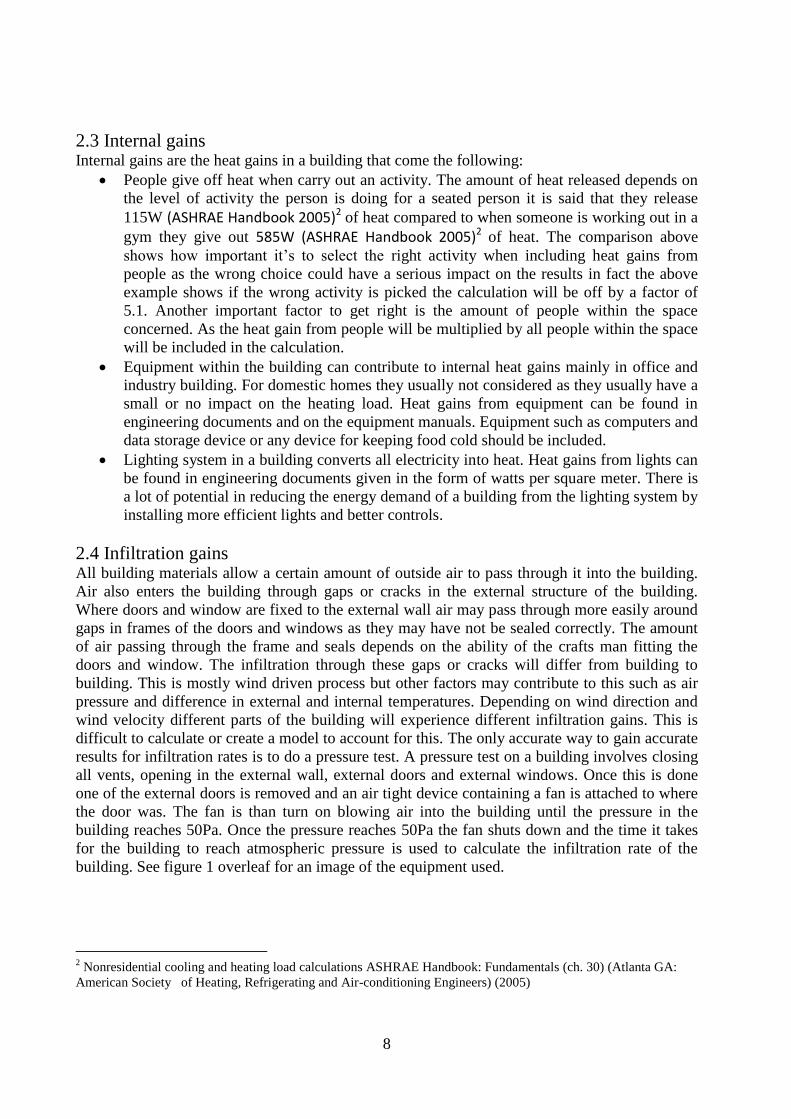
results for infiltration rates is to do a pressure test. A pressure test on a building involves closing
all vents, opening in the external wall, external doors and external windows. Once this is done
one of the external doors is removed and an air tight device containing a fan is attached to where
the door was. The fan is than turn on blowing air into the building until the pressure in the
building reaches 50Pa. Once the pressure reaches 50Pa the fan shuts down and the time it takes
for the building to reach atmospheric pressure is used to calculate the infiltration rate of the
building. See figure 1 overleaf for an image of the equipment used.
2 Nonresidential cooling and heating load calculations ASHRAE Handbook: Fundamentals (ch. 30) (Atlanta GA:
American Society of Heating, Refrigerating and Air-conditioning Engineers) (2005)
9
Figure 1 Air pressure test equipment. Source: Google images 3
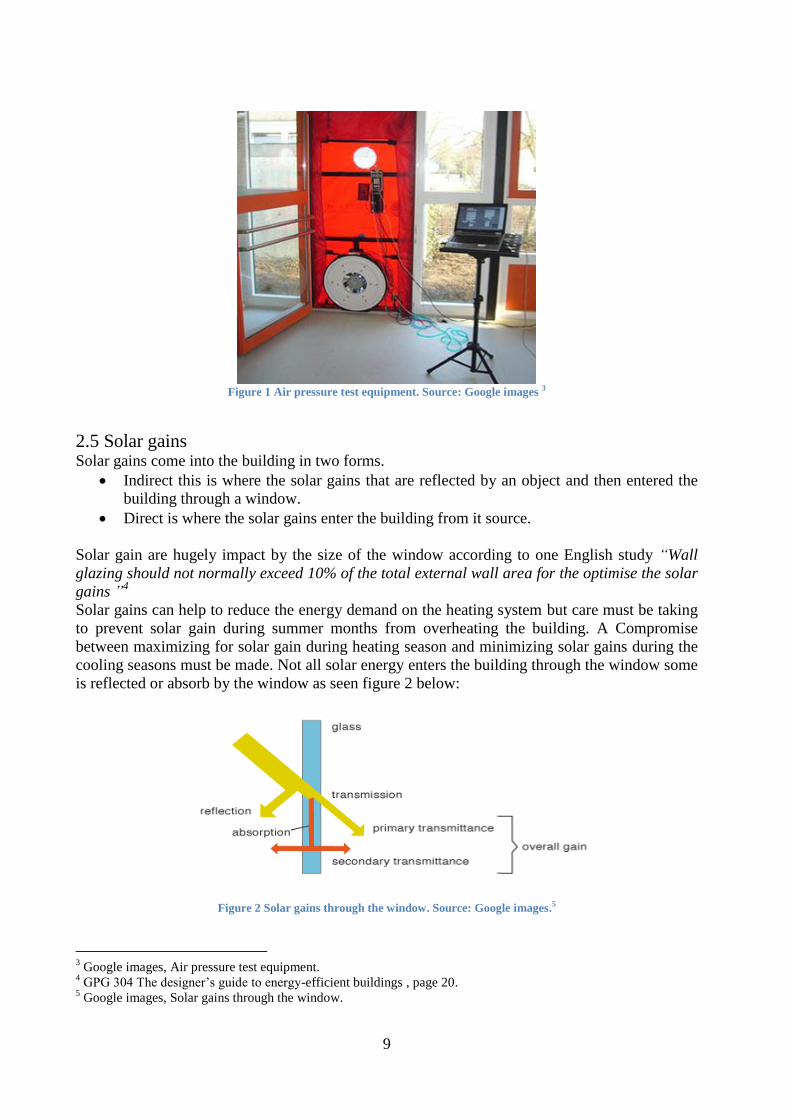
2.5 Solar gains Solar gains come into the building in two forms.
Indirect this is where the solar gains that are reflected by an object and then entered the
building through a window.
Direct is where the solar gains enter the building from it source.
Solar gain are hugely impact by the size of the window according to one English study “Wall
glazing should not normally exceed 10% of the total external wall area for the optimise the solar
gains ”4
Solar gains can help to reduce the energy demand on the heating system but care must be taking
to prevent solar gain during summer months from overheating the building. A Compromise
between maximizing for solar gain during heating season and minimizing solar gains during the
cooling seasons must be made. Not all solar energy enters the building through the window some
is reflected or absorb by the window as seen figure 2 below:
Figure 2 Solar gains through the window. Source: Google images.5
3 Google images, Air pressure test equipment.
4 GPG 304 The designer’s guide to energy-efficient buildings , page 20.
5 Google images, Solar gains through the window.

10
The amount solar energy reflected, transmitted and absorb by the glass will depend on the
properties of the glass which can be altered during the production stage of the glass to gain the
desired amount of solar energy been reflected, transmitted and absorb by the glass. This will
impact the designer choice of windows selected for any building project.
2.6 Thermal transmittance losses
Heat flows from the inside of the building through the buildings structures to the external
environment when the internal temperature is greater than the external temperature. As seen in
figure 3 below:
Figure 3 Heat loss due to heat transmittance through the building envelope. Source: Google images.6
Each element of the building structure will have a number of layers each with its own propose.
The number of layers and type will depend on a number of issues such as:
Which structure is being considered?
The design criteria of the structures has to meet.
The local weather climate.
Client’s opinion on how the external and internal surfaces should look like.
Whether the client wants a low or zero energy buildings or a building meeting current
building standards.
Thermal resistance of the materials used in the construction of the structure.
The width of the structure that the heat passes through.
The thermal resistance in each layer will add to the overall thermal resistance of the structure.
The amount of heat loss due to thermal transmittance losses will depend on the factor listed
above. The temperatures difference between the internal and external is one of the main factors
that affect thermal transmittance losses the larger the difference the greater the thermal
transmittance loss.
6 Google images, heat loss in a building.

11
U-values are important factor when design a building as they will affect the size of heating and
cooling equipment. Also as U-values increase the infiltration rate is usually lowered as a result.
Designers must be careful as there is a point to where the cost of improvement to the thermal
resistance of a structure will outweigh the saving of energy. The point where you save the most
energy at the least cost is referred to as the cost optimal. U-values are calculate using the method
of how much resistance electrical resistors provide when in series or parallel in an electrical
circuit. This method of calculating is explained in more detail in section 3 step 4.
2.7 Ventilation This is the process of suppling fresh air into a building in order to remove containments, odours
and moisture. Ventilation rates for building can be found in engineering documents and will
differ depending on the type of building being considered. Poor ventilation rates may cause the
people occupying the building to experience poor thermal comfort and illness. Leading to
complaints to management about work conditions being poor. This can cause serious problems
for the designer and energy firms as it decrease profits on the project also could give the frim a
bad reputation if the problem not resolved in a proper and professional manner. There are two
types of ventilation:
1. Passive ventilation is where the ventilation is supplied by natural means without any
mechanically equipment. One example of such a system is opening in the walls such as
vents to allow air to enter the building and exist through an opening opposite the vent that
the air enters form. This process is wind driven or caused by the convection movement of
air due to difference in temperature between the internal temperatures and external
temperature of a building. An example of such a design can be seen in figure 4 overleaf
which uses the above factors to provide ventilation for a building. There are number of
solution to choice for passive ventilation but it is not important to go into greater details
as the basic technique is only needed in this project. The limitation of natural ventilation
is “In areas where openings are only on one wall, wind pressure ventilation will be
limited to a room depth of around 6 m. With openings on opposite walls, cross-
ventilation occurs and can be effective in areas up to 12 m wide. Similarly, stack effect
ventilation can be effective for horizontal distances up to 12 m between the wall opening
and roof opening. Most effective natural ventilation will be achieved by using a
combination of low-level openings (eg windows) and some at high level (eg roof vents)”7
7 GPG 303 The designer’s guide to energy-efficient buildings , page 76
12
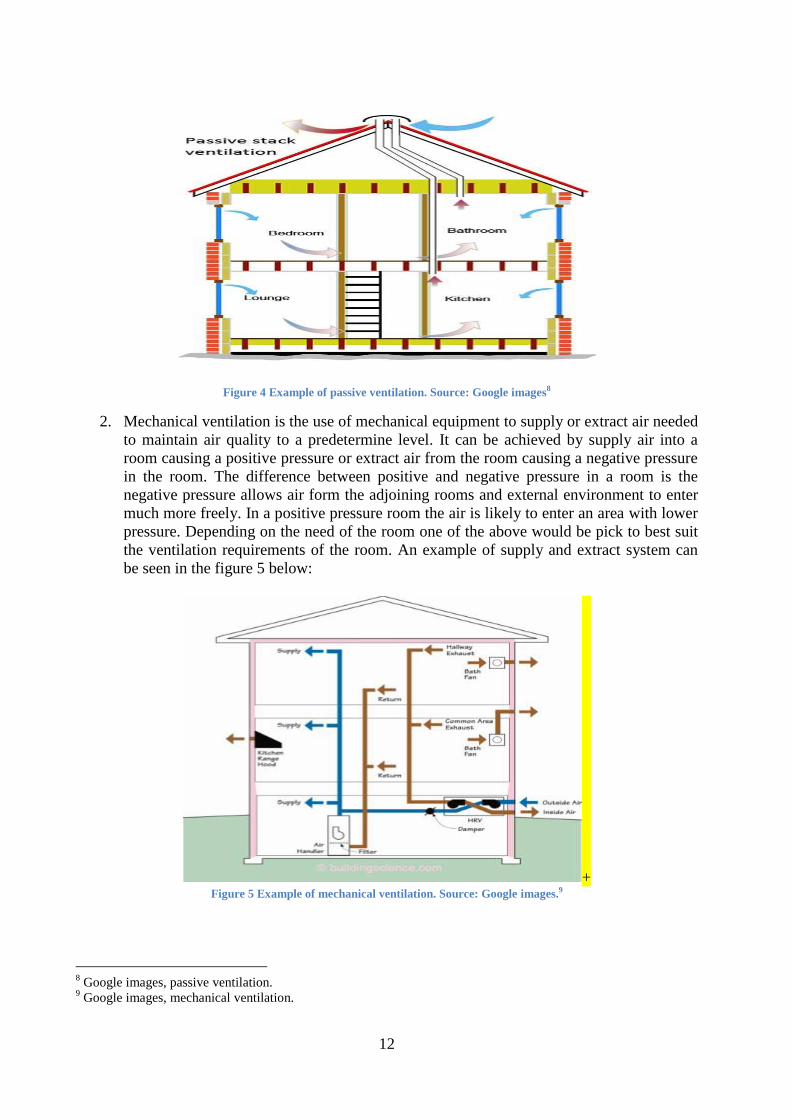
Figure 4 Example of passive ventilation. Source: Google images8
2. Mechanical ventilation is the use of mechanical equipment to supply or extract air needed
to maintain air quality to a predetermine level. It can be achieved by supply air into a
room causing a positive pressure or extract air from the room causing a negative pressure
in the room. The difference between positive and negative pressure in a room is the
negative pressure allows air form the adjoining rooms and external environment to enter
much more freely. In a positive pressure room the air is likely to enter an area with lower
pressure. Depending on the need of the room one of the above would be pick to best suit
the ventilation requirements of the room. An example of supply and extract system can
be seen in the figure 5 below:
+ Figure 5 Example of mechanical ventilation. Source: Google images.9
8 Google images, passive ventilation.
9 Google images, mechanical ventilation.
13
Poor ventilation can have the following side effect on the building:
The removal of commitments not been effectively removed could cause sick building
syndrome. Where there a high number of people occupying the building getting sick but
there no one cause for it and can’t be easily fixed. Building related illness may occur as
well but in this case there in one main factor causing the illness and a lot easier to fix.
Bad odour in the building
A build-up of moisture causing the growth of harmful bacteria and dangerous organisms
in the building.
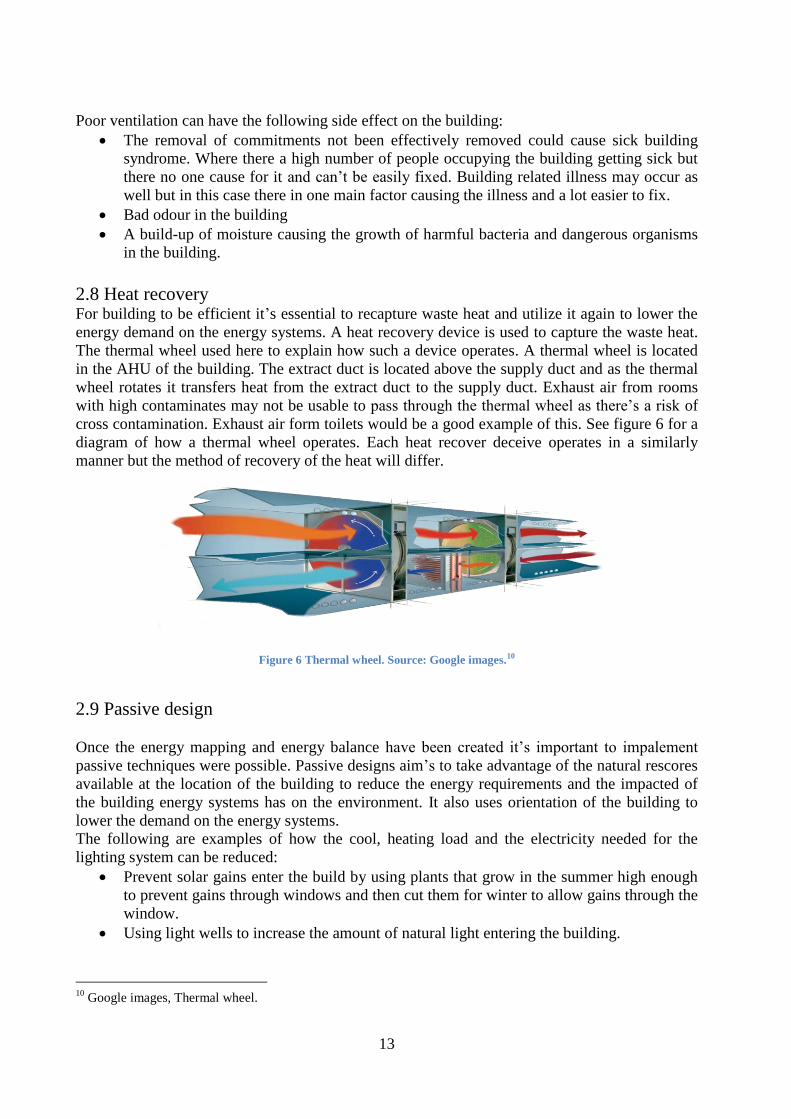
2.8 Heat recovery For building to be efficient it’s essential to recapture waste heat and utilize it again to lower the
energy demand on the energy systems. A heat recovery device is used to capture the waste heat.
The thermal wheel used here to explain how such a device operates. A thermal wheel is located
in the AHU of the building. The extract duct is located above the supply duct and as the thermal
wheel rotates it transfers heat from the extract duct to the supply duct. Exhaust air from rooms
with high contaminates may not be usable to pass through the thermal wheel as there’s a risk of
cross contamination. Exhaust air form toilets would be a good example of this. See figure 6 for a
diagram of how a thermal wheel operates. Each heat recover deceive operates in a similarly
manner but the method of recovery of the heat will differ.
Figure 6 Thermal wheel. Source: Google images.10
2.9 Passive design
Once the energy mapping and energy balance have been created it’s important to impalement
passive techniques were possible. Passive designs aim’s to take advantage of the natural rescores
available at the location of the building to reduce the energy requirements and the impacted of
the building energy systems has on the environment. It also uses orientation of the building to
lower the demand on the energy systems.
The following are examples of how the cool, heating load and the electricity needed for the
lighting system can be reduced:
Prevent solar gains enter the build by using plants that grow in the summer high enough
to prevent gains through windows and then cut them for winter to allow gains through the
window.
Using light wells to increase the amount of natural light entering the building.
10
Google images, Thermal wheel.
14
Allowing solar gains in during the heating period to decease the heat load on the heating
system.
Actuators are hydraulic mechanical devices that open windows to allow the correct
amount of air to enter the room for ventilation proposes.
Passive design is difficult to implement on building that have been built. As the orientation,
building elements and window size is already decided. But what can be done is change the
internal layout of the building to maximize on the passive design technique.
2.10 Creating or using a model When creating a model and carrying out simulations on the model it’s important to know the
difference of the two. A model is the mathematical representation of a physical energy system
and a simulation is using the parameters such as outside temperature, u-values and indoor air
temperature to name a few and entering the information into the model to gain results such as
energy demand for the year, size of heat emitter’s .Modelling can also be used to compare
different technologies to help the designer’s to choice the best energy system. There are a
number of modelling tools available to engineers today for example IDA ICE, modest and
reMIND. Care must be taking when using any modelling software packages as the limitations
must be known to the user to avoid problems with clients and projects. Simple models are often
more desired as complex model have higher risk of error and the cost tends be increase as the
complexity of the model increases. The amount of information needed to be inputted into the
model also increases with complexity.
2.11 Controls of the system Controls are used to maintain some conditions of a process or internal environment of a building
within acceptable levels which a designer would state. There are three basic control concepts:
1. There’s a set point which must be maintained for building one such condition would be
temperature. This is known as the controlled variable.
2. The second would be the variables that need to change in order to maintain the set point.
Changing the flow of hot water to a heat emitter is a good example of this. This is known
as the manipulated variable.
3. The factors that cause the controlled variable to vary from the set point are referred to as
disturbances. A chance in outdoor temperature is an example of this.
The most common type of controls used in industry is the PID controls. They are easy and cheap
to implement. Controls can be modelled and simulations to identify the best combination before
put to use. This increase the probability of the controls system performing to their best of their
ability. The PID controls is as follows:
Proportional (P): The error is detected by the sensor and the proportional control will
reply by trying to correct for the size of the error at that moment in time.
Integral (I): The errors are added over a period of time and the integral control acts
accordingly.
Derivative (D): The rate of change in the error is calculated and the derivative control
acts accordingly.

15
The P and I control can act aggressively and cause an overshoot of the set point. This may mean
that it will take the system longer to reach the set point or not at all. When this occurs the system
osculates and unlikely to reach the set point.
There are two types of control systems that are used:
1. Feedback control: This is where a sensor measures the output from a process than sends a
signal to an error detector which measures the difference between the output
measurement and the set point. The error is then send to the feedback controller which
varies the manipulate variables to return the output back to the set point. Feedback
control is always negative to ensure the controlled variable returns to the set point. If a
positive feedback was used the difference in the set point and controlled variable would
increase. See figure 7 overleaf:
Figure 7 Feedback control. Source: Google images.11
2. Feedforward control: the disturbances in the system are measured before they affect the
controlled variable. The manipulate variable are than changed to keep the controlled
variable at the set point see figure 8 below:
Figure 8 Feedforward control. Source: Google Images12
The difference between the two are in the feedback control it’s correct an error that’s been made
where as in the feedforward it prevents an error from occurring.
11
Google images, feedback control. 12
Google images, feedforward control.

16
2.12 Reference data This is where data for a given period of time such as outside temperature for the duration of a
heating session is used in a model in order to calculate energy usage of a building. Typically
weather seasons based on the location of the building are reliable and accurate to gain results.
However since averages temperatures over a thirty year period are available and more accurate to
calculate energy usage a reference temperature year will not be used. But the amount of
Saturday, Sunday and bank holiday in 2016-2015 heating period will be used as reference data.
17
3. Method In order to gain results for this thesis a excel tool was created to produce results and visual aids
in explaining the outcomes of the simulations. Most of the information gathered for the data
input section will be needed in several calculations throughout the process. This makes excel a
more efficient way of gaining results. The steps taken to create the excel tool are listed below
along with the required information need to complete this paper.
1. Collect information on the energy system.
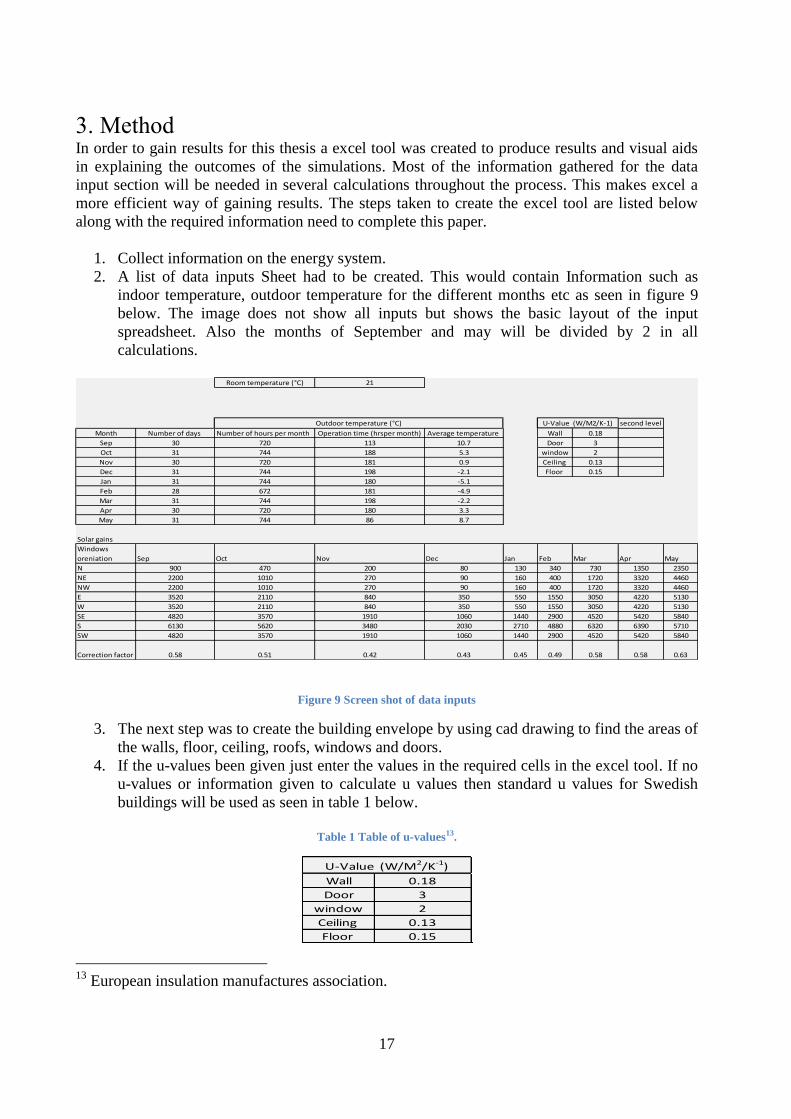
2. A list of data inputs Sheet had to be created. This would contain Information such as
indoor temperature, outdoor temperature for the different months etc as seen in figure 9
below. The image does not show all inputs but shows the basic layout of the input
spreadsheet. Also the months of September and may will be divided by 2 in all
calculations.
Figure 9 Screen shot of data inputs
3. The next step was to create the building envelope by using cad drawing to find the areas of
the walls, floor, ceiling, roofs, windows and doors.
4. If the u-values been given just enter the values in the required cells in the excel tool. If no
u-values or information given to calculate u values then standard u values for Swedish
buildings will be used as seen in table 1 below.
Table 1 Table of u-values13.
13
European insulation manufactures association.
Room temperature (°C) 21
second level
Month Number of days Number of hours per month Operation time (hrsper month) Average temperature Wall 0.18
Sep 30 720 113 10.7 Door 3
Oct 31 744 188 5.3 window 2
Nov 30 720 181 0.9 Ceiling 0.13
Dec 31 744 198 -2.1 Floor 0.15
Jan 31 744 180 -5.1
Feb 28 672 181 -4.9
Mar 31 744 198 -2.2
Apr 30 720 180 3.3
May 31 744 86 8.7
Solar gains
Windows
oreniation Sep Oct Nov Dec Jan Feb Mar Apr May
N 900 470 200 80 130 340 730 1350 2350
NE 2200 1010 270 90 160 400 1720 3320 4460
NW 2200 1010 270 90 160 400 1720 3320 4460
E 3520 2110 840 350 550 1550 3050 4220 5130
W 3520 2110 840 350 550 1550 3050 4220 5130
SE 4820 3570 1910 1060 1440 2900 4520 5420 5840
S 6130 5620 3480 2030 2710 4880 6320 6390 5710
SW 4820 3570 1910 1060 1440 2900 4520 5420 5840
Correction factor 0.58 0.51 0.42 0.43 0.45 0.49 0.58 0.58 0.63
Outdoor temperature (°C) U-Value (W/M2/K-1)
Wall 0.18
Door 3
window 2
Ceiling 0.13
Floor 0.15
U-Value (W/M2/K-1)
18
Windows u-values were given by the supervisor and the rest at EURIMA web-site.
But if the information to calculate the following formulas should be used to calculate u-
values:
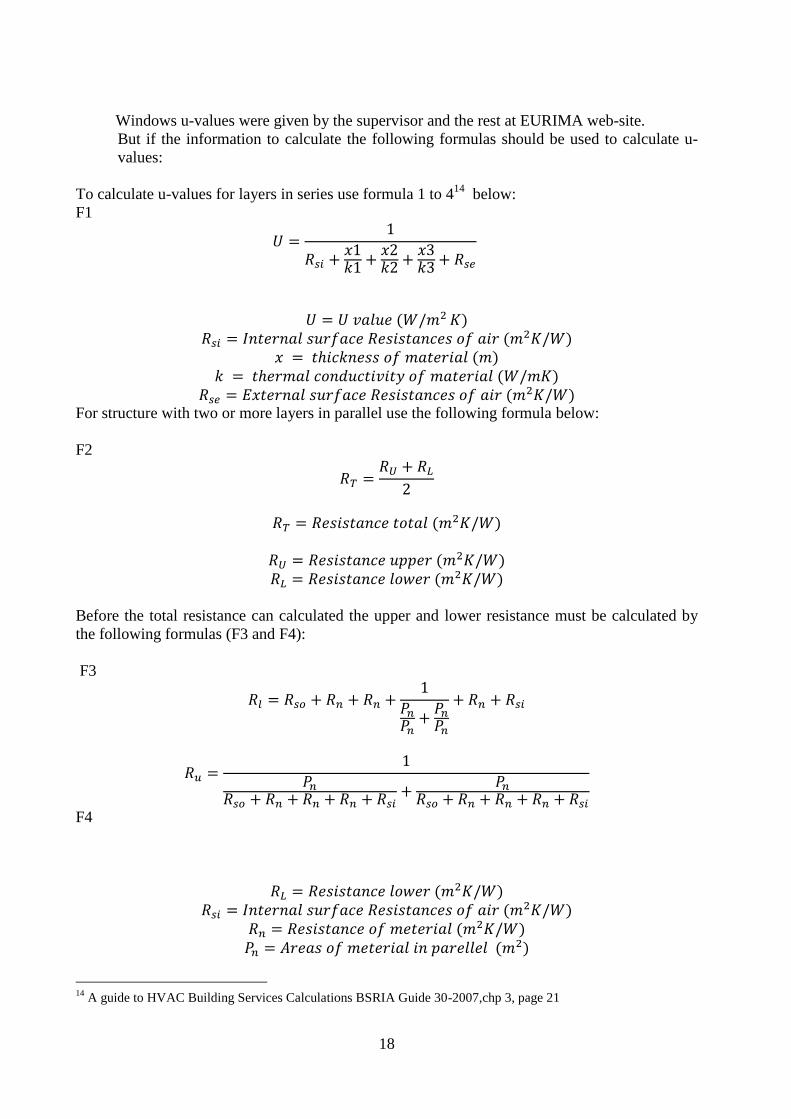
To calculate u-values for layers in series use formula 1 to 414
below:
F1
𝑈 =1
𝑅𝑠𝑖 +𝑥1𝑘1
+𝑥2𝑘2
+𝑥3𝑘3
+ 𝑅𝑠𝑒
𝑈 = 𝑈 𝑣𝑎𝑙𝑢𝑒 (𝑊/𝑚2 𝐾)
𝑅𝑠𝑖 = 𝐼𝑛𝑡𝑒𝑟𝑛𝑎𝑙 𝑠𝑢𝑟𝑓𝑎𝑐𝑒 𝑅𝑒𝑠𝑖𝑠𝑡𝑎𝑛𝑐𝑒𝑠 𝑜𝑓 𝑎𝑖𝑟 (𝑚2𝐾/𝑊)
𝑥 = 𝑡ℎ𝑖𝑐𝑘𝑛𝑒𝑠𝑠 𝑜𝑓 𝑚𝑎𝑡𝑒𝑟𝑖𝑎𝑙 (𝑚)
𝑘 = 𝑡ℎ𝑒𝑟𝑚𝑎𝑙 𝑐𝑜𝑛𝑑𝑢𝑐𝑡𝑖𝑣𝑖𝑡𝑦 𝑜𝑓 𝑚𝑎𝑡𝑒𝑟𝑖𝑎𝑙 (𝑊/𝑚𝐾)
𝑅𝑠𝑒 = 𝐸𝑥𝑡𝑒𝑟𝑛𝑎𝑙 𝑠𝑢𝑟𝑓𝑎𝑐𝑒 𝑅𝑒𝑠𝑖𝑠𝑡𝑎𝑛𝑐𝑒𝑠 𝑜𝑓 𝑎𝑖𝑟 (𝑚2𝐾/𝑊) For structure with two or more layers in parallel use the following formula below:
F2
𝑅𝑇 =𝑅𝑈 + 𝑅𝐿
2
𝑅𝑇 = 𝑅𝑒𝑠𝑖𝑠𝑡𝑎𝑛𝑐𝑒 𝑡𝑜𝑡𝑎𝑙 (𝑚2𝐾/𝑊)
𝑅𝑈 = 𝑅𝑒𝑠𝑖𝑠𝑡𝑎𝑛𝑐𝑒 𝑢𝑝𝑝𝑒𝑟 (𝑚2𝐾/𝑊)
𝑅𝐿 = 𝑅𝑒𝑠𝑖𝑠𝑡𝑎𝑛𝑐𝑒 𝑙𝑜𝑤𝑒𝑟 (𝑚2𝐾/𝑊)
Before the total resistance can calculated the upper and lower resistance must be calculated by
the following formulas (F3 and F4):
F3
𝑅𝑙 = 𝑅𝑠𝑜 + 𝑅𝑛 + 𝑅𝑛 +1
𝑃𝑛
𝑃𝑛+
𝑃𝑛
𝑃𝑛
+ 𝑅𝑛 + 𝑅𝑠𝑖
𝑅𝑢 =1
𝑃𝑛
𝑅𝑠𝑜 + 𝑅𝑛 + 𝑅𝑛 + 𝑅𝑛 + 𝑅𝑠𝑖+
𝑃𝑛
𝑅𝑠𝑜 + 𝑅𝑛 + 𝑅𝑛 + 𝑅𝑛 + 𝑅𝑠𝑖
F4
𝑅𝐿 = 𝑅𝑒𝑠𝑖𝑠𝑡𝑎𝑛𝑐𝑒 𝑙𝑜𝑤𝑒𝑟 (𝑚2𝐾/𝑊)
𝑅𝑠𝑖 = 𝐼𝑛𝑡𝑒𝑟𝑛𝑎𝑙 𝑠𝑢𝑟𝑓𝑎𝑐𝑒 𝑅𝑒𝑠𝑖𝑠𝑡𝑎𝑛𝑐𝑒𝑠 𝑜𝑓 𝑎𝑖𝑟 (𝑚2𝐾/𝑊)
𝑅𝑛 = 𝑅𝑒𝑠𝑖𝑠𝑡𝑎𝑛𝑐𝑒 𝑜𝑓 𝑚𝑒𝑡𝑒𝑟𝑖𝑎𝑙 (𝑚2𝐾/𝑊)
𝑃𝑛 = 𝐴𝑟𝑒𝑎𝑠 𝑜𝑓 𝑚𝑒𝑡𝑒𝑟𝑖𝑎𝑙 𝑖𝑛 𝑝𝑎𝑟𝑒𝑙𝑙𝑒𝑙 (𝑚2)
14
A guide to HVAC Building Services Calculations BSRIA Guide 30-2007,chp 3, page 21

19
𝑅𝑠𝑒 = 𝐸𝑥𝑡𝑒𝑟𝑛𝑎𝑙 𝑠𝑢𝑟𝑓𝑎𝑐𝑒 𝑟𝑒𝑠𝑖𝑠𝑡𝑎𝑛𝑐𝑒𝑠 𝑜𝑓 𝑎𝑖𝑟 (𝑚2 𝐾/𝑊)
Once the u-values are obtained the next step is to calculate the heat loss through the building
structures by using formula 515
below and the table 2 for average temperatures for Gävle below
was used since no data for average temperatures could be found for Skutskär where the building
are located and Gävle being the nearest location with the data required. U-value (W/K/m2)
F5
Q = A ∗ U ∗ ∆T
Q = Heat loss (W)
A = Area ( 𝑚2 )
U = U-value (W/K/m2)
∆T = Difference in temperature (°C)
Table 2 Monthly average temperatures (°C)16
When the above and below calculations are completed the results will have to be converted into kWh by dividing by 1000 than multiply by the operation hours of the equipment and in case of the number of heat gains from people multiply by the opening hours of the building. Using the areas measured in step 2 for windows and information given by the supervisor for solar gains and both correction factors as seen in tables 3 to 5 over leaf calculate the solar gains using formula 617 below:
F6
𝑄𝑆𝑂𝐿 = 𝐴 ∗ 𝑆 ∗ 𝐶𝑆 ∗ 𝐶𝐴 𝑄𝑠𝑜𝑙 = 𝑆𝑜𝑙𝑎𝑟 ℎ𝑒𝑎𝑡 𝑔𝑎𝑖𝑛 (𝑊ℎ𝑚2𝑑𝑎𝑦)
A= Window area (𝑚2) S= Solar gain W/𝑚2day
Cs= Correction factor for shading CA= Correction factor for absorption
15
CIBSE guide B: The Chartered Institution of Building Services Engineers Guide B, Heating, ventilating, air
conditioning and refrigeration chp1, pg 15, equ 1.3. 16 Klimatdata för Sverige, Statens institute för Byggnadslorskning. 17
Dwelling Energy Assessment Procedure manual, chp6, page 31.
Jan Feb Mar Apr May Jun Jul Aug Sep Oct Nov Dec
Gävle -5.1 -4.9 -2.2 3.3 8.7 13.8 16.6 15.3 10.7 5.3 0.9 -2.15
Average temperature (˚C) for
a yearLocation
Monthly Average temperature (˚C)

20
Table 3 𝑺𝒐𝒍𝒂𝒓 𝒉𝒆𝒂𝒕 𝒈𝒂𝒊𝒏 (𝑾𝒉/𝒎𝟐/𝒅𝒂𝒚)18
Table 4 Calculation factors for windows according to cloudy days18
Table 5 Calculation factors for windows according to sun radiation18
Once the above result is calculated it is than multiplied by the number of day in that month.
18
Information given by the supervisor.
Latitude 60˚N
Month -180 -150 -120 -90 -60 -30 0 30 60 90 120 150
0 130 130 160 550 1440 2360 2710 2360 1440 550 160 130
10 70 70 70 90 140 180 200 180 140 90 70 70
0 370 370 640 1550 2900 4280 4880 4280 2900 1550 640 370
10 340 340 400 1030 2240 3530 4020 4530 2240 1030 400 340
0 730 900 1720 3050 4520 5740 6320 5740 4520 3050 1720 900
10 710 730 1290 2460 3920 5290 5970 5290 3920 2460 1290 730
0 1350 1990 3320 4750 5850 6370 6410 6370 5850 4760 3320 1990
10 1170 1640 2810 4220 5420 6160 6390 6160 5420 4220 2810 1640
0 2350 3050 4460 5630 6150 5980 5730 5980 6150 5630 4460 3050
10 1840 2570 3910 5130 5840 5920 5710 5920 5840 5130 3910 2570
0 3210 3870 5320 6190 6350 5820 5460 5820 6350 6190 5230 3870
10 2420 3180 4570 5650 6070 5790 5430 5790 6070 5650 4570 3180
0 2830 3510 4910 5960 6280 5820 5580 5890 6280 5960 4910 3510
10 2270 3020 4410 5540 6050 5870 5560 5870 6050 5540 4410 3020
0 1700 2380 3720 5020 5850 6070 5970 6070 5850 5020 3720 2380
10 1400 2020 3240 4550 5520 5950 5940 5950 5520 4550 3240 2020
0 900 1230 2200 3520 4820 5760 6130 5760 4820 3520 2200 1230
10 880 1070 1930 3200 4530 5580 6080 5580 4530 3200 1930 1070
0 510 530 1010 2110 3570 4960 5620 4960 3570 2110 1010 530
10 470 480 650 1500 2850 4290 4870 4290 2850 1500 650 480
0 200 200 270 840 1910 3040 3480 3040 1910 840 270 200
10 160 160 160 300 990 1590 1810 1590 990 300 160 160
0 80 80 90 350 1060 1770 2030 1770 1060 350 90 60
10 40 40 50 60 90 120 130 120 90 60 50 40
N E S N
Jul
Aug
Sep
Oct
Nov
Dec
Jan
Feb
Mar
Apr
May
Jun
Month Calculation factor
Jan 0.45
Feb 0.49
Mar 0.58
Apr 0.58
May 0.63
Jun 0.61
Jul 0.61
Aug 0.59
Sep 0.58
Oct 0.51
Nov 0.42
Dec 0.43
Window type U-value Calculation factor
1-glass, normally 5.4 0.9
2-glass, normally 2.9-3.0 0.8
3-glass, normally 1.9-2.0 0.72
Special glass 1.0-1.5 0.69
2-glass, energy glass 1.0-1.5 0.7
21
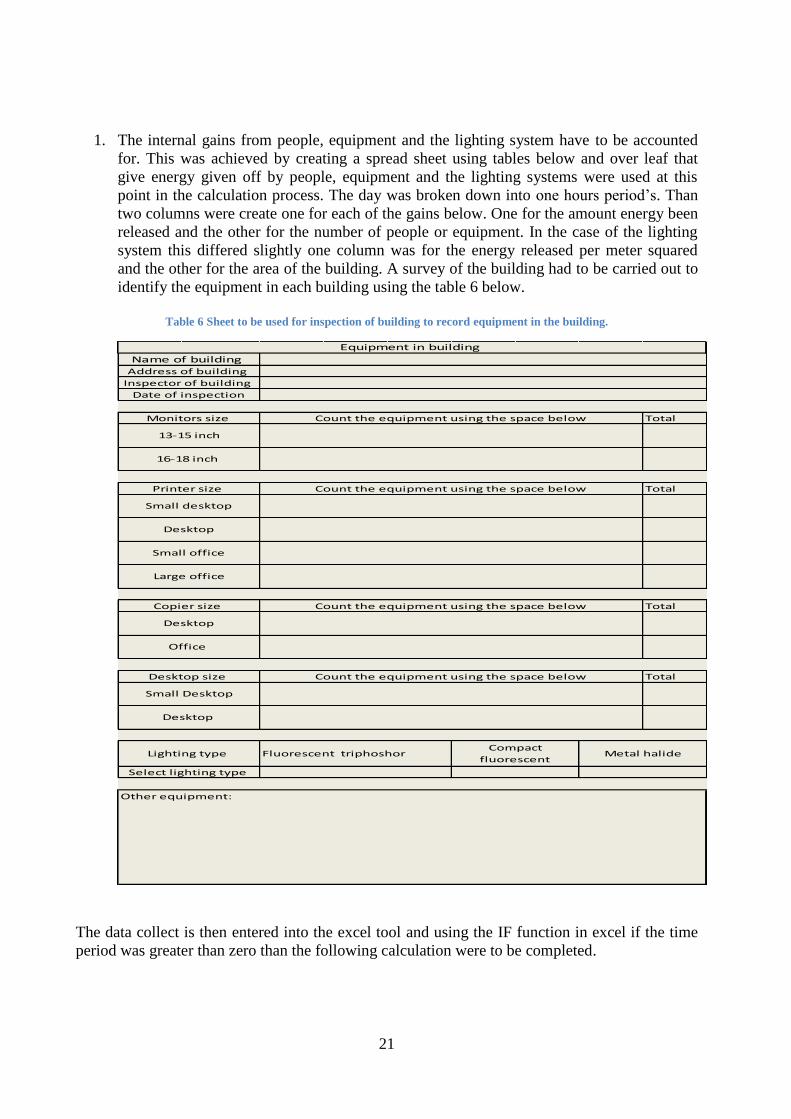
1. The internal gains from people, equipment and the lighting system have to be accounted
for. This was achieved by creating a spread sheet using tables below and over leaf that
give energy given off by people, equipment and the lighting systems were used at this
point in the calculation process. The day was broken down into one hours period’s. Than
two columns were create one for each of the gains below. One for the amount energy been
released and the other for the number of people or equipment. In the case of the lighting
system this differed slightly one column was for the energy released per meter squared
and the other for the area of the building. A survey of the building had to be carried out to
identify the equipment in each building using the table 6 below.
Table 6 Sheet to be used for inspection of building to record equipment in the building.
The data collect is then entered into the excel tool and using the IF function in excel if the time
period was greater than zero than the following calculation were to be completed.
Total
Total
Total
Total
Fluorescent triphoshor
Select lighting type
Other equipment:
Desktop
Lighting type Compact
fluorescent Metal halide
Small Desktop
Desktop size Count the equipment using the space below
Copier size Count the equipment using the space below
Desktop
Office
Small office
Large office
Small desktop
Desktop
16-18 inch
Printer size Count the equipment using the space below
Count the equipment using the space below
13-15 inch
Date of inspection
Monitors size
Equipment in building
Name of building Address of building
Inspector of building
22
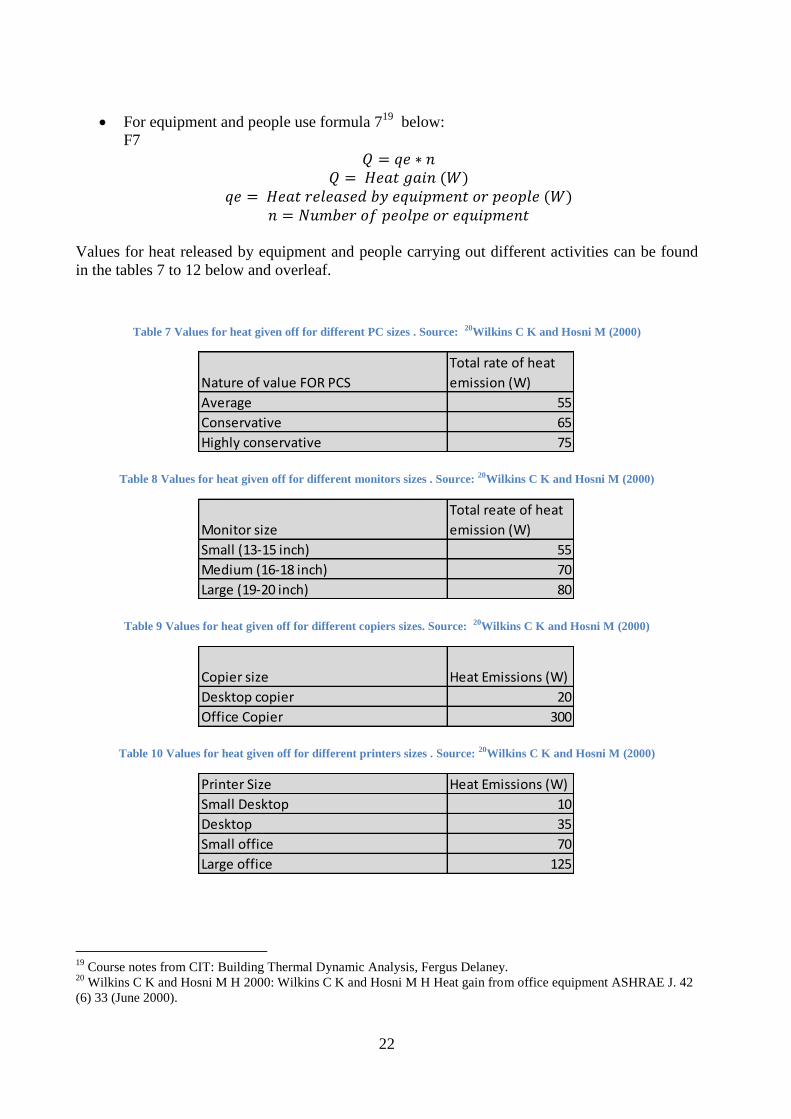
For equipment and people use formula 719
below:
F7
𝑄 = 𝑞𝑒 ∗ 𝑛
𝑄 = 𝐻𝑒𝑎𝑡 𝑔𝑎𝑖𝑛 (𝑊)
𝑞𝑒 = 𝐻𝑒𝑎𝑡 𝑟𝑒𝑙𝑒𝑎𝑠𝑒𝑑 𝑏𝑦 𝑒𝑞𝑢𝑖𝑝𝑚𝑒𝑛𝑡 𝑜𝑟 𝑝𝑒𝑜𝑝𝑙𝑒 (𝑊)
𝑛 = 𝑁𝑢𝑚𝑏𝑒𝑟 𝑜𝑓 𝑝𝑒𝑜𝑙𝑝𝑒 𝑜𝑟 𝑒𝑞𝑢𝑖𝑝𝑚𝑒𝑛𝑡
Values for heat released by equipment and people carrying out different activities can be found
in the tables 7 to 12 below and overleaf.
Table 7 Values for heat given off for different PC sizes . Source: 20Wilkins C K and Hosni M (2000)
Table 8 Values for heat given off for different monitors sizes . Source: 20Wilkins C K and Hosni M (2000)
Table 9 Values for heat given off for different copiers sizes. Source: 20Wilkins C K and Hosni M (2000)
Table 10 Values for heat given off for different printers sizes . Source: 20Wilkins C K and Hosni M (2000)
19
Course notes from CIT: Building Thermal Dynamic Analysis, Fergus Delaney. 20
Wilkins C K and Hosni M H 2000: Wilkins C K and Hosni M H Heat gain from office equipment ASHRAE J. 42
(6) 33 (June 2000).
Nature of value FOR PCS
Total rate of heat
emission (W)
Average 55
Conservative 65
Highly conservative 75
Monitor size
Total reate of heat
emission (W)
Small (13-15 inch) 55
Medium (16-18 inch) 70
Large (19-20 inch) 80
Copier size Heat Emissions (W)
Desktop copier 20
Office Copier 300
Printer Size Heat Emissions (W)
Small Desktop 10
Desktop 35
Small office 70
Large office 125
23
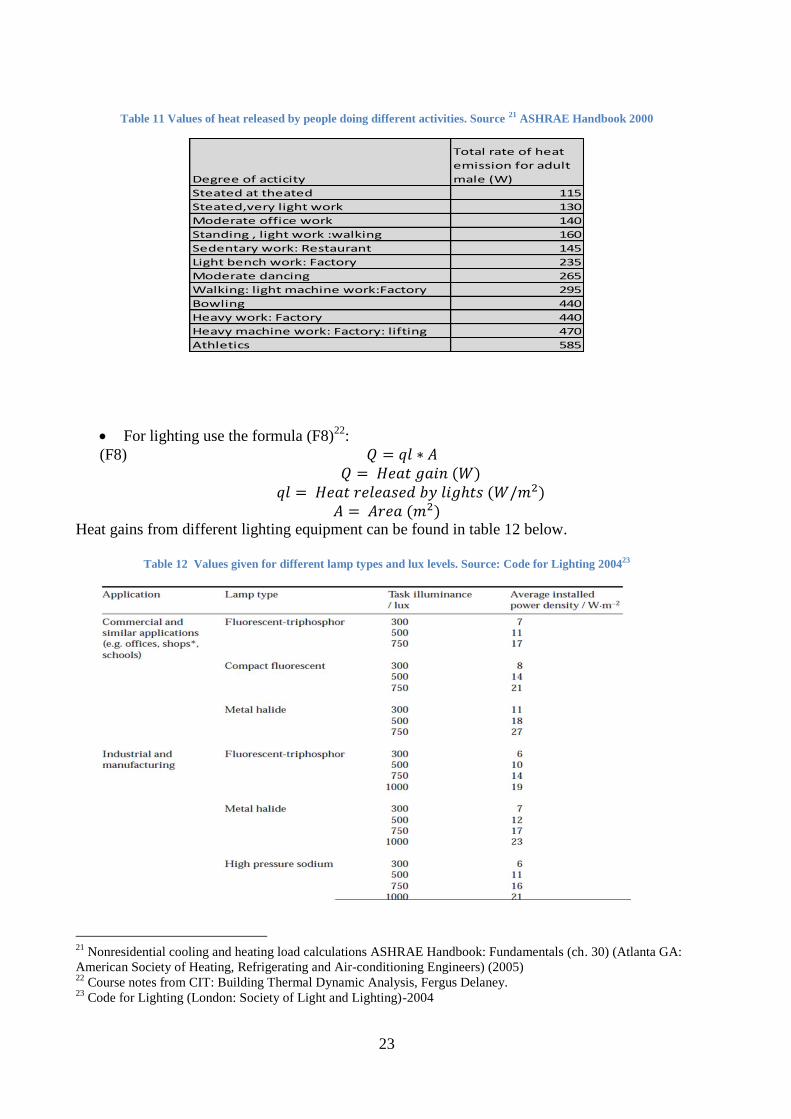
Table 11 Values of heat released by people doing different activities. Source 21 ASHRAE Handbook 2000
For lighting use the formula (F8)22
:
(F8) 𝑄 = 𝑞𝑙 ∗ 𝐴
𝑄 = 𝐻𝑒𝑎𝑡 𝑔𝑎𝑖𝑛 (𝑊)
𝑞𝑙 = 𝐻𝑒𝑎𝑡 𝑟𝑒𝑙𝑒𝑎𝑠𝑒𝑑 𝑏𝑦 𝑙𝑖𝑔ℎ𝑡𝑠 (𝑊/𝑚2)
𝐴 = 𝐴𝑟𝑒𝑎 (𝑚2) Heat gains from different lighting equipment can be found in table 12 below.
Table 12 Values given for different lamp types and lux levels. Source: Code for Lighting 200423
21
Nonresidential cooling and heating load calculations ASHRAE Handbook: Fundamentals (ch. 30) (Atlanta GA:
American Society of Heating, Refrigerating and Air-conditioning Engineers) (2005) 22
Course notes from CIT: Building Thermal Dynamic Analysis, Fergus Delaney. 23
Code for Lighting (London: Society of Light and Lighting)-2004
Degree of acticity
Total rate of heat
emission for adult
male (W)
Steated at theated 115
Steated,very light work 130
Moderate office work 140
Standing , light work :walking 160
Sedentary work: Restaurant 145
Light bench work: Factory 235
Moderate dancing 265
Walking: light machine work:Factory 295
Bowling 440
Heavy work: Factory 440
Heavy machine work: Factory: lifting 470
Athletics 585

24
2. The energy loss due to infiltration is calculated using the following steps and formulas F9
to F1124
below.
Step 1: Calculate surface area of the internal structures and volume of the building using
these formulas.
F9
𝑆 = (2 ∗ (𝑊 + 𝐿) ∗ 𝐻) + (𝐿 ∗ 𝑊)
𝑆 = 𝑆𝑢𝑟𝑓𝑎𝑐𝑒 𝑎𝑟𝑒𝑎 (𝑚2)
𝑊 = 𝑊𝑖𝑑ℎ𝑡 (𝑚) 𝐿 = 𝐿𝑒𝑛𝑔ℎ𝑡 (𝑚)
𝐻 = 𝐻𝑖𝑒𝑔ℎ𝑡 (𝑚)
𝑉 = 𝐿 ∗ 𝑊 ∗ 𝐻
𝑉 = 𝑉𝑜𝑙𝑢𝑚𝑒 (𝑚3)
𝐿, 𝑊 𝑎𝑛𝑑 𝐻 𝑎𝑟𝑒 𝑡ℎ𝑒 𝑠𝑎𝑚𝑒 𝑎𝑠 𝑎𝑏𝑜𝑣𝑒
Step 2 is using the information form the step 1 to calculate the air infiltration rate for the
building using the formula (F10) below:
F10
𝐼 =1
20∗
𝑆
𝑉∗
𝑄50
𝑆
𝐼 = 𝐼𝑛𝑓𝑖𝑙𝑡𝑟𝑎𝑡𝑖𝑜𝑛 𝑟𝑎𝑡𝑒 (𝐴𝐶𝐻−1)
𝑆 = 𝑆𝑢𝑟𝑓𝑎𝑐𝑒 𝑎𝑟𝑒𝑎 (𝑚2 )
𝑉 = 𝑉𝑜𝑙𝑢𝑚𝑒 (𝑚3)
𝑄50
𝑆= 𝐴𝑖𝑟 𝑙𝑒𝑎𝑘𝑎𝑔𝑒 𝑖𝑛𝑑𝑒𝑥 (
𝑚3
ℎ)
Step 3 Use the results from the previous steps to calculate the heat loss from infiltration
by using the formula below:
F(11)
𝑄𝑖𝑛 = 1
3∗ 𝐼 ∗ 𝑉 ∗ ∆𝑇
𝑄𝑖𝑛 = 𝐻𝑒𝑎𝑡 𝑙𝑜𝑠𝑠 𝑑𝑢𝑒 𝑡𝑜 𝑖𝑛𝑓𝑖𝑙𝑡𝑟𝑎𝑡𝑖𝑜𝑛 (𝑊)
𝐼 = 𝐼𝑛𝑓𝑖𝑙𝑡𝑟𝑎𝑡𝑖𝑜𝑛 𝑟𝑎𝑡𝑒 (𝐴𝐶𝐻−1)
∆𝑇 = 𝐷𝑖𝑓𝑓𝑒𝑟𝑛𝑐𝑒 𝑖𝑛 𝑡𝑒𝑚𝑝𝑒𝑟𝑎𝑡𝑢𝑟𝑒 (°C)
𝑉 = 𝑉𝑜𝑙𝑢𝑚𝑒 (𝑚3)
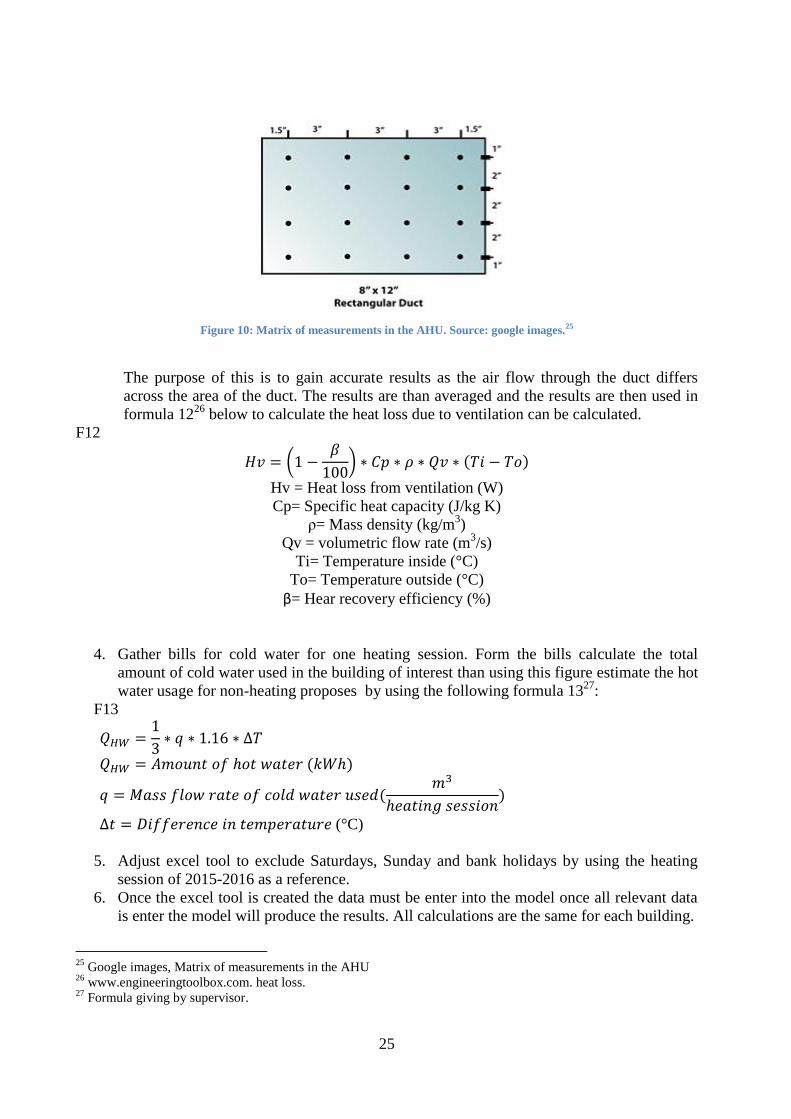
3. Heat loss from ventilation. The air flow in the AHU must be measured using an multi-
function anemometers. The below image shows an matrix of measurements in a AHU.
Four holes are drilled into the side of the duct equally spaced apart and at each hole four
measurements are taking to from a matrix of measurements as seen in the figure 10
overleaf.
24
CIBSE TM 23 2000 : The Chartered Institution of Building Services Engineers TM 23 testing building for air
leakage 2000,ISBN 1903287103
25
Figure 10: Matrix of measurements in the AHU. Source: google images.25
The purpose of this is to gain accurate results as the air flow through the duct differs
across the area of the duct. The results are than averaged and the results are then used in
formula 1226
below to calculate the heat loss due to ventilation can be calculated.
F12
𝐻𝑣 = (1 −𝛽
100) ∗ 𝐶𝑝 ∗ 𝜌 ∗ 𝑄𝑣 ∗ (𝑇𝑖 − 𝑇𝑜)
Hv = Heat loss from ventilation (W)
Cp= Specific heat capacity (J/kg K)
ρ= Mass density (kg/m3)
Qv = volumetric flow rate (m3/s)
Ti= Temperature inside (°C)
To= Temperature outside (°C)
β= Hear recovery efficiency (%)
4. Gather bills for cold water for one heating session. Form the bills calculate the total
amount of cold water used in the building of interest than using this figure estimate the hot
water usage for non-heating proposes by using the following formula 1327
:
F13
𝑄𝐻𝑊 =1
3∗ 𝑞 ∗ 1.16 ∗ ∆𝑇
𝑄𝐻𝑊 = 𝐴𝑚𝑜𝑢𝑛𝑡 𝑜𝑓 ℎ𝑜𝑡 𝑤𝑎𝑡𝑒𝑟 (𝑘𝑊ℎ)
𝑞 = 𝑀𝑎𝑠𝑠 𝑓𝑙𝑜𝑤 𝑟𝑎𝑡𝑒 𝑜𝑓 𝑐𝑜𝑙𝑑 𝑤𝑎𝑡𝑒𝑟 𝑢𝑠𝑒𝑑(𝑚3
ℎ𝑒𝑎𝑡𝑖𝑛𝑔 𝑠𝑒𝑠𝑠𝑖𝑜𝑛)
∆𝑡 = 𝐷𝑖𝑓𝑓𝑒𝑟𝑒𝑛𝑐𝑒 𝑖𝑛 𝑡𝑒𝑚𝑝𝑒𝑟𝑎𝑡𝑢𝑟𝑒 (°C)
5. Adjust excel tool to exclude Saturdays, Sunday and bank holidays by using the heating
session of 2015-2016 as a reference.
6. Once the excel tool is created the data must be enter into the model once all relevant data
is enter the model will produce the results. All calculations are the same for each building.
25
Google images, Matrix of measurements in the AHU 26
www.engineeringtoolbox.com. heat loss. 27
Formula giving by supervisor.

26
7. Create an energy balance using the results from the previous steps.
8. Using the energy balance investigate areas where improvements can be carried out to
improve on energy usage of all three building.
9. Carry out a visual inspection to determine whether improvements can be made in the
following areas:
Insulation on pipes and ducts.
Fix holes, gaps and cracks on the envelope of the building.
If maintenance can be improved on the equipment.
The following is a list of engineering documents and software package used to complete this
paper:
1. Microsoft word and excel
2. Documents given by the supervisor Roland Forsberg.
3. The Chartered Institution of Building Services Engineers Guide A- Environmental design
(CISBE Guide A- Environmental design)
4. The Chartered Institution of Building Services Engineers Guide F- Energy efficiency in
buildings (CIBSE Guide F- efficiency in buildings)
The following instruments were used:
1. Multi-function anemometers: To measure air velocity in side duct.
2. Digital capture hood: to measure air velocity from supply or extract diffuser.
3. Architectural scale rulers to measure lengths and heights of wall, windows and door on
cad drawings.
The following word key words or phrases were used to search for information using google:
Energy mapping.
Infiltration heat losses.
Ventilation heat losses.
Air exchange rates for buildings.
Wind speed and direction for Gävle.
Insulation suppliers in Sweden.
Energy benchmarks for building in Sweden.
The following assumption was made in order to complete the thesis:
1. The heating session is from the start of the 3rd
week of September to end of the 2nd
week
of May.
2. Heat loss calculation for one month due to transmittance is consent for each month.
3. Solar gains calculated for one day remains consent throughout a given month.
4. The velocity of air in the ducts remains consent all year round.
5. Temperature in the buildings is set at 21 for the winter months.
6. Internal gains calculated for a day remains consent for the enter heating session.
7. Equipment such as printers, PCs photocopiers are assumed to be on idle.
8. Equipment in the office excluding the heating system will only operate during the building
occupancy time.
9. Swing in temperatures and gains are not included in the model.
10. No smoking in buildings which would decrease the demand on the ventilation system.

27
11. An extra 15% Heat loss for roofs should be added because of heat loss due to radiation to
space. As advised by the supervisor.
12. Since there no heating in the basement or the attic this means this spaces will be treated as
unheated spaces which means they will be the same temperature as the outside air.
13. The air leakage index will be assumed to be 5 m3h
28.
14. The AHU supplies air to meet all room with efficient clean air to maintain good air quality
including the toilets so there’s no need to measures the extract fans in toilets.
.
28
CIBSE TM 23 2000 : The Chartered Institution of Building Services Engineers TM 23 testing building for air
leakage 2000,ISBN 1903287103.

28
29
4. Process and results Go to the flow chart in appendix B to see a visual representation of the energy systems. It shows
that all the heat required for the building comes from the heat pump and district heating system.
The use of heat exchanger helps to reduce the load on the heat pump and district heating system.
The thermal wheel lowers the need for heating in the AHU by using the heat form the exhaust
duct to heat the air in the supply duct. The hot water return from duct is than heated up again by
the use of the heat exchanger and used for hot water in the building.
4.1 Skutskärs Vårdcentral, Folktandvården building
Once all information was gather and the tool competed the following results were obtained. All
inputs can be found in appendix C for the results and calculations of this section. The formula
below was used at first to calculated heat loss due to infiltration but once results were obtained it
could be seen that this formula was not suitable or accurate enough for this thesis. There are
many formula out there to calculate the heat loss due to infiltration and may take trial and error
before finding a suitable one if no pressure test been carried out. After searching and reading
many engineering documents the method descried in the method section of this report see step 7
pages 14 and 15 was the best without having a pressure test for the building. Care must be taking
when this method is used by the person carry out the calculations as the results may
underestimate or overestimate the results.
𝐻𝑖 = 𝑐𝑝 ∗ 𝜌 ∗ 𝑛 ∗ 𝑣 ∗ (𝑇𝑖 − 𝑇𝑜)
Hi = Heat loss from infiltration (W)
Cp= specific heat capacity (J/kg K)
ρ= Mass density (kg/m3)
n= Number of air changes per hour
v= Volume (m3)
Ti= Temperature inside (°C)
To= temperature outside (°C)
Once the first simulation was completed the total gains and losses are were 1068510265 kWh
per heating session which is too high for the building size.
By rechecking the calculation it was discovered that the results were calculated in kWs once this
was notice it was easy to covert the results to kWh using the excel tool instead of calculating the
kW by the number of seconds in a heating session it should be calculated by the number of hours
the equipment is operational in a heating session.
Even thou the calculation were extremely high the results for the energy balance can be used to
see if any results is unusual as the same mistake was made in all calculation. The energy balance
was as expected except for the results for solar gains were far below to what was expected.
While inspecting the solar gains excel sheet used to calculate the solar gains it was discovered
that the kW was added instead of kWh explaining why it only made up less than 1% of the total
gains.
30
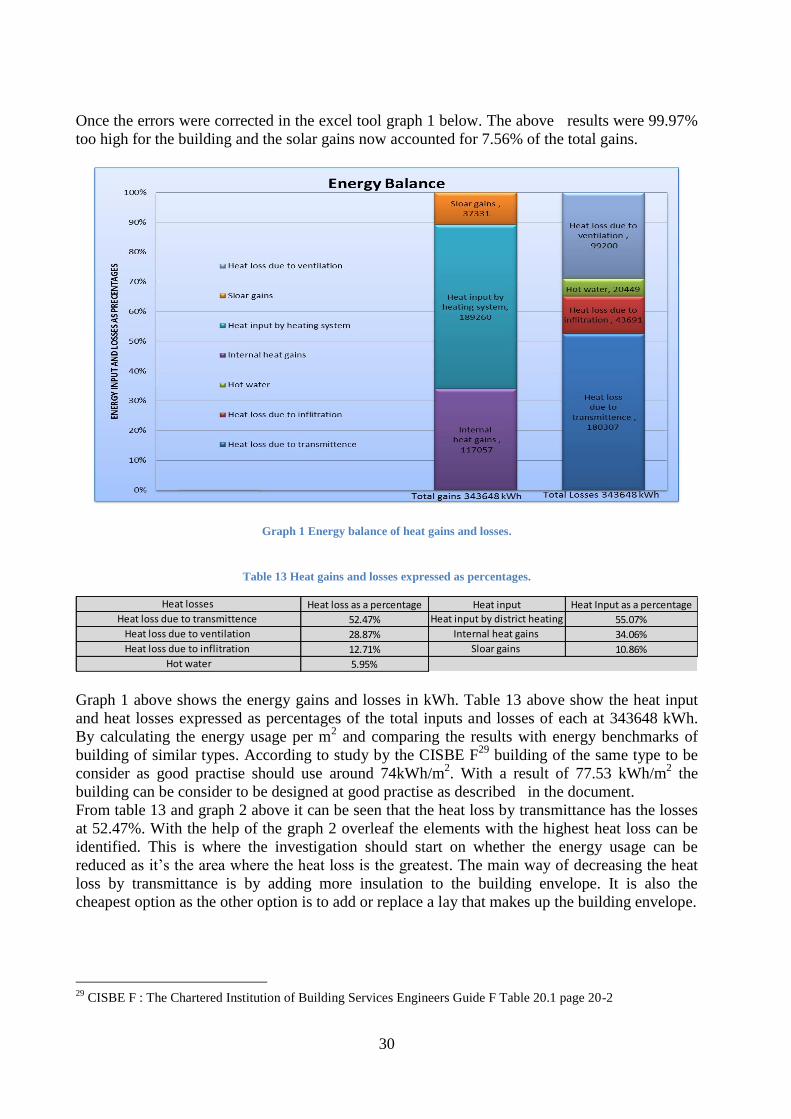
Once the errors were corrected in the excel tool graph 1 below. The above results were 99.97%
too high for the building and the solar gains now accounted for 7.56% of the total gains.
Graph 1 Energy balance of heat gains and losses.
Table 13 Heat gains and losses expressed as percentages.
Graph 1 above shows the energy gains and losses in kWh. Table 13 above show the heat input
and heat losses expressed as percentages of the total inputs and losses of each at 343648 kWh.
By calculating the energy usage per m2 and comparing the results with energy benchmarks of
building of similar types. According to study by the CISBE F29
building of the same type to be
consider as good practise should use around 74kWh/m2. With a result of 77.53 kWh/m
2 the
building can be consider to be designed at good practise as described in the document.
From table 13 and graph 2 above it can be seen that the heat loss by transmittance has the losses
at 52.47%. With the help of the graph 2 overleaf the elements with the highest heat loss can be
identified. This is where the investigation should start on whether the energy usage can be
reduced as it’s the area where the heat loss is the greatest. The main way of decreasing the heat
loss by transmittance is by adding more insulation to the building envelope. It is also the
cheapest option as the other option is to add or replace a lay that makes up the building envelope.
29
CISBE F : The Chartered Institution of Building Services Engineers Guide F Table 20.1 page 20-2
Heat loss as a percentage Heat Input as a percentage
52.47% 55.07%
28.87% 34.06%
12.71% 10.86%
5.95%
Sloar gains
Heat loss due to ventilation
Heat loss due to inflitration
Hot water
Heat input
Internal heat gains
Heat losses
Heat loss due to transmittence Heat input by district heating
31
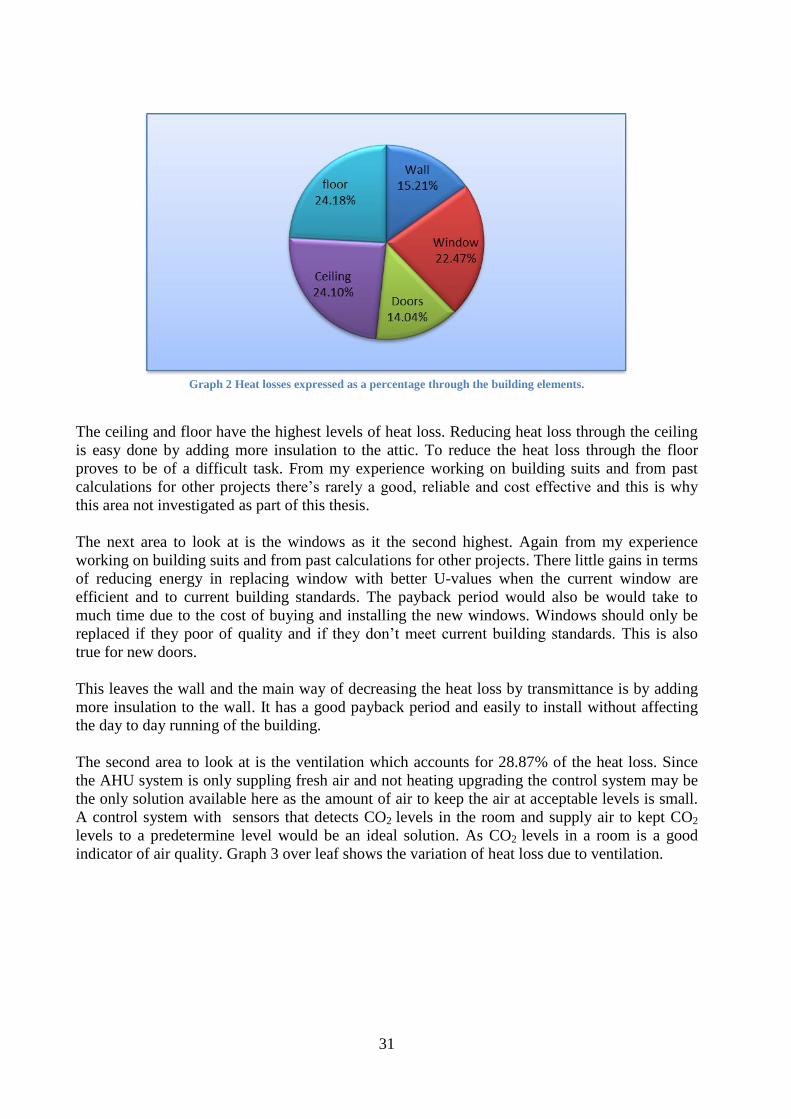
Graph 2 Heat losses expressed as a percentage through the building elements.
The ceiling and floor have the highest levels of heat loss. Reducing heat loss through the ceiling
is easy done by adding more insulation to the attic. To reduce the heat loss through the floor
proves to be of a difficult task. From my experience working on building suits and from past
calculations for other projects there’s rarely a good, reliable and cost effective and this is why
this area not investigated as part of this thesis.
The next area to look at is the windows as it the second highest. Again from my experience
working on building suits and from past calculations for other projects. There little gains in terms
of reducing energy in replacing window with better U-values when the current window are
efficient and to current building standards. The payback period would also be would take to
much time due to the cost of buying and installing the new windows. Windows should only be
replaced if they poor of quality and if they don’t meet current building standards. This is also
true for new doors.
This leaves the wall and the main way of decreasing the heat loss by transmittance is by adding
more insulation to the wall. It has a good payback period and easily to install without affecting
the day to day running of the building.
The second area to look at is the ventilation which accounts for 28.87% of the heat loss. Since
the AHU system is only suppling fresh air and not heating upgrading the control system may be
the only solution available here as the amount of air to keep the air at acceptable levels is small.
A control system with sensors that detects CO2 levels in the room and supply air to kept CO2
levels to a predetermine level would be an ideal solution. As CO2 levels in a room is a good
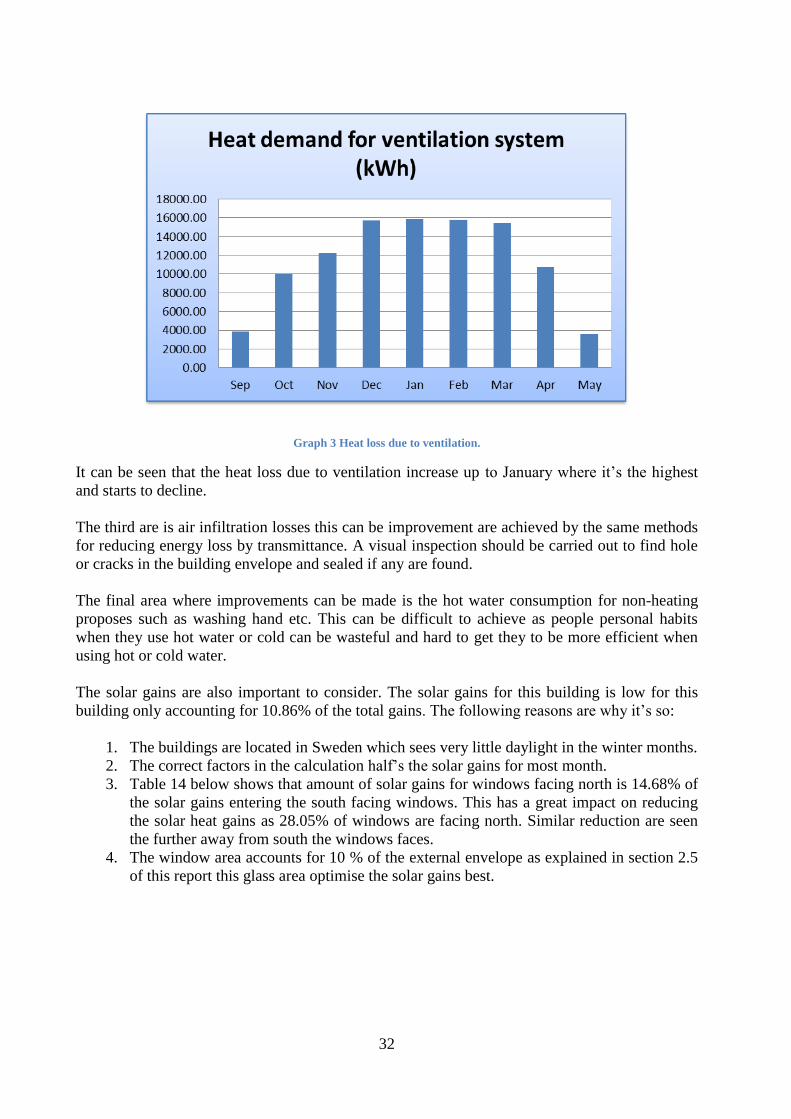
indicator of air quality. Graph 3 over leaf shows the variation of heat loss due to ventilation.
32
Graph 3 Heat loss due to ventilation.
It can be seen that the heat loss due to ventilation increase up to January where it’s the highest
and starts to decline.
The third are is air infiltration losses this can be improvement are achieved by the same methods
for reducing energy loss by transmittance. A visual inspection should be carried out to find hole
or cracks in the building envelope and sealed if any are found.
The final area where improvements can be made is the hot water consumption for non-heating
proposes such as washing hand etc. This can be difficult to achieve as people personal habits
when they use hot water or cold can be wasteful and hard to get they to be more efficient when
using hot or cold water.
The solar gains are also important to consider. The solar gains for this building is low for this
building only accounting for 10.86% of the total gains. The following reasons are why it’s so:
1. The buildings are located in Sweden which sees very little daylight in the winter months.
2. The correct factors in the calculation half’s the solar gains for most month.
3. Table 14 below shows that amount of solar gains for windows facing north is 14.68% of
the solar gains entering the south facing windows. This has a great impact on reducing
the solar heat gains as 28.05% of windows are facing north. Similar reduction are seen
the further away from south the windows faces.
4. The window area accounts for 10 % of the external envelope as explained in section 2.5
of this report this glass area optimise the solar gains best.

33
Table 14 Total window area orientation expressed as a percentage.
Graph 4 below shows how the solar gains vary to the time of the year. The lowest gains are from
the months of October to February. And the highest from March to September. Note that only
half the month is calculated for the months of September and May
.
Graph 4 Monthly solar gains
It can be seen by the graph 5 over leaf that the lighting system is the main source of heat for the
internal gains supplying 84.27% of the internal gains and people being the second suppling
8.37% and the reminder by the equipment in the building.
Orentation Area (%)Solar gains for sep
(Wh/m2/day )
Percentage of solar
gain compared to
south (%)
N 28.05% 900 14.68%
NE 4.88% 2200 35.89%
NW 0.00% 2200 35.89%
E 21.95% 3520 57.42%
W 21.95% 3520 57.42%
SE 0.00% 4820 78.63%
S 23.17% 6130 100.00%
SW 0.00% 4820 78.63%

34
Graph 5 Internal gain expressed as percentage.
4.2 Library Once the inputs in appendix D were entered into the model the following results were produced.
Graph 6 Energy balance of heat gains and losses.
35
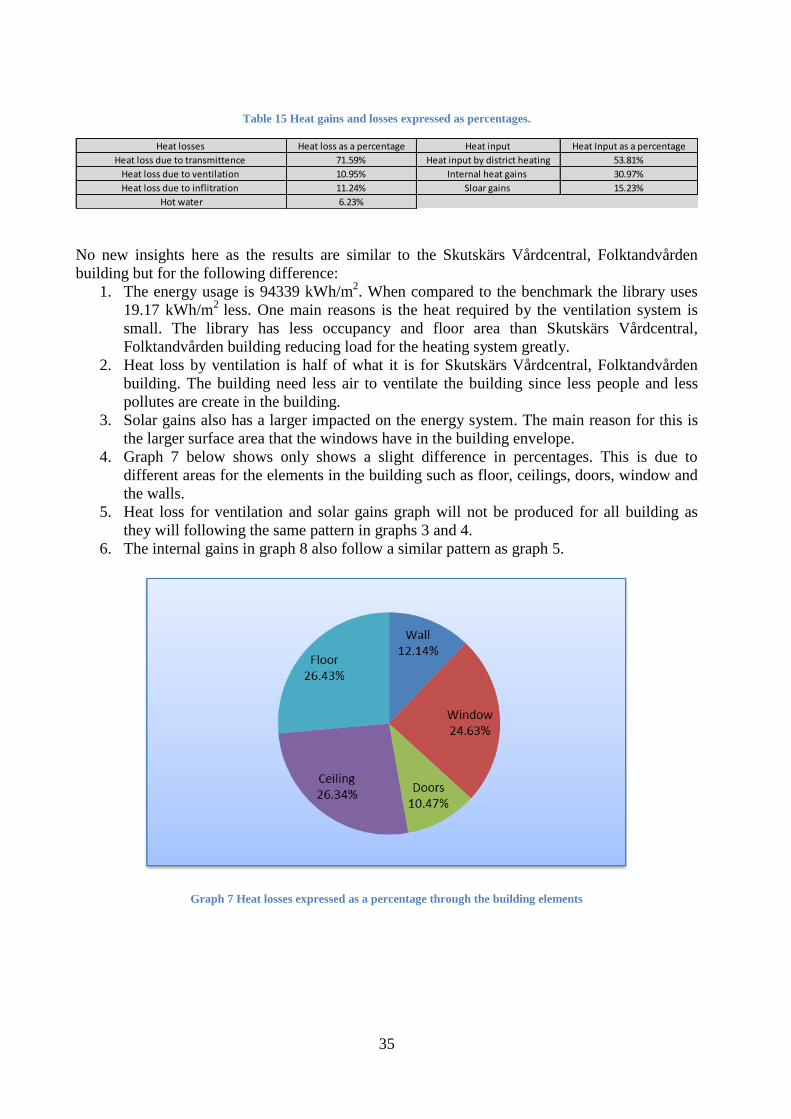
Table 15 Heat gains and losses expressed as percentages.
No new insights here as the results are similar to the Skutskärs Vårdcentral, Folktandvården
building but for the following difference:
1. The energy usage is 94339 kWh/m2. When compared to the benchmark the library uses
19.17 kWh/m2
less. One main reasons is the heat required by the ventilation system is
small. The library has less occupancy and floor area than Skutskärs Vårdcentral,
Folktandvården building reducing load for the heating system greatly.
2. Heat loss by ventilation is half of what it is for Skutskärs Vårdcentral, Folktandvården
building. The building need less air to ventilate the building since less people and less
pollutes are create in the building.
3. Solar gains also has a larger impacted on the energy system. The main reason for this is
the larger surface area that the windows have in the building envelope.
4. Graph 7 below shows only shows a slight difference in percentages. This is due to
different areas for the elements in the building such as floor, ceilings, doors, window and
the walls.
5. Heat loss for ventilation and solar gains graph will not be produced for all building as
they will following the same pattern in graphs 3 and 4.
6. The internal gains in graph 8 also follow a similar pattern as graph 5.
Graph 7 Heat losses expressed as a percentage through the building elements
Heat loss as a percentage Heat Input as a percentage
71.59% 53.81%
10.95% 30.97%
11.24% 15.23%
6.23%
Sloar gains
Heat loss due to ventilation
Heat loss due to inflitration
Hot water
Heat input
Internal heat gains
Heat losses
Heat loss due to transmittence Heat input by district heating
36
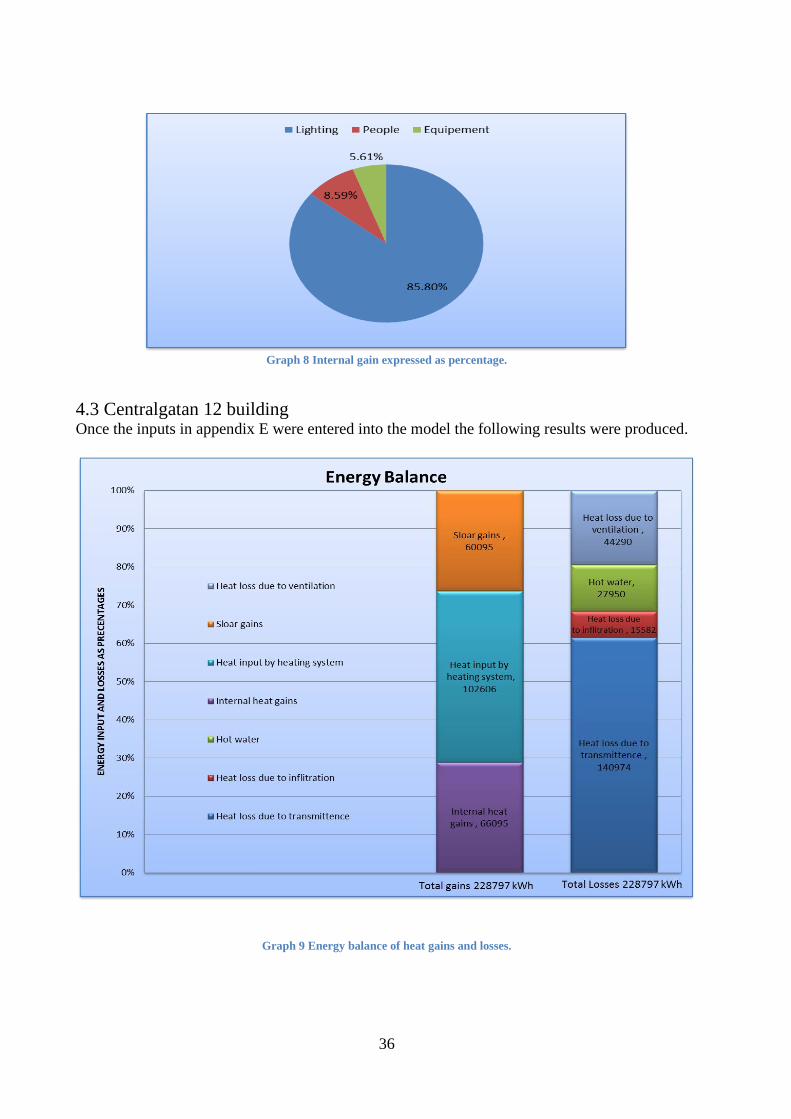
Graph 8 Internal gain expressed as percentage.
4.3 Centralgatan 12 building Once the inputs in appendix E were entered into the model the following results were produced.
Graph 9 Energy balance of heat gains and losses.
37
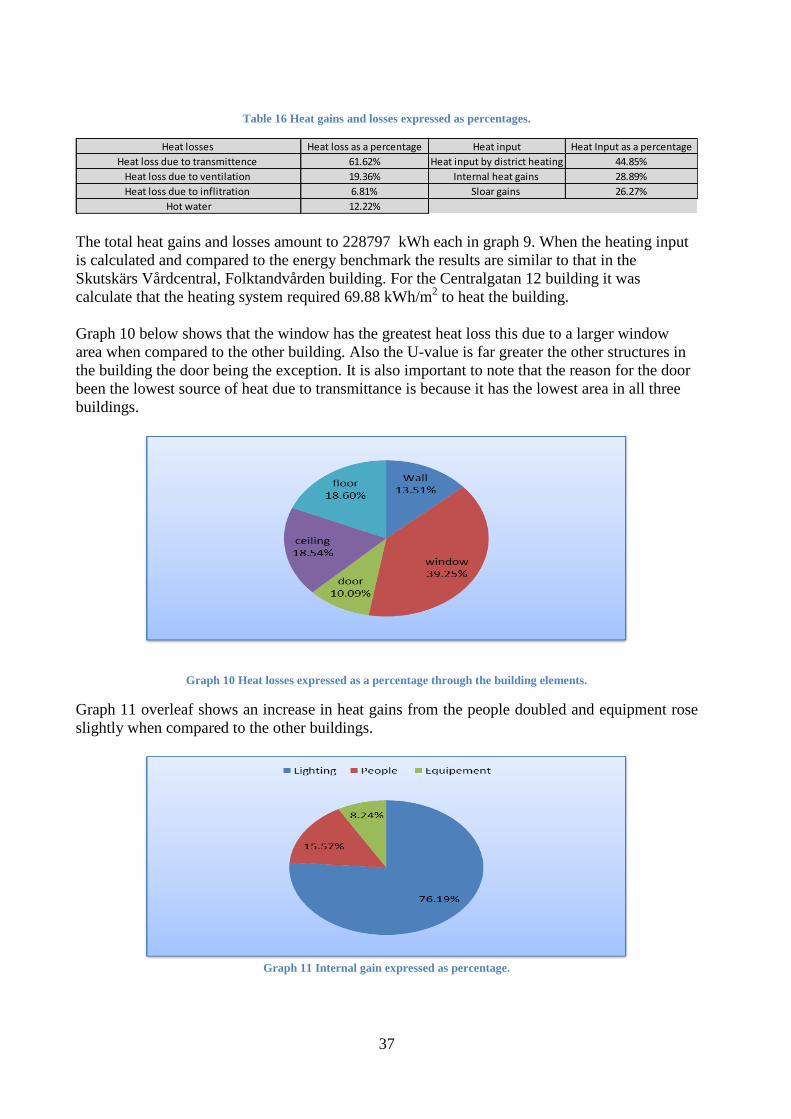
Table 16 Heat gains and losses expressed as percentages.
The total heat gains and losses amount to 228797 kWh each in graph 9. When the heating input
is calculated and compared to the energy benchmark the results are similar to that in the
Skutskärs Vårdcentral, Folktandvården building. For the Centralgatan 12 building it was
calculate that the heating system required 69.88 kWh/m2 to heat the building.
Graph 10 below shows that the window has the greatest heat loss this due to a larger window
area when compared to the other building. Also the U-value is far greater the other structures in
the building the door being the exception. It is also important to note that the reason for the door
been the lowest source of heat due to transmittance is because it has the lowest area in all three
buildings.
Graph 10 Heat losses expressed as a percentage through the building elements.
Graph 11 overleaf shows an increase in heat gains from the people doubled and equipment rose
slightly when compared to the other buildings.
Graph 11 Internal gain expressed as percentage.
Heat loss as a percentage Heat Input as a percentage
61.62% 44.85%
19.36% 28.89%
6.81% 26.27%
12.22%
Sloar gains
Heat loss due to ventilation
Heat loss due to inflitration
Hot water
Heat input
Internal heat gains
Heat losses
Heat loss due to transmittence Heat input by district heating
38
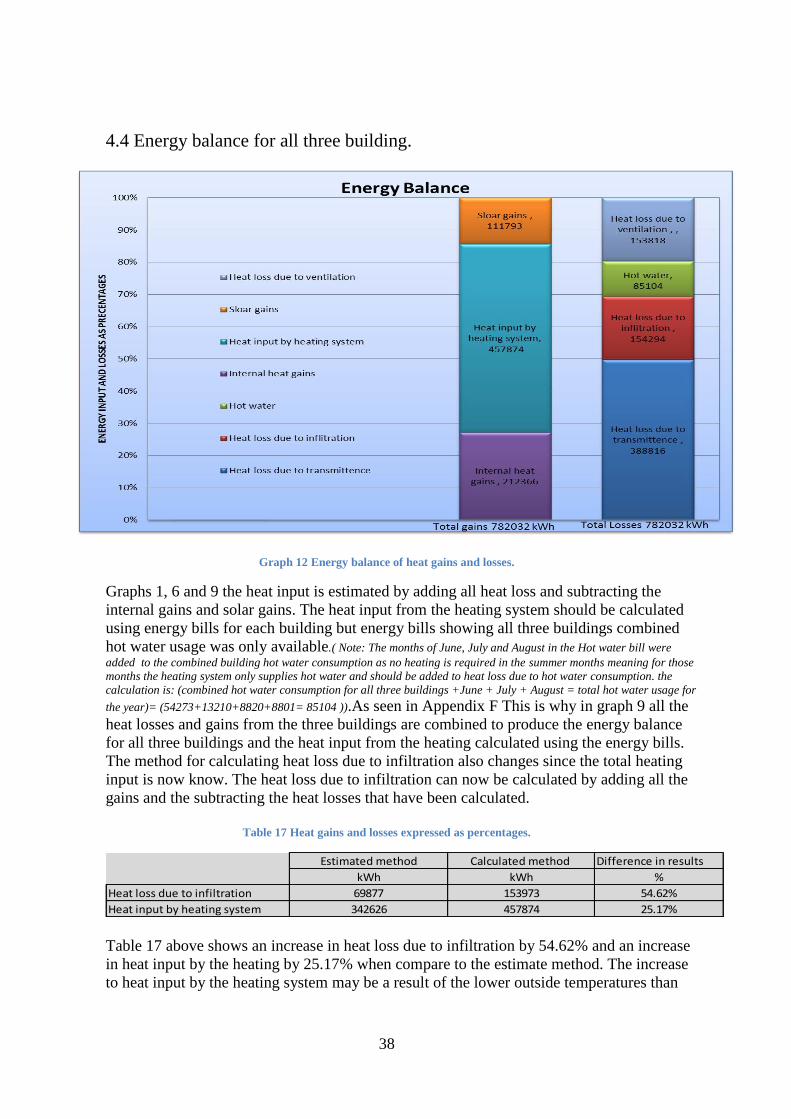
4.4 Energy balance for all three building.
Graph 12 Energy balance of heat gains and losses.
Graphs 1, 6 and 9 the heat input is estimated by adding all heat loss and subtracting the
internal gains and solar gains. The heat input from the heating system should be calculated
using energy bills for each building but energy bills showing all three buildings combined
hot water usage was only available.( Note: The months of June, July and August in the Hot water bill were
added to the combined building hot water consumption as no heating is required in the summer months meaning for those
months the heating system only supplies hot water and should be added to heat loss due to hot water consumption. the
calculation is: (combined hot water consumption for all three buildings +June + July + August = total hot water usage for
the year)= (54273+13210+8820+8801= 85104 )).As seen in Appendix F This is why in graph 9 all the
heat losses and gains from the three buildings are combined to produce the energy balance
for all three buildings and the heat input from the heating calculated using the energy bills.
The method for calculating heat loss due to infiltration also changes since the total heating
input is now know. The heat loss due to infiltration can now be calculated by adding all the
gains and the subtracting the heat losses that have been calculated.
Table 17 Heat gains and losses expressed as percentages.
Table 17 above shows an increase in heat loss due to infiltration by 54.62% and an increase
in heat input by the heating by 25.17% when compare to the estimate method. The increase
to heat input by the heating system may be a result of the lower outside temperatures than
Calculated method Difference in results
kWh
Heat loss due to infiltration 153973
Heat input by heating system 457874
Estimated method
69877
342626
kWh %
54.62%
25.17%
39
the ones used to estimate the heat input for graphs 1, 6 and 9. Also infiltration gains are
difficult to estimate may be high than those calculated in graphs 1, 6 and 9.
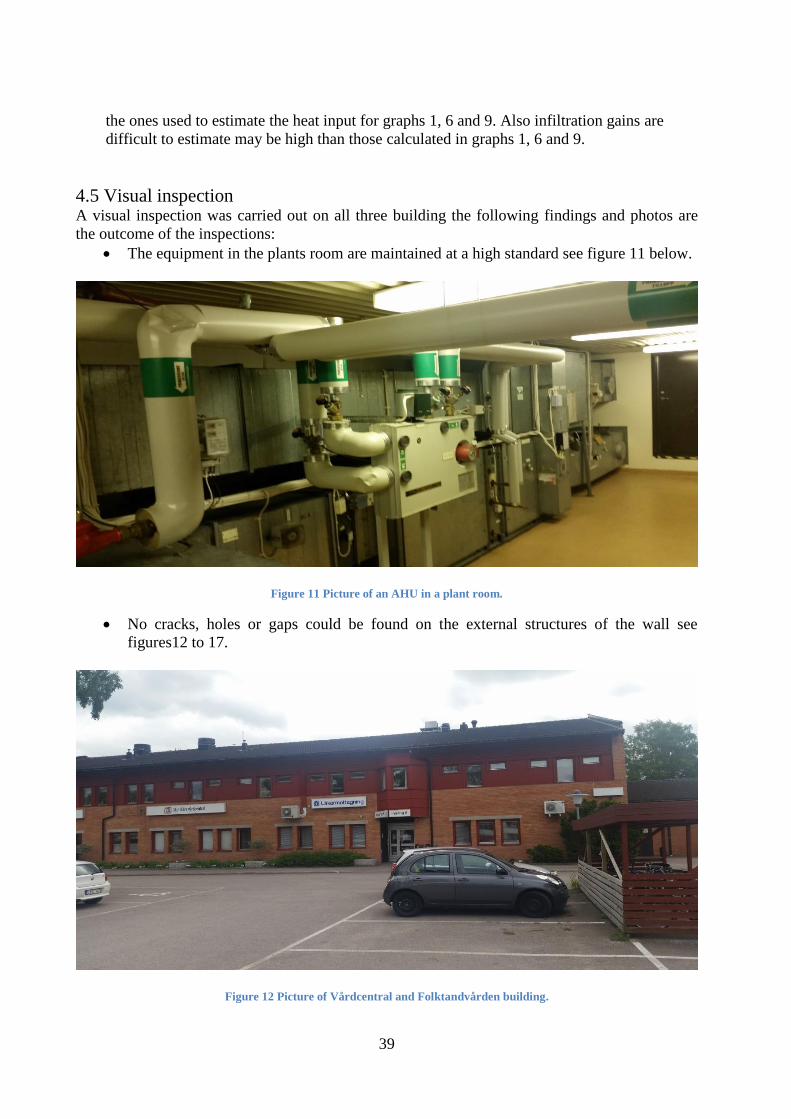
4.5 Visual inspection A visual inspection was carried out on all three building the following findings and photos are
the outcome of the inspections:
The equipment in the plants room are maintained at a high standard see figure 11 below.
Figure 11 Picture of an AHU in a plant room.
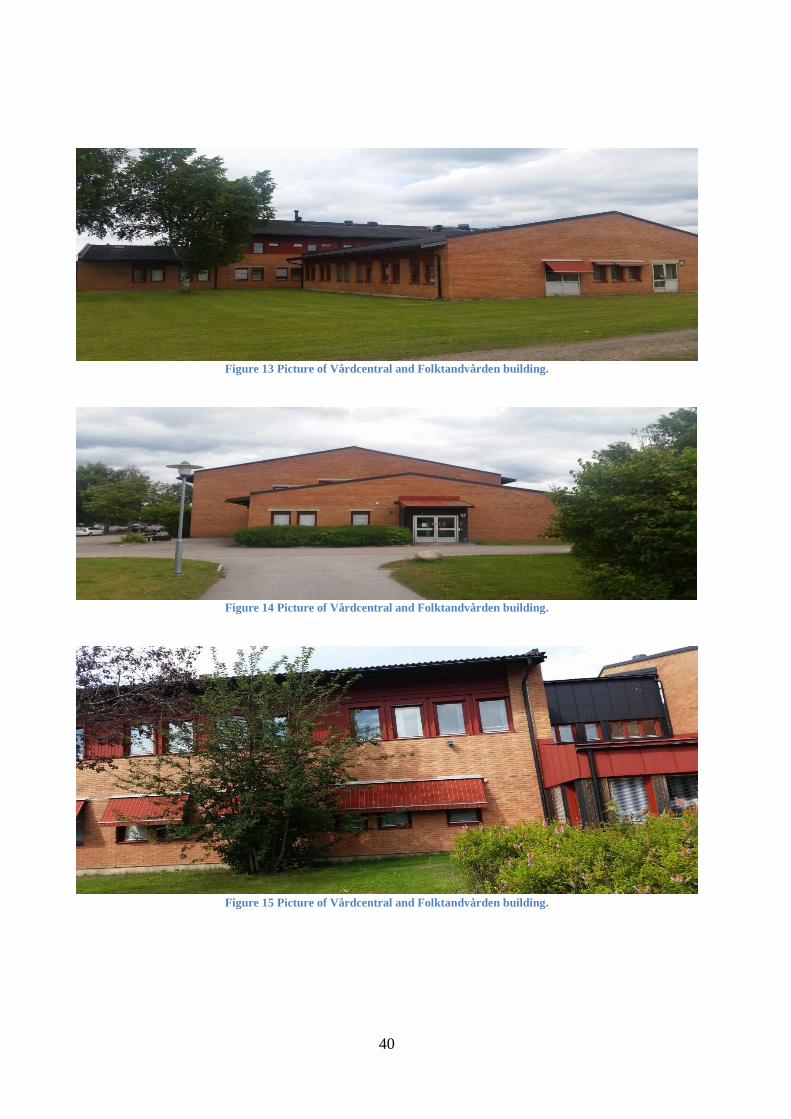
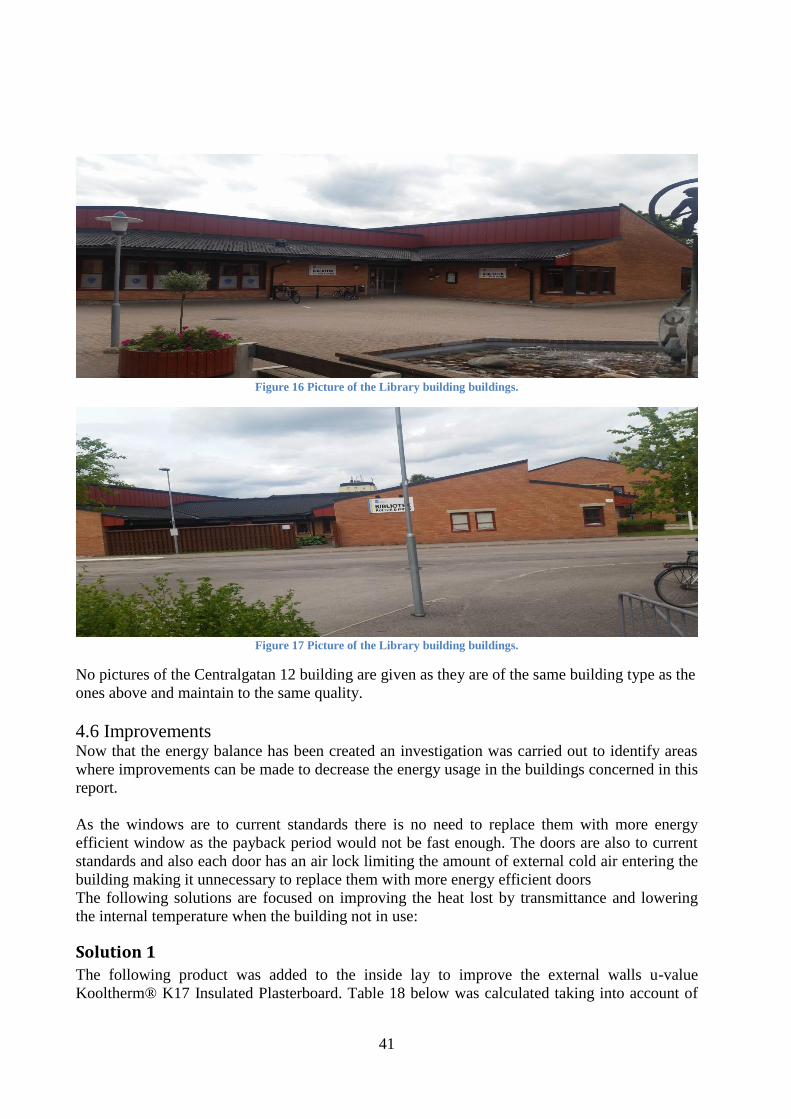
No cracks, holes or gaps could be found on the external structures of the wall see
figures12 to 17.
Figure 12 Picture of Vårdcentral and Folktandvården building.
40
Figure 13 Picture of Vårdcentral and Folktandvården building.
Figure 14 Picture of Vårdcentral and Folktandvården building.
Figure 15 Picture of Vårdcentral and Folktandvården building.
41
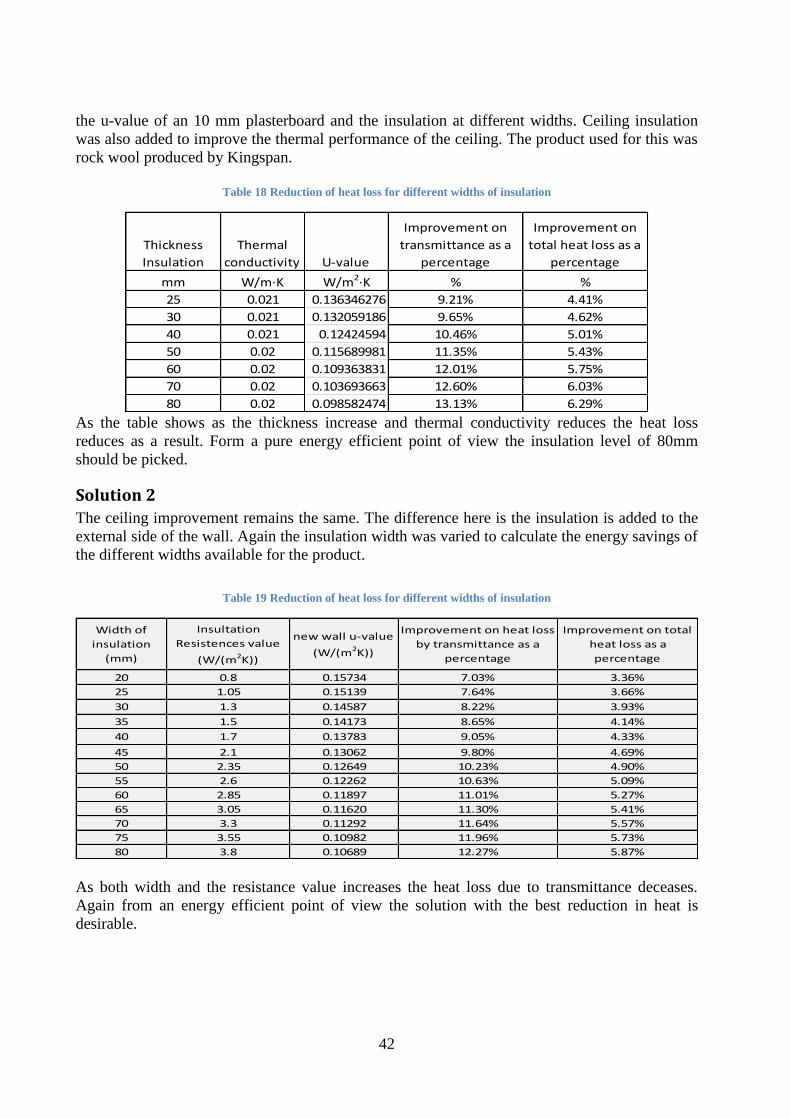
Figure 16 Picture of the Library building buildings.
Figure 17 Picture of the Library building buildings.
No pictures of the Centralgatan 12 building are given as they are of the same building type as the
ones above and maintain to the same quality.
4.6 Improvements Now that the energy balance has been created an investigation was carried out to identify areas
where improvements can be made to decrease the energy usage in the buildings concerned in this
report.
As the windows are to current standards there is no need to replace them with more energy
efficient window as the payback period would not be fast enough. The doors are also to current
standards and also each door has an air lock limiting the amount of external cold air entering the
building making it unnecessary to replace them with more energy efficient doors
The following solutions are focused on improving the heat lost by transmittance and lowering
the internal temperature when the building not in use:
Solution 1
The following product was added to the inside lay to improve the external walls u-value
Kooltherm® K17 Insulated Plasterboard. Table 18 below was calculated taking into account of
42
the u-value of an 10 mm plasterboard and the insulation at different widths. Ceiling insulation
was also added to improve the thermal performance of the ceiling. The product used for this was
rock wool produced by Kingspan.
Table 18 Reduction of heat loss for different widths of insulation
As the table shows as the thickness increase and thermal conductivity reduces the heat loss
reduces as a result. Form a pure energy efficient point of view the insulation level of 80mm
should be picked.
Solution 2
The ceiling improvement remains the same. The difference here is the insulation is added to the
external side of the wall. Again the insulation width was varied to calculate the energy savings of
the different widths available for the product.
Table 19 Reduction of heat loss for different widths of insulation
As both width and the resistance value increases the heat loss due to transmittance deceases.
Again from an energy efficient point of view the solution with the best reduction in heat is
desirable.
Thickness
Insulation
Thermal
conductivity U-value
Improvement on
transmittance as a
percentage
Improvement on
total heat loss as a
percentage
mm W/m·K W/m2·K % %
25 0.021 0.136346276 9.21% 4.41%
30 0.021 0.132059186 9.65% 4.62%
40 0.021 0.12424594 10.46% 5.01%
50 0.02 0.115689981 11.35% 5.43%
60 0.02 0.109363831 12.01% 5.75%
70 0.02 0.103693663 12.60% 6.03%
80 0.02 0.098582474 13.13% 6.29%
Width of
insulation
(mm)
Insultation
Resistences value
(W/(m2K))
new wall u-value
(W/(m2K))
Improvement on heat loss
by transmittance as a
percentage
Improvement on total
heat loss as a
percentage
20 0.8 0.15734 7.03% 3.36%
25 1.05 0.15139 7.64% 3.66%
30 1.3 0.14587 8.22% 3.93%
35 1.5 0.14173 8.65% 4.14%
40 1.7 0.13783 9.05% 4.33%
45 2.1 0.13062 9.80% 4.69%
50 2.35 0.12649 10.23% 4.90%
55 2.6 0.12262 10.63% 5.09%
60 2.85 0.11897 11.01% 5.27%
65 3.05 0.11620 11.30% 5.41%
70 3.3 0.11292 11.64% 5.57%
75 3.55 0.10982 11.96% 5.73%
80 3.8 0.10689 12.27% 5.87%
43
Solutions 3
When the building is not occupied there no need for the heating system to operate at full
capacity. Lowering the internal temperature can have significant energy savings. The excel tool
was modify to calculate the energy saving from lower the internal temperature when the building
was not in use. At first the temperature was lowered to 17°C and a 10.95% reduction in energy
consumption of the heating system was achieved. The second temperature tested was 15°C
which a 16.82% reduction in energy consumption by the heating system was achieved.
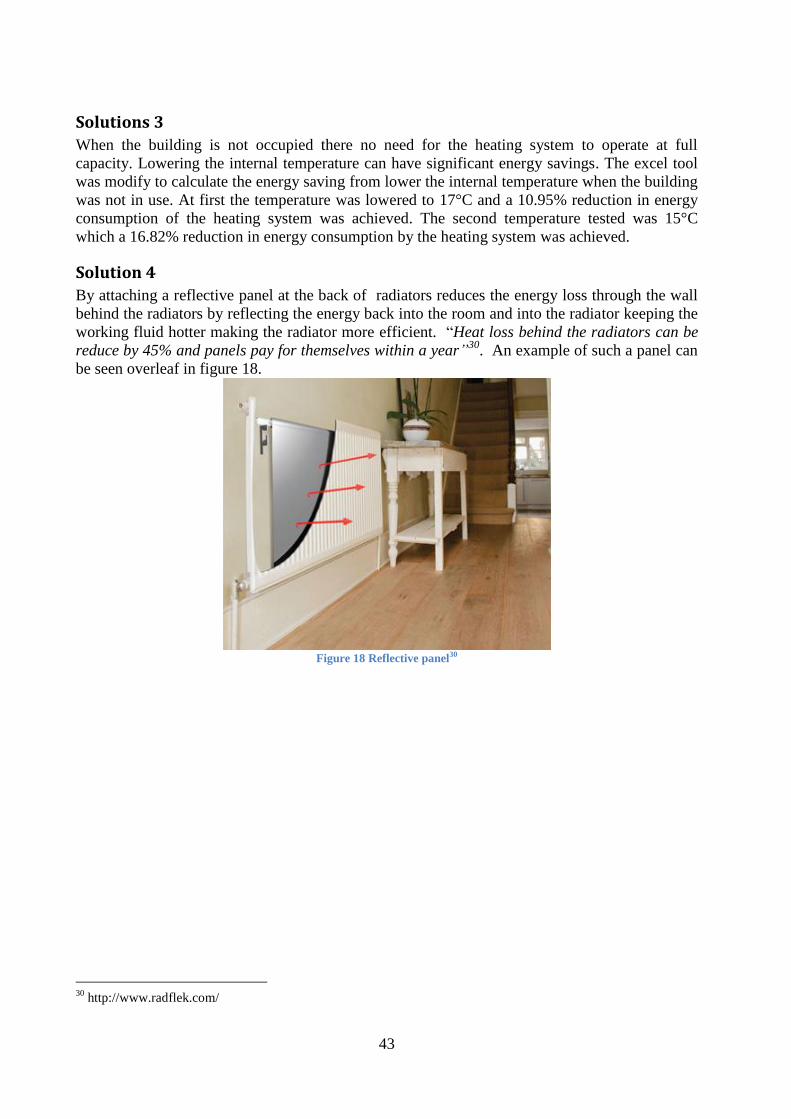
Solution 4
By attaching a reflective panel at the back of radiators reduces the energy loss through the wall
behind the radiators by reflecting the energy back into the room and into the radiator keeping the
working fluid hotter making the radiator more efficient. “Heat loss behind the radiators can be
reduce by 45% and panels pay for themselves within a year”30
. An example of such a panel can
be seen overleaf in figure 18.
Figure 18 Reflective panel30
30
http://www.radflek.com/

44
45
5. Discussion
Älvkarlebyhus can be proud that the building in this thesis releases no CO2 or other harmful
greenhouse gases as the greenhouses gases released from the production of the district heating
system and electricity suppliers are taken into account by the suppliers of these energy sources.
Making the buildings environmentally friendly.
On review of the calculation for heating required for ventilation. The 80 % efficiency for rotating
heat exchanger maybe too high and the typical value of 70 % should have been used to make the
calculations more accurate.
The results gained for the energy balance for each building was as expected. The gains and
losses in all three building followed the same pattern and changed depending on the difference in
areas of the structures of the building, the use of the building determined the internal gains and
the orientation of the building has an significant impact on solar gains. The time of year also
affected the heat gains and losses. The solar gains decreased to the months up to December and
started to increase starting in January. Where the losses are at the highest from December to
February with little difference between the months.
When comparing the results with the English energy benchmarks its important to remember that
the climate is a lot warmer in England when compared to the climate in Sweden for the same
time of year. This means the author had to make allowance in the comparisons to account for
this.
The estimate method for calculating the energy input is acceptable if no data is available for the
calculated using energy bills.
The best choice of the first two solutions on improving the energy usage in the building will
depend on quotes giving by suppliers and installers required to carry out the work. The payback
period should ideally be at most four years to make it profitable and worth the effort for the
company. Both solutions have the advantage and disadvantages which are listed below:
Solution1 the advantage of this is the external brick work remains seen which enhances
the building visual appearance of the building. The main disadvantage is the work will
be carried out inside the building which is in operation. As the work is been done the day
to day operations of these building will be affected. The library daily operation will be
less impacted as it’s has large open area and less visitors compared to by Skutskärs
Vårdcentral, Folktandvården building and Centralgatan 12 building have which have
many small rooms and more visitors on a daily basis.
Solution 2 main advantage is that it can be carried out without interfering with the daily
operation of the building concerned. The main disadvantage is that it will cover the brick
work so the finish product must be to high standard visually. There may also be some
locally restrictions that might make this solution not suitable because of the brick work.
Solution 3 should be cheap and easily to implement. Care must be taking when selecting
a lower temperature when the building is unoccupied as the pre heating time will
increase as the internal building temperature decreases. Also if the internal temperature
is lowered to far the building may not reach temperature’s consider to be comfortable
when the building is occupied.
46
Solution 4 Cheap and easily to implement. Anyone can install this panels.
A software package like IDA ICE could have been used to model the building and it’s energy
consumption but giving the time restrained and the limited knowledge by the author of the
software it was decided to create a model in excel. Creating the excel tool is a cheap, effective
and fast way to produce results and once created can be used for other buildings as well. Since
the excel tool was created the limitation and method for calculating the energy balance for the
building are known to the user. Also the user knows the necessary use of rule of thumbs and
simplification needed in order to make the model work. Once the simulation has been carried out
for the buildings in question any changes to the structure or the energy system can easily
modified in the excel tool and results can be gained quickly and a comparison made between the
two.
The strengths of work are:
Errors can be easily fixed without the need to redo all calculations by hand.
A visual representation of the results can be easily create in excel with the use of create a
graph function in Microsoft excel.
The instruments used to measure airflow were calibrated recently so if the devices were
used correctly the results should be accurate.
The excel tool create in excel for this thesis can be used again for other buildings. Offices
large and small would be able to freely use the tool since its made in Microsoft excel and
every office has the Microsoft office package.
The limitations of the work are:
The author was not experienced in using the tools to measure air flows in the AHU which
may cause errors in the calculation of the heat loss due to ventilation and the extract fans.
Heat gains due to equipment to the medical centre could not be calculated more
accurately because no information on the heat emit by the medical equipment could be
found so information on office equipment was used instead. Where the author had no
idea of what the equipment was or how often it is used it was not included in the
calculation.
The master’s thesis was carried out during the summer making it difficult to gain
information needed for the thesis as Swedish people tend to take all there holidays in
summer.
Assumption made and rule of thumb used decreased the accuracies of the results when
used instead of calculating the results. But the information to calculate the results may
have not been available.
Information given by the supervisor was in Swedish as the author has poor Swedish this
increases the probability of the misuse of information creating errors in the calculations.

47
The author and supervisors not speaking the same native language increased the risk of
misunderstanding between the two.

48
49
6. Conclusions
As the results show it is important to select a time of year to base the calculation on when sizing
equipment for a building heating or cooling system as the time of year will have great impact on
the results. If chosen wrong the heating system may be under sized and lead to discomfort in the
building. It also shows that u-values and structure area are both important factors in calculating
heat loss by transmittance. As a poor u-value with low structure area still can be the main factor
of heat loss as seen from windows in graph 10.
A combination of solution 3 with either solution 1 or 2 would be suited to reduce the energy
consumption of all three buildings. As cost for materials and labour for solution 1 and 2 could
not be found from Swedish companies so no advice to which solution for the Älvkarlebyhus
management can be made. The surface areas for both the floor and the external wall for the three
buildings can be found in appendix E that can be used to get quotes from suitable companies.
No other areas apart from solution three are suggested to improve on by the findings in this
report. An investigation into whether the control system for the lighting, heating and the
ventilation system can be upgraded to the energy usage of the system should be carried out.
The author does not have the required knowledge to model such control system and see how
much energy could be saved. The same should be done for lowering the internal temperature of
the building. As the author knows the theory behind this method the limitations of lowering the
temperature is unknown and therefore unable to recommend a suitable temperature. Pre heat up
time to get the internal temperature back up to acceptable levels would have to be calculating to
avoid discomfort in the mornings and the heating system operating poorly. Which the author has
limited knowledge and again the work should be carried out with someone that has the
experience with this type of work.
Since the heating and lighting systems run off electricity if the electricity can be generated by a
renewable technology the cost of supplying electricity would decrease significantly depending
on the generation capacity of the renewable technology installed. There are two suitable
renewable technology options first being wind turbine and second being PV panels there would a
vast improvement on the cost of energy usage of the buildings if installed. Since Älvkarlebyhus
manage a few other properties in the area they too may benefit.
A feasibility study should be carried out to determine whether PV panel or wind turbines could
supply electricity to Älvkarlebyhus properties. To create a model for the PV panels software
programme like T-SOL should be used and for the wind turbine once accurate average winds
speeds are located the power output can be easily estimate using by creating a model in
Microsoft excels and should be able to give all the information on whether the wind turbine is
feasible.
The Advantages and disadvantages for PV panels and wind turbines are listed below:
PV advantages:
In the summer months when the heating not required the electricity could be used for the
lighting systems. As the building opening hours are during the day this makes it possibly.
The roofs of the building are faces south which the best position to maximise solar
energy is.

50
Once operational the fuel source is free.
PV disadvantages:
High capital cost.
Low efficiency.
Roof structure may not be able to support the weight of the amount of PV required.
Large roof area needed.
Doesn’t operate at night time.
Intermitted fuel source.
Wind turbines advantages:
Fuel source free when operational.
High efficiency when compared to PV panels.
Wind turbines disadvantages:
Wind turbines are considered to be an eyesore.
Finding a location to place the wind turbine.
The local people may not want a wind turbine close to their homes.
Intermitted fuel source.
High capital cost.
.
51
7. References
1. Ref GPG 303 The designer’s guide to energy-efficient buildings, page 6.
2. (ASHRAE Handbook 2005) : Nonresidential cooling and heating load calculations
ASHRAE Handbook: Fundamentals (ch. 30) (Atlanta GA: American Society of Heating,
Refrigerating and Air-conditioning Engineers) (2005).
3. Google images, Air pressure test equipment.
4. GPG 304 The designer’s guide to energy-efficient buildings , page 20.
5. Google images, Solar gains through the window.
6. Google images, heat loss in a building.
7. GPG 303 The designer’s guide to energy-efficient buildings , page 76.
8. Google images, passive ventilation.
9. Google images, mechanical ventilation.
10. Google images, Thermal wheel.
11. Google images, Feedback control.
12. Google images, feedforward control.
13. European insulation manufactures association.
14. A guide to HVAC Building Services Calculations BSRIA Guide 30-2007,chp 3, page 21.
15. CIBSE guide B: The Chartered Institution of Building Services Engineers Guide B,
Heating, ventilating, air conditioning and refrigeration chp1, pg 15, equ 1.3.
16. Klimatdata för Sverige, Statens institute för Byggnadslorskning.
17. Dwelling Energy Assessment Procedure manual, chp6, page 31. 18. Information given by the supervisor.
19. Course notes from CIT: Building Thermal Dynamic Analysis, Fergus Delaney.
20. Wilkins C K and Hosni M H 2000: Wilkins C K and Hosni M H Heat gain from office
equipment ASHRAE J. 42 (6) 33 (June 2000).
21. (ASHRAE Handbook 2005) : Nonresidential cooling and heating load calculations
ASHRAE Handbook: Fundamentals (ch. 30) (Atlanta GA: American Society of Heating,
Refrigerating and Air-conditioning Engineers) (2005).
22. Course notes from CIT: Building Thermal Dynamic Analysis, Fergus Delaney.
23. Code for Lighting 2004: Code for Lighting (London: Society of Light and Lighting)-2004.
24. CIBSE TM 23 2000 : The Chartered Institution of Building Services Engineers TM 23
testing building for air leakage 2000,ISBN 1903287103.
25. Google images, Matrix of measurements in the AHU
26. www.engineeringtoolbox.com. heat loss.
27. Formula giving by supervisor.
28. CIBSE TM 23 2000 : The Chartered Institution of Building Services Engineers TM 23
testing building for air leakage 2000,ISBN 1903287103
29. CISBE F : The Chartered Institution of Building Services Engineers Guide F Table 20.1
page 20-2.
30. http://www.radflek.com.

52
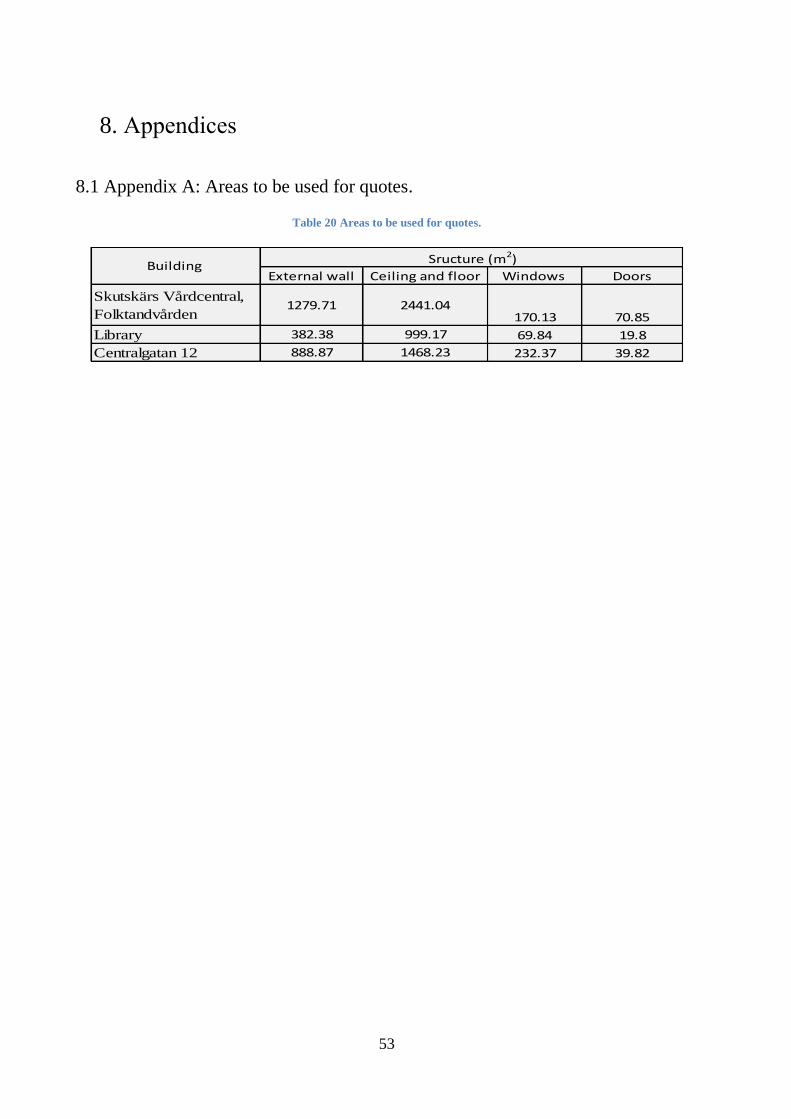
53
8. Appendices
8.1 Appendix A: Areas to be used for quotes.
Table 20 Areas to be used for quotes.
External wall Ceiling and floor Windows Doors
Skutskärs Vårdcentral,
Folktandvården1279.71 2441.04
170.13 70.85
Library 382.38 999.17 69.84 19.8
Centralgatan 12 888.87 1468.23 232.37 39.82
Sructure (m2)Building
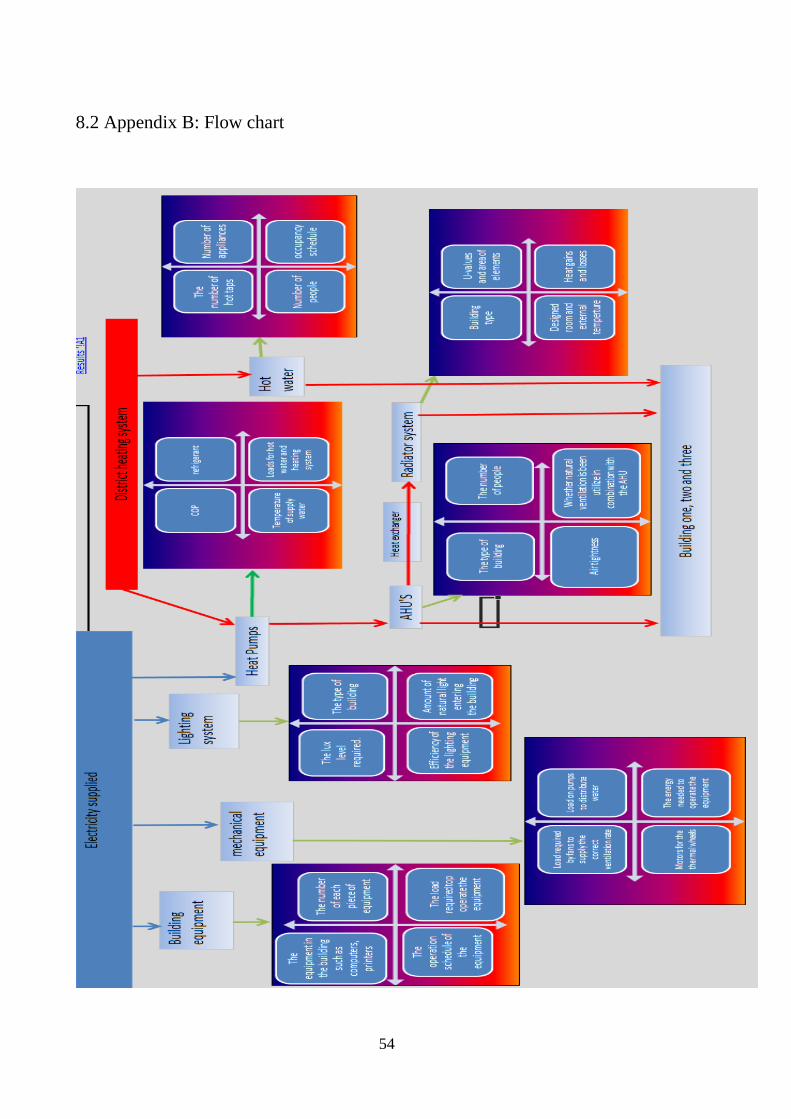
54
8.2 Appendix B: Flow chart
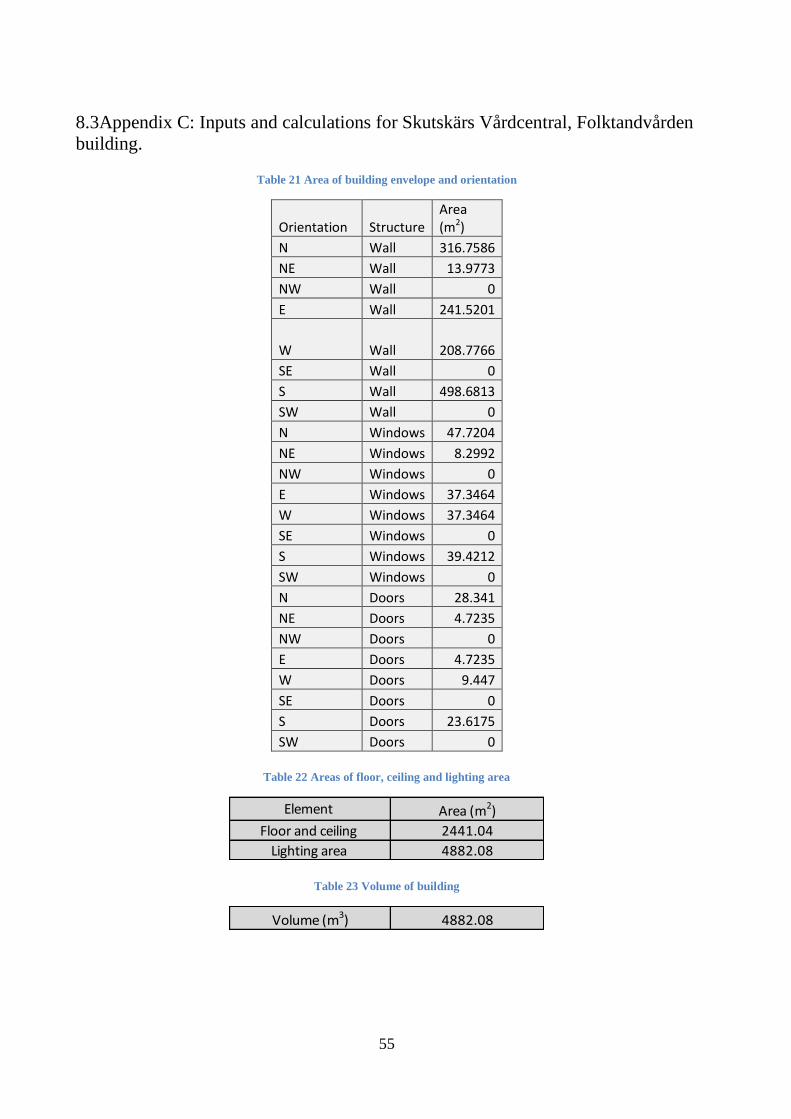
55
8.3Appendix C: Inputs and calculations for Skutskärs Vårdcentral, Folktandvården
building.
Table 21 Area of building envelope and orientation
Orientation Structure Area (m2)
N Wall 316.7586
NE Wall 13.9773
NW Wall 0
E Wall 241.5201
W Wall 208.7766
SE Wall 0
S Wall 498.6813
SW Wall 0
N Windows 47.7204
NE Windows 8.2992
NW Windows 0
E Windows 37.3464
W Windows 37.3464
SE Windows 0
S Windows 39.4212
SW Windows 0
N Doors 28.341
NE Doors 4.7235
NW Doors 0
E Doors 4.7235
W Doors 9.447
SE Doors 0
S Doors 23.6175
SW Doors 0
Table 22 Areas of floor, ceiling and lighting area
Table 23 Volume of building
Element Area (m2)
Floor and ceiling 2441.04
Lighting area 4882.08
Volume (m3) 4882.08
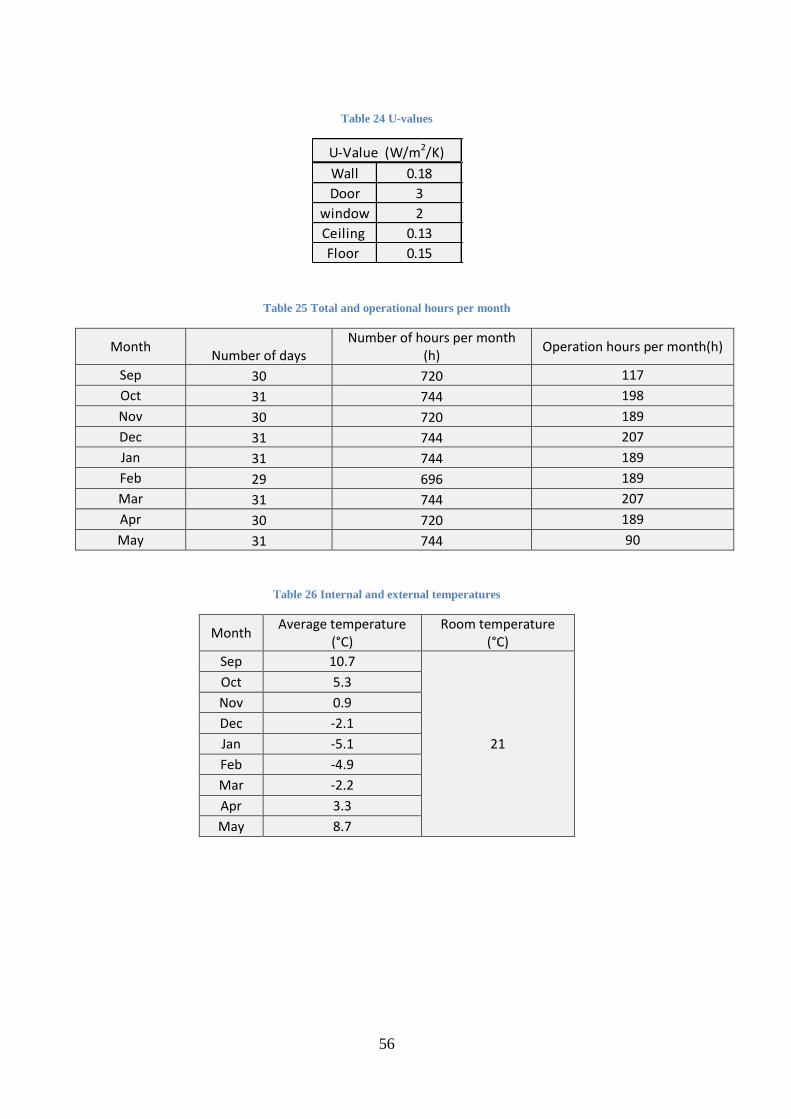
56
Table 24 U-values
Table 25 Total and operational hours per month
Month Number of days
Number of hours per month (h)
Operation hours per month(h)
Sep 30 720 117
Oct 31 744 198
Nov 30 720 189
Dec 31 744 207
Jan 31 744 189
Feb 29 696 189
Mar 31 744 207
Apr 30 720 189
May 31 744 90
Table 26 Internal and external temperatures
Month Average temperature
(°C) Room temperature
(°C)
Sep 10.7
21
Oct 5.3
Nov 0.9
Dec -2.1
Jan -5.1
Feb -4.9
Mar -2.2
Apr 3.3
May 8.7
Wall 0.18
Door 3
window 2
Ceiling 0.13
Floor 0.15
U-Value (W/m2/K)
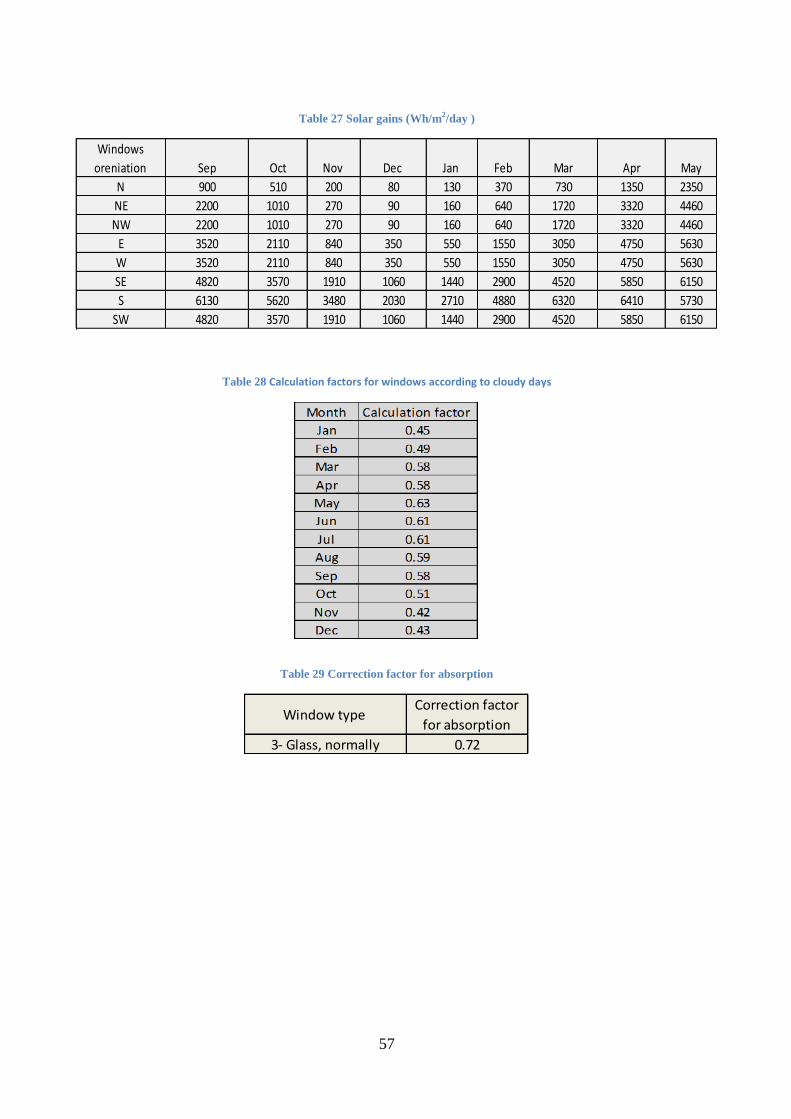
57
Table 27 Solar gains (Wh/m2/day )
Table 28 Calculation factors for windows according to cloudy days
Table 29 Correction factor for absorption
Windows
oreniation Sep Oct Nov Dec Jan Feb Mar Apr May
N 900 510 200 80 130 370 730 1350 2350
NE 2200 1010 270 90 160 640 1720 3320 4460
NW 2200 1010 270 90 160 640 1720 3320 4460
E 3520 2110 840 350 550 1550 3050 4750 5630
W 3520 2110 840 350 550 1550 3050 4750 5630
SE 4820 3570 1910 1060 1440 2900 4520 5850 6150
S 6130 5620 3480 2030 2710 4880 6320 6410 5730
SW 4820 3570 1910 1060 1440 2900 4520 5850 6150
Window type Correction factor
for absorption
3- Glass, normally 0.72
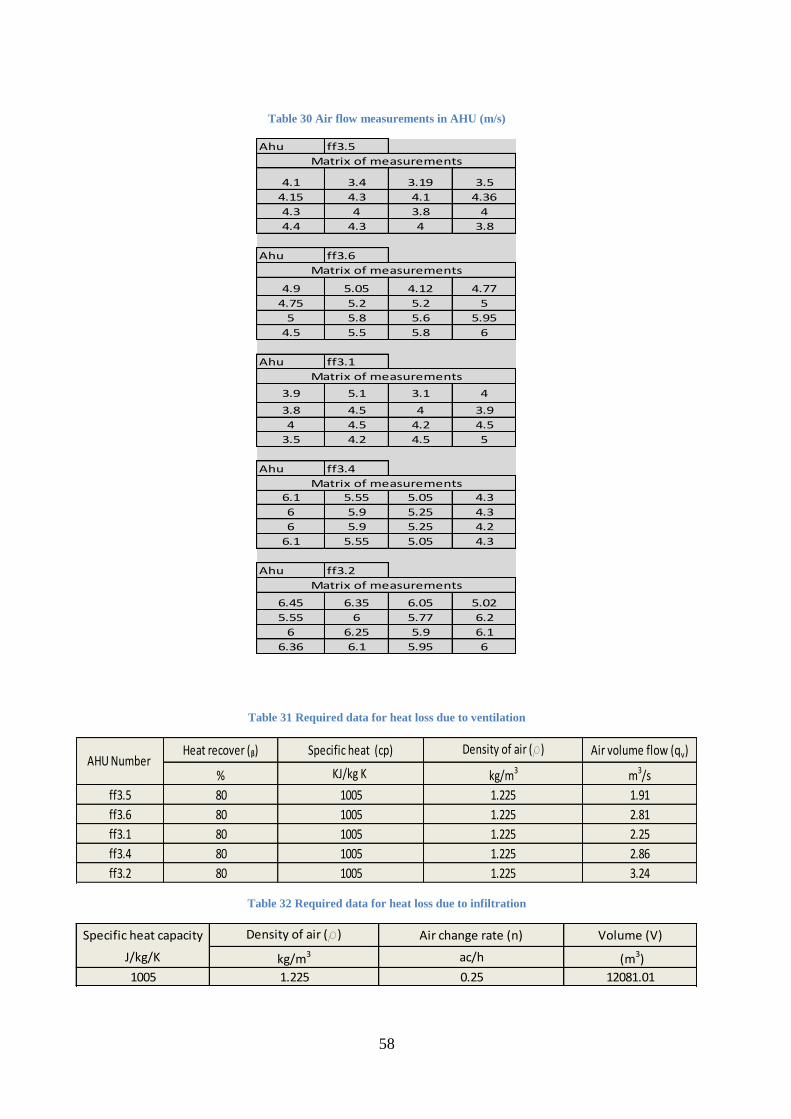
58
Table 30 Air flow measurements in AHU (m/s)
Table 31 Required data for heat loss due to ventilation
Table 32 Required data for heat loss due to infiltration
Ahu ff3.5
4.1 3.4 3.19 3.5
4.15 4.3 4.1 4.36
4.3 4 3.8 4
4.4 4.3 4 3.8
Ahu ff3.6
4.9 5.05 4.12 4.77
4.75 5.2 5.2 5
5 5.8 5.6 5.95
4.5 5.5 5.8 6
Ahu ff3.1
3.9 5.1 3.1 4
3.8 4.5 4 3.9
4 4.5 4.2 4.5
3.5 4.2 4.5 5
Ahu ff3.4
6.1 5.55 5.05 4.3
6 5.9 5.25 4.3
6 5.9 5.25 4.2
6.1 5.55 5.05 4.3
Ahu ff3.2
6.45 6.35 6.05 5.02
5.55 6 5.77 6.2
6 6.25 5.9 6.1
6.36 6.1 5.95 6
Matrix of measurements
Matrix of measurements
Matrix of measurements
Matrix of measurements
Matrix of measurements
Heat recover (ᵦ) Specific heat (cp) Density of air (r) Air volume flow (qv)
% KJ/kg K kg/m3 m3/s
ff3.5 80 1005 1.225 1.91
ff3.6 80 1005 1.225 2.81
ff3.1 80 1005 1.225 2.25
ff3.4 80 1005 1.225 2.86
ff3.2 80 1005 1.225 3.24
AHU Number
Specific heat capacity Density of air (r) Air change rate (n) Volume (V)
J/kg/K kg/m3 ac/h (m3)
1005 1.225 0.25 12081.01

59
Note the reason for a negative value appearing in the table below is a result of how the bills are
calculated. First the bills are estimate and at certain time of the year they are measured using the
meters installed in the building. If the bills are over estimated and the difference between the
estimate and measured bills are taken off the next estimated bill. When the difference in the
estimated and measure bill is greater than the next estimate bill this is where a negative number
appear which is to be subtracted away from the water usage.
Table 33 Cold water usage (m3)
m1 m2 m3 total
sep 42 43 63 148
oct 44 45 65 154
nov -51 -53 -130 -234
dec 86 87 113 286
jan 83 84 109 276
feb -83 -84 -109 -276
mar 126 128 166 420
apr 41 42 55 138
may 43 44 56 143
Total 1055

60
Table 34 List of equipment
Once the data was entered into the excel tool the following calculations were obtained.
Total
Total
Total
Total
Fluorescent triphoshor
Other equipment:
Name of building Address of building
Inspector of building
Count the equipment using the space below
13-15 inch0
Date of inspection
Skutskärs Vårdcentral, Folktandvården buildingSkutskär
Kieran Crowley
7/10/2016
Monitors size
0
16-18 inch 4 4
Printer size Count the equipment using the space below
Small desktop 0 0
Desktop 0 0
Office 1+1+2 4
Small office 0 0
Large office 3 3
Copier size Count the equipment using the space below
Desktop 0 0
Small Desktop 0 0
Desktop size Count the equipment using the space below
Desktop 51 51
Lighting type Compact
fluorescent Metal halide
Select lighting type no yes no
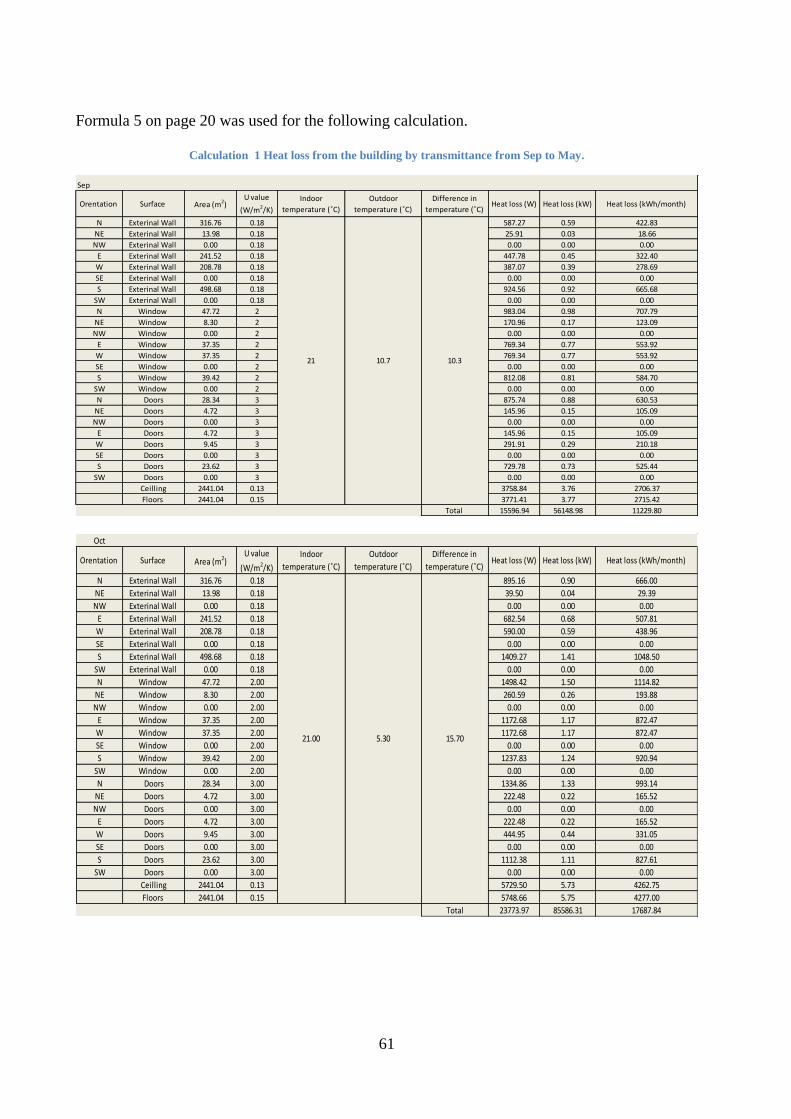
61
Formula 5 on page 20 was used for the following calculation.
Calculation 1 Heat loss from the building by transmittance from Sep to May.
Sep
Orentation Surface Area (m2)U value
(W/m2/K)
Indoor
temperature (˚C)
Outdoor
temperature (˚C)
Difference in
temperature (˚C)Heat loss (W) Heat loss (kW) Heat loss (kWh/month)
N Exterinal Wall 316.76 0.18 587.27 0.59 422.83
NE Exterinal Wall 13.98 0.18 25.91 0.03 18.66
NW Exterinal Wall 0.00 0.18 0.00 0.00 0.00
E Exterinal Wall 241.52 0.18 447.78 0.45 322.40
W Exterinal Wall 208.78 0.18 387.07 0.39 278.69
SE Exterinal Wall 0.00 0.18 0.00 0.00 0.00
S Exterinal Wall 498.68 0.18 924.56 0.92 665.68
SW Exterinal Wall 0.00 0.18 0.00 0.00 0.00
N Window 47.72 2 983.04 0.98 707.79
NE Window 8.30 2 170.96 0.17 123.09
NW Window 0.00 2 0.00 0.00 0.00
E Window 37.35 2 769.34 0.77 553.92
W Window 37.35 2 769.34 0.77 553.92
SE Window 0.00 2 0.00 0.00 0.00
S Window 39.42 2 812.08 0.81 584.70
SW Window 0.00 2 0.00 0.00 0.00
N Doors 28.34 3 875.74 0.88 630.53
NE Doors 4.72 3 145.96 0.15 105.09
NW Doors 0.00 3 0.00 0.00 0.00
E Doors 4.72 3 145.96 0.15 105.09
W Doors 9.45 3 291.91 0.29 210.18
SE Doors 0.00 3 0.00 0.00 0.00
S Doors 23.62 3 729.78 0.73 525.44
SW Doors 0.00 3 0.00 0.00 0.00
Ceilling 2441.04 0.13 3758.84 3.76 2706.37
Floors 2441.04 0.15 3771.41 3.77 2715.42
Total 15596.94 56148.98 11229.80
21 10.7 10.3
Oct
Orentation Surface Area (m2)U value
(W/m2/K)
Indoor
temperature (˚C)
Outdoor
temperature (˚C)
Difference in
temperature (˚C)Heat loss (W) Heat loss (kW) Heat loss (kWh/month)
N Exterinal Wall 316.76 0.18 895.16 0.90 666.00
NE Exterinal Wall 13.98 0.18 39.50 0.04 29.39
NW Exterinal Wall 0.00 0.18 0.00 0.00 0.00
E Exterinal Wall 241.52 0.18 682.54 0.68 507.81
W Exterinal Wall 208.78 0.18 590.00 0.59 438.96
SE Exterinal Wall 0.00 0.18 0.00 0.00 0.00
S Exterinal Wall 498.68 0.18 1409.27 1.41 1048.50
SW Exterinal Wall 0.00 0.18 0.00 0.00 0.00
N Window 47.72 2.00 1498.42 1.50 1114.82
NE Window 8.30 2.00 260.59 0.26 193.88
NW Window 0.00 2.00 0.00 0.00 0.00
E Window 37.35 2.00 1172.68 1.17 872.47
W Window 37.35 2.00 1172.68 1.17 872.47
SE Window 0.00 2.00 0.00 0.00 0.00
S Window 39.42 2.00 1237.83 1.24 920.94
SW Window 0.00 2.00 0.00 0.00 0.00
N Doors 28.34 3.00 1334.86 1.33 993.14
NE Doors 4.72 3.00 222.48 0.22 165.52
NW Doors 0.00 3.00 0.00 0.00 0.00
E Doors 4.72 3.00 222.48 0.22 165.52
W Doors 9.45 3.00 444.95 0.44 331.05
SE Doors 0.00 3.00 0.00 0.00 0.00
S Doors 23.62 3.00 1112.38 1.11 827.61
SW Doors 0.00 3.00 0.00 0.00 0.00
Ceilling 2441.04 0.13 5729.50 5.73 4262.75
Floors 2441.04 0.15 5748.66 5.75 4277.00
Total 23773.97 85586.31 17687.84
21.00 5.30 15.70
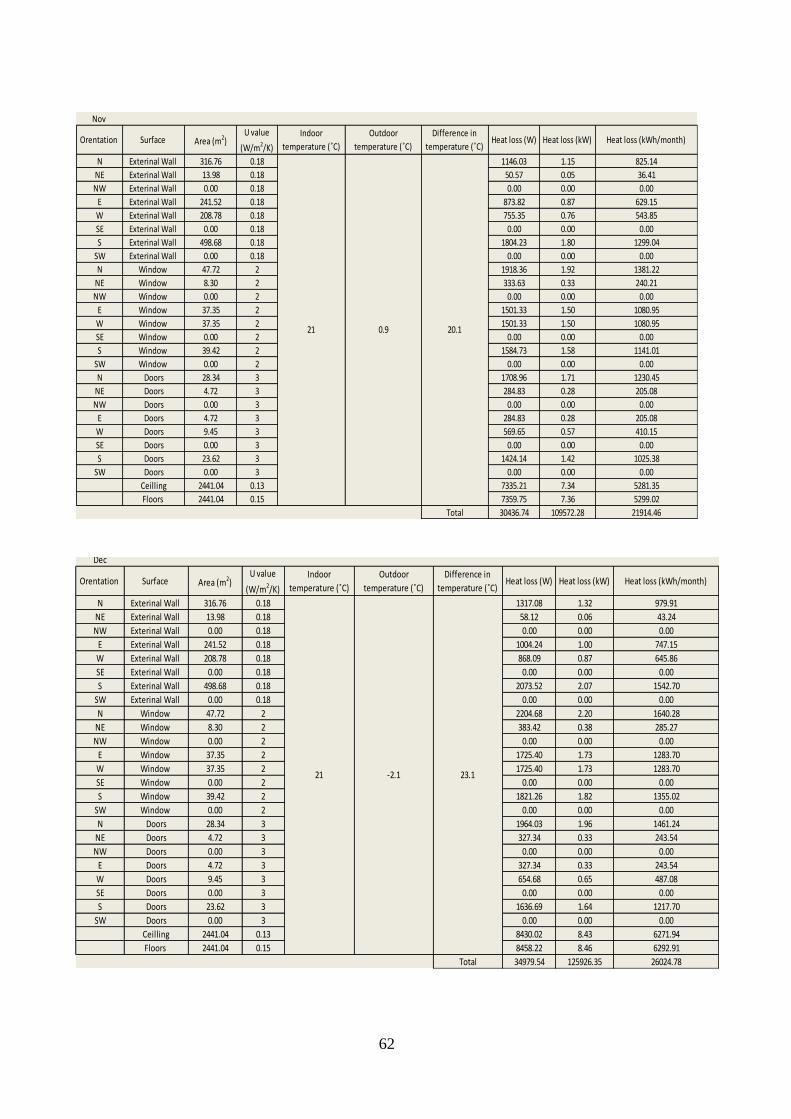
62
Nov
Orentation Surface Area (m2)U value
(W/m2/K)
Indoor
temperature (˚C)
Outdoor
temperature (˚C)
Difference in
temperature (˚C)Heat loss (W) Heat loss (kW) Heat loss (kWh/month)
N Exterinal Wall 316.76 0.18 1146.03 1.15 825.14
NE Exterinal Wall 13.98 0.18 50.57 0.05 36.41
NW Exterinal Wall 0.00 0.18 0.00 0.00 0.00
E Exterinal Wall 241.52 0.18 873.82 0.87 629.15
W Exterinal Wall 208.78 0.18 755.35 0.76 543.85
SE Exterinal Wall 0.00 0.18 0.00 0.00 0.00
S Exterinal Wall 498.68 0.18 1804.23 1.80 1299.04
SW Exterinal Wall 0.00 0.18 0.00 0.00 0.00
N Window 47.72 2 1918.36 1.92 1381.22
NE Window 8.30 2 333.63 0.33 240.21
NW Window 0.00 2 0.00 0.00 0.00
E Window 37.35 2 1501.33 1.50 1080.95
W Window 37.35 2 1501.33 1.50 1080.95
SE Window 0.00 2 0.00 0.00 0.00
S Window 39.42 2 1584.73 1.58 1141.01
SW Window 0.00 2 0.00 0.00 0.00
N Doors 28.34 3 1708.96 1.71 1230.45
NE Doors 4.72 3 284.83 0.28 205.08
NW Doors 0.00 3 0.00 0.00 0.00
E Doors 4.72 3 284.83 0.28 205.08
W Doors 9.45 3 569.65 0.57 410.15
SE Doors 0.00 3 0.00 0.00 0.00
S Doors 23.62 3 1424.14 1.42 1025.38
SW Doors 0.00 3 0.00 0.00 0.00
Ceilling 2441.04 0.13 7335.21 7.34 5281.35
Floors 2441.04 0.15 7359.75 7.36 5299.02
Total 30436.74 109572.28 21914.46
0.9 20.121
Dec
Orentation Surface Area (m2)U value
(W/m2/K)
Indoor
temperature (˚C)
Outdoor
temperature (˚C)
Difference in
temperature (˚C)Heat loss (W) Heat loss (kW) Heat loss (kWh/month)
N Exterinal Wall 316.76 0.18 1317.08 1.32 979.91
NE Exterinal Wall 13.98 0.18 58.12 0.06 43.24
NW Exterinal Wall 0.00 0.18 0.00 0.00 0.00
E Exterinal Wall 241.52 0.18 1004.24 1.00 747.15
W Exterinal Wall 208.78 0.18 868.09 0.87 645.86
SE Exterinal Wall 0.00 0.18 0.00 0.00 0.00
S Exterinal Wall 498.68 0.18 2073.52 2.07 1542.70
SW Exterinal Wall 0.00 0.18 0.00 0.00 0.00
N Window 47.72 2 2204.68 2.20 1640.28
NE Window 8.30 2 383.42 0.38 285.27
NW Window 0.00 2 0.00 0.00 0.00
E Window 37.35 2 1725.40 1.73 1283.70
W Window 37.35 2 1725.40 1.73 1283.70
SE Window 0.00 2 0.00 0.00 0.00
S Window 39.42 2 1821.26 1.82 1355.02
SW Window 0.00 2 0.00 0.00 0.00
N Doors 28.34 3 1964.03 1.96 1461.24
NE Doors 4.72 3 327.34 0.33 243.54
NW Doors 0.00 3 0.00 0.00 0.00
E Doors 4.72 3 327.34 0.33 243.54
W Doors 9.45 3 654.68 0.65 487.08
SE Doors 0.00 3 0.00 0.00 0.00
S Doors 23.62 3 1636.69 1.64 1217.70
SW Doors 0.00 3 0.00 0.00 0.00
Ceilling 2441.04 0.13 8430.02 8.43 6271.94
Floors 2441.04 0.15 8458.22 8.46 6292.91
Total 34979.54 125926.35 26024.78
21 -2.1 23.1

63
Jan
Orentation Surface Area (m2)U value
(W/m2/K)
Indoor
temperature (˚C)
Outdoor
temperature (˚C)
Difference in
temperature (˚C)Heat loss (W) Heat loss (kW) Heat loss (kWh/month)
N Exterinal Wall 316.76 0.18 1488.13 1.49 1107.17
NE Exterinal Wall 13.98 0.18 65.67 0.07 48.86
NW Exterinal Wall 0.00 0.18 0.00 0.00 0.00
E Exterinal Wall 241.52 0.18 1134.66 1.13 844.19
W Exterinal Wall 208.78 0.18 980.83 0.98 729.74
SE Exterinal Wall 0.00 0.18 0.00 0.00 0.00
S Exterinal Wall 498.68 0.18 2342.80 2.34 1743.05
SW Exterinal Wall 0.00 0.18 0.00 0.00 0.00
N Window 47.72 2 2491.00 2.49 1853.31
NE Window 8.30 2 433.22 0.43 322.31
NW Window 0.00 2 0.00 0.00 0.00
E Window 37.35 2 1949.48 1.95 1450.41
W Window 37.35 2 1949.48 1.95 1450.41
SE Window 0.00 2 0.00 0.00 0.00
S Window 39.42 2 2057.79 2.06 1530.99
SW Window 0.00 2 0.00 0.00 0.00
N Doors 28.34 3 2219.10 2.22 1651.01
NE Doors 4.72 3 369.85 0.37 275.17
NW Doors 0.00 3 0.00 0.00 0.00
E Doors 4.72 3 369.85 0.37 275.17
W Doors 9.45 3 739.70 0.74 550.34
SE Doors 0.00 3 0.00 0.00 0.00
S Doors 23.62 3 1849.25 1.85 1375.84
SW Doors 0.00 3 0.00 0.00 0.00
Ceilling 2441.04 0.13 9524.83 9.52 7086.47
Floors 2441.04 0.15 9556.69 9.56 7110.18
Total 39522.34 142280.42 29404.62
21 -5.1 26.1
Feb
Orentation Surface Area (m2)U value
(W/m2/K)
Indoor
temperature (˚C)
Outdoor
temperature (˚C)
Difference in
temperature (˚C)Heat loss (W) Heat loss (kW) Heat loss (kWh/month)
N Exterinal Wall 316.76 0.18 1476.73 1.48 1027.80
NE Exterinal Wall 13.98 0.18 65.16 0.07 45.35
NW Exterinal Wall 0.00 0.18 0.00 0.00 0.00
E Exterinal Wall 241.52 0.18 1125.97 1.13 783.67
W Exterinal Wall 208.78 0.18 973.32 0.97 677.43
SE Exterinal Wall 0.00 0.18 0.00 0.00 0.00
S Exterinal Wall 498.68 0.18 2324.85 2.32 1618.10
SW Exterinal Wall 0.00 0.18 0.00 0.00 0.00
N Window 47.72 2 2471.92 2.47 1720.45
NE Window 8.30 2 429.90 0.43 299.21
NW Window 0.00 2 0.00 0.00 0.00
E Window 37.35 2 1934.54 1.93 1346.44
W Window 37.35 2 1934.54 1.93 1346.44
SE Window 0.00 2 0.00 0.00 0.00
S Window 39.42 2 2042.02 2.04 1421.24
SW Window 0.00 2 0.00 0.00 0.00
N Doors 28.34 3 2202.10 2.20 1532.66
NE Doors 4.72 3 367.02 0.37 255.44
NW Doors 0.00 3 0.00 0.00 0.00
E Doors 4.72 3 367.02 0.37 255.44
W Doors 9.45 3 734.03 0.73 510.89
SE Doors 0.00 3 0.00 0.00 0.00
S Doors 23.62 3 1835.08 1.84 1277.22
SW Doors 0.00 3 0.00 0.00 0.00
Ceilling 2441.04 0.13 9451.84 9.45 6578.48
Floors 2441.04 0.15 9483.46 9.48 6600.49
Total 39219.49 141190.15 27296.76
21 -4.9 25.9
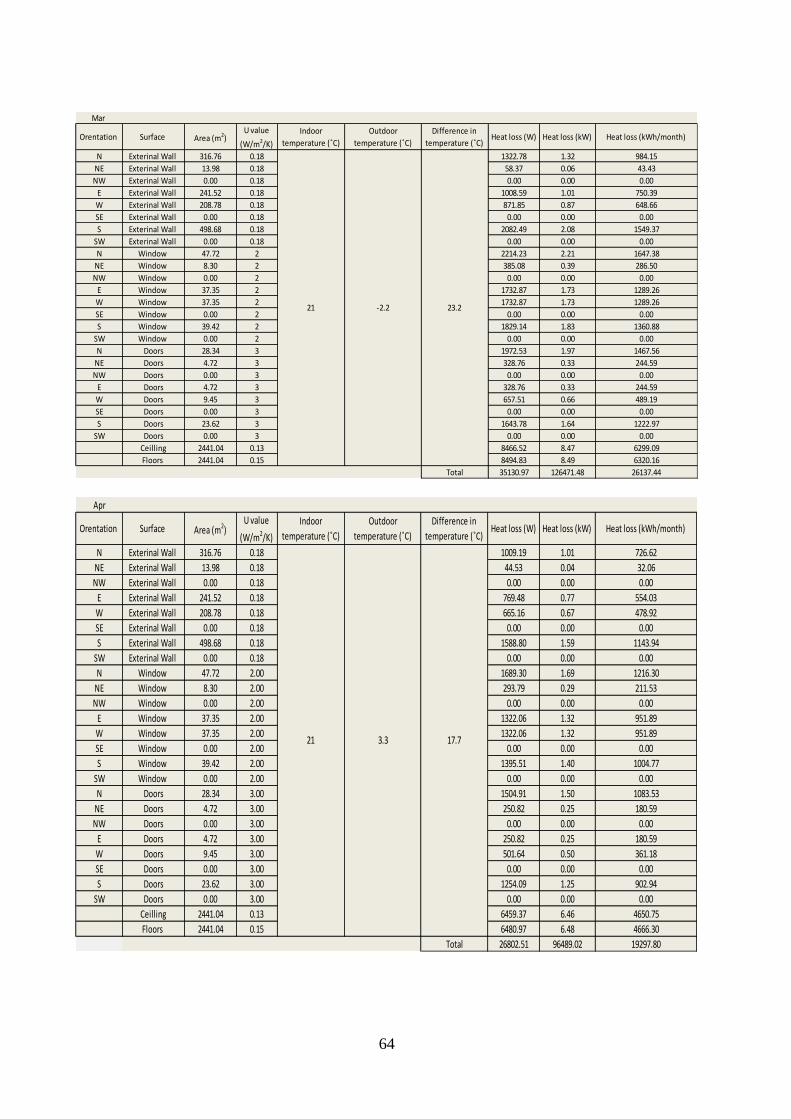
64
Mar
Orentation Surface Area (m2)U value
(W/m2/K)
Indoor
temperature (˚C)
Outdoor
temperature (˚C)
Difference in
temperature (˚C)Heat loss (W) Heat loss (kW) Heat loss (kWh/month)
N Exterinal Wall 316.76 0.18 1322.78 1.32 984.15
NE Exterinal Wall 13.98 0.18 58.37 0.06 43.43
NW Exterinal Wall 0.00 0.18 0.00 0.00 0.00
E Exterinal Wall 241.52 0.18 1008.59 1.01 750.39
W Exterinal Wall 208.78 0.18 871.85 0.87 648.66
SE Exterinal Wall 0.00 0.18 0.00 0.00 0.00
S Exterinal Wall 498.68 0.18 2082.49 2.08 1549.37
SW Exterinal Wall 0.00 0.18 0.00 0.00 0.00
N Window 47.72 2 2214.23 2.21 1647.38
NE Window 8.30 2 385.08 0.39 286.50
NW Window 0.00 2 0.00 0.00 0.00
E Window 37.35 2 1732.87 1.73 1289.26
W Window 37.35 2 1732.87 1.73 1289.26
SE Window 0.00 2 0.00 0.00 0.00
S Window 39.42 2 1829.14 1.83 1360.88
SW Window 0.00 2 0.00 0.00 0.00
N Doors 28.34 3 1972.53 1.97 1467.56
NE Doors 4.72 3 328.76 0.33 244.59
NW Doors 0.00 3 0.00 0.00 0.00
E Doors 4.72 3 328.76 0.33 244.59
W Doors 9.45 3 657.51 0.66 489.19
SE Doors 0.00 3 0.00 0.00 0.00
S Doors 23.62 3 1643.78 1.64 1222.97
SW Doors 0.00 3 0.00 0.00 0.00
Ceilling 2441.04 0.13 8466.52 8.47 6299.09
Floors 2441.04 0.15 8494.83 8.49 6320.16
Total 35130.97 126471.48 26137.44
23.221 -2.2
Apr
Orentation Surface Area (m2)U value
(W/m2/K)
Indoor
temperature (˚C)
Outdoor
temperature (˚C)
Difference in
temperature (˚C)Heat loss (W) Heat loss (kW) Heat loss (kWh/month)
N Exterinal Wall 316.76 0.18 1009.19 1.01 726.62
NE Exterinal Wall 13.98 0.18 44.53 0.04 32.06
NW Exterinal Wall 0.00 0.18 0.00 0.00 0.00
E Exterinal Wall 241.52 0.18 769.48 0.77 554.03
W Exterinal Wall 208.78 0.18 665.16 0.67 478.92
SE Exterinal Wall 0.00 0.18 0.00 0.00 0.00
S Exterinal Wall 498.68 0.18 1588.80 1.59 1143.94
SW Exterinal Wall 0.00 0.18 0.00 0.00 0.00
N Window 47.72 2.00 1689.30 1.69 1216.30
NE Window 8.30 2.00 293.79 0.29 211.53
NW Window 0.00 2.00 0.00 0.00 0.00
E Window 37.35 2.00 1322.06 1.32 951.89
W Window 37.35 2.00 1322.06 1.32 951.89
SE Window 0.00 2.00 0.00 0.00 0.00
S Window 39.42 2.00 1395.51 1.40 1004.77
SW Window 0.00 2.00 0.00 0.00 0.00
N Doors 28.34 3.00 1504.91 1.50 1083.53
NE Doors 4.72 3.00 250.82 0.25 180.59
NW Doors 0.00 3.00 0.00 0.00 0.00
E Doors 4.72 3.00 250.82 0.25 180.59
W Doors 9.45 3.00 501.64 0.50 361.18
SE Doors 0.00 3.00 0.00 0.00 0.00
S Doors 23.62 3.00 1254.09 1.25 902.94
SW Doors 0.00 3.00 0.00 0.00 0.00
Ceilling 2441.04 0.13 6459.37 6.46 4650.75
Floors 2441.04 0.15 6480.97 6.48 4666.30
Total 26802.51 96489.02 19297.80
21 3.3 17.7
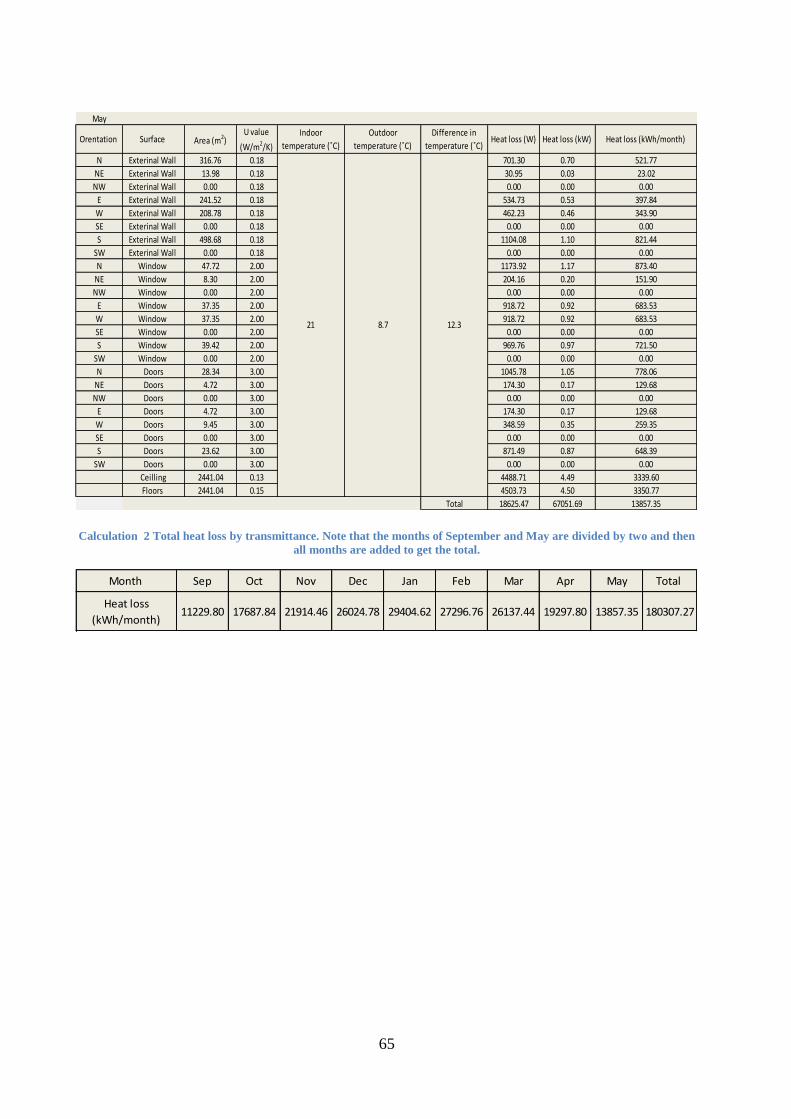
65
Calculation 2 Total heat loss by transmittance. Note that the months of September and May are divided by two and then
all months are added to get the total.
May
Orentation Surface Area (m2)U value
(W/m2/K)
Indoor
temperature (˚C)
Outdoor
temperature (˚C)
Difference in
temperature (˚C)Heat loss (W) Heat loss (kW) Heat loss (kWh/month)
N Exterinal Wall 316.76 0.18 701.30 0.70 521.77
NE Exterinal Wall 13.98 0.18 30.95 0.03 23.02
NW Exterinal Wall 0.00 0.18 0.00 0.00 0.00
E Exterinal Wall 241.52 0.18 534.73 0.53 397.84
W Exterinal Wall 208.78 0.18 462.23 0.46 343.90
SE Exterinal Wall 0.00 0.18 0.00 0.00 0.00
S Exterinal Wall 498.68 0.18 1104.08 1.10 821.44
SW Exterinal Wall 0.00 0.18 0.00 0.00 0.00
N Window 47.72 2.00 1173.92 1.17 873.40
NE Window 8.30 2.00 204.16 0.20 151.90
NW Window 0.00 2.00 0.00 0.00 0.00
E Window 37.35 2.00 918.72 0.92 683.53
W Window 37.35 2.00 918.72 0.92 683.53
SE Window 0.00 2.00 0.00 0.00 0.00
S Window 39.42 2.00 969.76 0.97 721.50
SW Window 0.00 2.00 0.00 0.00 0.00
N Doors 28.34 3.00 1045.78 1.05 778.06
NE Doors 4.72 3.00 174.30 0.17 129.68
NW Doors 0.00 3.00 0.00 0.00 0.00
E Doors 4.72 3.00 174.30 0.17 129.68
W Doors 9.45 3.00 348.59 0.35 259.35
SE Doors 0.00 3.00 0.00 0.00 0.00
S Doors 23.62 3.00 871.49 0.87 648.39
SW Doors 0.00 3.00 0.00 0.00 0.00
Ceilling 2441.04 0.13 4488.71 4.49 3339.60
Floors 2441.04 0.15 4503.73 4.50 3350.77
Total 18625.47 67051.69 13857.35
21 8.7 12.3
Month Sep Oct Nov Dec Jan Feb Mar Apr May Total
Heat loss
(kWh/month)11229.80 17687.84 21914.46 26024.78 29404.62 27296.76 26137.44 19297.80 13857.35 180307.27

66
Formula 6 on page 20 was used for the following calculation.
Calculation 3 Solar gains from months to September to May.
Sep
Windows
orientation Window area (m2)
solar gains
(Wh/m2/day )
Correction factor
for shading
Correction factor
for absorption
Total solar gains
(Wh/day )
Total solar gains
(kWh/month)
N 47.72 900 17935.24 538.06
NE 8.30 2200 7624.64 228.74
NW 0.00 2200 0.00 0.00
E 37.35 3520 54897.42 1646.92
W 37.35 3520 54897.42 1646.92
SE 0.00 4820 0.00 0.00
S 39.42 6130 100913.86 3027.42
SW 0.00 4820 0.00 0.00
Total 236268.56 7088.06
Oct
Windows
orientation Window area (m2)
solar gains
(Wh/m2/day )
Correction factor
for shading
Correction factor
for absorption
Total solar gains
(Wh/day )
Total solar gains
(kWh/month)
N 47.72 510 8936.69 277.04
NE 8.30 1010 3077.94 95.42
NW 0.00 1010 0.00 0.00
E 37.35 2110 28935.69 897.01
W 37.35 2110 28935.69 897.01
SE 0.00 3570 0.00 0.00
S 39.42 5620 81352.11 2521.92
SW 0.00 3570 0.00 0.00
Total 151238.13 4688.38
Nov
Windows
orientation Window area (m2)
solar gains
(Wh/m2/day )
Correction factor
for shading
Correction factor
for absorption
Total solar gains
(Wh/day )
Total solar gains
(kWh/month)
N 47.72 200 2886.13 86.58
NE 8.30 270 677.61 20.33
NW 0.00 270 0.00 0.00
E 37.35 840 9486.58 284.60
W 37.35 840 9486.58 284.60
SE 0.00 1910 0.00 0.00
S 39.42 3480 41484.98 1244.55
SW 0.00 1910 0.00 0.00
Total 64021.89 1920.66
Dec
Windows
orientation Window area (m2)
solar gains
(Wh/m2/day )
Correction factor
for shading
Correction factor
for absorption
Total solar gains
(Wh/day )
Total solar gains
(kWh/month)
N 47.72 80 1181.94 36.64
NE 8.30 90 231.25 7.17
NW 0.00 90 0.00 0.00
E 37.35 350 4046.86 125.45
W 37.35 350 4046.86 125.45
SE 0.00 1060 0.00 0.00
S 39.42 2030 24775.75 768.05
SW 0.00 1060 0.00 0.00
Total 34282.65 1062.76
Jan
Windows
orientation Window area (m2)
solar gains
(Wh/m2/day )
Correction factor
for shading
Correction factor
for absorption
Total solar gains
(Wh/day )
Total solar gains
(kWh/month)
N 47.72 130 2009.98 62.31
NE 8.30 160 430.23 13.34
NW 0.00 160 0.00 0.00
E 37.35 550 6655.13 206.31
W 37.35 550 6655.13 206.31
SE 0.00 1440 0.00 0.00
S 39.42 2710 34613.39 1073.02
SW 0.00 1440 0.00 0.00
Total 50363.86 1561.28
0.43 0.72
0.45 0.72
0.58 0.72
0.51 0.72
0.42 0.72
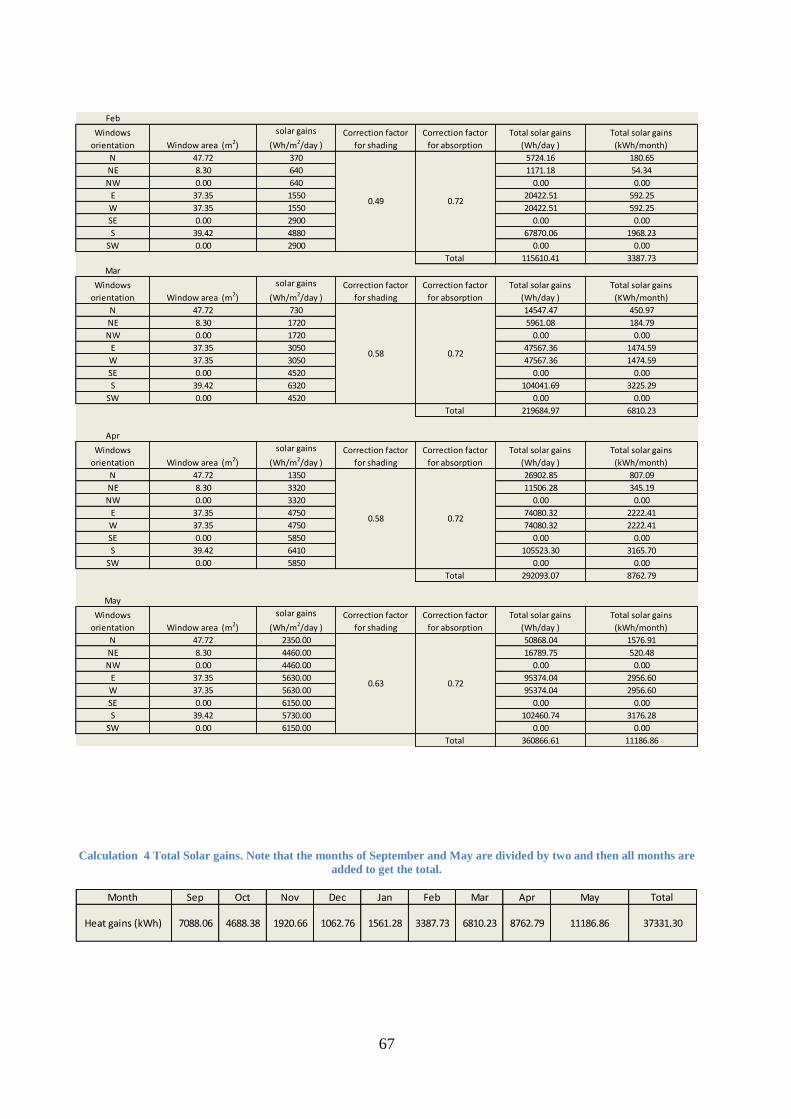
67
Calculation 4 Total Solar gains. Note that the months of September and May are divided by two and then all months are
added to get the total.
Feb
Windows
orientation Window area (m2)
solar gains
(Wh/m2/day )
Correction factor
for shading
Correction factor
for absorption
Total solar gains
(Wh/day )
Total solar gains
(kWh/month)
N 47.72 370 5724.16 180.65
NE 8.30 640 1171.18 54.34
NW 0.00 640 0.00 0.00
E 37.35 1550 20422.51 592.25
W 37.35 1550 20422.51 592.25
SE 0.00 2900 0.00 0.00
S 39.42 4880 67870.06 1968.23
SW 0.00 2900 0.00 0.00
Total 115610.41 3387.73
Mar
Windows
orientation Window area (m2)
solar gains
(Wh/m2/day )
Correction factor
for shading
Correction factor
for absorption
Total solar gains
(Wh/day )
Total solar gains
(KWh/month)
N 47.72 730 14547.47 450.97
NE 8.30 1720 5961.08 184.79
NW 0.00 1720 0.00 0.00
E 37.35 3050 47567.36 1474.59
W 37.35 3050 47567.36 1474.59
SE 0.00 4520 0.00 0.00
S 39.42 6320 104041.69 3225.29
SW 0.00 4520 0.00 0.00
Total 219684.97 6810.23
Apr
Windows
orientation Window area (m2)
solar gains
(Wh/m2/day )
Correction factor
for shading
Correction factor
for absorption
Total solar gains
(Wh/day )
Total solar gains
(kWh/month)
N 47.72 1350 26902.85 807.09
NE 8.30 3320 11506.28 345.19
NW 0.00 3320 0.00 0.00
E 37.35 4750 74080.32 2222.41
W 37.35 4750 74080.32 2222.41
SE 0.00 5850 0.00 0.00
S 39.42 6410 105523.30 3165.70
SW 0.00 5850 0.00 0.00
Total 292093.07 8762.79
May
Windows
orientation Window area (m2)
solar gains
(Wh/m2/day )
Correction factor
for shading
Correction factor
for absorption
Total solar gains
(Wh/day )
Total solar gains
(kWh/month)
N 47.72 2350.00 50868.04 1576.91
NE 8.30 4460.00 16789.75 520.48
NW 0.00 4460.00 0.00 0.00
E 37.35 5630.00 95374.04 2956.60
W 37.35 5630.00 95374.04 2956.60
SE 0.00 6150.00 0.00 0.00
S 39.42 5730.00 102460.74 3176.28
SW 0.00 6150.00 0.00 0.00
Total 360866.61 11186.86
0.63 0.72
0.49 0.72
0.58 0.72
0.58 0.72
Month Sep Oct Nov Dec Jan Feb Mar Apr May Total
Heat gains (kWh) 7088.06 4688.38 1920.66 1062.76 1561.28 3387.73 6810.23 8762.79 11186.86 37331.30
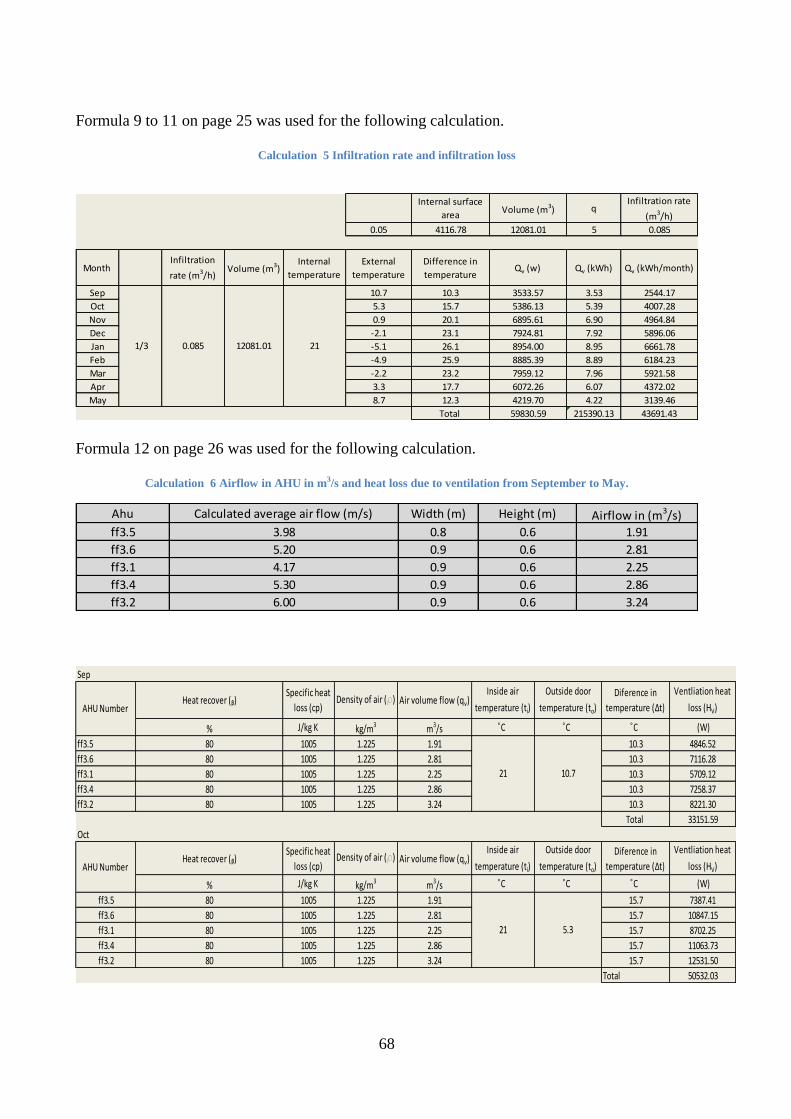
68
Formula 9 to 11 on page 25 was used for the following calculation.
Calculation 5 Infiltration rate and infiltration loss
Formula 12 on page 26 was used for the following calculation.
Calculation 6 Airflow in AHU in m3/s and heat loss due to ventilation from September to May.
Internal surface
area Volume (m3) q
Infiltration rate
(m3/h)
0.05 4116.78 12081.01 5 0.085
Month Infiltration
rate (m3/h)Volume (m3)
Internal
temperature
External
temperature
Difference in
temperature Qv (w) Qv (kWh) Qv (kWh/month)
Sep 10.7 10.3 3533.57 3.53 2544.17
Oct 5.3 15.7 5386.13 5.39 4007.28
Nov 0.9 20.1 6895.61 6.90 4964.84
Dec -2.1 23.1 7924.81 7.92 5896.06
Jan -5.1 26.1 8954.00 8.95 6661.78
Feb -4.9 25.9 8885.39 8.89 6184.23
Mar -2.2 23.2 7959.12 7.96 5921.58
Apr 3.3 17.7 6072.26 6.07 4372.02
May 8.7 12.3 4219.70 4.22 3139.46
Total 59830.59 215390.13 43691.43
1/3 0.085 12081.01 21
Ahu Calculated average air flow (m/s) Width (m) Height (m) Airflow in (m3/s)
ff3.5 3.98 0.8 0.6 1.91
ff3.6 5.20 0.9 0.6 2.81
ff3.1 4.17 0.9 0.6 2.25
ff3.4 5.30 0.9 0.6 2.86
ff3.2 6.00 0.9 0.6 3.24
Sep
Heat recover (ᵦ)Specific heat
loss (cp)Density of air (r) Air volume flow (qv)
Inside air
temperature (ti)
Outside door
temperature (to)
Diference in
temperature (∆t)
Ventliation heat
loss (HV)
% J/kg K kg/m3 m3/s ͦC ͦC ͦC (W)
ff3.5 80 1005 1.225 1.91 10.3 4846.52
ff3.6 80 1005 1.225 2.81 10.3 7116.28
ff3.1 80 1005 1.225 2.25 10.3 5709.12
ff3.4 80 1005 1.225 2.86 10.3 7258.37
ff3.2 80 1005 1.225 3.24 10.3 8221.30
Total 33151.59
Oct
Heat recover (ᵦ)Specific heat
loss (cp)Density of air (r) Air volume flow (qv)
Inside air
temperature (ti)
Outside door
temperature (to)
Diference in
temperature (∆t)
Ventliation heat
loss (HV)
% J/kg K kg/m3 m3/s ͦC ͦC ͦC (W)
ff3.5 80 1005 1.225 1.91 15.7 7387.41
ff3.6 80 1005 1.225 2.81 15.7 10847.15
ff3.1 80 1005 1.225 2.25 15.7 8702.25
ff3.4 80 1005 1.225 2.86 15.7 11063.73
ff3.2 80 1005 1.225 3.24 15.7 12531.50
Total 50532.03
AHU Number
10.721
AHU Number
21 5.3

69
Nov
Heat recover (ᵦ)Specific heat
loss (cp)Density of air (r) Air volume flow (qv)
Inside air
temperature (ti)
Outside door
temperature (to)
Diference in
temperature (∆t)
Ventliation heat
loss (HV)
% J/kg K kg/m3 m3/s ͦC ͦC ͦC (W)
ff3.5 80 1005 1.225 1.91 20.1 9457.77
ff3.6 80 1005 1.225 2.81 20.1 13887.11
ff3.1 80 1005 1.225 2.25 20.1 11141.09
ff3.4 80 1005 1.225 2.86 20.1 14164.39
ff3.2 80 1005 1.225 3.24 20.1 16043.51
Total 64693.88
Dec
Heat recover (ᵦ)Specific heat
loss (cp)Density of air (r) Air volume flow (qv)
Inside air
temperature (ti)
Outside door
temperature (to)
Diference in
temperature (∆t)
Ventliation heat
loss (HV)
% J/kg K kg/m3 m3/s ͦC ͦC ͦC (W)
ff3.5 80 1005 1.225 1.91 23.1 10869.38
ff3.6 80 1005 1.225 2.81 23.1 15959.82
ff3.1 80 1005 1.225 2.25 23.1 12803.94
ff3.4 80 1005 1.225 2.86 23.1 16278.48
ff3.2 80 1005 1.225 3.24 23.1 18438.06
Total 74349.68
Jan
Heat recover (ᵦ)Specific heat
loss (cp)Density of air (r) Air volume flow (qv)
Inside air
temperature (ti)
Outside door
temperature (to)
Diference in
temperature (∆t)
Ventliation heat
loss (HV)
% J/kg K kg/m3 m3/s ͦC ͦC ͦC (W)
ff3.5 80 1005 1.225 1.91 26.1 12280.99
ff3.6 80 1005 1.225 2.81 26.1 18032.52
ff3.1 80 1005 1.225 2.25 26.1 14466.79
ff3.4 80 1005 1.225 2.86 26.1 18392.56
ff3.2 80 1005 1.225 3.24 26.1 20832.62
Total 84005.48
Feb
Heat recover (ᵦ)Specific heat
loss (cp)Density of air (r) Air volume flow (qv)
Inside air
temperature (ti)
Outside door
temperature (to)
Diference in
temperature (∆t)
Ventliation heat
loss (HV)
% J/kg K kg/m3 m3/s ͦC ͦC ͦC (W)
ff3.5 80 1005 1.225 1.91 25.9 12186.88
ff3.6 80 1005 1.225 2.81 25.9 17894.34
ff3.1 80 1005 1.225 2.25 25.9 14355.94
ff3.4 80 1005 1.225 2.86 25.9 18251.63
ff3.2 80 1005 1.225 3.24 25.9 20672.98
Total 83361.76
AHU Number
AHU Number
AHU Number
AHU Number
21 0.9
-4.9
21 -2.1
21 -5.1
21
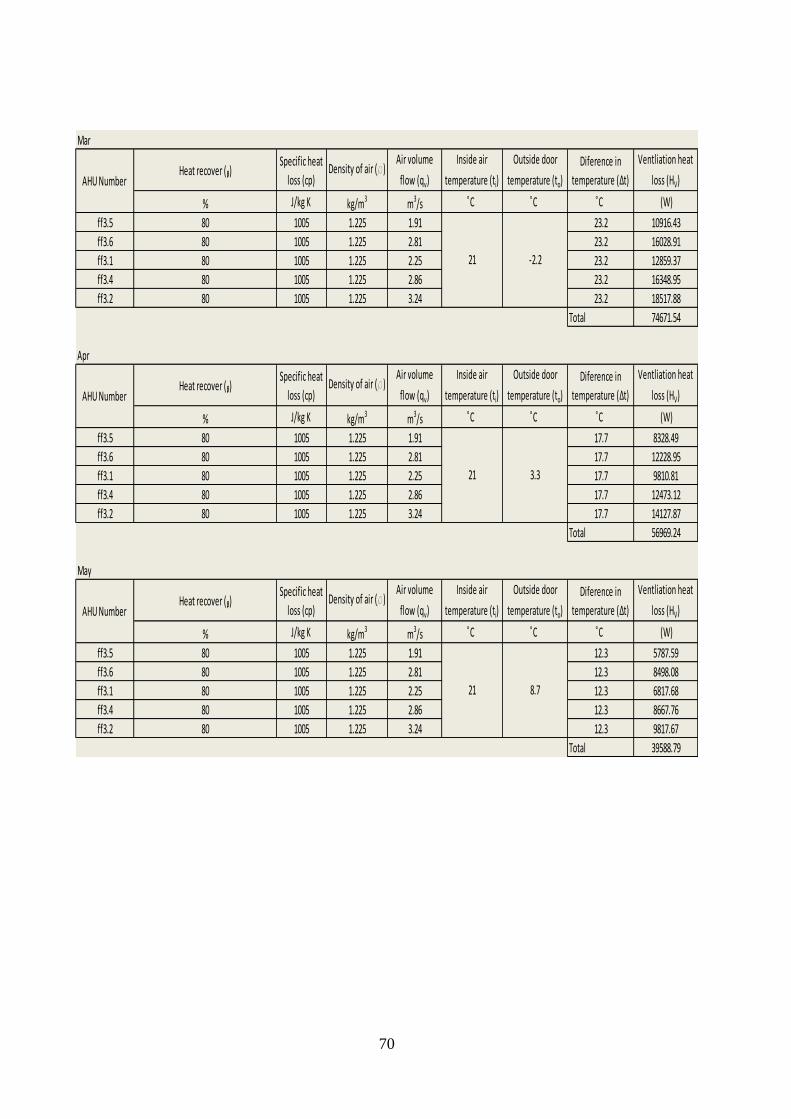
70
Mar
Heat recover (ᵦ)Specific heat
loss (cp)Density of air (r)
Air volume
flow (qv)
Inside air
temperature (ti)
Outside door
temperature (to)
Diference in
temperature (∆t)
Ventliation heat
loss (HV)
% J/kg K kg/m3 m3/s ͦC ͦC ͦC (W)
ff3.5 80 1005 1.225 1.91 23.2 10916.43
ff3.6 80 1005 1.225 2.81 23.2 16028.91
ff3.1 80 1005 1.225 2.25 23.2 12859.37
ff3.4 80 1005 1.225 2.86 23.2 16348.95
ff3.2 80 1005 1.225 3.24 23.2 18517.88
Total 74671.54
Apr
Heat recover (ᵦ)Specific heat
loss (cp)Density of air (r)
Air volume
flow (qv)
Inside air
temperature (ti)
Outside door
temperature (to)
Diference in
temperature (∆t)
Ventliation heat
loss (HV)
% J/kg K kg/m3 m3/s ͦC ͦC ͦC (W)
ff3.5 80 1005 1.225 1.91 17.7 8328.49
ff3.6 80 1005 1.225 2.81 17.7 12228.95
ff3.1 80 1005 1.225 2.25 17.7 9810.81
ff3.4 80 1005 1.225 2.86 17.7 12473.12
ff3.2 80 1005 1.225 3.24 17.7 14127.87
Total 56969.24
May
Heat recover (ᵦ)Specific heat
loss (cp)Density of air (r)
Air volume
flow (qv)
Inside air
temperature (ti)
Outside door
temperature (to)
Diference in
temperature (∆t)
Ventliation heat
loss (HV)
% J/kg K kg/m3 m3/s ͦC ͦC ͦC (W)
ff3.5 80 1005 1.225 1.91 12.3 5787.59
ff3.6 80 1005 1.225 2.81 12.3 8498.08
ff3.1 80 1005 1.225 2.25 12.3 6817.68
ff3.4 80 1005 1.225 2.86 12.3 8667.76
ff3.2 80 1005 1.225 3.24 12.3 9817.67
Total 39588.79
8.7
AHU Number
AHU Number
AHU Number
21 -2.2
21 3.3
21
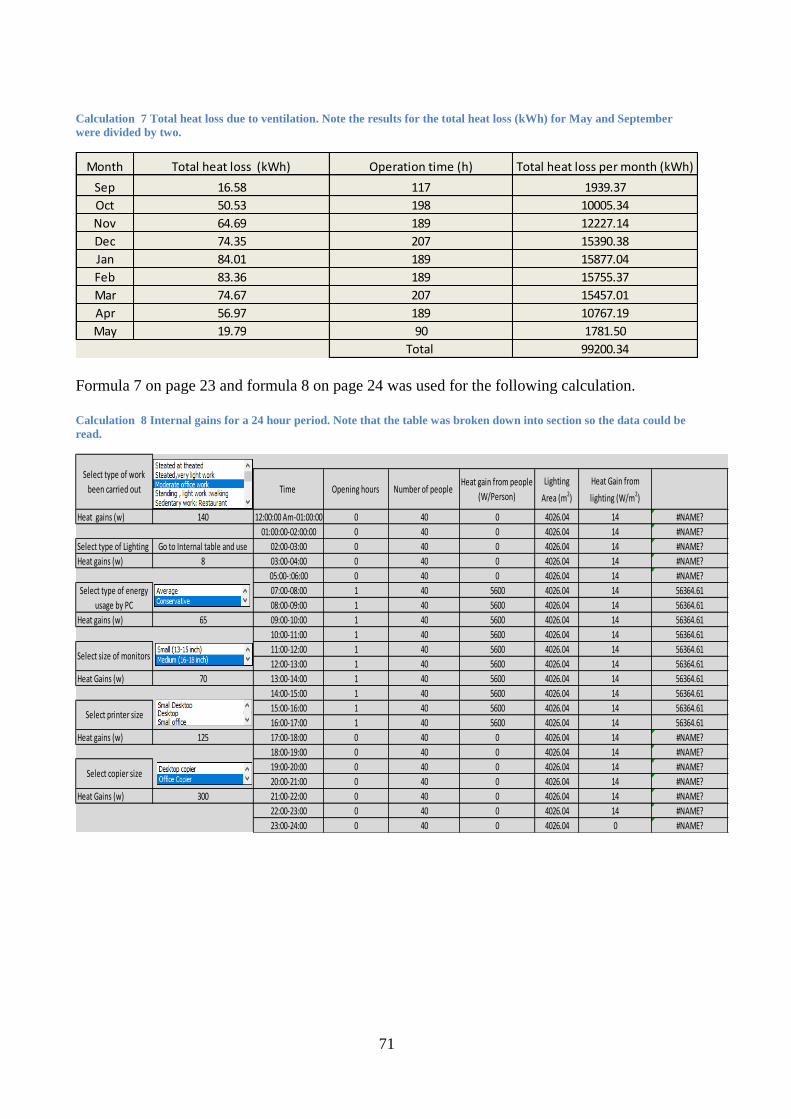
71
Calculation 7 Total heat loss due to ventilation. Note the results for the total heat loss (kWh) for May and September
were divided by two.
Formula 7 on page 23 and formula 8 on page 24 was used for the following calculation.
Calculation 8 Internal gains for a 24 hour period. Note that the table was broken down into section so the data could be
read.
Month Total heat loss (kWh) Operation time (h) Total heat loss per month (kWh)
Sep 16.58 117 1939.37
Oct 50.53 198 10005.34
Nov 64.69 189 12227.14
Dec 74.35 207 15390.38
Jan 84.01 189 15877.04
Feb 83.36 189 15755.37
Mar 74.67 207 15457.01
Apr 56.97 189 10767.19
May 19.79 90 1781.50
Total 99200.34
Time Opening hours Number of people Heat gain from people
(W/Person)
Lighting
Area (m2)
Heat Gain from
lighting (W/m2)
Heat gains (w) 12:00:00 Am-01:00:00 0 40 0 4026.04 14 #NAME?
01:00:00-02:00:00 0 40 0 4026.04 14 #NAME?
Select type of Lighting 02:00-03:00 0 40 0 4026.04 14 #NAME?
Heat gains (w) 03:00-04:00 0 40 0 4026.04 14 #NAME?
05:00-:06:00 0 40 0 4026.04 14 #NAME?
07:00-08:00 1 40 5600 4026.04 14 56364.61
08:00-09:00 1 40 5600 4026.04 14 56364.61
Heat gains (w) 09:00-10:00 1 40 5600 4026.04 14 56364.61
10:00-11:00 1 40 5600 4026.04 14 56364.61
11:00-12:00 1 40 5600 4026.04 14 56364.61
12:00-13:00 1 40 5600 4026.04 14 56364.61
Heat Gains (w) 13:00-14:00 1 40 5600 4026.04 14 56364.61
14:00-15:00 1 40 5600 4026.04 14 56364.61
15:00-16:00 1 40 5600 4026.04 14 56364.61
16:00-17:00 1 40 5600 4026.04 14 56364.61
Heat gains (w) 17:00-18:00 0 40 0 4026.04 14 #NAME?
18:00-19:00 0 40 0 4026.04 14 #NAME?
19:00-20:00 0 40 0 4026.04 14 #NAME?
20:00-21:00 0 40 0 4026.04 14 #NAME?
Heat Gains (w) 21:00-22:00 0 40 0 4026.04 14 #NAME?
22:00-23:00 0 40 0 4026.04 14 #NAME?
23:00-24:00 0 40 0 4026.04 0 #NAME?
Select type of work
been carried out
140
Go to Internal table and use
8
65
Select type of energy
usage by PC
Select size of monitors
70
125
Select printer size
Select copier size
300

72
Number of pcs Heat gain from
pcs (W)
Number
monitors
Heat gains from
Monitors (W)
Number of
printers
Heat gain from
printers (W)
51 0 3 0 4 0
51 0 3 0 4 0
51 0 3 0 4 0
51 0 3 0 4 0
51 0 3 0 4 0
51 3315 3 210 4 500
51 3315 3 210 4 500
51 3315 3 210 4 500
51 3315 3 210 4 500
51 3315 3 210 4 500
51 3315 3 210 4 500
51 3315 3 210 4 500
51 3315 3 210 4 500
51 3315 3 210 4 500
51 3315 3 210 4 500
51 0 3 0 4 0
51 0 3 0 4 0
51 0 3 0 4 0
51 0 3 0 4 0
51 0 3 0 4 0
51 0 3 0 4 0
51 0 3 0 4 0
Number of
copiers
Heat gains from
copiers (W)
Total internal
gains (W)
Total internal
gains (kW)
Total internal
gains (kWh )
3 0 0 0 0
3 0 0 0 0
3 0 0 0 0
3 0 0 0 0
3 0 0 0 0
3 900 66889.61 66.89 66.89
3 900 66889.61 66.89 66.89
3 900 66889.61 66.89 66.89
3 900 66889.61 66.89 66.89
3 900 66889.61 66.89 66.89
3 900 66889.61 66.89 66.89
3 900 66889.61 66.89 66.89
3 900 66889.61 66.89 66.89
3 900 66889.61 66.89 66.89
3 900 66889.61 66.89 66.89
3 0 0 0 0
3 0 0 0 0
3 0 0 0 0
3 0 0 0 0
3 0 0 0 0
3 0 0 0 0
3 0 0 0 0
Hand calculation of
internal gains 0 0
Total for 24 hr period 668896.15 668.90 668.90
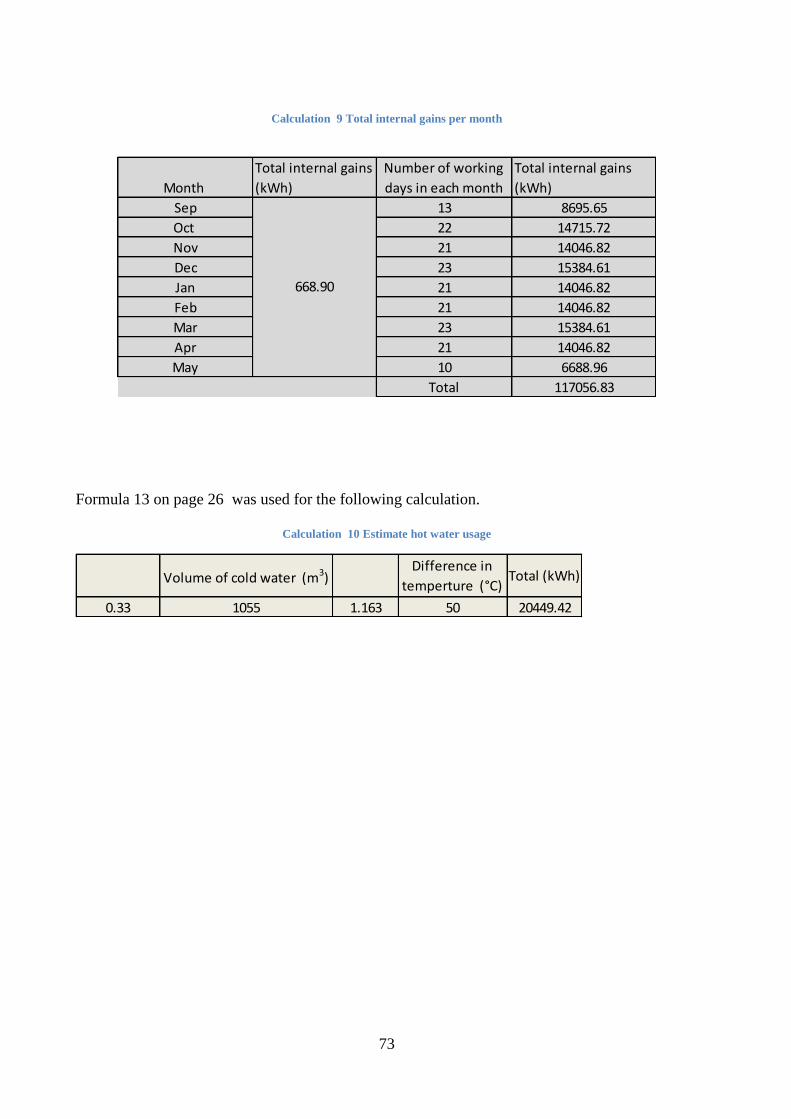
73
Calculation 9 Total internal gains per month
Formula 13 on page 26 was used for the following calculation.
Calculation 10 Estimate hot water usage
Month
Total internal gains
(kWh)
Number of working
days in each month
Total internal gains
(kWh)
Sep 13 8695.65
Oct 22 14715.72
Nov 21 14046.82
Dec 23 15384.61
Jan 21 14046.82
Feb 21 14046.82
Mar 23 15384.61
Apr 21 14046.82
May 10 6688.96
Total 117056.83
668.90
Volume of cold water (m3)Difference in
temperture (°C)Total (kWh)
0.33 1055 1.163 50 20449.42

74
8.4 Appendix D: Inputs and calculations for Library building.
Table 35 Area of building envelope and orientation
Table 36 Floor, ceiling and lighting area
Table 37 Volume of building
Orentation Structure Area (m2)
N Wall 93.374
NE Wall 5.58
NW Wall 0
E Wall 71.9004
W Wall 89.7464
SE Wall 0
S Wall 96.4856
SW Wall 25.29
N Windows 16.562
NE Windows 7.02
NW Windows 0
E Windows 18.18
W Windows 15.21
SE Windows 0
S Windows 9.36
SW Windows 3.51
N Doors 4.784
NE Doors 0
NW Doors 0
E Doors 3.3696
W Doors 9.1936
SE Doors 0
S Doors 2.4544
SW Doors 0
Floor and ceilling area (m2)
999.17
Volume (m3)
2997.51
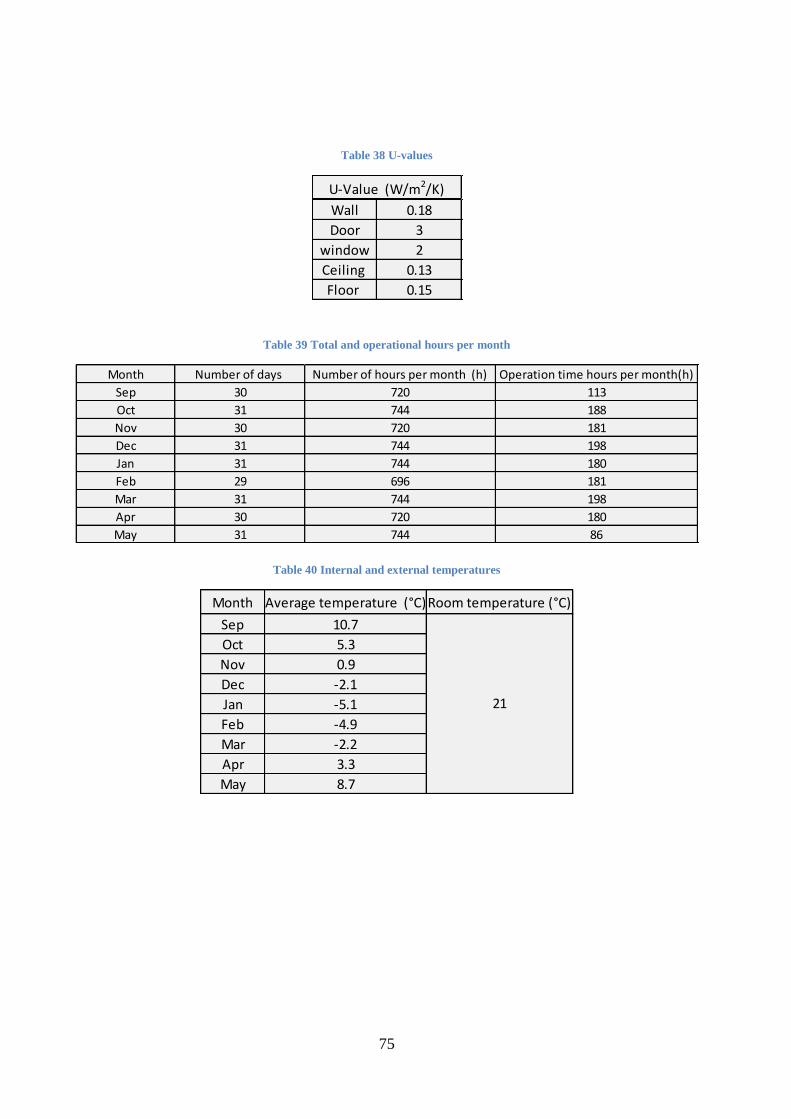
75
Table 38 U-values
Table 39 Total and operational hours per month
Table 40 Internal and external temperatures
Wall 0.18
Door 3
window 2
Ceiling 0.13
Floor 0.15
U-Value (W/m2/K)
Month Number of days Number of hours per month (h) Operation time hours per month(h)
Sep 30 720 113
Oct 31 744 188
Nov 30 720 181
Dec 31 744 198
Jan 31 744 180
Feb 29 696 181
Mar 31 744 198
Apr 30 720 180
May 31 744 86
Month Average temperature (°C)Room temperature (°C)
Sep 10.7
Oct 5.3
Nov 0.9
Dec -2.1
Jan -5.1
Feb -4.9
Mar -2.2
Apr 3.3
May 8.7
21

76
Table 41 Solar gains (Wh/m2/day )
Table 42 Calculation factors for windows according to cloudy days
Table 43 Correction factor for absorption
Table 44 Air flow measurements in AHU (m/s)
Windows
oreniation Sep Oct Nov Dec Jan Feb Mar Apr May
N 900 510 200 80 130 370 730 1350 2350
NE 2200 1010 270 90 160 640 1720 3320 4460
NW 2200 1010 270 90 160 640 1720 3320 4460
E 3520 2110 840 350 550 1550 3050 4750 5630
W 3520 2110 840 350 550 1550 3050 4750 5630
SE 4820 3570 1910 1060 1440 2900 4520 5850 6150
S 6130 5620 3480 2030 2710 4880 6320 6410 5730
SW 4820 3570 1910 1060 1440 2900 4520 5850 6150
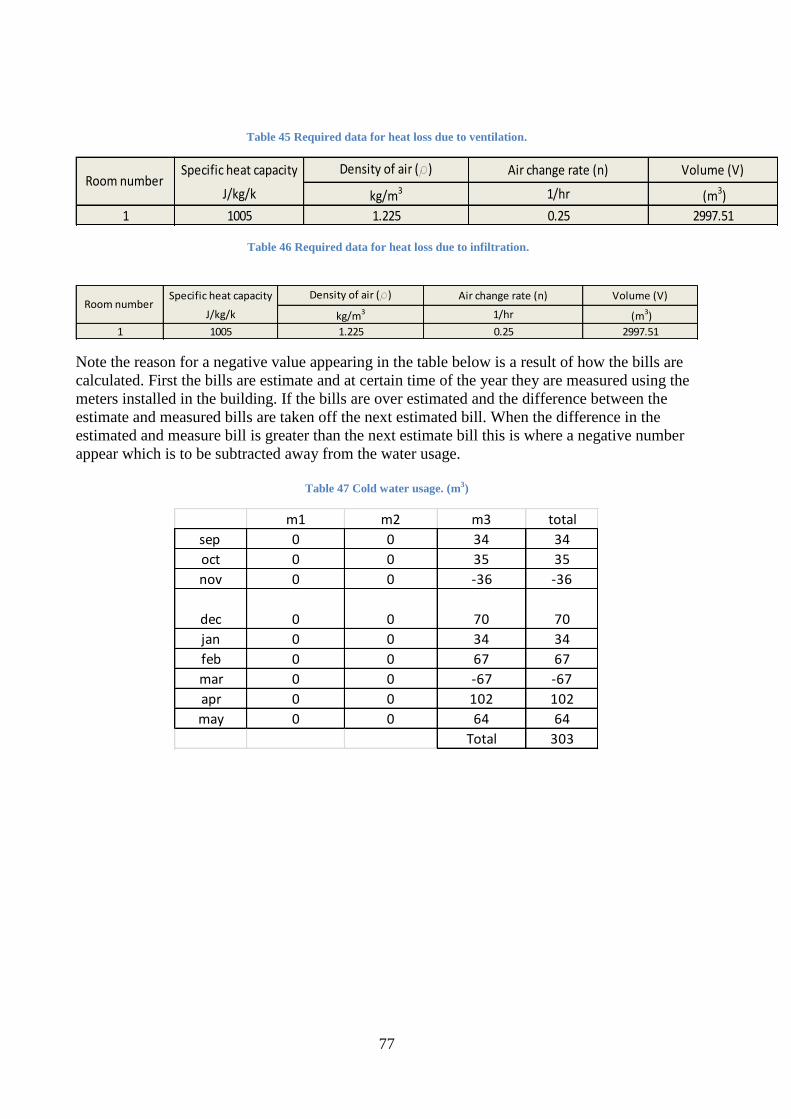
77
Table 45 Required data for heat loss due to ventilation.
Table 46 Required data for heat loss due to infiltration.
Note the reason for a negative value appearing in the table below is a result of how the bills are
calculated. First the bills are estimate and at certain time of the year they are measured using the
meters installed in the building. If the bills are over estimated and the difference between the
estimate and measured bills are taken off the next estimated bill. When the difference in the
estimated and measure bill is greater than the next estimate bill this is where a negative number
appear which is to be subtracted away from the water usage.
Table 47 Cold water usage. (m3)
Specific heat capacity Density of air (r) Air change rate (n) Volume (V)
J/kg/k kg/m3 1/hr (m3)
1 1005 1.225 0.25 2997.51
Room number
Specific heat capacity Density of air (r) Air change rate (n) Volume (V)
J/kg/k kg/m3 1/hr (m3)
1 1005 1.225 0.25 2997.51
Room number
m1 m2 m3 total
sep 0 0 34 34
oct 0 0 35 35
nov 0 0 -36 -36
dec 0 0 70 70
jan 0 0 34 34
feb 0 0 67 67
mar 0 0 -67 -67
apr 0 0 102 102
may 0 0 64 64
Total 303
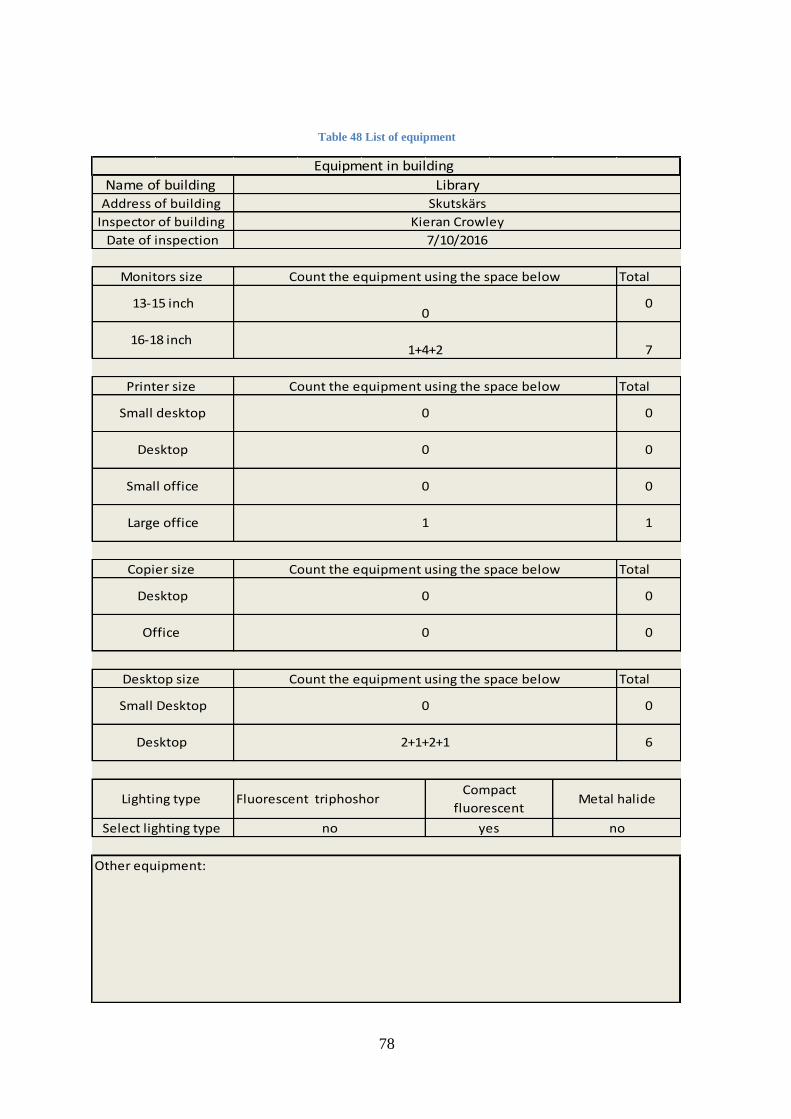
78
Table 48 List of equipment
Total
Total
Total
Total
Fluorescent triphoshor
Select lighting type no yes no
Other equipment:
Desktop 2+1+2+1 6
Lighting type Compact
fluorescent Metal halide
Small Desktop 0 0
Desktop size Count the equipment using the space below
Copier size Count the equipment using the space below
Desktop 0 0
Office 0 0
Small office 0 0
Large office 1 1
Small desktop 0 0
Desktop 0 0
0
16-18 inch 1+4+2 7
Printer size Count the equipment using the space below
Count the equipment using the space below
13-15 inch0
Date of inspection
LibrarySkutskärs
Kieran Crowley
7/10/2016
Monitors size
Equipment in building
Name of building Address of building
Inspector of building
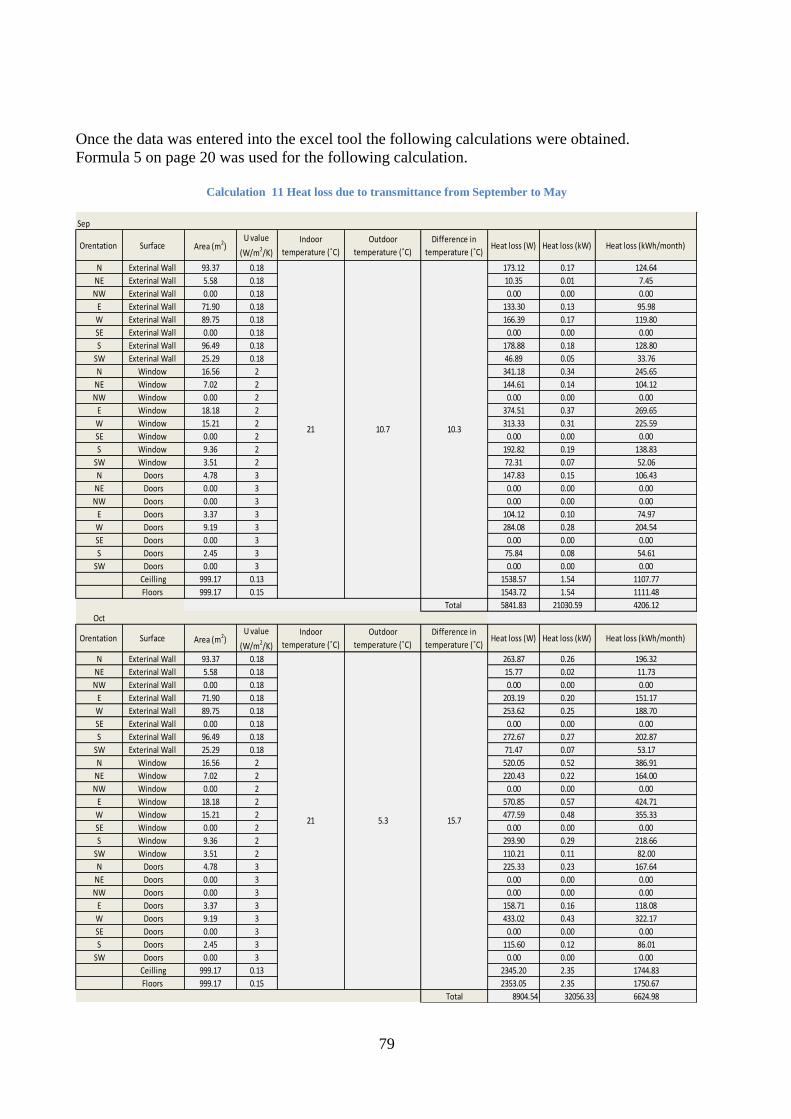
79
Once the data was entered into the excel tool the following calculations were obtained.
Formula 5 on page 20 was used for the following calculation.
Calculation 11 Heat loss due to transmittance from September to May
Sep
Orentation Surface Area (m2)U value
(W/m2/K)
Indoor
temperature (˚C)
Outdoor
temperature (˚C)
Difference in
temperature (˚C)Heat loss (W) Heat loss (kW) Heat loss (kWh/month)
N Exterinal Wall 93.37 0.18 173.12 0.17 124.64
NE Exterinal Wall 5.58 0.18 10.35 0.01 7.45
NW Exterinal Wall 0.00 0.18 0.00 0.00 0.00
E Exterinal Wall 71.90 0.18 133.30 0.13 95.98
W Exterinal Wall 89.75 0.18 166.39 0.17 119.80
SE Exterinal Wall 0.00 0.18 0.00 0.00 0.00
S Exterinal Wall 96.49 0.18 178.88 0.18 128.80
SW Exterinal Wall 25.29 0.18 46.89 0.05 33.76
N Window 16.56 2 341.18 0.34 245.65
NE Window 7.02 2 144.61 0.14 104.12
NW Window 0.00 2 0.00 0.00 0.00
E Window 18.18 2 374.51 0.37 269.65
W Window 15.21 2 313.33 0.31 225.59
SE Window 0.00 2 0.00 0.00 0.00
S Window 9.36 2 192.82 0.19 138.83
SW Window 3.51 2 72.31 0.07 52.06
N Doors 4.78 3 147.83 0.15 106.43
NE Doors 0.00 3 0.00 0.00 0.00
NW Doors 0.00 3 0.00 0.00 0.00
E Doors 3.37 3 104.12 0.10 74.97
W Doors 9.19 3 284.08 0.28 204.54
SE Doors 0.00 3 0.00 0.00 0.00
S Doors 2.45 3 75.84 0.08 54.61
SW Doors 0.00 3 0.00 0.00 0.00
Ceilling 999.17 0.13 1538.57 1.54 1107.77
Floors 999.17 0.15 1543.72 1.54 1111.48
Total 5841.83 21030.59 4206.12
Oct
Orentation Surface Area (m2)U value
(W/m2/K)
Indoor
temperature (˚C)
Outdoor
temperature (˚C)
Difference in
temperature (˚C)Heat loss (W) Heat loss (kW) Heat loss (kWh/month)
N Exterinal Wall 93.37 0.18 263.87 0.26 196.32
NE Exterinal Wall 5.58 0.18 15.77 0.02 11.73
NW Exterinal Wall 0.00 0.18 0.00 0.00 0.00
E Exterinal Wall 71.90 0.18 203.19 0.20 151.17
W Exterinal Wall 89.75 0.18 253.62 0.25 188.70
SE Exterinal Wall 0.00 0.18 0.00 0.00 0.00
S Exterinal Wall 96.49 0.18 272.67 0.27 202.87
SW Exterinal Wall 25.29 0.18 71.47 0.07 53.17
N Window 16.56 2 520.05 0.52 386.91
NE Window 7.02 2 220.43 0.22 164.00
NW Window 0.00 2 0.00 0.00 0.00
E Window 18.18 2 570.85 0.57 424.71
W Window 15.21 2 477.59 0.48 355.33
SE Window 0.00 2 0.00 0.00 0.00
S Window 9.36 2 293.90 0.29 218.66
SW Window 3.51 2 110.21 0.11 82.00
N Doors 4.78 3 225.33 0.23 167.64
NE Doors 0.00 3 0.00 0.00 0.00
NW Doors 0.00 3 0.00 0.00 0.00
E Doors 3.37 3 158.71 0.16 118.08
W Doors 9.19 3 433.02 0.43 322.17
SE Doors 0.00 3 0.00 0.00 0.00
S Doors 2.45 3 115.60 0.12 86.01
SW Doors 0.00 3 0.00 0.00 0.00
Ceilling 999.17 0.13 2345.20 2.35 1744.83
Floors 999.17 0.15 2353.05 2.35 1750.67
Total 8904.54 32056.33 6624.98
21 5.3 15.7
21 10.7 10.3

80
Nov
Orentation Surface Area (m2)U value
(W/m2/K)
Indoor
temperature (˚C)
Outdoor
temperature (˚C)
Difference in
temperature (˚C)Heat loss (W) Heat loss (kW) Heat loss (kWh/month)
N Exterinal Wall 93.37 0.18 337.83 0.34 243.24
NE Exterinal Wall 5.58 0.18 20.19 0.02 14.54
NW Exterinal Wall 0.00 0.18 0.00 0.00 0.00
E Exterinal Wall 71.90 0.18 260.14 0.26 187.30
W Exterinal Wall 89.75 0.18 324.70 0.32 233.79
SE Exterinal Wall 0.00 0.18 0.00 0.00 0.00
S Exterinal Wall 96.49 0.18 349.08 0.35 251.34
SW Exterinal Wall 25.29 0.18 91.50 0.09 65.88
N Window 16.56 2 665.79 0.67 479.37
NE Window 7.02 2 282.20 0.28 203.19
NW Window 0.00 2 0.00 0.00 0.00
E Window 18.18 2 730.84 0.73 526.20
W Window 15.21 2 611.44 0.61 440.24
SE Window 0.00 2 0.00 0.00 0.00
S Window 9.36 2 376.27 0.38 270.92
SW Window 3.51 2 141.10 0.14 101.59
N Doors 4.78 3 288.48 0.29 207.70
NE Doors 0.00 3 0.00 0.00 0.00
NW Doors 0.00 3 0.00 0.00 0.00
E Doors 3.37 3 203.19 0.20 146.29
W Doors 9.19 3 554.37 0.55 399.15
SE Doors 0.00 3 0.00 0.00 0.00
S Doors 2.45 3 148.00 0.15 106.56
SW Doors 0.00 3 0.00 0.00 0.00
Ceilling 999.17 0.13 3002.46 3.00 2161.77
Floors 999.17 0.15 3012.50 3.01 2169.00
Total 11400.08 41040.27 8208.05
Dec
Orentation Surface Area (m2)U value
(W/m2/K)
Indoor
temperature (˚C)
Outdoor
temperature (˚C)
Difference in
temperature (˚C)Heat loss (W) Heat loss (kW) Heat loss (kWh/month)
N Exterinal Wall 93.37 0.18 388.25 0.39 288.86
NE Exterinal Wall 5.58 0.18 23.20 0.02 17.26
NW Exterinal Wall 0.00 0.18 0.00 0.00 0.00
E Exterinal Wall 71.90 0.18 298.96 0.30 222.43
W Exterinal Wall 89.75 0.18 373.17 0.37 277.64
SE Exterinal Wall 0.00 0.18 0.00 0.00 0.00
S Exterinal Wall 96.49 0.18 401.19 0.40 298.48
SW Exterinal Wall 25.29 0.18 105.16 0.11 78.24
N Window 16.56 2 765.16 0.77 569.28
NE Window 7.02 2 324.32 0.32 241.30
NW Window 0.00 2 0.00 0.00 0.00
E Window 18.18 2 839.92 0.84 624.90
W Window 15.21 2 702.70 0.70 522.81
SE Window 0.00 2 0.00 0.00 0.00
S Window 9.36 2 432.43 0.43 321.73
SW Window 3.51 2 162.16 0.16 120.65
N Doors 4.78 3 331.53 0.33 246.66
NE Doors 0.00 3 0.00 0.00 0.00
NW Doors 0.00 3 0.00 0.00 0.00
E Doors 3.37 3 233.51 0.23 173.73
W Doors 9.19 3 637.12 0.64 474.01
SE Doors 0.00 3 0.00 0.00 0.00
S Doors 2.45 3 170.09 0.17 126.55
SW Doors 0.00 3 0.00 0.00 0.00
Ceilling 999.17 0.13 3450.58 3.45 2567.23
Floors 999.17 0.15 3462.12 3.46 2575.82
Total 13101.58 47165.69 9747.58
13101.58 47165.69 9747.58
0.9 20.121
21 -2.1 23.1
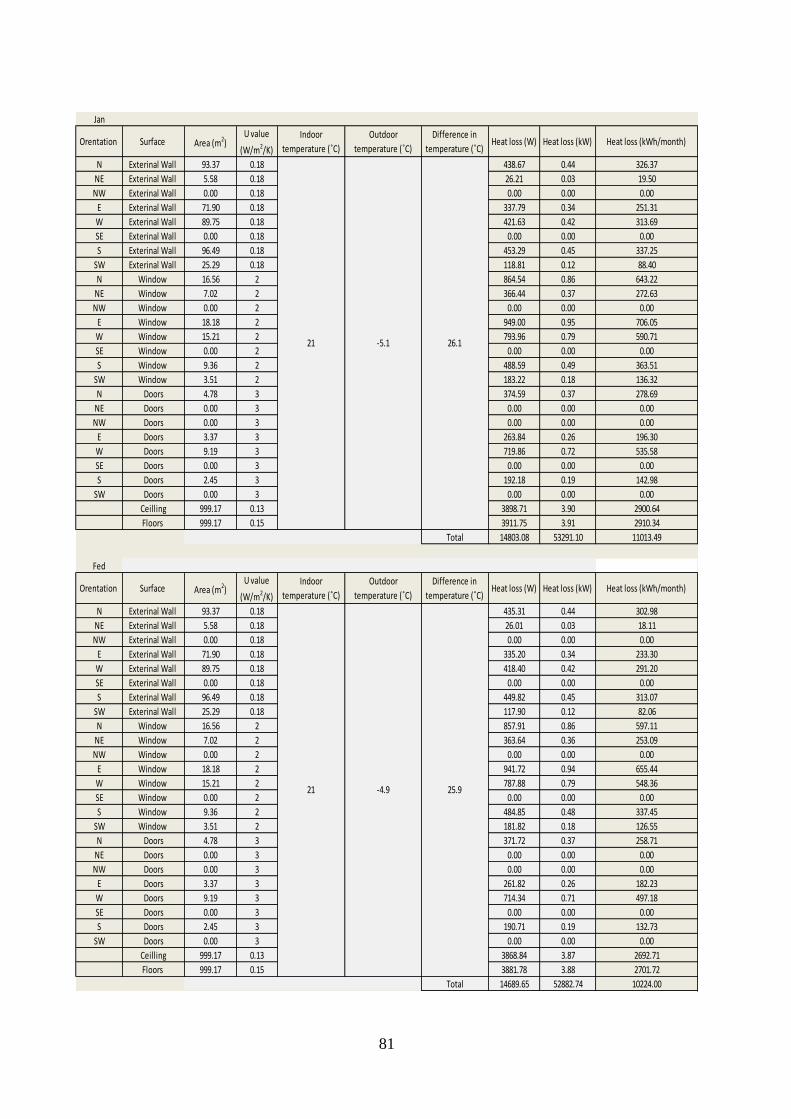
81
Jan
Orentation Surface Area (m2)U value
(W/m2/K)
Indoor
temperature (˚C)
Outdoor
temperature (˚C)
Difference in
temperature (˚C)Heat loss (W) Heat loss (kW) Heat loss (kWh/month)
N Exterinal Wall 93.37 0.18 438.67 0.44 326.37
NE Exterinal Wall 5.58 0.18 26.21 0.03 19.50
NW Exterinal Wall 0.00 0.18 0.00 0.00 0.00
E Exterinal Wall 71.90 0.18 337.79 0.34 251.31
W Exterinal Wall 89.75 0.18 421.63 0.42 313.69
SE Exterinal Wall 0.00 0.18 0.00 0.00 0.00
S Exterinal Wall 96.49 0.18 453.29 0.45 337.25
SW Exterinal Wall 25.29 0.18 118.81 0.12 88.40
N Window 16.56 2 864.54 0.86 643.22
NE Window 7.02 2 366.44 0.37 272.63
NW Window 0.00 2 0.00 0.00 0.00
E Window 18.18 2 949.00 0.95 706.05
W Window 15.21 2 793.96 0.79 590.71
SE Window 0.00 2 0.00 0.00 0.00
S Window 9.36 2 488.59 0.49 363.51
SW Window 3.51 2 183.22 0.18 136.32
N Doors 4.78 3 374.59 0.37 278.69
NE Doors 0.00 3 0.00 0.00 0.00
NW Doors 0.00 3 0.00 0.00 0.00
E Doors 3.37 3 263.84 0.26 196.30
W Doors 9.19 3 719.86 0.72 535.58
SE Doors 0.00 3 0.00 0.00 0.00
S Doors 2.45 3 192.18 0.19 142.98
SW Doors 0.00 3 0.00 0.00 0.00
Ceilling 999.17 0.13 3898.71 3.90 2900.64
Floors 999.17 0.15 3911.75 3.91 2910.34
Total 14803.08 53291.10 11013.49
Fed
Orentation Surface Area (m2)U value
(W/m2/K)
Indoor
temperature (˚C)
Outdoor
temperature (˚C)
Difference in
temperature (˚C)Heat loss (W) Heat loss (kW) Heat loss (kWh/month)
N Exterinal Wall 93.37 0.18 435.31 0.44 302.98
NE Exterinal Wall 5.58 0.18 26.01 0.03 18.11
NW Exterinal Wall 0.00 0.18 0.00 0.00 0.00
E Exterinal Wall 71.90 0.18 335.20 0.34 233.30
W Exterinal Wall 89.75 0.18 418.40 0.42 291.20
SE Exterinal Wall 0.00 0.18 0.00 0.00 0.00
S Exterinal Wall 96.49 0.18 449.82 0.45 313.07
SW Exterinal Wall 25.29 0.18 117.90 0.12 82.06
N Window 16.56 2 857.91 0.86 597.11
NE Window 7.02 2 363.64 0.36 253.09
NW Window 0.00 2 0.00 0.00 0.00
E Window 18.18 2 941.72 0.94 655.44
W Window 15.21 2 787.88 0.79 548.36
SE Window 0.00 2 0.00 0.00 0.00
S Window 9.36 2 484.85 0.48 337.45
SW Window 3.51 2 181.82 0.18 126.55
N Doors 4.78 3 371.72 0.37 258.71
NE Doors 0.00 3 0.00 0.00 0.00
NW Doors 0.00 3 0.00 0.00 0.00
E Doors 3.37 3 261.82 0.26 182.23
W Doors 9.19 3 714.34 0.71 497.18
SE Doors 0.00 3 0.00 0.00 0.00
S Doors 2.45 3 190.71 0.19 132.73
SW Doors 0.00 3 0.00 0.00 0.00
Ceilling 999.17 0.13 3868.84 3.87 2692.71
Floors 999.17 0.15 3881.78 3.88 2701.72
Total 14689.65 52882.74 10224.00
21 -4.9 25.9
21 -5.1 26.1
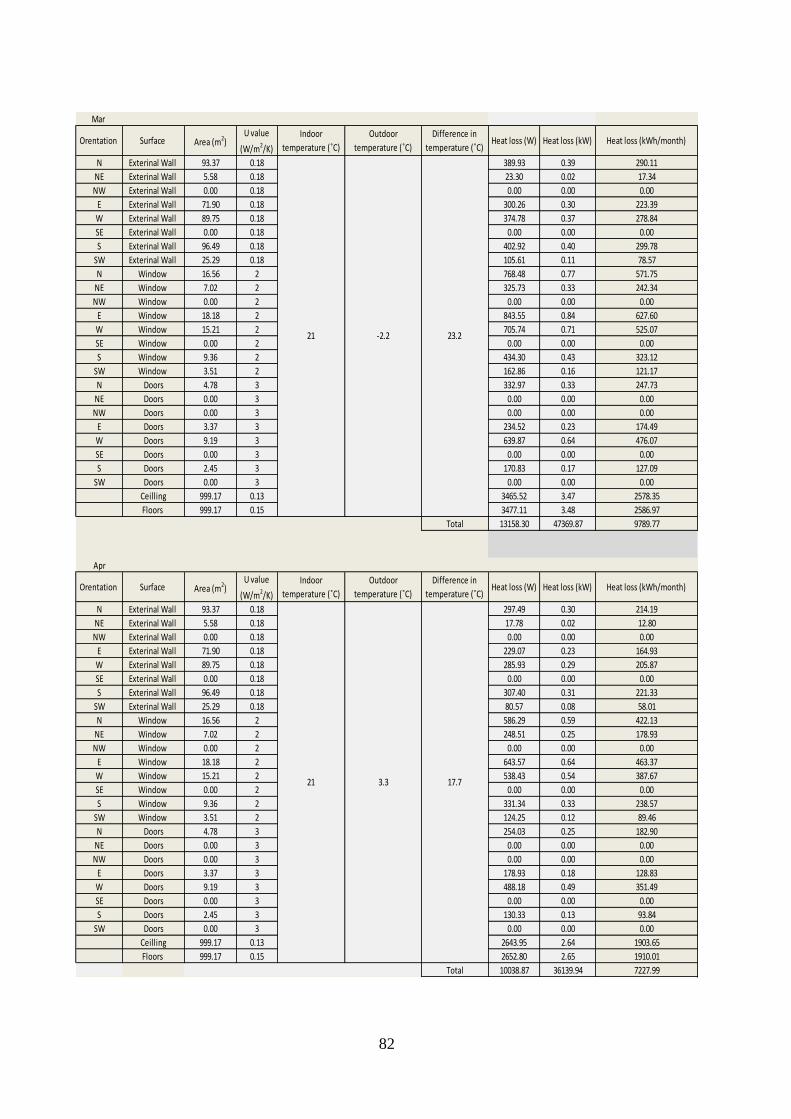
82
Mar
Orentation Surface Area (m2)U value
(W/m2/K)
Indoor
temperature (˚C)
Outdoor
temperature (˚C)
Difference in
temperature (˚C)Heat loss (W) Heat loss (kW) Heat loss (kWh/month)
N Exterinal Wall 93.37 0.18 389.93 0.39 290.11
NE Exterinal Wall 5.58 0.18 23.30 0.02 17.34
NW Exterinal Wall 0.00 0.18 0.00 0.00 0.00
E Exterinal Wall 71.90 0.18 300.26 0.30 223.39
W Exterinal Wall 89.75 0.18 374.78 0.37 278.84
SE Exterinal Wall 0.00 0.18 0.00 0.00 0.00
S Exterinal Wall 96.49 0.18 402.92 0.40 299.78
SW Exterinal Wall 25.29 0.18 105.61 0.11 78.57
N Window 16.56 2 768.48 0.77 571.75
NE Window 7.02 2 325.73 0.33 242.34
NW Window 0.00 2 0.00 0.00 0.00
E Window 18.18 2 843.55 0.84 627.60
W Window 15.21 2 705.74 0.71 525.07
SE Window 0.00 2 0.00 0.00 0.00
S Window 9.36 2 434.30 0.43 323.12
SW Window 3.51 2 162.86 0.16 121.17
N Doors 4.78 3 332.97 0.33 247.73
NE Doors 0.00 3 0.00 0.00 0.00
NW Doors 0.00 3 0.00 0.00 0.00
E Doors 3.37 3 234.52 0.23 174.49
W Doors 9.19 3 639.87 0.64 476.07
SE Doors 0.00 3 0.00 0.00 0.00
S Doors 2.45 3 170.83 0.17 127.09
SW Doors 0.00 3 0.00 0.00 0.00
Ceilling 999.17 0.13 3465.52 3.47 2578.35
Floors 999.17 0.15 3477.11 3.48 2586.97
Total 13158.30 47369.87 9789.77
Apr
Orentation Surface Area (m2)U value
(W/m2/K)
Indoor
temperature (˚C)
Outdoor
temperature (˚C)
Difference in
temperature (˚C)Heat loss (W) Heat loss (kW) Heat loss (kWh/month)
N Exterinal Wall 93.37 0.18 297.49 0.30 214.19
NE Exterinal Wall 5.58 0.18 17.78 0.02 12.80
NW Exterinal Wall 0.00 0.18 0.00 0.00 0.00
E Exterinal Wall 71.90 0.18 229.07 0.23 164.93
W Exterinal Wall 89.75 0.18 285.93 0.29 205.87
SE Exterinal Wall 0.00 0.18 0.00 0.00 0.00
S Exterinal Wall 96.49 0.18 307.40 0.31 221.33
SW Exterinal Wall 25.29 0.18 80.57 0.08 58.01
N Window 16.56 2 586.29 0.59 422.13
NE Window 7.02 2 248.51 0.25 178.93
NW Window 0.00 2 0.00 0.00 0.00
E Window 18.18 2 643.57 0.64 463.37
W Window 15.21 2 538.43 0.54 387.67
SE Window 0.00 2 0.00 0.00 0.00
S Window 9.36 2 331.34 0.33 238.57
SW Window 3.51 2 124.25 0.12 89.46
N Doors 4.78 3 254.03 0.25 182.90
NE Doors 0.00 3 0.00 0.00 0.00
NW Doors 0.00 3 0.00 0.00 0.00
E Doors 3.37 3 178.93 0.18 128.83
W Doors 9.19 3 488.18 0.49 351.49
SE Doors 0.00 3 0.00 0.00 0.00
S Doors 2.45 3 130.33 0.13 93.84
SW Doors 0.00 3 0.00 0.00 0.00
Ceilling 999.17 0.13 2643.95 2.64 1903.65
Floors 999.17 0.15 2652.80 2.65 1910.01
Total 10038.87 36139.94 7227.99
3.3
21 -2.2 23.2
17.721
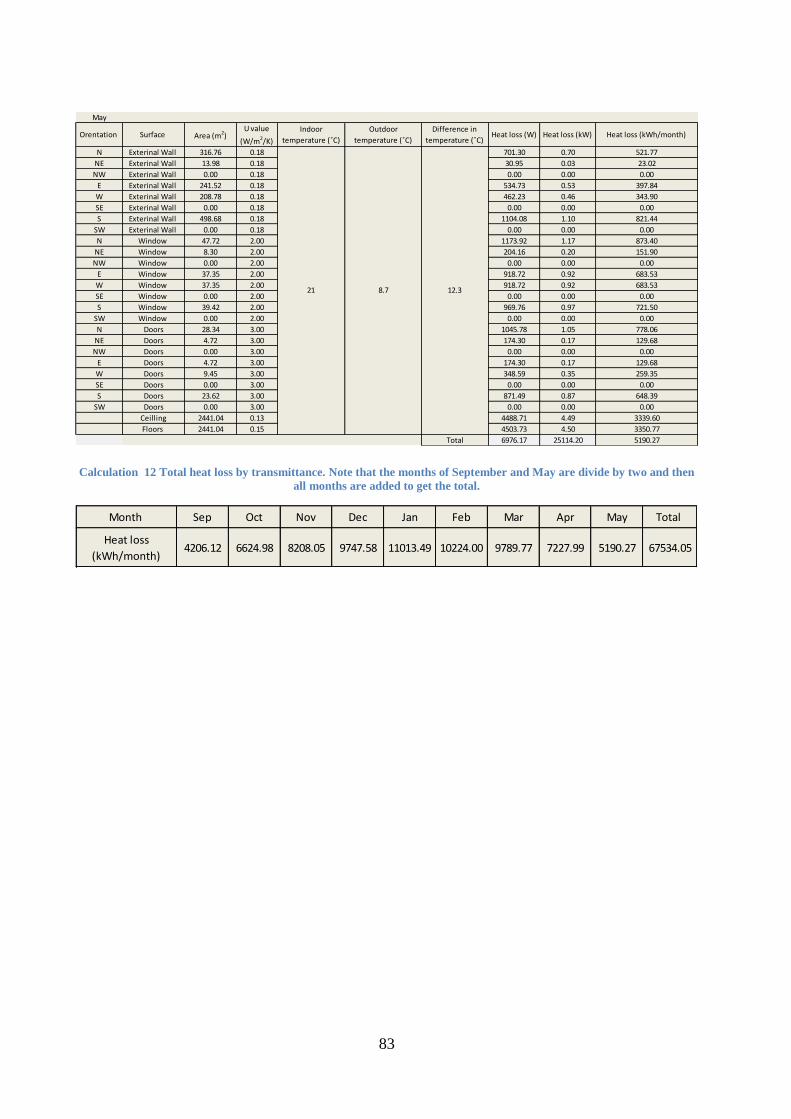
83
Calculation 12 Total heat loss by transmittance. Note that the months of September and May are divide by two and then
all months are added to get the total.
May
Orentation Surface Area (m2)U value
(W/m2/K)
Indoor
temperature (˚C)
Outdoor
temperature (˚C)
Difference in
temperature (˚C)Heat loss (W) Heat loss (kW) Heat loss (kWh/month)
N Exterinal Wall 316.76 0.18 701.30 0.70 521.77
NE Exterinal Wall 13.98 0.18 30.95 0.03 23.02
NW Exterinal Wall 0.00 0.18 0.00 0.00 0.00
E Exterinal Wall 241.52 0.18 534.73 0.53 397.84
W Exterinal Wall 208.78 0.18 462.23 0.46 343.90
SE Exterinal Wall 0.00 0.18 0.00 0.00 0.00
S Exterinal Wall 498.68 0.18 1104.08 1.10 821.44
SW Exterinal Wall 0.00 0.18 0.00 0.00 0.00
N Window 47.72 2.00 1173.92 1.17 873.40
NE Window 8.30 2.00 204.16 0.20 151.90
NW Window 0.00 2.00 0.00 0.00 0.00
E Window 37.35 2.00 918.72 0.92 683.53
W Window 37.35 2.00 918.72 0.92 683.53
SE Window 0.00 2.00 0.00 0.00 0.00
S Window 39.42 2.00 969.76 0.97 721.50
SW Window 0.00 2.00 0.00 0.00 0.00
N Doors 28.34 3.00 1045.78 1.05 778.06
NE Doors 4.72 3.00 174.30 0.17 129.68
NW Doors 0.00 3.00 0.00 0.00 0.00
E Doors 4.72 3.00 174.30 0.17 129.68
W Doors 9.45 3.00 348.59 0.35 259.35
SE Doors 0.00 3.00 0.00 0.00 0.00
S Doors 23.62 3.00 871.49 0.87 648.39
SW Doors 0.00 3.00 0.00 0.00 0.00
Ceilling 2441.04 0.13 4488.71 4.49 3339.60
Floors 2441.04 0.15 4503.73 4.50 3350.77
Total 6976.17 25114.20 5190.27
21 8.7 12.3
Month Sep Oct Nov Dec Jan Feb Mar Apr May Total
Heat loss
(kWh/month)4206.12 6624.98 8208.05 9747.58 11013.49 10224.00 9789.77 7227.99 5190.27 67534.05
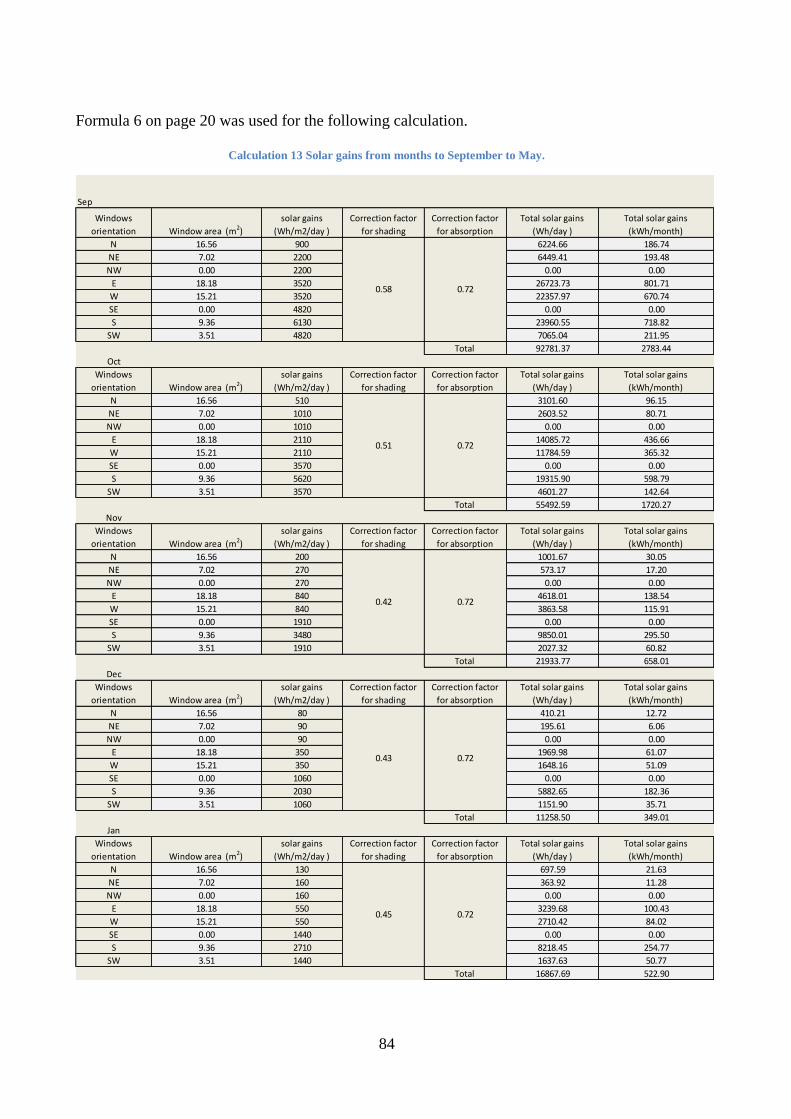
84
Formula 6 on page 20 was used for the following calculation.
Calculation 13 Solar gains from months to September to May.
Sep
Windows
orientation Window area (m2)
solar gains
(Wh/m2/day )
Correction factor
for shading
Correction factor
for absorption
Total solar gains
(Wh/day )
Total solar gains
(kWh/month)
N 16.56 900 6224.66 186.74
NE 7.02 2200 6449.41 193.48
NW 0.00 2200 0.00 0.00
E 18.18 3520 26723.73 801.71
W 15.21 3520 22357.97 670.74
SE 0.00 4820 0.00 0.00
S 9.36 6130 23960.55 718.82
SW 3.51 4820 7065.04 211.95
Total 92781.37 2783.44
Oct
Windows
orientation Window area (m2)
solar gains
(Wh/m2/day )
Correction factor
for shading
Correction factor
for absorption
Total solar gains
(Wh/day )
Total solar gains
(kWh/month)
N 16.56 510 3101.60 96.15
NE 7.02 1010 2603.52 80.71
NW 0.00 1010 0.00 0.00
E 18.18 2110 14085.72 436.66
W 15.21 2110 11784.59 365.32
SE 0.00 3570 0.00 0.00
S 9.36 5620 19315.90 598.79
SW 3.51 3570 4601.27 142.64
Total 55492.59 1720.27
Nov
Windows
orientation Window area (m2)
solar gains
(Wh/m2/day )
Correction factor
for shading
Correction factor
for absorption
Total solar gains
(Wh/day )
Total solar gains
(kWh/month)
N 16.56 200 1001.67 30.05
NE 7.02 270 573.17 17.20
NW 0.00 270 0.00 0.00
E 18.18 840 4618.01 138.54
W 15.21 840 3863.58 115.91
SE 0.00 1910 0.00 0.00
S 9.36 3480 9850.01 295.50
SW 3.51 1910 2027.32 60.82
Total 21933.77 658.01
Dec
Windows
orientation Window area (m2)
solar gains
(Wh/m2/day )
Correction factor
for shading
Correction factor
for absorption
Total solar gains
(Wh/day )
Total solar gains
(kWh/month)
N 16.56 80 410.21 12.72
NE 7.02 90 195.61 6.06
NW 0.00 90 0.00 0.00
E 18.18 350 1969.98 61.07
W 15.21 350 1648.16 51.09
SE 0.00 1060 0.00 0.00
S 9.36 2030 5882.65 182.36
SW 3.51 1060 1151.90 35.71
Total 11258.50 349.01
Jan
Windows
orientation Window area (m2)
solar gains
(Wh/m2/day )
Correction factor
for shading
Correction factor
for absorption
Total solar gains
(Wh/day )
Total solar gains
(kWh/month)
N 16.56 130 697.59 21.63
NE 7.02 160 363.92 11.28
NW 0.00 160 0.00 0.00
E 18.18 550 3239.68 100.43
W 15.21 550 2710.42 84.02
SE 0.00 1440 0.00 0.00
S 9.36 2710 8218.45 254.77
SW 3.51 1440 1637.63 50.77
Total 16867.69 522.90
0.45 0.72
0.58 0.72
0.51 0.72
0.42 0.72
0.43 0.72
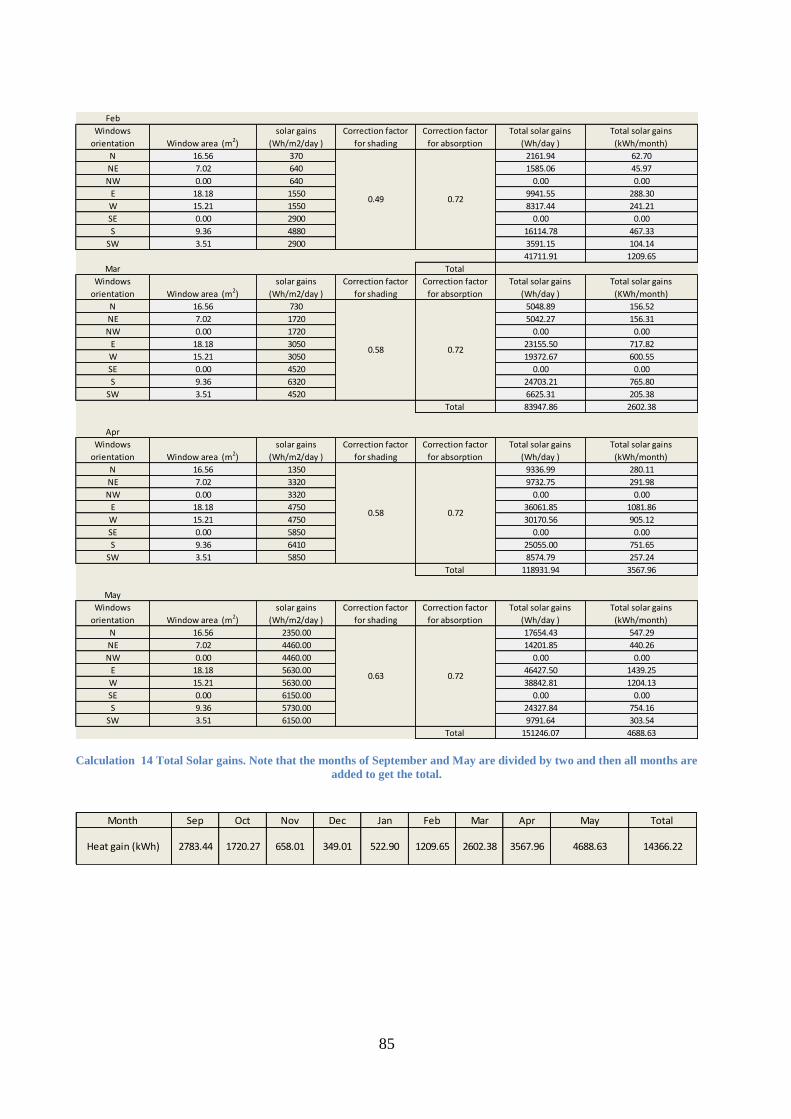
85
Calculation 14 Total Solar gains. Note that the months of September and May are divided by two and then all months are
added to get the total.
Feb
Windows
orientation Window area (m2)
solar gains
(Wh/m2/day )
Correction factor
for shading
Correction factor
for absorption
Total solar gains
(Wh/day )
Total solar gains
(kWh/month)
N 16.56 370 2161.94 62.70
NE 7.02 640 1585.06 45.97
NW 0.00 640 0.00 0.00
E 18.18 1550 9941.55 288.30
W 15.21 1550 8317.44 241.21
SE 0.00 2900 0.00 0.00
S 9.36 4880 16114.78 467.33
SW 3.51 2900 3591.15 104.14
41711.91 1209.65
Mar Total
Windows
orientation Window area (m2)
solar gains
(Wh/m2/day )
Correction factor
for shading
Correction factor
for absorption
Total solar gains
(Wh/day )
Total solar gains
(KWh/month)
N 16.56 730 5048.89 156.52
NE 7.02 1720 5042.27 156.31
NW 0.00 1720 0.00 0.00
E 18.18 3050 23155.50 717.82
W 15.21 3050 19372.67 600.55
SE 0.00 4520 0.00 0.00
S 9.36 6320 24703.21 765.80
SW 3.51 4520 6625.31 205.38
Total 83947.86 2602.38
Apr
Windows
orientation Window area (m2)
solar gains
(Wh/m2/day )
Correction factor
for shading
Correction factor
for absorption
Total solar gains
(Wh/day )
Total solar gains
(kWh/month)
N 16.56 1350 9336.99 280.11
NE 7.02 3320 9732.75 291.98
NW 0.00 3320 0.00 0.00
E 18.18 4750 36061.85 1081.86
W 15.21 4750 30170.56 905.12
SE 0.00 5850 0.00 0.00
S 9.36 6410 25055.00 751.65
SW 3.51 5850 8574.79 257.24
Total 118931.94 3567.96
May
Windows
orientation Window area (m2)
solar gains
(Wh/m2/day )
Correction factor
for shading
Correction factor
for absorption
Total solar gains
(Wh/day )
Total solar gains
(kWh/month)
N 16.56 2350.00 17654.43 547.29
NE 7.02 4460.00 14201.85 440.26
NW 0.00 4460.00 0.00 0.00
E 18.18 5630.00 46427.50 1439.25
W 15.21 5630.00 38842.81 1204.13
SE 0.00 6150.00 0.00 0.00
S 9.36 5730.00 24327.84 754.16
SW 3.51 6150.00 9791.64 303.54
Total 151246.07 4688.63
0.49 0.72
0.63 0.72
0.58 0.72
0.58 0.72
Month Sep Oct Nov Dec Jan Feb Mar Apr May Total
Heat gain (kWh) 2783.44 1720.27 658.01 349.01 522.90 1209.65 2602.38 3567.96 4688.63 14366.22
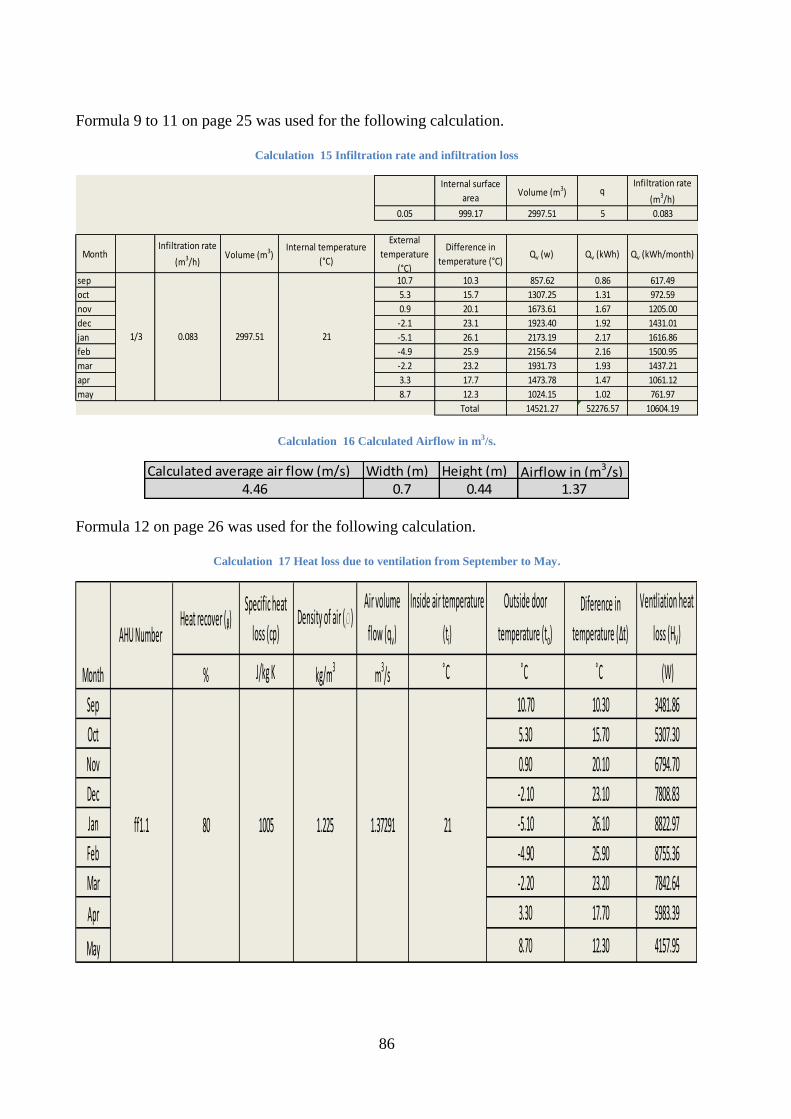
86
Formula 9 to 11 on page 25 was used for the following calculation.
Calculation 15 Infiltration rate and infiltration loss
Calculation 16 Calculated Airflow in m3/s.
Formula 12 on page 26 was used for the following calculation.
Calculation 17 Heat loss due to ventilation from September to May.
Internal surface
area Volume (m3) q
Infiltration rate
(m3/h)
0.05 999.17 2997.51 5 0.083
Month Infiltration rate
(m3/h)Volume (m3)
Internal temperature
(°C)
External
temperature
(°C)
Difference in
temperature (°C)Qv (w) Qv (kWh) Qv (kWh/month)
sep 10.7 10.3 857.62 0.86 617.49
oct 5.3 15.7 1307.25 1.31 972.59
nov 0.9 20.1 1673.61 1.67 1205.00
dec -2.1 23.1 1923.40 1.92 1431.01
jan -5.1 26.1 2173.19 2.17 1616.86
feb -4.9 25.9 2156.54 2.16 1500.95
mar -2.2 23.2 1931.73 1.93 1437.21
apr 3.3 17.7 1473.78 1.47 1061.12
may 8.7 12.3 1024.15 1.02 761.97
Total 14521.27 52276.57 10604.19
1/3 0.083 2997.51 21
Calculated average air flow (m/s) Width (m) Height (m) Airflow in (m3/s)4.46 0.7 0.44 1.37
Heat recover (ᵦ)Specific heat
loss (cp)Density of air (r)
Air volume
flow (qv)
Inside air temperature
(ti)
Outside door
temperature (to)
Diference in
temperature (∆t)
Ventliation heat
loss (HV)
% J/kg K kg/m3 m3/s ͦC ͦC ͦC (W)
Sep 10.70 10.30 3481.86
Oct 5.30 15.70 5307.30
Nov 0.90 20.10 6794.70
Dec -2.10 23.10 7808.83
Jan -5.10 26.10 8822.97
Feb -4.90 25.90 8755.36
Mar -2.20 23.20 7842.64
Apr 3.30 17.70 5983.39
May 8.70 12.30 4157.95
1.225 1.37291 21
AHU Number
Month
ff1.1 80 1005
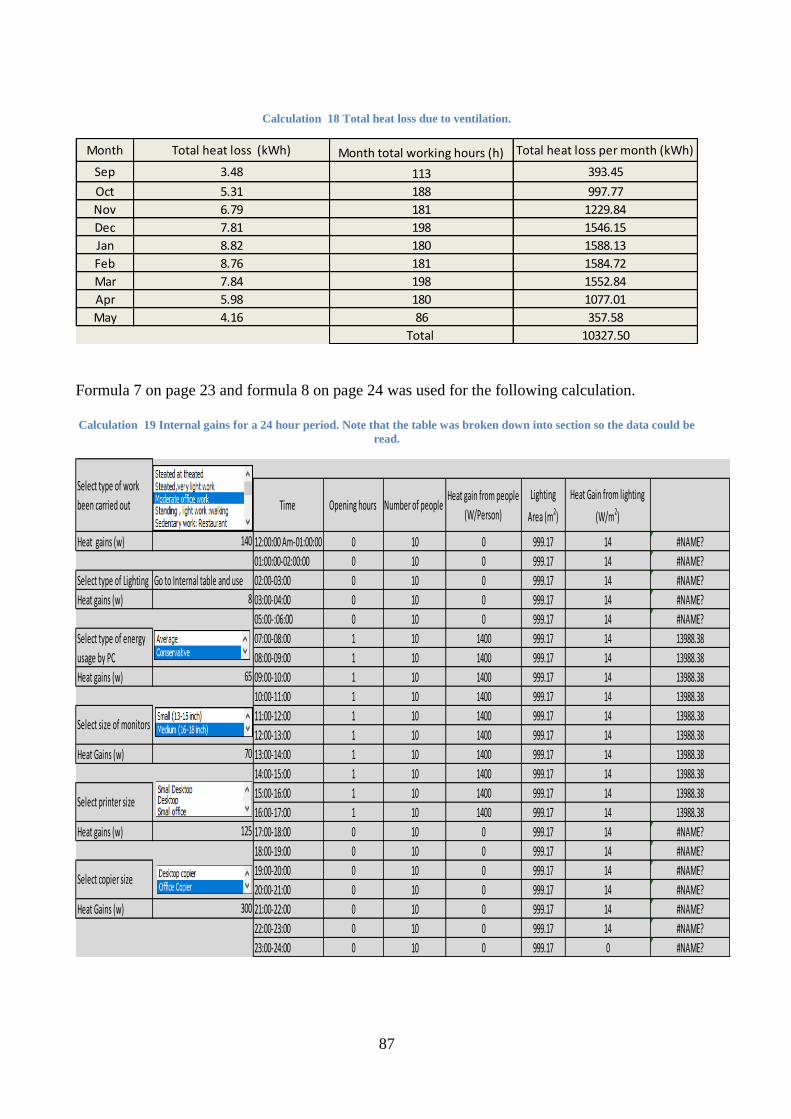
87
Calculation 18 Total heat loss due to ventilation.
Formula 7 on page 23 and formula 8 on page 24 was used for the following calculation.
Calculation 19 Internal gains for a 24 hour period. Note that the table was broken down into section so the data could be
read.
Month Total heat loss (kWh) Month total working hours (h) Total heat loss per month (kWh)
Sep 3.48 113 393.45
Oct 5.31 188 997.77
Nov 6.79 181 1229.84
Dec 7.81 198 1546.15
Jan 8.82 180 1588.13
Feb 8.76 181 1584.72
Mar 7.84 198 1552.84
Apr 5.98 180 1077.01
May 4.16 86 357.58
Total 10327.50
Time Opening hours Number of people Heat gain from people
(W/Person)
Lighting
Area (m2)
Heat Gain from lighting
(W/m2)
Heat gains (w) 12:00:00 Am-01:00:00 0 10 0 999.17 14 #NAME?
01:00:00-02:00:00 0 10 0 999.17 14 #NAME?
Select type of Lighting 02:00-03:00 0 10 0 999.17 14 #NAME?
Heat gains (w) 03:00-04:00 0 10 0 999.17 14 #NAME?
05:00-:06:00 0 10 0 999.17 14 #NAME?
07:00-08:00 1 10 1400 999.17 14 13988.38
08:00-09:00 1 10 1400 999.17 14 13988.38
Heat gains (w) 09:00-10:00 1 10 1400 999.17 14 13988.38
10:00-11:00 1 10 1400 999.17 14 13988.38
11:00-12:00 1 10 1400 999.17 14 13988.38
12:00-13:00 1 10 1400 999.17 14 13988.38
Heat Gains (w) 13:00-14:00 1 10 1400 999.17 14 13988.38
14:00-15:00 1 10 1400 999.17 14 13988.38
15:00-16:00 1 10 1400 999.17 14 13988.38
16:00-17:00 1 10 1400 999.17 14 13988.38
Heat gains (w) 17:00-18:00 0 10 0 999.17 14 #NAME?
18:00-19:00 0 10 0 999.17 14 #NAME?
19:00-20:00 0 10 0 999.17 14 #NAME?
20:00-21:00 0 10 0 999.17 14 #NAME?
Heat Gains (w) 21:00-22:00 0 10 0 999.17 14 #NAME?
22:00-23:00 0 10 0 999.17 14 #NAME?
23:00-24:00 0 10 0 999.17 0 #NAME?
Select size of monitors
70
125
Select printer size
Select copier size
300
Select type of work
been carried out
140
Go to Internal table and use
8
65
Select type of energy
usage by PC
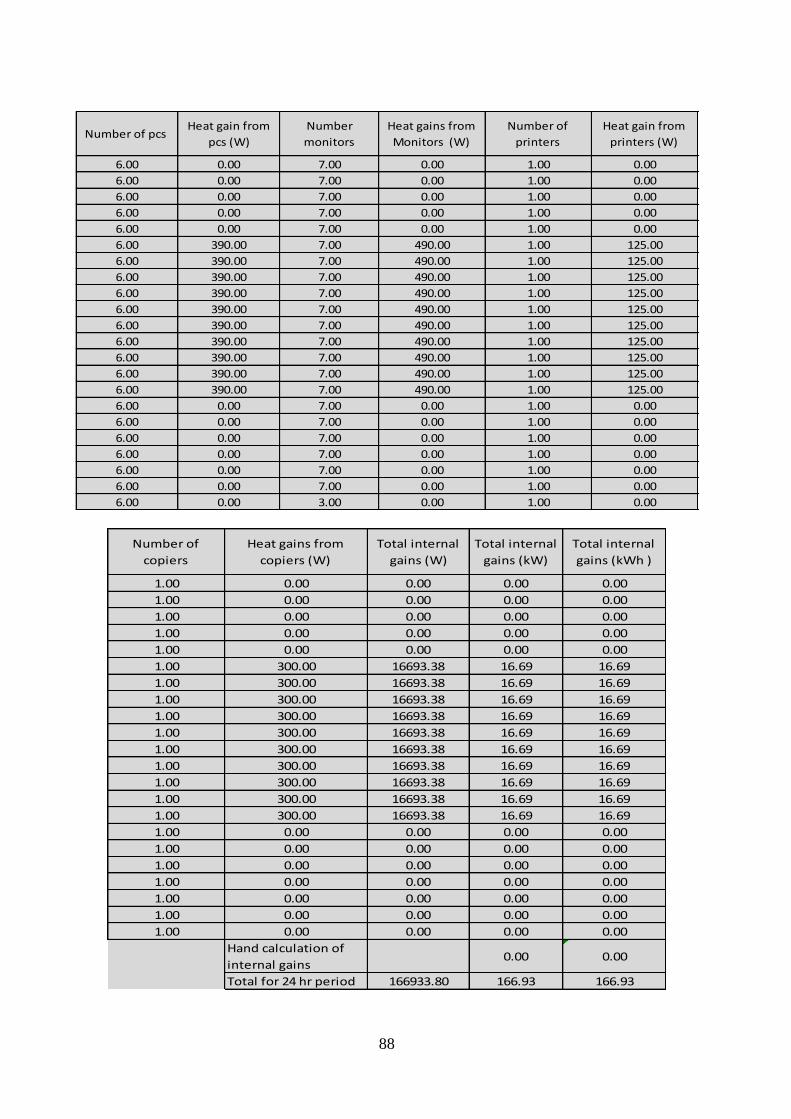
88
Number of pcs Heat gain from
pcs (W)
Number
monitors
Heat gains from
Monitors (W)
Number of
printers
Heat gain from
printers (W)
6.00 0.00 7.00 0.00 1.00 0.00
6.00 0.00 7.00 0.00 1.00 0.00
6.00 0.00 7.00 0.00 1.00 0.00
6.00 0.00 7.00 0.00 1.00 0.00
6.00 0.00 7.00 0.00 1.00 0.00
6.00 390.00 7.00 490.00 1.00 125.00
6.00 390.00 7.00 490.00 1.00 125.00
6.00 390.00 7.00 490.00 1.00 125.00
6.00 390.00 7.00 490.00 1.00 125.00
6.00 390.00 7.00 490.00 1.00 125.00
6.00 390.00 7.00 490.00 1.00 125.00
6.00 390.00 7.00 490.00 1.00 125.00
6.00 390.00 7.00 490.00 1.00 125.00
6.00 390.00 7.00 490.00 1.00 125.00
6.00 390.00 7.00 490.00 1.00 125.00
6.00 0.00 7.00 0.00 1.00 0.00
6.00 0.00 7.00 0.00 1.00 0.00
6.00 0.00 7.00 0.00 1.00 0.00
6.00 0.00 7.00 0.00 1.00 0.00
6.00 0.00 7.00 0.00 1.00 0.00
6.00 0.00 7.00 0.00 1.00 0.00
6.00 0.00 3.00 0.00 1.00 0.00
Number of
copiers
Heat gains from
copiers (W)
Total internal
gains (W)
Total internal
gains (kW)
Total internal
gains (kWh )
1.00 0.00 0.00 0.00 0.00
1.00 0.00 0.00 0.00 0.00
1.00 0.00 0.00 0.00 0.00
1.00 0.00 0.00 0.00 0.00
1.00 0.00 0.00 0.00 0.00
1.00 300.00 16693.38 16.69 16.69
1.00 300.00 16693.38 16.69 16.69
1.00 300.00 16693.38 16.69 16.69
1.00 300.00 16693.38 16.69 16.69
1.00 300.00 16693.38 16.69 16.69
1.00 300.00 16693.38 16.69 16.69
1.00 300.00 16693.38 16.69 16.69
1.00 300.00 16693.38 16.69 16.69
1.00 300.00 16693.38 16.69 16.69
1.00 300.00 16693.38 16.69 16.69
1.00 0.00 0.00 0.00 0.00
1.00 0.00 0.00 0.00 0.00
1.00 0.00 0.00 0.00 0.00
1.00 0.00 0.00 0.00 0.00
1.00 0.00 0.00 0.00 0.00
1.00 0.00 0.00 0.00 0.00
1.00 0.00 0.00 0.00 0.00
Hand calculation of
internal gains 0.00 0.00
Total for 24 hr period 166933.80 166.93 166.93
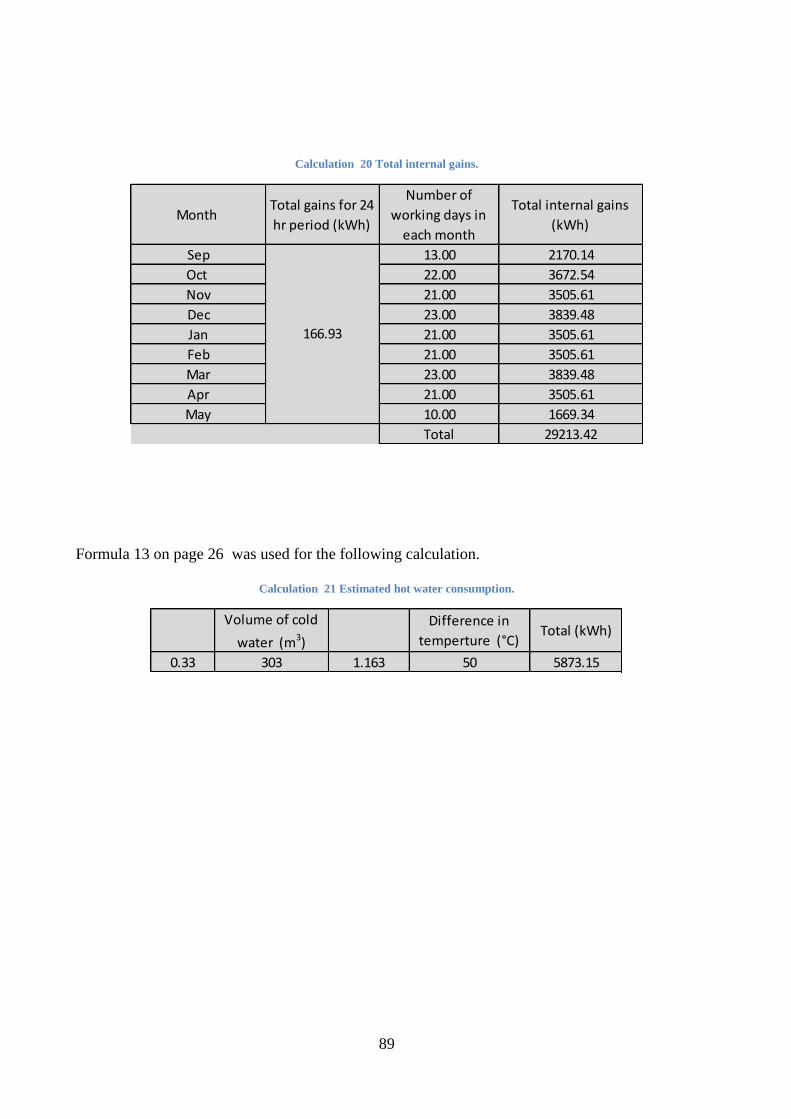
89
Calculation 20 Total internal gains.
Formula 13 on page 26 was used for the following calculation.
Calculation 21 Estimated hot water consumption.
Month Total gains for 24
hr period (kWh)
Number of
working days in
each month
Total internal gains
(kWh)
Sep 13.00 2170.14
Oct 22.00 3672.54
Nov 21.00 3505.61
Dec 23.00 3839.48
Jan 21.00 3505.61
Feb 21.00 3505.61
Mar 23.00 3839.48
Apr 21.00 3505.61
May 10.00 1669.34
Total 29213.42
166.93
Volume of cold
water (m3)
Difference in
temperture (°C)Total (kWh)
0.33 303 1.163 50 5873.15
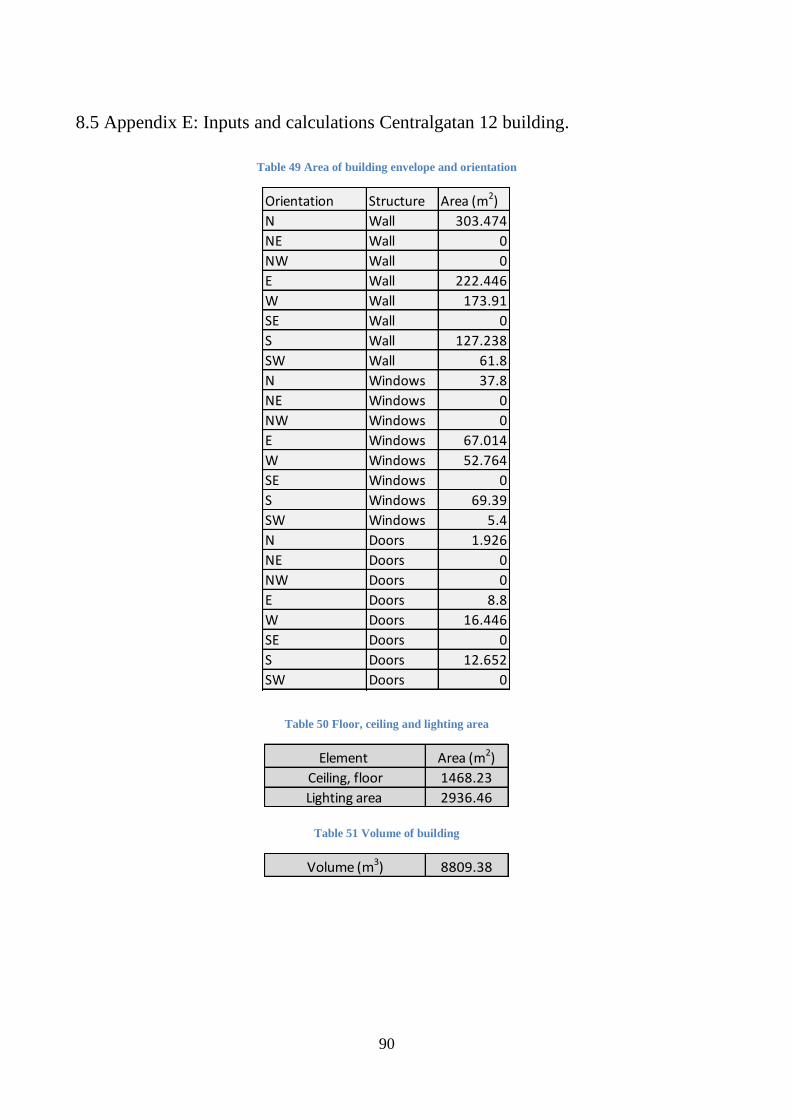
90
8.5 Appendix E: Inputs and calculations Centralgatan 12 building.
Table 49 Area of building envelope and orientation
Table 50 Floor, ceiling and lighting area
Table 51 Volume of building
Orientation Structure Area (m2)
N Wall 303.474
NE Wall 0
NW Wall 0
E Wall 222.446
W Wall 173.91
SE Wall 0
S Wall 127.238
SW Wall 61.8
N Windows 37.8
NE Windows 0
NW Windows 0
E Windows 67.014
W Windows 52.764
SE Windows 0
S Windows 69.39
SW Windows 5.4
N Doors 1.926
NE Doors 0
NW Doors 0
E Doors 8.8
W Doors 16.446
SE Doors 0
S Doors 12.652
SW Doors 0
Element Area (m2)
Ceiling, floor 1468.23
Lighting area 2936.46
Volume (m3) 8809.38
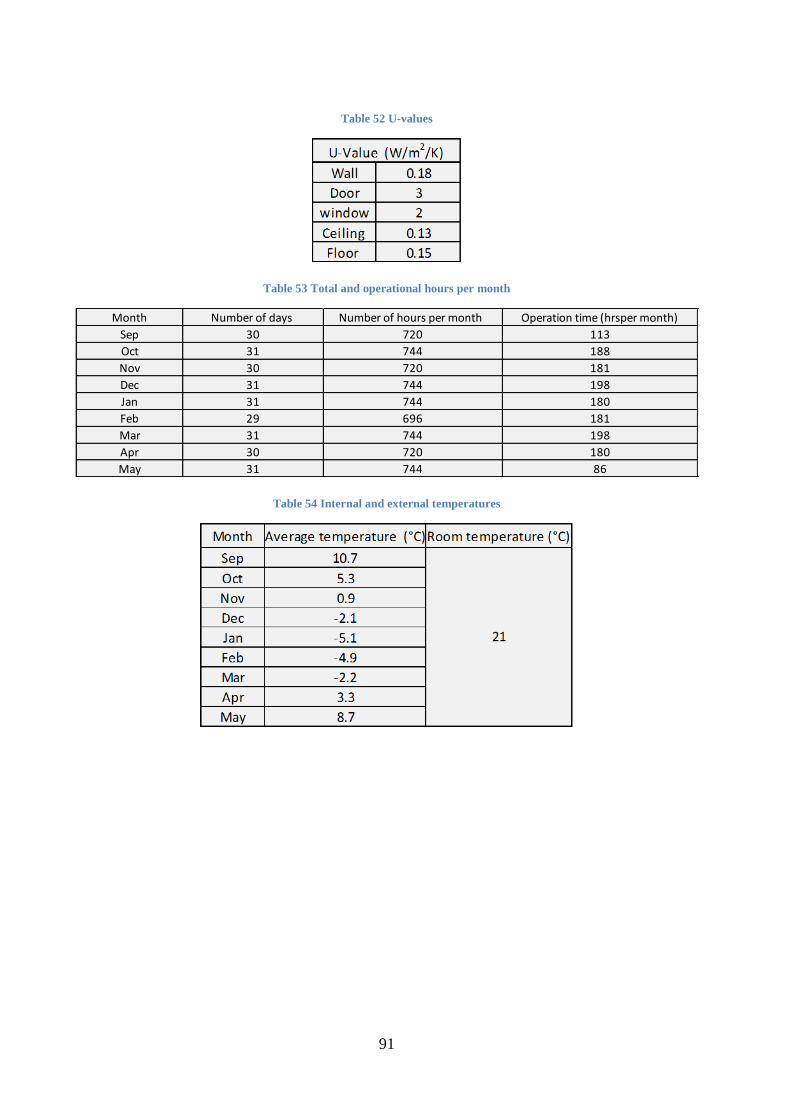
91
Table 52 U-values
Table 53 Total and operational hours per month
Table 54 Internal and external temperatures
Month Number of days Number of hours per month Operation time (hrsper month)
Sep 30 720 113
Oct 31 744 188
Nov 30 720 181
Dec 31 744 198
Jan 31 744 180
Feb 29 696 181
Mar 31 744 198
Apr 30 720 180
May 31 744 86
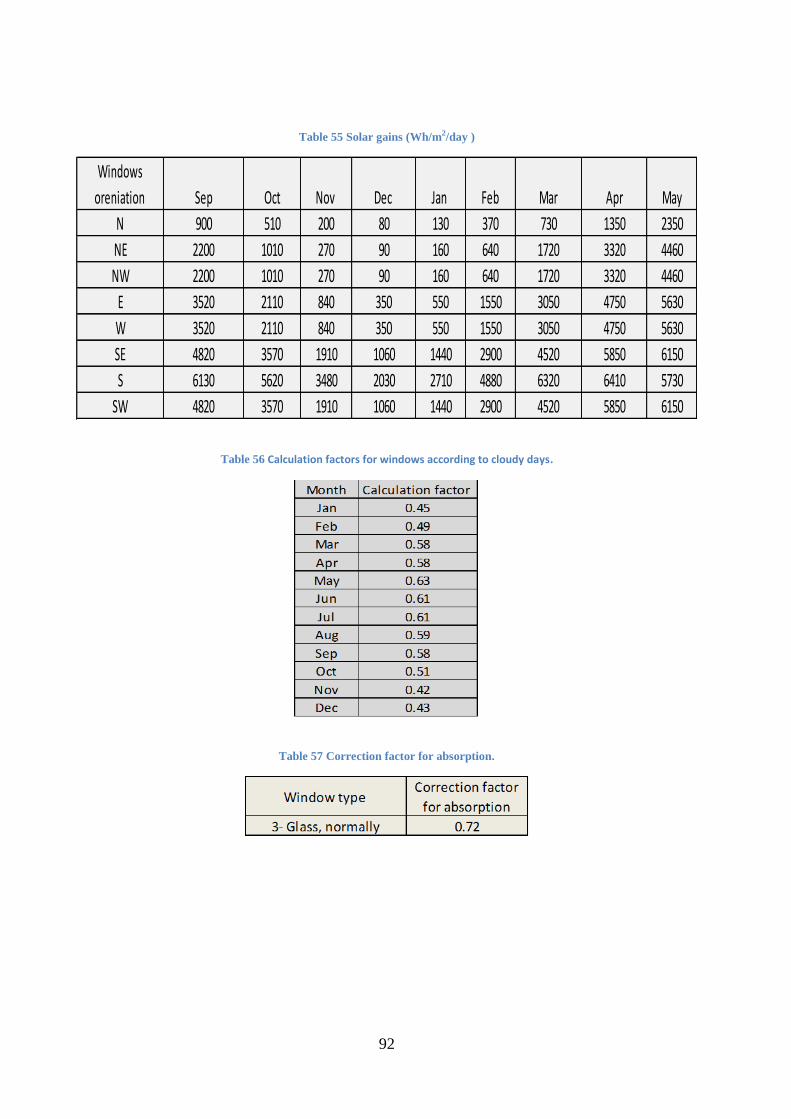
92
Table 55 Solar gains (Wh/m2/day )
Table 56 Calculation factors for windows according to cloudy days.
Table 57 Correction factor for absorption.
Windows
oreniation Sep Oct Nov Dec Jan Feb Mar Apr May
N 900 510 200 80 130 370 730 1350 2350
NE 2200 1010 270 90 160 640 1720 3320 4460
NW 2200 1010 270 90 160 640 1720 3320 4460
E 3520 2110 840 350 550 1550 3050 4750 5630
W 3520 2110 840 350 550 1550 3050 4750 5630
SE 4820 3570 1910 1060 1440 2900 4520 5850 6150
S 6130 5620 3480 2030 2710 4880 6320 6410 5730
SW 4820 3570 1910 1060 1440 2900 4520 5850 6150
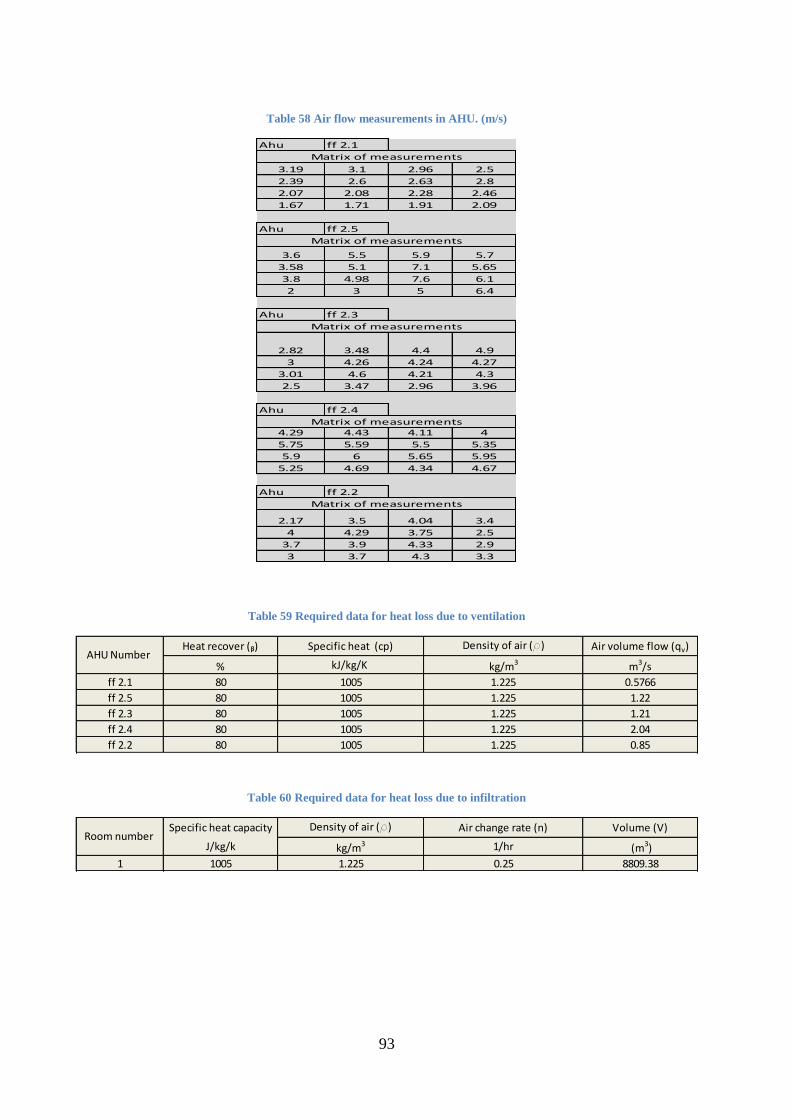
93
Table 58 Air flow measurements in AHU. (m/s)
Table 59 Required data for heat loss due to ventilation
Table 60 Required data for heat loss due to infiltration
Ahu ff 2.1
3.19 3.1 2.96 2.5
2.39 2.6 2.63 2.8
2.07 2.08 2.28 2.46
1.67 1.71 1.91 2.09
Ahu ff 2.5
3.6 5.5 5.9 5.7
3.58 5.1 7.1 5.65
3.8 4.98 7.6 6.1
2 3 5 6.4
Ahu ff 2.3
2.82 3.48 4.4 4.9
3 4.26 4.24 4.27
3.01 4.6 4.21 4.3
2.5 3.47 2.96 3.96
Ahu ff 2.4
4.29 4.43 4.11 4
5.75 5.59 5.5 5.35
5.9 6 5.65 5.95
5.25 4.69 4.34 4.67
Ahu ff 2.2
2.17 3.5 4.04 3.4
4 4.29 3.75 2.5
3.7 3.9 4.33 2.9
3 3.7 4.3 3.3
Matrix of measurements
Matrix of measurements
Matrix of measurements
Matrix of measurements
Matrix of measurements
Heat recover (ᵦ) Specific heat (cp) Density of air (r) Air volume flow (qv)
% kJ/kg/K kg/m3 m3/s
ff 2.1 80 1005 1.225 0.5766
ff 2.5 80 1005 1.225 1.22
ff 2.3 80 1005 1.225 1.21
ff 2.4 80 1005 1.225 2.04
ff 2.2 80 1005 1.225 0.85
AHU Number
Specific heat capacity Density of air (r) Air change rate (n) Volume (V)
J/kg/k kg/m3 1/hr (m3)
1 1005 1.225 0.25 8809.38
Room number
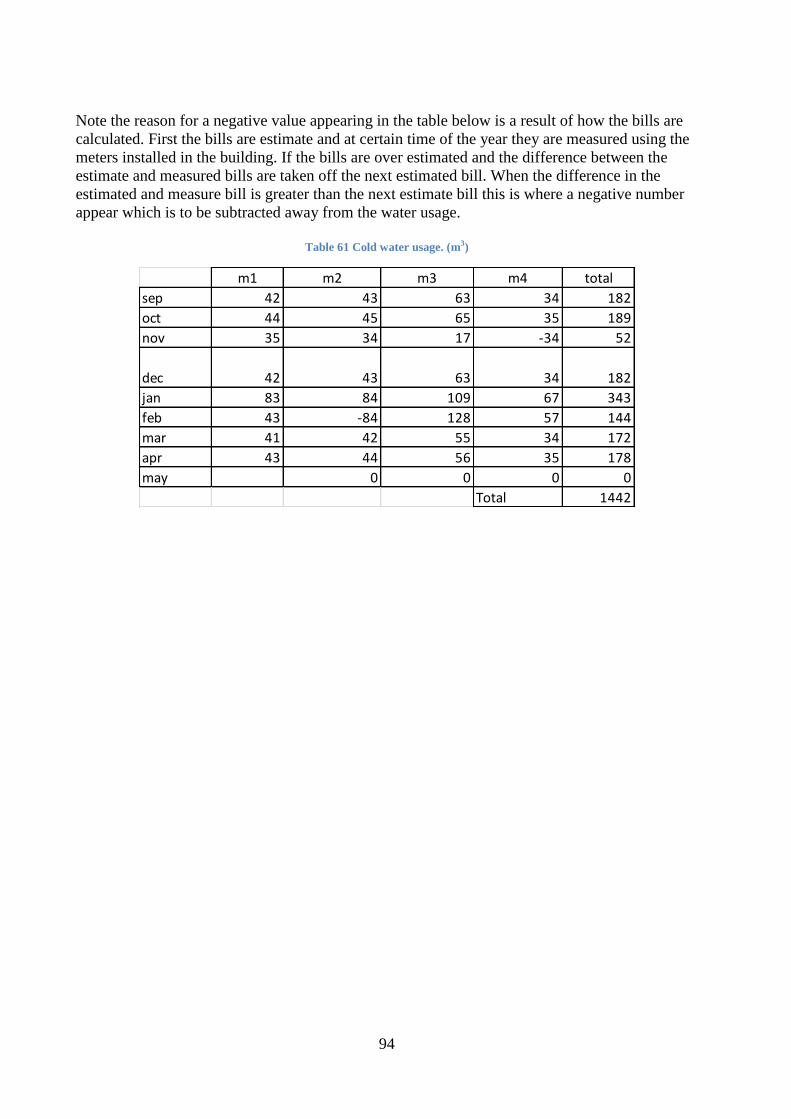
94
Note the reason for a negative value appearing in the table below is a result of how the bills are
calculated. First the bills are estimate and at certain time of the year they are measured using the
meters installed in the building. If the bills are over estimated and the difference between the
estimate and measured bills are taken off the next estimated bill. When the difference in the
estimated and measure bill is greater than the next estimate bill this is where a negative number
appear which is to be subtracted away from the water usage.
Table 61 Cold water usage. (m3)
m1 m2 m3 m4 total
sep 42 43 63 34 182
oct 44 45 65 35 189
nov 35 34 17 -34 52
dec 42 43 63 34 182
jan 83 84 109 67 343
feb 43 -84 128 57 144
mar 41 42 55 34 172
apr 43 44 56 35 178
may 0 0 0 0
Total 1442
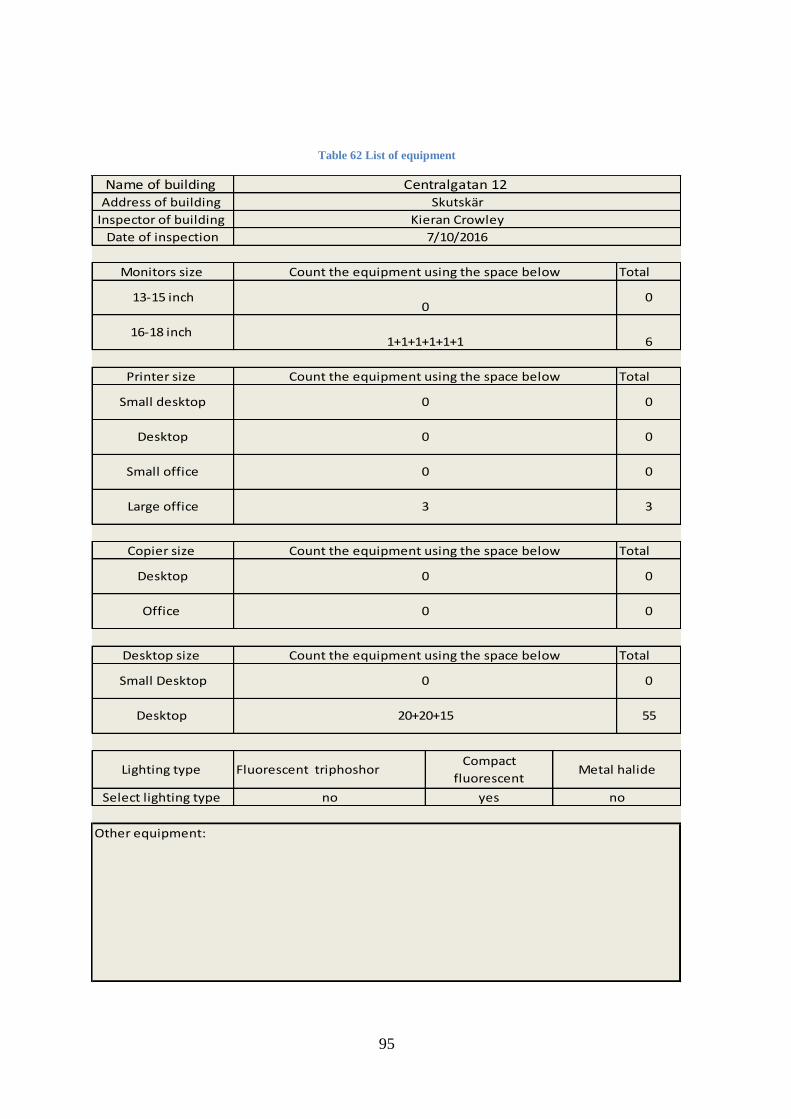
95
Table 62 List of equipment
Total
Total
Total
Total
Fluorescent triphoshor
Other equipment:
Name of building Address of building
Inspector of building
Count the equipment using the space below
13-15 inch0
Date of inspection
Centralgatan 12 Skutskär
Kieran Crowley
7/10/2016
Monitors size
0
16-18 inch 1+1+1+1+1+1 6
Printer size Count the equipment using the space below
Small desktop 0 0
Desktop 0 0
Office 0 0
Small office 0 0
Large office 3 3
Copier size Count the equipment using the space below
Desktop 0 0
Small Desktop 0 0
Desktop size Count the equipment using the space below
Desktop 20+20+15 55
Lighting type Compact
fluorescent Metal halide
Select lighting type no yes no

96
Once the data was entered into the excel tool the following calculations were obtained.
Formula 5 on page 20 was used for the following calculation.
Calculation 22 Heat loss by transmittance from September to May.
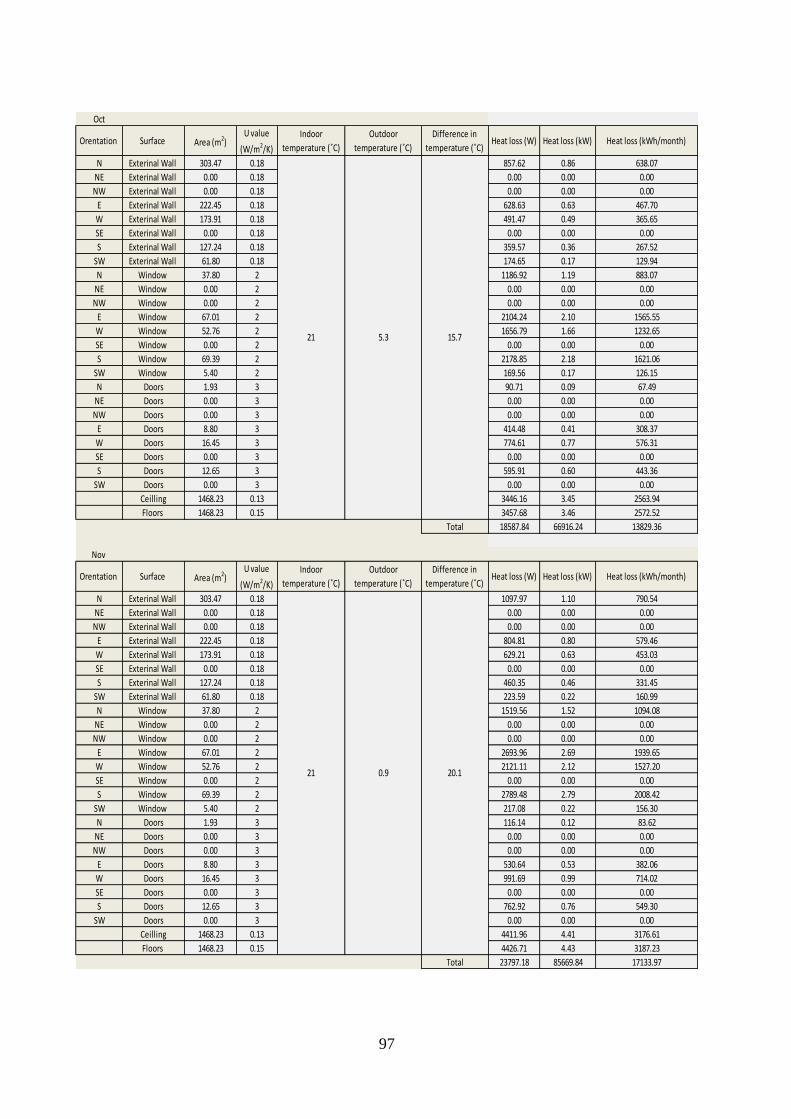
97
Oct
Orentation Surface Area (m2)U value
(W/m2/K)
Indoor
temperature (˚C)
Outdoor
temperature (˚C)
Difference in
temperature (˚C)Heat loss (W) Heat loss (kW) Heat loss (kWh/month)
N Exterinal Wall 303.47 0.18 857.62 0.86 638.07
NE Exterinal Wall 0.00 0.18 0.00 0.00 0.00
NW Exterinal Wall 0.00 0.18 0.00 0.00 0.00
E Exterinal Wall 222.45 0.18 628.63 0.63 467.70
W Exterinal Wall 173.91 0.18 491.47 0.49 365.65
SE Exterinal Wall 0.00 0.18 0.00 0.00 0.00
S Exterinal Wall 127.24 0.18 359.57 0.36 267.52
SW Exterinal Wall 61.80 0.18 174.65 0.17 129.94
N Window 37.80 2 1186.92 1.19 883.07
NE Window 0.00 2 0.00 0.00 0.00
NW Window 0.00 2 0.00 0.00 0.00
E Window 67.01 2 2104.24 2.10 1565.55
W Window 52.76 2 1656.79 1.66 1232.65
SE Window 0.00 2 0.00 0.00 0.00
S Window 69.39 2 2178.85 2.18 1621.06
SW Window 5.40 2 169.56 0.17 126.15
N Doors 1.93 3 90.71 0.09 67.49
NE Doors 0.00 3 0.00 0.00 0.00
NW Doors 0.00 3 0.00 0.00 0.00
E Doors 8.80 3 414.48 0.41 308.37
W Doors 16.45 3 774.61 0.77 576.31
SE Doors 0.00 3 0.00 0.00 0.00
S Doors 12.65 3 595.91 0.60 443.36
SW Doors 0.00 3 0.00 0.00 0.00
Ceilling 1468.23 0.13 3446.16 3.45 2563.94
Floors 1468.23 0.15 3457.68 3.46 2572.52
Total 18587.84 66916.24 13829.36
Nov
Orentation Surface Area (m2)U value
(W/m2/K)
Indoor
temperature (˚C)
Outdoor
temperature (˚C)
Difference in
temperature (˚C)Heat loss (W) Heat loss (kW) Heat loss (kWh/month)
N Exterinal Wall 303.47 0.18 1097.97 1.10 790.54
NE Exterinal Wall 0.00 0.18 0.00 0.00 0.00
NW Exterinal Wall 0.00 0.18 0.00 0.00 0.00
E Exterinal Wall 222.45 0.18 804.81 0.80 579.46
W Exterinal Wall 173.91 0.18 629.21 0.63 453.03
SE Exterinal Wall 0.00 0.18 0.00 0.00 0.00
S Exterinal Wall 127.24 0.18 460.35 0.46 331.45
SW Exterinal Wall 61.80 0.18 223.59 0.22 160.99
N Window 37.80 2 1519.56 1.52 1094.08
NE Window 0.00 2 0.00 0.00 0.00
NW Window 0.00 2 0.00 0.00 0.00
E Window 67.01 2 2693.96 2.69 1939.65
W Window 52.76 2 2121.11 2.12 1527.20
SE Window 0.00 2 0.00 0.00 0.00
S Window 69.39 2 2789.48 2.79 2008.42
SW Window 5.40 2 217.08 0.22 156.30
N Doors 1.93 3 116.14 0.12 83.62
NE Doors 0.00 3 0.00 0.00 0.00
NW Doors 0.00 3 0.00 0.00 0.00
E Doors 8.80 3 530.64 0.53 382.06
W Doors 16.45 3 991.69 0.99 714.02
SE Doors 0.00 3 0.00 0.00 0.00
S Doors 12.65 3 762.92 0.76 549.30
SW Doors 0.00 3 0.00 0.00 0.00
Ceilling 1468.23 0.13 4411.96 4.41 3176.61
Floors 1468.23 0.15 4426.71 4.43 3187.23
Total 23797.18 85669.84 17133.97
0.9 20.121
21 5.3 15.7
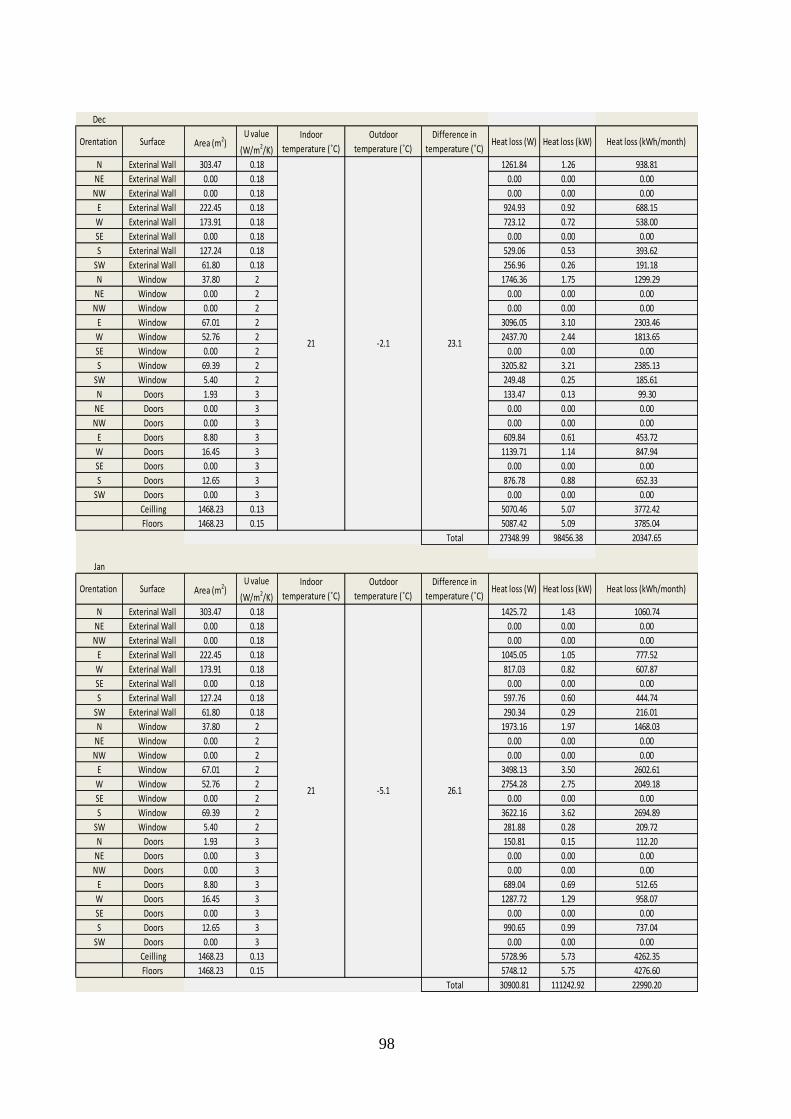
98
Dec
Orentation Surface Area (m2)U value
(W/m2/K)
Indoor
temperature (˚C)
Outdoor
temperature (˚C)
Difference in
temperature (˚C)Heat loss (W) Heat loss (kW) Heat loss (kWh/month)
N Exterinal Wall 303.47 0.18 1261.84 1.26 938.81
NE Exterinal Wall 0.00 0.18 0.00 0.00 0.00
NW Exterinal Wall 0.00 0.18 0.00 0.00 0.00
E Exterinal Wall 222.45 0.18 924.93 0.92 688.15
W Exterinal Wall 173.91 0.18 723.12 0.72 538.00
SE Exterinal Wall 0.00 0.18 0.00 0.00 0.00
S Exterinal Wall 127.24 0.18 529.06 0.53 393.62
SW Exterinal Wall 61.80 0.18 256.96 0.26 191.18
N Window 37.80 2 1746.36 1.75 1299.29
NE Window 0.00 2 0.00 0.00 0.00
NW Window 0.00 2 0.00 0.00 0.00
E Window 67.01 2 3096.05 3.10 2303.46
W Window 52.76 2 2437.70 2.44 1813.65
SE Window 0.00 2 0.00 0.00 0.00
S Window 69.39 2 3205.82 3.21 2385.13
SW Window 5.40 2 249.48 0.25 185.61
N Doors 1.93 3 133.47 0.13 99.30
NE Doors 0.00 3 0.00 0.00 0.00
NW Doors 0.00 3 0.00 0.00 0.00
E Doors 8.80 3 609.84 0.61 453.72
W Doors 16.45 3 1139.71 1.14 847.94
SE Doors 0.00 3 0.00 0.00 0.00
S Doors 12.65 3 876.78 0.88 652.33
SW Doors 0.00 3 0.00 0.00 0.00
Ceilling 1468.23 0.13 5070.46 5.07 3772.42
Floors 1468.23 0.15 5087.42 5.09 3785.04
Total 27348.99 98456.38 20347.65
Jan
Orentation Surface Area (m2)U value
(W/m2/K)
Indoor
temperature (˚C)
Outdoor
temperature (˚C)
Difference in
temperature (˚C)Heat loss (W) Heat loss (kW) Heat loss (kWh/month)
N Exterinal Wall 303.47 0.18 1425.72 1.43 1060.74
NE Exterinal Wall 0.00 0.18 0.00 0.00 0.00
NW Exterinal Wall 0.00 0.18 0.00 0.00 0.00
E Exterinal Wall 222.45 0.18 1045.05 1.05 777.52
W Exterinal Wall 173.91 0.18 817.03 0.82 607.87
SE Exterinal Wall 0.00 0.18 0.00 0.00 0.00
S Exterinal Wall 127.24 0.18 597.76 0.60 444.74
SW Exterinal Wall 61.80 0.18 290.34 0.29 216.01
N Window 37.80 2 1973.16 1.97 1468.03
NE Window 0.00 2 0.00 0.00 0.00
NW Window 0.00 2 0.00 0.00 0.00
E Window 67.01 2 3498.13 3.50 2602.61
W Window 52.76 2 2754.28 2.75 2049.18
SE Window 0.00 2 0.00 0.00 0.00
S Window 69.39 2 3622.16 3.62 2694.89
SW Window 5.40 2 281.88 0.28 209.72
N Doors 1.93 3 150.81 0.15 112.20
NE Doors 0.00 3 0.00 0.00 0.00
NW Doors 0.00 3 0.00 0.00 0.00
E Doors 8.80 3 689.04 0.69 512.65
W Doors 16.45 3 1287.72 1.29 958.07
SE Doors 0.00 3 0.00 0.00 0.00
S Doors 12.65 3 990.65 0.99 737.04
SW Doors 0.00 3 0.00 0.00 0.00
Ceilling 1468.23 0.13 5728.96 5.73 4262.35
Floors 1468.23 0.15 5748.12 5.75 4276.60
Total 30900.81 111242.92 22990.20
21 -5.1 26.1
21 -2.1 23.1

99
Feb
Orentation Surface Area (m2)U value
(W/m2/K)
Indoor
temperature (˚C)
Outdoor
temperature (˚C)
Difference in
temperature (˚C)Heat loss (W) Heat loss (kW) Heat loss (kWh/month)
N Exterinal Wall 303.47 0.18 1414.80 1.41 984.70
NE Exterinal Wall 0.00 0.18 0.00 0.00 0.00
NW Exterinal Wall 0.00 0.18 0.00 0.00 0.00
E Exterinal Wall 222.45 0.18 1037.04 1.04 721.78
W Exterinal Wall 173.91 0.18 810.77 0.81 564.29
SE Exterinal Wall 0.00 0.18 0.00 0.00 0.00
S Exterinal Wall 127.24 0.18 593.18 0.59 412.86
SW Exterinal Wall 61.80 0.18 288.11 0.29 200.53
N Window 37.80 2 1958.04 1.96 1362.80
NE Window 0.00 2 0.00 0.00 0.00
NW Window 0.00 2 0.00 0.00 0.00
E Window 67.01 2 3471.33 3.47 2416.04
W Window 52.76 2 2733.18 2.73 1902.29
SE Window 0.00 2 0.00 0.00 0.00
S Window 69.39 2 3594.40 3.59 2501.70
SW Window 5.40 2 279.72 0.28 194.69
N Doors 1.93 3 149.65 0.15 104.16
NE Doors 0.00 3 0.00 0.00 0.00
NW Doors 0.00 3 0.00 0.00 0.00
E Doors 8.80 3 683.76 0.68 475.90
W Doors 16.45 3 1277.85 1.28 889.39
SE Doors 0.00 3 0.00 0.00 0.00
S Doors 12.65 3 983.06 0.98 684.21
SW Doors 0.00 3 0.00 0.00 0.00
Ceilling 1468.23 0.13 5685.06 5.69 3956.80
Floors 1468.23 0.15 5704.07 5.70 3970.04
Total 30664.02 110390.48 21342.16
Mar
Orentation Surface Area (m2)U value
(W/m2/K)
Indoor
temperature (˚C)
Outdoor
temperature (˚C)
Difference in
temperature (˚C)Heat loss (W) Heat loss (kW) Heat loss (kWh/month)
N Exterinal Wall 303.47 0.18 1267.31 1.27 942.88
NE Exterinal Wall 0.00 0.18 0.00 0.00 0.00
NW Exterinal Wall 0.00 0.18 0.00 0.00 0.00
E Exterinal Wall 222.45 0.18 928.93 0.93 691.13
W Exterinal Wall 173.91 0.18 726.25 0.73 540.33
SE Exterinal Wall 0.00 0.18 0.00 0.00 0.00
S Exterinal Wall 127.24 0.18 531.35 0.53 395.32
SW Exterinal Wall 61.80 0.18 258.08 0.26 192.01
N Window 37.80 2 1753.92 1.75 1304.92
NE Window 0.00 2 0.00 0.00 0.00
NW Window 0.00 2 0.00 0.00 0.00
E Window 67.01 2 3109.45 3.11 2313.43
W Window 52.76 2 2448.25 2.45 1821.50
SE Window 0.00 2 0.00 0.00 0.00
S Window 69.39 2 3219.70 3.22 2395.45
SW Window 5.40 2 250.56 0.25 186.42
N Doors 1.93 3 134.05 0.13 99.73
NE Doors 0.00 3 0.00 0.00 0.00
NW Doors 0.00 3 0.00 0.00 0.00
E Doors 8.80 3 612.48 0.61 455.69
W Doors 16.45 3 1144.64 1.14 851.61
SE Doors 0.00 3 0.00 0.00 0.00
S Doors 12.65 3 880.58 0.88 655.15
SW Doors 0.00 3 0.00 0.00 0.00
Ceilling 1468.23 0.13 5092.41 5.09 3788.75
Floors 1468.23 0.15 5109.44 5.11 3801.42
Total 27467.39 98882.60 20435.74
21 -2.2 23.2
21 -4.9 25.9

100
Calculation 23 Total heat loss by transmittance. Note that the months of September and May are divide by two and then
all months are added to get the total.
Apr
Orentation Surface Area (m2)U value
(W/m2/K)
Indoor
temperature (˚C)
Outdoor
temperature (˚C)
Difference in
temperature (˚C)Heat loss (W) Heat loss (kW) Heat loss (kWh/month)
N Exterinal Wall 303.47 0.18 966.87 0.97 696.15
NE Exterinal Wall 0.00 0.18 0.00 0.00 0.00
NW Exterinal Wall 0.00 0.18 0.00 0.00 0.00
E Exterinal Wall 222.45 0.18 708.71 0.71 510.27
W Exterinal Wall 173.91 0.18 554.08 0.55 398.94
SE Exterinal Wall 0.00 0.18 0.00 0.00 0.00
S Exterinal Wall 127.24 0.18 405.38 0.41 291.87
SW Exterinal Wall 61.80 0.18 196.89 0.20 141.76
N Window 37.80 2 1338.12 1.34 963.45
NE Window 0.00 2 0.00 0.00 0.00
NW Window 0.00 2 0.00 0.00 0.00
E Window 67.01 2 2372.30 2.37 1708.05
W Window 52.76 2 1867.85 1.87 1344.85
SE Window 0.00 2 0.00 0.00 0.00
S Window 69.39 2 2456.41 2.46 1768.61
SW Window 5.40 2 191.16 0.19 137.64
N Doors 1.93 3 102.27 0.10 73.63
NE Doors 0.00 3 0.00 0.00 0.00
NW Doors 0.00 3 0.00 0.00 0.00
E Doors 8.80 3 467.28 0.47 336.44
W Doors 16.45 3 873.28 0.87 628.76
SE Doors 0.00 3 0.00 0.00 0.00
S Doors 12.65 3 671.82 0.67 483.71
SW Doors 0.00 3 0.00 0.00 0.00
Ceilling 1468.23 0.13 3885.16 3.89 2797.31
Floors 1468.23 0.15 3898.15 3.90 2806.67
Total 20955.72 75440.60 15088.12
May
Orentation Surface Area (m2)U value
(W/m2/K)
Indoor
temperature (˚C)
Outdoor
temperature (˚C)
Difference in
temperature (˚C)Heat loss (W) Heat loss (kW) Heat loss (kWh/month)
N Exterinal Wall 303.47 0.18 671.89 0.67 499.89
NE Exterinal Wall 0.00 0.18 0.00 0.00 0.00
NW Exterinal Wall 0.00 0.18 0.00 0.00 0.00
E Exterinal Wall 222.45 0.18 492.50 0.49 366.42
W Exterinal Wall 173.91 0.18 385.04 0.39 286.47
SE Exterinal Wall 0.00 0.18 0.00 0.00 0.00
S Exterinal Wall 127.24 0.18 281.70 0.28 209.59
SW Exterinal Wall 61.80 0.18 136.83 0.14 101.80
N Window 37.80 2.00 929.88 0.93 691.83
NE Window 0.00 2.00 0.00 0.00 0.00
NW Window 0.00 2.00 0.00 0.00 0.00
E Window 67.01 2.00 1648.54 1.65 1226.52
W Window 52.76 2.00 1297.99 1.30 965.71
SE Window 0.00 2.00 0.00 0.00 0.00
S Window 69.39 2.00 1706.99 1.71 1270.00
SW Window 5.40 2.00 132.84 0.13 98.83
N Doors 1.93 3.00 71.07 0.07 52.88
NE Doors 0.00 3.00 0.00 0.00 0.00
NW Doors 0.00 3.00 0.00 0.00 0.00
E Doors 8.80 3.00 324.72 0.32 241.59
W Doors 16.45 3.00 606.86 0.61 451.50
SE Doors 0.00 3.00 0.00 0.00 0.00
S Doors 12.65 3.00 466.86 0.47 347.34
SW Doors 0.00 3.00 0.00 0.00 0.00
Ceilling 1468.23 0.13 2699.85 2.70 2008.69
Floors 1468.23 0.15 2708.88 2.71 2015.41
Total 14562.45 52424.82 10834.46
21 3.3 17.7
21 8.7 12.3
Month Sep Oct Nov Dec Jan Feb Mar Apr May Total
Heat loss
(kWh/month)8780.09 13829.36 17133.97 20347.65 22990.20 21342.16 20435.74 15088.12 10834.46 140974.47
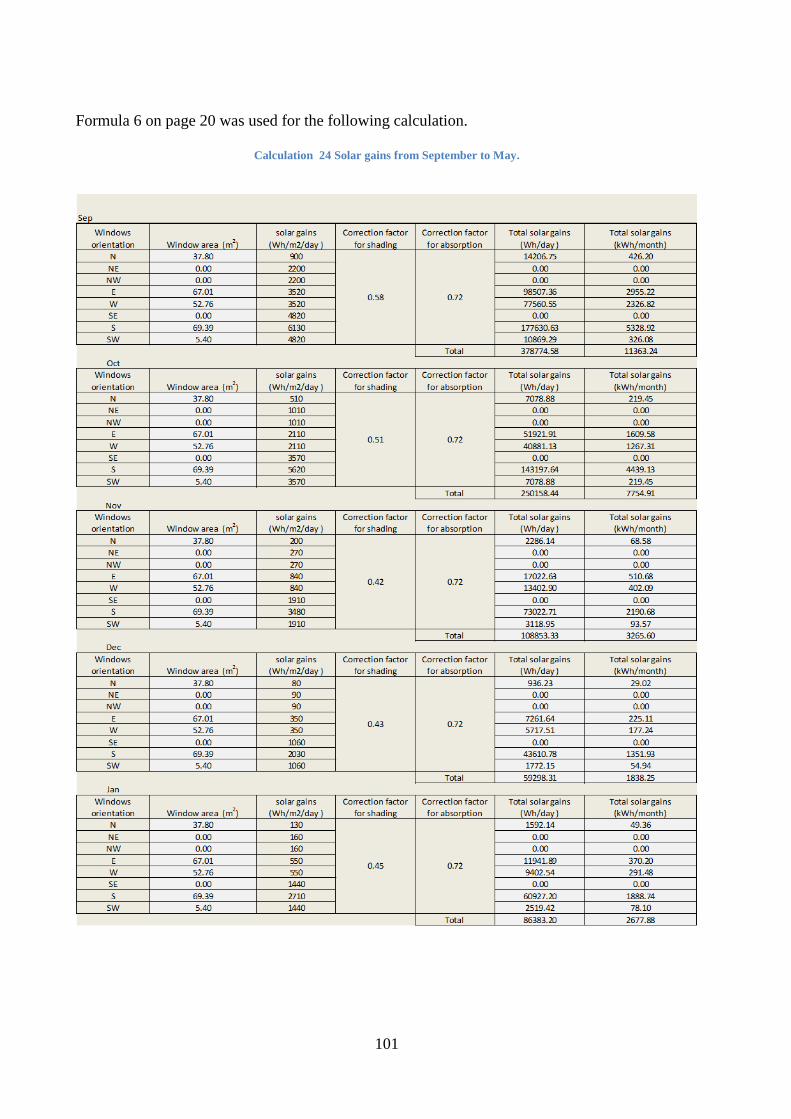
101
Formula 6 on page 20 was used for the following calculation.
Calculation 24 Solar gains from September to May.

102
Calculation 25 Total solar gains. Note that the months of September and May are divided by two and then all months are
added to get the total.
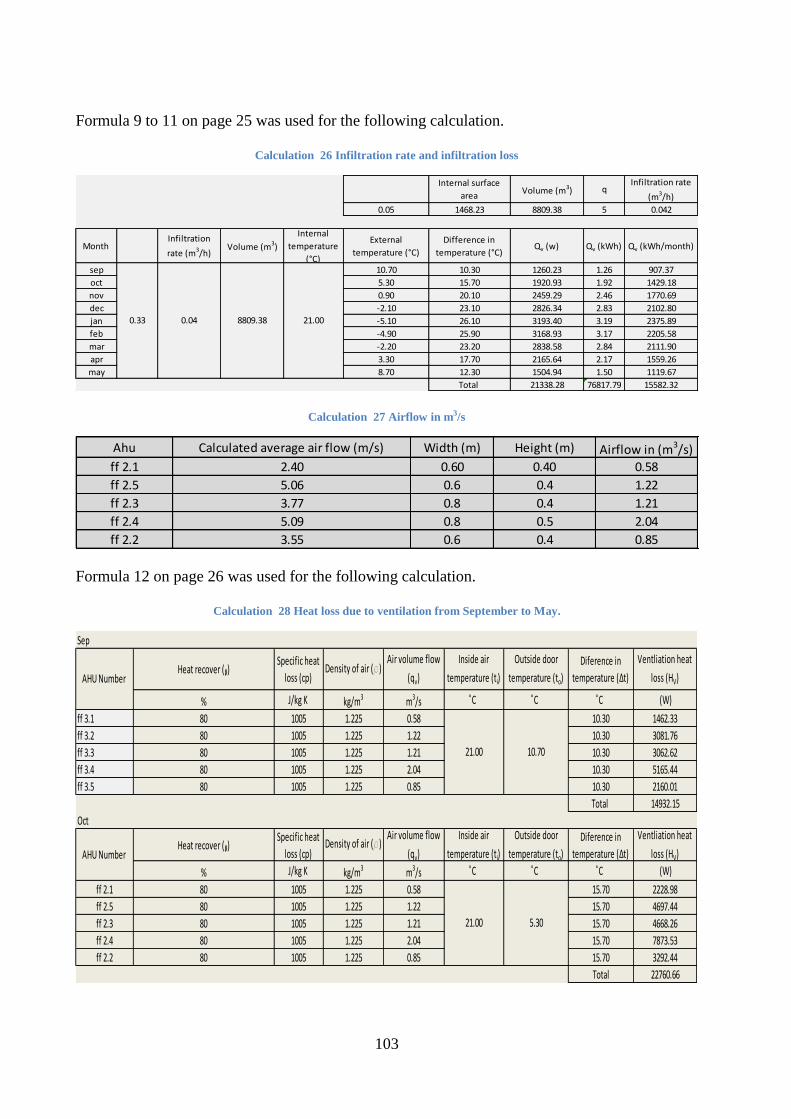
103
Formula 9 to 11 on page 25 was used for the following calculation.
Calculation 26 Infiltration rate and infiltration loss
Calculation 27 Airflow in m3/s
Formula 12 on page 26 was used for the following calculation.
Calculation 28 Heat loss due to ventilation from September to May.
Internal surface
area Volume (m3) q
Infiltration rate
(m3/h)
0.05 1468.23 8809.38 5 0.042
Month Infiltration
rate (m3/h)Volume (m3)
Internal
temperature
(°C)
External
temperature (°C)
Difference in
temperature (°C)Qv (w) Qv (kWh) Qv (kWh/month)
sep 10.70 10.30 1260.23 1.26 907.37
oct 5.30 15.70 1920.93 1.92 1429.18
nov 0.90 20.10 2459.29 2.46 1770.69
dec -2.10 23.10 2826.34 2.83 2102.80
jan -5.10 26.10 3193.40 3.19 2375.89
feb -4.90 25.90 3168.93 3.17 2205.58
mar -2.20 23.20 2838.58 2.84 2111.90
apr 3.30 17.70 2165.64 2.17 1559.26
may 8.70 12.30 1504.94 1.50 1119.67
Total 21338.28 76817.79 15582.32
0.33 0.04 8809.38 21.00
Ahu Calculated average air flow (m/s) Width (m) Height (m) Airflow in (m3/s)
ff 2.1 2.40 0.60 0.40 0.58
ff 2.5 5.06 0.6 0.4 1.22
ff 2.3 3.77 0.8 0.4 1.21
ff 2.4 5.09 0.8 0.5 2.04
ff 2.2 3.55 0.6 0.4 0.85
Sep
Heat recover (ᵦ)Specific heat
loss (cp)Density of air (r)
Air volume flow
(qv)
Inside air
temperature (ti)
Outside door
temperature (to)
Diference in
temperature (∆t)
Ventliation heat
loss (HV)
% J/kg K kg/m3 m3/s ͦC ͦC ͦC (W)
ff 3.1 80 1005 1.225 0.58 10.30 1462.33
ff 3.2 80 1005 1.225 1.22 10.30 3081.76
ff 3.3 80 1005 1.225 1.21 10.30 3062.62
ff 3.4 80 1005 1.225 2.04 10.30 5165.44
ff 3.5 80 1005 1.225 0.85 10.30 2160.01
Total 14932.15
Oct
Heat recover (ᵦ)Specific heat
loss (cp)Density of air (r)
Air volume flow
(qv)
Inside air
temperature (ti)
Outside door
temperature (to)
Diference in
temperature (∆t)
Ventliation heat
loss (HV)
% J/kg K kg/m3 m3/s ͦC ͦC ͦC (W)
ff 2.1 80 1005 1.225 0.58 15.70 2228.98
ff 2.5 80 1005 1.225 1.22 15.70 4697.44
ff 2.3 80 1005 1.225 1.21 15.70 4668.26
ff 2.4 80 1005 1.225 2.04 15.70 7873.53
ff 2.2 80 1005 1.225 0.85 15.70 3292.44
Total 22760.66
AHU Number
AHU Number
5.3021.00
10.7021.00
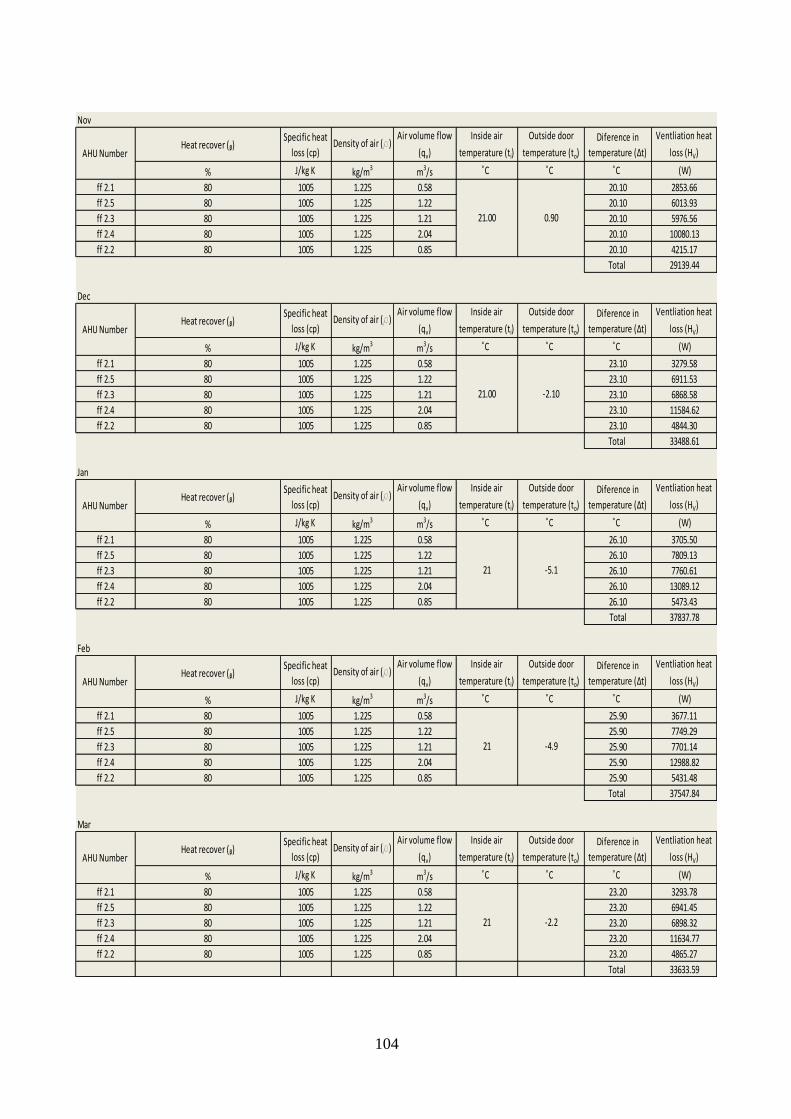
104
Nov
Heat recover (ᵦ)Specific heat
loss (cp)Density of air (r)
Air volume flow
(qv)
Inside air
temperature (ti)
Outside door
temperature (to)
Diference in
temperature (∆t)
Ventliation heat
loss (HV)
% J/kg K kg/m3 m3/s ͦC ͦC ͦC (W)
ff 2.1 80 1005 1.225 0.58 20.10 2853.66
ff 2.5 80 1005 1.225 1.22 20.10 6013.93
ff 2.3 80 1005 1.225 1.21 20.10 5976.56
ff 2.4 80 1005 1.225 2.04 20.10 10080.13
ff 2.2 80 1005 1.225 0.85 20.10 4215.17
Total 29139.44
Dec
Heat recover (ᵦ)Specific heat
loss (cp)Density of air (r)
Air volume flow
(qv)
Inside air
temperature (ti)
Outside door
temperature (to)
Diference in
temperature (∆t)
Ventliation heat
loss (HV)
% J/kg K kg/m3 m3/s ͦC ͦC ͦC (W)
ff 2.1 80 1005 1.225 0.58 23.10 3279.58
ff 2.5 80 1005 1.225 1.22 23.10 6911.53
ff 2.3 80 1005 1.225 1.21 23.10 6868.58
ff 2.4 80 1005 1.225 2.04 23.10 11584.62
ff 2.2 80 1005 1.225 0.85 23.10 4844.30
Total 33488.61
Jan
Heat recover (ᵦ)Specific heat
loss (cp)Density of air (r)
Air volume flow
(qv)
Inside air
temperature (ti)
Outside door
temperature (to)
Diference in
temperature (∆t)
Ventliation heat
loss (HV)
% J/kg K kg/m3 m3/s ͦC ͦC ͦC (W)
ff 2.1 80 1005 1.225 0.58 26.10 3705.50
ff 2.5 80 1005 1.225 1.22 26.10 7809.13
ff 2.3 80 1005 1.225 1.21 26.10 7760.61
ff 2.4 80 1005 1.225 2.04 26.10 13089.12
ff 2.2 80 1005 1.225 0.85 26.10 5473.43
Total 37837.78
Feb
Heat recover (ᵦ)Specific heat
loss (cp)Density of air (r)
Air volume flow
(qv)
Inside air
temperature (ti)
Outside door
temperature (to)
Diference in
temperature (∆t)
Ventliation heat
loss (HV)
% J/kg K kg/m3 m3/s ͦC ͦC ͦC (W)
ff 2.1 80 1005 1.225 0.58 25.90 3677.11
ff 2.5 80 1005 1.225 1.22 25.90 7749.29
ff 2.3 80 1005 1.225 1.21 25.90 7701.14
ff 2.4 80 1005 1.225 2.04 25.90 12988.82
ff 2.2 80 1005 1.225 0.85 25.90 5431.48
Total 37547.84
Mar
Heat recover (ᵦ)Specific heat
loss (cp)Density of air (r)
Air volume flow
(qv)
Inside air
temperature (ti)
Outside door
temperature (to)
Diference in
temperature (∆t)
Ventliation heat
loss (HV)
% J/kg K kg/m3 m3/s ͦC ͦC ͦC (W)
ff 2.1 80 1005 1.225 0.58 23.20 3293.78
ff 2.5 80 1005 1.225 1.22 23.20 6941.45
ff 2.3 80 1005 1.225 1.21 23.20 6898.32
ff 2.4 80 1005 1.225 2.04 23.20 11634.77
ff 2.2 80 1005 1.225 0.85 23.20 4865.27
Total 33633.59
21 -4.9
21 -2.2
AHU Number
AHU Number
AHU Number
AHU Number
21.00 -2.10
21 -5.1
AHU Number
21.00 0.90
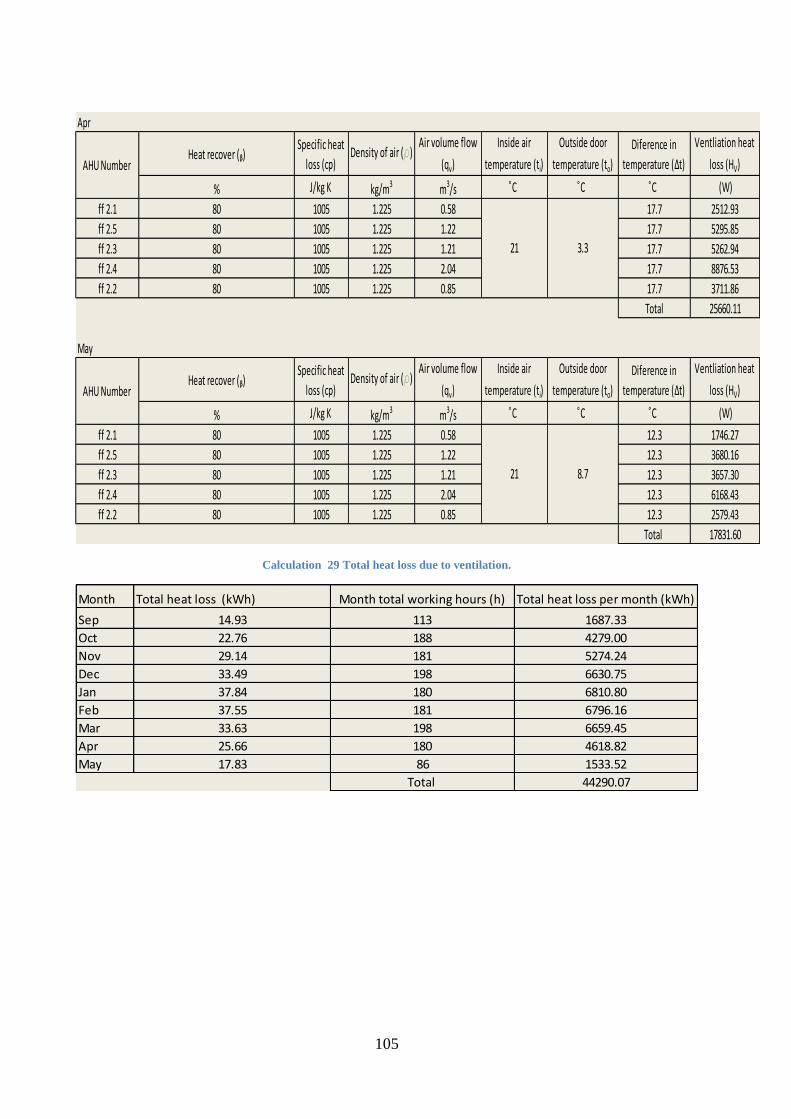
105
Calculation 29 Total heat loss due to ventilation.
Apr
Heat recover (ᵦ)Specific heat
loss (cp)Density of air (r)
Air volume flow
(qv)
Inside air
temperature (ti)
Outside door
temperature (to)
Diference in
temperature (∆t)
Ventliation heat
loss (HV)
% J/kg K kg/m3 m3/s ͦC ͦC ͦC (W)
ff 2.1 80 1005 1.225 0.58 17.7 2512.93
ff 2.5 80 1005 1.225 1.22 17.7 5295.85
ff 2.3 80 1005 1.225 1.21 17.7 5262.94
ff 2.4 80 1005 1.225 2.04 17.7 8876.53
ff 2.2 80 1005 1.225 0.85 17.7 3711.86
Total 25660.11
May
Heat recover (ᵦ)Specific heat
loss (cp)Density of air (r)
Air volume flow
(qv)
Inside air
temperature (ti)
Outside door
temperature (to)
Diference in
temperature (∆t)
Ventliation heat
loss (HV)
% J/kg K kg/m3 m3/s ͦC ͦC ͦC (W)
ff 2.1 80 1005 1.225 0.58 12.3 1746.27
ff 2.5 80 1005 1.225 1.22 12.3 3680.16
ff 2.3 80 1005 1.225 1.21 12.3 3657.30
ff 2.4 80 1005 1.225 2.04 12.3 6168.43
ff 2.2 80 1005 1.225 0.85 12.3 2579.43
Total 17831.60
AHU Number
AHU Number
21 3.3
8.721
Month Total heat loss (kWh) Month total working hours (h) Total heat loss per month (kWh)
Sep 14.93 113 1687.33
Oct 22.76 188 4279.00
Nov 29.14 181 5274.24
Dec 33.49 198 6630.75
Jan 37.84 180 6810.80
Feb 37.55 181 6796.16
Mar 33.63 198 6659.45
Apr 25.66 180 4618.82
May 17.83 86 1533.52
Total 44290.07

106
Formula 7 page 23 and forumla 8 page 24 were used in the following calculations. Calculation 30 Internal gains for a 24 hour period. Note that the table was broken down into section so the data could be
read.
Time Opening hours Number of people Heat gain from people
(W/Person)
Lighting
Area (m2)
Heat Gain from
lighting (W/m2)
Heat gains (w) 12:00:00 Am-01:00:00 0 60 0 2936.46 14 #NAME?
01:00:00-02:00:00 0 60 0 2936.46 14 #NAME?
Select type of Lighting 02:00-03:00 0 60 0 2936.46 14 #NAME?
Heat gains (w) 03:00-04:00 0 60 0 2936.46 14 #NAME?
05:00-:06:00 0 60 0 2936.46 14 #NAME?
07:00-08:00 0 60 0 2936.46 14 #NAME?
08:00-09:00 0 60 0 2936.46 14 #NAME?
Heat gains (w) 09:00-10:00 1 60 8400 2936.46 14 41110.44
10:00-11:00 1 60 8400 2936.46 14 41110.44
11:00-12:00 1 60 8400 2936.46 14 41110.44
12:00-13:00 1 60 8400 2936.46 14 41110.44
Heat Gains (w) 13:00-14:00 1 60 8400 2936.46 14 41110.44
14:00-15:00 1 60 8400 2936.46 14 41110.44
15:00-16:00 1 60 8400 2936.46 14 41110.44
16:00-17:00 0 60 0 2936.46 14 #NAME?
Heat gains (w) 17:00-18:00 0 60 0 2936.46 14 #NAME?
18:00-19:00 0 60 0 2936.46 14 #NAME?
19:00-20:00 0 60 0 2936.46 14 #NAME?
20:00-21:00 0 60 0 2936.46 14 #NAME?
Heat Gains (w) 21:00-22:00 0 60 0 2936.46 14 #NAME?
22:00-23:00 0 60 0 2936.46 14 #NAME?
23:00-24:00 0 60 0 2936.46 0 #NAME?
Select copier size
300
Select type of work
been carried out
140
Go to Internal table and use
8
65
Select type of energy
usage by PC
Select size of monitors
70
125
Select printer size
Number of pcs Heat gain from
pcs (W)
Number
monitors
Heat gains from
Monitors (W)
Number of
printers
Heat gain from
printers (W)
55 0 1 0 4 0
55 0 1 0 4 0
55 0 1 0 4 0
55 0 1 0 4 0
55 0 1 0 4 0
55 0 1 0 4 0
55 0 1 0 4 0
55 3575 1 70 4 500
55 3575 1 70 4 500
55 3575 1 70 4 500
55 3575 1 70 4 500
55 3575 1 70 4 500
55 3575 1 70 4 500
55 3575 1 70 4 500
55 0 1 0 4 0
55 0 1 0 4 0
55 0 1 0 4 0
55 0 1 0 4 0
55 0 1 0 4 0
55 0 1 0 4 0
55 0 1 0 4 0
55 0 1 0 4 0
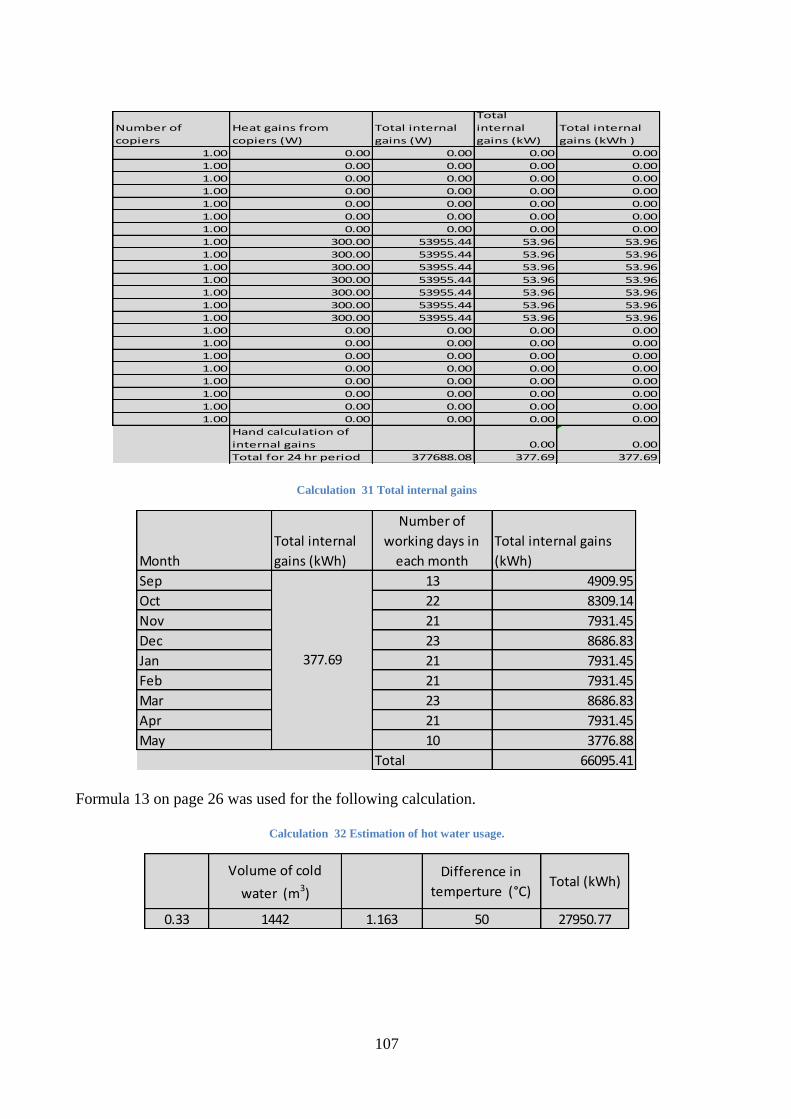
107
Calculation 31 Total internal gains
Formula 13 on page 26 was used for the following calculation.
Calculation 32 Estimation of hot water usage.
Number of
copiers
Heat gains from
copiers (W)
Total internal
gains (W)
Total
internal
gains (kW)
Total internal
gains (kWh )
1.00 0.00 0.00 0.00 0.00
1.00 0.00 0.00 0.00 0.00
1.00 0.00 0.00 0.00 0.00
1.00 0.00 0.00 0.00 0.00
1.00 0.00 0.00 0.00 0.00
1.00 0.00 0.00 0.00 0.00
1.00 0.00 0.00 0.00 0.00
1.00 300.00 53955.44 53.96 53.96
1.00 300.00 53955.44 53.96 53.96
1.00 300.00 53955.44 53.96 53.96
1.00 300.00 53955.44 53.96 53.96
1.00 300.00 53955.44 53.96 53.96
1.00 300.00 53955.44 53.96 53.96
1.00 300.00 53955.44 53.96 53.96
1.00 0.00 0.00 0.00 0.00
1.00 0.00 0.00 0.00 0.00
1.00 0.00 0.00 0.00 0.00
1.00 0.00 0.00 0.00 0.00
1.00 0.00 0.00 0.00 0.00
1.00 0.00 0.00 0.00 0.00
1.00 0.00 0.00 0.00 0.00
1.00 0.00 0.00 0.00 0.00
Hand calculation of
internal gains 0.00 0.00
Total for 24 hr period 377688.08 377.69 377.69
Month
Total internal
gains (kWh)
Number of
working days in
each month
Total internal gains
(kWh)
Sep 13 4909.95
Oct 22 8309.14
Nov 21 7931.45
Dec 23 8686.83
Jan 21 7931.45
Feb 21 7931.45
Mar 23 8686.83
Apr 21 7931.45
May 10 3776.88
Total 66095.41
377.69
Volume of cold
water (m3)
Difference in
temperture (°C)Total (kWh)
0.33 1442 1.163 50 27950.77
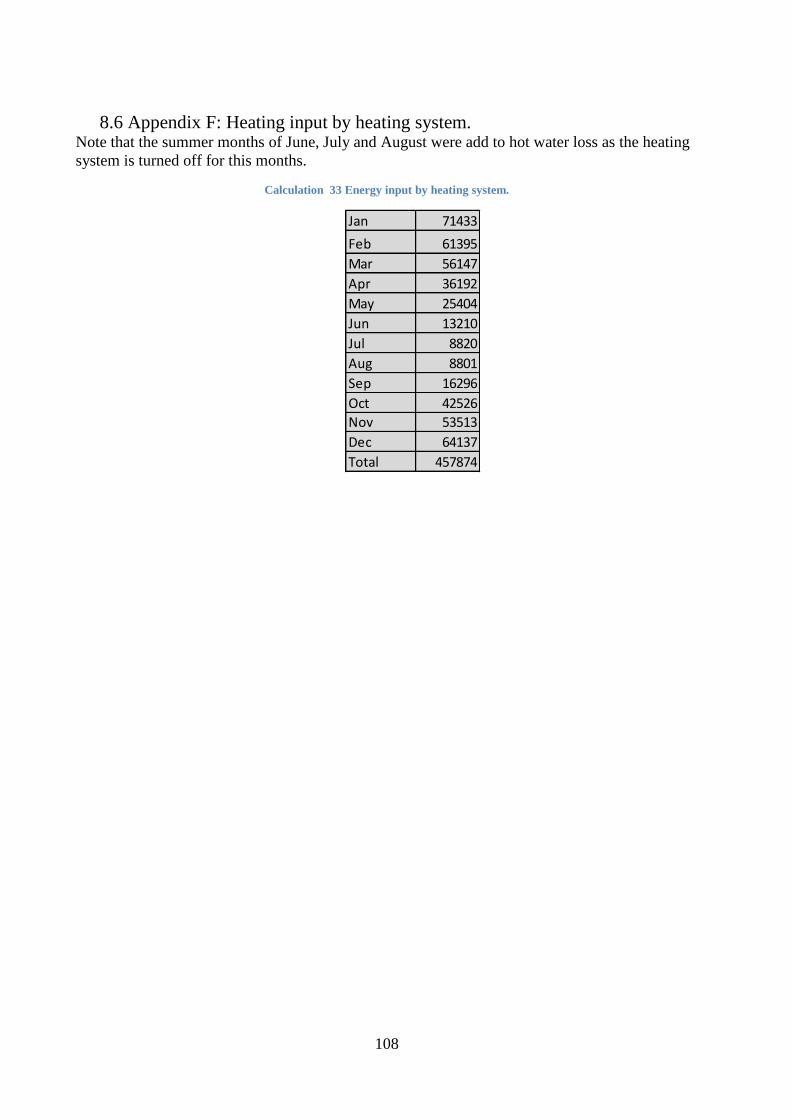
108
8.6 Appendix F: Heating input by heating system. Note that the summer months of June, July and August were add to hot water loss as the heating
system is turned off for this months.
Calculation 33 Energy input by heating system.
Jan 71433
Feb 61395
Mar 56147
Apr 36192
May 25404
Jun 13210
Jul 8820
Aug 8801
Sep 16296
Oct 42526
Nov 53513
Dec 64137
Total 457874


![Time-varying jump tails - Duke Universitypublic.econ.duke.edu/~boller/Published_Papers/joe_14.pdf · varying± ± ± ± ± − (+ −]) ± (+ − ±, =,..., −] = −, −] = −,),](https://static.fdocuments.in/doc/165x107/5f9eb1e298e27c43de4b3c12/time-varying-jump-tails-duke-bollerpublishedpapersjoe14pdf-varying-.jpg)