Energy Integration in South Asia Region -...
44
Energy Integration in South Asia Region Progress, Key Achievements and Way forward V K Kharbanda SARI/EI/IRADe HAPUA- UNESCAP Workshop 17-19 th April’2017, Jakarta, Indonesia
Transcript of Energy Integration in South Asia Region -...

Energy Integration in South Asia
Region
Progress, Key Achievements and Way forward
V K Kharbanda
SARI/EI/IRADe
HAPUA- UNESCAP Workshop
17-19th April’2017, Jakarta, Indonesia
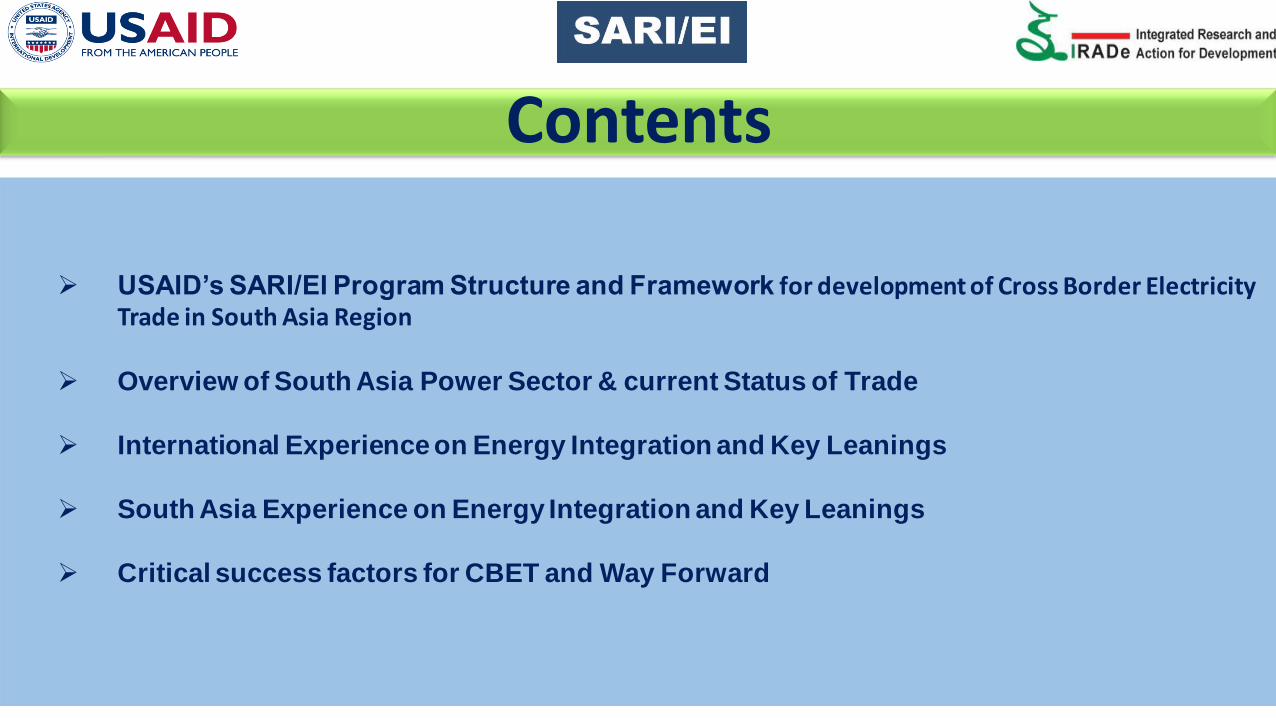
USAID’s SARI/EI Program Structure and Framework for development of Cross Border Electricity
Trade in South Asia Region
Overview of South Asia Power Sector & current Status of Trade
International Experience on Energy Integration and Key Leanings
South Asia Experience on Energy Integration and Key Leanings
Critical success factors for CBET and Way Forward
Contents

Overview SARI/EI Program: South Asia Regional Initiative for Energy Integration (SARI/EI)
4/16/2017 3
1. SARI/E is a long standing program of USAID started in the year 2000.
2. Program has consistently strived to address energy security in South Asia by focusing 1) Cross Border Energy Trade 2) Energy Market Formation and 3) Regional Clean Energy Development.
3. SARI/EI–Phase IV (2012-2017): Key Outcomes. Three Key Development Outcomes:
1. Coordinate policy, legal and regulatory issues.
2. Advance transmission interconnections.
3. Establish South Asia Regional Electricity Markets.
Demand Driven ‘Bottom Up’ Approach IRADe, a regional organization, is implementing partner
Presentation on SA Power Sector/Investment Challenges/South Asia:/Rajiv-Head-Technical/SARI/EI/New Delhi, India
Maldives
Sri Lanka
India
Nepal
Bangladesh
Bhutan Pakistan
Afghanistan
8 SAARC COUNTRIES
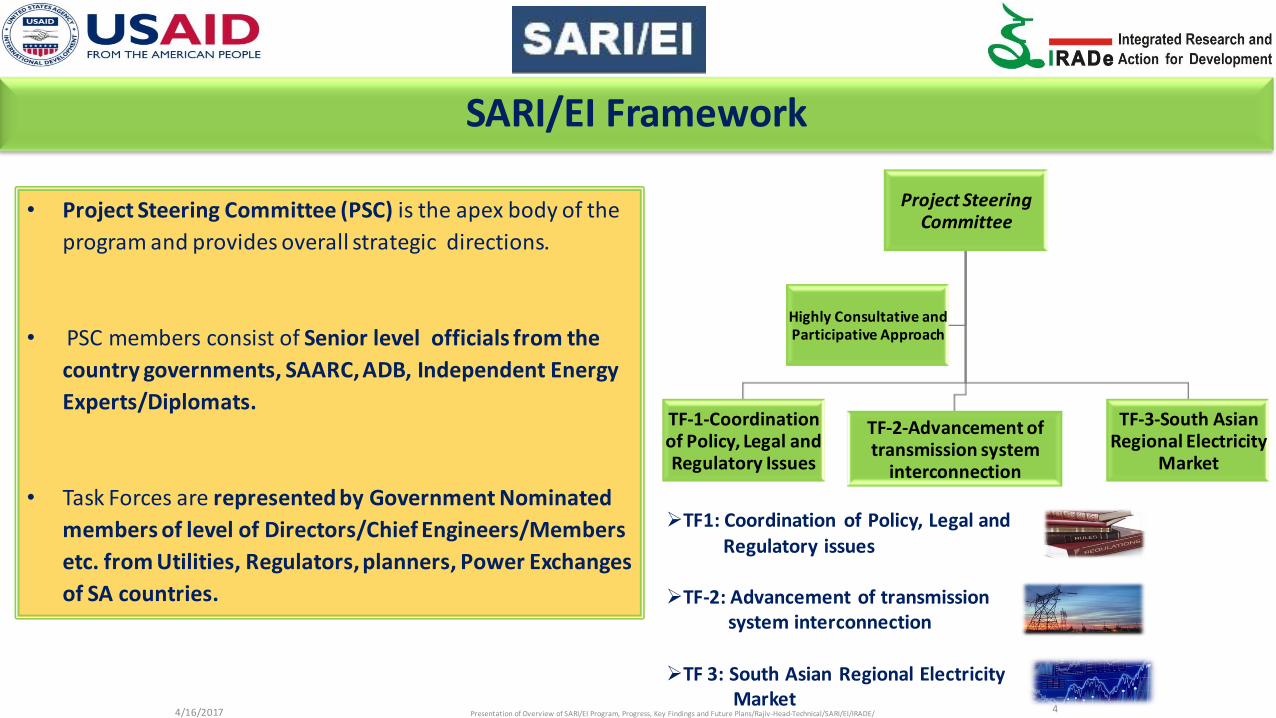
SARI/EI Framework
TF1: Coordination of Policy, Legal and Regulatory issues TF-2: Advancement of transmission system interconnection TF 3: South Asian Regional Electricity Market
Project Steering Committee
TF-1-Coordination of Policy, Legal and Regulatory Issues
TF-2-Advancement of transmission system
interconnection
TF-3-South Asian Regional Electricity
Market
Highly Consultative and Participative Approach
Presentation of Overview of SARI/EI Program, Progress, Key Findings and Future Plans/Rajiv -Head-Technical/SARI/EI/IRADE/ 4/16/2017 4
• Project Steering Committee (PSC) is the apex body of the
program and provides overall strategic directions.
• PSC members consist of Senior level officials from the
country governments, SAARC, ADB, Independent Energy
Experts/Diplomats.
• Task Forces are represented by Government Nominated
members of level of Directors/Chief Engineers/Members
etc. from Utilities, Regulators, planners, Power Exchanges
of SA countries.

CBET facilitation through
Harmoniz
ation of Grid
Codes
Standard Contracts (Bankable
PPAs/TSAs)
Regional Regulatory Guidelines
Assessme
nt of Trading
Potential
Model framework for Open Access
and Trading License Regime
SAARC Framework Agreement on Energy (Electricity) Cooperation
Suggested Changes/Amendments in Electricity Laws, Regulations and Policies (L&R&P ) of South Asian Countries.
Undertaken as part of the TF-1
and has been
Published
Institutional Mechanism
Regional
Investment
Framework and
Investment Policy
Guidelines
Transmiss
ion Master plan and
Pricing
Mock Exercise for
SARPEX
Model Regulation for Power
Market Development
5
Demand Driven Studies
International Consultants
Deloitte, KMPG
PRDC, PWC, ICF
Mercados, E & Y
SARI/EI Overall Framework for development of CBET in SA

SARI/EI/IRADe
Intergovernmental Task Forces on CBET
Policy, Regulatory, Legal, Technical, Grid Code, Commercial and Power Market
aspects
Think Tank Forum on Energy Cooperation
Mock Exercise on South Asia Regional
Power Exchange
Analytical Studies: Macro-
Economic benefits of
CBET
SARI/EI: Various Streams of Work
SARI/EI/IRADe
Overview of South Asia Power Sector
4/16/2017 7
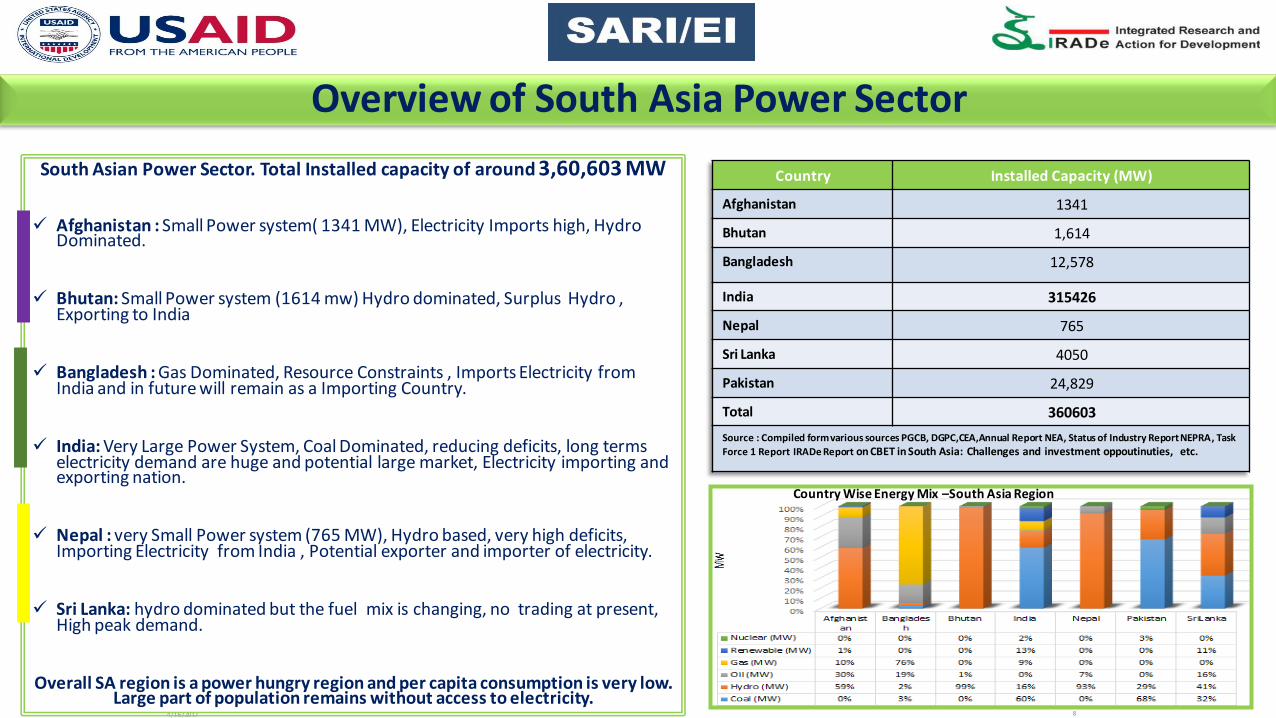
Overview of South Asia Power Sector
Country Installed Capacity (MW)
Afghanistan 1341
Bhutan 1,614
Bangladesh 12,578
India 315426
Nepal 765
Sri Lanka 4050
Pakistan 24,829
Total 360603
Source : Compiled form various sources PGCB, DGPC,CEA,Annual Report NEA, Status of Industry Report NEPRA, Task
Force 1 Report IRADe Report on CBET in South Asia: Challenges and investment oppoutinuties, etc.
4/16/2017 8
South Asian Power Sector. Total Installed capacity of around 3,60,603 MW
Afghanistan : Small Power system( 1341 MW), Electricity Imports high, Hydro Dominated.
Bhutan: Small Power system (1614 mw) Hydro dominated, Surplus Hydro , Exporting to India
Bangladesh : Gas Dominated, Resource Constraints , Imports Electricity from India and in future will remain as a Importing Country.
India: Very Large Power System, Coal Dominated, reducing deficits, long terms electricity demand are huge and potential large market, Electricity importing and exporting nation.
Nepal : very Small Power system (765 MW), Hydro based, very high deficits, Importing Electricity from India , Potential exporter and importer of electricity.
Sri Lanka: hydro dominated but the fuel mix is changing, no trading at present, High peak demand.
Overall SA region is a power hungry region and per capita consumption is very low. Large part of population remains without access to electricity.
Country Wise Energy Mix –South Asia Region

Resource Potential: Hydro Potential :350 GW !
SAARC Hydro Potential in MW
Vast potential of hydro power:350 GW
Bhutan, Nepal, Pakistan, India: 30,83, 59, 150 GW respectively.
Nepal and Bhutan can build export oriented hydro power plants
Significant Coal deposits in India and Pakistan.
Coal deposits in Bangladesh yet to be exploited.
In addition to the conventional energy resources, there is huge renewable energy resources like solar and wind.
Country
Coal
(million
tons)
Oil
(million
barrels)
Natural Gas
(trillion cubic
feet)
Biomass
(million tons)
Hydro
(GW)
Afghanistan 440 NA 15 18–27 25
Bhutan 2 0 0 26.6 30
Bangladesh 884 12 8 0.08 0.33
India 90,085 5,700 39 139 150
Maldives 0 0 0 0.06 0
Nepal NA 0 0 27.04 83
Pakistan 17,550 324 33 NA 59
Sri Lanka NA 150 0 12 2
Total 108,961 5,906 95 223 349.33 Source: SAARC Secretariat (2010) for Bangladesh, Bhutan, India, Nepal, Sri Lanka; CWC (2005) for Indian States and WAPDA (2011) for Pakistan
4/16/2017 9
Renewables Bangladesh India Nepal Bhutan Pakistan Sri Lanka
Solar Power
(Kwh/sq. m per day)
3.8 - 6.5 4 - 7 3.6 - 6.2 2.5 - 5 5.3 NA
Wind (MW) Very limited
potential
151,918 3,000 4,825 24,000 25,000MW

4/16/2017 Presentation on SA Power Sector/Investment Challenges/South Asia:/Rajiv -Head-Technical/SARI/EI/New Delhi, India 10
Country/ Region
Electricity Use kWh/capita/yr
SAARC 517
USA 12,914
EU 6,592
BRAZIL 2,206
MALAYASIA 3,614
CHINA 2,631
WORLD 2,803
Per Capita Electricity Consumption
49 274
2420
1010
2283
103 458 449
2944
13426
2977
0
2000
4000
6000
8000
10000
12000
14000
16000
Electricity Consumption KWH per Capita
Low per capita electricity consumptions. Maldives and Bhutan have high per capita electricity consumption among SA countries. Developed countries are at much higher level of consumption. Need to increase the level of consumption for a decent standard of living.
Source:SAARC Energy Centre

Key Drivers for CBET
4/16/2017 Presentation on SA Power Sector/Investment Challenges/South Asia:/Rajiv -Head-Technical/SARI/EI/New Delhi, India 11
9% 6% 3%
34%
24%
10%
0%
10%
20%
30%
40%
Bangladesh Bhutan India Nepal Pakistan Sri Lanka
Peak Deficit (%)
36
62 72 75
63 67.4
94 99.7
77.6
0
20
40
60
80
100
120
Access to Electricity (%)
Energy and Peak Shortages.
Low per Capita electricity consumptions
Poor access to electricity.
Resource Crunch (In Bangladesh)
Optimal utilization of energy resources.
Availability of Prices on Market Based.
Enhancing Liquidity
Economic benefits.
12
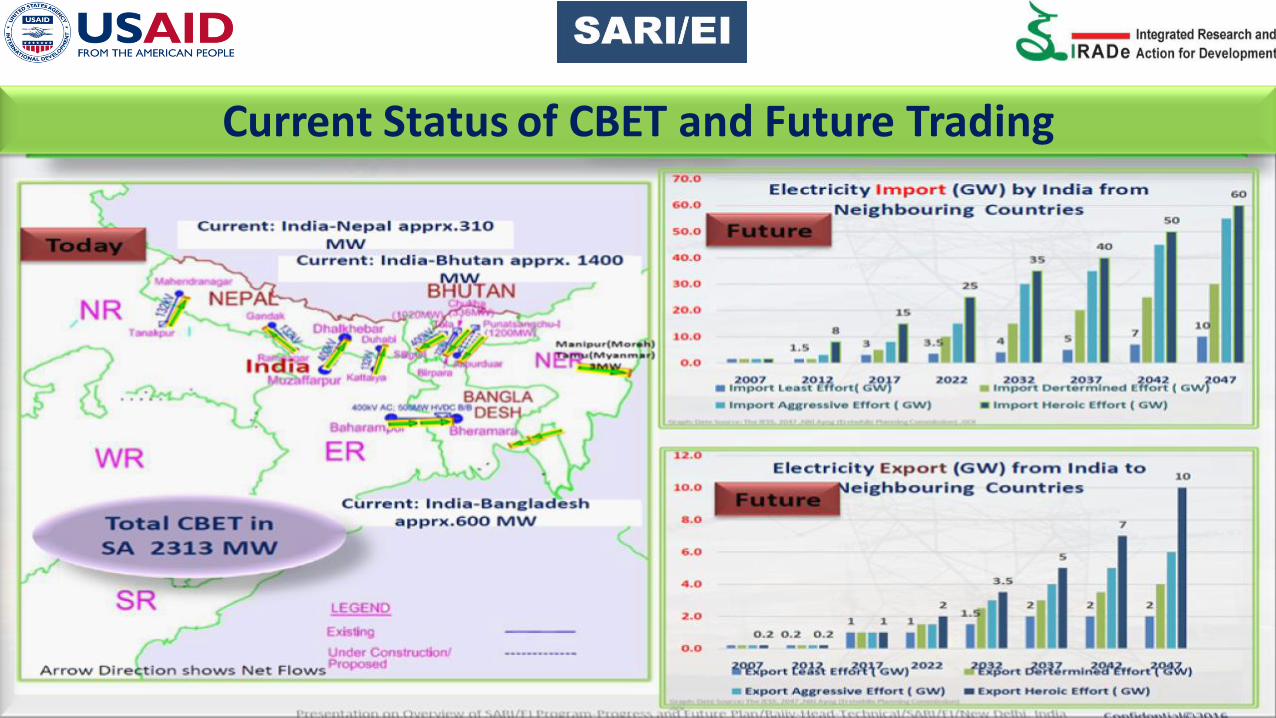
Current Status of CBET and Future Trading

International Experience: Power Market Development
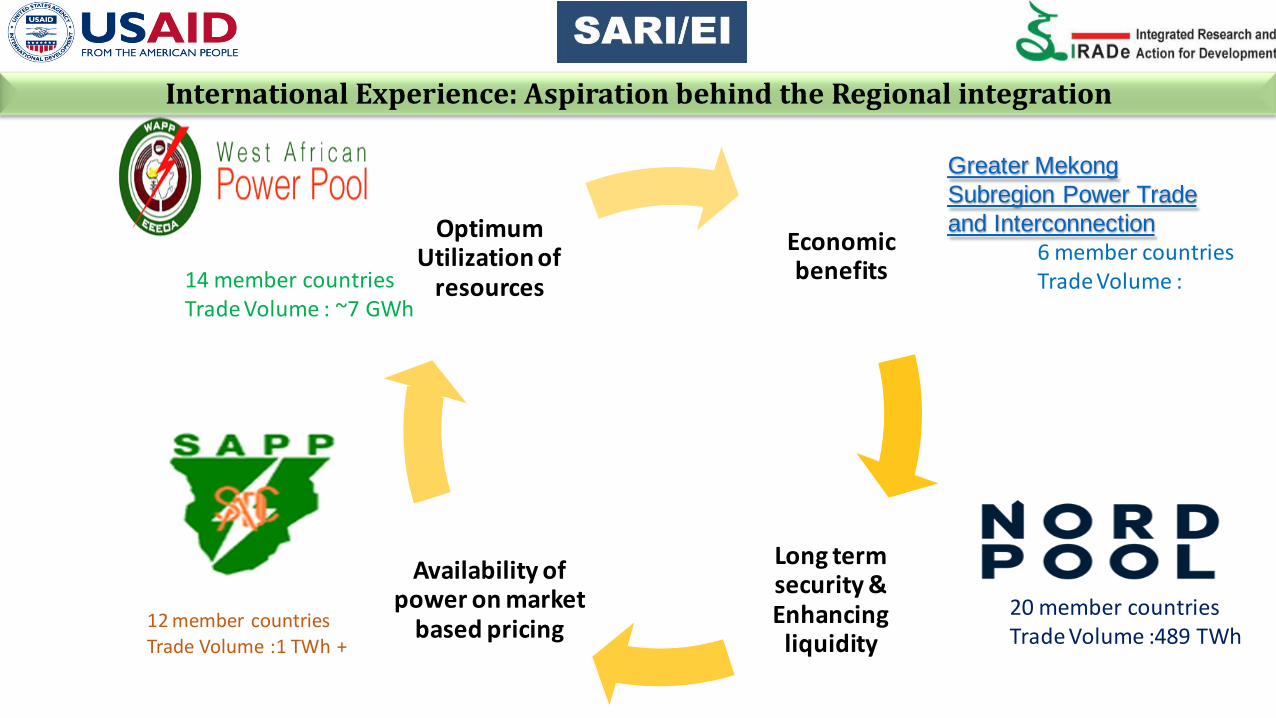
International Experience: Aspiration behind the Regional integration
Economic benefits
Long term security & Enhancing liquidity
Availability of power on market
based pricing
Optimum Utilization of
resources
Greater Mekong
Subregion Power Trade
and Interconnection
14 member countries Trade Volume : ~7 GWh
12 member countries Trade Volume :1 TWh +
6 member countries Trade Volume :
20 member countries Trade Volume :489 TWh

Greater Mekong Subregion
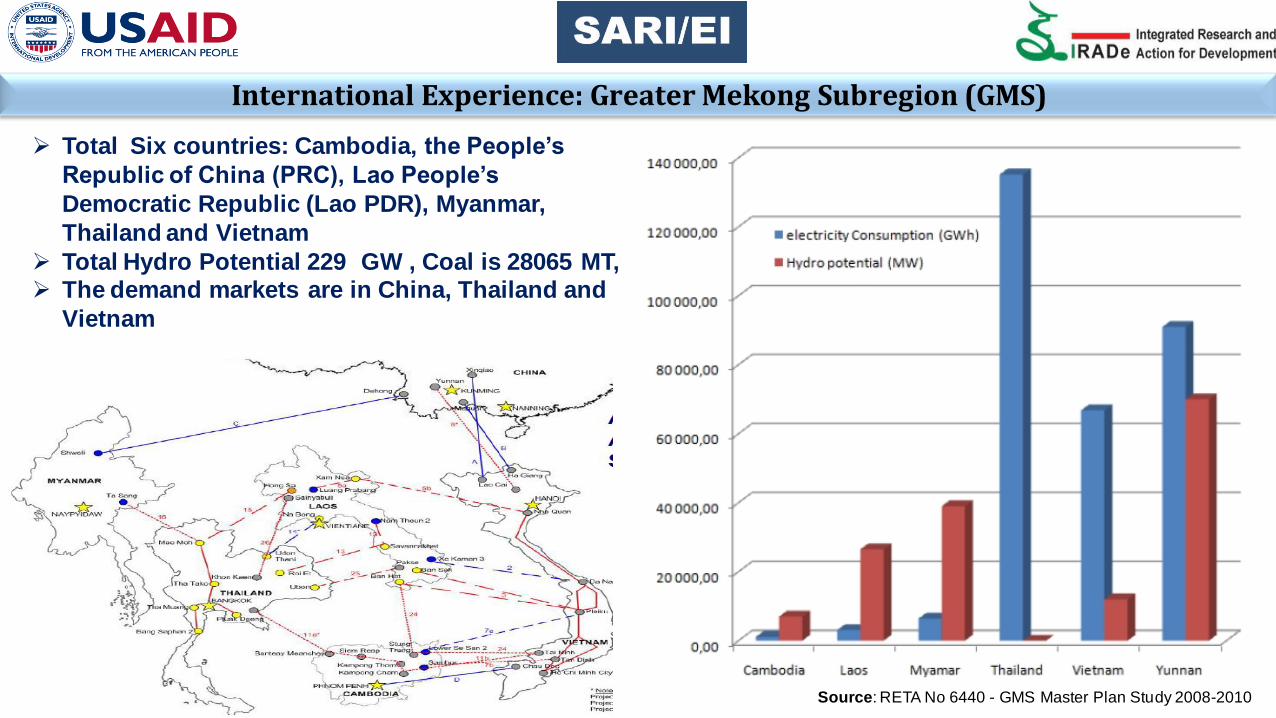
Total Six countries: Cambodia, the People’s
Republic of China (PRC), Lao People’s
Democratic Republic (Lao PDR), Myanmar,
Thailand and Vietnam
Total Hydro Potential 229 GW , Coal is 28065 MT, The demand markets are in China, Thailand and
Vietnam
Source: RETA No 6440 - GMS Master Plan Study 2008-2010
International Experience: Greater Mekong Subregion (GMS)
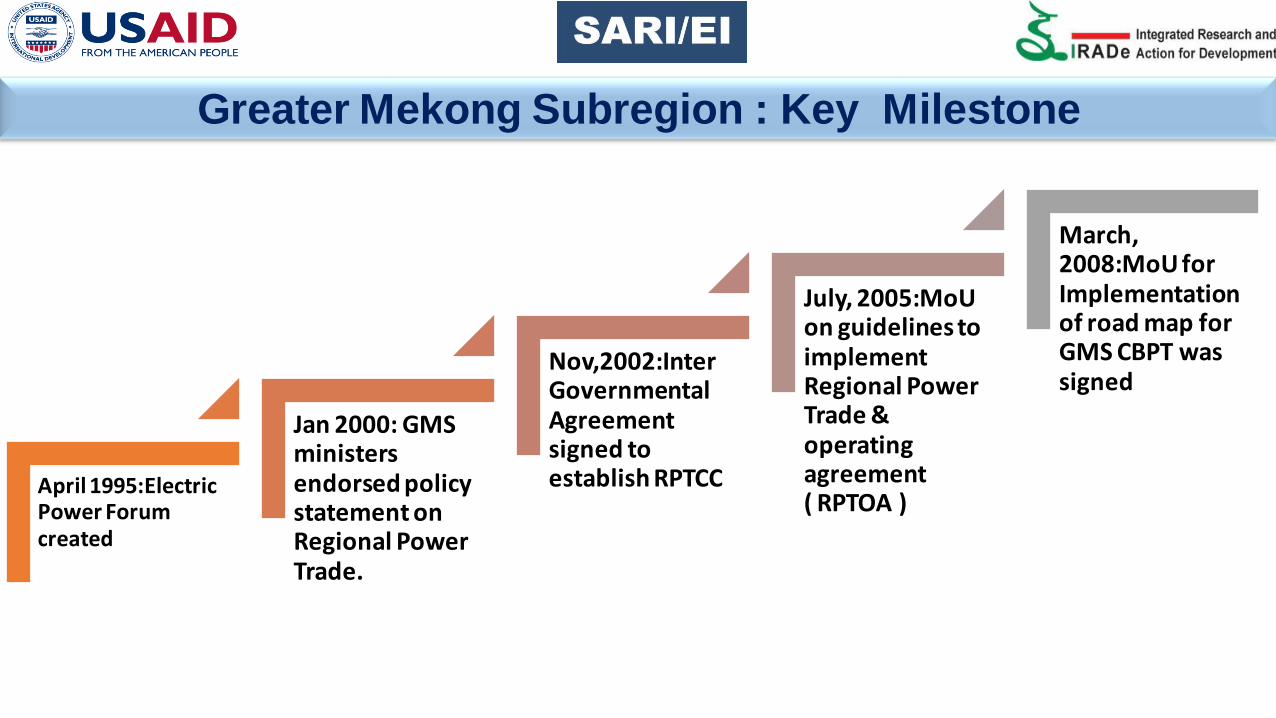
Greater Mekong Subregion : Key Milestone
April 1995:Electric Power Forum created
Jan 2000: GMS ministers endorsed policy statement on Regional Power Trade.
Nov,2002:Inter Governmental Agreement signed to establish RPTCC
July, 2005:MoU on guidelines to implement Regional Power Trade & operating agreement ( RPTOA )
March, 2008:MoU for Implementation of road map for GMS CBPT was signed

Greater Mekong Subregion (GMS) :Key Instruments
Inter-Country MOU, Treaties, Agreements
The intergovernmental agreement signed in year 2000, provided a framework to implement the Policy Statement on Regional Energy Trade in the GMS.
MoU on the Overall Framework of Regional Trade
MoU on guidelines for the implementation of the Regional Power Trade Operating Agreement (RPTOA) helped to promote efficient development of power trade to aid economic growth.
PPA Terms and Open Access Dominated by bilateral negotiated long term contracts Presently Bilateral and open access has been recognized through strategy documents .
Transmission Planning/Infrastructure
The Planning Working Group (PWG) was established to fulfil the functions of the operational and system planning working groups, identified in the draft RPTOA . Master Plan at the regional level.
Interconnection Mechanism Single Synchronous AC Power Grid. All the countries follow same operating codes (regional grid codes) to ensure system stability.
Commercial Mechanism to Settle Imbalances
Settlement procedure for long term bilateral : governed by such agreements .
Sustainable Development of Energy Trade and Provision for Projects Committed to Trade
The 15th GMS Ministerial Meeting during 2009, adopted a roadmap for expanded cooperation in the energy sector of the GMS taking into account the need for improved energy security, better utilization of Resources in the region.
Dispute Resolution The concession agreement and the PPA, Experts and International Arbitration.
South Africa Power Pool

South African Power Pool (SAPP)- Snap Shot
74.3% Coal 20.1% Hydro 4.0% Nuclear 1.6% Gas/Diesel
12 Countries :Angola, Botswana, Democratic Republic of Congo (DRC), Lesotho, Madagascar, Mozambique, Namibia, South Africa, Swaziland, Tanzania, Zambia, and Zimbabwe.
Trade Volume :1 TWh +
Average Electricity growth rate 3% p.a.
For South Africa demand growth was 4.9% in 2007 and for whole region 4.6%.
Installed Capacity 58,608 MW
Available Capacity 52,589 MW
Operating Capacity 46,910 MW
Peak Demand 48,216 MW

South Africa Power Pool : Key Milestone
1992: Heads of Countries signed Treaty of SADC.
1995: Formation of SAPP
2001:Short Term Electricity Market commenced.
2002: Establishment of Regional Electricity Regulatory Association.
2009: DAM operation commenced.
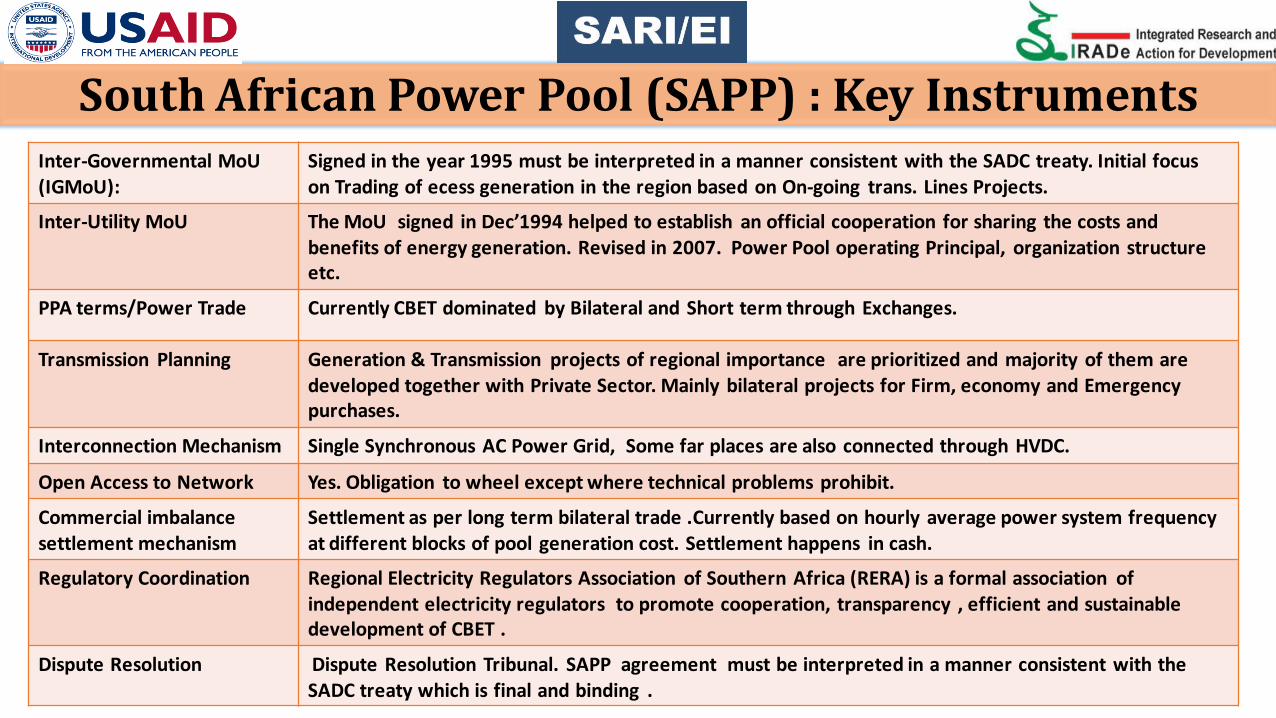
South African Power Pool (SAPP) : Key Instruments
Inter-Governmental MoU (IGMoU):
Signed in the year 1995 must be interpreted in a manner consistent with the SADC treaty. Initial focus on Trading of ecess generation in the region based on On-going trans. Lines Projects.
Inter-Utility MoU The MoU signed in Dec’1994 helped to establish an official cooperation for sharing the costs and benefits of energy generation. Revised in 2007. Power Pool operating Principal, organization structure etc.
PPA terms/Power Trade Currently CBET dominated by Bilateral and Short term through Exchanges.
Transmission Planning Generation & Transmission projects of regional importance are prioritized and majority of them are developed together with Private Sector. Mainly bilateral projects for Firm, economy and Emergency purchases.
Interconnection Mechanism Single Synchronous AC Power Grid, Some far places are also connected through HVDC.
Open Access to Network Yes. Obligation to wheel except where technical problems prohibit.
Commercial imbalance settlement mechanism
Settlement as per long term bilateral trade .Currently based on hourly average power system frequency at different blocks of pool generation cost. Settlement happens in cash.
Regulatory Coordination Regional Electricity Regulators Association of Southern Africa (RERA) is a formal association of independent electricity regulators to promote cooperation, transparency , efficient and sustainable development of CBET .
Dispute Resolution Dispute Resolution Tribunal. SAPP agreement must be interpreted in a manner consistent with the SADC treaty which is final and binding .

West Africa Power Pool
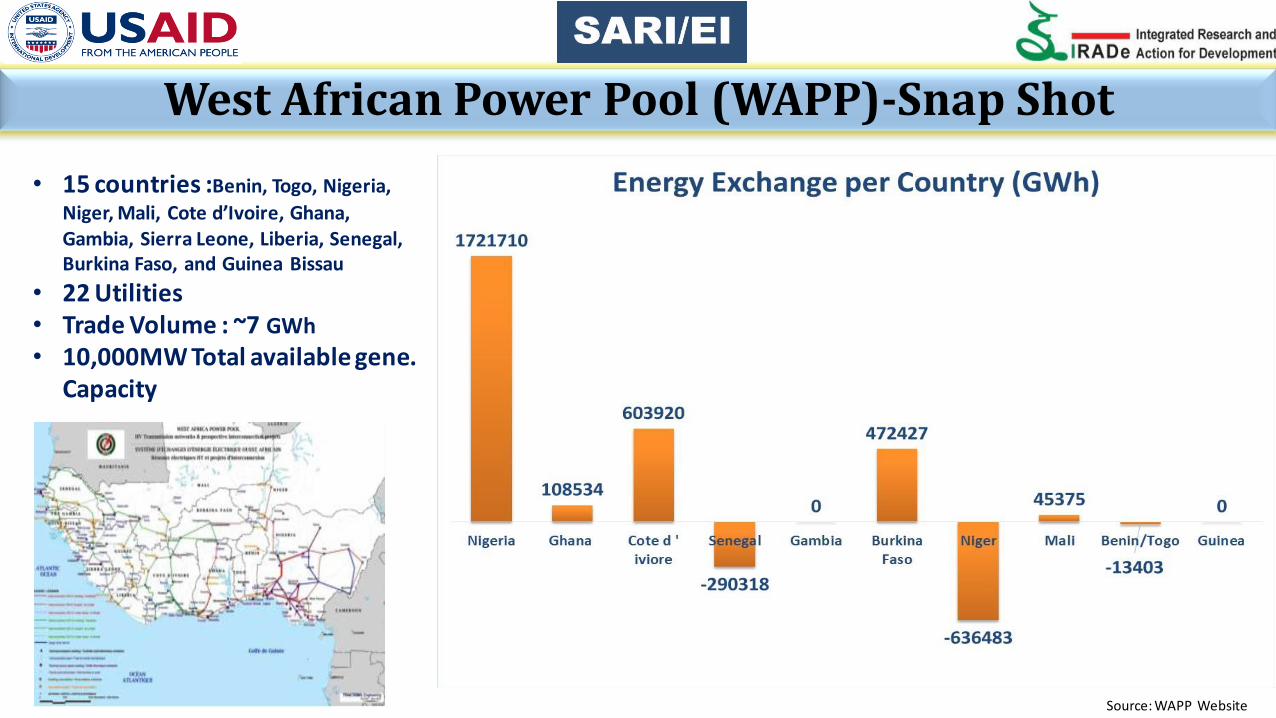
West African Power Pool (WAPP)-Snap Shot
• 15 countries :Benin, Togo, Nigeria,
Niger, Mali, Cote d’Ivoire, Ghana, Gambia, Sierra Leone, Liberia, Senegal, Burkina Faso, and Guinea Bissau
• 22 Utilities • Trade Volume : ~7 GWh
• 10,000MW Total available gene. Capacity
Source: WAPP Website

West African Power Pool : Key Milestone
1975: Treaty on Economic Community of West Africa States (ECOWAS)
2000: Intergovernmental MOU to create WAPP.
2006 :Utilities signed Article of Agreement, covering operating procedures, regulatory affairs, Dispute Resolution etc.
2008: Creation of ECOWAS Regional Electricity Regulatory Authority (ERERA).
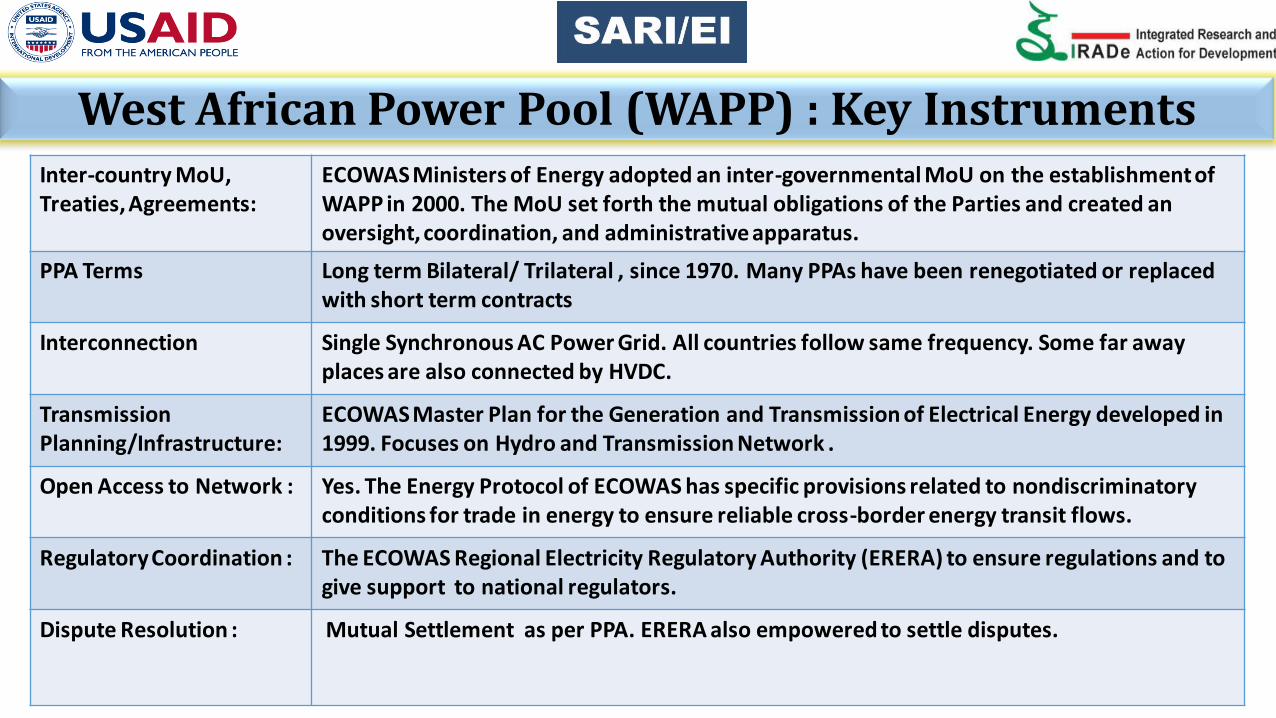
West African Power Pool (WAPP) : Key Instruments Inter-country MoU, Treaties, Agreements:
ECOWAS Ministers of Energy adopted an inter-governmental MoU on the establishment of WAPP in 2000. The MoU set forth the mutual obligations of the Parties and created an oversight, coordination, and administrative apparatus.
PPA Terms Long term Bilateral/ Trilateral , since 1970. Many PPAs have been renegotiated or replaced with short term contracts
Interconnection Single Synchronous AC Power Grid. All countries follow same frequency. Some far away places are also connected by HVDC.
Transmission Planning/Infrastructure:
ECOWAS Master Plan for the Generation and Transmission of Electrical Energy developed in 1999. Focuses on Hydro and Transmission Network .
Open Access to Network : Yes. The Energy Protocol of ECOWAS has specific provisions related to nondiscriminatory conditions for trade in energy to ensure reliable cross-border energy transit flows.
Regulatory Coordination : The ECOWAS Regional Electricity Regulatory Authority (ERERA) to ensure regulations and to give support to national regulators.
Dispute Resolution :
Mutual Settlement as per PPA. ERERA also empowered to settle disputes.
Nord Pool
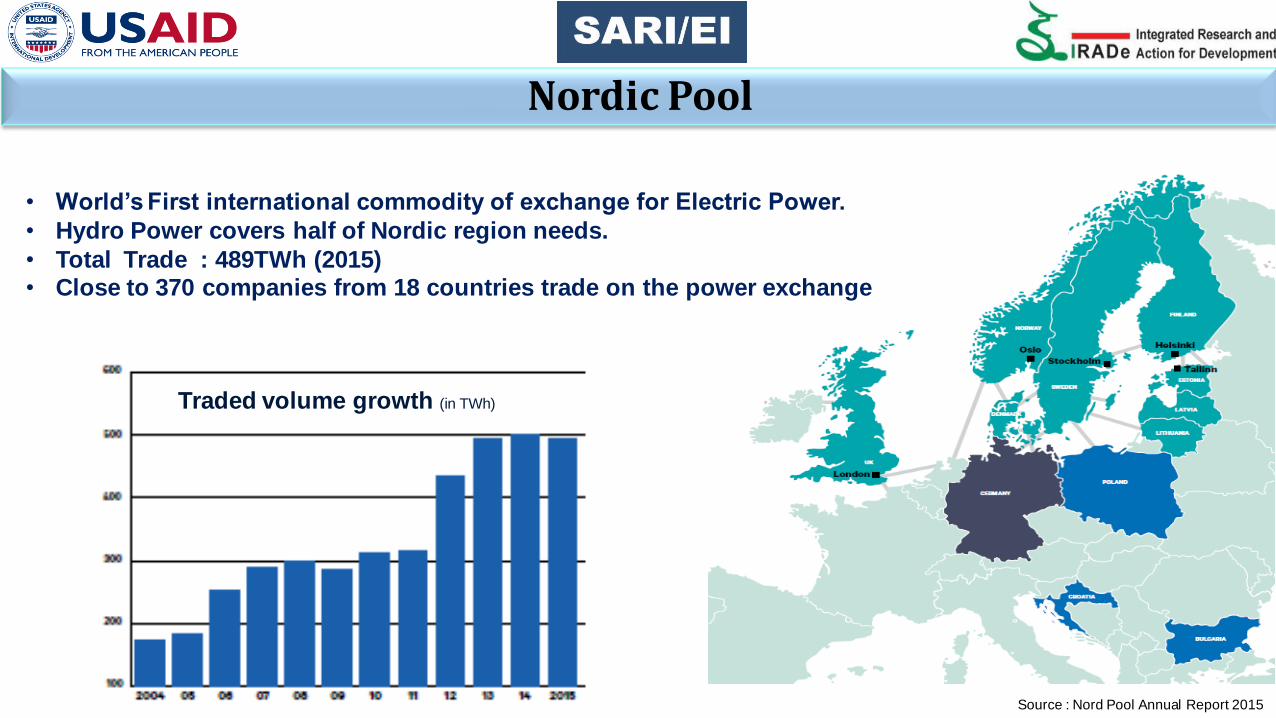
Traded volume growth (in TWh)
• World’s First international commodity of exchange for Electric Power.
• Hydro Power covers half of Nordic region needs.
• Total Trade : 489TWh (2015) • Close to 370 companies from 18 countries trade on the power exchange
Source : Nord Pool Annual Report 2015
Nordic Pool
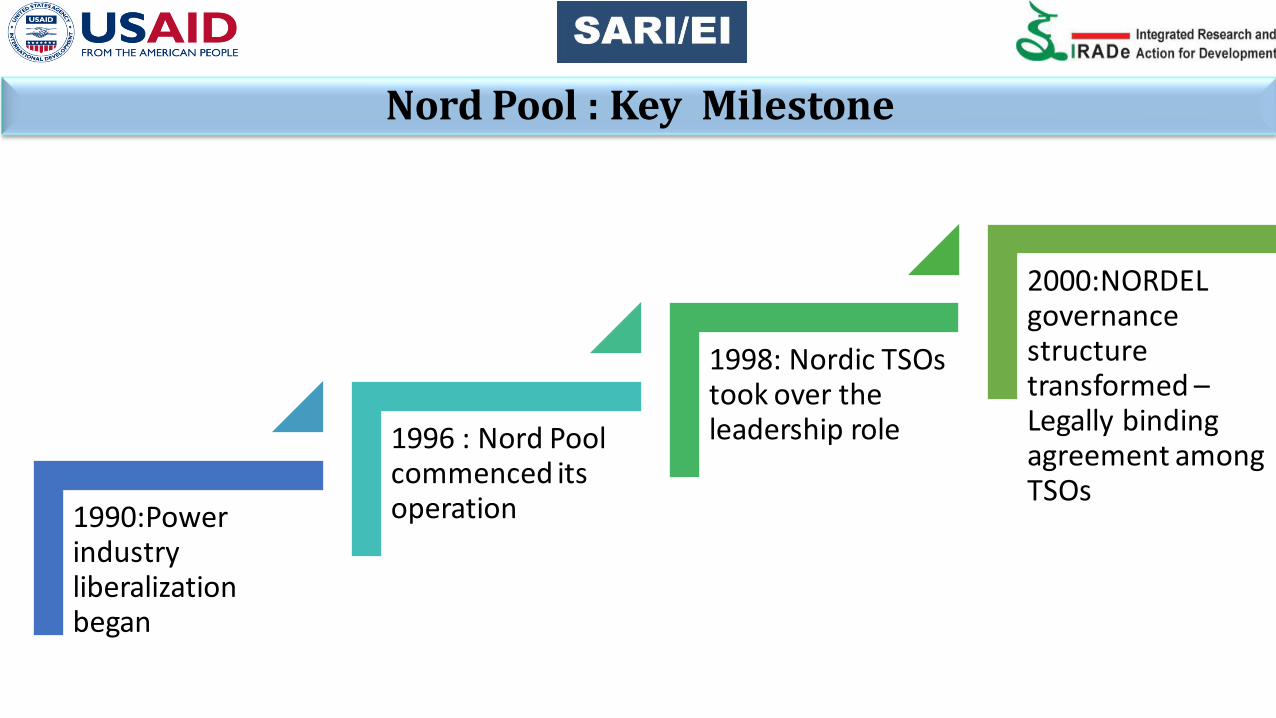
Nord Pool : Key Milestone
1990:Power industry liberalization began
1996 : Nord Pool commenced its operation
1998: Nordic TSOs took over the leadership role
2000:NORDEL governance structure transformed – Legally binding agreement among TSOs

Nordic Pool : Key Instruments
.
Inter-country MOU, Treaties, Agreements The inter-Nordic Transmission System Operation Agreement (TSOA) signed in the year 2000, defines framework on Security standards, Congestion management etc.
Power Trade/PPA Terms Physical ( spot market) and Financial ( Price hedging & risk management)- for future forward options. Physical - Hourly bids, 5 blocks. Intraday – Continuous 24 x7 a week, 1 hour prior to delivery. All Contracts are standardized in confirmative with Nordic OTC and bilateral market rate.
Regulatory Coordination Nord REG- Nordic Energy Regulator – to promote legal and institutional framework. With deeper energy integration across Europe, ACER was formed in 2009.
Transmission Planning/Infrastructure Transmission planning is done by Planning Committee; objective is smooth functioning, efficient utilization, consistent with environmental system. Master Plan at regional level .
Mechanism of interconnection . AC Inter-connection .HVDC link are also in place.
Open Access to Network Yes. All networks were opened for third-party access.
Transmission Pricing/Wheeling Charges and Transit
The point of Connection Tariff is used. Distance between seller and buyer – no significance.
Commercial Mechanism to Settle Imbalances Settlement procedure for long term bilateral agreement governed by conditions attached to such markets .Common imbalance settlement is therefore a prerequisite for a common end user market
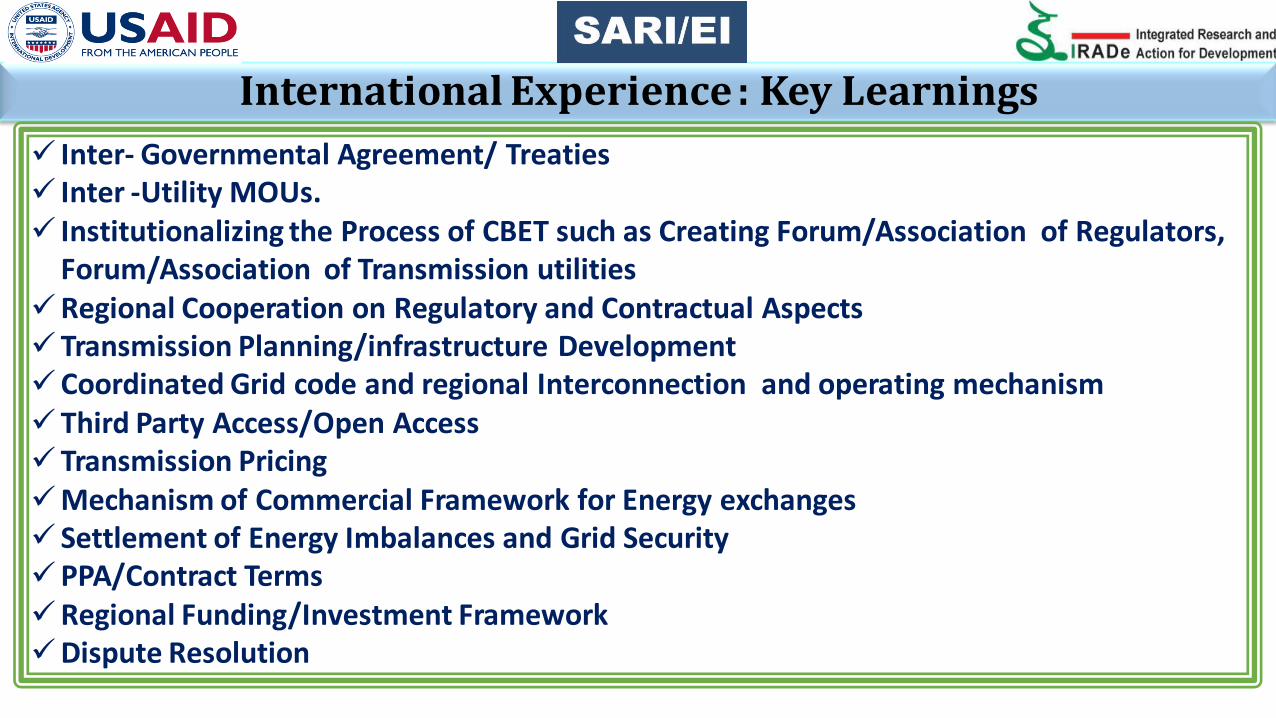
International Experience : Key Learnings
Inter- Governmental Agreement/ Treaties Inter -Utility MOUs. Institutionalizing the Process of CBET such as Creating Forum/Association of Regulators,
Forum/Association of Transmission utilities Regional Cooperation on Regulatory and Contractual Aspects Transmission Planning/infrastructure Development Coordinated Grid code and regional Interconnection and operating mechanism Third Party Access/Open Access Transmission Pricing Mechanism of Commercial Framework for Energy exchanges Settlement of Energy Imbalances and Grid Security PPA/Contract Terms Regional Funding/Investment Framework Dispute Resolution
Experiences and Leanings of South Asia Region
South Asia Region Experience : Key highlights
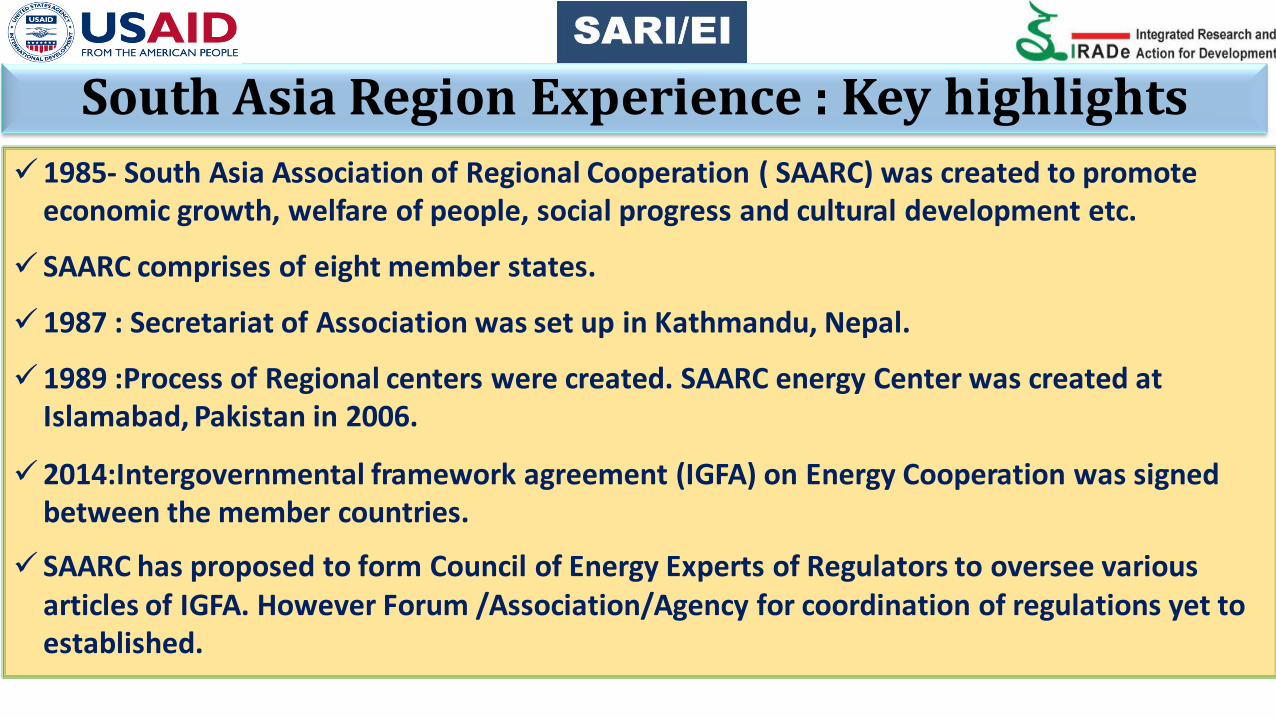
1985- South Asia Association of Regional Cooperation ( SAARC) was created to promote economic growth, welfare of people, social progress and cultural development etc.
SAARC comprises of eight member states.
1987 : Secretariat of Association was set up in Kathmandu, Nepal.
1989 :Process of Regional centers were created. SAARC energy Center was created at Islamabad, Pakistan in 2006.
2014:Intergovernmental framework agreement (IGFA) on Energy Cooperation was signed between the member countries.
SAARC has proposed to form Council of Energy Experts of Regulators to oversee various articles of IGFA. However Forum /Association/Agency for coordination of regulations yet to established.

South Asia Region Experience : Key highlights Currently Electricity Trade is between Eastern Region of the South Asia viz. between India-
Nepal, India-Bhutan, India-Bangladesh.
Current form of trade between South Asian countries is Bilateral- Long and Medium term. Multi-lateral and Trade of electricity on Exchanges is yet to commence.
Transmission Planning : Jointly/Bilateral.
Interconnection Mechanism: AC and HVDC both
Open Access: Only in India in Transmission and Distribution
Imbalance Settlement Mechanism: Only in India.
Dispute Resolution – SAARC arbitration council OR Singapore arbitration.
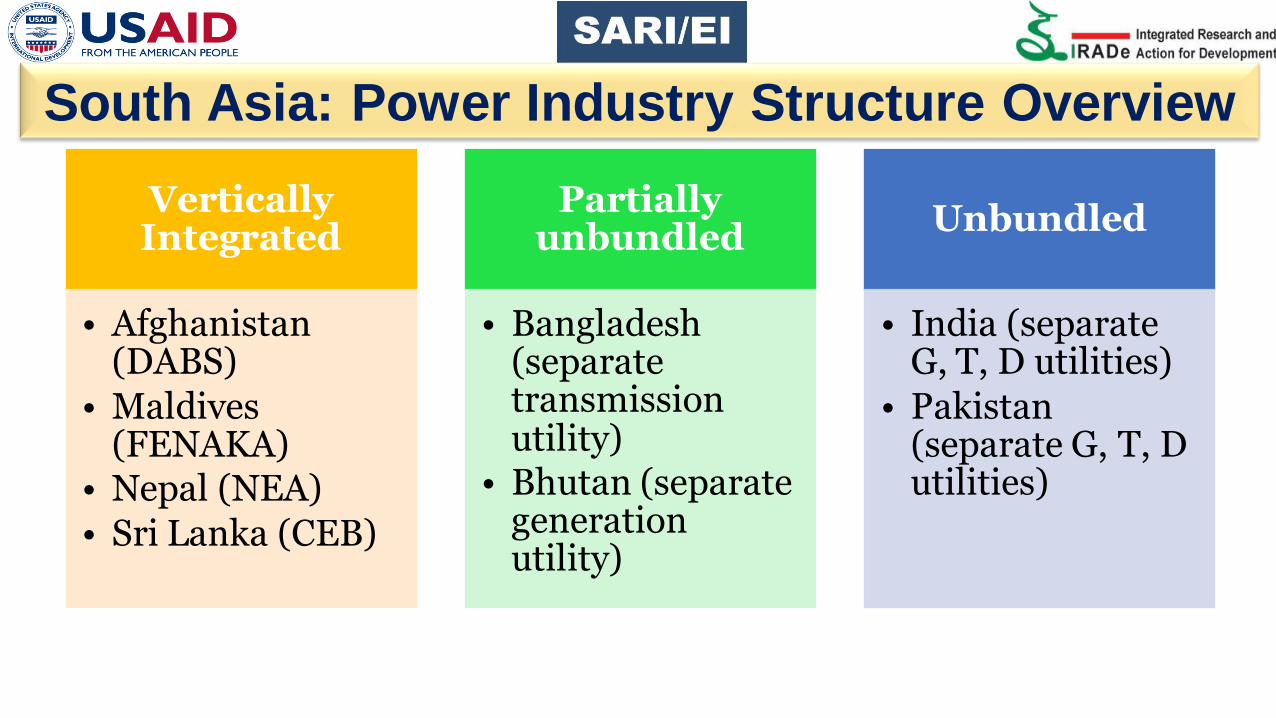
Vertically Integrated
• Afghanistan (DABS)
• Maldives (FENAKA)
• Nepal (NEA) • Sri Lanka (CEB)
Partially unbundled
• Bangladesh (separate transmission utility)
• Bhutan (separate generation utility)
Unbundled
• India (separate G, T, D utilities)
• Pakistan (separate G, T, D utilities)
South Asia: Power Industry Structure Overview

India Power sector Status
Thermal 68%
Nuclear 2%
Hydro 14%
RE 16%
INSTALLED CAPACITY (MW)
Total Installed Capacity 315426 MW
Thermal 215214 MW
Renewable energy 50018 MW
Nuclear 5780 MW
Hydro 44413 MW

Electricity Industry Structure in India

Indian Power Market Development : Key Lessons
.
Issue Lesson Learnt
Private Sector Participation
Rapid Capacity Addition-Prior to 2003 - 3 % ,presently - 40%
Unbundling Generation delicensed ,Trading distinct activity, Independent TSO’s
Transmission and Losses Improved Efficiency – Losses Reduced.
Competitive Bidding Efficient and Competitive Tariffs
Open Access In Transmission and distribution
Trading / Merchant Operations Trading still at 3% – 5% of the Total Market
Distribution Reforms In some selected cities ,Privatization happened which led to significant reduction in T& D losses and efficiency was improved
Grid Discipline Entire country is having an uniform Frequency. Deviation settlement mechanism has disciplined
Spot market Platform Two Power exchanges come up – Day Ahead Market ,Term Ahead Market.

Key leanings
SARI/EI Task Force Approach for Energy Integration for CBET: Key leanings for South Asia
1. Political Conesus : Regional Cooperation
and Recognition of CBET/Trade in the National
Policy, Law
2. Government Commitment & Policy
Coordination
3. Financial Challenges, Investment , Financial
Viability
4. Mechanism of Inter-connection
5. Market form of Trade
6. Regional Cooperation on Regulatory and
Contractual Aspects
7. Open Access in Transmission
8. Transmission Charges/Pricing
9. Transmission Plan
10.Commercial Mechanisms to Settle
Imbalances
11. Dispute Resolution
39
Motivation behind these challenge is to
address the typical Risks in Cross-Border Projects.
What are the Risk?
Funding Risk Financial Risk
Exchange Rate Risk
Financing Risk
Legal & Regulatory
Risk
Security Risk
Currency Transfer
Restriction Risk
Dispute Resolution
Risk
Po
litica
l a
nd
R
eg
ula
to
ry R
isk
Expropriation and Breach of
Contract
Planning & Construction
Risk
Commercial Risk
Pricing and Payment Risk
Supply Risk
Cross Border
Electricity Trade
Regional
Power System/
at
Initial Stages
Regional
Power System at
in
Transition and
Mature Stages
Country Risks
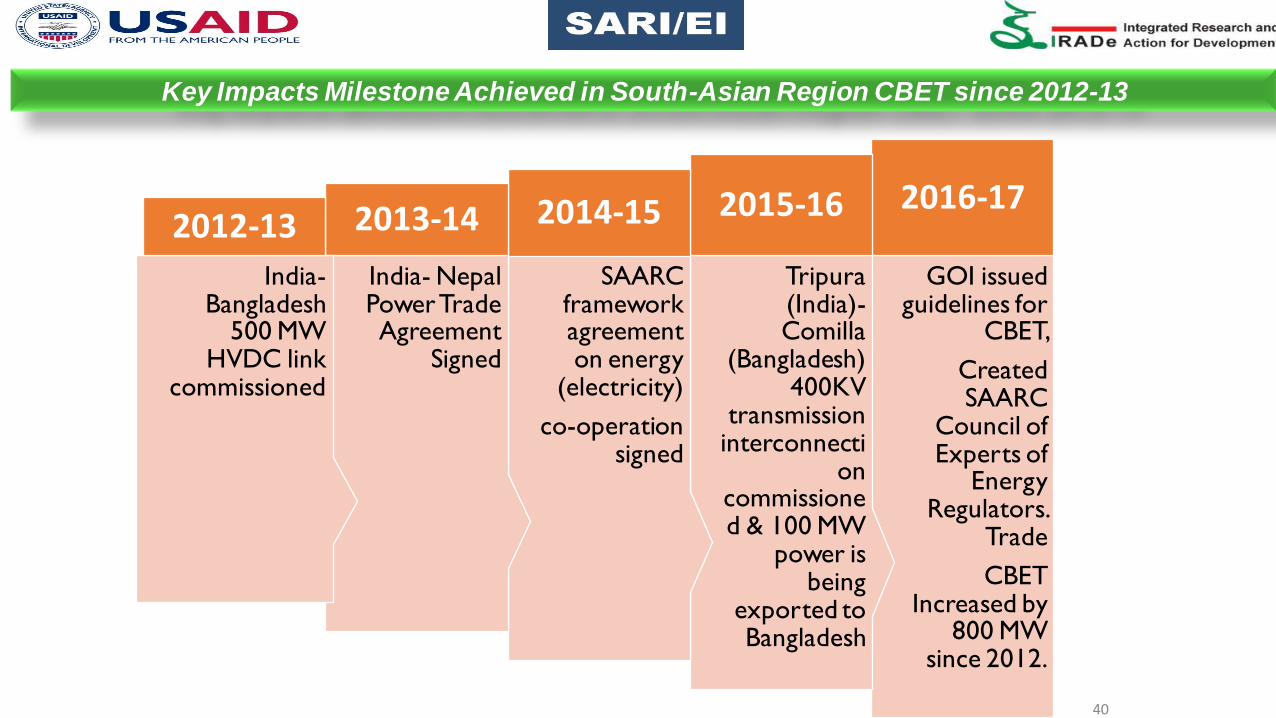
40
GOI issued guidelines for
CBET,
Created SAARC
Council of Experts of
Energy Regulators.
Trade
CBET Increased by
800 MW since 2012.
2016-17
Tripura (India)-Comilla
(Bangladesh) 400KV
transmission interconnecti
on commissioned & 100 MW
power is being
exported to Bangladesh
2015-16
SAARC framework agreement on energy
(electricity)
co-operation signed
2014-15
India- Nepal Power Trade Agreement
Signed
2013-14
India-Bangladesh
500 MW HVDC link
commissioned
2012-13
Key Impacts Milestone Achieved in South-Asian Region CBET since 2012-13

Major Publications

42
Way Forward
Implementation of Intergovernmental Framework Regional/bilateral Agreement/Treaties.
Regional investor friendly framework.
Alignment of Regulations ,Technical Standards, Grid Codes ,Operating Procedures
Multilateral Power Trading and Power exchange, imbalance settlement mechanism
Institutionalizing the Process of CBET such as Creating Forum/Association of Regulators(SAFER) , Forum/Association of Transmission utilities (SAFTU)
Financial Viability of power sector needs to be improved to sustain CBET in long run
Regional level Generation and Transmission Planning Transparent Regional Dispute Settlement mechanism .

Thank You
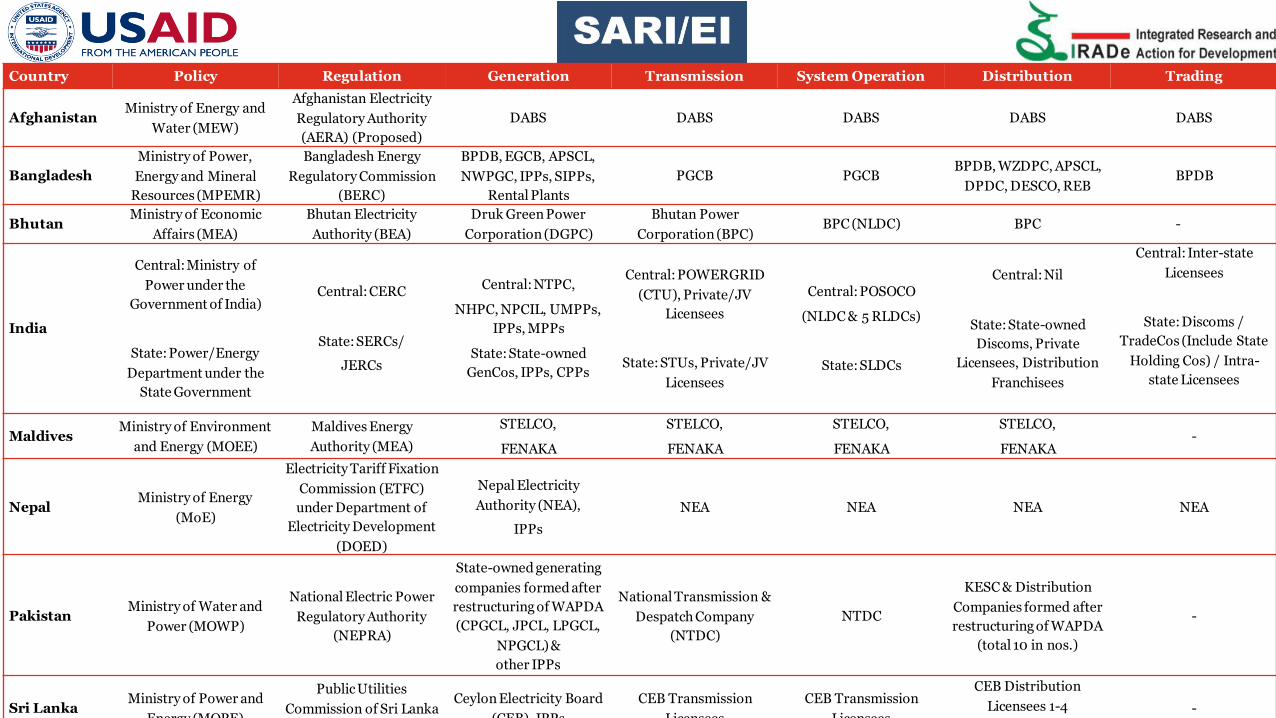
Country Policy Regulation Generation Transmission System Operation Distribution Trading
Afghanistan Ministry of Energy and
Water (MEW)
Afghanistan Electricity
Regulatory Authority
(AERA) (Proposed)
DABS DABS DABS DABS DABS
Bangladesh
Ministry of Power,
Energy and Mineral
Resources (MPEMR)
Bangladesh Energy
Regulatory Commission
(BERC)
BPDB, EGCB, APSCL,
NWPGC, IPPs, SIPPs,
Rental Plants
PGCB PGCB BPDB, WZDPC, APSCL,
DPDC, DESCO, REB BPDB
Bhutan Ministry of Economic
Affairs (MEA)
Bhutan Electricity
Authority (BEA)
Druk Green Power
Corporation (DGPC)
Bhutan Power
Corporation (BPC) BPC (NLDC) BPC -
India
Central: Ministry of
Power under the
Government of India)
State: Power/Energy
Department under the
State Government
Central: CERC
State: SERCs/
JERCs
Central: NTPC,
NHPC, NPCIL, UMPPs,
IPPs, MPPs
State: State-owned
GenCos, IPPs, CPPs
Central: POWERGRID
(CTU), Private/JV
Licensees
State: STUs, Private/JV
Licensees
Central: POSOCO
(NLDC & 5 RLDCs)
State: SLDCs
Central: Nil
State: State-owned
Discoms, Private
Licensees, Distribution
Franchisees
Central: Inter-state
Licensees
State: Discoms /
TradeCos (Include State
Holding Cos) / Intra-
state Licensees
Maldives Ministry of Environment
and Energy (MOEE)
Maldives Energy
Authority (MEA)
STELCO,
FENAKA
STELCO,
FENAKA
STELCO,
FENAKA
STELCO,
FENAKA -
Nepal Ministry of Energy
(MoE)
Electricity Tariff Fixation
Commission (ETFC)
under Department of
Electricity Development
(DOED)
Nepal Electricity
Authority (NEA),
IPPs
NEA NEA NEA NEA
Pakistan Ministry of Water and
Power (MOWP)
National Electric Power
Regulatory Authority
(NEPRA)
State-owned generating
companies formed after
restructuring of WAPDA
(CPGCL, JPCL, LPGCL,
NPGCL) &
other IPPs
National Transmission &
Despatch Company
(NTDC)
NTDC
KESC & Distribution
Companies formed after
restructuring of WAPDA
(total 10 in nos.)
-
Sri Lanka Ministry of Power and
Energy (MOPE)
Public Utilities
Commission of Sri Lanka
(PUCSL)
Ceylon Electricity Board
(CEB), IPPs
CEB Transmission
Licensees
CEB Transmission
Licensees
CEB Distribution
Licensees 1-4
LECO
-