Energy Efficiency Best Practices for Drinking Water …...Energy Efficiency Best Practices for...
38
Energy Efficiency Best Practices for Drinking Water Utilities 2010 GWPC Water/Energy Sustainability Symposium Vanessa M. Leiby The Cadmus Group, Inc. September 29, 2010
Transcript of Energy Efficiency Best Practices for Drinking Water …...Energy Efficiency Best Practices for...

Energy Efficiency Best Practices for Drinking Water Utilities
2010 GWPC Water/Energy Sustainability Symposium
Vanessa M. LeibyThe Cadmus Group, Inc.
September 29, 2010

RESEARCH PROJECT• Water Research Foundation Project #4223
– Project Manager, Linda Reekie• Co-funded with NYSERDA
– Kathleen O’Connor• Research Team
– PI, Vanessa Leiby, The Cadmus Group, Inc.– Subcontractor, Michael Burke, CH2M Hill
• PAC Members: Richard Metzger, MVWA; Kevin Fisher, LVVWD; and Steve Conrad, Simon Fraser University
• International Research Project headed by GWRC– North America, Asia, Europe, South Africa, and Australia

GOALS AND OBJECTIVES
• Compile successful strategies to help water utilities reduce energy consumption– Reduce energy costs for individual utilities– Reduce GHGe that contribute to climate change
• Develop a compendium of best practices and case studies– Report– Searchable database– Presentations
CASE STUDY LOCATIONS

CASE STUDY UTILITIES
• American Water, NJ• Ann Arbor Water Treatment Services, MI• Austin Water Utility, TX• Cedar Rapids Water Department, IA• Cleveland Water Division, OH• Columbus Water Works, GA• Las Vegas Valley Water District , NV• Metro Vancouver / Greater Vancouver Water
District, BC, CN
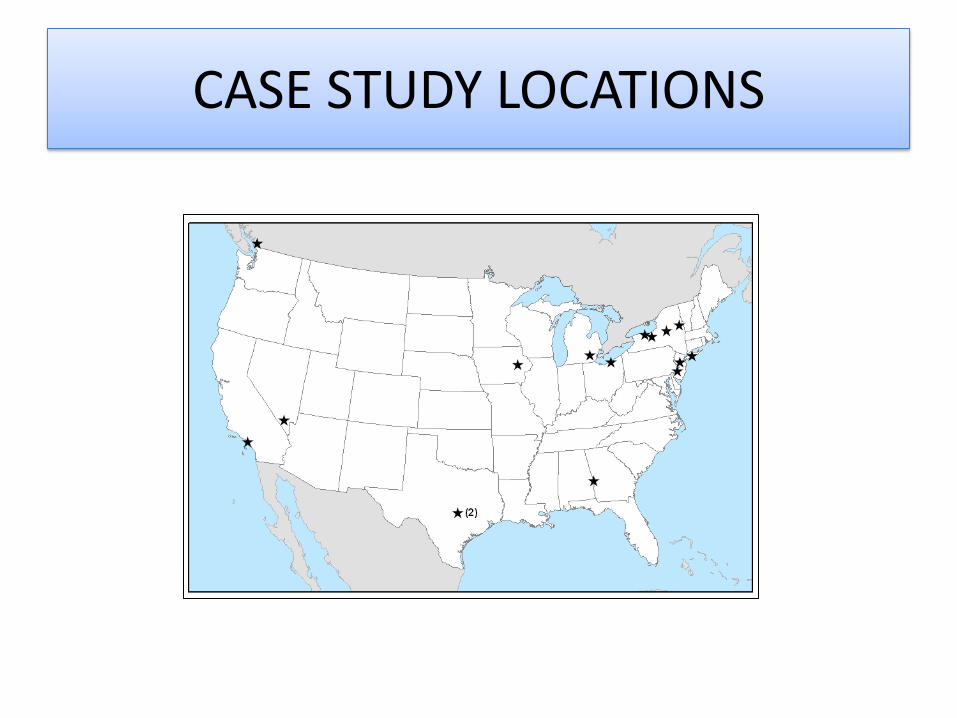
CASE STUDY UTILITIES
• Mohawk Valley Water Authority, NY• Monroe County Water Authority, NY• New Jersey American Water, NJ• Queensbury Water District, NY• Suffolk County Water Authority, NY• Village of Waterloo, NY• West Basin Municipal Water District, CA

BACKGROUND
• $4 billion spent annually in U.S. in the water sector on energy
• 3% of U.S. energy consumption
• 56 billion kilowatt hours (kWh)
• 44.8 million tons greenhouse gas
BACKGROUND
• DW and WW treatment consume 30 – 60% of energy used by municipalities
• 80 – 90% of water treatment plant energy consumption goes to pumping
• Energy efficiency could be improved by 10 –30%
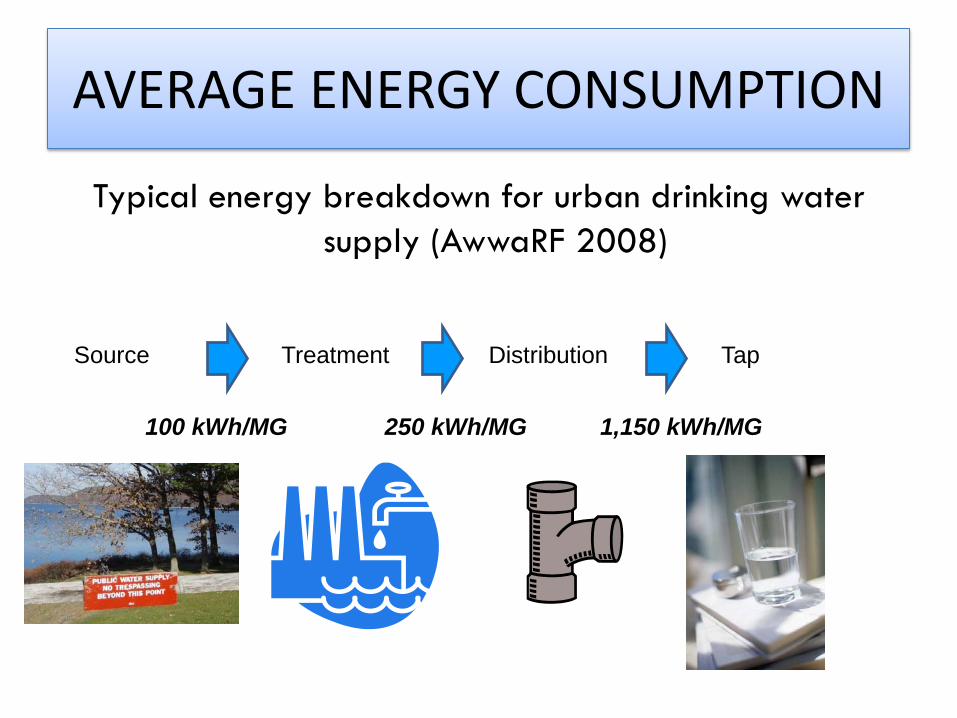
AVERAGE ENERGY CONSUMPTION
Typical energy breakdown for urban drinking water supply (AwwaRF 2008)
Source Treatment Distribution Tap
100 kWh/MG 250 kWh/MG 1,150 kWh/MG

ENERGY COSTS ARE INCREASING
• Installing new technologies
• Drought and climate change
• Aging infrastructure
• Growth and system expansion
• Increased demand
BENEFITS OF ENERGY EFFICIENCY
• Reduced GHG emissions
• Less strain on current energy grid
• Meet new state energy reduction targets
• Financial savings/reinvestment– New/better treatment – Distribution system/infrastructure upgrades
• Environmental stewardship
• Improved customer relations

POTENTIAL ENERGY SAVINGS
• Potential savings of 10-30% are readily achievable
• Water facilities can save – 10-15% through load shifting– 5-15% through VFDs and premium efficiency motors– 10-20% through process optimization and SCADA
• Installing meters and monitoring systems can save 10% of energy costs through behavioral changes and improved O&M

POTENTIAL BARRIERS
• Operational barriers
• Institutional barriers
• Political barriers
• Regulatory barriers
• Financial barriers
BEST PRACTICES
• Management Tools• Plant Improvements and Operational Changes• Water Treatment• Water Distribution• Water Conservation• Alternative / Renewable Energy Sources• Financial Assistance• Partnerships

Benchmarking
Energy Audits
Energy Management Systems
EWQMS
MANAGEMENT TOOLS

PLANT IMPROVEMENTS AND OPERATIONAL CHANGES
Lighting & HVAC
SCADA
Forecasting & Load Demand
Profiles
Long-range Planning
Rate Structures
Fuel Efficient Vehicles

WATER TREATMENT
River Bank Filtration
Slow Sand Filtration
Direct Filtration
Conventional Filtration
Diatomaceous Earth Filtration
Hydraulic Flocculation
Polyaluminum Chloride Air Stripping
Membranes Ozone Ultraviolet Disinfection Desalination

WATER DISTRIBUTION
Hydraulic Modeling
Post Flocculation
Distribution System Piping
Pumps MotorsVariable
Frequency Drives
PRVs & Inline Turbines

• Supply Side– Leak Detection– Metering– Alternate Supply
• Demand Side– Water Loss Audits– EPA’s WaterSense Program– Metering– Water Efficient Devices– Commercial and Industrial Efficiency– Alternate Supply– Conservation Rate Structure
WATER CONSERVATION

ALTERNATIVE/RENEWABLE ENERGY SOURCES
• Solar Power
• Wind Turbines
• Geothermal
• Lake / Ocean Water Cooling
• Micro-Hydro Generation

FINANCIAL ASSISTANCE
• DWSRF and CWSRF• ARRA-GPR• Financial Incentives
– State programs– Electric and power utilities
• State Funding Programs• Energy Performance Contracting

PARTNERSHIPS
• Federal Government
• State Governments
• Universities
• Energy and Water Providers
• Trade Associations and Other Business Networks
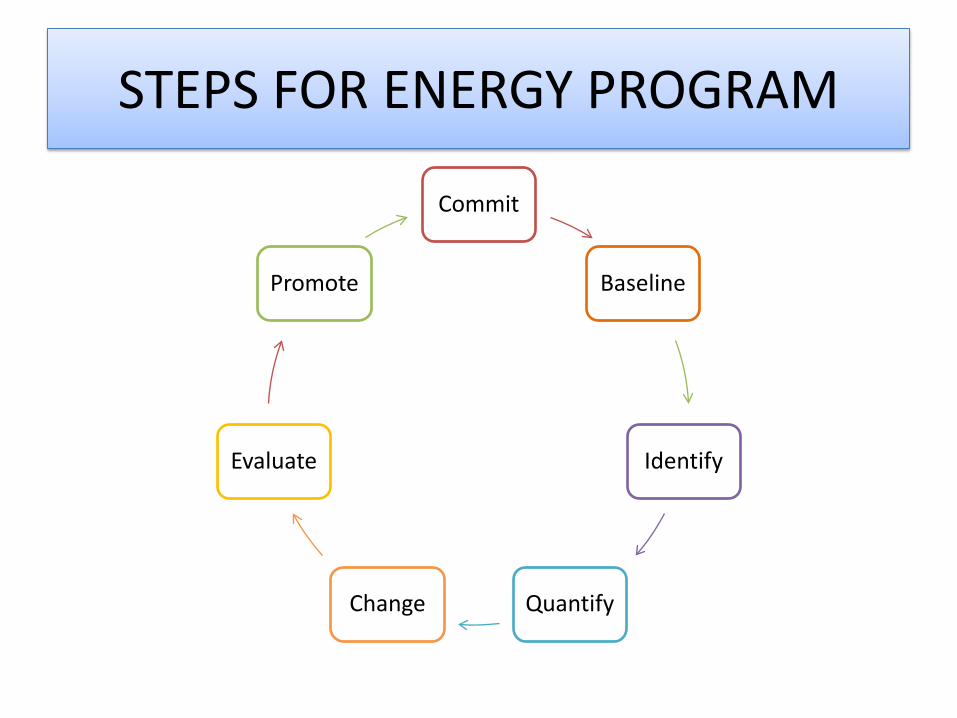
STEPS FOR ENERGY PROGRAM
Commit
Baseline
Identify
QuantifyChange
Evaluate
Promote
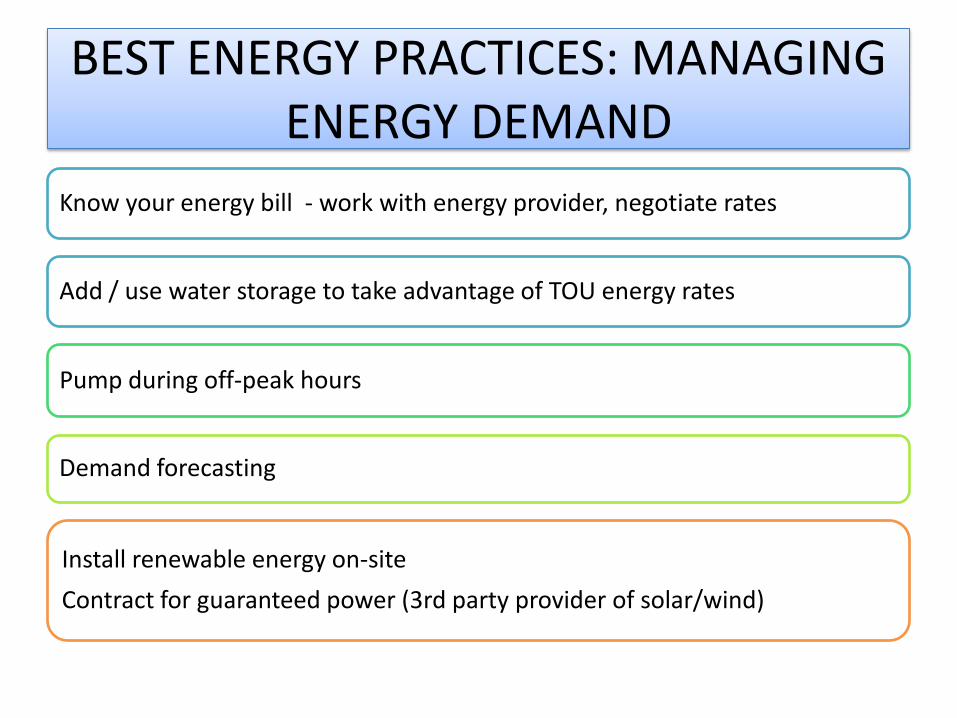
BEST ENERGY PRACTICES: MANAGING ENERGY DEMAND
Know your energy bill - work with energy provider, negotiate rates
Add / use water storage to take advantage of TOU energy rates
Pump during off-peak hours
Demand forecasting
Install renewable energy on-site Contract for guaranteed power (3rd party provider of solar/wind)

BEST ENERGY PRACTICES: HVAC
Greatest opportunities at design phase - latest systems can reduce energy use 10-40%
High efficiency AC can reduce cooling loads by 30-40%
Controls can reduce energy use by 10-20%
Regular cleaning of air filters can lower energy use by as much as 20%
Programmable thermostats, ventilation fans, insulated building, low-emittance windows, reflective coating on building roof

BEST ENERGY PRACTICES: LIGHTING
Lighting accounts for 35-45% of a building’s energy use; uses 2% of a plant’s total electricity load
Occupancy sensors can reduce lighting 10-20% with average payback period of 1 year
Upgrade incandescent lights with fluorescent systems – last 10x longer, 3x more effective, use 20-30% less wattage than conventional
Replace T-12 with T-8 lamps which are up to 34% more energy efficient
Replace mercury lights with metal halide or high-pressure sodium – yield 50% energy savings
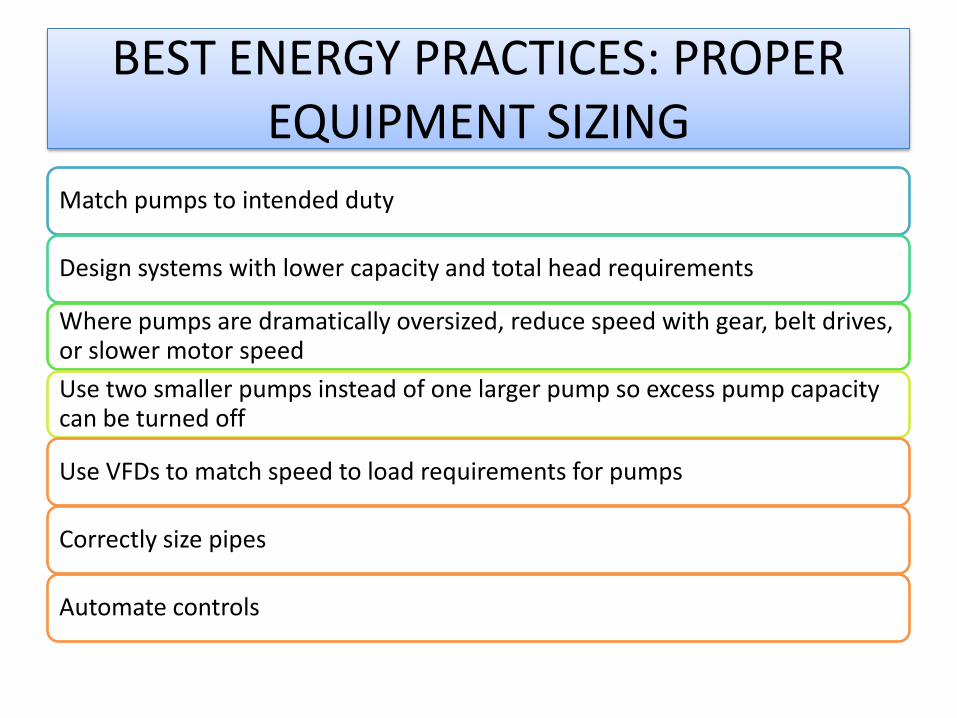
Match pumps to intended duty
Design systems with lower capacity and total head requirements
Where pumps are dramatically oversized, reduce speed with gear, belt drives, or slower motor speedUse two smaller pumps instead of one larger pump so excess pump capacity can be turned off
Use VFDs to match speed to load requirements for pumps
Correctly size pipes
Automate controls
BEST ENERGY PRACTICES: PROPER EQUIPMENT SIZING
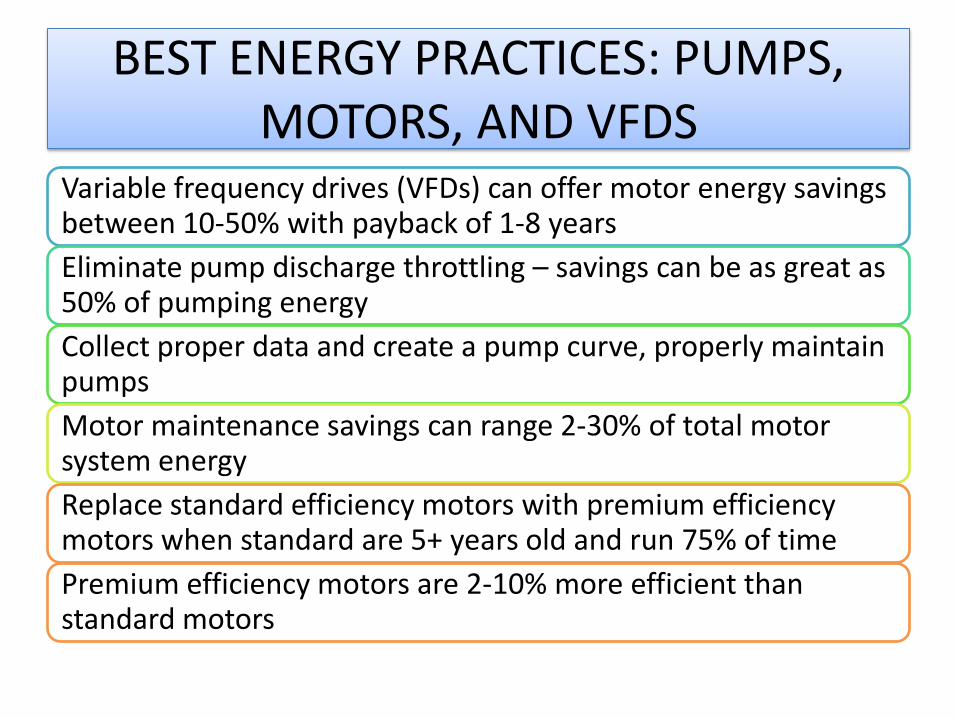
BEST ENERGY PRACTICES: PUMPS, MOTORS, AND VFDS
Variable frequency drives (VFDs) can offer motor energy savings between 10-50% with payback of 1-8 yearsEliminate pump discharge throttling – savings can be as great as 50% of pumping energyCollect proper data and create a pump curve, properly maintain pumpsMotor maintenance savings can range 2-30% of total motor system energyReplace standard efficiency motors with premium efficiency motors when standard are 5+ years old and run 75% of timePremium efficiency motors are 2-10% more efficient than standard motors

Water saved is energy saved
Average water loss 10-20%
Leak detection & repair/replacement
Accurate metering
Promoting conservation with consumers (rebates, home audits, etc.)
Manage high-volume users
BEST ENERGY PRACTICES: WATER EFFICIENCY & CONSERVATION
Available at the end of this presentation
RESOURCES
Web sites Resources Tools

QUESTIONS?
Vanessa LeibyPrincipalThe Cadmus Group, Inc.301-253-3671 [email protected] site: http://www.cadmusgroup.com

RESOURCES• Water Research Foundation
http://www.waterresearchfoundation.org/• NYSERDA http://www.nyserda.org• EPA ENERGY STAR® http://www.energystar.gov• EPA Green Power Partnerships http://www.epa.gov/greenpower• EPA WaterSense http://www.epa.gov/watersense• AWWA WaterWiser
http://www.awwa.org/Resources/Waterwiser.cfm?navItemNumber=1516
• Consortium for Energy Efficiency http://www.cee1.org• California Energy Commission
http://www.energy.ca.gov/reports/efficiency_handbooks/index.html
• Alliance to Save Energy http://www.ase.org

• Alliance for Water Efficiency http://www.allianceforwaterefficiency.org
• California Urban Water Conservation Council http://www.cuwcc.org
• National Regulatory Research Institutehttp://www.nrri.org
• Electric Power Research Institute http://my.epri.com/portal/server.pt?
• DOE’s Energy Efficiency and Renewable Energy Clearinghouse http://www.eere.energy.gov
• USGBC and LEED program http://www.usgbc.org; http://www.usgbc.org/DisplayPage.aspx?CategoryID=19
RESOURCES

RESOURCES• EPA Climate Leadership Partner Program
http://www.epa.gov/stateply• EPA Drinking Water State Revolving Fund
http://www.epa.gov/safewater/dwsrf• American Water Works Association (AWWA)
http://www.awwa.org• Database for State Incentives for Renewables and Efficiency
(DSIRE) http://www.dsireusa.org• Ensuring a Sustainable Future: An Energy Management
Guidebook for Wastewater and Water Utilities, USEPA http://www.epa.gov/waterinfrastructure/pdfs/guidebook_si_energymanagement.pdf
• U.S. Department of Energy http://www.doe.gov

RESOURCES• Iowa Association of Municipal Utilities http://iamu-is-
svr01.iamu.org/ww-cat• Pump System Improvement Modeling Tool
http://www.pumpsystemsmatter.org• USEPA region 9’s website:
http://www.epa.gov/region09/waterinfrastructure/benchmark.html
• Lean and Energy Toolkit http://www.epa.gov/lean• CEC energy audit
http://www.energy.ca.gov/reports/efficiency_handbooks/index.html.
• EPRI Energy Audit Manual for Water /Wastewater Facilities http://www.cee1.org/ind/mot-sys/ww/epri-audit.pdf

• EPA Portfolio Manager http://www.energystar.gov/index.cfm?c=evaluate_performance.bus_portfoliomanager
• DOE information on various alternative fuels http://www.fueleconomy.gov and http://www.eere.energy.gov/afdc/fleets/index.html
• DOE free software program, the Pumping System Assessment Tool (PSAT) http://www.pumpsystemsmatter.org/content_detail.aspx?id=112
• DOE 1*2*3 Approach to Motor Management resource tool to assist with motor repair / replace decisions http://www.motorsmatter.org/
RESOURCES
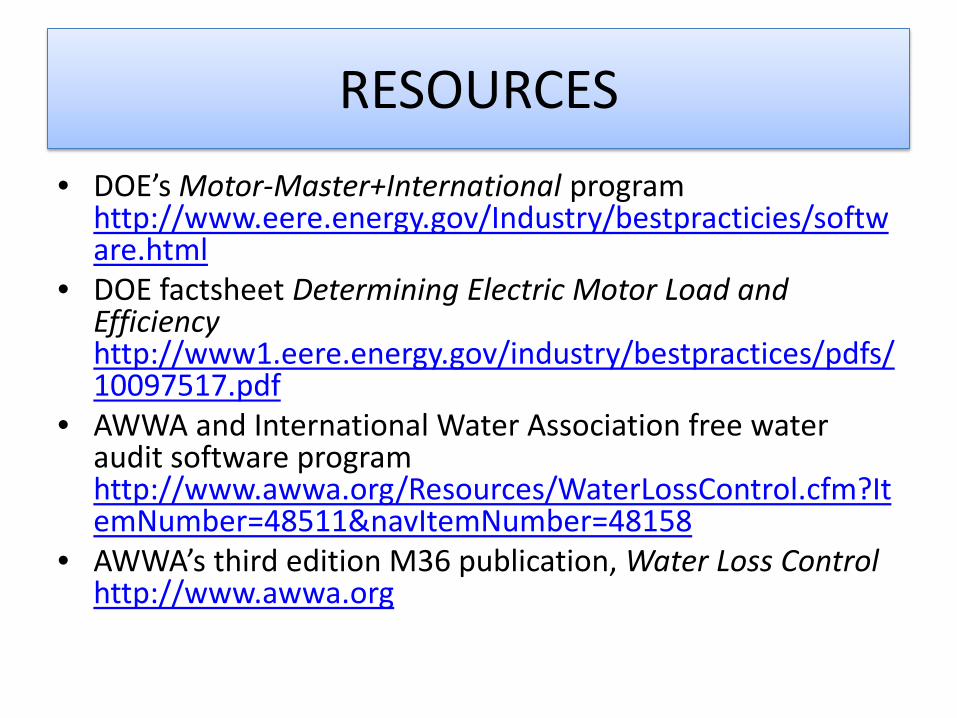
• DOE’s Motor-Master+International program http://www.eere.energy.gov/Industry/bestpracticies/software.html
• DOE factsheet Determining Electric Motor Load and Efficiency http://www1.eere.energy.gov/industry/bestpractices/pdfs/10097517.pdf
• AWWA and International Water Association free water audit software program http://www.awwa.org/Resources/WaterLossControl.cfm?ItemNumber=48511&navItemNumber=48158
• AWWA’s third edition M36 publication, Water Loss Controlhttp://www.awwa.org
RESOURCES

RESOURCES• DOE Save Energy Now Program
http://www1.eere.energy.gov/industry/saveenergynow/assessments.html
• Energy Efficiency and Conservation Block Grant Program (EECBG) http://www.eecbg.energy.gov/
• USDA Rural Development – Rural Energy for America Program Grants/Energy Audit and
Renewable Energy Development Assist http://www.rurdev.usda.gov/rbs/busp/9006loan.htm
– Rural Energy for America Program Guaranteed Loan Program (REAP LOAN)http://www.rurdev.usda.gov/rbs/busp/REAPEA.htm
• U.S. DHHS Rural Assistance Center (RAC) http://www.raconline.org/funding/