Energy Core Laboratories, NV (NYSE: CLB) Recommendation
30
1 | Core Laboratories, NV Energy Core Laboratories, NV (NYSE: CLB) November 10, 2017 Krause Fund Research Fall 2017 Recommendation: Analysts Cheick Ndiaye Robert Gill [email protected] [email protected] John Akpan [email protected] Core Laboratories, NV (NYSE: CLB) is an oil and gas equipment and services company established in 1936 in Houston Texas. Core Labs employs over 4,400 people, and maintains over 70 offices in over 50 countries across the globe. Since their inception, Core Labs has risen to become a leading global provider of Reservoir Description and management services to oil & gas exploration and production (E&P) companies. Core Laboratories divides its operations into three distinct categories: Reservoir Description, Production Enhancement, and Reservoir Management. Reservoir Description is the firm’s largest source of revenue, and has shown remarkable resiliency, with floor 2016 revenues being down less than 20% from peak levels in 2014, despite drastic cut-backs in capital expenditures from their client base. Additionally, Core is a Cash Flow machine and boasts the highest ROIC of any comparable firm (Market Cap 4B+) within their industry • With oil markets recovering from 2016 lows, we forecast Core Laboratories’ revenue to grow strongly by an annual average of 13%-14% within the next few years • Additionally, we predict that their disciplined utilization of capital will enable them to maintain their industry leading ROIC during the forecasted period • Furthermore, strong cash flow should ensure more value returned to shareholders in the form of increased dividend payouts and continued share repurchases • However, despite these positives, the level of growth necessary to justify Core’s gaudy price of nearly 64 times Earnings is unreasonable given current conditions within the energy sector • High ROIC is great, but the effect is stymied by limited capital expenditure spending by Core’s client base, which reduces demand for Core’s services and limits the firm’s overall growth potential • Therefore, we are estimating a target price of $90-$95, and providing a SELL recommendation. One Year CLB Performance Current Price $104.30 Target Price $90 - $95 Stock Performance Highlights 52 week High $125.83 52 week Low $86.55 Beta 1.67 Average Daily Volume 7.15 M Share Highlights Market Capitalization 4.6 B Shares Outstanding 44.15 M EPS 1.45 Trailing P/E Ratio 63.99 Dividend Yield 2.09% Dividend Payout Ratio 152% Company Performance Highlights ROA 11% ROE 97% Revenue 594.74 M Financial Ratios Current Ratio 1.79 Debt to Equity 1.39 Company Overview Core Poised for High Growth as Oil Market Recovery continues
Transcript of Energy Core Laboratories, NV (NYSE: CLB) Recommendation

1 | C o r e L a b o r a t o r i e s , N V
Energy Core Laboratories, NV (NYSE: CLB) November 10, 2017
Krause Fund Research Fall 2017 Recommendation: Analysts Cheick Ndiaye Robert Gill [email protected] [email protected]
John Akpan [email protected]
Core Laboratories, NV (NYSE: CLB) is an oil and gas equipment and services company established in 1936 in Houston Texas. Core Labs employs over 4,400 people, and maintains over 70 offices in over 50 countries across the globe. Since their inception, Core Labs has risen to become a leading global provider of Reservoir Description and management services to oil & gas exploration and production (E&P) companies. Core Laboratories divides its operations into three distinct categories: Reservoir Description, Production Enhancement, and Reservoir Management. Reservoir Description is the firm’s largest source of revenue, and has shown remarkable resiliency, with floor 2016 revenues being down less than 20% from peak levels in 2014, despite drastic cut-backs in capital expenditures from their client base. Additionally, Core is a Cash Flow machine and boasts the highest ROIC of any comparable firm (Market Cap 4B+) within their industry
• With oil markets recovering from 2016 lows, we forecast Core Laboratories’ revenue to grow strongly by an annual average of 13%-14% within the next few years
• Additionally, we predict that their disciplined utilization of capital will enable them to maintain their industry leading ROIC during the forecasted period
• Furthermore, strong cash flow should ensure more value returned to shareholders in the form of increased dividend payouts and continued share repurchases
• However, despite these positives, the level of growth necessary to justify Core’s gaudy price of nearly 64 times Earnings is unreasonable given current conditions within the energy sector
• High ROIC is great, but the effect is stymied by limited capital expenditure spending by Core’s client base, which reduces demand for Core’s services and limits the firm’s overall growth potential
• Therefore, we are estimating a target price of $90-$95, and providing a SELL recommendation.
One Year CLB Performance
Current Price
$104.30
Target Price $90 - $95
Stock Performance Highlights 52 week High $125.83 52 week Low $86.55 Beta 1.67 Average Daily Volume 7.15 M Share Highlights Market Capitalization 4.6 B Shares Outstanding 44.15 M EPS 1.45 Trailing P/E Ratio 63.99 Dividend Yield 2.09% Dividend Payout Ratio 152% Company Performance Highlights ROA 11% ROE 97% Revenue 594.74 M Financial Ratios Current Ratio 1.79 Debt to Equity 1.39
Company Overview
Core Poised for High Growth as Oil Market Recovery continues

2 | C o r e L a b o r a t o r i e s , N V
While Core Laboratories is not immune to the cyclicality of the oil and gas industry, their services and products are centered around improving reservoir production and recovery, as opposed to E&P. Core’s services are typically applied to oil fields that are already in production, helping to somewhat insulate them from industry downturns, as major production companies typically continue to invest in their existing and maturing oil fields throughout the entire cycle. Additionally, Core Laboratories has boasted one of the strongest performances among their peers regarding cash flow and ROIC, which should ensure steady dividend growth growing forward. However, despite these strong fundamentals, we believe that the level of organic growth necessary to justify Core’s current sky-high P/E ratio of 64 (nearly four times the current industry average) is unreasonable given the current conditions facing the energy sector. Thus, we are providing a SELL recommendation based upon our DDM and DCF analysis.
Gross Domestic Product The gross domestic product, or GDP, is a common measure of the state of national and global economies. It quantifies the monetary value of all the goods and services produced in a country over a specific period. When inflation is not out of control, an increase in GDP is one of the strongest indicators of healthy economic growth. GDP can also be viewed as a measure of overall consumption. Expansions and contractions in GDP have a strong influence on energy demands, as energy is a vital input for the transportation and production of nearly all goods and services. As illustrated in the historical graph below, GDP, Energy Consumption, and the price of crude oil are
all strongly correlated with each other.
(Source: Energy Information Administration)
GDP growth varies from country to country, but typically, developing and emerging economies have significantly higher levels of growth than the post-industrial economies of the western world. We expect GDP growth to continue to ramp up in developing economies, but remain relatively flat among the developed world, consistent with OECD estimates and projections
With growth remaining stagnant in the western world, we believe that it will be the emerging economies in Asia and Africa that will drive increasing oil consumption and demand into the future. Energy Prices The price of crude oil is arguably the biggest driver in the earnings performance of energy sector companies, as it dictates the profitability of upstream exploration and production companies, which in turn influences their demand for the various products & services offered by downstream companies in the energy sector. The
2.0% 2.2% 1.8% 2.1% 2.1%
4.6%3.9% 4.1% 4.6% 4.8%
0.0%
2.0%
4.0%
6.0%
2014 2015 2016 2017 2018
OECD vs Non-OECD Real GDP Growth
OECD Non-OECD
Executive Summary
Economic Analysis

3 | C o r e L a b o r a t o r i e s , N V
price of crude has fallen significantly in recent years, but has begun to recover from its trough in 2016. The Energy Information Administration projects that the price of Crude oil will remain relatively stable over the next few years.
(Source: Energy Information Administration)
For our part, we are projecting an estimated price of crude between $55-$60 per barrel for the target period of our forecast. Important supply-side indicators that contribute to the overall price level of crude oil are inventory levels and refinery utilization, and conversely, demand-side energy consumption levels also play a major role in influencing the overall price level.
Crude Inventories
Growing inventory levels are a leading indicator of oil prices, as it signals that either oil demand is falling, or that production is outstripping demand, both of which signal an oil surplus, which puts downward pressure on energy prices.
Since 2014, U.S. Crude Oil Inventories have steadily risen from roughly 300 million barrels in 2011 to a peak of nearly 576 billion barrels in March of 2017. At the end of August 2017 the U.S. had crude oil inventories of 540 million barrels. (EIA)
Additionally, the Energy Information Administration projects that Oil inventories will
remain stable for the remainder of 2017, but begin to increase by 40 million barrels in early 2018.
The projected rise in oil inventories suggests that the price of crude is unlikely to rise significantly in the immediate future, as it signals that the oil supply will continue to outstrip demand, barring any significant aggregate supply shocks.
Refinery Utilization
The refinery Utilization rate is a percent measurement of how close to maximum capacity oil refineries are operating at. A refinery rate that is near maximum suggests a high demand for oil which in turn infers a higher price level, all else held equal. The refinery utilization rate fell to the low to mid 80% in the wake of the great recession, as demand for oil plummeted, but has since returned to pre-recession levels in the low 90%, suggesting that the recent downward pressure on oil prices is due primarily to the large supply glut and not a weakening of demand. (EIA)
75.00%80.00%85.00%90.00%95.00%
2005
2006
2007
2008
2009
2010
2011
2012
2013
2014
2015
2016
U.S. Percent Utilization of Operating Capacity
U.S. Percent Utilization of Operating Capacity

4 | C o r e L a b o r a t o r i e s , N V
We expect the refinery utilization rate to remain near maximum as global oil demand continues to rise, driven by increased consumption in emerging and expanding economies in Asia and Africa.
Oil Consumption
While Inventory levels and refinery utilization are indicators of oil supply, global consumption levels of oil help to fill out the demand half of the equation. Higher consumption while holding production levels equal puts an upward pressure on prices. Global consumption of oil was roughly 97 million barrels per day in 2016, and is expected to rise to over 100 million barrels per day by the end of 2018. (EIA)
While Oil demand has remained relatively static in the United States, large growth in China as well as developing countries elsewhere in the world has been a significant driver in rising global consumption.
Looking forward, after several years of excess supply over demand, the two have reached an effective equilibrium over the past year, and are expected to track closely together through 2018, inferring that market prices for oil may stabilize. However, prices could fall further if demand in emerging economies were to falter, as oil consumption in the United States and Europe has arguably reached its peak.
Overview
Core Laboratories operates within the Oil & Gas Equipment and Services industry, also known as “the downstream”, a sub-industry of the broader energy sector. Firms in this industry derive their revenues not from the production or sale of oil-based products, but by supplying their unique services and products to the actual drilling and exploration companies, also known as “the upstream”. As such, the performance of firms in the downstream are less dependent on the price of the underlying commodity than Production and Exploration firms, but still significantly influenced by changes in oil prices as their growth potential is constrained by the capital expenditures of their clients in the upstream.
INDUSTRY TRENDS
Production Cuts OPEC is currently in a phase of production cuts in efforts to bolster oil prices. We expect this to continue through at least March 2018, given managerial guidance.
Industry Analysis

5 | C o r e L a b o r a t o r i e s , N V
New Entrants Another important trend has been the emergence of US shale into the energy mix. US Shale gas has risen 35% in terms of natural gas production. Long term, cost inflation and environmental lobbying threaten high growth; however, shale production is expected to increase to 900,000 barrels/day in 2017 according to (DiChristopher). This could offset OPEC’s production cuts. With a breakeven price at less than $40/barrel, shale is competitive in a low-price environment. Mergers and Acquisitions Recent consolidation of the industry can be attributed to a survival response to the low oil prices. Particularly in the Oilfield services sector, it appears firms are shifting their operations towards more specific capabilities/specialties. As increasing global capital expenditures are being justified by increasing oil prices, rig activity has also been on the rise.
Source:PwC Forward-looking firms are increasing M&A activity to position themselves for an inevitably changing energy landscape, especially with oil prices stabilizing and making the valuation process easier. MARKETS AND COMPETITITON The competitive landscape that firms compete in is largely defined by OPEC and non-OPEC suppliers. Previous monopolization of the energy industry by OPEC is eroding, thus leading way to growing competition. On the demand side, our forward-looking analysis expects demand to come primarily
from quickly industrializing countries. Downstream firms have higher profit margins when oil profits are lower, compared to midstream and upstream firms. As a result, they are more sensitive to oil price volatility compared to firms farther in the supply chain. Crack spread, the price difference between crude oil and refined petroleum products, is a large determinant in the competitiveness of downstream firms.
Source: HSNO A widening crack spread over the course of the last year signals that refined oil products are outpacing the price of oil. Holding all else equal, we expect oil prices to rise, which will benefit the industry. Industry Classification Oil Equipment and Services is a mature industry. Thus, industry trends are highly correlated with the overall economy in addition to commodity prices, and threat of disruption via new entrants is low. Competition lies in garnering market share of this stable industry. This industry reacts to business cycles quite defensively. It experiences more stable performance during stages of the business cycle. Porter’s Five Forces Potential Entrants: Shale in the US has been the largest contributor to new oil production. It challenges rival crude oil extraction.
Gulf Coast Crack Spread, TTM

6 | C o r e L a b o r a t o r i e s , N V
Suppliers: The alignment of interests among member countries of OPEC greatly solidifies their bargaining power as a collective. While high barriers to entry, regulatory burden, and the finite existence of resources keeps competition at bay, it also creates a level of inflexibility for firms to deal with significant demand or supply shocks. Rivalry intensity: This industry is characterized by large capital requirements which make the threat of entry low. The industry is also highly saturated and mature. Customers: Energy demand is driven by rapid industrialization of growing countries. Their bargaining power is relatively low as global oil benchmarks determine the oil price and information is mostly symmetrical. Moreover, growing countries need energy. We expect consumption growth from industrializing non-OECD countries to be 10.96% through 2018. Substitutes: A threat of perceived substitutes is present with alternative and renewable energy. This is due to changing social factors, namely environmental sustainability; however, main growth is more attribute to the decline in coal consumption. Fossil fuels still dominate the energy mix and the noise around renewables is overstated. 77% of the world energy mix is expected come from fossil fuels in 2040, according to the EIA 2017 International Energy Outlook. This analysis leads us to believe that competition among firms is primarily for market share. Competition has been recently characterized by mergers and acquisitions which enable businesses to divest and position themselves strategically for what we believe is going to be a changing energy mix with slightly more prioritization placed on low carbon. Recovering oil prices have helped to justify this. Oilfield services are competing through specialization in offerings or fully integrated services. In the face of rising oil prices, we believe that it is paramount for E&P client companies to increase capital expenditures due to growing demand. This directly impacts oilfield service companies and their revenues.
Catalysts for change:
Developing and Emerging Markets
While Global Oil demand continues to rise, the rise in consumption is being increasingly fueled by developing and industrial Non-OECD countries in Asia and Africa, most notably China and India.
India in particular is projected to overtake China as the largest energy growth market in the world by 2025 (Economic Times)
As the push for renewable energy usage expands and manufacturing declines in the western world, these emerging markets will be key to driving oil demand into the future
Oil Prices
Crude Oil prices have remained stubbornly low due to excessive global supply, fueled largely by record production among non-OPEC producers, most notably the United States
While low oil prices are devastating to the profitability and earning potential of upstream companies involved primarily in drilling and exploration, they have less of an impact on downstream companies involved in equipment & services industries, provided that the low prices are not due to a decline in aggregate global demand. With global demand and supply continuing to rise, we believe the demand for equipment services will remain strong, especially in the U.S. where domestic production is projected to reach a record of 9.96 million bpd in 2018. (Shenk)
Changes in Government Policy
The Energy sector remains a heavily regulated industry due to the various environmental concerns.
One key policy proposal often being suggested by the Trump administration is the opening of the over 640 million acres of federal government land to private drilling and exploration. (Cama)

7 | C o r e L a b o r a t o r i e s , N V
Opening these federal lands could have the potential to further expand domestic oil production, which in turn would increase the demand for equipment and services and oil transportation.
Other potential reforms include a general relaxation of regulation facing drillers as well as an expansion of oil pipelines, the two most notable and controversial being the keystone and Dakota access pipelines.
We believe these reforms have the potential to encourage further domestic production, subsequently increasing the demand for equipment and services, as well a potentially lowering the direct costs faces by firms in the oil transportation industry.
Key Industry Positives
Rising U.S. oil production should continue to further the demand for domestic services and transportation.
As a mature industry with high barriers to entry via large capital costs and regulatory burden, the threat of new entrants disrupting existing firms is relatively low compared to other industries
While there is considerable hyperbole regarding the threat of renewable energy sources such as energy and wind, in practicality such sources remain a relatively minor share of overall energy consumption
Furthermore, we expect rising demand in developing non-OECD countries to more than offset any potential loss in market share among developed western economies.
Key Industry Negatives
While the high barriers to entry, regulatory burden, and finite existence of resources can serve to protect existing firms from greater competition or disruption, it also creates a level of inflexibility for firms to deal with significant demand or supply shocks.
While firms in the Equipment & Services industry are not as reliant on high energy prices as upstream firms, the key driver behind the energy sector at large is the price of oil, which as a commodity has a cyclical nature, causing increased volatility for long-term earnings and performance.
8 | C o r e L a b o r a t o r i e s , N V
General Overview
CEO: David Deshmur
COO: Monty Davis
CFO: Richard Bergmark
Core Laboratories, NV (Core) is an oil-services company that assists oil and gas companies better understand how to improve their production levels via reservoir analysis. Core Laboratories was established in 1936, and has become a global leading provider of reservoir description, production enhancement and reservoir management services to the oil and gas industry. Core Laboratories operates over 70 offices in over 50 countries in the world, and employs over 4,400 people worldwide. Core Laboratories breaks down their business operations into 3 main segments: Reservoir Description, Production Enhancement, and Reservoir Management. Business and Management Strategy Core Laboratories primary business strategy can be divided into 3 distinct components:
• To continue their development of new reservoir-optimizing technologies via research and development driven by their clients
• To expand their line of services and products they offer through their global network of offices
• To acquire complementary technologies to enhance their existing services and products
Additionally, Core Laboratories established a very shareholder-friendly management philosophy by achieving an industry-leading ROIC of over 60% the past three years, while also increasing their operating cash flow to close to 10-times their capital expenditures. In 2nd quarter of 2017, Free Cash Flow was 130% of Net Income, the best
mark among all Oil & Gas Services companies. Since the firm’s inception, it has returned more than $1.6 billion to equity holders in the form of dividends and share buybacks. (Earnings Call Q2) Financial Summary As with most firms within the oil services industry, Core Laboratories saw revenues and earnings decline significantly during fiscal year 2016, as the plummeting price of oil caused a cratering in demand for their services. The decline has been more muted in Core’s leading business segment, Reservoir Description, where 2016 revenues were down less than 20% from 2014 highs. Conversely, The Product Enhancement business segment has been the most adversely affected, seeing a dramatic decline by over 60% since 2014. (10K) Revenues thus far have rebounded in 2017, as the price of oil has recovered, spurring greater demand for Core’s products and services. Most recent 2017 Q3 earnings per share outperformed consensus analyst estimates by $0.04
Source: AMBN We continue to forecast double-digit earnings growth for the remainder of 2017 and into the next few years.
Company Analysis

9 | C o r e L a b o r a t o r i e s , N V
Key Products and Operations Core Laboratories derives their revenue primarily from the sales of services and products to firms in the oil and gas industry. Services accounted for roughly 79% of their revenue in 2016 while products accounted for the remaining 21%. Core Laboratories breaks down their business into 3 key segments: Reservoir Description, Production Enhancement, and Reservoir management. (2016 10K) Reservoir Description: Oil & gas fields consist of permeable rock that contain water, crude oil, natural gas, & other fluids. Reservoir description entails the analysis that determines the quality and quantity of the various fluids that lay within the reservoir. To this end, Core Laboratories provides services that help to determine the capacity of the reservoir, as well as the permeability of the rock, which determines he ability of the fluids to flow through it. Production Enhancement: Core provides various diagnostic services and products to assist production companies in maximizing the amount of oil & natural gas they can recover from their reserves. Key patented products and technologies in this segment produced by Core include SPECTRACHEM®, FLOWPROFILERTM, and HERO® (High Efficiency Reservoir Optimization). (2016 10K) Reservoir Management: To maximize daily production. Core is involved in numerous large-scale reservoir management projects, ensuring maximum efficiency from the beginning of an oil field’s development to the final barrel that is produced from the well. These services are of increasing importance to oil producers, as the marginal cost of producing each barrel falls, and thus the next barrel produced is often the most profitable one.
Revenue Breakdown Core derives a majority of their revenue from sales of products and services in the Reservoir Description segment, followed by Production Enhancement, and then Reservoir Management. Additionally, sales in the Reservoir Description business segment have seen significantly softer decline from 2014 peak sales compared to Core’s other two business segments.
Global Operations Breakdown Core operates facilities in more than 50 countries. While operations within the United states remains a plurality of Core’s total sales, since 2014 non-U.S. operations have increased their proportion of
Source: 2016 10K

10 | C o r e L a b o r a t o r i e s , N V
total revenue. A relative increase in global operations exposes Core to an increased level of exchange rate risk. Significant Customers In 2016, no single client accounted for greater than 10% of Core’s total sales. While Core’s revenues are heavily reliant on expenditures from upstream oil and gas companies, there is no single client whose demand for Core’s services drastically influences their revenue. Competition Being a highly specialized firm, Core faces few competitors who operate in all their product lines and services, but they do face competition within each line, primarily from major integrated Oil & Gas Companies who participate in nearly all elements of the energy sector from upstream to downstream. Much of Core’s major competition can often come from their own clients, who sometimes may choose to perform the same services in-house to cut costs. Thus, major consolidations leading to an expansion of integrated firms in the energy industry could pose a risk to the future growth of Core if more of their clients decide to perform the same services themselves. Key Risk Factors Downturns in the oil & gas industry The largest clients for Core’s services are firms that operate in the Oil & Gas industry, which is highly cyclical in nature due the volatile price of the underlying commodities. Demand for Core’s services and products is highly dependent on the level of expenditures of production and exploration companies within the oil and gas industry. The current downturn in the overall oil & gas industry has negatively affected Core’s ability to accurately assess client demand, causing them to hold excess and obsolete inventories, and driving down the firm’s gross margins and financial results
Global Instability Core operates in numerous countries across the globe, exposing them to inherent risks associated with doing business abroad, including trade policy of foreign governments, civil unrest, acts of terrorism, as well as specific economic conditions in less-stable oil-producing nations such as Venezuela, Nigeria, Libya, Iran, and Iraq. Currency Exchange Rate Risk Core derives a substantial amount of their revenue from international operations, and thus is exposed to risks due to the fluctuation in currency exchange rates. These risks can be mitigated by requesting that foreign contracts be denominated in USD, but that is ultimately a decision that lays with the client, and thus Core cannot 100% mitigate their currency risk. Catalysts for Growth and Change More Oil Producers are seeking to reduce production declines among aging oil fields, as the cost of extracting from mature wells is significantly less than from newer ones. This trend should increase demand for Core’s production enhancement and reservoir management business segments. Hydraulic Fracturing and other unconventional drilling process are growing increasingly advanced and complex, leading to a greater need for Core highly advanced and specialized services. Core is expanding their use of big data, neural networks, and data analytics to increase the efficiency of their services and reduce the cost of evaluating reservoirs. Additionally, an overall increase in production should continue to drive demand for Core’s products and services. While international rig counts have remained flat in 2017, The land-based rig count in the U.S. has increased by 44% over the first half of the year. (Earnings Call 2Q 2017)

11 | C o r e L a b o r a t o r i e s , N V
Key Investment Positives Core boasts the strongest cash flow relative to earnings and return on invested capital of any other comparable large-cap firm within the Oil & Gas Services Industry. This helps to ensure steady dividend growth rate and additional share repurchases going forward. (Earnings Call 2Q 2017) Core’s product and service line is highly specialized and differentiated, which limits the ability of competitors to emulate them, and reduces the risk of disruption Key Investment Negatives Core’s Production Enhancement segment has benefited from increased unconventional U.S. production due to the shale oil boom, thus this segment would be highly vulnerable if U.S. production were to slide significantly. Core’s main competitors among their largest revenue driver, reservoir description, are often their own larger customers in integrated oil and gas, who can perform many of the same tasks, this could put future growth at risk if more firms decided to perform these services internally to cut costs. Additionally, Global Natural Gas demand has stronger future growth prospects than Oil, and national gas reservoirs are less complex than oil reservoirs. As a result, natural gas producers are less reliant on Core’s services than Oil producers are. (Caldwell)
Revenue Forecast In-line with analyst consensus, we are projecting strong double-digit revenue growth through the year 2020. 2017 Projected revenues are highest at 14%, as the large revenue decline that occurred in 2016 leaves
room for stronger growth. We chose to decompose the revenue stream by product segment rather than by country of origin. Our revenue growth forecast is driven primarily by steady growth in the Reservoir Description segment, as well as a strong recovery in performance among the Production Enhancement segment. Cost of Goods Sold and SG&A Expense COGS and SG&A Expense were forecasted as a percentage of sales utilizing historical averages as well as peer comparisons. COGS were forecasted as 70% of sales and SG&A Expense at 4.95% respectively. PPE and Depreciation Growth rates PPE and Depreciation were forecasted at fixed growth rates of 6.75% and 6.25% respectively. Tax Rate The marginal tax rate used for all our forecasts was the Netherlands statutory corporate tax rate of 25%. We do not expect any significant changes to the tax rate by the Dutch government, and thus we utilized a 25% marginal rate for the duration of our forecast Debt Long-Term debt was forecasted as a percentage of Long-Term Assets, based upon historical debt levels of the firm. Long-Term Debt was forecasted at 71% of total assets. Short-Term debt was forecasted at zero based upon recent historical trends of Core maintaining no short-term leverage. WACC The Weighted Average Cost of Capital for Core Laboratories was estimated to be 9.89%. A consistent, fixed WACC was used for the duration of the forecast, as we do not expect any significant changes to Core’s capital structure.
Analysis of Valuation Methods

12 | C o r e L a b o r a t o r i e s , N V
Cost of Equity Cost of Equity was calculated using the capital asset pricing model (CAPM). Cost of Equity was calculated at 10.37% Beta Core’s Beta was calculated utilizing weekly returns of Core stock and the S&P500 over a 5-year period. Beta was calculated to be 1.61 Risk-Free Rate The 30-yr U.S. Treasury yield of 2.92% was used as a proxy for the Risk-Free Rate Market Risk Premium The Market Risk Premium was backed out by taking the geometric average of stocks to bonds, and was estimated to be 4.63%, Cost of Debt Core Laboratories cost of debt was calculated to be 4.5%, utilizing the yield to maturity of existing Core Laboratory corporate bonds. Weight of Equity The market value of equity was calculated by multiplying the stock price as of 11/10/17 by the number of shares outstanding. The weight of equity used for our WACC calculation was 93.03% Weight of Debt As estimating the market value of debt can prove notoriously difficult, the book value of debt was used as a proxy for the market value of debt. The weight of debt used for our WACC calculation was 6.97% Discounted Cash Flow (DCF) / Economic Profit As of 11/10/17, our DCF model forecasts an intrinsic value of $90.13, compared to a current stock price of $104.30. Continuing Value growth
rate for NOPLAT was calculated based upon expected real GDP growth rate of 2.5%, long-term inflation rate of 2%, and an additional 3% based upon Core’s individual potential for high growth. Due to the significant difference between our target price and the stock’s current price, we are issuing a SELL rating based upon our DCF model. Other assumptions utilized in the DCF model include the WACC and CV ROIC, which was calculated based upon ROIC during the terminal year of our forecast, 2021. Dividend Discount Model As of 11/10/17, Our DDM model forecasts an intrinsic value of $93.39. As Core Laboratories has historically paid a healthy dividend, and is expected to continue to do so into the future, and due to the proximity in price to our DCF price, we believe that the DDM constitutes an appropriate valuation model for the firm, and thus are incorporating this outcome into our SELL recommendation along with the DCF. Continuing Value EPS was calculated based upon expected real GDP, expected inflation, as well as additional growth based upon Core’s individual potential. There is a slight discrepancy between the CV growth assumptions in the DCF and DDM analysis, due to discrepancies between NOPLAT and Net Income, and changing amounts of share outstanding due to Core’s share repurchase program. Relative Valuation (P/E) It proved rather difficult to construct a meaningful relative valuation for Core Laboratories. Due to the Energy Sectors recent struggles as whole, most comparable firms in size and industry to Core had negative performance and negative EPS outlooks in the near future. Thus, we were forced to compare Core to much larger companies in the Oil & Gas Services industry, such as Schlumberger, Haliburton, and Baker Hughes, wo do not necessarily have the same high growth potential, and thus are not necessarily strong comparisons in regard to P/E. For this reason, we

13 | C o r e L a b o r a t o r i e s , N V
do not feel as confident in our relative valuation was with our DCF and DDM valuations, and are thus ignoring it for purposes of our SELL recommendation.
Impact on DCF Stock Price: COGS vs SG&A Changes to SG&A expense had little effect on the outcome of the model, but changes to Cost of Goods Sold had a very pronounced impact. This illustrates a possible threat to Core’s growth potential if they cannot maintain current gross margins going forward.
Impact on WACC: RE vs. RD Changes in the cost of debt had negligible impact on Core’s Weighted Average Cost of Capital. This is due to the very low weight of debt utilized in the calculation of the WACC. Conversely, changes to the cost of equity had a more noticeable impact, with a 1% increase or decrease causing the WACC to rise or fall by 0.93% respectively.
Impact on DCF Stock Price: NOPLAT CV vs. ROIC CV
Changes to the CV growth and ROIC assumptions had the biggest effect on our DCF model, with the intrinsic value of the “best case” scenario being over twice the intrinsic value in the “worst case” scenario. This illustrates the pressure Core faces to achieve their growth expectations, as it is their high future potential that is driving much of their valuation.
Important Disclaimer This report was created by students enrolled in the Applied Equity Valuation (6F:112) class at the University of Iowa. The report was originally created to offer an internal investment recommendation for the University of Iowa Krause Fund and its advisory board. The report also provides potential employers and other interested parties an example of the students’ skills, knowledge and abilities. Members of the Krause Fund are not registered investment advisors, brokers or officially licensed financial professionals. The investment advice contained in this report does not represent an offer or solicitation to buy or sell any of the securities mentioned. Unless otherwise noted, facts and figures included in this report are from publicly available sources. This report is not a complete compilation of data, and its accuracy is not guaranteed. From time to time, the University of Iowa, its faculty, staff, students, or the Krause Fund may hold a financial interest in the companies mentioned in this report.
Sensitivity Analysis

14 | C o r e L a b o r a t o r i e s , N V
Works Cited Cama, Timothy. Trump Administration Looks to Speed Drilling Permits. The Hill, 7 July 2017. Shenk, Mark. U.S. Oil Output to Hit a Record in 2018. Bloomberg, 9 August, 2017. Economic Times. India’s Energy Consumption to Grow Faster than Major Economies. The Economic Times, 27 Aug. 2017. EIA. EIA - Independent Statistics and Analysis. Even as Renewables Increase, Fossil Fuels Continue to Dominate U.S. Energy Mix - Today in Energy - U.S. Energy . Accessed September, 2017.
What Drives Crude Oil Prices: Supply Non-OPEC.” U.S. Energy Information Administration (EIA), 8 Aug. 2017, www.eia.gov/finance/markets/crudeoil/supply-nonopec.php.
“Global Interim Economic Outlook, March 2017” OECD http://www.oecd.org/eco/outlook/general-assessment-of-the-macroeconomic-situation-oecd-economic-outlook-june-2017.pdf.
EIA. Short-Term Energy Outlook. U.S. Energy Information Administration, 8 Aug. 2017.
Macrotrends. WTI Crude Oil Prices - 10 Year Daily Chart. MacroTrends, 4 Sept. 2017.
Kaplan, Robert D. “The Geopolitics of Energy.” Forbes, Forbes Magazine, 4 Apr. 2014, www.forbes.com/sites/stratfor/2014/04/04/the-geopolitics-of-energy/.
Core Laboratories 2017 Q2 Earnings Release http://www.Corelab.com/investors/cms/docs/press_release/2017_07_24_earnings_release.pdf Core Laboratories 2017 Q3 Earnings Release http://www.Corelab.com/investors/cms/docs/press_release/2017_10_23_earnings_release.pdf Core Laboratories 2016 10K http://www.Corelab.com/investors/cms/docs/form10k_report/2016_10k.pdf
ABMN. "Core Laboratories (Core) Issues Quarterly Earnings Results, Beats Expectations By $0.04 EPS." N.p., 2017. DiChristopher, Tom. US Shale Oil Drillers Keep on Pumping: EIA Forecasts 122,000 Barrels a Day Jump in June. CNBC, 15 May 2017. Caldwell, Preston. Core Labs Should Continue to Deliver the Sector's Best Returns on Capital for Years to Come. Morningstar, 31 Oct. 2017 Meier, Doug. PwC Presents: U.S. Oil and Gas Deal Activity and Trends. Pricewaterhouse Cooper, 17 May 2016. HSNO. Wholesale Spot Petroleum and Crude Oil Prices and Crack Spreads. HSNO, 10 Sept. 2017.

Core Laboratories, NVKey Assumptions of Valuation Model
Ticker Symbol CLBCurrent Share Price $104.30Current Model Date 10/16/2017FY End (month/day) Dec. 31
Pre-Tax Cost of Debt 4.50%Cost of Equity 10.37%Beta 1.61Risk-Free Rate 2.92%Equity Risk Premium 4.63%CV Growth of NOPLAT 7.35%CV Growth of ROIC 45.77%CV Growth of EPS 7.15%
Marginal Tax Rate 25.00%WACC 9.93%Annual Dividends $2.20
COGS % of Sales 70.00%SG&A % of Sales 4.95%
A/R % of Sales 19.50%Inventories % of Sales 4.80%Prepaid Expenses % of Sales 1.47%Other Current Assets % of Sales 3.25%Other LT Assets % of Sales 3.29%PPE Growth Rate 6.75%Depreciation Rate 6.25%
A/P % of Sales 5.37%Accrued Payroll % of Sales 3.71%Other Current Liabilities % of Sales 4.11%LT Debt % of LT Assets 71.00%Deferred Revenue % of Sales 2.15%Income Tax Payable % of Income Tax Provision 27.80%Deferred TA % of Income Tax Provision 32.00%Deferred TL % of Income Tax Provision 14.00%Other LT Liabilities % of Sales 11.50%

Core Laboratories, NVRevenue Decomposition(Values in millions)Fiscal Years Ending Dec. 31 2014 2015 2016 2017E 2018E 2019E 2020E 2021E (CV)
Resevoir Description Services 495.658 445.729 377.975 400.9 422.75 451.25 484.5 518.3675Reservoir Description Product sales 23.316 27.643 26.171 21.1 22.25 23.75 25.5 27.2825Reservoir Description Total 518.974 473.372 404.146 422 445 475 510 545.65YoY Change -9% -15% 4% 5% 7% 7% 7%
Production Enhancement Services 220.177 121.675 68.433 86.3 106.34 126.34 145.06 156.1Production Enhancement Product Sales 247.4 145.549 95.594 129.45 159.51 189.51 217.59 234.15Production Enhancement Total 467.577 267.224 164.027 215.75 265.85 315.85 362.65 390.25YoY Change -43% -39% 32% 23% 19% 15% 8%
Reservoir Management Services 65.037 44.55 23.851 30.19 36.39 39.03 40.90 42.14Reservoir Management Product Sales 33.634 12.374 2.717 10.06 12.13 13.01 13.63 14.05Reservoir Management Total 98.671 56.924 26.568 40.25 48.52 52.05 54.54 56.19YoY Change -42% -53% 52% 21% 7% 5% 3%
Total Revenue 1085.222 797.52 594.74 678.00 759.37 842.90 927.19 992.09YoY Change -26.51% -25.43% 14.00% 12.00% 11.00% 10.00% 7.00%

Core Laboratories, NVIncome Statement(values in millions)Fiscal Years Ending Dec. 31 2014 2015 2016 2017E 2018E 2019E 2020E 2021E (CV)Sales 1085.22 797.52 594.74 678.00 759.37 842.90 927.19 992.09
COGS 665.27 532.65 442.64 474.60 531.56 590.03 649.03 694.46
Depreciation 25.30 26.55 26.03 23.70 25.30 27.00 28.83 30.77
Amortization of Intangibles 1.40 0.91 0.84 0.84 0.84 0.84 0.84 0.84
Gross Income 393.26 237.41 125.23 178.86 201.67 225.02 248.49 266.01
SG&A Expense 45.66 49.73 39.39 33.56 37.59 41.72 45.90 49.11
Other Operating Expense 0.00 0.00 0.00 0.00 0.00 0.00 0.00 0.00
EBIT (Operating Income) 347.60 187.68 85.84 145.30 164.08 183.30 202.59 216.90
Nonoperating Interest Income 0.40 0.06 0.00 0.20 0.20 0.40 0.40 0.20Equity in Earnings of Affiliates 0.00 0.00 0.00 0.00 0.00 0.00 0.00 0.00
Other Income (Expense) -2.13 -4.11 -0.16 0.10 0.10 0.10 0.10 0.10
Interest Expense 10.60 12.38 11.57 9.74 12.30 12.58 12.85 13.15
Extraordinary Expense -0.29 22.94 0.00 0.00 0.00 0.00 0.00 0.00Pretax Income 335.57 148.31 74.10 135.86 152.08 171.22 190.24 204.06
Income Taxes 77.31 33.76 10.75 33.96 38.02 42.81 47.56 51.01
Equity in Earnings of Affiliates 0.36 0.38 0.51 0.40 0.40 0.40 0.40 0.40
Consolidated Net Income 258.63 114.93 63.86 102.29 114.46 128.82 143.08 153.44
Minority Interest 1.14 0.09 -0.04 0.00 0.00 0.00 0.00 0.00
Net Income 257.49 114.85 63.90 102.29 114.46 128.82 143.08 153.44
Total Shares Outstanding 43.64 42.38 44.15 44.07 43.99 43.90 43.79 43.68
EPS 5.90 2.71 1.45 2.32 2.60 2.93 3.27 3.51
Dividends per Share 2.00 2.20 2.20 2.31 2.43 2.55 2.67 2.81

Core Laboratories, NVCommon Size Income Statement
Fiscal Years Ending Dec. 31 2014 2015 2016 2017E 2018E 2019E 2020E 2021ESales 100.00% 100.00% 100.00% 100.00% 100.00% 100.00% 100.00% 100.00%
COGS 61.30% 66.79% 74.43% 70.00% 70.00% 70.00% 70.00% 70.00%
Depreciation 2.33% 3.33% 4.38% 3.50% 3.33% 3.20% 3.11% 3.10%
Amortization of Intangibles 0.13% 0.11% 0.14% 0.12% 0.11% 0.10% 0.09% 0.08%
Gross Income 36.24% 29.77% 21.06% 26.38% 26.56% 26.70% 26.80% 26.81%
SG&A Expense 4.21% 6.24% 6.62% 4.95% 4.95% 4.95% 4.95% 4.95%
Other Operating Expense 0.00% 0.00% 0.00% 0.00% 0.00% 0.00% 0.00% 0.00%
EBIT (Operating Income) 32.03% 23.53% 14.43% 21.43% 21.61% 21.75% 21.85% 21.86%
Nonoperating Interest Income 0.04% 0.01% 0.00% 0.03% 0.03% 0.05% 0.04% 0.02%
Equity in Earnings of Affiliates 0.00% 0.00% 0.00% 0.00% 0.00% 0.00% 0.00% 0.00%
Other Income (Expense) -0.20% -0.52% -0.03% 0.01% 0.01% 0.01% 0.01% 0.01%
Interest Expense 0.98% 1.55% 1.95% 1.44% 1.62% 1.49% 1.39% 1.33%
Unusual Expense - Net -0.03% 2.88% 0.00% 0.00% 0.00% 0.00% 0.00% 0.00%
Pretax Income 30.92% 18.60% 12.46% 20.04% 20.03% 20.31% 20.52% 20.57%
Income Taxes 7.12% 4.23% 1.81% 5.01% 5.01% 5.08% 5.13% 5.14%
Equity in Earnings of Affiliates 0.03% 0.05% 0.09% 0.06% 0.05% 0.05% 0.04% 0.04%
Consolidated Net Income 23.83% 14.41% 10.74% 15.09% 15.07% 15.28% 15.43% 15.47%
Minority Interest 0.11% 0.01% -0.01% 0.00% 0.00% 0.00% 0.00% 0.00%
Net Income 23.73% 14.40% 10.74% 15.09% 15.07% 15.28% 15.43% 15.47%

Core Laboratories, NVBalance Sheet(values in millions)Fiscal Years Ending Dec. 31 2014 2015 2016 2017E 2018E 2019E 2020E 2021EAssets
Cash & Cash Equivilents 23.35 22.49 14.76 35.48 31.80 36.76 49.44 66.24
Accounts Receivables, Net 208.14 152.90 120.76 132.21 148.08 164.36 180.80 193.46
Inventories, Net 43.37 40.91 33.72 32.54 36.45 40.46 44.50 47.62Prepaid Expenses 14.25 12.05 10.71 10.00 11.20 12.43 13.67 14.63Other Current Assets 12.71 10.20 6.51 22.04 24.68 27.39 30.13 32.24Total Current Assets 301.82 238.55 186.46 232.27 252.20 281.41 318.55 354.18
Net Property, Plant & Equipment 149.01 143.21 129.88 130.93 132.12 133.43 134.90 136.51Property, Plant & Equipment - Gross 367.20 383.49 379.15 404.74 432.06 461.22 492.36 525.59Accumulated Depreciation 218.18 240.28 249.27 273.80 299.94 327.79 357.46 389.08Total Investments and Advances 2.34 2.72 3.22 3.40 3.40 2.80 2.80 2.80Net Goodwill 164.46 178.16 179.04 179.04 179.04 179.04 179.04 179.04
Net Other Intangible Assets 10.64 10.04 9.94 9.94 9.94 9.94 9.94 9.94
Deferred Tax Assets 3.88 11.69 20.61 10.87 12.17 13.70 15.22 16.32Other LT Assets 43.50 40.89 43.90 50.85 56.95 63.22 69.54 74.41Total LT Assets 373.83 386.71 386.59 385.03 393.61 402.13 411.43 419.03
Total Assets 675.65 625.26 573.05 617.30 645.81 683.53 729.98 773.21Liabilities & Shareholders' Equity
ST Debt & Curr. Portion LT Debt 0.00 0.00 0.00 0.00 0.00 0.00 0.00 0.00Accounts Payable 47.08 33.47 33.72 36.40 40.77 45.26 49.78 53.27Income Tax Payable 8.33 1.73 15.72 9.44 10.57 11.90 13.22 14.18Accrued Payroll 34.62 36.48 19.41 25.19 28.21 31.31 34.44 36.85Other Current Liabilities 41.83 49.08 35.17 27.89 31.24 34.67 38.14 40.81
Total Current Liabilities 131.87 120.76 104.02 98.92 110.79 123.14 135.59 145.11
Long-Term Debt 356.00 430.99 216.49 273.37 279.47 285.51 292.12 297.51Deferred Tax Liabilities 7.21 4.88 6.28 4.76 5.32 5.99 6.66 7.14Other LT Liabilities 43.88 92.33 90.97 77.97 87.33 96.93 106.63 114.09Deferred Income 42.71 0.00 0.00 14.57 16.32 18.12 19.93 21.33Total Liabilities 581.66 648.96 417.755 469.60 499.23 529.70 560.92 585.18Common Stock 1.17 1.14 54.00 54.00 54.00 54.00 54.00 54.00
Retained Earnings 415.91 219.21 187.96 188.44 196.21 213.23 239.21 270.00Other Appropriated Reserves -11.89 -10.54 -9.83 -9.83 -9.83 -9.83 -9.83 -9.83
Treasury Stock -317.61 -238.88 -80.77 -88.85 -97.74 -107.51 -118.26 -130.09Total Shareholders' Equity 87.57 -29.06 151.35 143.76 142.64 149.89 165.12 184.09Accumulated Minority Interest 6.42 5.37 3.94 3.94 3.94 3.94 3.94 3.94
Total Equity 93.99 -23.70 155.30 147.70 146.59 153.84 169.06 188.03Total Liabilities & Shareholders' Equity 675.65 625.26 573.05 617.30 645.81 683.53 729.98 773.21

Core Laboratories, NVCommon Size Balance Sheet
Fiscal Years Ending Dec. 31 2014 2015 2016 2017E 2018E 2019E 2020E 2021EAssets
Cash & Short-Term Investments 2.15% 2.82% 2.48% 5.23% 4.19% 4.36% 5.33% 6.68%
Short-Term Receivables 19.18% 19.17% 20.30% 19.50% 19.50% 19.50% 19.50% 19.50%
Inventories 4.00% 5.13% 5.67% 4.80% 4.80% 4.80% 4.80% 4.80%
Prepaid Expenses 1.31% 1.51% 1.80% 1.47% 1.47% 1.47% 1.47% 1.47%
Miscellaneous Current Assets 1.17% 1.28% 1.09% 3.25% 3.25% 3.25% 3.25% 3.25%
Total Current Assets 27.81% 29.91% 31.35% 34.26% 33.21% 33.39% 34.36% 35.70%
Net Property, Plant & Equipment 13.73% 17.96% 21.84% 19.31% 17.40% 15.83% 14.55% 13.76%
Property, Plant & Equipment - Gross 33.84% 48.09% 63.75% 59.70% 56.90% 54.72% 53.10% 52.98%
Accumulated Depreciation 20.10% 30.13% 41.91% 40.38% 39.50% 38.89% 38.55% 39.22%
Total Investments and Advances 0.22% 0.34% 0.54% 0.50% 0.45% 0.33% 0.30% 0.28%
Net Goodwill 15.15% 22.34% 30.10% 26.41% 23.58% 21.24% 19.31% 18.05%
Net Other Intangibles 0.98% 1.26% 1.67% 1.47% 1.31% 1.18% 1.07% 1.00%
Deferred Tax Assets 0.36% 1.47% 3.46% 1.60% 1.60% 1.63% 1.64% 1.65%
Other Assets 4.01% 5.13% 7.38% 7.50% 7.50% 7.50% 7.50% 7.50%
Total Long-Term Assets 34.45% 48.49% 65.00% 56.79% 51.83% 47.71% 44.37% 42.24%
Total Assets 62.26% 78.40% 96.35% 91.05% 85.05% 81.09% 78.73% 77.94%
Liabilities & Shareholders' Equity 0.00% 0.00% 0.00% 0.00% 0.00% 0.00% 0.00% 0.00%
ST Debt & Curr. Portion LT Debt 0.00% 0.00% 0.00% 0.00% 0.00% 0.00% 0.00% 0.00%
Accounts Payable 4.34% 4.20% 5.67% 5.37% 5.37% 5.37% 5.37% 5.37%
Income Tax Payable 0.77% 0.22% 2.64% 1.39% 1.39% 1.41% 1.43% 1.43%
Accrued Payroll 3.19% 4.57% 3.26% 3.71% 3.71% 3.71% 3.71% 3.71%
Miscellaneous Current Liabilities 3.85% 6.15% 5.91% 4.11% 4.11% 4.11% 4.11% 4.11%
Total Current Liabilities 12.15% 15.14% 17.49% 14.59% 14.59% 14.61% 14.62% 14.63%
Long-Term Debt 32.80% 54.04% 36.40% 40.32% 36.80% 33.87% 31.51% 29.99%
Deferred Tax Liabilities 0.66% 0.61% 1.06% 0.70% 0.70% 0.71% 0.72% 0.72%
Other Liabilities (excl. Deferred Income) 4.04% 11.58% 15.30% 11.50% 11.50% 11.50% 11.50% 11.50%
Deferred Income 3.94% 0.00% 0.00% 2.15% 2.15% 2.15% 2.15% 2.15%
Total Liabilities 53.60% 81.37% 70.24% 69.26% 65.74% 62.84% 60.50% 58.98%
Common Equity 0.20% 0.20% 9.38% 7.96% 7.11% 6.41% 5.82% 5.44%
Retained Earnings 38.32% 27.49% 31.60% 27.79% 25.84% 25.30% 25.80% 27.22%
Other Appropriated Reserves -1.10% -1.32% -1.65% -1.45% -1.29% -1.17% -1.06% -0.99%
Treasury Stock -29.27% -29.95% -13.58% -13.10% -12.87% -12.75% -12.75% -13.11%
Total Shareholders' Equity 8.07% -3.64% 25.45% 21.20% 18.78% 17.78% 17.81% 18.56%
Accumulated Minority Interest 0.59% 0.67% 0.66% 0.58% 0.52% 0.47% 0.43% 0.40%
Total Equity 8.66% -2.97% 26.11% 21.79% 19.30% 18.25% 18.23% 18.95%
Total Liabilities & Shareholders' Equity 62.26% 78.40% 96.35% 91.05% 85.05% 81.09% 78.73% 77.94%

Core Laboratories, NVHistorical Cash Flow Statement
Fiscal Years Ending Dec. 31 2012 2013 2014 2015 2016Operating Activities
Net Income / Starting Line 216.61 243.19 258.63 114.93 63.86
Depreciation, Depletion & Amortization 22.92 25.47 26.70 27.46 26.87
Depreciation and Depletion 21.76 24.17 25.30 26.55 26.03
Amortization of Intangible Assets 1.16 1.30 1.40 0.91 0.84
Deferred Taxes & Investment Tax Credit 3.61 6.79 4.68 -0.11 -14.39
Deferred Taxes 3.61 6.79 4.68 -0.11 -14.39
Other Funds 17.49 16.13 20.11 29.82 20.34
Funds from Operations 260.62 291.59 310.12 172.10 96.69
Changes in Working Capital -23.42 6.55 -6.67 47.00 35.20
Receivables -16.66 -16.31 3.49 49.26 31.58
Inventories 3.22 1.29 2.89 3.05 6.22
Accounts Payable -3.67 -6.34 -3.02 -13.35 -1.04
Other Accruals 4.87 3.00 -2.61 -9.72 -6.74
Other Assets/Liabilities -11.18 24.91 -7.41 17.76 5.17
Net Operating Cash Flow 237.20 298.14 303.45 219.10 131.89
Investing Activities
Capital Expenditures -32.80 -38.95 -37.44 -24.26 -11.70
Capital Expenditures (Fixed Assets) -31.15 -35.42 -36.59 -22.80 -11.36
Capital Expenditures (Other Assets) -1.65 -3.53 -0.85 -1.46 -0.35
Net Assets from Acquisitions -0.56 0.00 -1.20 -13.77 -1.24
Sale of Fixed Assets & Businesses 0.67 1.04 0.00 0.00 0.00
Purchase/Sale of Investments -0.32 -0.10 0.00 0.00 0.00
Purchase of Investments 0.32 0.10 0.00 0.00 0.00
Other Funds -0.99 -5.19 -3.43 -1.62 -1.78
Other Uses -3.28 -6.58 -4.31 -2.94 -2.52
Other Sources 2.29 1.39 0.88 1.32 0.74
Net Investing Cash Flow -34.00 -43.20 -42.07 -39.65 -14.72
Financing Activities
Cash Dividends Paid -52.95 -58.64 -89.09 -94.24 -95.15
Change in Capital Stock -175.73 -227.13 -264.37 -159.71 190.04
Repurchase of Common & Preferred Stk. -175.73 -227.22 -264.37 -159.71 -7.16
Sale of Common & Preferred Stock 0.01 0.08 0.00 0.00 197.20
Proceeds from Sale of Stock 0.00 0.00 0.00 0.00 197.20
Proceeds from Stock Options 0.01 0.08 0.00 0.00 0.00
Issuance/Reduction of Debt, Net 8.65 32.95 87.71 74.96 -217.24
Change in Current Debt -- -- -- -- 0.00
Change in Long-Term Debt 8.65 32.95 87.71 74.96 -217.24
Issuance of Long-Term Debt 120.99 167.00 215.87 214.61 99.00
Reduction in Long-Term Debt -112.35 -134.05 -128.16 -139.66 -316.24
Other Funds 6.73 3.74 2.63 -1.32 -2.55
Other Uses -0.30 0.00 -0.39 -1.32 -2.55
Other Sources 7.03 3.74 3.02 0.00 0.00
Net Financing Cash Flow -213.30 -249.08 -263.12 -180.30 -124.90
Net Change in Cash -10.11 5.86 -1.74 -0.86 -7.73
Free Cash Flow 206.05 262.72 266.86 196.30 120.53
Free Cash Flow per Share 4.33 5.71 5.98 4.57 2.76
Free Cash Flow Yield (%) 3.96 2.99 4.97 4.21 2.30

Core Laboratories, NVForecasted Cash Flow Statement(values in millions)
2017E 2018E 2019E 2020E 2021E (CV)Cash Flows from Operating ActivitiesNet Income 102.29 114.46 128.82 143.08 153.44Adjustments to Reconcile net income to net cashDepreciation 23.70 25.30 27.00 28.83 30.77Amortization 0.84 0.84 0.84 0.84 0.84Total 126.83 140.60 156.66 172.75 185.06Changes in Working Capital AccountsIncrease in recievables -11.46 -15.87 -16.29 -16.44 -12.66Increase in inventories 1.18 -3.91 -4.01 -4.05 -3.12increase in prepaid expenses 0.71 -1.20 -1.23 -1.24 -0.96increase in other current assets -15.52 -2.64 -2.71 -2.74 -2.11increase in accounts payable 2.68 4.37 4.49 4.53 3.48Increase in Accrued Payroll 5.77 3.02 3.10 3.13 2.41Increase in Other Current Liabilities -7.28 3.35 3.44 3.47 2.67Increase In income taxes payable -6.28 1.13 1.33 1.32 0.96Increase in deferred income 14.57 1.75 1.80 1.81 1.40Increase in Deferred Tax Liability -1.52 0.57 0.67 0.67 0.48Increase in deferred Tax Asset 9.74 -1.30 -1.53 -1.52 -1.11Increase in other LT liabilities -13.00 9.36 9.61 9.69 7.46Net Cash provided by operating activities 106.43 139.23 155.31 171.38 183.98
Cash Flows from Investing ActivitiesIncrease in total investments and advances -0.18 0.00 0.60 0.00 0.00capital expenditures -25.59 -27.32 -29.16 -31.13 -33.23increase in other LT assets -6.95 -6.10 -6.26 -6.32 -4.87Net Cash Used for investing activities -32.72 -33.42 -34.83 -37.45 -38.10
Cash flows from financing activitiesproceed from issuance of long-term debt 56.89 6.09 6.04 6.61 5.39payment of dividends -101.81 -106.69 -111.79 -117.11 -122.65proceeds from issuance of common stock 0.00 0.00 0.00 0.00 0.00repurchases of common stock -8.08 -8.89 -9.77 -10.75 -11.83Net cash provided by financing activities -53.00 -109.49 -115.52 -121.25 -129.08
Net Change in cash 20.72 -3.68 4.96 12.68 16.80
Cash, Beginning 14.76 35.48 31.80 36.76 49.44
Cash, Ending 35.48 31.80 36.76 49.44 66.24
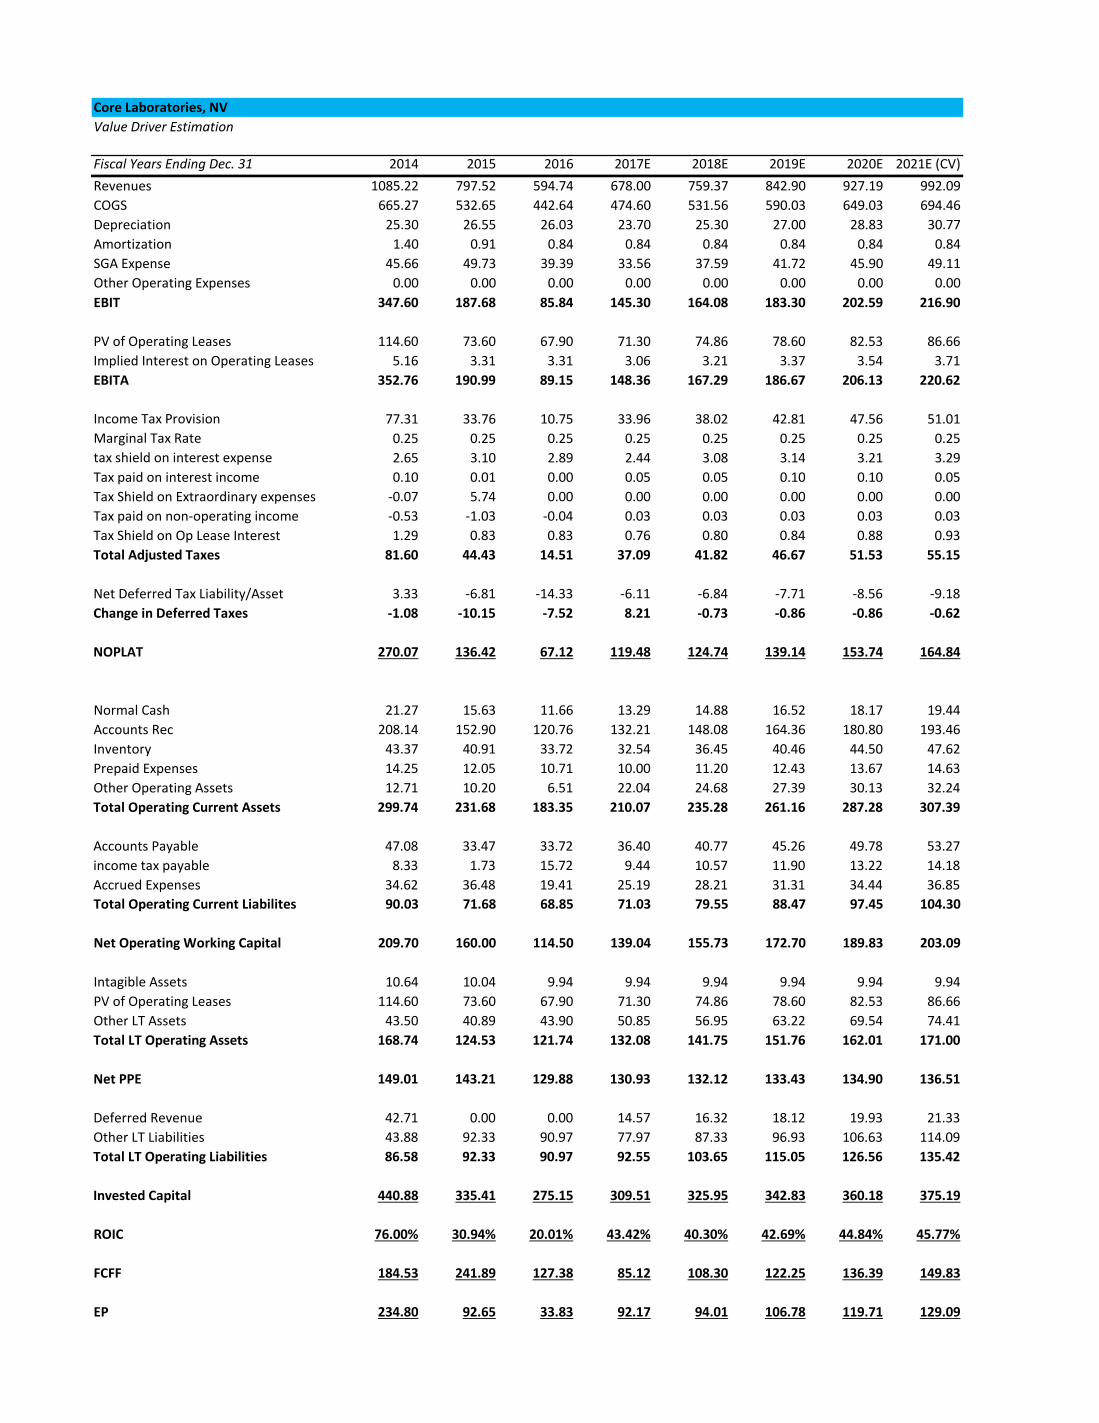
Core Laboratories, NVValue Driver Estimation
Fiscal Years Ending Dec. 31 2014 2015 2016 2017E 2018E 2019E 2020E 2021E (CV)Revenues 1085.22 797.52 594.74 678.00 759.37 842.90 927.19 992.09COGS 665.27 532.65 442.64 474.60 531.56 590.03 649.03 694.46Depreciation 25.30 26.55 26.03 23.70 25.30 27.00 28.83 30.77Amortization 1.40 0.91 0.84 0.84 0.84 0.84 0.84 0.84SGA Expense 45.66 49.73 39.39 33.56 37.59 41.72 45.90 49.11Other Operating Expenses 0.00 0.00 0.00 0.00 0.00 0.00 0.00 0.00EBIT 347.60 187.68 85.84 145.30 164.08 183.30 202.59 216.90
PV of Operating Leases 114.60 73.60 67.90 71.30 74.86 78.60 82.53 86.66Implied Interest on Operating Leases 5.16 3.31 3.31 3.06 3.21 3.37 3.54 3.71EBITA 352.76 190.99 89.15 148.36 167.29 186.67 206.13 220.62
Income Tax Provision 77.31 33.76 10.75 33.96 38.02 42.81 47.56 51.01Marginal Tax Rate 0.25 0.25 0.25 0.25 0.25 0.25 0.25 0.25tax shield on interest expense 2.65 3.10 2.89 2.44 3.08 3.14 3.21 3.29Tax paid on interest income 0.10 0.01 0.00 0.05 0.05 0.10 0.10 0.05Tax Shield on Extraordinary expenses -0.07 5.74 0.00 0.00 0.00 0.00 0.00 0.00Tax paid on non-operating income -0.53 -1.03 -0.04 0.03 0.03 0.03 0.03 0.03Tax Shield on Op Lease Interest 1.29 0.83 0.83 0.76 0.80 0.84 0.88 0.93Total Adjusted Taxes 81.60 44.43 14.51 37.09 41.82 46.67 51.53 55.15
Net Deferred Tax Liability/Asset 3.33 -6.81 -14.33 -6.11 -6.84 -7.71 -8.56 -9.18Change in Deferred Taxes -1.08 -10.15 -7.52 8.21 -0.73 -0.86 -0.86 -0.62
NOPLAT 270.07 136.42 67.12 119.48 124.74 139.14 153.74 164.84
Normal Cash 21.27 15.63 11.66 13.29 14.88 16.52 18.17 19.44Accounts Rec 208.14 152.90 120.76 132.21 148.08 164.36 180.80 193.46Inventory 43.37 40.91 33.72 32.54 36.45 40.46 44.50 47.62Prepaid Expenses 14.25 12.05 10.71 10.00 11.20 12.43 13.67 14.63Other Operating Assets 12.71 10.20 6.51 22.04 24.68 27.39 30.13 32.24Total Operating Current Assets 299.74 231.68 183.35 210.07 235.28 261.16 287.28 307.39
Accounts Payable 47.08 33.47 33.72 36.40 40.77 45.26 49.78 53.27income tax payable 8.33 1.73 15.72 9.44 10.57 11.90 13.22 14.18Accrued Expenses 34.62 36.48 19.41 25.19 28.21 31.31 34.44 36.85Total Operating Current Liabilites 90.03 71.68 68.85 71.03 79.55 88.47 97.45 104.30
Net Operating Working Capital 209.70 160.00 114.50 139.04 155.73 172.70 189.83 203.09
Intagible Assets 10.64 10.04 9.94 9.94 9.94 9.94 9.94 9.94PV of Operating Leases 114.60 73.60 67.90 71.30 74.86 78.60 82.53 86.66Other LT Assets 43.50 40.89 43.90 50.85 56.95 63.22 69.54 74.41Total LT Operating Assets 168.74 124.53 121.74 132.08 141.75 151.76 162.01 171.00
Net PPE 149.01 143.21 129.88 130.93 132.12 133.43 134.90 136.51
Deferred Revenue 42.71 0.00 0.00 14.57 16.32 18.12 19.93 21.33Other LT Liabilities 43.88 92.33 90.97 77.97 87.33 96.93 106.63 114.09Total LT Operating Liabilities 86.58 92.33 90.97 92.55 103.65 115.05 126.56 135.42
Invested Capital 440.88 335.41 275.15 309.51 325.95 342.83 360.18 375.19
ROIC 76.00% 30.94% 20.01% 43.42% 40.30% 42.69% 44.84% 45.77%
FCFF 184.53 241.89 127.38 85.12 108.30 122.25 136.39 149.83
EP 234.80 92.65 33.83 92.17 94.01 106.78 119.71 129.09

Core Laboratories, NVWeighted Average Cost of Capital (WACC) Estimation
Risk Free Rate (30 yr Treasury) 2.92%Market Risk Premium 4.63%Beta 1.61Estimated Cost of Equity 10.37%Estimated Cost of Debt 4.50%Weight of Debt 6.38%Book Value of Short Term-Debt 0.00Book Value of Long Term Debt 33.72Weight of Equity 93.62%Current Share Price $104.30Current Shares Outstanding 44.15Market Capitalization $4,604.98WACC Estimate 9.93%

Core Laboratories, NVDiscounted Cash Flow (DCF) and Economic Profit (EP) Valuation ModelsKey Inputs: CV Growth 7.35% CV ROIC 45.77% WACC 9.93% Cost of Equity 10.37%
Fiscal Years Ending Dec. 31 2017E 2018E 2019E 2020E 2021E (CV)
Discount Period 1 2 3 4 4DCF ModelNoplat 119.48 124.74 139.14 153.74 164.84Change in Invested Capital 34.36 16.43 16.89 17.35 15.01FCFF 85.12 108.30 122.25 136.39 149.83Terminal Value (T=4) 5369.27Present Value of FCFF 77.44 89.63 92.03 93.41Present Value of Terminal 3677.03Value of Operating Assets 4029.53Non-Operating AdjustmentsExcess Cash 20.60Total Investments and Advances 3.40(Short Term Debt) 0.00(Long Term Debt) 273.37(PV of Operating Leases) 67.90Value of Equity 3712.25Shares Outstanding 44.15Intrinsic value (per share) $84.08Partial Year Adjustments 1.071948Target Price (As of 10/31/17) $90.13
Discount Period 1 2 3 4 4EP ModelBeginning Invested Capital 275.15Economic Profit 92.17 94.01 106.78 119.71 129.09Terminal Value (T=4) 5009.09Present Value of EP 83.84 77.80 80.39 81.98Present Value of Terminal 3430.37Value of Operating Assets 4029.53Non-Operating AdjustmentsExcess Cash 20.60Total Investments and Advances 3.40(Short Term Debt) 0.00(Long Term Debt) 273.37(PV of Operating Leases) 67.90Value of Equity 3712.25Shares Outstanding 44.15Intrinsic value (per share) $84.08Partial Year Adjustments 1.07195Target Price (as of 10/31/17) $90.13

Core Laboratories, NVDividend Discount Model (DDM)
Fiscal Years Ending Dec. 31 2017E 2018E 2019E 2020E 2021E (CV)
EPS 2.32$ 2.60$ 2.93$ 3.27$ 3.51$
Key Assumptions CV growth 7.15% CV ROE 85.94% Cost of Equity 10.37% EPS (CV Year) 3.51$
Future Cash FlowsDiscount Period 1 2 3 4 4 Future Stock Price $117.75 Dividends Per Share 2.31 2.43 2.55 2.67Future Cash Flows $2.31 $2.43 $2.55 $2.67Discounted Cash Flows $2.09 $1.99 $1.89 $1.80Discounted Terminal Value $79.34Intrinsic Value 87.12$ Adjustments for Partial Year 1.07195Target Price (as of 11/10/17) 93.39$

Core Laboratories, NVRelative Valuation Models
EPS EPSTicker Company Price 2017E 2018E P/E 17 P/E 18SLB Schlumberger NV $63.55 $1.48 $2.24 42.94 28.37 HAL Haliburton Co $42.43 $1.16 $2.15 36.58 19.73 BHGE Baker Hughes, a GE Company $31.30 $0.34 $1.11 92.06 28.20 NOV National Oilwell Varco, Inc $33.23 ($0.41) $0.35 -- 94.94 MDR McDermott International, Inc $6.49 $0.42 $0.40 15.45 16.23
Average 46.76 37.49
CLB Core Laboratories, NV $104.90 $2.32 $2.60 45.2 40.3
Implied Relative Value: P/E (EPS17) $ 108.52 P/E (EPS18) 97.56$

Core Laboratories, NVKey Management Ratios
Fiscal Years Ending Dec. 31 2011 2012 2013 2014 2015 2016 2017E 2018E 2019E 2020E 2021EDescription
Liquidity RatiosQuick Ratio Current Assets - Inventories / Current Liabilities 1.46 1.58 1.80 1.76 1.45 1.30 1.70 1.62 1.63 1.70 1.79Current Ratio Current Assets / Current Liabilities 2.04 2.11 2.24 2.29 1.98 1.79 2.35 2.28 2.29 2.35 2.44Cash Ratio Cash / Current Liabilities 0.21 0.14 0.18 0.18 0.19 0.14 0.36 0.29 0.30 0.36 0.46
Activity or Asset-Management RatiosInventory Turnover Sales / Avg Total Inventory 20.82 19.15 22.34 24.06 18.93 15.94 20.46 22.01 21.92 21.83 21.54Receivables Turnover Sales / Avg Net Receivables 5.31 4.84 4.91 5.21 5.22 4.93 5.13 5.13 5.13 5.13 5.13Total Asset Turnover Sales / Avg Total Assets 1.50 1.54 1.62 1.61 1.28 1.04 1.10 1.18 1.23 1.27 1.28
Financial Leverage RatiosDebt Ratio ST Debt + LT Debt / Total Assets 0.60 0.60 0.45 0.32 0.25 0.37 0.37 0.40 0.53 0.69 0.38Debt to Equity Ratio ST Debt + LT Debt / Shareholder's Equity 1.24 1.25 1.58 3.79 -18.19 1.39 1.85 1.91 1.86 1.73 1.58Equity Ratio Shareholder's Equity / Total Assets 0.30 0.30 0.26 0.14 -0.04 0.27 0.24 0.23 0.23 0.23 0.24
Profitability RatiosGross Margin Revenue - Cogs / Revenue 35% 37% 38% 39% 33% 26% 30% 30% 30% 30% 30%Profit Margin Net Income / Revenue 20% 22% 23% 24% 14% 11% 15% 15% 15% 15% 15%Return on Assets Net Income / Avg Total Assets 30% 35% 37% 39% 18% 11% 17% 18% 19% 20% 20%Return on Equity Net Income / Avg Shareholder's Equity 78% 117% 136% 196% 327% 97% 68% 78% 86% 89% 86%
Payout Policy RatiosDividend Payout Ratio Dividends per share / EPS 26% 24% 24% 34% 81% 152% 100% 93% 87% 82% 80%

Sensitivity Analysis
COGS90.13$ 60.00% 65.00% 70.00% 75.00% 80.00%3.95% 149.56$ 122.55$ 95.53$ 68.52$ 41.51$ 4.45% 146.86$ 119.84$ 92.83$ 65.82$ 38.81$
SG&A 4.95% 144.16$ 117.14$ 90.13$ 63.12$ 36.10$ 5.45% 141.45$ 114.44$ 87.43$ 60.42$ 33.40$ 5.95% 138.75$ 111.74$ 84.73$ 57.71$ 30.70$
Beta90.13$ 1.41 1.51 1.61 1.71 1.813.63% 628.49$ 333.16$ 225.48$ 169.70$ 135.59$
MRP 4.13% 229.81$ 166.39$ 129.85$ 106.09$ 89.40$ 4.63% 138.85$ 109.57$ 90.13$ 76.28$ 65.91$ 5.13% 98.52$ 80.91$ 68.36$ 58.97$ 51.67$ 5.63% 75.75$ 63.61$ 54.60$ 47.64$ 42.11$
Re9.93% 8.37% 9.37% 10.37% 11.37% 12.37%3.50% 8.01% 8.94% 9.88% 10.82% 11.75%4.00% 8.03% 8.97% 9.90% 10.84% 11.78%
Rd 4.50% 8.05% 8.99% 9.93% 10.86% 11.80%5.00% 8.08% 9.01% 9.95% 10.89% 11.82%5.50% 8.10% 9.04% 9.97% 10.91% 11.85%
NOPLAT CV90.13$ 6.35% 7% 7.35% 7.85% 8.35%
35.77% 63.88$ 72.87$ 85.36$ 103.85$ 134.08$ 40.77% 65.54$ 74.96$ 88.04$ 107.41$ 139.06$
ROIC CV 45.77% 66.85$ 76.60$ 90.13$ 110.18$ 142.94$ 50.77% 67.89$ 77.91$ 91.81$ 112.41$ 146.07$ 55.77% 68.75$ 78.99$ 93.19$ 114.24$ 148.63$
EPS CV93.39$ 5.25% 5.75% 6.25% 6.75% 7.25%9.37% 78.31$ 87.54$ 99.73$ 116.57$ 141.35$ 9.87% 69.82$ 76.91$ 85.95$ 97.90$ 114.41$
Re 10.37% 62.94$ 68.53$ 75.47$ 84.32$ 96.02$ 10.87% 57.37$ 61.88$ 67.36$ 74.18$ 82.88$ 11.37% 52.68$ 56.37$ 60.80$ 66.18$ 72.86$
Impact on DCF Stock Price: COGS, SG&A Expense
Impact on DCF Stock Price: Beta, Market Risk Premium
Impact on WACC: Cost of Equity, Cost of Debt
Impact on DCF Stock Price: NOPLAT CV, ROIC CV
Impact on DDM Stock Price: EPS CV Growth, Cost of Equity

Effects of Share Repurchases on Common Stock Balance Sheet Account and Number of Shares Outstanding
2017E 2018E 2019E 2020E 2021E
Change in Treasury Stock 8.08 8.89 9.77 10.75 11.83Expected Price of Repurchased Shares: 105.00$ 105.00$ 105.00$ 105.00$ 105.00$ Number of Shares Repurchased: 0.08 0.08 0.09 0.10 0.11
Shares Outstanding (beginning of the year) 44.15 44 44 44 44Less: Shares Repurchased in Treasury 0.08 0 0 0 0 Shares Outstanding (end of the year) 44.07 43.99 43.90 43.79 43.68


![L16: Power Dissipation in Digital Systemsweb.mit.edu/6.111/www/s2006/LECTURES/l16.pdf · [Montanaro, JSSC ‘96] [A. Sinha, DAC] 65% 21% 9% 5% Interconnect Clock I/O CLB CLB CLB CLB](https://static.fdocuments.in/doc/165x107/6075f07be9a488213651b8cd/l16-power-dissipation-in-digital-montanaro-jssc-a96-a-sinha-dac-65-21.jpg)

![Design Considerations for Next Generation Wireless Power ......[Montanaro, JSSC ‘96] CLB CLB CLB CLB 65% 21% 9% 5% Interconnect Clock I/O CLB “Software” Energy Dissipation is](https://static.fdocuments.in/doc/165x107/6075f305565b1e4d845c5e4e/design-considerations-for-next-generation-wireless-power-montanaro-jssc.jpg)