Energy and Technology Policies · PDF fileEnergy and Technology Policies ... 30 years Lessons...
27
Energy and Technology Policies Energy and Technology Policies - - Japan's Perspectives and Experiences Japan's Perspectives and Experiences CARB Chair’s Air Pollution Seminar @Sacramento January 17, 2007 Susumu Okamoto Ministry of Economy, Trade and Industry, Japan
Transcript of Energy and Technology Policies · PDF fileEnergy and Technology Policies ... 30 years Lessons...

Energy and Technology PoliciesEnergy and Technology Policies-- Japan's Perspectives and ExperiencesJapan's Perspectives and Experiences
CARB Chair’s Air Pollution Seminar @Sacramento
January 17, 2007
Susumu OkamotoMinistry of Economy, Trade and Industry, Japan
1
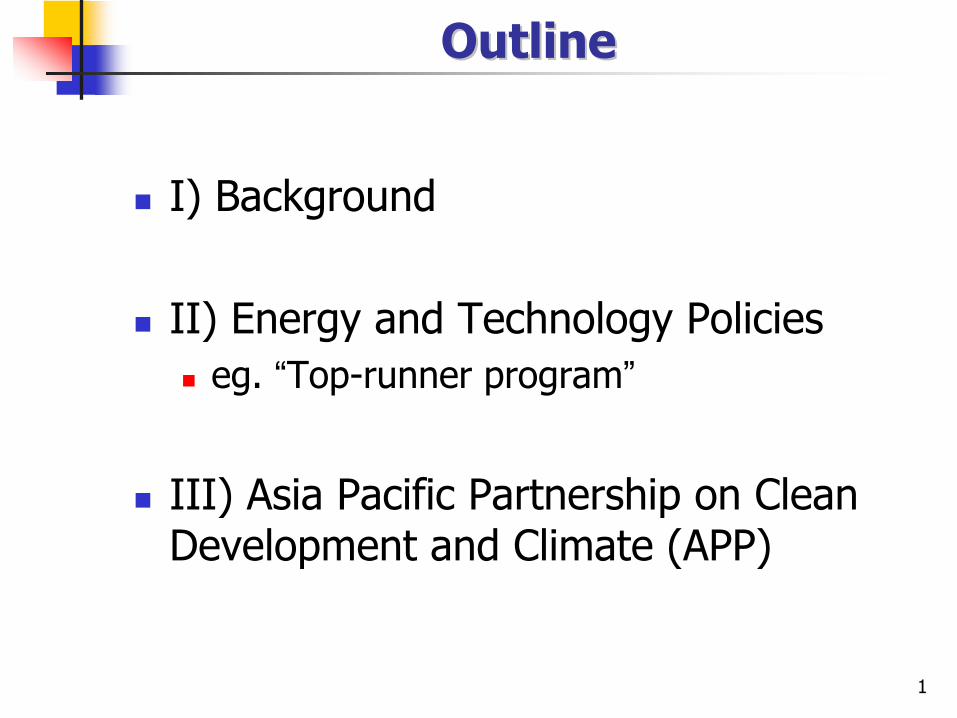
OutlineOutline
I) Background
II) Energy and Technology Policieseg. “Top-runner program”
III) Asia Pacific Partnership on Clean Development and Climate (APP)

I) BackgroundI) Background

3
Historical Background on Historical Background on Energy Efficiency in JapanEnergy Efficiency in Japan
30 years Lessons learnt from energy crisis & economic growth
Due to the limited land, resources, …Need to be efficientTechnologies: core competence in business
Security of Energy Supply
Oil Crises1973-
Large Quantity of Inexpensive Oil
High Economic Growth1960-
Harmony with Environment
United Nation Framework Convention on Climate Change
1992-
Efficiency of the Market Mechanism
Plaza Accord1985-
PrioritiesEventsYear

4
Improvement over last 30 yearsImprovement over last 30 years
Oil Stockpiling
Alternatives to OilNuclearGasCoalOil
Energy Conservation(Energy Intensity in Manufacturing)
56days
0.6%1%
16%77%
100
1973 2003
168days
13%13%19%49%
64

5
Basic Principles of JapanBasic Principles of Japan’’s Energy Policy : 3Ess Energy Policy : 3Es
Harmony Harmony with Environmentwith Environment
Alternative to CO2Alternative to CO2
EfficiencyEfficiencyof theof theMarketMarket
mechanismmechanism
Security of Security of Energy SupplyEnergy SupplyAlternatives to oilAlternatives to oil
3 E s3 E s

6
Energy ConservationEnergy Conservation
*Energy Consumption in 2001 (kl:Oil Equivalent)/ GDP
in 2001* Converting Japan as 1
Comparison of Energy Consumption per GDPComparison of Energy Consumption per GDP
2.7
1.9
1.61.4
1.0
0.0
0.5
1.0
1.5
2.0
2.5
3.0
Japan USA UK France Germany120110180100
Cement
---161100Paper
120118100Chemicals
111103112118100Steel
GermanyFranceUKUSAJapan
International Comparison of Energy International Comparison of Energy Consumption Rates (Japan=100)Consumption Rates (Japan=100)
Source : Subcommittee on Demand & Supply, Advisory Committee for Natural Resources and Energy, Interim Report 1998 ※Chemicals shows the unit of soda industry.
※Cement shows the unit of calcination process.

7
Development and diffusion of Development and diffusion of innovative technologiesinnovative technologies
Stabilization of GHG concentrations can be achieved only throughdevelopment and diffusion of innovative technologies, together with maximum use of existing technologies.
There is no silver bullet. Need to pursue multiple technologies.
Future framework has to incorporate a mechanism for promoting efforts for innovative technologies.
Fig: Importance of innovative technologies in CO2emission reduction
GAPGAP
(Source) Battelle (2000) (Source) RITE (2004)
0
5000
10000
15000
2000 2010 2020 2030 2040 2050year
Car
bon
emis
sion
s & re
duct
ions
(MtC
/yr)
Energy Saving
Fuel Switch among Fossil Fuel
Nuclear Power
Renewables
CO2Sequestration
Net Emission
Emissions in Reference Case(IPCC/SRES/B2)
Scenario to stabilize atmospheric CO2 concentration at 550ppm
(Source) RITE (2004)
0
5000
10000
15000
2000 2010 2020 2030 2040 2050year
Car
bon
emis
sion
s & re
duct
ions
(MtC
/yr)
Energy Saving
Fuel Switch among Fossil Fuel
Nuclear Power
Renewables
CO2Sequestration
Net Emission
Emissions in Reference Case(IPCC/SRES/B2)
Scenario to stabilize atmospheric CO2 concentration at 550ppm
Fig: CO2 emission reduction by various technologies

II) Energy and Technology PoliciesII) Energy and Technology Policies

9
• Innovative technologies are necessary for sustainable development as well as for stabilization of GHG gas concentration in the long run.
• The Government of Japan has put emphasis on energy-related R&D with a view to reducing emissions not only domestically but also globally.
Emphasis on EnergyEmphasis on Energy--Related Tech. R&D Related Tech. R&D PrgrmsPrgrms..
(Source) IEA (2002)
0
200
400
600
800
1000
1995 2000 1995 2000 1995 2000 1995 2000 1995 2000
Japan US Germany Italy UK
M$
Renewable energyEnergy conservation
343
712869
766
80 74 84 4218 9
Fig: Energy-related R&D investmentby government
0
5000
10000
15000
2000 2010 2020 2030 2040 2050年
二酸
化炭
素排
出・
削減
量(M
tC/年
)
省エネルギー
化石燃料間の燃料転換原子力
再生可能エネルギー炭素隔離
総排出量
リファレンスケースの排出シナリオ
(IPCC/SRES/B2シナリオ)
550ppmに安定化させるためのシナリオ
0
5000
10000
15000
2000 2010 2020 2030 2040 2050年
二酸
化炭
素排
出・
削減
量(M
tC/年
)
省エネルギー
化石燃料間の燃料転換原子力
再生可能エネルギー炭素隔離
総排出量
リファレンスケースの排出シナリオ
(IPCC/SRES/B2シナリオ)
550ppmに安定化させるためのシナリオ
(Source) RITE DNE+ Model
Energy Conservation
Fuel Conversion
Nuclear
Renewable Energy
Carbon Sequestration
Total CO2 Emission
CO2 Emission scenario to achieve concentration at 550ppm
CO2 Emission Scenario at reference case (IPCC/SRES/B2)
Year
CO
2Emission/R
eduction (MtC/Yr)
Fig: Expected Effect of reduction of CO2 emission by technology

10
Top Runner Program (1)Top Runner Program (1)
Introduced in 1998Energy conservation standards for home/office appliances and fuel efficiency standards for automotivesAdopts a values of the product with the highest energy efficiency as a base value of a product categoryTargets are to be revised in 4 to 8 years, reflecting the outlook for future technological developments
Fuel Efficiency(km/l)
Fuel Efficiency(km/l)
Top Runner Program(Stricter energy conservation standard)
Conventional energy
conservation standard
The Top Runner Program sets the level of the energy efficiency standard of the product in the market in consideration of the existing highest efficiency and the potential technological improvements.
The Top Runner Program sets the level of the energy efficiency standard of the product in the market in consideration of the existing highest efficiency and the potential technological improvements.

11
Top Runner Program (2)Top Runner Program (2)
Main featuresCovers energy-use products used in large volumes, which consume substantial amounts of energyProvides manufacturers incentives for developing more energy efficient equipmentDiffuses more efficient products in the market
Target products (21 Items)
1 Passenger Vehicles2 Freight Vehicles3 Air Conditioners4 Electric Refrigerators5 Electric Freezers 6 Electric Rice Cookers 7 Microwave Ovens
15 Copying Machines 16 Space Heaters 17 Gas Cooking Appliances18 Gas Water Heaters19 Oil Water Heaters 20 Vending Machines 21 Transformers
8 Fluorescent Lights 9 Electric Toilet Seats 10 TV Sets 11 Video Cassette Recorders 12 DVD Recorders 13 Computers14 Magnetic Disk Units
The Top Runner Program creates “Win-Win”situation and virtuous cycle.
The Top Runner Program creates “Win-Win”situation and virtuous cycle.

12
Top Runner Program (3)Top Runner Program (3)
How to establish “Top Runner” standardsTechnical and methodological evaluation by the Advisory Committee
Committee’s membershipindustry representatives, academic experts, researchers, consumer representatives, local government representatives
Target standard and year set in consideration of the technological improvement
Working group study, subcommittee deliberations, etc.Public commentReport to the WTO/TBT
Avoid trade barriers to imported productsAmendment of the government ordinance

13
Top Runner Program (4)Top Runner Program (4)Related measures to diffuse the target product
Display obligationsManufacturers are required under the “Notification” to display the energy efficiency informationPenalty can be imposed if the manufacturer does not obey the order from the Ministry
Retailer assistanceGovernment awards are given to the excellent shops.
Labeling SystemPromotes the diffusion of the target products

14
Top Runner Program (5)Top Runner Program (5)
Verification MethodsTo confirm achievement of standards, questionnaires are distributed to the manufacturers
Measures to the manufacturers in non-compliance
Government offers recommendations to the manufacturer in questionIf the recommendation is not followed, the manufacturer may be ordered to follow the recommendation

15
Top Runner Program (6)Top Runner Program (6)
Assessment of the target achievementMany products show better improvement of efficiency in the earlier stage than planned
66.1 %67.8 %(FY1997-2004)
Air Conditioners
58.7 %73.6 %(FY1997-2003)
VCRs
16.4 %25.7 %(FY1997-2003)
TV sets
23.0 %(FY1995-2010)
22.0 %(FY1998-2004)
Passenger Vehicles
22.9 %29.6 %(FY1998-2004)
Electric Freezers
30.5 %55.2 %(FY1998-2004)
Electric Refrigerators
Improved Efficiency Ratio (planned)
Improved Efficiency Ratio (actual)
Products

16
Efforts for innovative technologies Efforts for innovative technologies
Quite a few energy technologies such as nuclear, gas-turbine and photovoltaic were developed by technology-push.GOJ’s photovoltaic program induced private sector’s R&D at initial stage and realized cost-down at deployment stage.
JapanUSGermanOthers
Japan636.8 MWUS
212.2MW
German277.3 MW
Others201.6 MW
World 1327.7MW
(2002)
Fig: Total worldwide installations of photovoltaic power system
(Source) IEA PVPS
(Source) The Institute of Energy Economics, Japan(2005)(Reference) Agency for Natural Resources and Energy, METI
Fig: Support for installation of photovoltaic and accumulated production.
0
10
20
30
40
50
60
70
80
90
100
1994 1995 1996 1997 1998 1999 2000 2001 2002 20030
100
200
300
400
500( ) ( )
累積導入量
住宅用予算
公共施設・産業用予算
(Source)Watanabe(1999)
Fig: Public and private R&D expenditures on photovoltaic.
10 thousand KW 1 hundred thousand yen
Total
For public and industry
For housing

17
Goal: To contribute to stable and efficient energy supply, solution to the global warming (CO2) problem and global environment (NOx, particulate matters, etc) problem, creation of new industry/employment, and realization of hydrogen society.
Targets:
1. Enable new technologies in the long run to play a role as one of major energy resources by conducting strategic government-industry-academia cooperation in R&D activities to reduce their cost, to stabilize their supply and to improve their performance.
2. Contribute to achieve the introduction target of new energy (19.1 million liter by 2010) as well as the introduction target of fuel cell technology (2,200 MW for stationary FC and 50,000 FCVs.
Budget: FY 2006 JPY 58.2 billion (FY 2005 JPY 58.7 billion)
R&D Program on New Energy TechnologiesR&D Program on New Energy Technologies
PV M odule
G rid
Load
PV M odule
G rid
Load
PV 4,820MW (by2010)
○ Stationary fuel cell○ Fuel cell cars ○ Stationary fuel cell○ Fuel cell cars
FC 2,200 MW & FCV 50,000 FCVs (by 2010)

18
Goal: To establish a sustainable society with a good balance of 3E (environment, energy and economy) by promoting R&D and introduction of the innovative technologies to radically improve energy efficiency, to fix and use CO2,and control 3 gases including substitute chlorofluorocarbon.
Targets:
Establish in the long run effective technologies contributing to further reduction of CO2 emission in order to ensure sustainable economic growth with constraining energy consumption and to secure industrial competitiveness through world top-class global prevention technologies.
Budget: FY 2006 JPY 5.7 billion (FY 2005 JPY 5.3 billion)(for CCS)/ FY 2006 JPY 1.1 billion (FY 2005 JPY 1.2 billion)(for 3 gas)/
Innovative Technology Program on Innovative Technology Program on Global Warming Prevention Global Warming Prevention
Progress of CO2 Aquifer Sequestration Project
CO2
CO2CO2
CO2CO2
TransportSeparation/Capture Injection
Injection
Onshore aquifer
Offshore
aquifer
Large scaleEmission source
CO2
CO2CO2
CO2CO2
TransportSeparation/Capture Injection
Injection
Onshore aquifer
Offshore
aquifer
Large scaleEmission source
TransportSeparation/Capture Injection
Injection
Onshore aquifer
Offshore
aquifer
Large scaleEmission source
Progress of CO2 Aquifer Sequestration ProjectProgress of CO2 Aquifer Sequestration Project
CO2
CO2
CO2
CO2CO2
CO2CO2
TransportSeparation/Capture Injection
Injection
Onshore aquifer
Offshore
aquifer
Large scaleEmission source
CO2
CO2CO2
TransportSeparation/Capture Injection
Injection
Onshore aquifer
Offshore
aquifer
Large scaleEmission source
CO2
CO2CO2
CO2CO2
CO2CO2
CO2CO2
TransportSeparation/Capture Injection
Injection
Onshore aquifer
Offshore
aquifer
Large scaleEmission source
TransportSeparation/Capture Injection
Injection
Onshore aquifer
Offshore
aquifer
Large scaleEmission source
○Development of technology to store CO2 underground
○Development of CO2 fixation technology based on the effective use of used paper
セルロース分解
糖
CO2
有機酸有機酸
燃料油燃料油
新規バイオコンバージョン
古紙

19
Model Projects for IntModel Projects for Int’’l Energy Efficiencyl Energy EfficiencyAs of August 2006
2006–2009NIPPON STEEL CORP.
Thai Roong RuangEnergy Co., Ltd.
Department of Economic Affairs, Ministry of Finance/Ministry of Steel
IndiaThe Model Project for Increasing the Efficient Use of Energy Using a Coke Dry Quenching System
2006–2007Marubeni Corporation
Thong Thai Textile Co., Ltd.
Office of the Cane and Sugar Board Ministry of Industry Kingdom of Thailand
ThailandThe Model Project for Ethanol Production from Molasses and Bagasse in a Sugar Factory in Thailand
2004–2005KRI, Inc.PT. Gunung GarudaDapartment of Industrial Promotion, Ministry of Industry
ThailandThe Model Project for Energy and Water Saving in the Textile Dyeing and Finishing Industry
2003–2006NIPPON STEEL CORP.
Thanh Hoa Brewery Company, Hanoi Beer Alcohol Beverages Corporation
Ministry of Industry and TradeIndonesia
The Model Project for High Performance Industrial Furnaces
2003–2005MAEKAWA MFG. CO., LTD.
Uralsk Heat and Electric Power Station"
Ministry of Industry/Ministry of Natural Resources and Environment
VietnamThe Model Project for Renovation to Increase the Efficient Use of Energy in a Brewery
2002–2006Tohoku Electric Power Co., Inc.
ZhaiykteploenergoMinistry of Energy and Mineral Resources/The Government of West Kazakhstan Region/Ministry of Natural Resources and Environmental Protection
Kazakhs-tan
The Model Project for Increasing the Efficient Use of Energy
2002–2005Cosmo Engineering Co., Ltd.
Balikpapan Refinery of Pertamina
Directorate General of Oil and Gas, Ministry of Energy and Mineral Resources
Indonesia
The Model Project for Flare Gas and Hydrogen Recovery Systems in an Oil Refinery
1999–2005NKK CORPORA-TION
Bang-poo Industrial Estate
Ministry of Industry/Industrial Estate Authority of Thailand
ThailandThe Model Project for Utilization of Waste Heat from Incineration of Industrial Waste in Industrial Estates
Term of project implementation
Entrusted company
Implementation siteCounterpartHost country
Project name
Source: NEDO Website: http://www.nedo.go.jp/

III) III) AsiaAsia--Pacific Partnership on Clean Pacific Partnership on Clean Development and Climate (APP) Development and Climate (APP)

21
AsiaAsia--Pacific Partnership on Clean Pacific Partnership on Clean Development and Climate (APP) (1)Development and Climate (APP) (1)
PartnersAustralia, China, India, Japan, Korea, USA
CharacteristicsComplement to Kyoto Protocol, Technology-oriented, Sectoral approach, Public-Private partnership, project- and activity-based
PotentialSignificant shares in these major sectors in the world

22
AsiaAsia--Pacific Partnership on Clean Pacific Partnership on Clean Development and Climate (APP) (2)Development and Climate (APP) (2)
8 public-private sector Task Forces: (1) Cleaner fossil energy(2) Renewable energy and distributed generation(3) Power generation and transmission(4) Steel(5) Aluminium(6) Cement(7) Coal mining(8) Buildings and Appliances
Japan leads: (4) Steel and (6) CementUS leads: (3) Power generation and
transmission and (7) Coal mining
Japan leads: (4) Steel and (6) CementUS leads: (3) Power generation and
transmission and (7) Coal mining
Percentage of CO2 emissions by sector in 6 APP countriesEnergy supply sector
50.7%
Industrial sector
16.0%General sector
10.8%Transportation sector
22.5%
Power-generating sector
42.8%
Others (petroleum refining, city gas production, etc.) 7.9% Iron and steel
6.0%Cement2.7%
Other industries 7.4%
House-holds 6.7%
Business, others 4.1%
Automobiles and trucks
18.8%
Other transportation 3.6%

23
AsiaAsia--Pacific Partnership on Clean Pacific Partnership on Clean Development and Climate (APP) (3)Development and Climate (APP) (3)
APP countries share about half of the world production
Japan
Power (kWh)
Steel (ton)
Cement (ton)
Aluminum (ton)
Japan
US
Australia
China
Korea
Others
49.1%
57.5%
60.5%
36.9%
US
USJapan China
Korea
India
Australia
Others
Others
Others
China
Korea
IndiaJapan
Australia
India
China
Australia
US
India
CO2 emissions (2003)
Primary energy consumption (2003)
Korea48.2%
US
Australia India
OthersChina
Japan
Actual GDP (2003)
54.7%
US
Australia
India
Korea
Others
Japan China
50.5%
US
Australia India
Korea
OthersChina
Japan

24
AsiaAsia--Pacific Partnership on Clean Pacific Partnership on Clean Development and Climate (APP) (4)Development and Climate (APP) (4)
3rd Policy Implementation Committee (PIC) meeting
Oct. 11-13, 2006 @ Jeju Island, KoreaMain outcomes
Endorsed the all Action Plans in principleAPP is experiencing an important transition from ‘‘Planning’’ to ‘‘Implementation’’
Recognized the importance of financing to the project activities
Strong demands for financing from project participantsThe number of projects: 92 (as of October 31, 2006)
Agreed on some procedures such as flagship and outreach
Foundations for the future activities

25
AsiaAsia--Pacific Partnership on Clean Pacific Partnership on Clean Development and Climate (APP) (5)Development and Climate (APP) (5)
For future activities of APPIncentives to China and India
Private companies need short term resultsCapacity buildings through cooperative work with US or Japanese business partners
Collaboration with IEA“Sectoral approach”
To develop energy efficiency indicators in each industrial sector To identify “best-practices”
Exchange views between APP and IEATo give insights for IEA’s task

Thank you for Thank you for youryour attention.attention.
E-mail: [email protected]
Susumu OkamotoMinistry of Economy, Trade and Industry, Japan