Energy Technology Perspectives - International Energy · PDF fileEnergy Technology...
45
© OECD/IEA 2016 Energy Technology Perspectives Sustainable Transport in an era of Urbanization Jacob Teter Transport Energy Analyst International Energy Agency National and local policies to promote sustainable transport
Transcript of Energy Technology Perspectives - International Energy · PDF fileEnergy Technology...
© OECD/IEA 2016
Energy Technology Perspectives Sustainable Transport in an era of Urbanization
Jacob Teter Transport Energy Analyst International Energy Agency
National and local policies to promote sustainable transport
© OECD/IEA 2016
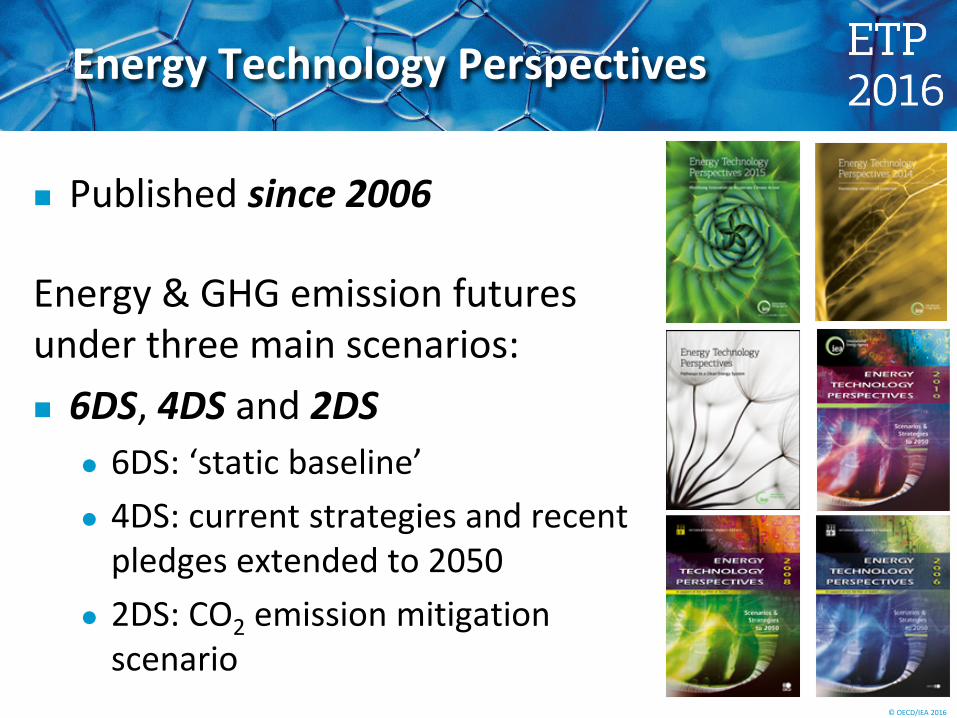
Energy Technology Perspectives
Published since 2006
Energy & GHG emission futures under three main scenarios: 6DS, 4DS and 2DS
6DS: ‘static baseline’ 4DS: current strategies and recent
pledges extended to 2050 2DS: CO2 emission mitigation
scenario
© OECD/IEA 2016
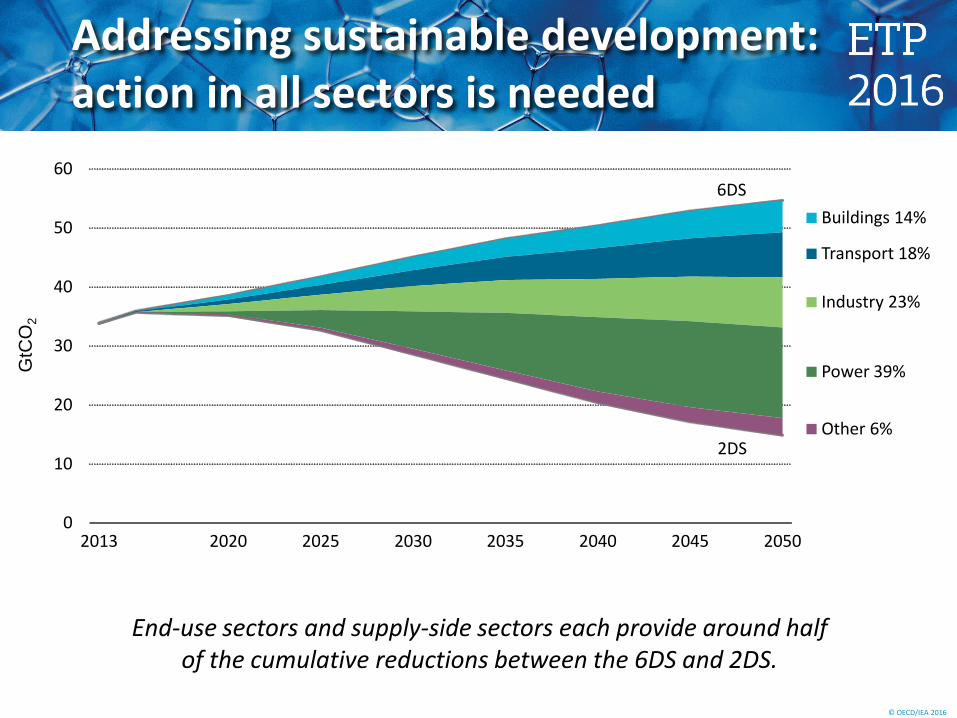
Addressing sustainable development: action in all sectors is needed
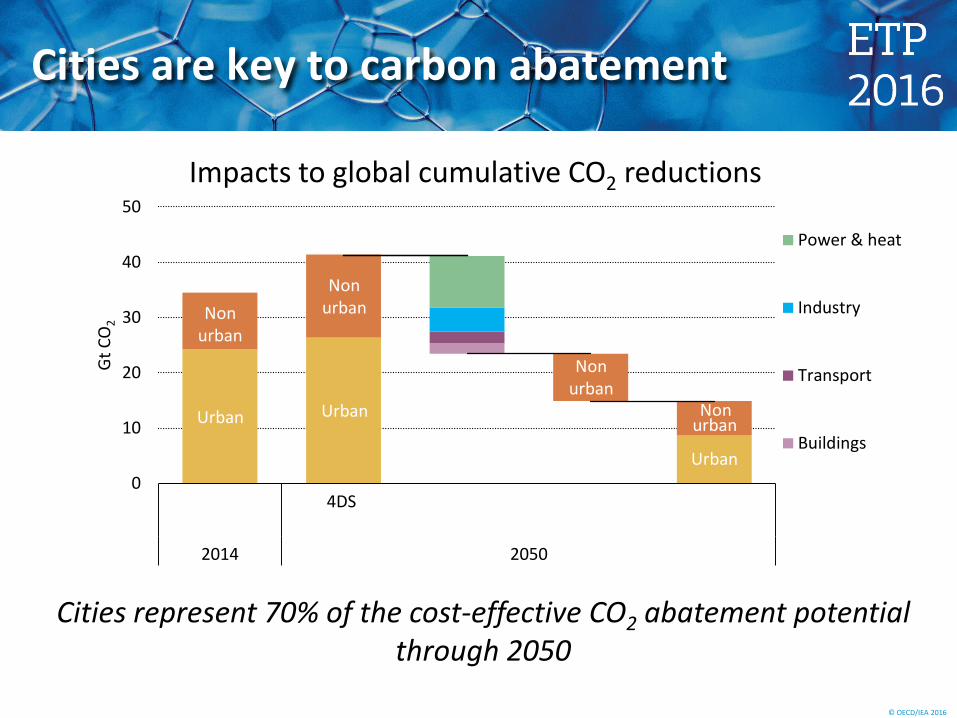
End-use sectors and supply-side sectors each provide around half of the cumulative reductions between the 6DS and 2DS.
6DS
2DS
0
10
20
30
40
50
60
2013 2020 2025 2030 2035 2040 2045 2050
GtC
O2
Buildings 14%
Transport 18%
Industry 23%
Power 39%
Other 6%
© OECD/IEA 2016
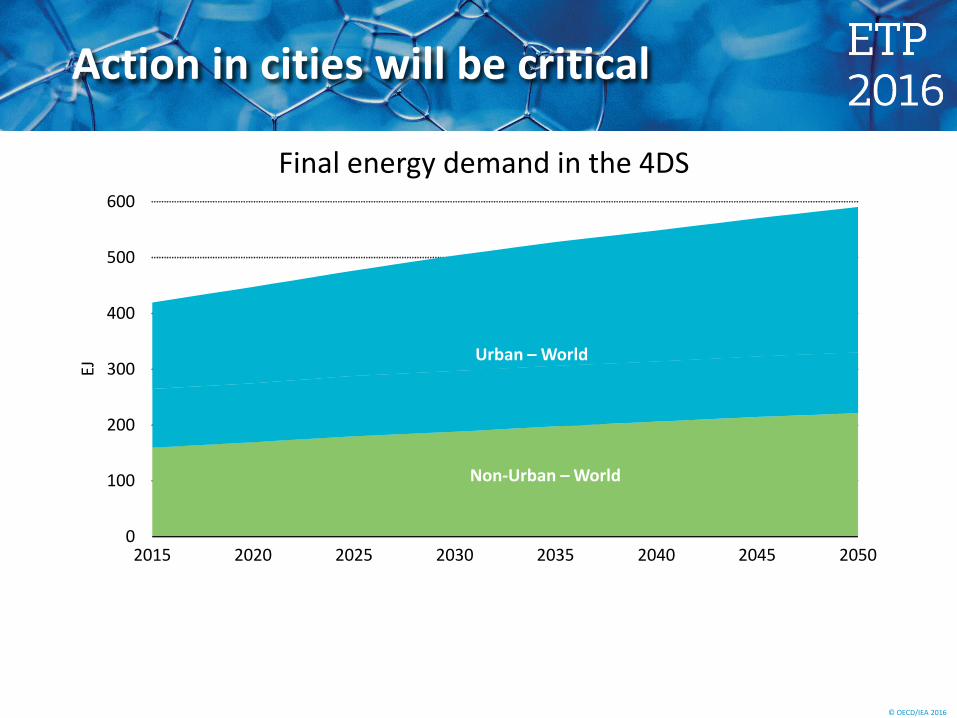
Action in cities will be critical
Final energy demand in the 4DS
Urban non-OECD
Urban OECD
0
100
200
300
400
500
600
2015 2020 2025 2030 2035 2040 2045 2050
EJ Urban – World
Non-Urban – World
© OECD/IEA 2016
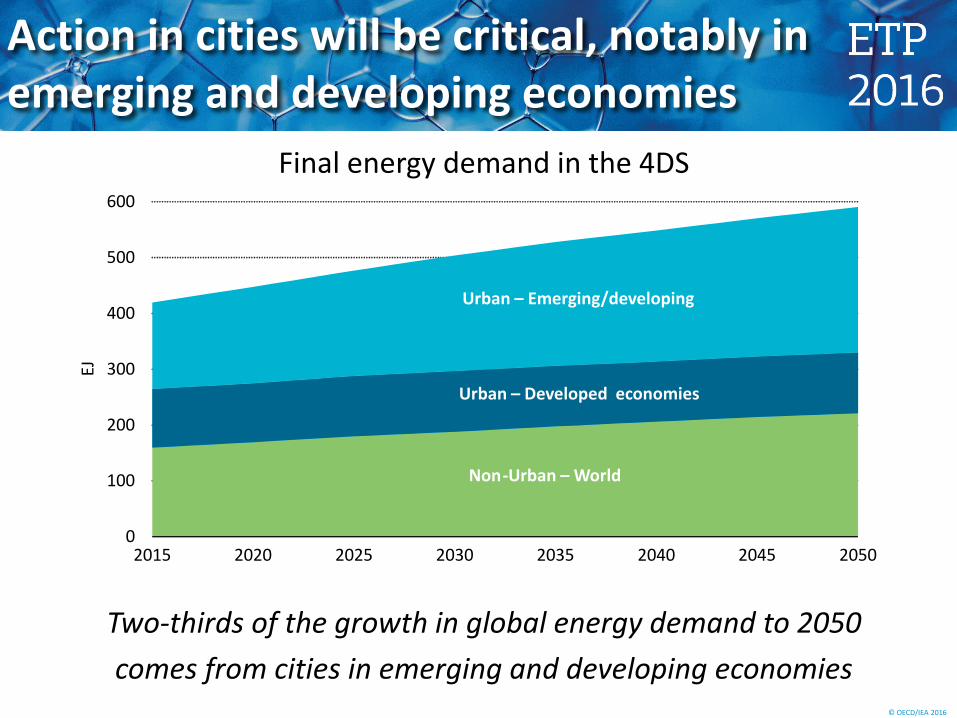
Action in cities will be critical, notably in emerging and developing economies
Two-thirds of the growth in global energy demand to 2050 comes from cities in emerging and developing economies
Final energy demand in the 4DS
Urban non-OECD
Urban OECD
0
100
200
300
400
500
600
2015 2020 2025 2030 2035 2040 2045 2050
EJ
Urban OECD
Urban – Emerging/developing
Non - Urban – World
Urban – Developed economies
© OECD/IEA 2016
Cities are key to carbon abatement
Cities represent 70% of the cost-effective CO2 abatement potential through 2050
Impacts to global cumulative CO2 reductions
CO2 CO2 CO2 CO2 CO2
0
10
20
30
40
50
4DS Urbanreductions
Non-urbanreductions
2DS
2014 2050
Gt C
O2
Power & heat
Industry
Transport
BuildingsUrban Urban
Non urban
Non urban
Urban
Non urban
urban Non
© OECD/IEA 2016
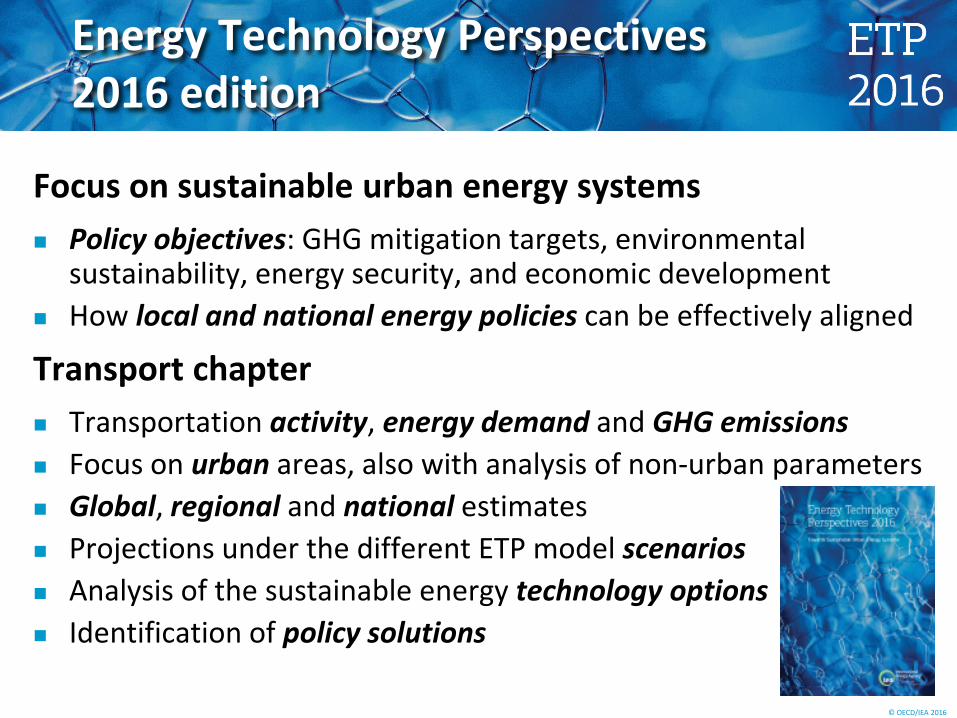
Energy Technology Perspectives 2016 edition
Focus on sustainable urban energy systems Policy objectives: GHG mitigation targets, environmental
sustainability, energy security, and economic development How local and national energy policies can be effectively aligned
Transport chapter Transportation activity, energy demand and GHG emissions Focus on urban areas, also with analysis of non-urban parameters Global, regional and national estimates Projections under the different ETP model scenarios Analysis of the sustainable energy technology options Identification of policy solutions
© OECD/IEA 2016
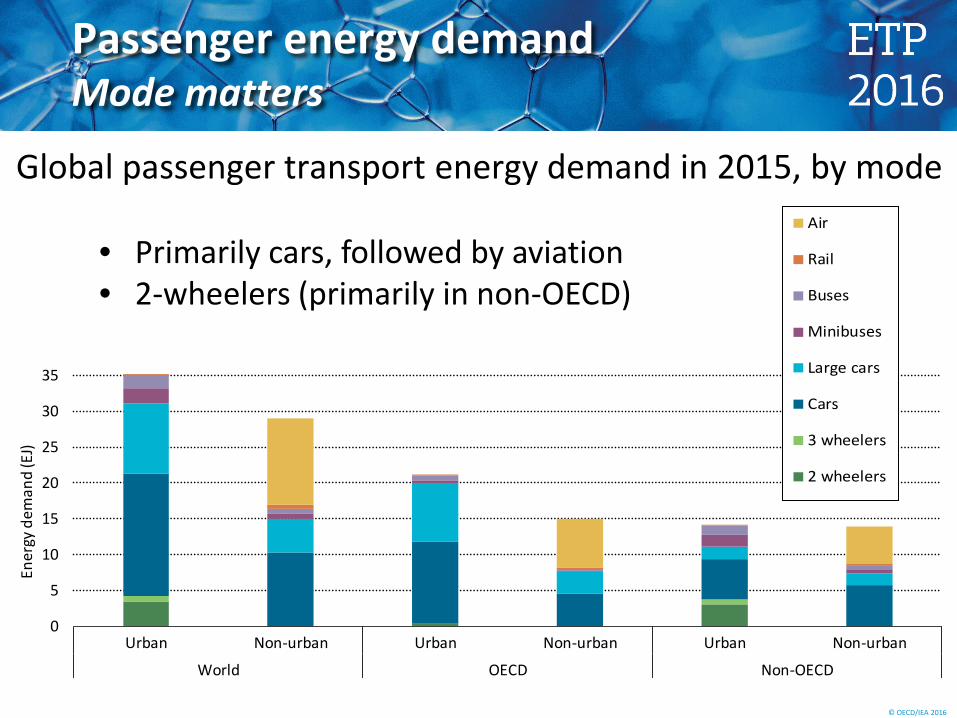
Passenger energy demand Mode matters
0
5
10
15
20
25
30
35
Urban Non-urban Urban Non-urban Urban Non-urban
World OECD Non-OECD
Ener
gy d
eman
d (E
J)
Air
Rail
Buses
Minibuses
Large cars
Cars
3 wheelers
2 wheelers
Global passenger transport energy demand in 2015, by mode
• Primarily cars, followed by aviation • 2-wheelers (primarily in non-OECD)
© OECD/IEA 2016
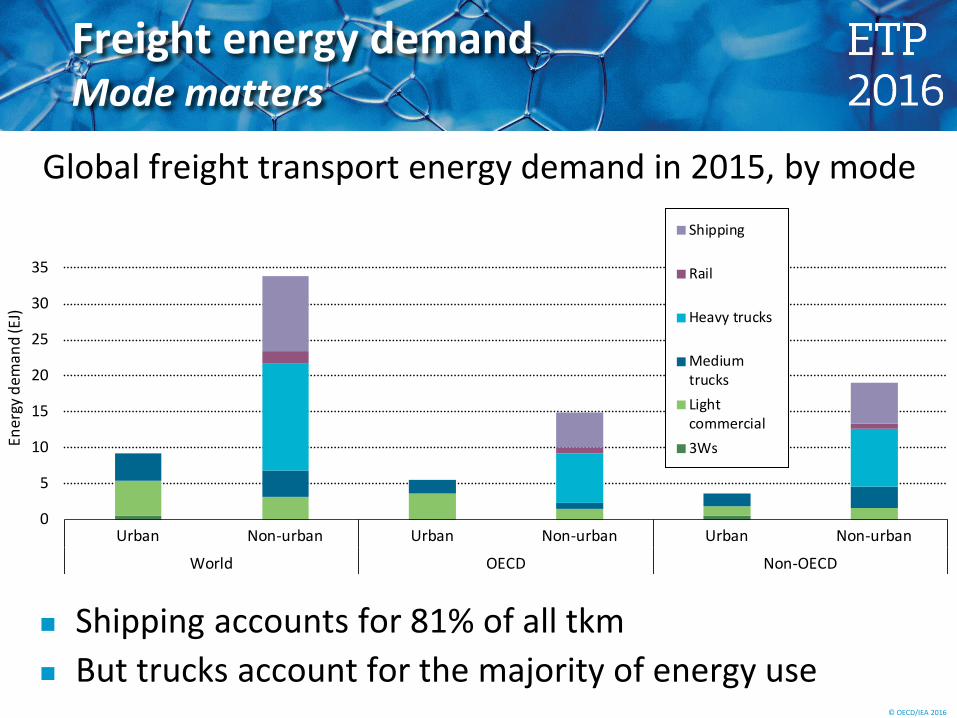
Shipping accounts for 81% of all tkm But trucks account for the majority of energy use
Freight energy demand Mode matters
0
5
10
15
20
25
30
35
Urban Non-urban Urban Non-urban Urban Non-urban
World OECD Non-OECD
Ener
gy d
eman
d (E
J)
Shipping
Rail
Heavy trucks
MediumtrucksLightcommercial3Ws
Global freight transport energy demand in 2015, by mode
© OECD/IEA 2016
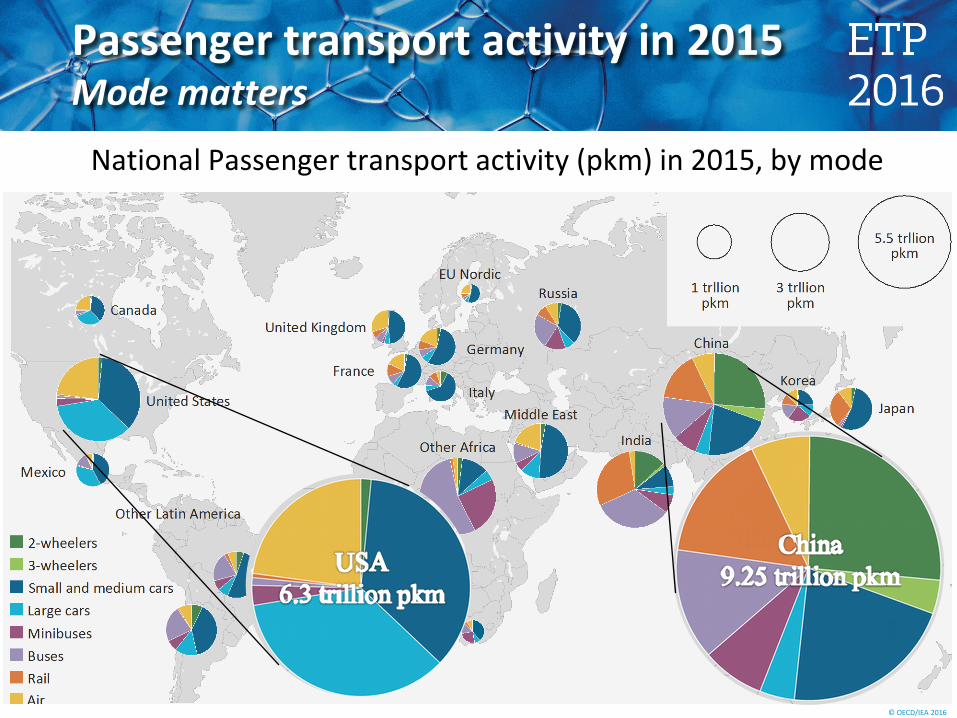
Passenger transport activity in 2015 Mode matters
National Passenger transport activity (pkm) in 2015, by mode
© OECD/IEA 2016
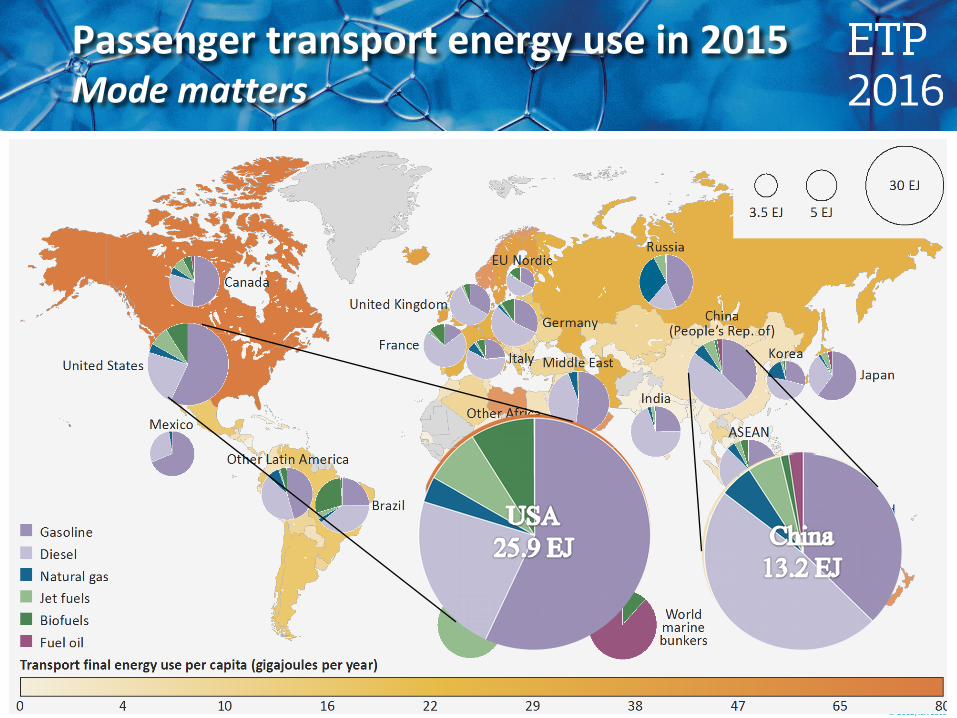
Passenger transport energy use in 2015 Mode matters
© OECD/IEA 2016
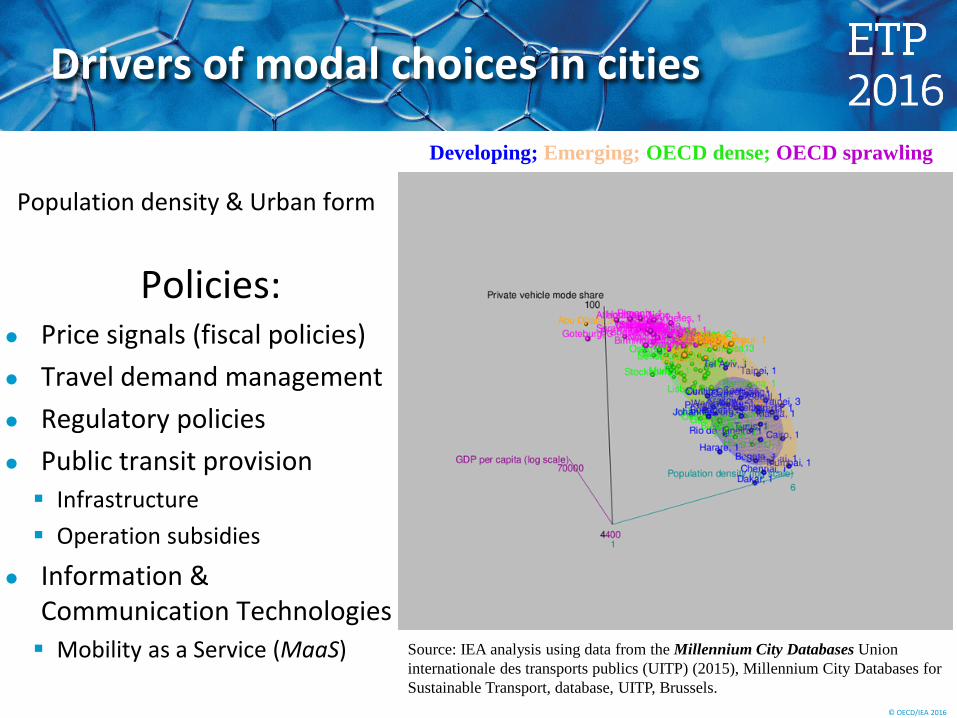
Drivers of modal choices in cities
Population density & Urban form
Policies: Price signals (fiscal policies) Travel demand management Regulatory policies Public transit provision Infrastructure Operation subsidies
Information & Communication Technologies Mobility as a Service (MaaS)
Developing; Emerging; OECD dense; OECD sprawling
Source: IEA analysis using data from the Millennium City Databases Union internationale des transports publics (UITP) (2015), Millennium City Databases for Sustainable Transport, database, UITP, Brussels.
© OECD/IEA 2016
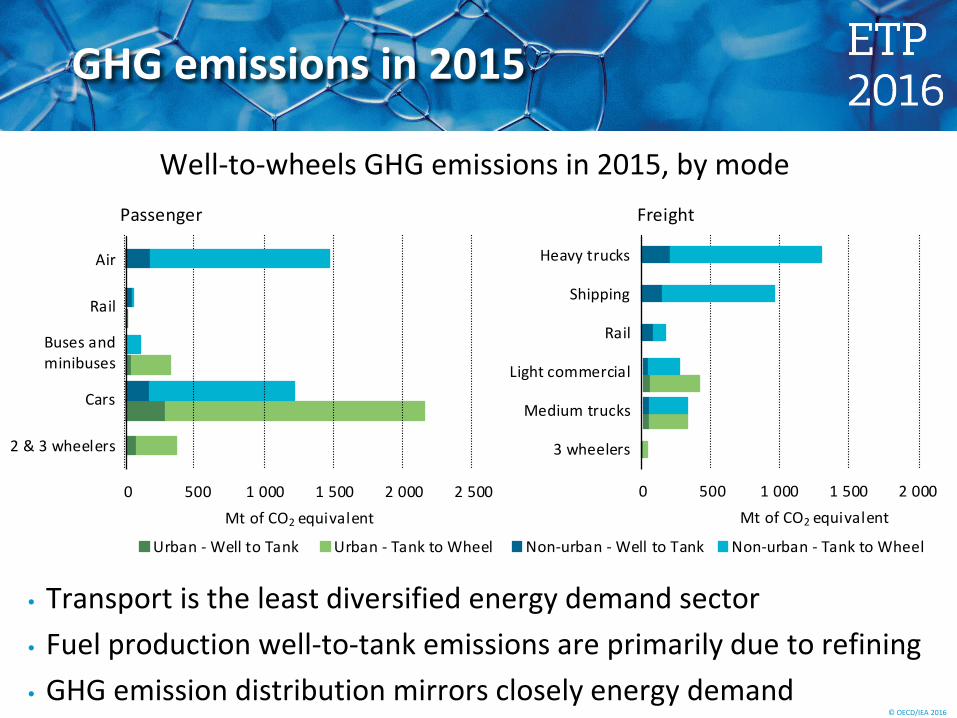
GHG emissions in 2015
• Transport is the least diversified energy demand sector • Fuel production well-to-tank emissions are primarily due to refining • GHG emission distribution mirrors closely energy demand
Non-urban - Well to Tank Non-urban - Tank to Wheel
0 500 1 000 1 500 2 000
3 wheelers
Medium trucks
Light commercial
Rail
Shipping
Heavy trucks
Mt of CO2 equivalent 0 500 1 000 1 500 2 000 2 500
2 & 3 wheelers
Cars
Buses andminibuses
Rail
Air
Mt of CO2 equivalent
Urban - Well to Tank Urban - Tank to Wheel
Passenger Freight
Well-to-wheels GHG emissions in 2015, by mode
© OECD/IEA 2016
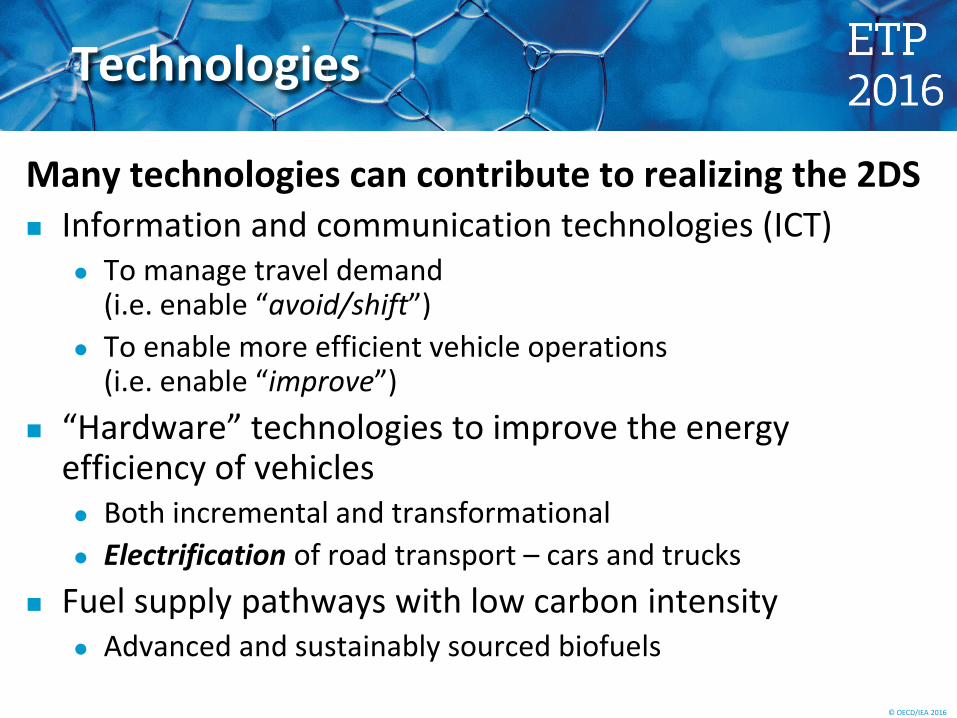
Technologies
Many technologies can contribute to realizing the 2DS Information and communication technologies (ICT)
To manage travel demand (i.e. enable “avoid/shift”)
To enable more efficient vehicle operations (i.e. enable “improve”)
“Hardware” technologies to improve the energy efficiency of vehicles Both incremental and transformational Electrification of road transport – cars and trucks
Fuel supply pathways with low carbon intensity Advanced and sustainably sourced biofuels
© OECD/IEA 2016
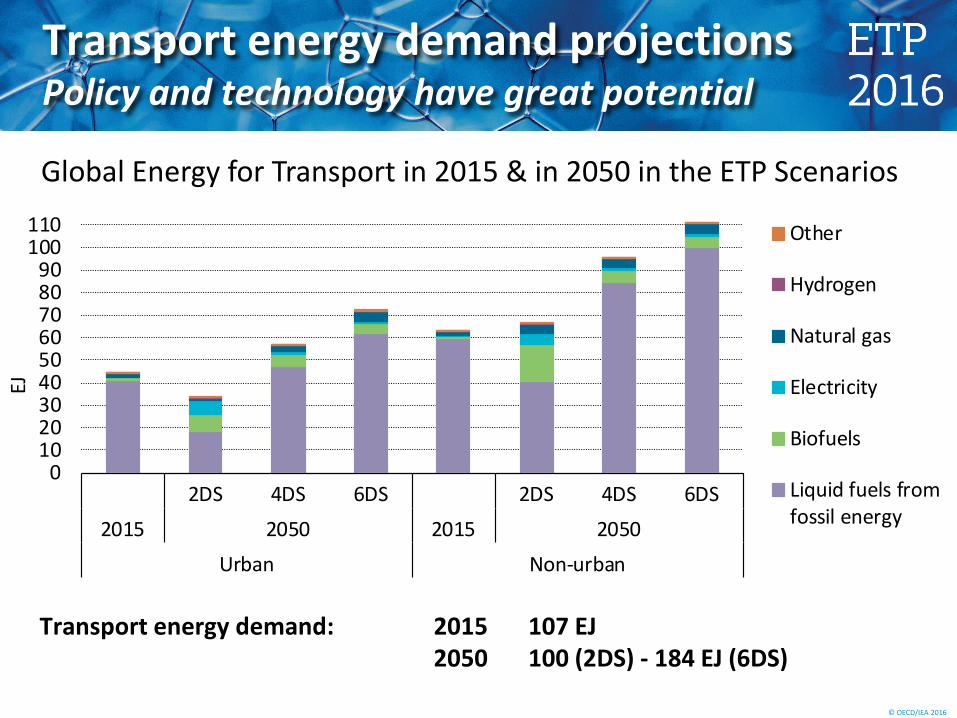
Transport energy demand projections Policy and technology have great potential
Transport energy demand: 2015 107 EJ 2050 100 (2DS) - 184 EJ (6DS)
0 10 20 30 40 50 60 70 80 90
100 110
2DS 4DS 6DS 2DS 4DS 6DS2015 2050 2015 2050
Urban Non-urban
EJ
Other
Hydrogen
Natural gas
Electricity
Biofuels
Liquid fuels fromfossil energy
Global Energy for Transport in 2015 & in 2050 in the ETP Scenarios
© OECD/IEA 2016
0
2
4
6
8
10
12
2010 2020 2030 2040 2050
GtCO
2-eq
OECD
2DS
4DS6DS
0
2
4
6
8
10
12
2010 2020 2030 2040 2050
Non-OECD6DS
4DS
2DS
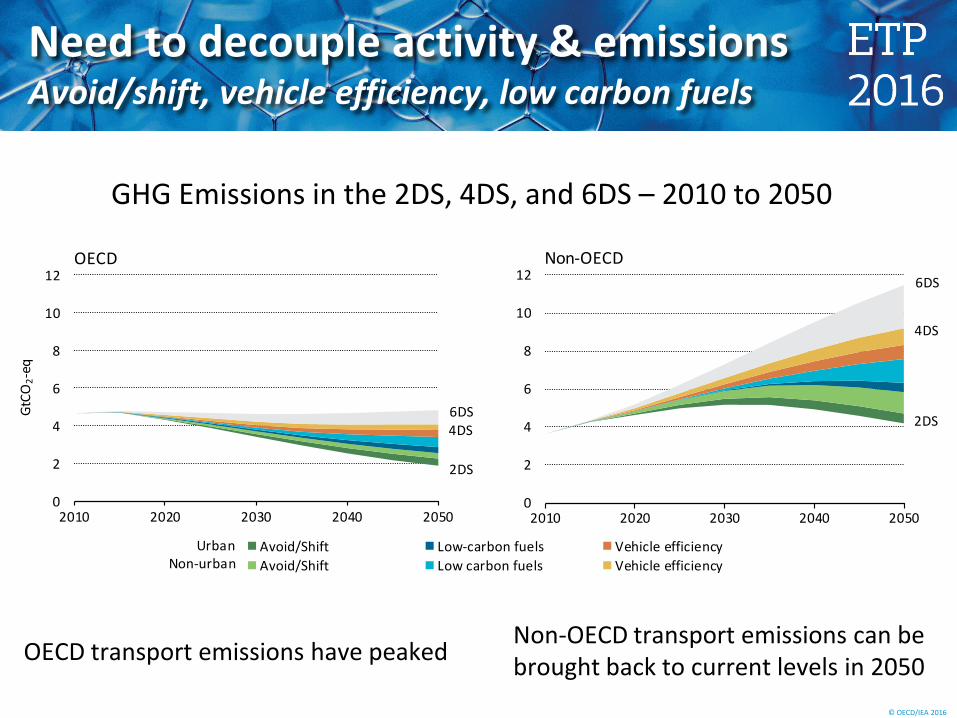
Avoid/Shift Low-carbon fuels Vehicle efficiencyAvoid/Shift Low carbon fuels Vehicle efficiency
UrbanNon-urban
Need to decouple activity & emissions Avoid/shift, vehicle efficiency, low carbon fuels
OECD transport emissions have peaked Non-OECD transport emissions can be brought back to current levels in 2050
GHG Emissions in the 2DS, 4DS, and 6DS – 2010 to 2050
© OECD/IEA 2016
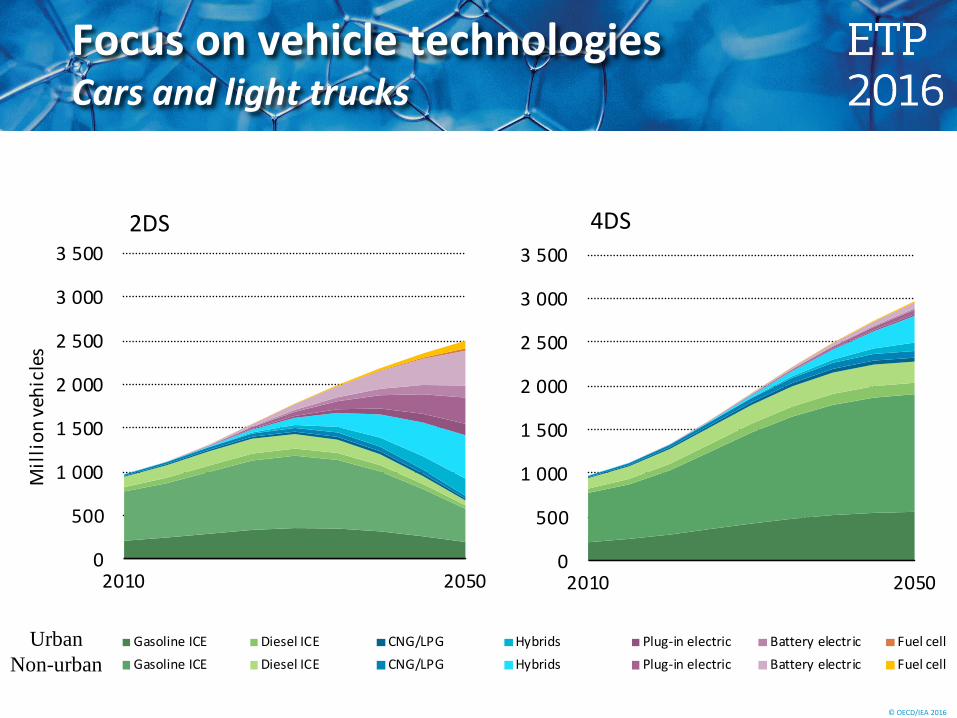
Focus on vehicle technologies Cars and light trucks
0
500
1 000
1 500
2 000
2 500
3 000
3 500
2010 2050
Mill
ion
vehi
cles
2DS
5
1
1
2
2
3
3
Gasoline ICE Diesel ICE CNG/LPG Hybrids Plug-in electric Battery electric Fuel cellGasoline ICE Diesel ICE CNG/LPG Hybrids Plug-in electric Battery electric Fuel cell
50
0
500
1 000
1 500
2 000
2 500
3 000
3 500
2010 2050
4DS
Urban Non-urban
© OECD/IEA 2016
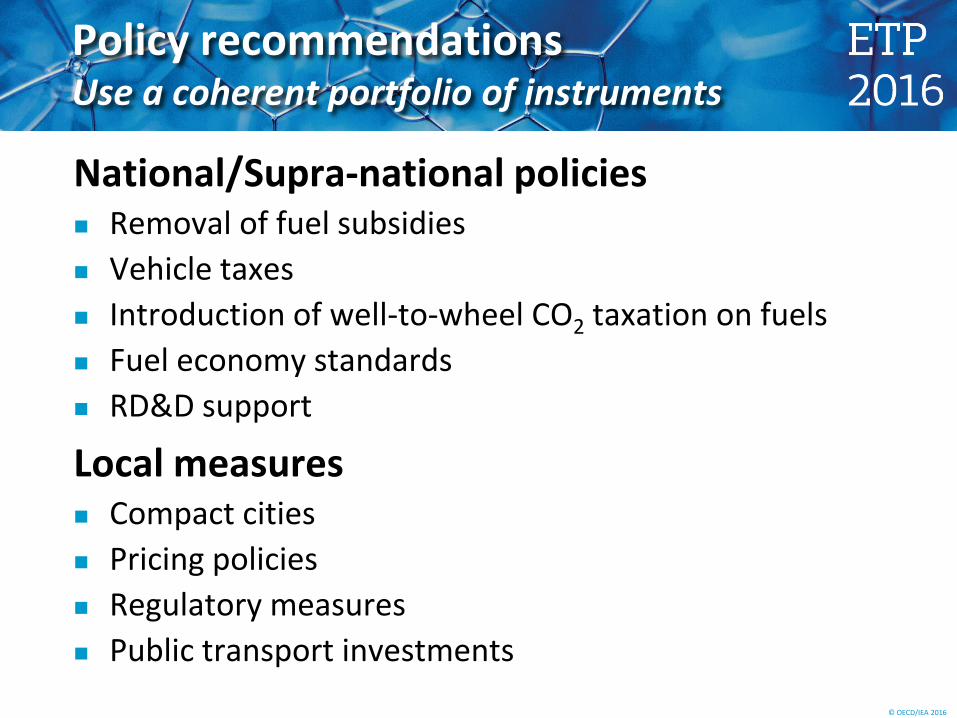
Policy recommendations Use a coherent portfolio of instruments
National/Supra-national policies Removal of fuel subsidies Vehicle taxes Introduction of well-to-wheel CO2 taxation on fuels Fuel economy standards RD&D support
Local measures Compact cities Pricing policies Regulatory measures Public transport investments
© OECD/IEA 2016
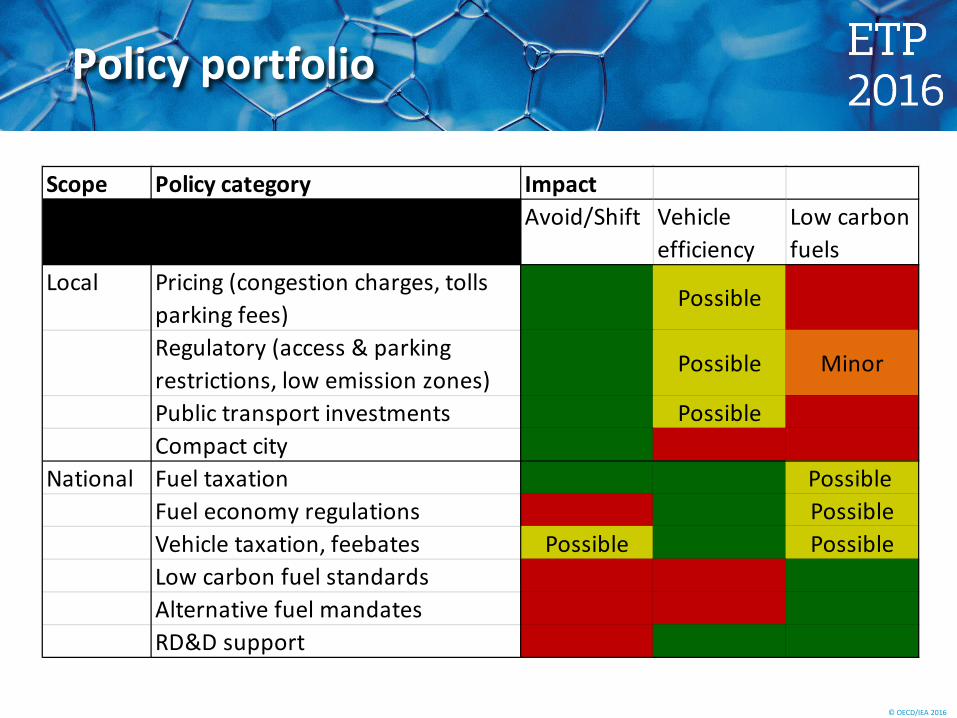
Policy portfolio
Scope Policy category ImpactAvoid/Shift Vehicle
efficiencyLow carbon fuels
Local Pricing (congestion charges, tolls parking fees)
Yes Possible none
Regulatory (access & parking restrictions, low emission zones)
Yes Possible Minor
Public transport investments Yes Possible noneCompact city Yes none none
National Fuel taxation Yes Yes Possible Fuel economy regulations none Yes PossibleVehicle taxation, feebates Possible Yes PossibleLow carbon fuel standards none none YesAlternative fuel mandates none none YesRD&D support none yes Yes
© OECD/IEA 2016
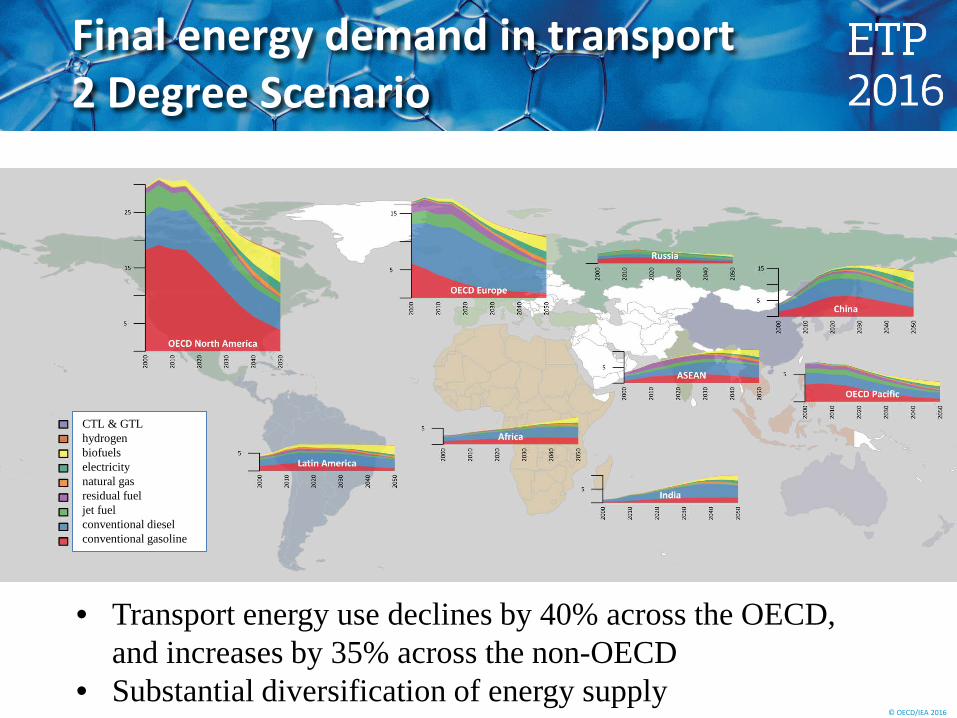
Final energy demand in transport 2 Degree Scenario
CTL & GTL hydrogen biofuels electricity natural gas residual fuel jet fuel conventional diesel conventional gasoline
• Transport energy use declines by 40% across the OECD, and increases by 35% across the non-OECD
• Substantial diversification of energy supply
© OECD/IEA 2016
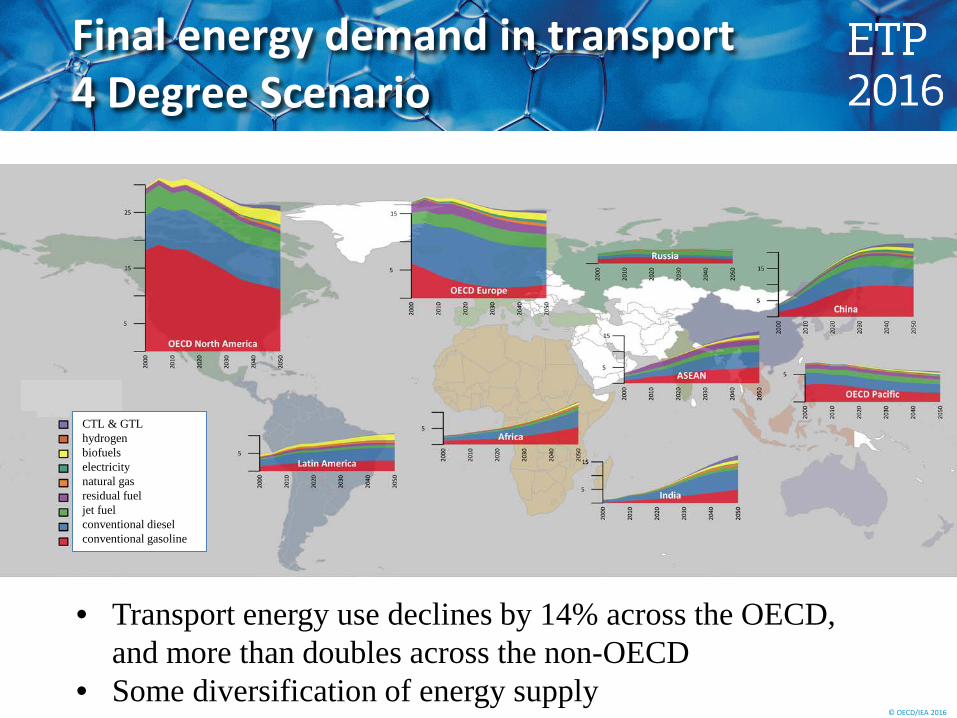
Final energy demand in transport 4 Degree Scenario
CTL & GTL hydrogen biofuels electricity natural gas residual fuel jet fuel conventional diesel conventional gasoline
• Transport energy use declines by 14% across the OECD, and more than doubles across the non-OECD
• Some diversification of energy supply
© OECD/IEA 2016
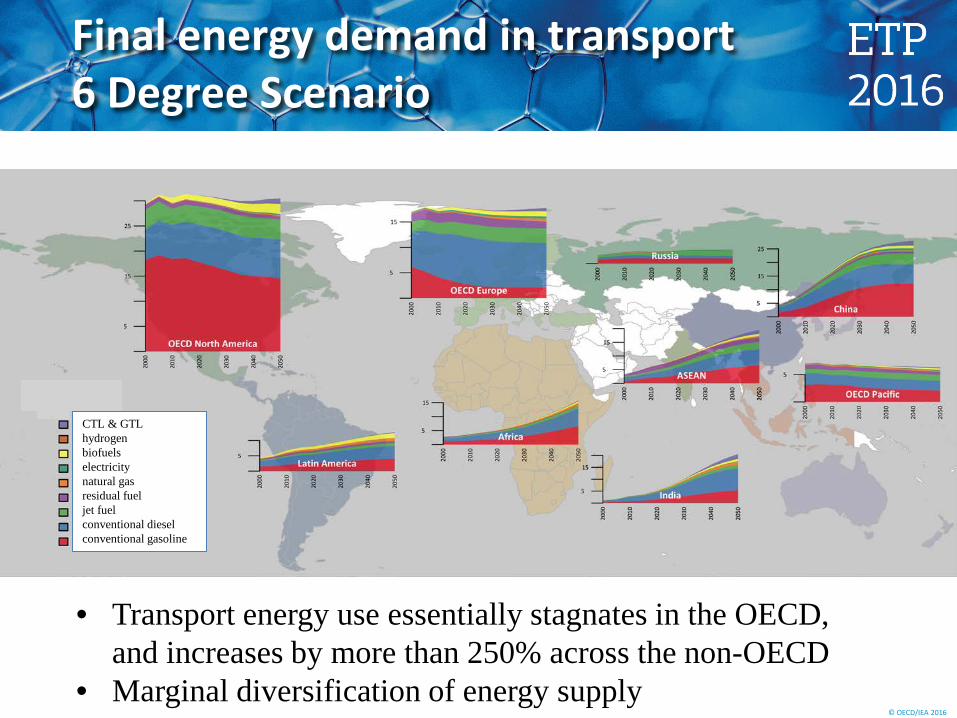
Final energy demand in transport 6 Degree Scenario
CTL & GTL hydrogen biofuels electricity natural gas residual fuel jet fuel conventional diesel conventional gasoline
• Transport energy use essentially stagnates in the OECD, and increases by more than 250% across the non-OECD
• Marginal diversification of energy supply
© OECD/IEA 2016
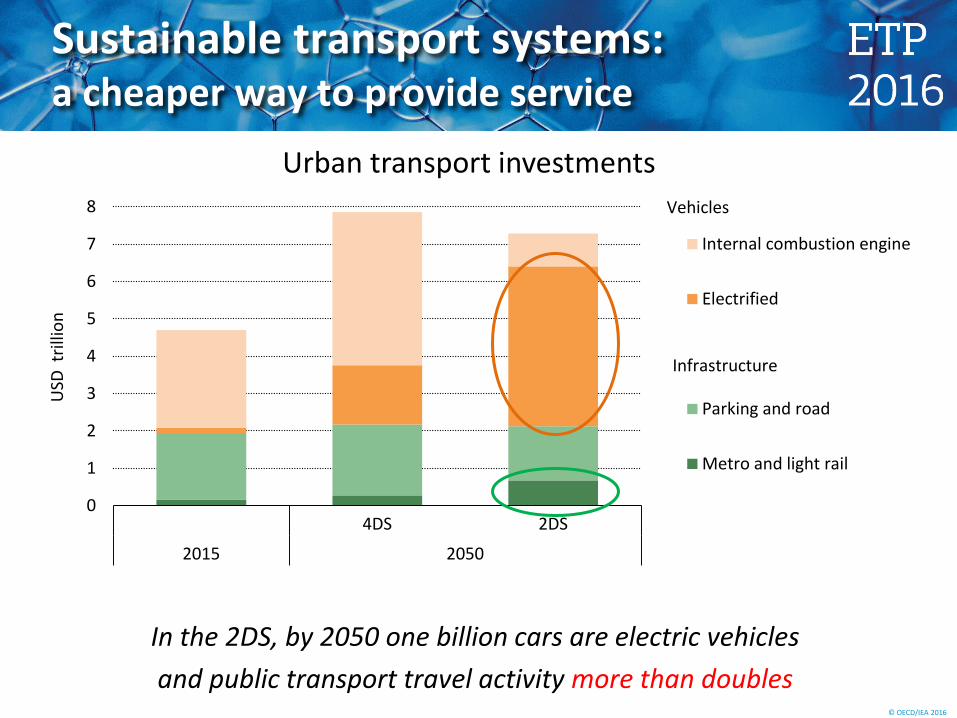
Sustainable transport systems: a cheaper way to provide service
Urban transport investments
In the 2DS, by 2050 one billion cars are electric vehicles and public transport travel activity more than doubles
0
1
2
3
4
5
6
7
8
4DS 2DS
2015 2050
USD
tril
lion
Internal combustion engine
Electrified
Parking and road
Metro and light rail
Infrastructure
Vehicles
© OECD/IEA 2016
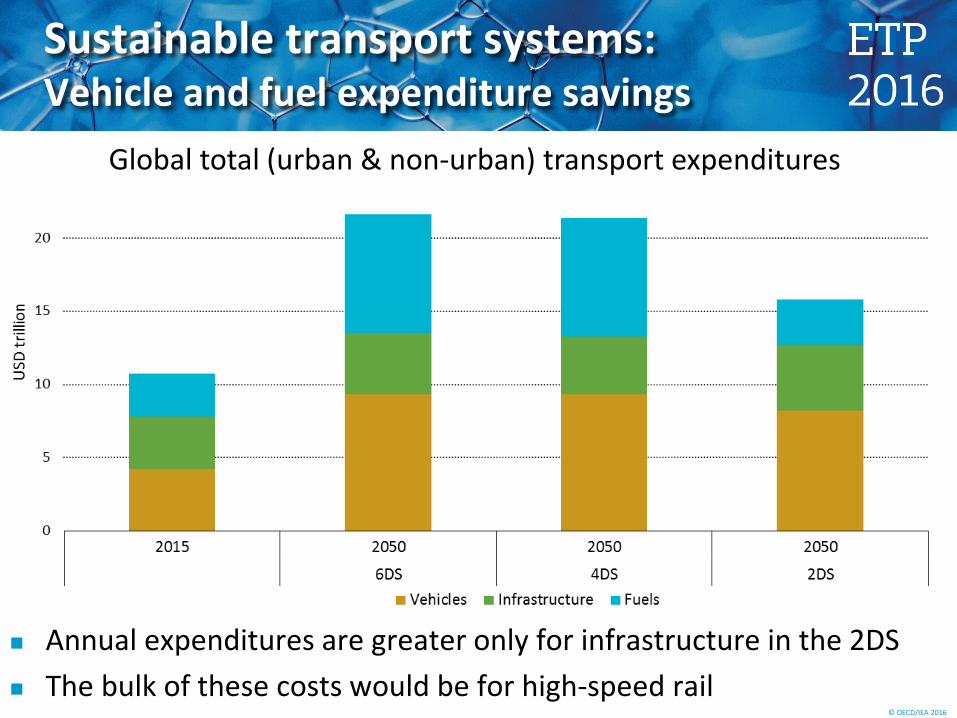
Sustainable transport systems: Vehicle and fuel expenditure savings
Annual expenditures are greater only for infrastructure in the 2DS The bulk of these costs would be for high-speed rail
Global total (urban & non-urban) transport expenditures
© OECD/IEA 2016
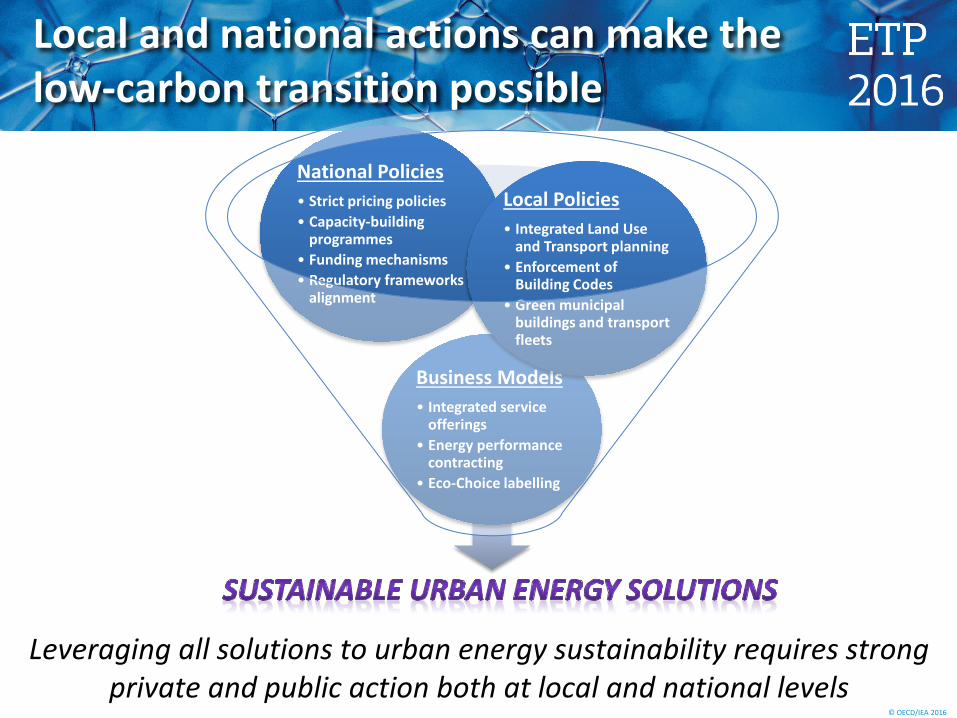
Local and national actions can make the low-carbon transition possible
Leveraging all solutions to urban energy sustainability requires strong private and public action both at local and national levels
Business Models • Integrated service
offerings • Energy performance
contracting • Eco-Choice labelling
National Policies • Strict pricing policies • Capacity-building
programmes • Funding mechanisms • Regulatory frameworks
alignment
Local Policies • Integrated Land Use
and Transport planning • Enforcement of
Building Codes • Green municipal
buildings and transport fleets
© OECD/IEA 2016 © OECD/IEA 2015
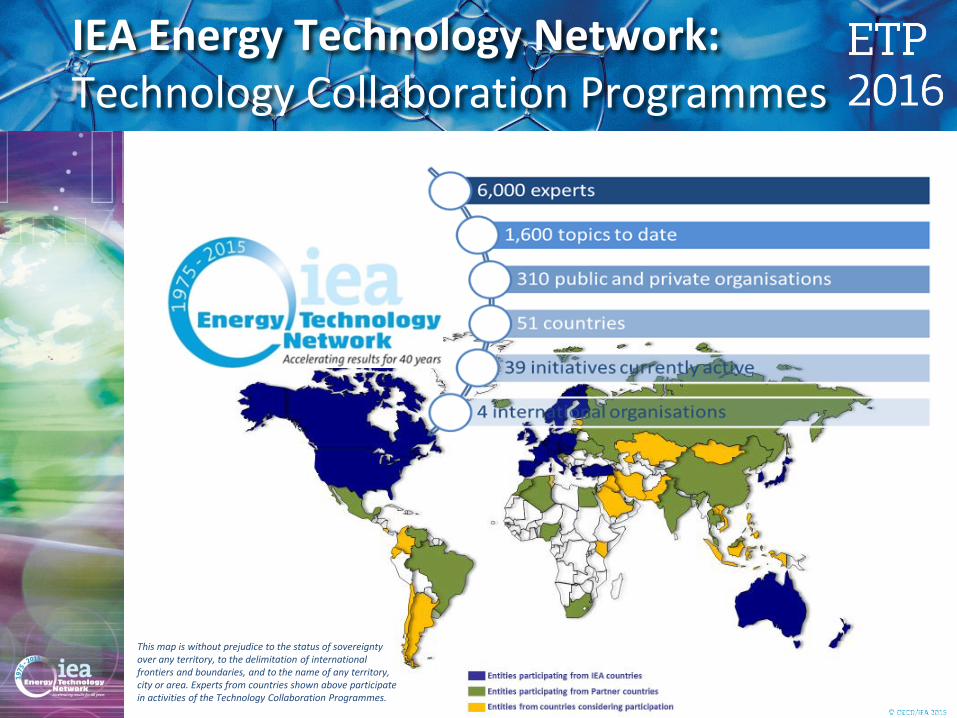
This map is without prejudice to the status of sovereignty over any territory, to the delimitation of international frontiers and boundaries, and to the name of any territory, city or area. Experts from countries shown above participate in activities of the Technology Collaboration Programmes.
IEA Energy Technology Network: Technology Collaboration Programmes
© OECD/IEA 2016
Thank you
© OECD/IEA 2016
Supplemental Slides and further discussion
The Mobility Model (MoMo) ETP 2016 methods More detailed results from ETP 2016 Highlights of other recent publications
Global Electric Vehicle Outlook Energy and Air Quality, WEO Special Report Global Fuel Economy Initiative
Upcoming projects Trucks WB2DS
© OECD/IEA 2016
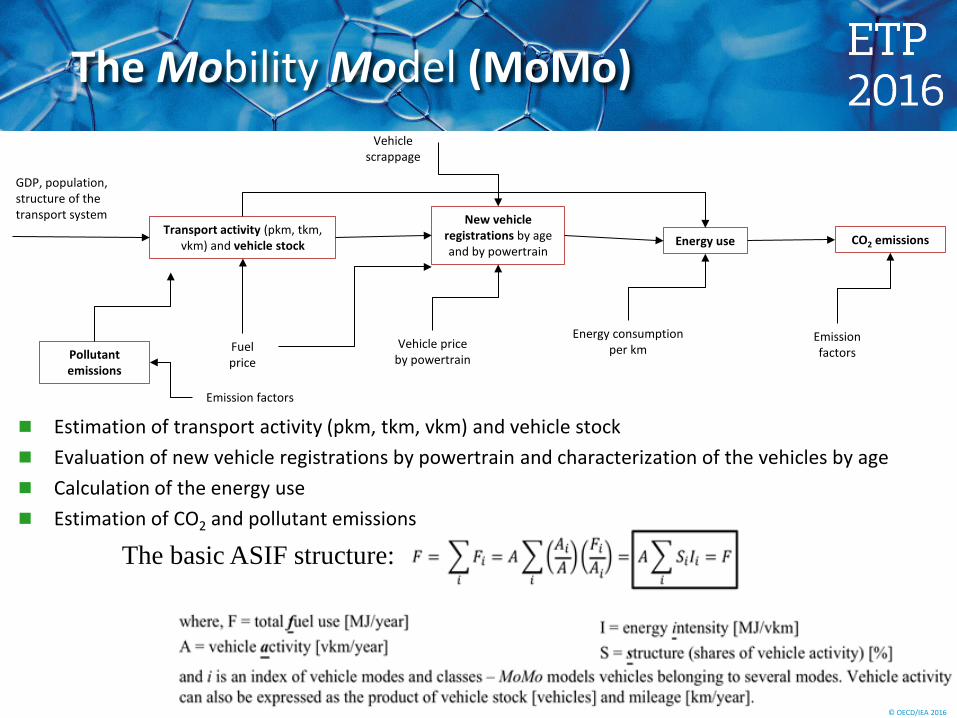
Estimation of transport activity (pkm, tkm, vkm) and vehicle stock Evaluation of new vehicle registrations by powertrain and characterization of the vehicles by age Calculation of the energy use Estimation of CO2 and pollutant emissions
The Mobility Model (MoMo)
Transport activity (pkm, tkm, vkm) and vehicle stock
New vehicle registrations by age and by powertrain
Energy use CO2 emissions
Emission factors
Energy consumption per km Vehicle price
by powertrain
GDP, population, structure of the transport system
Vehicle scrappage
Fuel price
Emission factors
Pollutant emissions
The basic ASIF structure:
© OECD/IEA 2016
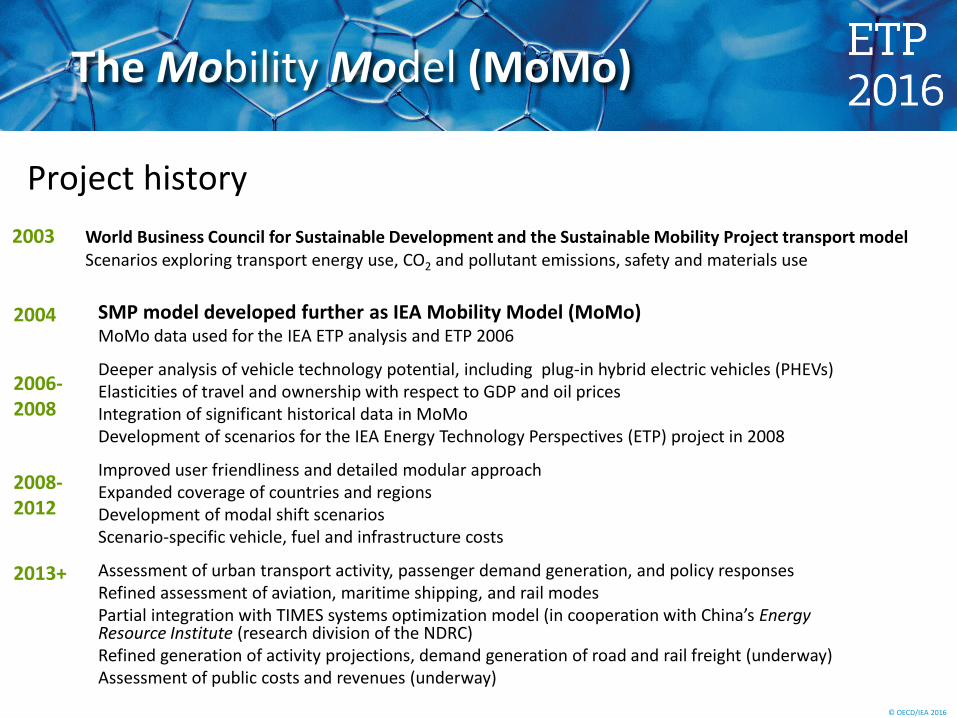
2003 World Business Council for Sustainable Development and the Sustainable Mobility Project transport model Scenarios exploring transport energy use, CO2 and pollutant emissions, safety and materials use
SMP model developed further as IEA Mobility Model (MoMo) MoMo data used for the IEA ETP analysis and ETP 2006
Deeper analysis of vehicle technology potential, including plug-in hybrid electric vehicles (PHEVs) Elasticities of travel and ownership with respect to GDP and oil prices Integration of significant historical data in MoMo Development of scenarios for the IEA Energy Technology Perspectives (ETP) project in 2008
Improved user friendliness and detailed modular approach Expanded coverage of countries and regions Development of modal shift scenarios Scenario-specific vehicle, fuel and infrastructure costs
Assessment of urban transport activity, passenger demand generation, and policy responses Refined assessment of aviation, maritime shipping, and rail modes Partial integration with TIMES systems optimization model (in cooperation with China’s Energy Resource Institute (research division of the NDRC) Refined generation of activity projections, demand generation of road and rail freight (underway) Assessment of public costs and revenues (underway)
2004
2006- 2008 2008- 2012
2013+
Project history
The Mobility Model (MoMo)
© OECD/IEA 2016
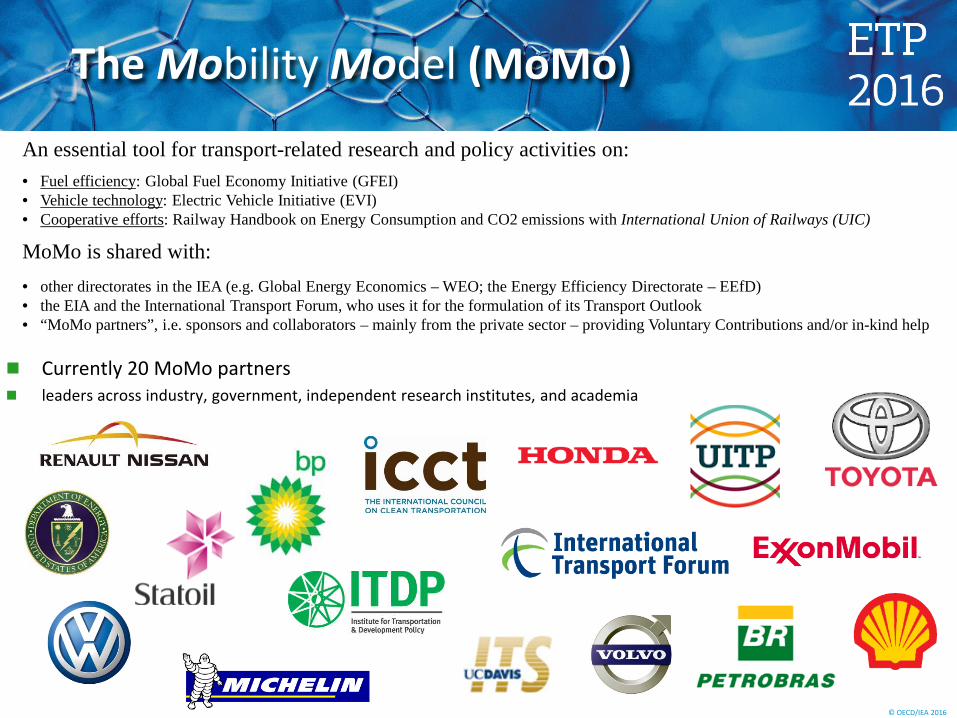
Currently 20 MoMo partners leaders across industry, government, independent research institutes, and academia
An essential tool for transport-related research and policy activities on:
• Fuel efficiency: Global Fuel Economy Initiative (GFEI) • Vehicle technology: Electric Vehicle Initiative (EVI) • Cooperative efforts: Railway Handbook on Energy Consumption and CO2 emissions with International Union of Railways (UIC)
MoMo is shared with:
• other directorates in the IEA (e.g. Global Energy Economics – WEO; the Energy Efficiency Directorate – EEfD) • the EIA and the International Transport Forum, who uses it for the formulation of its Transport Outlook • “MoMo partners”, i.e. sponsors and collaborators – mainly from the private sector – providing Voluntary Contributions and/or in-kind help
The Mobility Model (MoMo)
© OECD/IEA 2016
ETP 2016 Methods
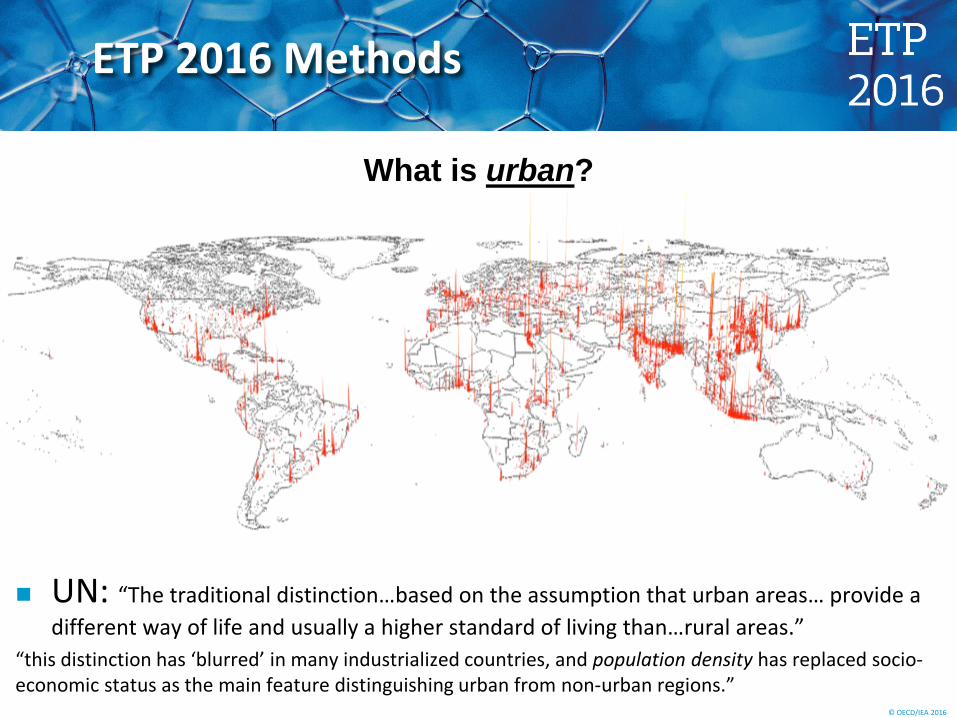
What is urban?
UN: “The traditional distinction…based on the assumption that urban areas… provide a different way of life and usually a higher standard of living than…rural areas.”
“this distinction has ‘blurred’ in many industrialized countries, and population density has replaced socio-economic status as the main feature distinguishing urban from non-urban regions.”
© OECD/IEA 2016
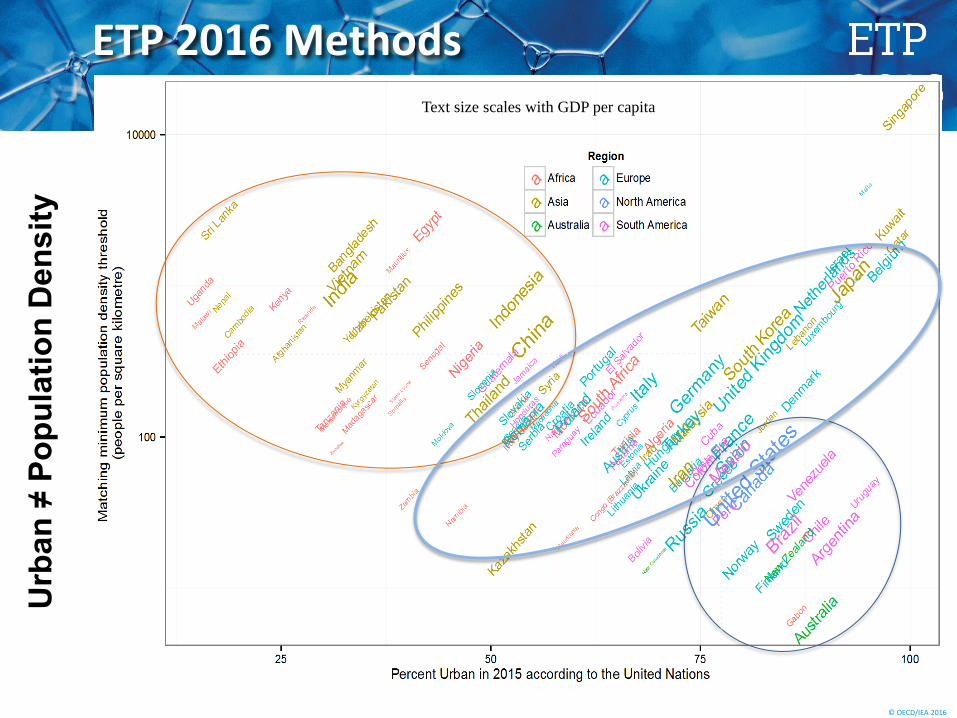
Text size scales with GDP per capita
Urb
an ≠
Pop
ulat
ion
Den
sity
ETP 2016 Methods
© OECD/IEA 2016
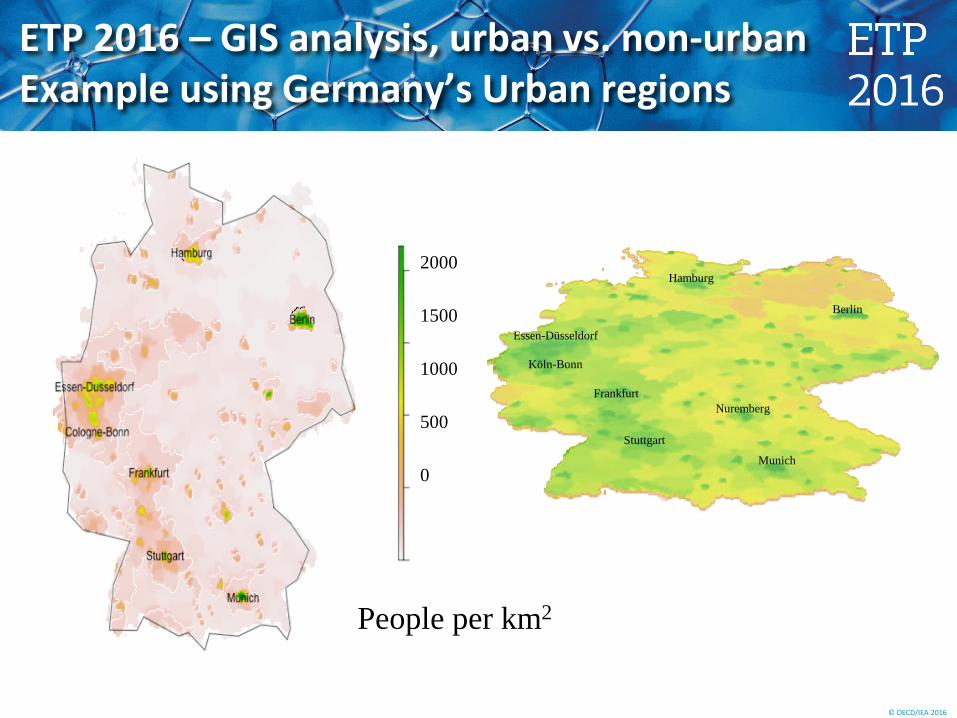
ETP 2016 – GIS analysis, urban vs. non-urban Example using Germany’s Urban regions
Munich
Berlin
Frankfurt
Stuttgart
Essen-Düsseldorf
Köln-Bonn
Hamburg
Nuremberg
People per km2
2000 1500 1000 500 0
© OECD/IEA 2016
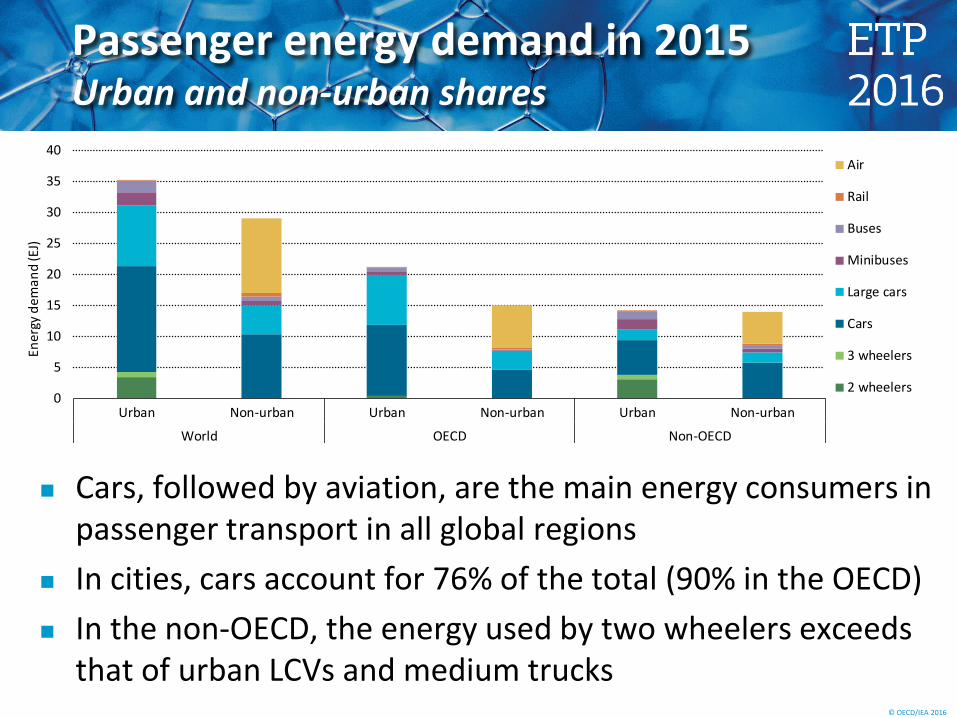
Passenger energy demand in 2015 Urban and non-urban shares
Cars, followed by aviation, are the main energy consumers in passenger transport in all global regions
In cities, cars account for 76% of the total (90% in the OECD) In the non-OECD, the energy used by two wheelers exceeds
that of urban LCVs and medium trucks
0
5
10
15
20
25
30
35
40
Urban Non-urban Urban Non-urban Urban Non-urban
World OECD Non-OECD
Ener
gy d
eman
d (E
J)
Air
Rail
Buses
Minibuses
Large cars
Cars
3 wheelers
2 wheelers
© OECD/IEA 2016
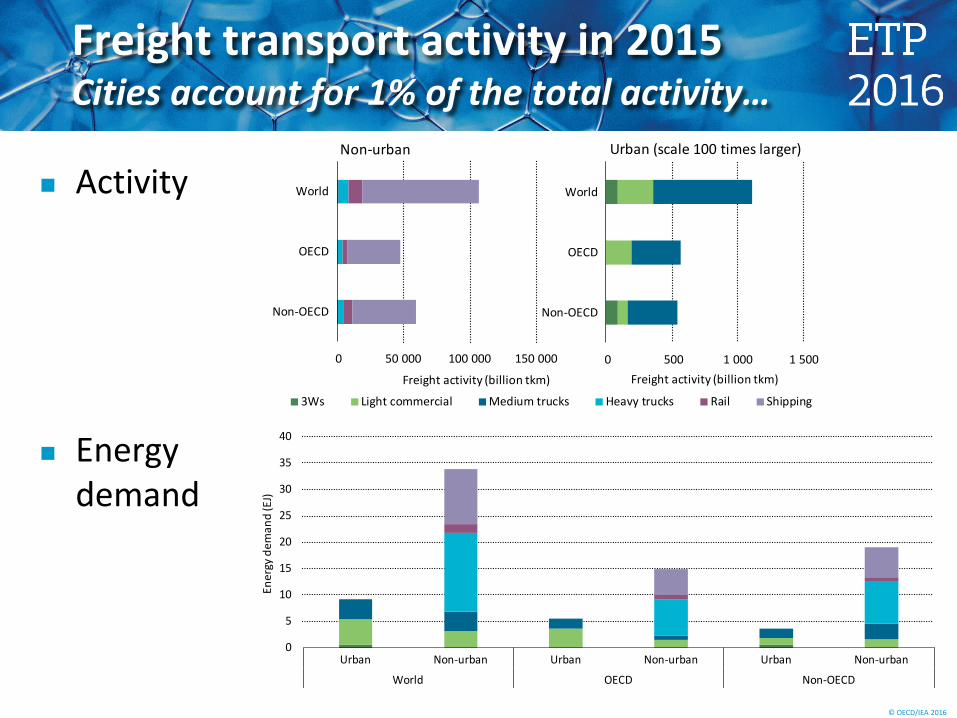
Freight transport activity in 2015 Cities account for 1% of the total activity…
0 50 000 100 000 150 000
Non-OECD
OECD
World
Freight activity (billion tkm)
Non-urban
3Ws Light commercial Medium trucks Heavy trucks Rail Shipping
0 500 1 000 1 500
Non-OECD
OECD
World
Freight activity (billion tkm)
Urban (scale 100 times larger)
0
5
10
15
20
25
30
35
40
Urban Non-urban Urban Non-urban Urban Non-urban
World OECD Non-OECD
Ener
gy d
eman
d (E
J)
Activity
Energy demand
© OECD/IEA 2016
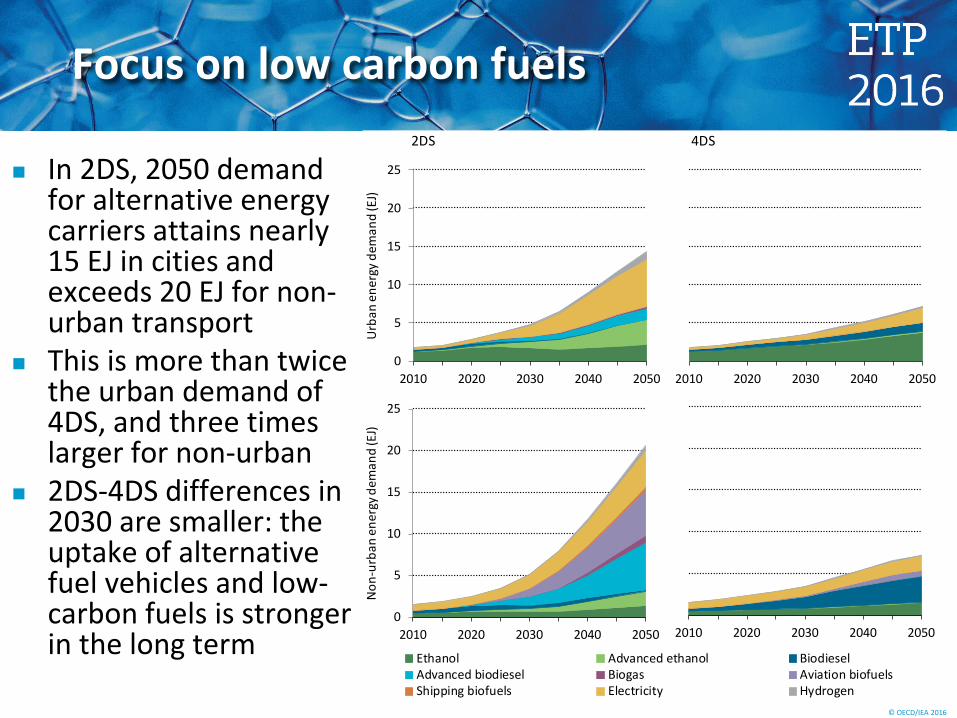
Focus on low carbon fuels
In 2DS, 2050 demand for alternative energy carriers attains nearly 15 EJ in cities and exceeds 20 EJ for non-urban transport
This is more than twice the urban demand of 4DS, and three times larger for non-urban
2DS-4DS differences in 2030 are smaller: the uptake of alternative fuel vehicles and low-carbon fuels is stronger in the long term
2DS 4DS
0
5
10
15
20
25
2010 2020 2030 2040 2050
Non
-urb
an e
nerg
y dem
and
(EJ)
Ethanol Advanced ethanol BiodieselAdvanced biodiesel Biogas Aviation biofuelsShipping biofuels Electricity Hydrogen
0
5
10
15
20
25
2010 2020 2030 2040 2050U
rban
ene
rgy
dem
and
(EJ)
2010 2020 2030 2040 2050
2010 2020 2030 2040 2050
© OECD/IEA 2016
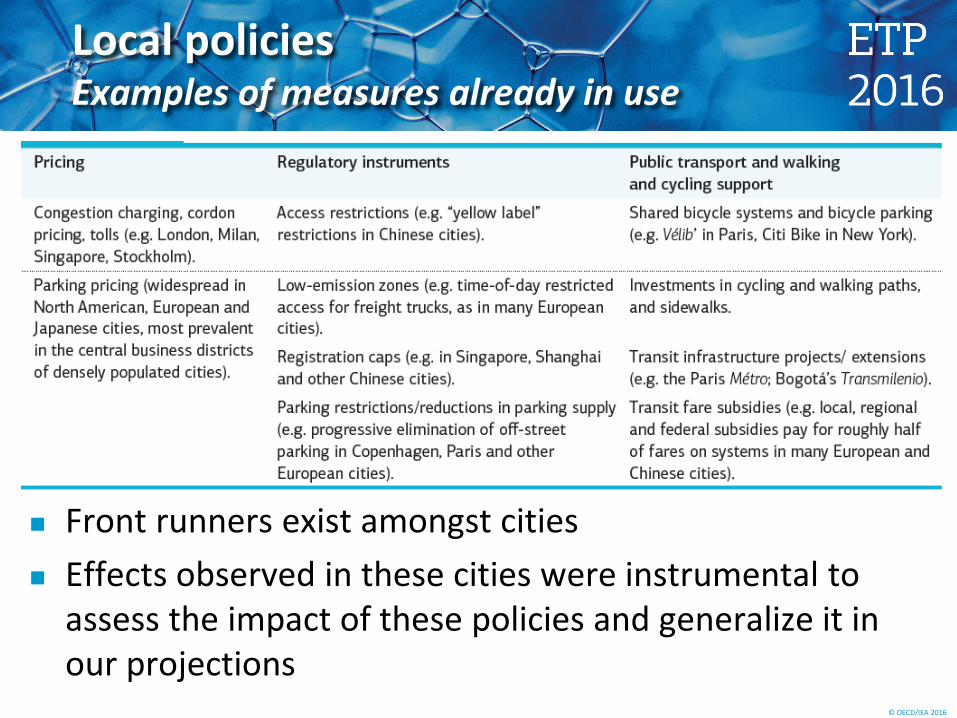
Local policies Examples of measures already in use
Front runners exist amongst cities Effects observed in these cities were instrumental to
assess the impact of these policies and generalize it in our projections
© OECD/IEA 2016
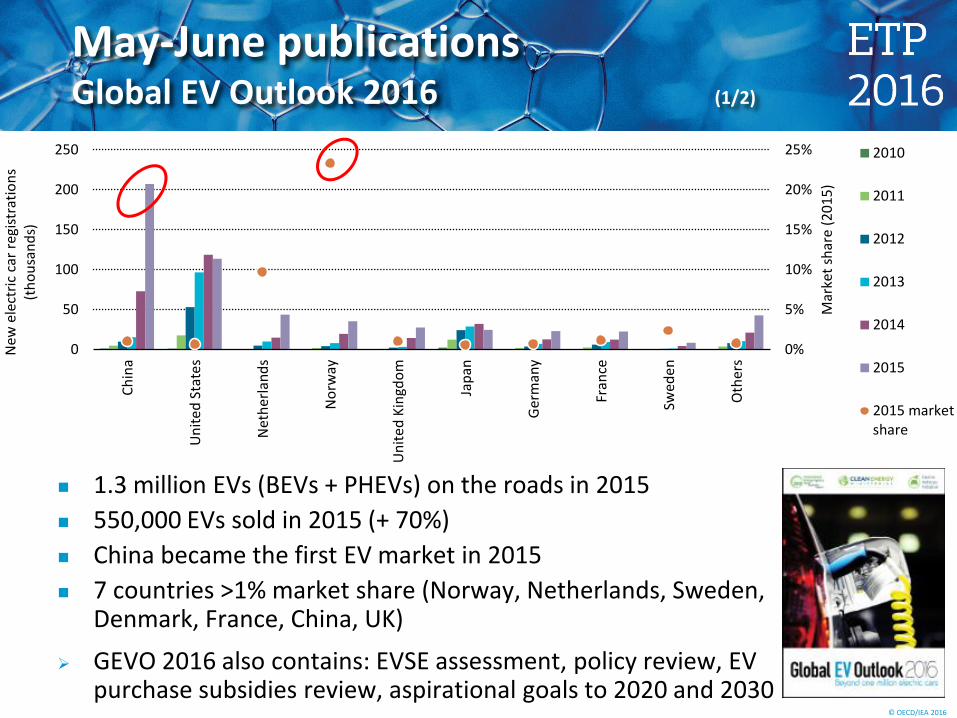
May-June publications Global EV Outlook 2016 (1/2)
1.3 million EVs (BEVs + PHEVs) on the roads in 2015 550,000 EVs sold in 2015 (+ 70%) China became the first EV market in 2015 7 countries >1% market share (Norway, Netherlands, Sweden,
Denmark, France, China, UK)
GEVO 2016 also contains: EVSE assessment, policy review, EV purchase subsidies review, aspirational goals to 2020 and 2030
0%
5%
10%
15%
20%
25%
0
50
100
150
200
250Ch
ina
Uni
ted
Stat
es
Net
herla
nds
Nor
way
Uni
ted
King
dom
Japa
n
Ger
man
y
Fran
ce
Swed
en
Oth
ers
Mar
ket s
hare
(201
5)
New
ele
ctric
car
regi
stra
tions
(t
hous
ands
)
2010
2011
2012
2013
2014
2015
2015 marketshare
© OECD/IEA 2016
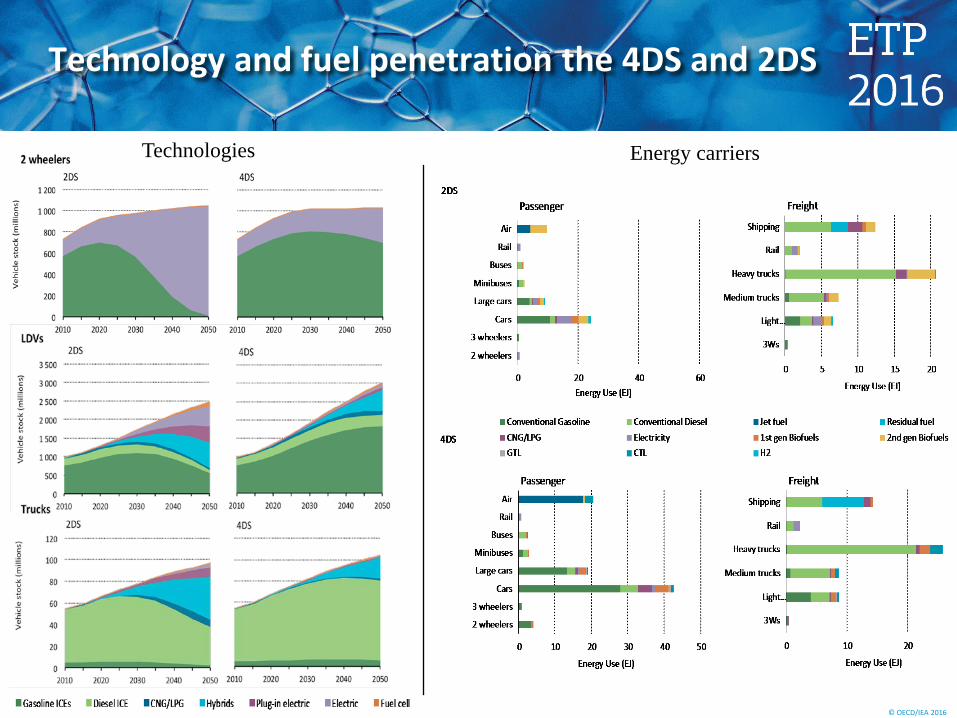
Technology and fuel penetration the 4DS and 2DS
Technologies Energy carriers
© OECD/IEA 2016
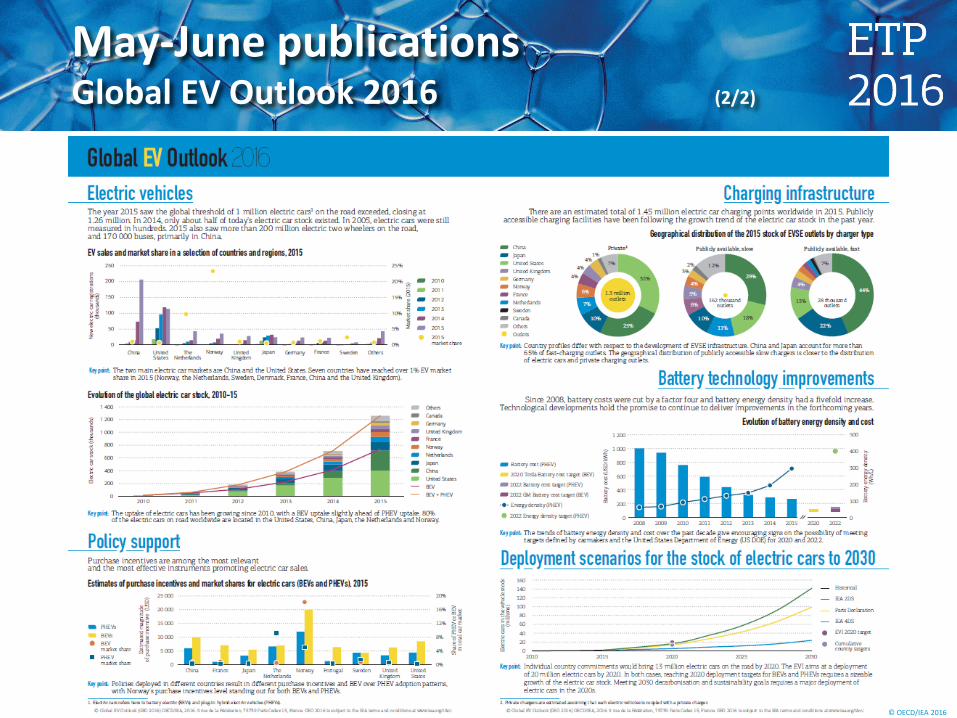
May-June publications Global EV Outlook 2016 (2/2)
© OECD/IEA 2016
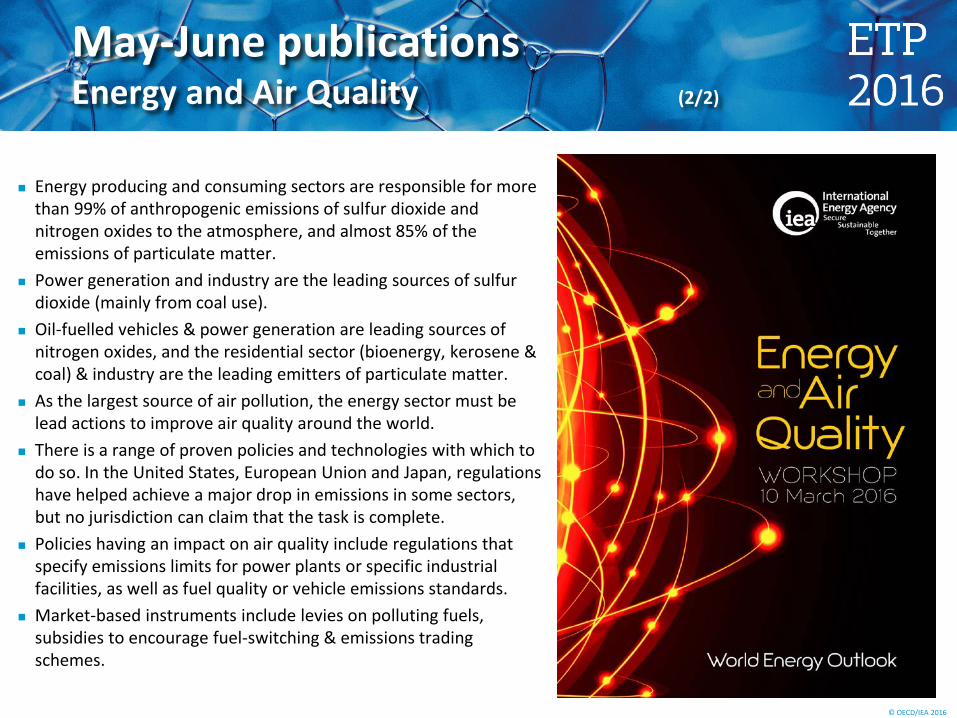
May-June publications Energy and Air Quality (2/2)
Energy producing and consuming sectors are responsible for more than 99% of anthropogenic emissions of sulfur dioxide and nitrogen oxides to the atmosphere, and almost 85% of the emissions of particulate matter.
Power generation and industry are the leading sources of sulfur dioxide (mainly from coal use).
Oil-fuelled vehicles & power generation are leading sources of nitrogen oxides, and the residential sector (bioenergy, kerosene & coal) & industry are the leading emitters of particulate matter.
As the largest source of air pollution, the energy sector must be lead actions to improve air quality around the world.
There is a range of proven policies and technologies with which to do so. In the United States, European Union and Japan, regulations have helped achieve a major drop in emissions in some sectors, but no jurisdiction can claim that the task is complete.
Policies having an impact on air quality include regulations that specify emissions limits for power plants or specific industrial facilities, as well as fuel quality or vehicle emissions standards.
Market-based instruments include levies on polluting fuels, subsidies to encourage fuel-switching & emissions trading schemes.
© OECD/IEA 2016
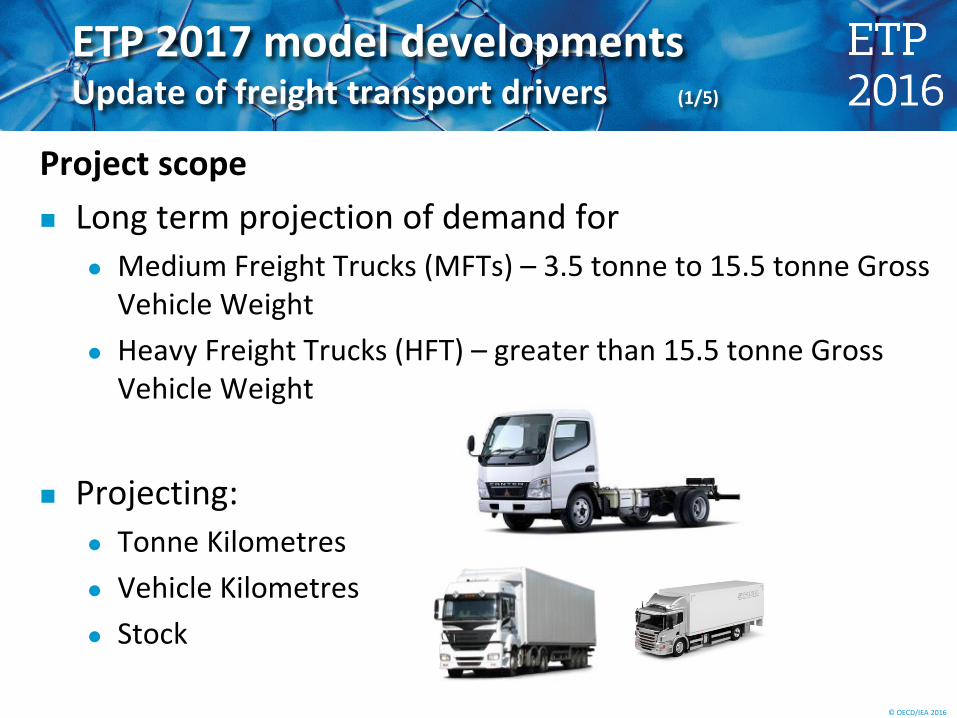
ETP 2017 model developments Update of freight transport drivers (1/5)
Project scope Long term projection of demand for
Medium Freight Trucks (MFTs) – 3.5 tonne to 15.5 tonne Gross Vehicle Weight
Heavy Freight Trucks (HFT) – greater than 15.5 tonne Gross Vehicle Weight
Projecting:
Tonne Kilometres Vehicle Kilometres Stock
© OECD/IEA 2016
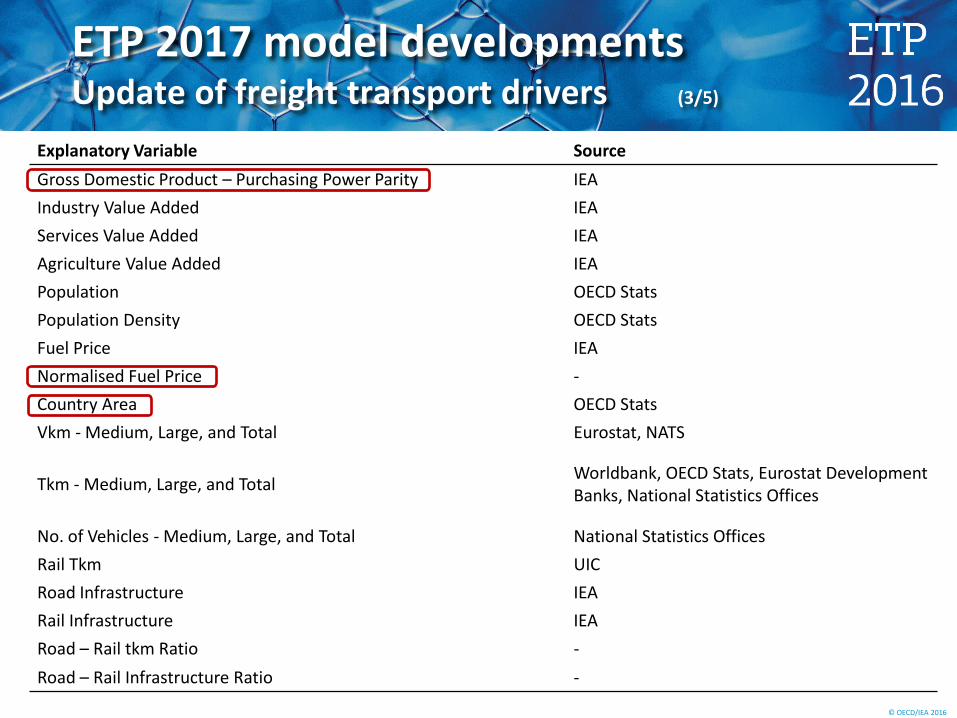
ETP 2017 model developments Update of freight transport drivers (3/5)
Explanatory Variable Source Gross Domestic Product – Purchasing Power Parity IEA Industry Value Added IEA Services Value Added IEA Agriculture Value Added IEA Population OECD Stats Population Density OECD Stats Fuel Price IEA Normalised Fuel Price - Country Area OECD Stats Vkm - Medium, Large, and Total Eurostat, NATS
Tkm - Medium, Large, and Total Worldbank, OECD Stats, Eurostat Development Banks, National Statistics Offices
No. of Vehicles - Medium, Large, and Total National Statistics Offices Rail Tkm UIC Road Infrastructure IEA Rail Infrastructure IEA Road – Rail tkm Ratio - Road – Rail Infrastructure Ratio -
© OECD/IEA 2016
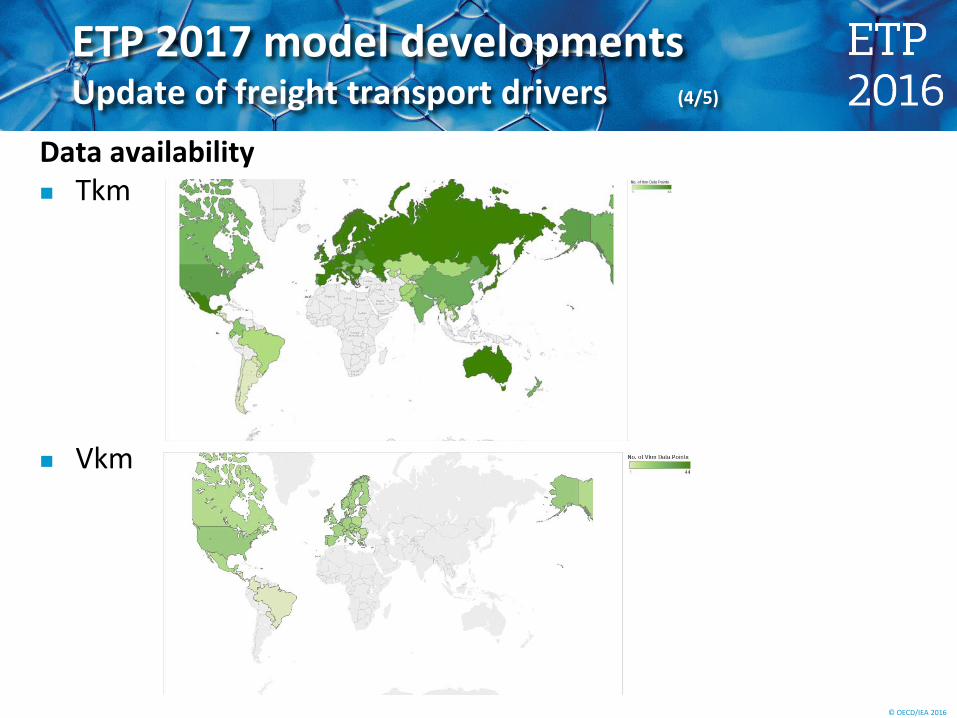
ETP 2017 model developments Update of freight transport drivers (4/5)
Data availability Tkm
Vkm