Energetic Limits to Economic Growth. - New Mexicans for Science
54
Ecology and Economics: It’s Also About Resources, Not Just Jobs and Deficits James H. Brown Department of Biology University of New Mexico Presentation to New Mexicans for Science and Reason 9 May 2012
Transcript of Energetic Limits to Economic Growth. - New Mexicans for Science

Ecology and Economics: It’s Also About Resources, Not Just Jobs and Deficits James H. Brown Department of BiologyUniversity of New Mexico
Presentation to New Mexicans for Science and Reason9 May 2012

OUT OF AFRICA INTO THE 21ST CENTURY

50,000 years of
• Exponential increase in population and resource use
• Global geographic expansion
• Unprecedented ecological dominance


How much longer can current trajectories of growth and development be maintained? Optimistic projections for 2050:• Population: 1-2% per year, 9-10 billion• Economy: 4% per year, “lift developing
countries out of poverty” These are exponentials which cannot be
continued indefinitely in a finite environment
Are “sustainability” and “sustainable development” assumptions, hypotheses, oxymorons?

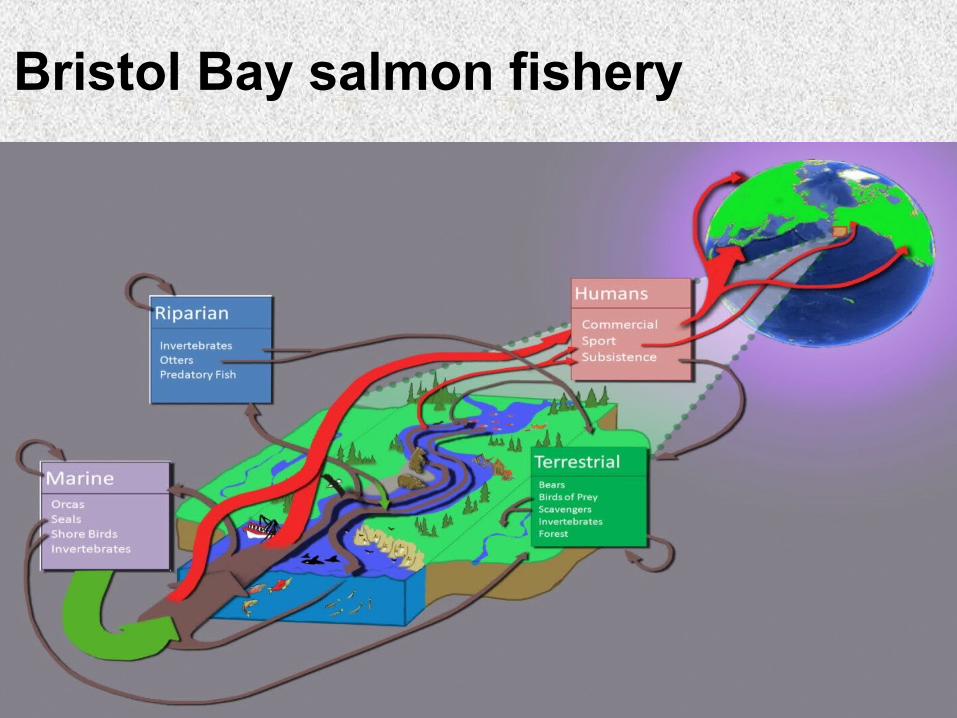
Icons of sustainability re-examined?Bristol Bay salmon fishery “a model of successful natural resource stewardship” State of Alaska http://www.adfg.alaska.gov
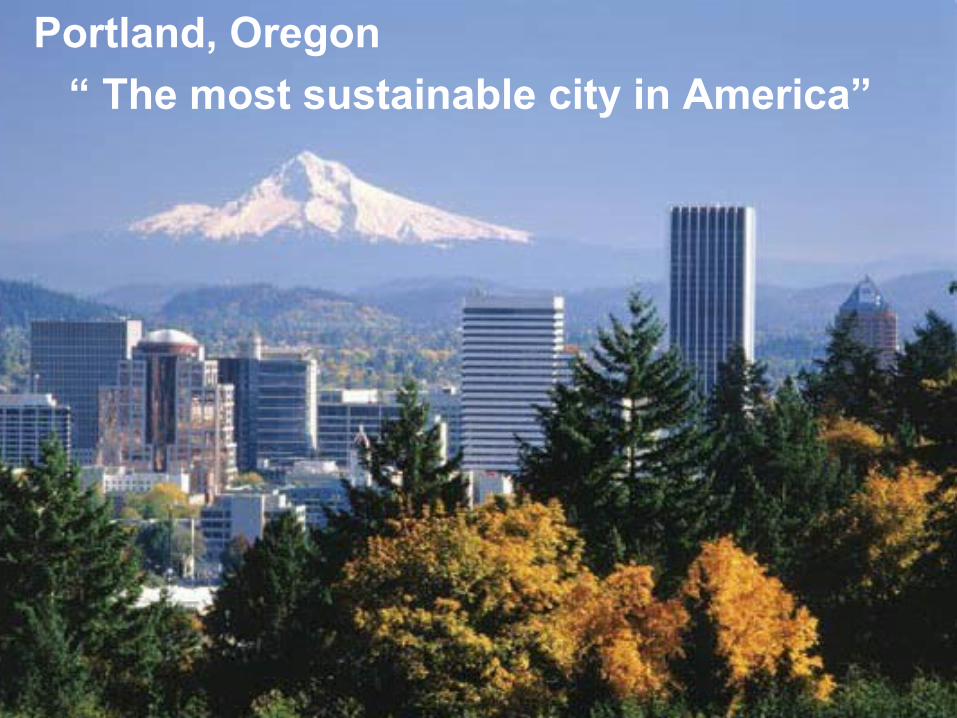
Portland, Oregon “ The most sustainable city in America”
SustainLane (2008) http://www.sustainlane. com/us-city-rankings/overall-rankings

Bristol Bay salmon fishery “A model of successful natural resource stewardship”

Bristol Bay salmon fishery70% of wild salmon harvested, sockeye 95% of catch
Evidence of sustainability• Harvests have been steady 2007-2009 Causes for concern• Export of 83,000 metric tonnes of salmon biomass: 12,000 t Carbon, 2,500 t Nitrogen, 330 t Phosphorus• In Lake Nerka “this loss of MDN (marine derived nutrients) has reduced lake algal productivity to about 1/3 of its level before commercial fishing” Schindler et al. (2005)• Effects on terrestrial and riparian ecosystems, predators, scavengers, subsistence fishers?
Bristol Bay salmon fishery
Portland, Oregon “ The most sustainable city in America”

Portland, OregonCity of Portland and Multnomah County• population 715,000, median income $51,000 Imports/consumes• 1.25 billion liters of gasoline• 28.8 billion megajoules of natural gas• 31.1 billion megajoules of electricity• 136 billion liters of water• 0.5 million tonnes of foodExports/releases• 8.5 million tonnes of carbon as CO2 • 99 billion liters of liquid sewage • 1 million tonnes of solid waste

Portland, Oregon

Humans have always used local ecosystems unsustainably
Importing resourcesEnergy, food, water, minerals
Exporting wastesCO2, sewage, chemical

GLOBAL SUSTAINABILITY:ENERGY AND ECONOMICS

Energy and economics
• Energy powers the economy
• GDP tracks per capita energy use across nations and over time
• Most energy comes from fossil fuels
• Implications for economic growth and “sustainable development”

Smil (2010)
Global population and energy use

Hirsch (2008)
Global economy and energy use

Data compiled and analyzed by M. Hamilton
Per-capita energy use vs. per capita GDP

Kleiber’s law: metabolic rate scales as 3/4 power of body mass (from Kleiber 1932)
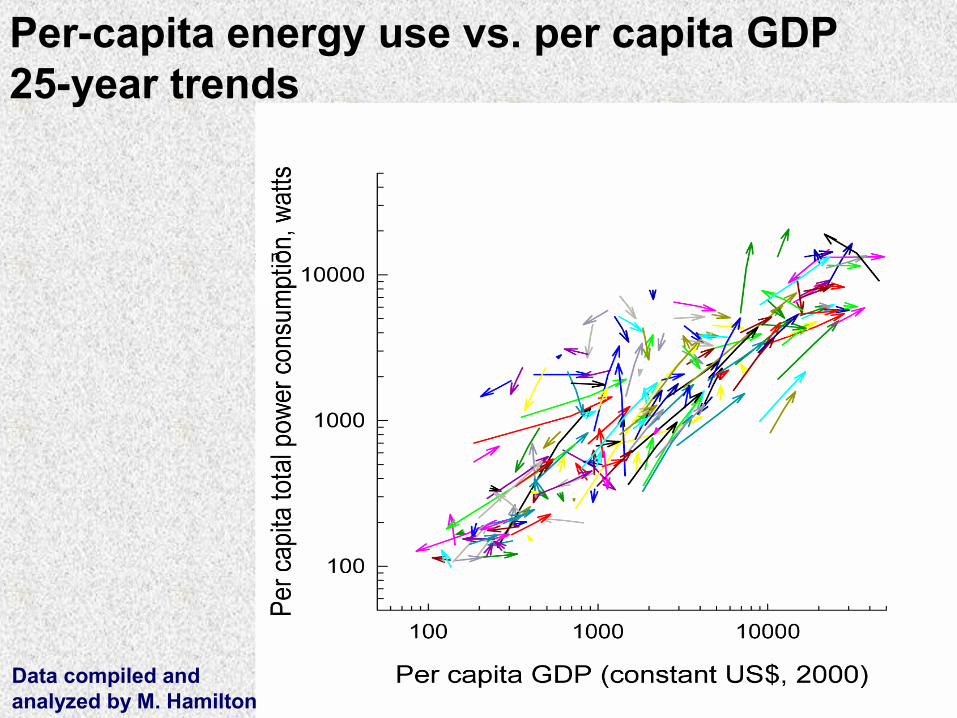
Per-capita energy use vs. per capita GDP25-year trends
Data compiled and analyzed by M. Hamilton

Problem: 1)Massive quantities of energy will be required for projected economic growth and development
Solutions:1)Increase supply to meet expected demand2)Reduce demand by reducing population3) Reduce demand by reducing consumption

Possible solutions
1) Increase supply of energy to meet expected demand
• How much energy will be required?
• Where will it come from?

Total annual global energy consumption in different economic scenarios
EJ factorworld current 524 1.0U.S. lifestyle 2440 4.7Chinese lifestyle 392 0.75current trends to 2025* 1142 2.2U.S. lifestyle in 2025* 5409 10.3Chinese lifestyle in 2025* 848 1.6
*Assumes 2025 world population of 8 billion (U.S. Census Bureau) and 3.8% per year increase in global GDP (World Resources Institute) Data compiled and analyzed by W. Zuo

Current global energy use
Source: Energy Information Agency, U.S. Dept. of Energy

Current global energy use
Fossil fuels 85% (oil, gas, coal)
“Renewables” 9% (solar, wind, geothermal, tidal)
Nuclear 6%
Source: Energy Information Agency, U.S. Dept. of Energy
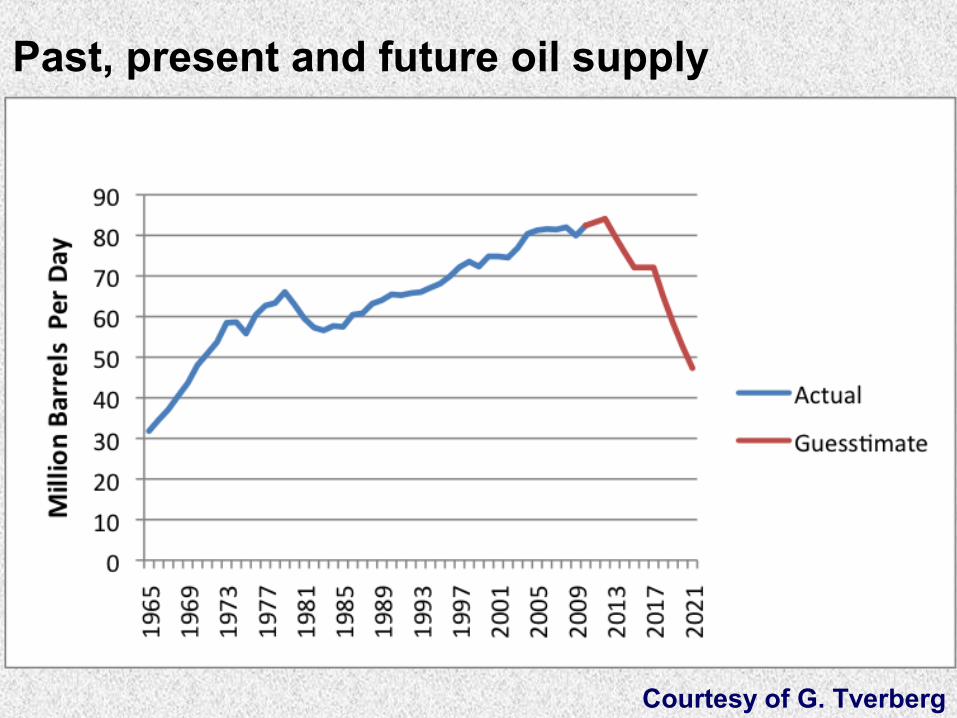
Courtesy of G. Tverberg
Past, present and future oil supply

Possible solutions
2) Reduce demand for energy by reducing population • take advantage of the “demographic
transition” (UN model) but see DeLong et al. 2010 (PLoS 1)
• something more drastic – like China’s one child policy?
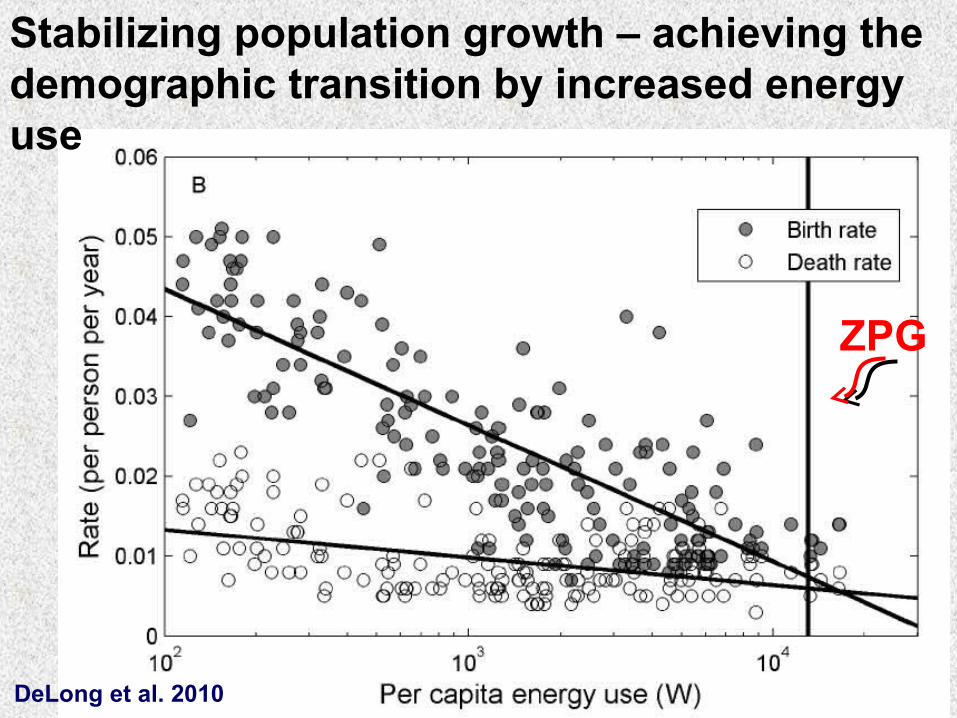
Stabilizing population growth – achieving the demographic transition by increased energy use
DeLong et al. 2010
ZPG

DeLong et al . 2010
past history UN model current trend redistribute energy
Projected population growth

Possible solutions
3) Reduce demand for energy by reducing per-capita consumption
• increase efficiency – limited gains and must counter “Jevon’s paradox”
• curtail lifestyle – “there is no such thing as a free lunch”

It is not just GDP
No such thing as a free lunch
Other metricsof quality of life are all correlated with GDP and energy use

It’s not just oil
Per capita rates of consumption of other critical resources aredecreasing
per capita
total

TRAGEDY OF THE COMMONS MARINE FISHERIES
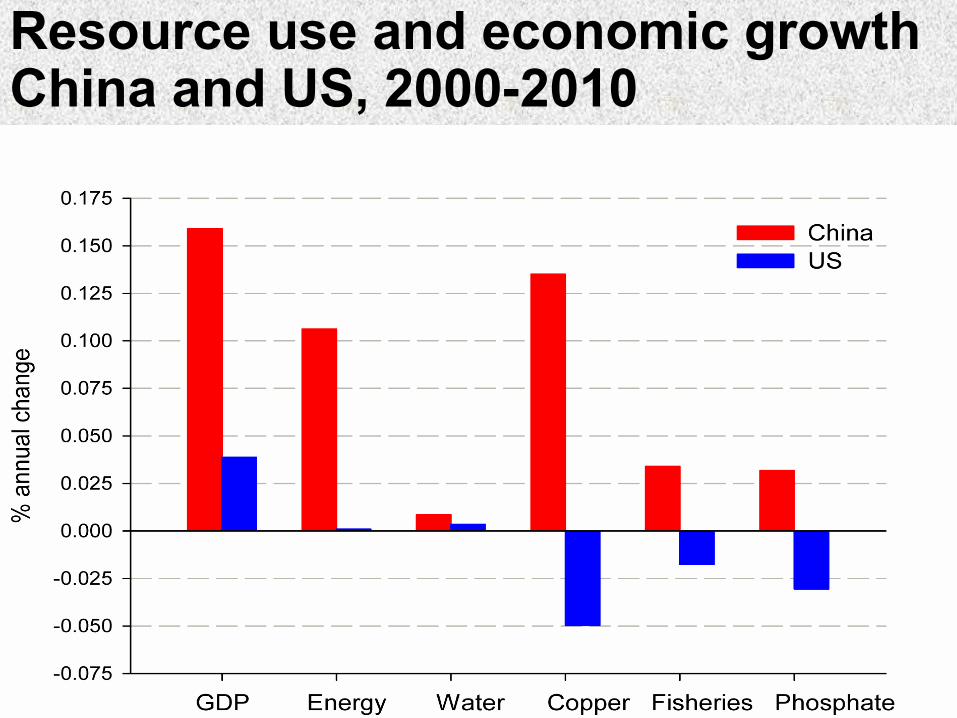
Resource use and economic growthChina and US, 2000-2010

“Sustainable development … meets the needs of the present without compromising the ability of future generations to meet their own needs.” Brundtland Commission Report for the World Commission on Environment and Development (1987)
Sustainable development:assumption, hypothesis, oxymoron?

Sustainable development:assumption, hypothesis, oxymoron?To “get the economy growing again” and “lift developing countries out of poverty” will require enormous quantities of energy
Exponential growth cannot continue indefinitely in a world of finite resources Per capita supplies of many critical resources have been declining since the 1980s
Much of economics is human ecology

The biggest obstacle to sustainability is human nature
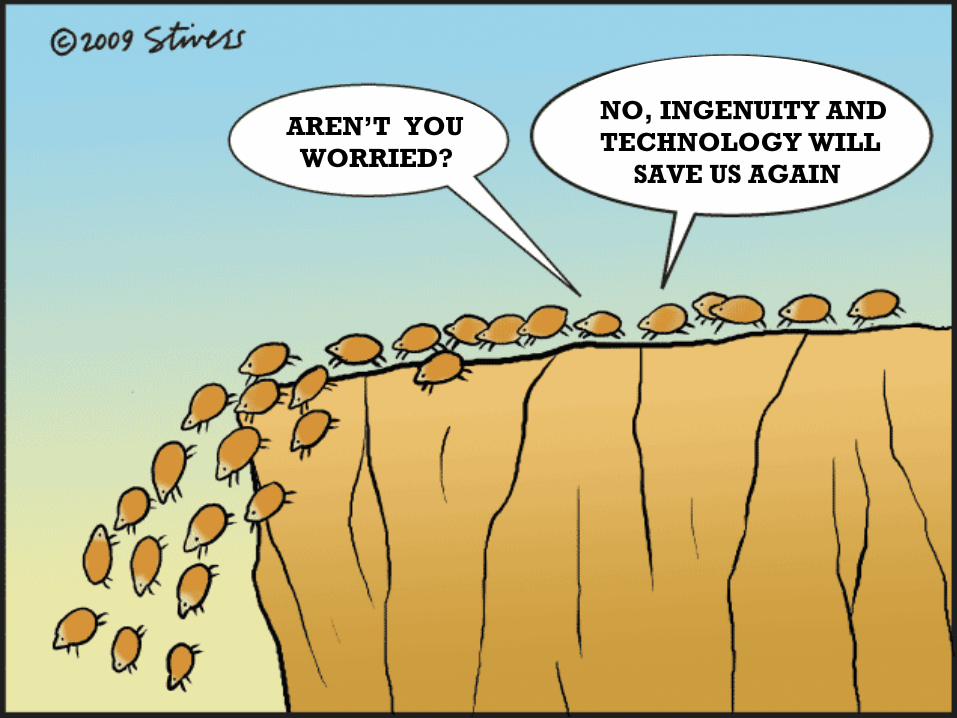
The biggest obstacle to sustainability is human nature
NO, INGENUITY AND TECHNOLOGY WILL SAVE US AGAIN
AREN’T YOU WORRIED?

“I can't think about that right now. If I do, I'll go crazy. I'll think about that tomorrow.” Scarlet O’Hara

Collaborators: New Mexico “Human macroecology” group:Craig Allen, Robbie Burger, Bill Burnside, Ana Davidson, Trevor Fristoe, Marcus Hamilton, Norman Mercado-Silva, Jeff Nekola, Jordan Okie, Wenyun Zuo
Supported by:Program in Interdisciplinary Biological and Biomedical Science (PiBBs) with grants from the Howard Hughes Medical Institute and the National Institutes of Health

Courtesy of G. Tverberg

SONNY (11) AND QUINTON (7) DUQUETTE
MEREDITH (10) AND RHYS (7) BROWN
Dedicated to my grandchildren
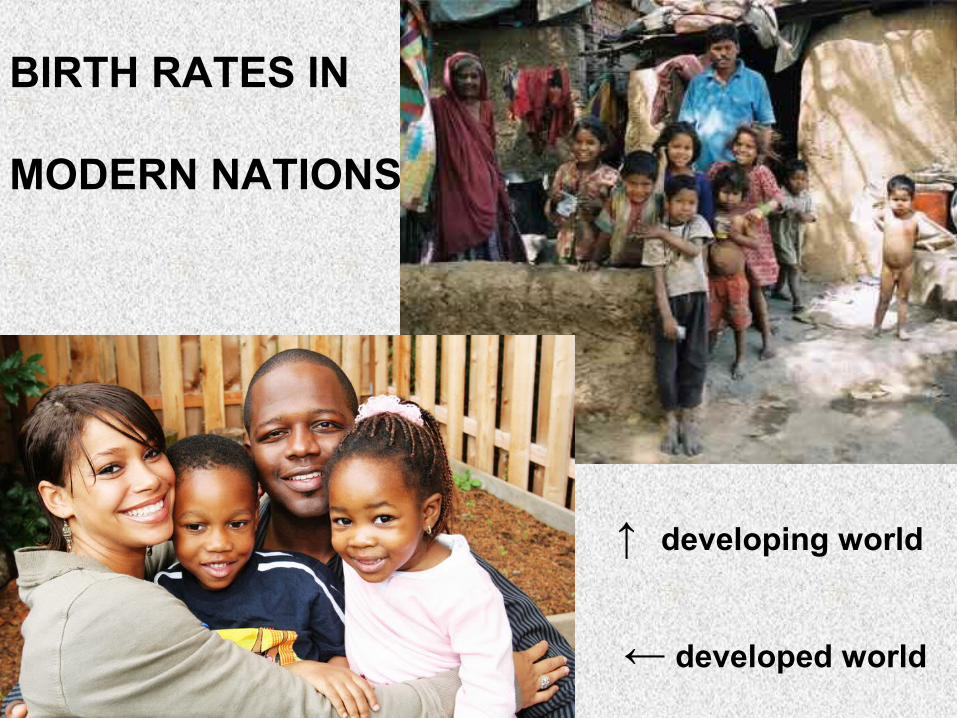
← developed world
↑ developing world
BIRTH RATES IN
MODERN NATIONS
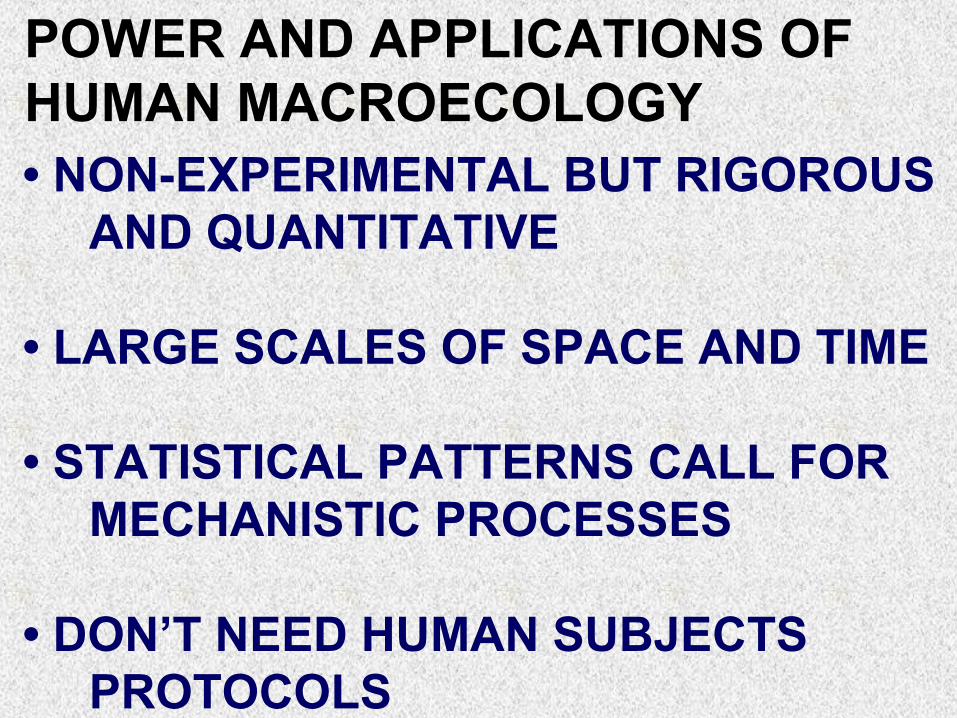
• NON-EXPERIMENTAL BUT RIGOROUS AND QUANTITATIVE
• LARGE SCALES OF SPACE AND TIME
• STATISTICAL PATTERNS CALL FOR MECHANISTIC PROCESSES
• DON’T NEED HUMAN SUBJECTS PROTOCOLS
POWER AND APPLICATIONS OF HUMAN MACROECOLOGY

• JUST ONE OF MILLIONS OF SPECIES
• SUBJECT TO THE SCIENTIFIC LAWS PHYSICS AND CHEMISTRY: CONSERVATION OF ENERGY, MASS, STOICHIOMETRY BIOLOGY: MALTHUSIAN-DARWINIAN DYNAMIC
• SUBJECT OF NATURAL SCIENCES BIOMEDICINE, ECOLOGY
THE DUALITY OF Homo sapiensON ONE SIDE:

HUMANS ARE UNIQUE
• BRAIN AND BEHAVIOR, • AGRICULTURAL, INDUSTRIAL, TECHNOLOGICAL ECONOMY
• THE ECOLOGICALLY DOMINANT SPECIES • SUBJECT OF SOCIAL SCIENCES PSYCHOLOGY, SOCIOLOGY, ECONOMICS
THE DUALITY OF Homo sapiensON THE OTHER SIDE:

Data compiled and analyzed by M. Hamilton
Per-capita energy use vs. per capita GDP

Data compiled and analyzed by M. Hamilton
Per-capita energy use vs. per capita GDP
Slopes over 25 years, 1980-2005

Other metricsare all correlated with GDP and energy use
• consumption of aluminum, wood, residential energy, gasoline, electricity, coal, meat, coffee, calories• production of waste• number of doctors, life expectancy, infant mortality, poverty level, population growth rate• carbon and ecological footprint • imports, exports• patents, Nobel Prizes

It’s not just oil
Per capita rates of consumption of other critical resources aredecreasing
per capita
total

ENERGY AND ECONOMICS:a macroecological and metabolic perspective
∙ GDP tracks per capita energy use across nations and over time
∙ Energy fuels economic growth and development ∙ All measures of standard of living are correlated with energy use and GDP∙ Most energy comes from fossil fuels∙ Limited potential to substitute renewable sources∙ Implications for “getting the economy growing again” “sustainable development” Third World must develop or die (BBC 2/12/09)

Per-capita energy use vs. per capita GDP25-year averages for alternative scenarios
Data compiled and analyzed by M. Hamilton

The biggest obstacle to sustainability is human nature
NO, INGENUITY AND TECHNOLOGY WILL SAVE US AGAIN
ARE YOU WORRIED?

Thanks to: National Science Foundation, Packard Foundation, Santa Fe Institute, Thaw Charitable Trust
UNM/SFI/LANL scaling group: O. Burger, W. Burnside, H. Davis, M. Hamilton, M. Moses, J. Okie, G. West, W. Woodruff