Endeavour Mining TSX:EDV June 2016 - s21.q4cdn.com · Market Information Current shareholder...
53
CREATING A PREMIER AFRICAN GOLD PRODUCER Endeavour Mining Corporate Presentation TSX:EDV June 2016
Transcript of Endeavour Mining TSX:EDV June 2016 - s21.q4cdn.com · Market Information Current shareholder...
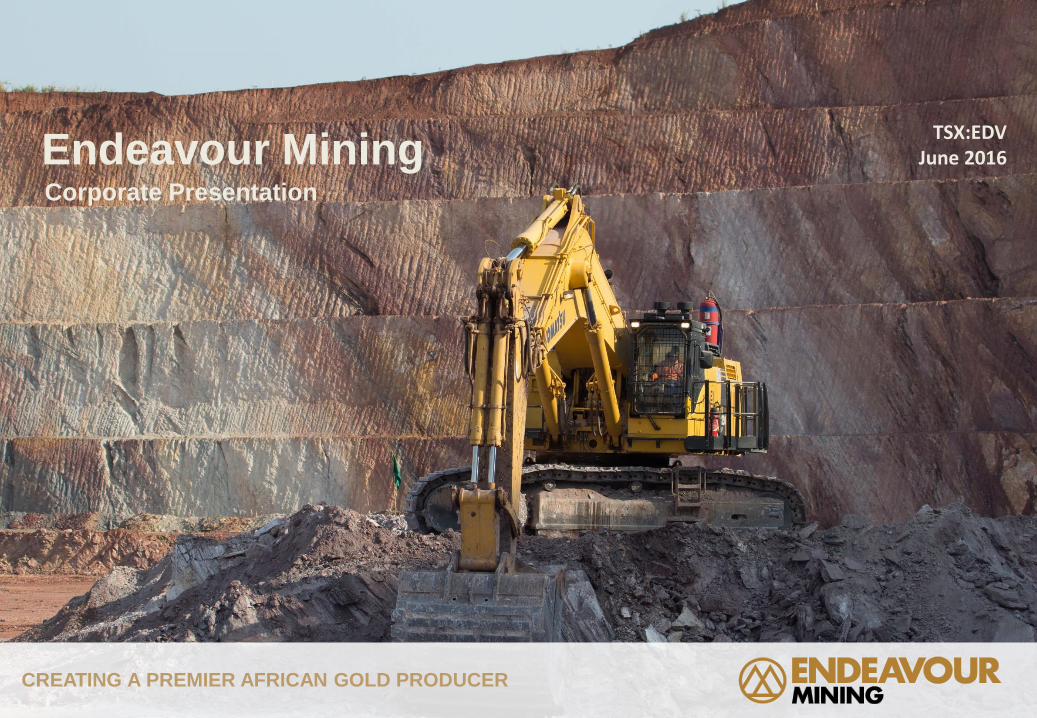
CREATING A PREMIER AFRICAN GOLD PRODUCER
Endeavour MiningCorporate Presentation
TSX:EDVJune 2016

1
Disclaimer & Forward Looking Statements
CREATING A PREMIER AFRICAN GOLD PRODUCER
Cash cost per ounce and all-in sustaining cash cost per ounce are non-GAAP
performance measures with no standard meaning under IFRS. This
presentation contains “forward-looking statements” including but not
limited to, statements with respect to Endeavour’s plans and operating
performance, the estimation of mineral reserves and resources, the timing
and amount of estimated future production, costs of future production,
future capital expenditures, and the success of exploration activities.
Generally, these forward-looking statements can be identified by the use of
forward-looking terminology such as “expects”, “expected”, “budgeted”,
“forecasts” and “anticipates”. Forward-looking statements, while based on
management’s best estimates and assumptions, are subject to risks and
uncertainties that may cause actual results to be materially different from
those expressed or implied by such forward-looking statements, including
but not limited to: risks related to the successful integration of acquisitions;
risks related to international operations; risks related to general economic
conditions and credit availability, actual results of current exploration
activities, unanticipated reclamation expenses; changes in project
parameters as plans continue to be refined; fluctuations in prices of metals
including gold; fluctuations in foreign currency exchange rates, increases in
market prices of mining consumables, possible variations in ore reserves,
grade or recovery rates; failure of plant, equipment or processes to operate
as anticipated; accidents, labour disputes, title disputes, claims and
limitations on insurance coverage and other risks of the mining industry;
delays in the completion of development or construction activities, changes
in national and local government regulation of mining operations, tax rules
and regulations, and political and economic developments in countries in
which Endeavour operates. Although Endeavour has attempted to identify
important factors that could cause actual results to differ materially from
those contained in forward-looking statements, there may be other factors
that cause results not to be as anticipated, estimated or intended. There
can be no assurance that such statements will prove to be accurate, as
actual results and future events could differ materially from those
anticipated in such statements. Accordingly, readers should not place
undue reliance on forward-looking statements. Please refer to Endeavour’s
most recent Annual Information Form filed under its profile at
www.sedar.com for further information respecting the risks affecting
Endeavour and its business.
Adriaan “Attie” Roux, Pr.Sci.Nat, Endeavour’s Chief Operating Officer, is a Qualified Person under NI 43-101, and has reviewed and approved the technical information in this presentation.
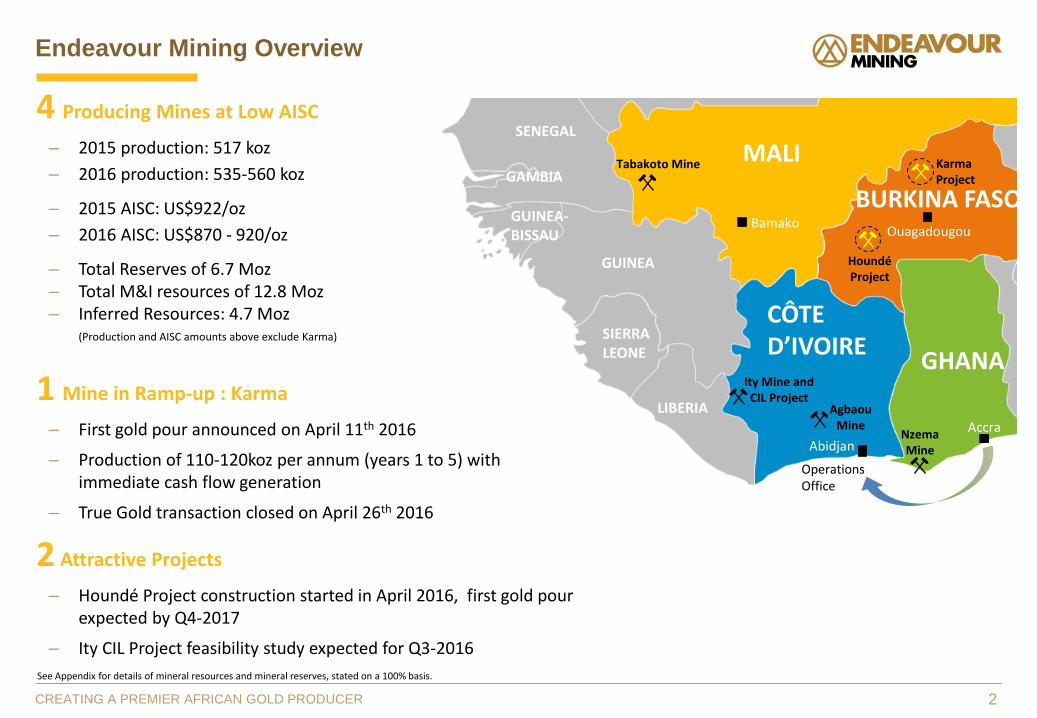
MALI
AgbaouMine
NzemaMine
Tabakoto Mine
HoundéProject
CÔTE D’IVOIRE
GHANA
Karma Project
Ity Mine and CIL Project
Abidjan
Accra
BamakoOuagadougou
GUINEA
SIERRALEONE
SENEGAL
GAMBIA
LIBERIA
GUINEA-BISSAU
Operations Office
Endeavour Mining Overview
2CREATING A PREMIER AFRICAN GOLD PRODUCER
See Appendix for details of mineral resources and mineral reserves, stated on a 100% basis.
BURKINA FASO
4 Producing Mines at Low AISC
– 2015 production: 517 koz
– 2016 production: 535-560 koz
– 2015 AISC: US$922/oz
– 2016 AISC: US$870 - 920/oz
– Total Reserves of 6.7 Moz– Total M&I resources of 12.8 Moz– Inferred Resources: 4.7 Moz
(Production and AISC amounts above exclude Karma)
1 Mine in Ramp-up : Karma
– First gold pour announced on April 11th 2016
– Production of 110-120koz per annum (years 1 to 5) with immediate cash flow generation
– True Gold transaction closed on April 26th 2016
2 Attractive Projects
– Houndé Project construction started in April 2016, first gold pour expected by Q4-2017
– Ity CIL Project feasibility study expected for Q3-2016
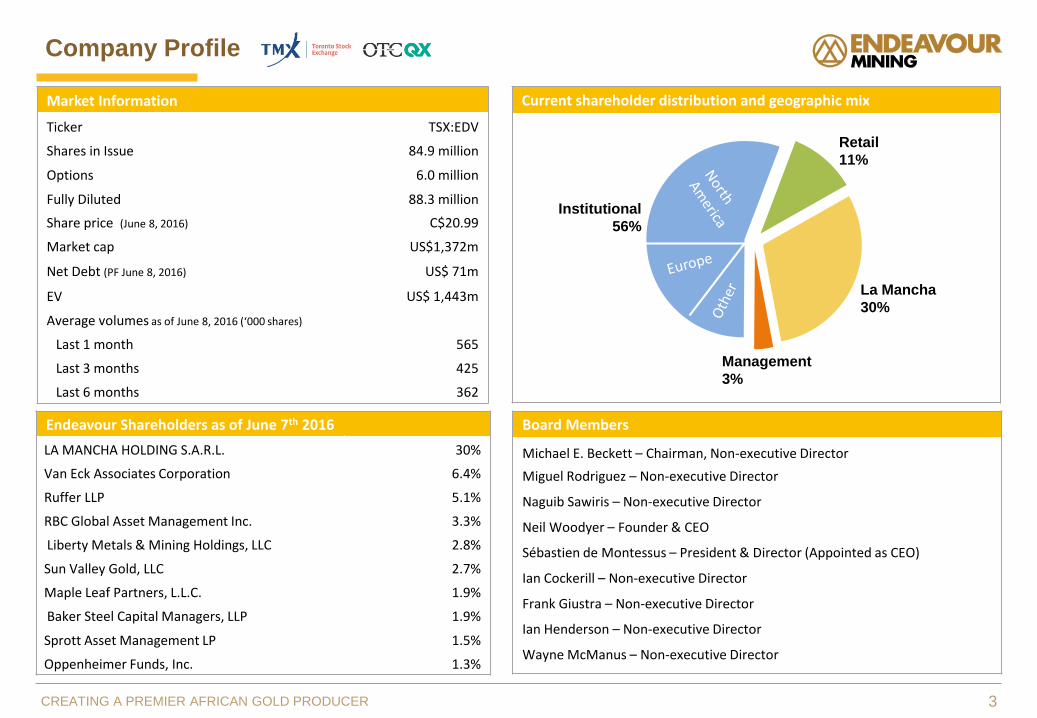
Current shareholder distribution and geographic mixMarket Information
Ticker TSX:EDV
Shares in Issue 84.9 million
Options 6.0 million
Fully Diluted 88.3 million
Share price (June 8, 2016) C$20.99
Market cap US$1,372m
Net Debt (PF June 8, 2016) US$ 71m
EV US$ 1,443m
Average volumes as of June 8, 2016 (‘000 shares)
Last 1 month 565
Last 3 months 425
Last 6 months 362
Company Profile
Retail
11%
Institutional
56%
Management
3%
La Mancha
30%
3CREATING A PREMIER AFRICAN GOLD PRODUCER
Endeavour Shareholders as of June 7th 2016
LA MANCHA HOLDING S.A.R.L. 30%
Van Eck Associates Corporation 6.4%
Ruffer LLP 5.1%
RBC Global Asset Management Inc. 3.3%
Liberty Metals & Mining Holdings, LLC 2.8%
Sun Valley Gold, LLC 2.7%
Maple Leaf Partners, L.L.C. 1.9%
Baker Steel Capital Managers, LLP 1.9%
Sprott Asset Management LP 1.5%
Oppenheimer Funds, Inc. 1.3%
Board Members
Michael E. Beckett – Chairman, Non-executive Director
Miguel Rodriguez – Non-executive Director
Naguib Sawiris – Non-executive Director
Neil Woodyer – Founder & CEO
Sébastien de Montessus – President & Director (Appointed as CEO)
Ian Cockerill – Non-executive Director
Frank Giustra – Non-executive Director
Ian Henderson – Non-executive Director
Wayne McManus – Non-executive Director

Endeavour is backed by La Mancha
30%holding
31%holding
Sawiris family’s mining investment vehicle
La Mancha vended-in the Frog’s Leg and White Foil mines
La Mancha then contributed $112m for acquisition of the Cowal mine
Evolution has grown from a ~A$670m market cap to ~A$3.0B, ~350% increase, since announcement of strategic partnership
0
0,5
1
1,5
2
2,5
Jan-15 Apr-15 Jul-15 Oct-15 Jan-16 Apr-16
Partnership Announced
La Mancha vended-in the Ity mine and $63m of cash
La Mancha then contributed $65m following the acquisition of Truegold
Endeavour has grown from a US$250m to a US$1.2B market cap since announcement of strategic partnership
3
7
11
15
19
Sep-15 Dec-15 Mar-16
Partnership Announced
The Sawiris family is present across various sectors and businesses, ranging from construction and fertilizers to
real estate and telecommunications
Long-term growth supportive investor
4CREATING A PREMIER AFRICAN GOLD PRODUCER

Neil Woodyer – Founder & CEO
• Former CEO of Lloyds International Trading, a subsidiary of Lloyds Bank plc
• Former CEO of Amalgamated Metal’s group of New York & Latin America-based metal trading & mining finance
Adriaan “Attie” Roux – COO
• Previously General Manager of Adamus Resources & Senior VP –Operations of Endeavour Mining
• Metallurgical engineer with +38 years of experience, including 34 years with Anglo American, De Beers & AngloGold
Ota Hally – CFO
• Chartered Accountant & Chartered Financial Analyst – joined Endeavour in early 2014 as VP – Group Controller
• Former Director of Finance for Pan American Silver
Vincent Benoit – Exec VP Strategy & Business Development
• Former EVP Strategy & Business Development of La Mancha
• Former EVP Merger & Acquisitions, as well as Head of Strategy & Investor Relations, at Orange
Management Changes Announced(to take effect upon the completion of the AGM on June 28th, 2016)
Sebastien de Montessus appointed as CEO
Neil Woodyer has decided not to seek a nomination to the Board
Michael Beckett will continue in his role as Chairman and Non-Executive Director
Endeavour Mining – Management Team
CREATING A PREMIER AFRICAN GOLD PRODUCER
Sébastien de Montessus – President & Director
• Former CEO of the La Mancha Group (2012-2015)
• Former member of the Executive Board & Group Deputy CEO of AREVA Group & CEO of AREVA Mining
• Prior to joining AREVA in 2002, Mr. de Montessus was an investment banker at Morgan Stanley in London (M&A, ECM)
Patrick Bouisset – Exec VP Exploration
• Former Executive VP Exploration & New Ventures of La Mancha
• +20 years at Total – in charge of exploration activities in Africa
• Former VP Geoscience of AREVA’s Business Group
Doug Bowlby – Exec VP Corporate Development
• Responsible for analysis of corporate transactions, assisting with transaction implementation
• Joined Endeavour in 1996 with experience in merchant banking, corporate finance and M&A
Morgan Carroll – Exec VP Corporate Finance & General Counsel
• Previously practiced law in the finance group at Mayer Brown International LLP in London & New York
Jeremy Langford – Exec VP Construction Services
• Managed the construction & delivery of Nzema and Agbaou
• Currently managing Houndé project along with Endeavour’s in-house Construction Services Group
Richard Thomas – Exec VP Technical Services
• Former VP Mining for Continental Africa for AngloGold
• Professional Engineer
5

Building A Premier African Gold Producer
CREATING A PREMIER AFRICAN GOLD PRODUCER
Youga: 1st acquisition, (mature mine sold Feb 2016)
Nzema: 2nd acquisition, recapitalized
Tabakoto: 3rd acquisition, mill expanded, converted to owner mining, improved mill feed
Agbaou: FS in 2012, commissioned in 2014
Ity Heap Leach: 5th mine, potential to extend to 2019/2020 with definition of additional resources and CIL reserves
Houndé: Houndé Project construction started, first gold pour expected by Q4 2017
$1 137
$1 010
$922
$800
$500
$600
$700
$800
$900
$1 000
$1 100
$1 200
0
100
200
300
400
500
600
700
800
900
1 000
2010 2011 2012 2013 2014 2015 2016E 2017E 2018E
Current Gold Production Profile (100%) and AISC (Mine-Level, US$/oz)
83koz
167koz
220koz
317koz
462koz
517koz
+900koz
Strategic Objective for 2018-2020
+ 900 kozYEARLY PRODUCTION
< 800$/ozALL IN CASH COST
10+ year MINE LIFE IN OUR CORE ASSETS
Karma: Transaction closed on April 26, 2016
6

Dynamic Portfolio Management
CREATING A PREMIER AFRICAN GOLD PRODUCER 7
1 2 3 4 5 6 7 8 9 10 11 12 13
$1,050/oz
$1,000/oz
$950/oz
$900/oz
$850/oz
$800/oz
$750/oz
$700/oz
$650/oz
$1,100/oz
Mine life, years
Decreased costs from >1,300/oz
Agbaou(165-175koz)
Nzema(110-130koz)
Tabakoto(155-175koz)
Ity HL(65-75koz)
Youga(40-45koz)
Optimization + exploration
Cut-back
Develop CIL project
AISC, US$/oz
4 Strategic Levers
1 OPERATIONAL EXCELLENCE
PROJECTDEVELOPMENT
UNLOCKEXPLORATION VALUE
OPPORTUNISTIC M&A APPROACH
234
Ity HL(65-75koz)
Prolong
Extending Mine Life and Lowering AISC
Ity CIL DFS in progress
(120 - 150koz)Houndé(200koz)Karma
(110-120koz)
Bubble size represents production
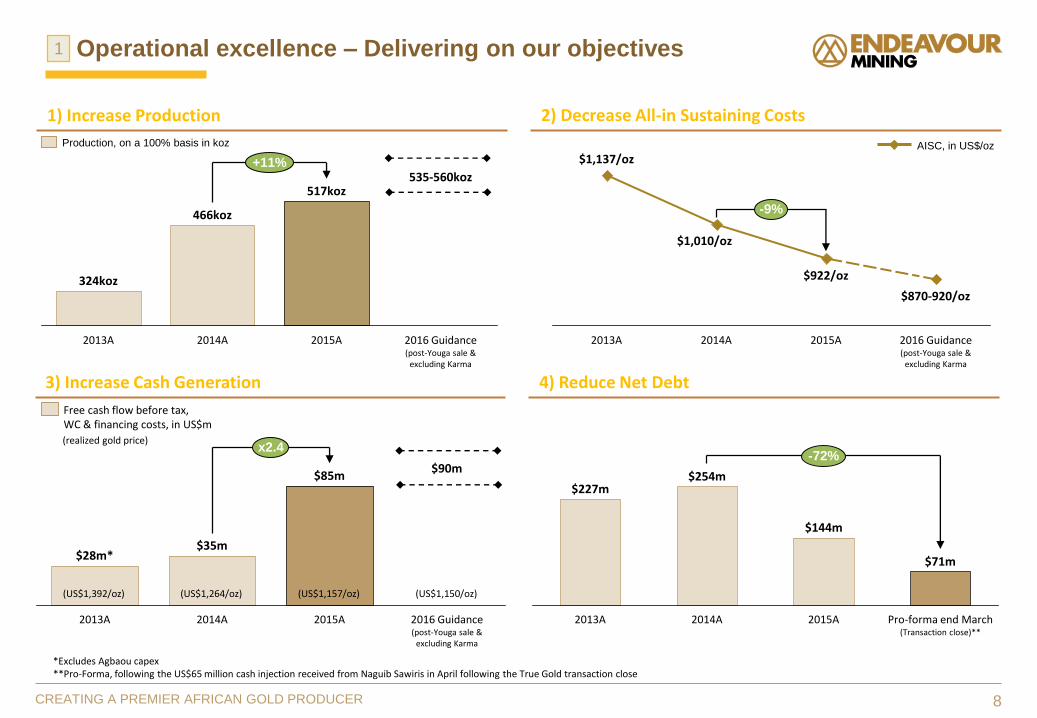
Operational excellence – Delivering on our objectives
1) Increase Production 2) Decrease All-in Sustaining Costs
3) Increase Cash Generation 4) Reduce Net Debt
+11%
2016 Guidance (post-Youga sale &
excluding Karma
535-560koz
2015A
517koz
2014A
466koz
2013A
324koz
*Excludes Agbaou capex**Pro-Forma, following the US$65 million cash injection received from Naguib Sawiris in April following the True Gold transaction close
Production, on a 100% basis in koz
x2.4
2016 Guidance (post-Youga sale &
excluding Karma
$90m
2015A
$85m
2014A
$35m
2013A
$28m*
-9%
2016 Guidance (post-Youga sale &
excluding Karma
$870-920/oz
2015A
$922/oz
2014A
$1,010/oz
2013A
$1,137/ozAISC, in US$/oz
(US$1,392/oz) (US$1,264/oz) (US$1,157/oz) (US$1,150/oz)
Free cash flow before tax, WC & financing costs, in US$m
(realized gold price)
8CREATING A PREMIER AFRICAN GOLD PRODUCER
$71m
Pro-forma end March(Transaction close)**
-72%
2015A
$144m
2014A
$254m
2013A
$227m
1

9CREATING A PREMIER AFRICAN GOLD PRODUCER
Production Guidance1, ounces AISC Guidance, $/oz
Agbaou 165,000 - 175,000 Agbaou 650 - 700
Tabakoto 155,000 - 175,000 Tabakoto 920 - 970
Nzema 110,000 - 130,000 Nzema 970 - 1,020
Ity 65,000 - 75,000 Ity 800 - 850
Youga (pre-disposal²) 7,000 - 8,000 Youga (pre-disposal²) 980 - 1,030
Total 502,000 - 563,000 Mine-level AISC/oz 820 - 870
Group Guidance Range 535,000 - 560,000 Corporate G&A 38
Sustaining exploration 11
Group All-In Sustaining costs 870 - 920
$ million $/ounce
Revenue (based on production guidance range mid-point) 630 1,150
AISC costs (based on AISC guidance range mid-point) (492) 895
All-in sustaining margin 138 255
Non-sustaining capital:
(48) 80
Agbaou secondary crusher: 12
Nzema pit wall push-back: 12
Non-sustaining exploration: 14
Houndé and the Ity CIL projects: 10
Free cash flow (before working capital movement, tax and financing costs) 90 175
1Gold production is on a 100% consolidated basis. Actual mine ownership is Agbaou – 85%, Nzema – 90%, Tabakoto – 80%, Youga – 90%, Ity – 55%. ²Estimate for the pre-sale period ended February 29, 2016.
• 2016 Guidance excluding Karma and Houndé:
- At US$1,150 gold price, AISC margin of approximately US$138m in 2016, or US$255/oz
- Free cash flow (before working capital movement, tax and financing costs) is projected to be US$90m or US$175/oz
- US$30m sensitivity for a $50 per ounce gold price movement
- 2016 exploration budget of US$20m for reserve replacement and mine life extensions
- US$48m non-sustaining capital allocated to Agbaou, Nzema, exploration and projects
• Updated guidance for 2016 with Karma and Houndé capex will be provided with the release of second quarter results
2016 production guidance of 535-560koz at AISC of US$870-920/oz
US$90m expected Free cash flow at US$1,150/oz(before working capital movement, tax and financing costs)
Operational excellence – Free cash flow expected to increase1

Q1-2016Actual
2016 Guidance
Comment
Production, koz 132koz 535-560koz
On-track to meet guidance for the year despite low production from Nzema in Q1-16
AISC, US$/oz $900/oz($889/oz without Youga)
$870-920/ozDecreased AISC in line with guidance
Free Cash Flow, US$m(before tax, WC & financing costs)
US$28m US$90mSlightly above guidance due notably to stronger gold price
Net Debt, US$m $136m n/aFurther decrease since end of December 2015
10CREATING A PREMIER AFRICAN GOLD PRODUCER
All amounts include 2 months of Youga production for the pre-sale period
After True Gold transaction close, pro-forma net debt amounts to$71m
Operational excellence – Q1 2016 in line with full year guidance1
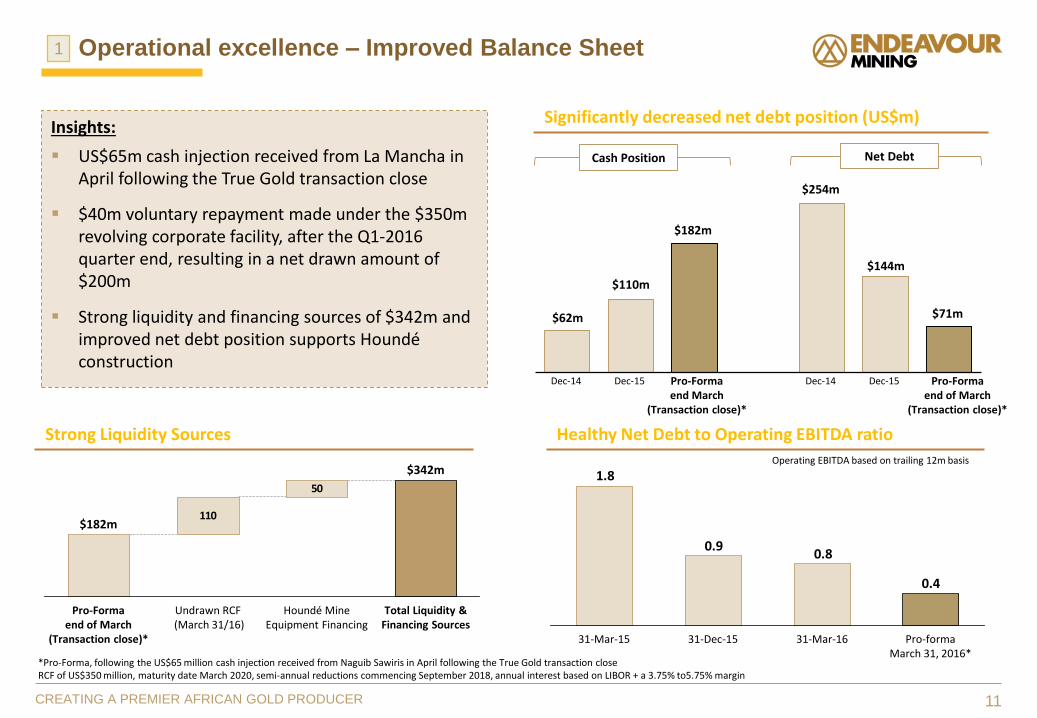
Operational excellence – Improved Balance Sheet
11CREATING A PREMIER AFRICAN GOLD PRODUCER
Healthy Net Debt to Operating EBITDA ratio
0.4
0.80.9
1.8
Pro-forma March 31, 2016*
31-Mar-1631-Dec-1531-Mar-15
Insights:
US$65m cash injection received from La Mancha in April following the True Gold transaction close
$40m voluntary repayment made under the $350m revolving corporate facility, after the Q1-2016 quarter end, resulting in a net drawn amount of $200m
Strong liquidity and financing sources of $342m and improved net debt position supports Houndéconstruction
Operating EBITDA based on trailing 12m basis
1
*Pro-Forma, following the US$65 million cash injection received from Naguib Sawiris in April following the True Gold transaction closeRCF of US$350 million, maturity date March 2020, semi-annual reductions commencing September 2018, annual interest based on LIBOR + a 3.75% to5.75% margin
110
50
Total Liquidity & Financing Sources
$342m
Houndé Mine Equipment Financing
Undrawn RCF(March 31/16)
Pro-Forma end of March
(Transaction close)*
$182m
Significantly decreased net debt position (US$m)
$110m
Dec-14
$62m
Dec-15Dec-14
$71m
$182m
$144m
$254m
Pro-Forma end March
(Transaction close)*
Dec-15
Cash Position Net Debt
Strong Liquidity Sources
Pro-Forma end of March
(Transaction close)*

12CREATING A PREMIER AFRICAN GOLD PRODUCER
5 6 7 8 9 10 11 12 13 14
$850/oz
$900/oz
$800/oz
$1,000/oz
$950/oz
$700oz
$750/oz
Yanfolila
Yaramoko
Mine life, years
Fekola
Banfora
Asanko Phase 1
New Liberty
Bombore
Houndé
Project Development - Houndé and Ity CIL are top tier projects2
All-in
Cash
Co
st, US$
/oz
(AISC
+ Initial C
ape
x)
Top-tier West African projects:
– Houndé Project, construction started with first gold pour expected by Q4-2017
– Ity CIL project, positive DFS expected mid-2016 has the potential to extend mine life and lower AISC
– Karma is ramping up with the potential to extend mine life by converting a portion of inferred
Significant Construction Expertise In West Africa:
– Core construction team has been successfully developing projects together for over 10 years.
– 7 projects built over past 10 years, $2.4 billion in total capex
– All projects were delivered on time and within budget
West African Peer Projects: Mine life and All-in cost (including Capex)
Karma(110-120koz)
Ity CIL (PFS: ~120koz)
DFS underway
Houndé(200koz)
Bubble size represents average annual production

Project Development - Houndé construction underway
Burkina Faso
Houndé
Ouagadougou
Essakane(IAMGOLD)
Taparko(Nordgold)
Youga(MNG)
Mana(Semafo)
Inata(Avocet)
Bissa Hill(Nordgold)
Yaramoko(Roxgold)
Bomboré(Orezone)
Konkera(Centamin)
Banfora(Gryphon)
Karma
CREATING A PREMIER AFRICAN GOLD PRODUCER
Houndé is positioned to be Endeavour’s flagship low cost mine
• Improves the overall quality of our portfolio
• In line with objective of increasing Group production to +900koz at AISC of <$800/ozwith +10 year mine life across all mines
• $328m, inclusive of $47m for owner-mining fleet
• Robust Project after-tax IRR of +30% at US$1,250/oz
• Average production of 190kozpa at AISC of US$709/oz
• 10-year mine life based on current reserves
• Significant exploration upside
• 18 months construction with first gold pour by Q4 2017
13
2
Houndé resettlement site cleared
$662/oz
184koz
Year 2
$648/oz
218koz
Year 3
231koz
Year 9 to 10
Average
$645/oz
116koz
$496/oz
Year 5 to 8
Average
$901/oz
Year 4
223koz
265koz
$506/oz
Year 1
AISC/ozProduction based on reserves, koz
Exploration upside expected to fill this shortfall
Life of Mine Plan

14CREATING A PREMIER AFRICAN GOLD PRODUCER
Houndé Project Fully Financed with Significant Headroom
110
50
Inclusive of FCF
~500-550m
Total Liquidity & Financing
Sources
$342m
Houndé Mine Equipment Financing
Undrawn RCF(March 31/16)1
Pro-forma March 31/16 Cash Position
After True Gold closing
$182m
1 RCF of US$350 million, maturity date March 2020, semi-annual reductions commencing September 2018, annual interest based on LIBOR + a 3.75% to 5.75% margin
Free Cash Flow of
2016 – 2017 +
Sources of Liquidity and Financing (US$m) Capex Spend (US$m)
Fully financed with FCF providing +50% funding headroom
3556
115
52 5217
Q4 2017Q1 2017 Q3 2017Q2 2017Q4 2016Q2/Q3 2016
Total Capex:$328m
2
Pro-Forma cash position of US$ 182m
Liquidity position at the end of March of US$ 342m

Karma
Siguiri
Tasiast
AISC, US$/oz
Tabakoto(2016E)
Sabodala
Nzema(2016E)
15CREATING A PREMIER AFRICAN GOLD PRODUCER
50
100
150
200
250
300
350
400
450
500
550
600
500 550 600 650 700 750 800 850 900 950 1,000 1,050 1,100 1,150 1,200 1,250 1,300 1,350
Ity
Syama
Chirano
Loulo
Mana
Gounkoto
Bissa
Agbaou
Akyem
Damang
Bogoso/Prestea
Iduapriem
Essekane
Tarkwa
Bonikro
Ahafo
Sadiola
Edikan
Wassa
Tongon
Lefa
Morila
Houndé Increases the Quality of our Portfolio Ranks amongst the highest quality West African mines
Pro
du
ctio
n, k
ozp
a
Houndé and Karma are respectively based on first 4 and 5 year averages. Peer group based on 2015A. Source: UBS research
Lowest cost mines Highest cost mines
Houndé
2

Most West African gold findings are located in the Birimian greenstone belt
Côte d’Ivoire and Burkina Faso: Largest Birimian holding yet low findings as under-exploration
Unlock Exploration Value – Long-term planning underway
• One of the largest exploration packages in West Africa
• Strategically positioned to become the the largest gold producer in both Côte d’Ivoire and Burkina Faso which host +50% of the Birimian belt
• Capital constraints since 2010 have limited exploration to focus primarily on replenishing mined ounces
• A strategic exploration review is currently underway to establish the long-term exploration strategy and prioritize targets:
– Agbaou: strong proven potential with renewal of all reserves depleted since inception in 2014
– Tabakoto: capacity to find more open pit potential in a very prolific area
– Ity: Focused on identifying new oxide targets (>2.5g/t) in very close vicinity to the plant (<2km) to extend heap leach mine life and/or enhance CIL project
– Houndé: potential to extend significantly mine life project
CRATING A PREMIER AFRICAN GOLD PRODUCER 16
Mali
33Moz
10%
Guinea
12Moz11%
Ghana
110Moz
19%
BurkinaFaso
12Moz22%
Côte d’Ivoire
8Moz
35%
Endownment found, Moz% of Birimian
3
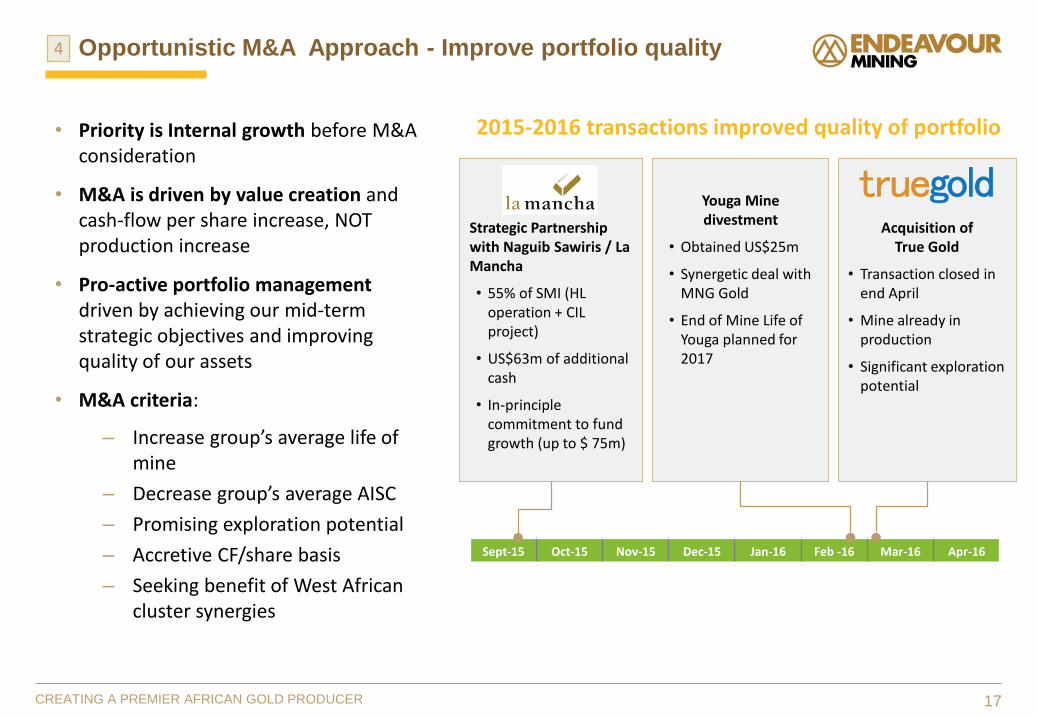
Opportunistic M&A Approach - Improve portfolio quality
• Priority is Internal growth before M&A consideration
• M&A is driven by value creation and cash-flow per share increase, NOT production increase
• Pro-active portfolio managementdriven by achieving our mid-term strategic objectives and improving quality of our assets
• M&A criteria:
– Increase group’s average life of mine
– Decrease group’s average AISC
– Promising exploration potential
– Accretive CF/share basis
– Seeking benefit of West African cluster synergies
17CREATING A PREMIER AFRICAN GOLD PRODUCER
4
Sept-15 Oct-15 Nov-15 Dec-15 Jan-16 Feb -16 Mar-16 Apr-16
Strategic Partnership with Naguib Sawiris / La Mancha
• 55% of SMI (HL operation + CIL project)
• US$63m of additional cash
• In-principle commitment to fund growth (up to $ 75m)
Acquisition of True Gold
• Transaction closed in end April
• Mine already in production
• Significant exploration potential
Youga Mine divestment
• Obtained US$25m
• Synergetic deal with MNG Gold
• End of Mine Life of Youga planned for 2017
2015-2016 transactions improved quality of portfolio

Why True Gold?
• Fits with our M&A criteria :
– Production-ready with immediate cash flow generation
– 110-120koz low-cost production at AISC of ~US$700/oz on average over the first 5 years
– +10 years potential mine life
– Significant exploration potential with 45 new drill ready targets
• Reinforced liquidity sources
– Naguib Sawiris to top-up C$83m (US$62m) to maintain 30% stake
– Karma adds a 5th cash generating mine
• Direct synergies by removing True Gold’scorporate costs(US$6m/year) which offsets most of the premuim paid
18CREATING A PREMIER AFRICAN GOLD PRODUCER
4
Karma Production Profile
120
160
140
20
80
100
40
60
0Year 9Year 8Year 1 Year 2
668
488
639582
Year 4Year 3
636
Year 5 Year 7Year 6
AISC (US$/oz) Production based on reserves (koz)
Karma Mine Quick Facts (1) (on 100% basis)
Ownership 90% True Gold, 10% Burkina Faso
Resources(incl. of Reserves)
M&I: 75.2Mt @ 1.08 g/t for 2.621MozInferred: 65.3Mt @ 1.13 g/t for 2.362Moz
Reserves 33.2Mt @ 0.89 g/t for 0.949Moz
Processing Rate 4.0mtpa Heap Leach
Gold Recovery 87%
Mining TypeEasy operation with shallow open pit and free digging
material with no blasting required, low strip ratio
Avg Annual Production 110 – 120 kozs @ <$700/oz for years 1-5
Mine lifeLong life of mine of 8 years mine life based on reserves
+ 2.5 years from North Kao deposit (inferred resource)
Objective of convertingexisting inferred

20%
17%
11% 10%
7% 6% 6% 5%3%
2%0,1%
-1%
Endeavour B2Gold New Gold Evolution OceanaGold Teranga Resolute Randgold Centamin SEMAFO IAMGOLD Acacia
1289,817
+900800,70 782,106 781,027 535-560koz
(excluding Karma)523,474 471,677 427,111 376,264 315,677
237,336 220,483
Benchmarking vs Peers – Gold Production
19CREATING A PREMIER AFRICAN GOLD PRODUCER
Source: Bloomberg and broker research(1) Endeavour based on internal estimates; peers based on Bloomberg; growth shown as Compound Annual Growth Rate (CAGR)(2) Calendarised Evolution production as of December 2015
2016E Gold Production (koz)
2015 – 2018E Annual Gold Production Growth(1)
Average: 7.9%
(2)
21.5x
19.5x
11.0x
8.8x 7.5x 7.3x 7.1x6.7x 6.3x
6.1x 5.8x5.1x
4.3x3.6x
Pe
rseu
s
Ran
dgo
ld
SEMA
FO
Go
lde
n Star
Cen
tamin
IAM
GO
LD
B2
Go
ld
Acacia
Harm
on
y
End
eavo
ur
Teran
ga
Siban
ye
Re
solu
te
No
rd G
old
Average: 7.6x
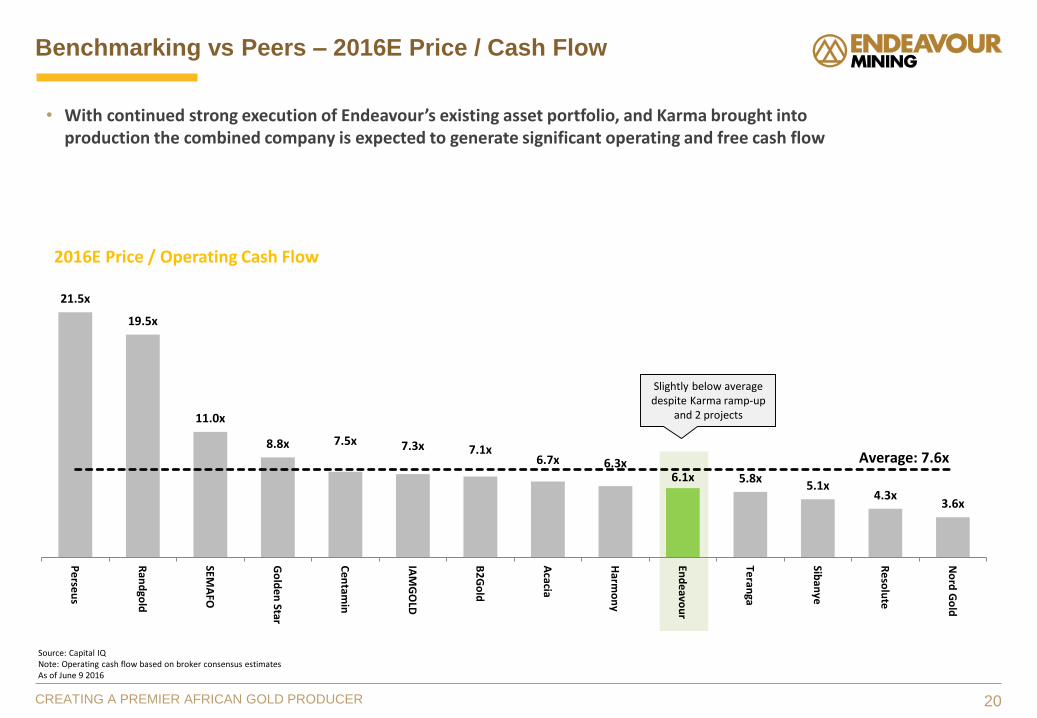
Benchmarking vs Peers – 2016E Price / Cash Flow
20CREATING A PREMIER AFRICAN GOLD PRODUCER
• With continued strong execution of Endeavour’s existing asset portfolio, and Karma brought into production the combined company is expected to generate significant operating and free cash flow
2016E Price / Operating Cash Flow
Source: Capital IQNote: Operating cash flow based on broker consensus estimatesAs of June 9 2016
Slightly below average despite Karma ramp-up
and 2 projects

0
5
10
15
20
1-Jan-15 1-Feb-15 1-Mar-15 1-Apr-15 1-May-15 1-Jun-15 1-Jul-15 1-Aug-15 1-Sep-15 1-Oct-15 1-Nov-15 1-Dec-15 1-Jan-16 1-Feb-16 1-Mar-16 1-Apr-16 1-May-16 1-Jun-16
Conclusion: Endeavour’s Re-rating has begunShare Price Re-Rating + True Gold Acquisition = C$1.8B Market Cap
CREATING A PREMIER AFRICAN GOLD PRODUCER 21
C$/share
C$450m
C$227mC$256mC$244m
C$1.8 billion
Market Capitalization
3/31/2015 6/30/2015 9/30/2015 12/31/2015 06/08/2016

CREATING A PREMIER AFRICAN GOLD PRODUCER
Appendix 1:Asset Description

Sustained production performance in Q1-2016
Q3/15 Q4/15
131koz 132koz137koz125koz
Q2/15
124koz
Q1/15 Q1/16
+6%
CREATING A PREMIER AFRICAN GOLD PRODUCER
Production, on a 100% basis in koz
23
Production breakdown
Q1-2015 Q1-2016 2016 Full Year Guidance
Agbaou 45,323 42,765 165,000 - 175,000
Tabakoto 33,574 38,542 155,000 - 175,000
Nzema 26,979 19,757 110,000 - 130,000
Ity - 22,324 65,000 - 75,000
Youga 17,868 8,179 7,000 - 8,000
Total 123,744 131,567 535,000 - 560,000
Insights:
All mines in line with guidance except for Nzema, which is expected to perform better in upcoming quarters
Q1-2016 includes 2 months of Yougaproduction and full quarter of Ity production
Sustained performance at Agbaou
Tabakoto’s production is expected to be lifted in upcoming quarters with higher grades
Nzema production below target as mine was impacted by purchased ore availability, which is expected to increase in the upcoming quarters
Production trend

Continued reduction in all-in sustaining costs
CREATING A PREMIER AFRICAN GOLD PRODUCER 24
$1,137
Q1-2016(excluding
Youga)
$889
YougaSale
(11)
Q1-2016
(1)(29)
$900
Nzema Ity
+17
Sustaining exploration
Corporate G&A
(25)
Youga
(10)
Agbaou
(4)
TabakotoQ1-2015
$946
Full Year2014
$1,010
Full Year2013
+6
All-in Sustaining Costs and weighted impact on group AISC, US$/oz
Lower AISC offset by slightly lower production
(in $/oz) Q1-2015 Q1-2016 2016 Full Year Guidance
Agbaou 577 525 650 - 700Tabakoto 1,127 1,071 920 - 970Nzema 1,194 1,158 970 - 1,020
Ity - 710 800 - 850Youga 851 1,101 980 - 1,030
Mine level AISC 901 851 820 - 870Corporate G&A 32 38 38
Sustaining exploration 13 12 11AISC 946 900 870 - 920
Lower AISC + lower production weight
New low-AISC mine
AISC breakdown

25
Agbaou Mine – Côte d’Ivoire
Recent and Upcoming catalysts
Accomplished
- Record year in 2015, up 23% YoY
- Fully repaid shareholder loans in <2 years, in Nov 2015
- 2015 drill results confirmed oxide mineralization extensions
Upcoming
- Continue to benefit from the soft ore with high potential to add oxide reserves
- US$12 million secondary crusher to be built in 2016 to maintain throughput despite harder rock mix
Quick Facts (on 100% basis)
Ownership 85% EDV, 10% Côte d’Ivoire, 5% SODEMI
Resources(incl. of Reserves)
M&I: 14.4Mt @ 2.5 g/t for 1.180MozInferred: 1.2Mt @ 1.7 g/t for 0.065Moz
Reserves 13.2Mt @ 2.4 g/t for 1.027Moz
Processing RateUp to 2.2 Mtpa Gravity/CIL plant - oxides;
1.6 Mtpa fresh ore
Gold Recovery Achieving 97% at present; 92.5% design
Mining Type Open Pit – Contractor Mining (BCM)
Production
AISC (mine-level)
2014A– $621/oz
2015A – $576/oz
2016F – $650-$700/oz
Expected Mine Life 7 years from current Reserves
Royalty 3% - 5% sliding scale
Corporate Tax 25% (5 year corporate tax holiday)
2016F
2014A
2015A
165-175koz
181koz
147koz
AgbaouMine
Abidjan
Ity Mine
Côte d’Ivoire
CREATING A PREMIER AFRICAN GOLD PRODUCER

26
Agbaou Mine – Côte d’Ivoire
• Agbaou achieved record production in FY-2015, up 24% over the previous year with a 20% increase in mill throughput and continued benefit from mining free-dig oxide ore
• Agbaou fully replaced the soft material mined during 2015 and added an additional year of free-dig oxide mine life, which should allow the mine to maintain its current production level over the next few years
• Reserve is now 13% greater than the 2014 pre-production reserve.
• Strong performance in Q1-2016 with a normal production level after record production in Q4-2015
Insights:Q4 Q1 Full year ended Dec 31
2015 2016 2014 2015
OperationalData
Mining
Waste (kt) 4,171 5,251 26,292 15,529
Ore Mined - open pit (kt) 753 820 2,741 2,818
Open pit strip ratio 5.5 6.4 9.6 5.5
Processing
Ore Processed (kt) 748 654 2,241 2,665
Grade Milled (g/t) 2.05 2.05 2.10 2.15
Recovery (%) 97% 98% 97% 97%
Production(oz) 51,732 42,765 146,757 181,365
Unit costs
Open pit mining cost (US$/t) 2.7 2.2 2.6 2.6
Processing Cost (US$/t) 7.1 5.8 7.7 6.9
G&A Cost (US$/t) 3.4 4.6 3.8 5.4
Cash cost per ounce sold (US$/oz) 452 422 523 462
All-in Sustaining Costs (US$/oz) 537 525 621 576
Financial data
SustainingCapital (US$m) 2.4 2.4 7.6 13.1
Sustaining margin (US$m) 30.2 27.0 91.2 106.3
Q3-2015
$537
43koz
Q4-2015
$525
52koz
$620
Q2-2015
41koz44koz
$583
Q1-2015
45koz
$577
Q1-2016
AISC, US$/ozProduction, koz
Production and AISC
CREATING A PREMIER AFRICAN GOLD PRODUCER

Agbaou Site Map
27CREATING A PREMIER AFRICAN GOLD PRODUCER
Agbaou Exploration Potential – Côte d’Ivoire
• 47,620m drilled in 2015, totaling 475 holes, with aim of replacing depletion and extending oxide ore mine life
• Drill results confirmed the continuity of oxide mineralization at the pit extensions and at surrounding targets
• Results include:
– 7.4 metres at 6.71 g/t at Omega
– 7.4 metres at 7.73 g/t at Gamma
– 6.8 metres at 3.18 g/t at Sigma
• In 2016, focus will continue on adding oxide material

Quick Facts (on 100% basis)
Ownership80-90% Endeavour depending on pit, remainder government of Mali
Resources(incl. of Reserves)
M&I: 18.5Mt @ 3.1 g/t for 1.844Moz Inferred: 9.0Mt @ 3.6 g/t for 1.023Moz
Reserves 6.4Mt @ 3.5 g/t for 0.725Moz
Processing Rate 1.4 Mtpa Gravity/CIL Plan
Gold Recovery 92% - 95%
Mining Type Tabakoto (UG), Segala (UG) & Kofi C Open Pit Mine
Production
AISC (mine-level)
2014A– $1,335/oz
2015A –$1,067/oz
2016F – $920-$970/oz
Expected Mine Life 4+ years from current Reserves
Royalty 6%
Corporate Tax 30%
28
Tabakoto Mine – Mali
Recent and Upcoming catalysts
Accomplished
- In 2013 the mill was expanded from 2,000 tpd to 4,000 tpd
- Segala ore production commenced in Q2 2014 and to full production by Q4 2014
- Kofi C deposit commenced production in Q1 2015
- In 2015, switch to owner and contractor fleet resulting in increased productivity
Upcoming
- Continue to optimize operation and reduce costs
- Considerable potential to expand and replace reserves
- Kofi B pre-stripping to start in H2-2016
2014A
2016F 155-175koz
2015A 152koz
127koz
CREATING A PREMIER AFRICAN GOLD PRODUCER
Tabakoto Mine
Bamako
Mali
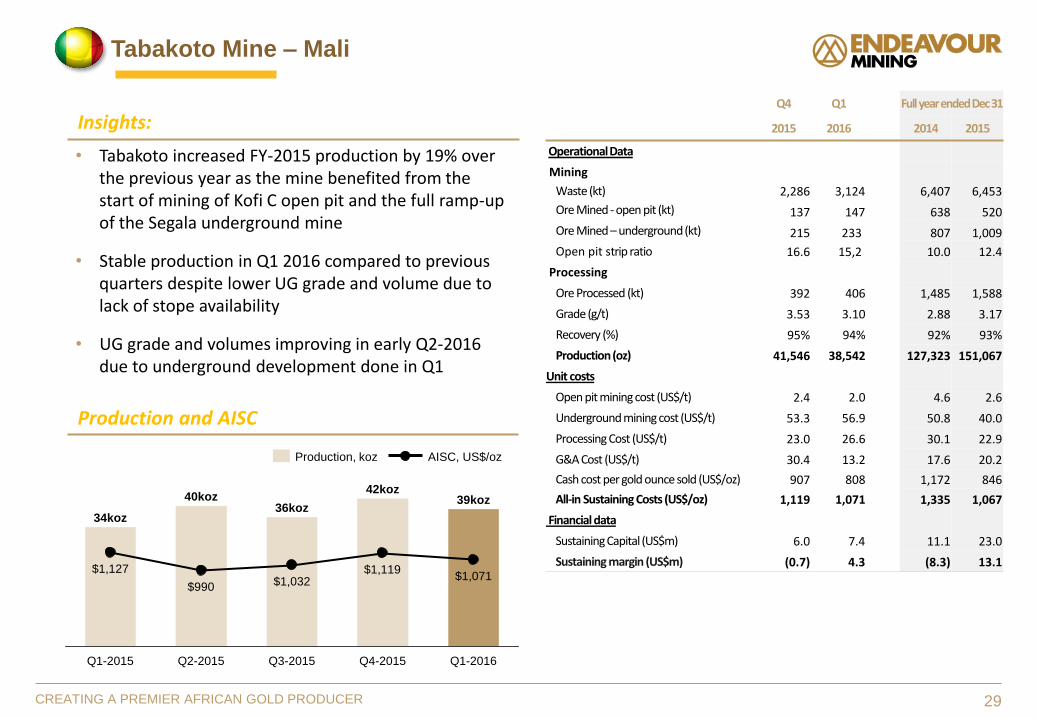
Tabakoto Mine – Mali
Q4 Q1 Full year ended Dec 31
2015 2016 2014 2015
OperationalData
Mining
Waste (kt) 2,286 3,124 6,407 6,453
Ore Mined - open pit (kt) 137 147 638 520
Ore Mined – underground(kt) 215 233 807 1,009
Open pit strip ratio 16.6 15,2 10.0 12.4
Processing
Ore Processed (kt) 392 406 1,485 1,588
Grade (g/t) 3.53 3.10 2.88 3.17
Recovery (%) 95% 94% 92% 93%
Production(oz) 41,546 38,542 127,323 151,067
Unit costs
Open pit mining cost (US$/t) 2.4 2.0 4.6 2.6
Underground mining cost (US$/t) 53.3 56.9 50.8 40.0
Processing Cost (US$/t) 23.0 26.6 30.1 22.9
G&A Cost (US$/t) 30.4 13.2 17.6 20.2
Cash cost per gold ounce sold (US$/oz) 907 808 1,172 846
All-in Sustaining Costs (US$/oz) 1,119 1,071 1,335 1,067
Financial data
SustainingCapital (US$m) 6.0 7.4 11.1 23.0
Sustaining margin (US$m) (0.7) 4.3 (8.3) 13.1
• Tabakoto increased FY-2015 production by 19% over the previous year as the mine benefited from the start of mining of Kofi C open pit and the full ramp-up of the Segala underground mine
• Stable production in Q1 2016 compared to previous quarters despite lower UG grade and volume due to lack of stope availability
• UG grade and volumes improving in early Q2-2016 due to underground development done in Q1
Insights:
29CREATING A PREMIER AFRICAN GOLD PRODUCER
Q1-2016
$1,071
39koz
Q4-2015Q1-2015
$1,032
34koz
40koz
$990
Q2-2015
$1,127
36koz
Q3-2015
$1,119
42koz
Production, koz AISC, US$/oz
Production and AISC

Tabakoto Site Map
30CREATING A PREMIER AFRICAN GOLD PRODUCER
Tabakoto Exploration Potential – Mali
• Located on the same trend as Randgold’sLoulo property which hosts >11 Moz
• After significantly optimizing and improving the mining operation, exploration to become a greater focus
• Objective of replacing production depletion and extending high grade Tabakoto and Segala underground mine lives
• Good exploration targets identified in the Kofi Nord permit area

31
Nzema Mine – Ghana
Recent and Upcoming catalysts
Accomplished
- Increased levels of purchased ore availability is strategically being used to improve the mine’s economics, operating margins and in the preservation of the mine’s reserves in-situ
Upcoming
- Benefit from accumulated ore stockpiles and increased purchased ore
- Nzema pushback ($13 million) in 2016 to should give access to higher grades
Quick Facts (on 100% basis)
Ownership 90% EDV, 10% government of Ghana
Resources(incl. of Reserves)
M&I: 34.6Mt @ 1.3 g/t for 1.490MozInferred: 5.9Mt @ 1.3 g/t for 0.244Moz
Reserves 4.7Mt @ 2.4 g/t for 0.356Moz
Processing Rate 1.6 Mtpa Gravity/CIL plant
Gold Recovery 91% to 75% depending on ore type
Mining Type Open Pit – Contractor Mining (BCM)
Production
AISC (mine-level)
2014A– $1,036/oz
2015A – $1,064/oz
2016F – $970-$1,020/oz
Expected Mine Life 4 years from current Reserves
Royalty 5% (+1% 3rd party at Adamus pits)
Corporate Tax 35%
110-130koz
110koz
2014A 115koz
2015A
2016F
AccraNzemaMine
Ghana
CREATING A PREMIER AFRICAN GOLD PRODUCER
Nzema Mine – Ghana
• Q1-2016 production impacted by lower volumes of purchased ore, as purchased ore suppliers are ramping-up operations following the halt experienced in late 2015 due to new permitting requirements imposed on them
• Lower grade stockpiles utilized during quarter to maintain optimal throughput at process plant while pit push-back commenced
• Mined grades are expected to improve in Q4-2016, following the push-back completion, while purchased ore tonnage is expected to continue to increase
Insights:
32
Q4 Q1 Full year ended Dec 31
2015 2016 2014 2015
OperationalData
Mining
Waste (kt) 1,063 1,433 6,963 4,096
Ore Mined - open pit (kt) 278 277 1,366 1,310
Open pit strip ratio 3.8 3.4 5.1 3.1
Processing
Ore Processed (kt) 446 459 1,587 1,783
Grade milled (g/t) 1.80 1.53 2.51 2.21
Recovery (%) 87% 86% 90% 87%
Production(oz)1 23,076 19,757 115,129 110,302
Unit costs
Open pit mining cost (US$/t) 5.4 4.3 4.6 4.7
Processing Cost (US$/t) 12.7 12.2 17.9 14.3
G&A Cost (US$/t) 8.4 7.2 7.9 7.1
Cash Cost per gold ounce sold(US$/oz)1 1,033 1,095 880 900
All-in Sustaining Costs (US$/oz) 1,133 1,158 1,036 1,064
Financial data
SustainingCapital (US$m) 0.9 0.04 9.8 10.8
Sustaining margin (US$m) (0.6) 0.4 26.4 10.9
1 Includes purchased ore of 6,315 ounces and 47,383 ounces for the three months and year
ended December 31, 2015, and 12,168 ounces and 42,633 ounces in the comparable periodsin 2014
CREATING A PREMIER AFRICAN GOLD PRODUCER
$953$1,011
Q2-2015
27koz
Q1-2015
33koz
$1,194
27koz
Q4-2015
$1,158
20koz
Q3-2015
23koz
$1,133
Q1-2016
Production, koz AISC, US$/oz
Production and AISC

Quick Facts (on 100% basis)
Ownership55% EDV, 30% SODEMI, 10% Côte d’Ivoire, 5% privateinvestor
Resources (HL + CIL)(incl. of Reserves)
M&I: 61.4Mt @ 1.6 g/t for 3.106MozInferred: 14.1Mt @ 1.5 g/t for 0.687Moz
Reserves (HL+CIL) 30.4Mt @ 1.7 g/t for 1.6Moz
Processing Rate 950ktpa HL
Gold Recovery 81%
Mining Type Open pit / Heap Leach
Production
AISC (mine-level) 2016F – $800-850/oz
Mine life 3 years from current Reserves + addition potential
Royalty 3% - 5% sliding scale
Corporate Tax 25%
33
Ity Mine – Côte d’Ivoire
Recent and Upcoming catalysts
Accomplished
- Gained majority ownership in 2014
- Producing at historic highs (+50% since 2012 level)
- Increased heap leach capacity from 0.6mtpa to 1.0mtpa
- Increased M&I resources since 2011 from 0.2Moz to 2.9Moz plus 0.5Moz Inferred
Upcoming
- Continued exploration success to prolong heap leach life at current production level
- DFS underway for CIL project
- Potential to increase ownership
2015A 81koz
2016F 65-75koz
AgbaouMine
Abidjan
Ity Mine
Côte d’Ivoire
CREATING A PREMIER AFRICAN GOLD PRODUCER

34CREATING A PREMIER AFRICAN GOLD PRODUCER
Ity Mine – Côte d’Ivoire
Insights:
Post acquisitionperiod
(Nov 28 to Dec 31, 2015)
Q1
2016
Full year ended 2015
OperationalData
Mining
Waste (kt) 368 1,811 5,465
Ore Mined - open pit (kt) 63 287 1,021
Open pit strip ratio 4.9 6.3 5.4
Processing
Ore Processed (kt) 71 303 1,062
Grade (g/t) 2.39 2.53 2.56
Recovery (%) 81% 90% 83%
Production(oz) 5,689 22,324 80,807
Unit costs
Open pit mining cost (US$/t) 2.1 2.4 1.7
Processing Cost (US$/t) 16.2 18.2 14.0
G&A Cost (US$/t) 11.8 10.8 12.3
Total Cash Cost excl royalties(US$/oz)
550 609 521
All-in Sustaining Costs (US$/oz) 683 710 619
Financial data
SustainingCapital (US$m) 0.5 1.3 4.5
Sustaining margin (US$m) 3.0 11.1 45.4
22koz
$621
$710
Q4-2015
19koz17koz
$628
Q2-2015 Q3-2015 Q1-2016
$603
21koz
$595
24koz
Q1-2015
Production, koz AISC, US$/oz
Production and AISC
• Ity mine integration progressed well in Q1-2016
• The Ity CIL feasibility study is expected to be completed in the third quarter of 2016
• Exploration potential highlighted to extend the heap leach mine life to 4-5 years by the end of 2016
• Strategic exploration planning underway to fully identify all exploration potential of this significantly underexplored area
• In addition, Endeavour has strategically applied for adjacent exploration tenements
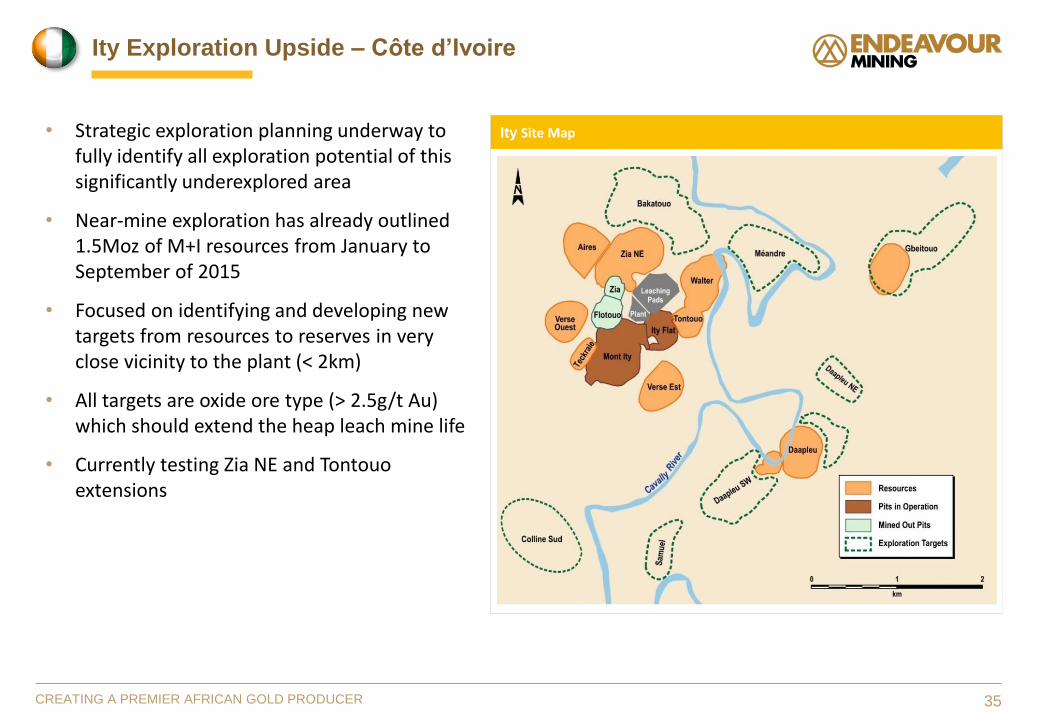
Ity Site Map
35CREATING A PREMIER AFRICAN GOLD PRODUCER
Ity Exploration Upside – Côte d’Ivoire
• Strategic exploration planning underway to fully identify all exploration potential of this significantly underexplored area
• Near-mine exploration has already outlined 1.5Moz of M+I resources from January to September of 2015
• Focused on identifying and developing new targets from resources to reserves in very close vicinity to the plant (< 2km)
• All targets are oxide ore type (> 2.5g/t Au) which should extend the heap leach mine life
• Currently testing Zia NE and Tontouoextensions

Quick Facts based upon PFS (on 100% basis)*
Ownership55% EDV, 30% SODEMI, 10% Côte d’Ivoire, 5% private investor
Status DFS expected by mid-2016
Production start date 2019E
Resources (HL + CIL)(incl. of Reserves)
M&I: 61.4Mt @ 1.6 g/t for 3.106MozInferred: 14.1Mt @ 1.5 g/t for 0.687Moz
Reserves (CIL) CIL: 28.0Mt @ 1.6 g/t for 1.4Moz
Mine Type Open pit
Processing Plant 3.0Mtpa CIL (upgraded from 2.0mtpa in PFS)
Upfront Capital (US$M) Approx. $300
LOMP Average Production 120kozpa
LOMP Average AISC (mine-level) <US$725/oz
Mine life +10 years
36
Ity CIL Project – Côte d’Ivoire
CREATING A PREMIER AFRICAN GOLD PRODUCER
Recent and Upcoming catalysts
Accomplished
- Positive PFS based on smaller mill size and not integrating all known deposits / resources
- Positive metallurgical tests
- Positive support from local government
Upcoming
- DFS underway expected to be completed mid-2016
- Additional resource expansion expected to be included in DFS mining inventory
- Potential to increase ownership
AgbaouMine
Abidjan
Ity CIL Project
*Parameters currently being evaluated in the DFS
Côte d’Ivoire

Quick Facts (on 100% basis)
Ownership 90% EDV, 10% Burkina Faso
Status Fully permitted, construction launched
Production start date First gold pour expected Q4 2017
Resources(incl. of Reserves)
M&I: 37.9Mt @ 2.1 g/t for 2.551Moz
Inferred: 3.2Mt @ 2.6 g/t for 0.274Moz
Reserves 30.6Mt @ 2.1 g/t for 2.075Moz
Mine Type Open pit
Processing Rate 3.0 Mtpa Gravity / CIL plant
Gold Recovery 93%
Upfront Capital (US$M) $328m, inclusive of $47m for the owner-mining fleet
37
Houndé Project – Burkina Faso
Houndé Project
Ouagadougou
Burkina Faso
CREATING A PREMIER AFRICAN GOLD PRODUCER
Karma Project
LOMP Summary (on 100% basis)
Processing
Total ore processed, Mt 29.7Gold grade, g/t 2.15Contained gold, koz 2,057
Recovery rate, % 93%
Production, koz 1,906
Operating Costs
Mining costs, $/t moved 2.17
Processing costs, $/t 13.36
Site G&A, $m/yr 9.8
AISC , US$/oz 709
Economic Returns1
Gold Price (US$/oz) $1,150 $1,200 $1,250 $1,300 1,350
After-tax Project NPV (5%) $230 $286 $342 $398 $437
After-tax Project IRR 24% 28% 32% 36% 39%
Payback, years² 2.7 2.4 2.2 2.0 1.8
1Based on 100% equity funding and equipment lease financing²From production start

Houndé Exploration Upside
38CREATING A PREMIER AFRICAN GOLD PRODUCER
• The Houndé exploration tenement covers +1,075km² within Burkina Faso’s highly prospective Birimian belt
• Historically, exploration focus mainly on the Vindaloo trends
• At least 15 other significant targets were identified by previous limited drilling campaigns but remain largely untested
– All located within 20km from the planned mill
– High grade targets (+5g/t) will be explored in priority
Potential to Significantly Extend Houndé’s Mine Life
Exploration Targets in Proximity to the Planned Mill

39
Karma Project – Burkina Faso
Recent and Upcoming catalysts
Accomplished
- First gold production achieved on April 11th 2016
- Mined 685,000 ore tonnes through February 29, 2016
- Started leach pad ore stacking and irrigating in early March 2016
Upcoming
- Commercial production expected in June
CREATING A PREMIER AFRICAN GOLD PRODUCER
Houndé Project
Ouagadougou
Karma Project
Karma Mine Quick Facts (1) (on 100% basis)
Ownership 90% True Gold, 10% Burkina Faso
Resources(incl. of Reserves)
M&I: 75.2Mt @ 1.08 g/t for 2.621MozInferred: 65.3Mt @ 1.13 g/t for 2.362Moz
Reserves 33.2Mt @ 0.89 g/t for 0.949Moz
Processing Rate 4.0mtpa Heap Leach
Gold Recovery 87%
Mining TypeShallow open pit and free digging material with no
blasting required, low strip ratio
Avg Annual Production (y 1-5) 110 – 120 kozs @ <$700/oz
Mine life8 years mine life based on reserves + 2.5 years from
North Kao deposit (inferred resource)
Infrastructure
Easy operation with low power requirements (~4MW)
with six diesel gen-sets.
Water supplied by barrage on river 4 km south of
plant; pumped to holding ponds at site
Tax regime 3% - 5% sliding scale royalty / 17.5% Corporate tax
Financing
• Drawn US$105m out of US$120m gold streaming
facility with Franco-Nevada and Sandstorm Gold
(representing 2.3% cost of capital ay US$1,200/oz
and DFS mine mine)
• Drawn US$6.0m US$10m Auramet loan

Overview of Truegold’s Assets: Karma Exploration Upside
40CREATING A PREMIER AFRICAN GOLD PRODUCER
6.0m @ 29.5g/t Au
70.5m @ 1.9g/t Au
5.6m @ 12.61g/t Au
7.1m @6.6g/t Au
16.3m @ 0.9g/t Au
22.5m @ 2.4g/t Au
76.0m @ 0.5g/t Au
7 DRILL DISCOVERIES
45 NEW DRILL READY TARGETS
233 SIGNIFICANT GOLD ANOMALIES
• 866km² land package
• ~90 km strike length of regional unconformity
• Seven targets drilled, 100% hit rate
• Exploration focus on expanding leachable resource base
• Controls on gold mineralization well understood
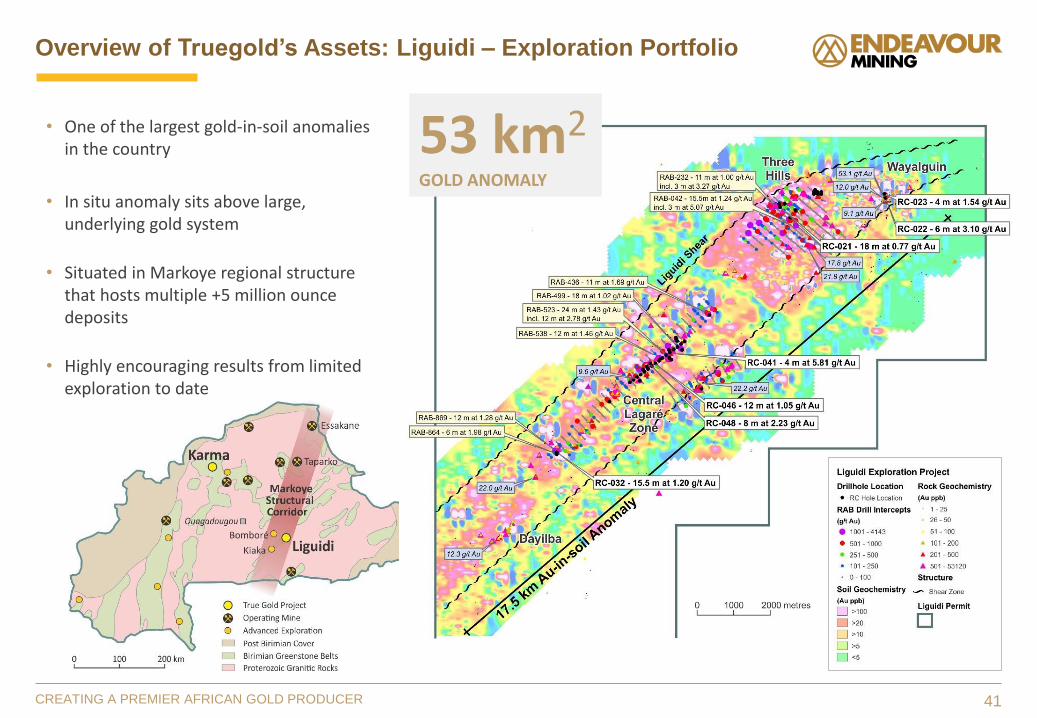
Overview of Truegold’s Assets: Liguidi – Exploration Portfolio
41CREATING A PREMIER AFRICAN GOLD PRODUCER
• One of the largest gold-in-soil anomalies in the country
• In situ anomaly sits above large, underlying gold system
• Situated in Markoye regional structure that hosts multiple +5 million ounce deposits
• Highly encouraging results from limited exploration to date
53 km2
GOLD ANOMALY
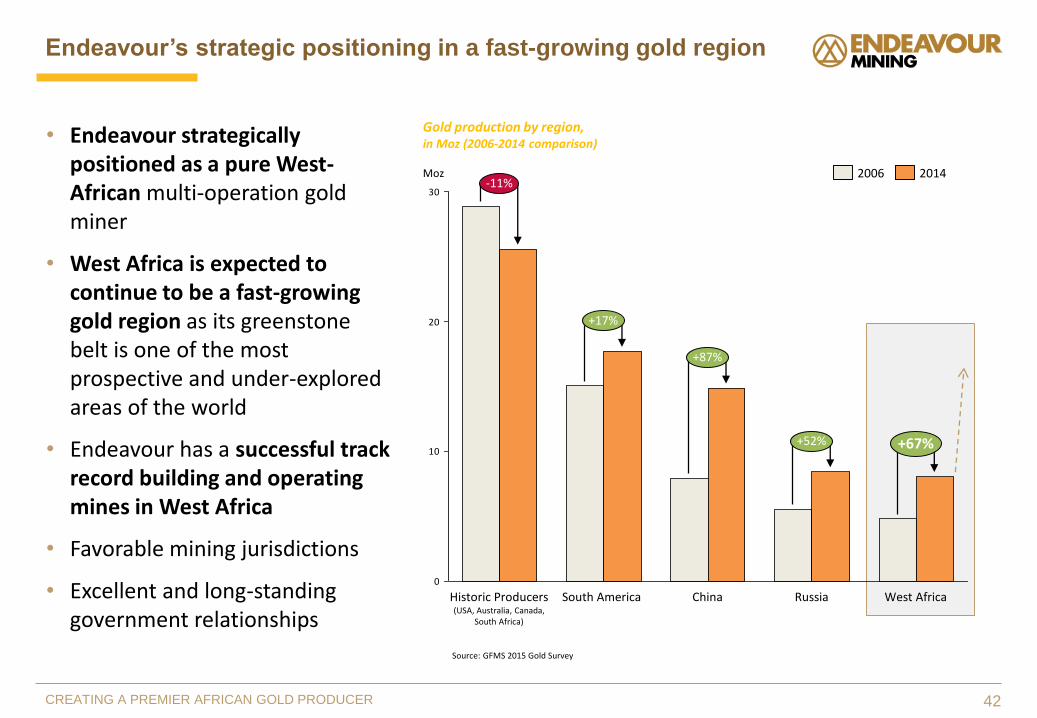
Endeavour’s strategic positioning in a fast-growing gold region
• Endeavour strategically positioned as a pure West-African multi-operation gold miner
• West Africa is expected to continue to be a fast-growing gold region as its greenstone belt is one of the most prospective and under-explored areas of the world
• Endeavour has a successful track record building and operating mines in West Africa
• Favorable mining jurisdictions
• Excellent and long-standing government relationships
CREATING A PREMIER AFRICAN GOLD PRODUCER 42
Gold production by region, in Moz (2006-2014 comparison)
0
10
20
30
South AmericaHistoric Producers(USA, Australia, Canada,
South Africa)
+67%+52%
+87%
+17%
-11%
West AfricaRussiaChina
20142006Moz
Source: GFMS 2015 Gold Survey

Reserve and Resource Table
Resources inclusive of reserves
P&P Reserves M&I Resources Inferred Resources
(Mt) Au g/t (koz) (Mt) Au g/t (koz) (Mt) Au g/t (koz)
Agbaou Mine 13.2 2.42 1,027 14.4 2.54 1,180 1.2 1.71 65
Tabakoto Mine 6.4 3.50 725 18.5 3.09 1,844 9.0 3.55 1,023
Nzema Mine 4.7 2.35 356 34.6 1.34 1,490 5.9 1.28 244
Ity Mine & CIL Project 30.4 1.65 1,613 61.4 1.57 3,106 14.1 1.52 687
Karma Mine 33.2 0.89 949 75.2 1.08 2,621 65.3 1.13 2,362
Houndé Project 30.6 2.11 2,075 37.9 2.09 2,551 3.2 2.62 274
Total 6,744 12,793 4,655
Attributable 5,405 10,238 3,852
GoldPrice and Cut-off GradesResources Gold price Resource lower cut-off grade Reserves Gold Price Reserve lower cut-off grade *
US$/oz g/t Au US$/oz g/t Au
Agbaou Mine 1,500 0.5 1,350 0.6 to 0.8
Tabakoto Mine 1,350 to 1,600* 0.5 to 1.5* 1,250 1.1 to 1.9
Nzema Mine 1,500 0.5 1,250 0.8 to 1.9
Ity Mine & CIL Project 1,500 0 to 0.5* HL: 1,250 CIL: 1,150* 0.6 to 1.5
Karma Mine 1,557 0.2 to 0.5* 1,250 0.2 to 0.3
Houndé Project 1,500 0.5 1,300 0.4 to 0.8
*Varies by distance from deposit to the mill, ore type and mining method (OP/UG)
As at December 31, 2015
Full details and notes of reserves and resources can be found under the ‘Reserves and Resources’ section on the Company’s website at www.endeavourmining.com
CREATING A PREMIER AFRICAN GOLD PRODUCER 43

1 000
1 100
1 200
1 300
1 400
1 500
Upside on 100% of production
44CREATING A PREMIER AFRICAN GOLD PRODUCER
Gold Revenue Protection Program Limit Debt Drawdown
Gold Revenue Protection Program : Gold Option Collar Strategy
US$1,300US$1,100US$1,000
$70m
$30m
US$1,200
($9m) ($9m)
Gold price in US$/oz
Meaningful replacement of reduced revenue
Collar “bought puts” strike
Collar “written calls” strike
Upside on 50% of production
Protection on 50% of
production
Proceeds from Gold Option Contracts (US$) (net of premium cost)
• Gold Option Contracts aim to increase the certainty of the free cash flow during the construction period
Objective of using free cash flow rather than Revolving Credit Facility
Significantly reduces debt requirements, even if the gold price drops to US$1,000/oz
• Gold Option Contracts applied to ~50% of Endeavour’s expected production over 15 months (Apr 2016-Jun 2017)
Protect 50% of production below $1,200/oz
Fully exposed between 1,200 and $1,400/oz
Upside beyond $1,400/oz on 50% of production
• Full exposure to the gold price once project is built

CREATING A PREMIER AFRICAN GOLD PRODUCER
Appendix 2:Company Information

Endeavour Mining – Board of DirectorsChanges effective post-AGM on June 28th, 2016
46CREATING A PREMIER AFRICAN GOLD PRODUCER
Michael E. Beckett – Chairman, Non-executive DirectorFormer chair of Ashanti Goldfields & former Managing Director of Consolidated Gold Fields
Ian Cockerill – Non-executive Director
• Former business development in AngloGold & CEO of both Gold Fields & AngloCoal
• Current chairman of Petmin Ltd., non-executive director of Orica Ltd., senior lead independent director of Ivanhoe Mines
Frank Giustra – Non-executive Director
• President & CEO of Fiore Financial Corp., private firm managing a broad portfolio of private equity investments
• Former President, Chairman & CEO of Yorkton Securities
• Former Chairman of Endeavour Financial
Ian Henderson – Non-executive Director
• Former Managing Director at JP Morgan Asset Management and managed JP Morgan’s Natural Resources Funds
• Former director & chief investment officer at Wardley
Wayne McManus – Non-executive Director
• Work experience in the private banking sector, providing accounting & wealth management services for high net worth clients
Miguel Rodriguez – Non-executive Director
• Director of D.Societe Financiere in Geneva
• Former Economic Minister & Chief of the Economic Cabinet of the Republic of Venezuela
• Former President of the Central Bank of Venezuela & Governor to the International Monetary Fund, the World Bank & the Inter-American Development Bank
Naguib Sawiris – Non-executive Director
• Chairman of the advisory board of La Mancha, Chairman of the Board of Orascom TMT Investments & Executive Chairman & CEO of Orascom Telecom Medi & Technology Holding
• Sawiris Family have substantial interests in the telcom, construction & fertilizer, cement, real estate & hotel development industries, as well as other businesses
Neil Woodyer – Founder & CEO (To step down)
• Former CEO of Lloyds International Trading, a subsidiary of Lloyds Bank plc
• Former CEO of Amalgamated Metal’s group of New York & Latin America-based metal trading & mining finance
Sébastien de Montessus – President & Director (Appointed as CEO)
• Former CEO of the La Mancha Group (2012-2015)
• Former member of the Executive Board & Group Deputy CEO of AREVA Group & CEO of AREVA Mining
• Prior to joining AREVA in 2002, Mr. de Montessus was an investment banker at Morgan Stanley in London (M&A, ECM)

Cash Flow generation is on track to meet guidance…
Q1-2016 Q4-2015
US$m US$/oz US$m US$/oz
Gold revenue 151 1,192 157 1,102
Royalties (7) (54) (8) (53)
Cash cost for ounces sold (90) (709) (105) (740)
Cost G&A (5) (38) (8) (56)
Sustaining Capital (11) (87) (10) (70)
Sustaining Exploration (1) (12) (2) (15)
AISC Costs 115 900 133 934
AISC Margin 37 292 24 168
Non-sustaining exploration (2) (15) (2) (14)
Non-sustaining capital (7) (55) (10) (70)
Free cash flow (before WC, taxes and financing costs) 28 227 12 84
Figures include the discontinued Youga operations, for the first 2 months of 2016
CREATING A PREMIER AFRICAN GOLD PRODUCER 47

…with some phasing on working capital changes in Q1- 2016
In US$m Q1-2016 Q4-2015
Free cash flow (before WC, taxes and financing costs) 28 12
Working capital change (20) 26
Taxes paid (3) (1)
Interest paid (0) (7)
Other items* (2) (5)
Free Cash Flow 3 25
*Includes financial fees, lease repayments, hedge settlements, realized loss on derivative financial instruments, unrealized foreign exchange loss on cash, and other non-operating cash adjustments.
48CREATING A PREMIER AFRICAN GOLD PRODUCER
Insights:
Negative working capital movement in Q1-2016 was mainly due to phasing on accounts payables between Q4-2015 and Q1-2016.
There were no interest payments scheduled in Q1-2016, as it is payable twice a year in June and December.

49CREATING A PREMIER AFRICAN GOLD PRODUCER
Balance Sheet
For more information, see notes to the financial statements,available on www.Endeavourmining.com
March 31,
2016
December 31,
2015
ASSETS
Current
Cash 117,004$ 109,519
Cash - restricted 3,583 4,824
Trade and other receivables 5,474 13,045
Income taxes receivable (Note 17) 283 2,945
Inventories (Note 5) 74,653 93,939
Prepaid expenses and other 12,603 12,640
Loan receivable (Note 6) 15,000 -
228,600 236,912
Mining interests (Note 7) 731,282 740,756
Deferred income taxes 72,820 70,116
Other long term assets (Note 8) 6,083 6,310
1,038,785$ 1,054,094$
LIABILITIES
Current
Trade and other payables 112,659 127,581
Current portion of finance lease obligations (Note 9) 4,315 4,394
Current portion of derivative financial liabilities (Note 10) 5,554 5,463
Income taxes payable 17,759 16,061
140,287 153,499
Finance lease obligations (Note 9) 8,282 9,025
Long-term debt (Note 11) 226,708 225,582
Other long term liabilities (Note 12) 36,052 38,862
Deferred income taxes 25,791 30,014 437,120 456,982
EQUITY
Share capital (Note 13 (a)) 1,071,898 1,071,088
Equity reserve (Note 13) 41,981 41,966
Retained earnings (547,995) (548,951)
Equity attributable to shareholders
of the Corporation 565,884 564,103
Non-controlling interests (Note 14) 35,781 33,009
Total equity 601,665 597,112
1,038,785$ 1,054,094$
COMMITMENTS AND CONTINGENCIES (NOTE 21)
SUBSEQUENT EVENTS (NOTE 22)
Approved by the Board: April 29, 2016
"Neil Woodyer" Director "Wayne McManus" Director

50CREATING A PREMIER AFRICAN GOLD PRODUCER
P&L
For more information, see notes to the financial statements,available on www.Endeavourmining.com
2016 2015
Revenues
Gold revenue 143,957$ 130,449$
Cost of sales
Operating expenses 83,985 79,759
Depreciation and depletion 26,224 17,958
Royalties 6,590 6,353
Earnings from mine operations 27,158 26,379
Corporate costs 4,826 3,983
Acquisition costs (Note 22) 1,249 -
Share-based payments (Note 13 (b)) 2,555 1,130
Exploration 914 649
Earnings from operations 17,614 20,617
(Losses) gains on financial instruments (Note 15) (2,875) 3,891
Finance costs (6,844) (7,808)
Other expenses (Note 16) 90 169
Other income (expenses) (9,629) (3,748)
Earnings from continuing operations before taxes 7,985 16,869
Current income taxes expense (2,342) (879)
Deferred income taxes recovery (expense) 5,488 (5,066)
Net and comprehensive earnings from continuing operations 11,131 10,924
Net (loss) earnings from discontinued operations and loss on disposal (Note 4) (3,273) 2,027
Total net and comprehensive earnings 7,858 12,951
Net earnings from continuing operations attributable to:
Shareholders of Endeavour Mining Corporation 4,054 7,271
Non-controlling interests (Note 14) 7,077 3,653
Net earnings from continuing operations 11,131$ 10,924$
Total net earnings attributable to:
Shareholders of Endeavour Mining Corporation 956 9,045
Non-controlling interests (Note 14) 6,902 3,906
Total net earnings 7,858$ 12,951$
Net earnings per share from continuing operations (Note 13 (c))
Basic earnings per share 0.07$ 0.18$ Diluted earnings per share 0.07$ 0.18$
Net earnings per share (Note 13 (c))
Basic earnings per share 0.02$ 0.22$ Diluted earnings per share 0.02$ 0.22$
Three months ended March 31,

51CREATING A PREMIER AFRICAN GOLD PRODUCER
Cash Flow Statement
For more information, see notes to the financial statements,available on www.Endeavourmining.com
2016(1) 2015 (1)
Operating Activities
Earnings before taxes 5,583$ 20,289$
Adjustments for:
Depreciation and depletion 27,483 19,451
Unwinding of reclamation obligation 192 194
Amortization of financing costs 1,124 1,016
(115) (79)
Share-based payments, net of cash paid on settlement of performance share units 1,951 1,130
Unrealized gain on derivative financial instruments 91 -
Loss on derecognition of promissory note - (2,025)
Realized loss on derivative financial instruments 3,502 2,283
Pension adjustment 72 -
Loss on disposition of Youga Mine (Note 4) 1,025 -
Interest expense 3,548 3,937
Unrealized foreign exchange (gain) loss (1,250) (1,592)
Income taxes paid (2,624) (2,834)
Operating cash flows before non-cash working capital 40,582 41,770
Changes in non-cash working capital:
Trade and other receivables 100 (2,161)
Prepaid expenses and other (2,328) 1,298
Inventories (4,636) (294)
Trade and other payables (13,571) (9,711)
Other - 522
Cash generated from operating activities 20,147$ 31,425$
Investing Activities
Expenditures and prepayments on mining interests (21,032) (24,933)
Bridge loan advanced to True Gold (Note 6) (15,000) -
Cash received on sale of Youga Mine (net) (Note 4) 22,086 -
Other 539 (461)
Cash used in investing activities (13,407)$ (25,394)$
Financing Activities
Proceeds received from the issue of common shares 539 -
Cash payment on settlement of hedge programs (Note 10) (3,212) (2,283)
Payment of financing and other fees - (5,387)
Interest paid (431) (4,172)
Repayment of finance lease obligation (Note 11) (823) (818)
Cash used in financing activities (3,927)$ (12,660)$
Effect of exchange rate changes on cash 4,672 854
Increase (decrease) in cash 7,485 (5,775)
Cash, beginning of year 109,519 62,179
Cash, end of year 117,004$ 56,404$
Unrealized gain on marketable securities and interest on working capital loan
Three months ended March 31,

52CREATING A PREMIER AFRICAN GOLD PRODUCER
Vincent Benoit
EVP – Strategy & Business Development+33 (0)1 70 38 36 [email protected]
Martino De Ciccio
VP – Strategy & Investor Relations+33 (0)1 70 38 36 [email protected]
DFH Public Affairs in Toronto
John Vincic, Senior Advisor+416 206 0118 [email protected]
Brunswick Group LLP in London
Carole Cable, Partner
+44 7974 982 458
Contact Information