
ManaGeMent’S DiSCuSSiOn anD analYSiS ManaGeMent’S ...
43
22 LAURENTIAN BANK 2010 Annual Report MANAGEMENT’S DISCUSSION AND ANALYSIS MANAGEMENT’S DISCUSSION AND ANALYSIS FOR THE YEAR ENDED OCTOBER 31, 2010 OVERVIEW OF FISCAL 2010 For the year ended October 31, 2010, the Bank reported net income of $122.9 million, or diluted earnings of $4.63 per share, compared with $113.1 million, or diluted earnings of $4.23 per share in 2009. Return on common shareholders’ equity was 11.5% in 2010, compared with 11.4% in 2009. Net income in 2009 included income from discontinued operations of $11.5 million, or diluted earnings of $0.48 per share, related to the sale of asset management activities in fiscal 2005. Income from continuing operations was $101.7 million in 2009, or $3.75 diluted per share, with a return on common shareholders’ equity of 10.1%. The 21% increase in income from continuing operations over last year reflects the strong growth in mortgage loans and commercial loans, as well as a solid contribution from each business segment. For the fourth year in a row, the Bank reported record results, despite the very challenging economic conditions around the world and fierce competition in most retail segments. In addition, in 2010, the Bank compensated for the lost stream of revenue from discontinued operations, the significantly reduced income from securitization and higher loan losses. The Bank’s solid operating foundation built over the recent years, the growth momentum created in all its businesses, and employees’ commitment, were at the forefront of the Bank’s success in 2010. With solid liquidity and capital levels, the Bank maintained a strong financial position throughout the year and remains well positioned for fiscal 2011. SUMMARY OF FINANCIAL RESULTS RETURN ON COMMON SHAREHOLDERS’ EQUITY (as a percentage) RETURN ON COMMON SHAREHOLDERS’ EQUITY FOR CONTINUING OPERATIONS RETURN ON COMMON SHAREHOLDERS’ EQUITY 2006 2007 2008 2009 2010 6 10 14 7.5 10.3 10.5 10.1 11.4 11.0 10.9 8.2 11.5 11.5 NET INCOME (in millions of dollars) INCOME FROM CONTINUING OPERATIONS NET INCOME 2006 2007 2008 2009 2010 50 75 100 125 65.6 70.3 90.1 94.5 98.1 102.5 101.7 113.1 122.9 122.9 DILUTED EARNINGS PER SHARE (in dollars) DILUTED EARNINGS PER SHARE FROM CONTINUING OPERATIONS DILUTED EARNINGS PER SHARE 2006 2007 2008 2009 2010 2.0 3.5 5.0 2.28 2.48 3.48 3.80 4.23 3.29 3.61 3.75 4.63 4.63
Transcript of ManaGeMent’S DiSCuSSiOn anD analYSiS ManaGeMent’S ...
22 laurentian banK 2010 Annual Report
ManaGeMent’S DiSCuSSiOn anD analYSiS
ManaGeMent’S DiSCuSSiOn anD analYSiSFOR THE YEAR ENDED OCTOBER 31, 2010
Our people
OVERVIEW OF FISCAL 2010
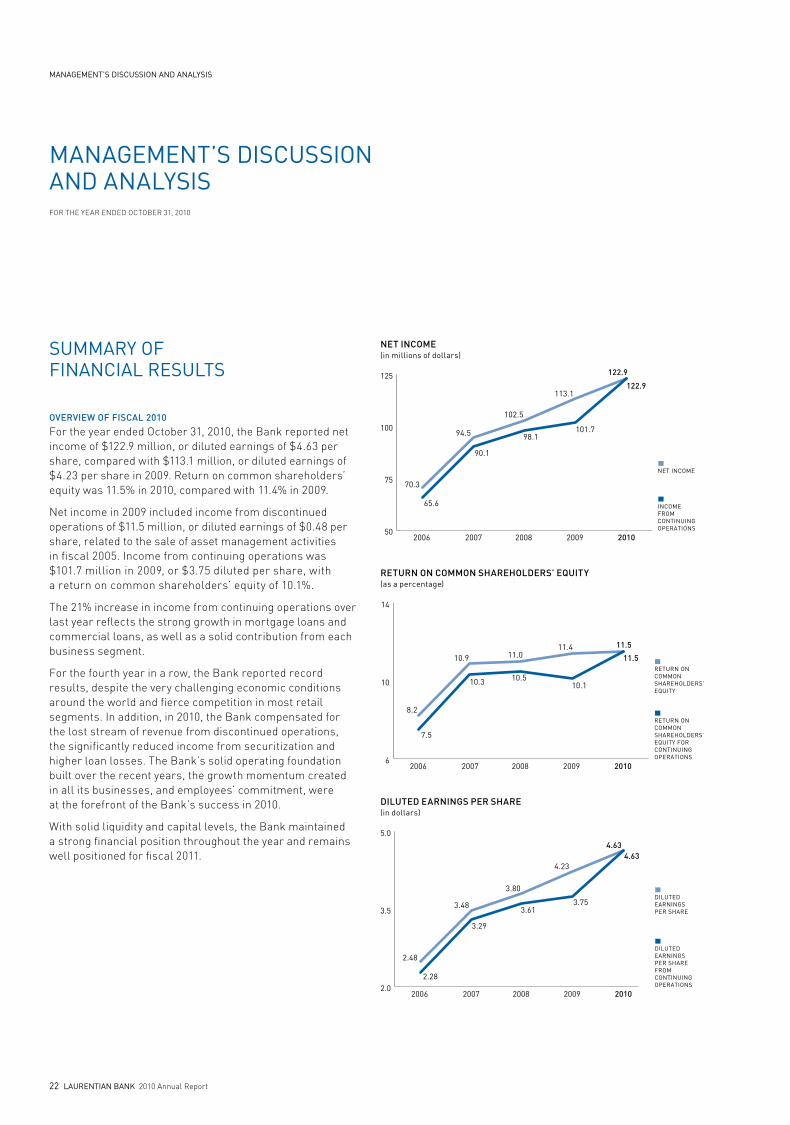
For the year ended October 31, 2010, the Bank reported net income of $122.9 million, or diluted earnings of $4.63 per share, compared with $113.1 million, or diluted earnings of $4.23 per share in 2009. Return on common shareholders’ equity was 11.5% in 2010, compared with 11.4% in 2009.
Net income in 2009 included income from discontinued operations of $11.5 million, or diluted earnings of $0.48 per share, related to the sale of asset management activities in fiscal 2005. Income from continuing operations was $101.7 million in 2009, or $3.75 diluted per share, with a return on common shareholders’ equity of 10.1%.
The 21% increase in income from continuing operations over last year reflects the strong growth in mortgage loans and commercial loans, as well as a solid contribution from each business segment.
For the fourth year in a row, the Bank reported record results, despite the very challenging economic conditions around the world and fierce competition in most retail segments. In addition, in 2010, the Bank compensated for the lost stream of revenue from discontinued operations, the significantly reduced income from securitization and higher loan losses. The Bank’s solid operating foundation built over the recent years, the growth momentum created in all its businesses, and employees’ commitment, were at the forefront of the Bank’s success in 2010.
With solid liquidity and capital levels, the Bank maintained a strong financial position throughout the year and remains well positioned for fiscal 2011.
SuMMarY OF FinanCial reSultS
buSineSS review
laurentian banK 2010 Annual Report 21
RETURN ON COMMON SHAREHOLDERS’ EQUITY(as a percentage)
RETURN ON COMMON SHAREHOLDERS’EQUITY FOR CONTINUING OPERATIONS
RETURN ON COMMONSHAREHOLDERS’EQUITY
2006 2007 2008 2009 20106
10
14
7.5
10.3 10.510.1
11.411.010.9
8.2
11.5
11.5
NET INCOME(in millions of dollars)
INCOME FROM CONTINUING OPERATIONS
NET INCOME
2006 2007 2008 2009 201050
75
100
125
65.6
70.3
90.1
94.5 98.1
102.5
101.7
113.1122.9
122.9
DILUTED EARNINGS PER SHARE(in dollars)
DILUTED EARNINGS PER SHARE FROM CONTINUING OPERATIONS
DILUTED EARNINGS PER SHARE
2006 2007 2008 2009 20102.0
3.5
5.0
2.28
2.48
3.48
3.80
4.23
3.29
3.613.75
4.634.63

business segments For the years ended october 31 (in thousands oF dollars, except percentage amounts)
29 rapport annuel 2010 banque laurentienne
rapport de gestion
Corporate priorities for 2011
1 3the bank’s three main priorities will again remain at the forefront of strategic development for 2011. these priorities have provided the bank with a framework in the operational decision-making process.
reVieW of 2010 business segment operations and 2011 priorities
2 IncreaseourprofItabIlIty ensure sustained growth in each business segment, by focusing on markets in which we have strong competitive advantages
continue implementing strategies to develop our sales culture, while maintaining excellence in customer service—the cornerstone of our reputation
ImproveoureffIcIency continue optimizing key processes
ensure excellence in execution
DevelopourhumancapItal reinforce hiring strategies and talent management to support sustained growth
support business segment initiatives to enhance employee performance
this section outlines the bank’s operations according to its organizational structure. services to individuals, businesses, financial intermediaries and institutional clients are offered through the following business segments:
retaIl&smeQuébec
realestate&commercIal
b2btrust
laurentIanbanksecurItIes&capItalmarkets
other
as of november 1, 2009, certain capital market activities which were previously reported in the other segment are now reported with laurentian bank securities activities under the newly formed laurentian bank securities and capital markets business segment. in addition, foreign exchange and international services, which were also formerly reported in the other segment, are now reported in the real estate & commercial segment. the retail & sme Québec and b2b trust business segments were not affected by this reorganization. comparative figures were reclassified to conform to the current year presentation.
the solid contribution from each business segment, resulting from an overall higher business activity level, strong volumes increases and better interest margins, played a central role in the bank’s overall good performance in 2010.
Table 3INCOMe CONTRIbUTIONS
For the years ended october 31 (in thousands of dollars, except percentage amounts)
ReTaIl & SMeQUébeC
Real eSTaTe & COMMeRCIal b2b TRUST
laUReNTIaN baNk
SeCURITIeS aNd CapITal
MaRkeTS OTheR TOTal
2010 Income from continuing operations Growth 2010/2009
$47,013 19%
$49,089 43%
$46,394 45%
$ 9,988(17 )%
$(29,543
n.a. )
$122,941
21%
2009income from continuing operationsgrowth 2009/2008
$39,623 (3)%
$34,42113%
$32,092(8)%
$11,976 255%
$(16,448n.a.
) $101,664 4
%
retaIl&smeQuébec
FINaNCIal hIGhlIGhTS 2010 income from continuing operations up 19% residential mortgage loan portfolio up 10% Commercial loan portfolio up 9% average deposits up 9% revenues up $27.6 million or 6%
OveRvIewthe retail & sme business segment provides banking products and services to retail customers as well as to small and medium sized enterprises in québec. With its network of 157 branches, 23 commercial banking centres and 413 automated banking machines, it operates the third largest retail branch network in québec.
key aCCOMplIShMeNTS diversified revenue streams rolled out a customer relationship management tool (Crm), in all branches expanded mobile banking teams and increased the presence of financial planners in all branches furthered the niche strategy by broadening specialist teams to serve the québec sme market
pRIORITIeS FOR 2011 maximize benefits of the customer relationship management system for customers and the bank increase our share of wallet per customer pursue the evolution of the three distribution channels: branches, mobile and virtual Continue building specialist teams to serve the québec sme market improve operational efficiency through end-to-end process streamlining
the retail & sme québec business segment had a great year, with income from continuing operations improving 19% to $47.0 million, compared to $39.6 million for 2009. net income for 2009 was $51.1 million and included income from discontinued operations of $11.5 million related to the sale of asset management activities in fiscal 2005. revenues improved by 6% or $27.6 million, from $425.9 million in 2009 to $453.5 million in 2010, as a result of the significant growth in loan and deposit volumes stemming from various growth initiatives and favourable market conditions, as well as higher prepayment penalties on mortgage loans. Credit insurance revenues, income from mutual funds and credit card service revenues all improved year-over-year. non-interest expenses also increased by 6%, or $19.1 million, from $333.5 million in 2009 to $352.6 million in 2010, essentially due to increased salaries. loan losses decreased slightly to $40.9 million in 2010 from $41.9 million in 2009, as a result of lower losses on the point-of-sale financing portfolio, partially offset by higher losses in the small commercial business portfolio. retail credit conditions have steadily improved over the last 18 months and remain sound at the onset of 2011.
Table 4
SeGMeNT CONTRIbUTION2010 2009 2008
net interest incomeother income
$ 323,740 129,774
$ 305,959 119,965
$ 299,336 115,894
total revenueprovision for loan lossesnon-interest expenses
453,514 40,919
352,621
425,924 41,887
333,475
415,230 33,583
326,871
income from continuing operations before income taxesincome taxes
59,974 12,961
50,562 10,939
54,776 13,785
income from continuing operationsincome from discontinued operations, net of income taxes
47,013
–
39,623
11,469
40,991
4,423
net income $ 47,013 $ 51,092 $ 45,414
efficiency ratioaverage loansaverage deposits
77.8 $11,688,722
$ 8,580,912
% 78.3 $ 10,836,421 $ 7,881,703
% 78.7 $ 9,899,648 $ 7,460,949
%
retaIl&smeQuébec inCome from Continuing operations up
19%
realestate&commercIal net inCome up
43%
b2btrust Continued reVenue groWth of $24.3 million or
24%
otherimproVement in net interest margins
laurentIanbanksecurItIes&capItalmarketsstrong performanCe of the institutional fixed inCome diVision
23 laurentian banK 2010 annual report
management’s disCussion and analYsis

RETAIL & SME QuébEc
Financial HigHligHts 2010 Income from continuing operations up 19% Residential mortgage loan portfolio up 10% Commercial loan portfolio up 9% Average deposits up 9% Revenues up $27.6 million or 6%
OverviewThe Retail & SME business segment provides banking products and services to retail customers as well as to small and medium sized enterprises in Québec. With its network of 157 branches, 23 commercial banking centres and 413 automated banking machines, it operates the third largest retail branch network in Québec.
Key accOmplisHments Diversified revenue streams Rolled out a customer relationship management tool (CRM), in all branches
Expanded mobile banking teams and increased the presence of Financial Planners in all branches
Furthered the niche strategy by broadening specialist teams to serve the Québec SME market
priOrities FOr 2011 Maximize benefits of the customer relationship management system for customers and the Bank
Increase our share of wallet per customer Pursue the evolution of the three distribution channels: branches, mobile and virtual
Continue building specialist teams to serve the Québec SME market
Improve operational efficiency through end-to-end process streamlining
The Retail & SME Québec business segment had a great year, with income from continuing operations improving 19% to $47.0 million, compared to $39.6 million for 2009. Net income for 2009 was $51.1 million and included income from discontinued operations of $11.5 million related to the sale of asset management activities in fiscal 2005. Revenues improved by 6% or $27.6 million, from $425.9 million in 2009 to $453.5 million in 2010, as a result of the significant growth in loan and deposit volumes stemming from various growth initiatives and favourable market conditions, as well as higher prepayment penalties on mortgage loans. Credit insurance revenues, income from mutual funds and credit card service revenues all improved year-over-year. Non-interest expenses also increased by 6%, or $19.1 million, from $333.5 million in 2009 to $352.6 million in 2010, essentially due to increased salaries. Loan losses decreased slightly to $40.9 million in 2010 from $41.9 million in 2009, as a result of lower losses on the point-of-sale financing portfolio, partially offset by higher losses in the small commercial business portfolio. Retail credit conditions have steadily improved over the last 18 months and remain sound at the onset of 2011.
table 4
segment cOntributiOn2010 2009 2008
Net interest incomeOther income
$ 323,740 129,774
$ 305,959 119,965
$ 299,336 115,894
Total revenueProvision for loan lossesNon-interest expenses
453,514 40,919
352,621
425,924 41,887
333,475
415,230 33,583
326,871
Income from continuing operations before income taxesIncome taxes
59,974 12,961
50,562 10,939
54,776 13,785
Income from continuing operationsIncome from discontinued operations, net of income taxes
47,013
–
39,623
11,469
40,991
4,423
Net income $ 47,013 $ 51,092 $ 45,414
Efficiency ratioAverage loansAverage deposits
77.8 $11,688,722
$ 8,580,912
% 78.3 $ 10,836,421 $ 7,881,703
% 78.7 $ 9,899,648 $ 7,460,949
%
BuSINESS SEgMENTS FOr ThE yEArs ENdEd OcTObEr 31 (IN ThOusANds OF dOllArs, ExcEPT PErcENTAgE AmOuNTs)
RETAIL & SME QuébEc INCoME FRoM CoNTINuINg oPERATIoNS uP
19%
REAL ESTATE & cOMMERcIAL NET INCoME uP
43%
b2b TRuST CoNTINuED REvENuE gRoWTh oF $24.3 MILLIoN oR
24%
OThERIMPRovEMENT IN NET INTEREST MARgINS
LAuRENTIAN bANK SEcuRITIES & cAPITAL MARKETSSTRoNg PERFoRMANCE oF ThE INSTITuTIoNAL FIxED INCoME DIvISIoN

REAL ESTATE & cOMMERcIAL
Financial HigHligHts 2010 Net income up 43% Average loan growth of 19% Revenues up $25.8 million or 28% good credit quality, despite increase in loan losses
OverviewThe Real Estate & Commercial business segment consists of two areas of operation. The first is real estate financing, specializing in financing for condominiums, office buildings, shopping centers and residential developments. The second is commercial financing, specializing in financing for medium-sized enterprises in Québec and ontario. This segment also offers international services dedicated to the foreign trade activities of small and medium-sized businesses.
Key accOmplisHments Achieved record new business activity and profitability opened a real estate loan syndication desk in Toronto to support growth and facilitate diversification of the portfolio Invested in human capital by increasing staff complement by 15%
priOrities FOr 2011 grow the balance sheet profitably and within acceptable risk parameters Enlarge the deposit base to support loan growth and minimize cost of funds Invest in human capital in the areas of business development and support staff Build on existing success in commercial lending and develop new market niches Invest in information technology to sustain good efficiency ratios
The Real Estate & Commercial business segment’s contribution to net income improved by $14.7 million, or 43%, to $49.1 million in 2010, compared with $34.4 million in 2009. Total revenue increased by 28% or $25.8 million, from $93.5 million in 2009 to $119.3 million in 2010, as a result of strong loan growth and recent initiatives to grow deposit volumes, as well as sound pricing strategies. Loan losses were higher at $24.1 million in 2010, compared with $9.8 million in 2009. The increase mainly reflects losses related to certain commercial and real estate accounts which were adversely impacted by the economic slowdown, as well as higher loan volumes. Nonetheless, overall credit quality improved toward the end of the year, as evidenced by a decline in net impaired loans. Non-interest expenses decreased by 26% or $8.8 million, from $33.6 million in 2009 to $24.8 million in 2010, mainly as results for 2009 included charges related to specific operational issues, mostly recovered early in 2010.
table 5
segment cOntributiOn2010 2009 2008
Net interest incomeOther income
$ 84,475 34,852
$ 67,598 25,915
$ 56,947 20,406
Total revenueProvision for loan lossesNon-interest expenses
119,327 24,124 24,801
93,513 9,817
33,589
77,353 5,374
26,441
Income before income taxes Income taxes
70,402 21,313
50,107 15,686
45,538 15,057
Net income $ 49,089 $ 34,421 30,481
Efficiency ratioAverage loansAverage deposits
20.8 $2,651,586 $ 485,012
% 35.9 $2,234,249 $ 298,245
% 34.2 $1,984,054 $ 179,645
%
b2b TRuST
Financial HigHligHts 2010 Net income up 45% Continued revenue growth of $24.3 million or 24% Residential mortgage loans up $0.6 billion or 37% Excellent credit quality, despite the recent economic slowdown
OverviewThe B2B Trust business segment is a leader in the financial intermediary market, offering personal banking products through a network of over 15,000 independent financial advisors. Products include investment loans, mortgage loans, high yield investment accounts and self-managed accounts.
Key accOmplisHments Increased emphasis on sales of prime mortgage loans through mortgage brokers to raise market share and geographically diversify the portfolio
Increased development of distribution channels by expanding relationships with managing general agencies (MgAs) and by adding key fund manufacturers to the distribution alliance program Continued to enhance the online loan application (EASE) to help advisors save time
Improved the loan application process and client service team to deliver on operational excellence
priOrities FOr 2011 Maximize business development efforts by strengthening infrastructure, better aligning territories to ensure sufficient advisor coverage, and adding more sales tools
Further the pursuit for operational excellence and increase capacity by re-engineering key operational processes
Continue to improve product offerings and advisor-focused tools to increase the number of products sold by advisors
The B2B Trust business segment’s contribution to net income improved by $14.3 million, or 45%, to $46.4 million in 2010, compared with $32.1 million in 2009. Total revenue increased by $24.3 million, from $100.3 million in 2009 to $124.6 million in 2010. Net interest income increased by $23.5 million year-over-year, as a combined result of higher loan and deposit volumes and B2B Trust’s agility to weather the challenges from the evolving market environment and competition. In addition, in the first half of 2009, margins had been under pressure as a result of the introductory promotional pricing on the high Interest Investment Account.Provision for loan losses related to B2B Trust’s various loan portfolios decreased to $3.0 million in 2010, compared with $4.3 million in 2009, reflecting the quality of its portfolios and underwriting practices. In line with increased business activity and enhanced service levels, non-interest expenses rose by $5.4 million, from $49.0 million in 2009 to $54.4 million in 2010, including the effect of additional employees.Loans increased by $735.4 million over the last twelve months, mostly in mortgage lending. Deposits totalled $9.2 billion as at october 31, 2010, up $43.2 million since the beginning of the year. B2B Trust remains a key source of funding for the Bank.
table 6
segment cOntributiOn2010 2009 2008
Net interest incomeOther income
$ 114,194 10,419
$ 90,696 9,560
$ 87,297 10,548
Total revenueProvision for loan lossesNon-interest expenses
124,613 2,957
54,449
100,256 4,296
48,995
97,845 1,543
43,681
Income before income taxes Income taxes
67,207 20,813
46,965 14,873
52,621 17,748
Net income $ 46,394 $ 32,092 $ 34,873
Efficiency ratioAverage loansAverage deposits
43.7 $4,973,835 $9,232,384
% 48.9 $4,255,268 $7,892,823
% 44.6 $3,845,035 $ 6,058,935
%

MANAgEMENT’S DISCuSSIoN AND ANALYSIS
LAuRENTIAN bANK SEcuRITIES & cAPITAL MARKETS
Financial HigHligHts 2010 Significant revenue increases in Retail and Institutional Equity divisions Strong performance of the Institutional Fixed Income division
OverviewThe Laurentian Bank Securities & Capital Markets business segment provides full-service brokerage services to retail and institutional clients and manages bank-related capital market activities. Its Institutional fixed income division has a particularly strong presence in government and Corporate underwriting, as well as in secondary markets.
Key accOmplisHments Expanded the Fixed Income division’s presence in Canada Continued development of Institutional Equities and Retail Brokerage operations hired select personnel to be better positioned for continued growth Realized synergies of combining Laurentian Bank Securities with Capital Markets
priOrities FOr 2011 Expand and increase the footprint in Fixed Income Further develop the Institutional Equities presence Continue to differentiate the segment as a bank-owned small cap investment dealer and capitalize on ensuing synergies Maximize the return on investment in the divisions and human capital
The Laurentian Bank Securities and Capital Markets business segment’s contribution to net income totalled $10.0 million in 2010, compared with $12.0 million in 2009, as the better performance from the Retail brokerage and Institutional Equity divisions were offset by lower income from the Institutional Fixed Income division and the Bank’s capital market operations. Non-interest expenses increased, mainly in the brokerage business, essentially as a result of higher variable compensation and higher salaries related to new employees hired to support growth.
table 7
segment cOntributiOn2010 2009 2008
Total revenueNon-interest expenses
$ 61,115 46,938
$ 61,573 43,473
$ 37,338 32,150
Income before income taxes Income taxes
14,177 4,189
18,100 6,124
5,188 1,818
Net income $ 9,988 $ 11,976 $ 3,370
Efficiency ratioclients' brokerage assets
76.8 $2,274,998
% 70.6 $1,969,917
% 86.1 $1,643,088
%
OThER
Financial HigHligHts 2010 Significant increase in income from treasury and financial market operations
Improvement in net interest margins Securitization income down $28.4 million to $6.0 million
OverviewThe other segment includes the activities of the Bank’s various corporate support sectors, mainly Treasury, Credit, Finance, Risk Management, Technology, operations, Corporate Affairs and human Resources. Revenues and expenses from these sectors are generally allocated to the other business segments. however, certain treasury operations such as securitization activities and other corporate activities are reported in this segment.
Key accOmplisHments Introduced a Dynamic Liquidity Management process to optimize this function
Attained an upgrade of the Bank’s credit rating from Standard and Poor’s, the first bank in North America to be upgraded since the financial crisis
Returned to the institutional funding market with LBS-led issuances totaling $350 million
Implemented re-engineered processes to improve efficiency Deployed the ‘leaders in action’ management training program to all head office managers
Maintained credit quality at sound levels
priOrities FOr 2011 Ensure conversion to IFRS on November 1, 2011 optimize capital adequacy and liquidity management to new Basel III international regulatory requirements
Further strengthen the risk management processes Continue to invest in operational efficiency projects Further enhance employee engagement through efficient human resources practices and inspiring communications
The other segment posted a negative contribution to net income of $29.5 million in 2010, compared with a negative contribution of $16.4 million in 2009. Net interest income improved as asset-liability management activities contributed more positively to results. however, securitization income declined sharply as lower volumes of loans were securitized. In addition, interest spreads on securitized loans narrowed in 2010, compared to 2009 and the mark-to-market revaluation on seller swaps affected results during 2010.
table 8
segment cOntributiOn2010 2009 2008
Net interest incomeOther income
$(28,429 7,306
) $(42,830 28,066
) $(40,793 43,508
)
Total revenueProvision for loan lossesNon-interest expenses
(21,123 –
25,427
) (14,764 –
12,458
) 2,715 8,000
16,848
Income before income taxes Income taxes recovery
(46,550 (17,007
))
(27,222 (10,774
))
(22,133 (10,526
))
Net loss $(29,543 ) $(16,448) $(11,607)
LAuRENTIAN BANK 2010 Annual report 26

28 laurentian banK 2010 Annual Report
ManaGeMent’S DiSCuSSiOn anD analYSiS
the relatively weak domestic demand in the U.S. will hinder the growth of exports. Elsewhere globally, particularly in Asia, economic growth should remain quite strong, thereby exerting upward pressure on the price of raw materials and, indirectly, on the Canadian dollar. Lastly, the risk of global financial instability remains high due to concerns over the public debt of the euro zone’s peripheral countries, the current account imbalances among the large trading blocs (USD-EUR-JPY-CNY), and the less than traditional monetary policies of the U.S. and Japan.
Despite a reduced contribution from households and governments in 2011, and the risk of financial instability, the Bank does not believe that the Canadian economy is at risk of falling back into a recession. Other factors are expected to improve, contributing thereby to support economic growth to a larger degree. Specifically, Canadian businesses, particularly in industries exporting outside North America, well profitable as a whole, are in a good position to stimulate private investments and thereby support job creation.
All things considered, economic growth (real GDP) in Canada should reach 2.5% in 2011 and 2012, which should bring about a very slight reduction in the unemployment rate (from 8% in the fourth quarter of 2010 to 7.8% in 2011 and 7.6% in 2012) and in Québec (from 7.9% to 7.8% and 7.7% respectively). From June to September 2010, the Bank of Canada increased its key interest rate three times, in 25 basis points tranches, to 1.00%. Presently, a pause, lasting 6 to 9 months at least, is expected, given the cooling of the economic outlook, particularly in the United States. The situation in the U.S. presents so many difficulties that, in November 2010, the Federal Reserve initiated a new quantitative easing program (QE2) to ward off a deflationary spiral. In general, short- and medium-term interest rates should remain very low throughout most of 2011. Interest rates should return to normal levels only in 2012, depending on the outcome of QE2.
In Québec, as in Canada, 2011 will be a more complex year. The economic recovery will slow down in part due to the higher taxes and tariffs announced at both the provincial and municipal levels.
ECONOMIC OUTLOOK: AN UNEVEN AND FRAGILE RECOVERY
In June 2009, the “Great Recession” came to an end in the United States according to the National Bureau of Economic Research. In all likelihood, the recession also came to an end in Canada at around the same time. Normally, a strong recovery should therefore be in progress. That is not the case however. The least that can be said is that, less than a year after it started, the economic recovery in North America is slowing down. For the United States, which remains Canada’s foremost commercial partner, the risk of falling back into a recession is even relatively significant.
The Bank considers that a double-dip recession and deflation in the U.S., while possible, is still quite unlikely, mostly because the Federal Reserve would not “allow” it, meaning that successive waves of quantitative easing would be launched. However, economic growth should not exceed 2% to 2.5% in 2011 and 2012, which is clearly not sufficient to lower unemployment in any significant way. In Canada, the direct implication of this situation is that U.S. domestic demand will remain very weak for at least two years. The Canadian economy is thus entering a transition period under ongoing difficult external conditions.
As for domestic demand, the Bank notes that, during 2009 and 2010, households have reacted well to expansionist policies, thus rapidly reviving economic activities. Extremely low interest rates have encouraged Canadians to increase their use of credit, as opposed to income, to finance their expenses, which contributed to a marked increase of their indebtedness in proportion to their disposable income. It does not come as a surprise therefore that consumer credit, in proportion to consumption expenditures, has increased during the recession, which is unusual.
In the future, the contribution of households to the economic recovery is bound to decrease, considering that their level of indebtedness is rather high, that interest levels will not remain at such a low level and that the value of assets will not increase as rapidly, as was the case in 2010. Moreover,
ManaGeMent’S DiSCuSSiOn anD analYSiS
laurentian banK 2010 Annual Report 27
-2.5
0.0
2.5
5.0
7.5
10.0
12.5
CREDIT GROWTH IN CANADA (Year over year change in %)
HOUSEHOLD CREDIT
BUSINESS CREDIT
20062005 2007 2008 2009 2010 2011
Source: Bank of Canada/Haver Analytics
-2.5
0.0
2.5
5.0
7.5
10.0
12.5
CREDIT GROWTH IN CANADA (Credit growth in Canada)
HOUSEHOLD CREDIT
BUSINESS CREDIT
2006 2007 2008 2009 2010 2011
Source: Bank of Canada/Haver Analytics
UNEMPLOYMENT RATES (as a percentage)
Source: Statistics Canada/Haver Analytics
2001 2003 2005 2007 2009 2011CANADA
QUÉBEC
ONTARIO
5
6
7
8
9
10
HIGHLIGHTS OF 2010
reCOrD net inCOMe, up 9% tO $122.9 MilliOn
inCOMe frOM COntinuinG OperatiOnS up 21%
tOtal revenue up 11% tO $737.4 MilliOn
return On COMMOn SharehOlDerS’ equitY Of 11.5%
StrOnG lOan GrOwth at 12%
net inCOMe
$122.9 million
TAbLE 1
CONSOLIDATED RESULTSFor the years ended October 31 (in thousands of dollars, except per share and percentage amounts)
2010 2009 2008 VARIANCE
10 / 09
Net interest incomeOther income
$496,421 241,025
$423,777 242,725
$ 405,263 225,218
17 (1
%)
Total revenueProvision for loan lossesNon-interest expenses
737,446 68,000
504,236
666,502 56,000
471,990
630,481 48,500
445,991
11 21
7
Income from continuing operations before income taxes Income taxes
165,210 42,269
138,512 36,848
135,990 37,882
19 15
Income from continuing operationsIncome from discontinued operations, net of income taxes
122,941 –
101,664 11,469
98,108 4,423
21 (100)
Net income $122,941 $113,133 $ 102,531 9%
Preferred share dividends, including applicable taxes $ 12,122 $ 12,116 $ 11,818 –%
Net income available to common shareholders $110,819 $101,017 $ 90,713 10%
Average number of common shares outstanding (in thousands)
Basic Diluted
23,921 23,937
23,858 23,876
23,837 23,880
Earnings per share from continuing operations Basic Diluted
$ 4.63 $ 4.63
$ 3.75 $ 3.75
$ 3.62 $ 3.61
2323
%%
Earnings per share Basic Diluted
$ 4.63 $ 4.63
$ 4.23 $ 4.23
$ 3.81 $ 3.80
99
%%
Return on common shareholders’ equityReturn on common shareholders’ equity for continuing operations
11.5 11.5
%%
11.4 10.1
%
% 11.0 10.5
%
%
2010 finanCial perfOrManCeThe Bank met or exceeded all of its published objectives for fiscal 2010, as illustrated in the table below. As a result of its strong commitment to improve its efficiency and profitability, the Bank significantly improved its performance. Furthermore, the Bank maintained its financial strength through sound risk and capital management.
TAbLE 2
PERFORMANCE INDICATORS
2009 RESULTS 2010 OBJECTIVES 2010 RESULTS
Revenue growth 6% 5% to 10% 11%
Efficiency ratio 70.8% 70% to 67% 68.4%
Return on common shareholders’ equity 11.4% 10.0% to 12.0% 11.5%
Diluted earnings per share $4.23 $4.00 to $4.70 $4.63
Tier I BIS capital ratio 11.0% minimum of 9.5% 10.9%
OutlOOK anD ObJeCtiveS fOr 2011

management’s discussion and analysis
laurentian banK 2010 Annual Report 29
Key assumptions supporting the Bank’s objectivesThe following assumptions are the most significant items considered in setting the Bank’s strategic priorities and financial objectives. Other factors such as those detailed in the Caution Regarding Forward-Looking Statements and Integrated Risk Management Framework sections of this MD&A could also cause future results to differ materially from these objectives.
The objectives for 2011 assume that the Canadian economy is entering a period of slow transition from recession to recovery, with continued challenges stemming from low interest rates
and increased competition, leading to ongoing pressure on pricing and margins. Nonetheless, the Bank expects loan growth to continue at a healthy rate in 2011. The targets for 2011 also incorporate increased spending necessary to meet heightened regulatory requirements, higher salaries and employee benefits resulting from ongoing hiring to support growth and service levels, as well as higher pension costs. However, the Bank expects to maintain a solid return on com-mon shareholders’ equity by maintaining appropriate cost controls while ensuring it continues to further build its key growth engines.
Net income totalled $122.9 million in 2010, compared with $113.1 million last year. Net income in 2009 included income from discontinued operations of $11.5 million related to the sale of asset management activities in fiscal 2005. Income from continuing operations amounted to $101.7 million in 2009.
Discontinued Operations — Sale of BLC-Edmond de Rothschild Asset Management Inc.In fiscal 2005, the Bank sold its interest in the joint-venture BLC-Edmond de Rothschild Asset Management Inc. to Industrial Alliance Insurance and Financial Services Inc. As part of this transaction, a portion of the proceeds was subject to recovery clauses, based on net annual mutual fund sales, and therefore, the sale resulted in the recognition of a $26.2 million deferred gain. During fiscal 2009, the Bank recognized $11.5 million, net of income taxes, in income as sale thresholds were met. Note 28 to the annual consolidated financial statements provides additional information regarding this transaction.
TOTAL REvEnuETotal revenue improved 11% to $737.4 million for the year ended October 31, 2010, compared to $666.5 million for the year ended October 31, 2009. Net interest income improved 17% to $496.4 million, while other income remained relatively unchanged at $241.0 million, as detailed in the following paragraphs.
A. NET INTEREST INCOME B. FEES AND COMMISSIONS ON LOANS AND DEPOSITS C. INCOME RELATED TO FINANCIAL MARKETS (1) D. OTHER
A
B
TOTAL REVENUE MIX(as a percentage)
(1) Including income from brokerage operations, income from treasury and financial market operations and securitization income.
C
D
67.3%
15.4%10.5%
6.8%
nET InTEREST InCOMENet interest income rose by $72.6 million to $496.4 million in 2010 from $423.8 million in 2009. The year-over-year increase resulted mainly from the significant growth in average loan and deposit volumes of $2.0 billion and $1.9 billion respectively. In addition, net interest margins improved 8 basis points in 2010 to 2.15%, mainly as a result of the introductory promotional pricing on B2B Trust’s High Interest Investment Accounts and a generally declining interest rate environment in the first part of 2009. Table 10 provides a summary of net interest income.
analysis oF consolidated results
HOW WE WILL MEASuRE OuR PERFORMAnCE In 2011As discussed above, the economic outlook remains a significant source of uncertainty. However, the following
objectives for 2011 clearly reflect management’s confidence in the Canadian economy and its conviction that the Bank has the ability to take advantage of market opportunities.
TABLE 9
2011 FInAnCIAL OBJECTIvES
2011 OBJECTIvES(1)
Revenue growth > 5%
Efficiency ratio 70% to 67%
Return on common shareholders’ equity 11.0% to 13.0%
Diluted earnings per share $4.80 to $5.40
(1) These objectives for 2011 should be read concurrently with the following paragraphs.

30 laurentian banK 2010 Annual Report
management’s discussion and analysis
The following graph shows historical interest rates since 2005.
0
2
4
6
LAURENTIAN BANK PRIME RATE AND BANKERS' ACCEPTANCE RATEAs at October 31 (in percentages)
90-DAYBANKERS’ACCEPTANCE RATE
PRIMERATE
20062005 2007 2008 2009 2010
The Bank uses derivative financial instruments to manage the interest rate risk associated with some of its loan and deposit portfolios. In 2010, interest rate swaps generated revenues of $116.3 million and effectively compensated lower interest income stemming from variable rate loan portfolios resulting from the low interest rate environment. Depending on interest rate fluctuations and on the portfolio mix in terms of maturity and product types, actual return on portfolios can vary sub-stantially. The Bank uses models to quantify the potential impact of various rate scenarios on future revenues and equity, as explained in the Asset and Liability Management Activities section on page 51 of this MD&A.
TABLE 10CHAnGES In nET InTEREST InCOMEFor the years ended October 31 (in thousands of dollars, except percentage amounts)
2010 2009
AvERAGEvOLuME
In %AvERAGEvOLuME InTEREST
AvERAGE RATE
AvERAgEvOLuME
IN %AvERAgEvOLuME INTEREST
AvERAgE RATE
Assets Cash resources and securities Securities purchased under reverse repurchase agreements Loans Personal Residential mortgage Commercial mortgage Commercial and other Derivative financial instruments Other assets
20.5
2.6
24.5 34.8
6.1 7.7
– 3.8
% $ 4,736,468
598,983
5,653,441 8,030,720 1,419,800 1,785,067
– 868,939
$ 73,273
3,240
266,030 340,581
74,283 73,543
116,273 –
1.55
0.54
4.71 4.24 5.23 4.12
– –
%
20.5
3.4
27.7 31.9
5.1 7.9
– 3.5
%
$ 4,192,907
701,662
5,667,866 6,531,433 1,054,518 1,609,180
– 726,275
$ 75,276
4,014
279,730 310,479
55,139 70,176
137,275 –
1.80
0.57
4.94 4.75 5.23 4.36
– –
%
Total – assets 100.0% $23,093,418 $947,223 4.10% 100.0 % $20,483,841 $ 932,089 4.55 %
Liabilities and shareholders’ equity Demand and notice deposits Term deposits Obligations related to securities sold short or under repurchase agreements Acceptances Other liabilities Subordinated debentures Shareholders’ equity
$ 7,056,613 11,940,790
1,991,117 198,337 558,827 150,000
1,197,734
$ 48,417 391,636
3,011 – –
7,738 –
0.69 3.28
0.15 – –
5.16 –
%
$ 4,752,585 12,318,315
1,489,522 155,100 494,758 150,000
1,123,561
$ 35,219
458,593
6,765 – –
7,735 –
0.74 3.72
0.45 – –
5.16 –
%
Total – liabilities and shareholders’ equity $23,093,418 $450,802 1.95 % $20,483,841 $508,312 2.48 %
Net interest income $496,421 2.15 % $423,777 2.07 %

management’s discussion and analysis
laurentian banK 2010 Annual Report 31
OTHER InCOMEOther income totalled $241.0 million in 2010, compared with $242.7 million in 2009. The decrease essentially resulted from the lower income from securitization activities, as other sources of other income generally improved, as detailed below.
Fees and commissions on loans and deposits rose 12% to $113.7 million for fiscal 2010 from $101.4 million in 2009, mainly as a result of higher lending fees stemming from the increased level of business activity.
Income from brokerage operations improved slightly to $52.9 million for fiscal 2010 from $51.8 million in 2009, driven by continued strong performance from the Institutional Fixed Income division of Laurentian Bank Securities and better performance from retail operations.
Income from treasury and financial market operations improved by $7.6 million to $18.0 million for fiscal 2010. As market condi-tions improved in 2010, income generally improved. For fiscal 2009, treasury and financial market revenues were particularly affected by net losses on securities amounting to $9.0 million.Additional information related to the Bank’s securities portfolio is presented in Note 4 to the annual consolidated financial statements.
Credit insurance revenues are mainly generated by insurance programs related to loans disbursed by the Bank. These reve-nues grew by 11% to $17.8 million for fiscal 2010, owing mainly to strong growth in mortgage loan portfolios.
Revenues from mutual funds improved $2.6 million to $15.0 million in fiscal 2010. The increase results from continuing growth in sales and the positive impact on trailer fees from the recovering market values of mutual funds under administration.
Revenues from registered self-directed plans improved slightly to $8.7 million for fiscal 2010 from $8.0 million in 2009, mainly as a result of improving market values. See the Off-Balance Sheet Arrangements section on page 39 of this MD&A for additional information.
Securitization income decreased significantly to $6.0 million for fiscal 2010, compared with $34.4 million for fiscal 2009. In 2010, the Bank relied less on securitization to fund its loan growth. Nonetheless, securitization of $823.0 million in resi-dential mortgage loans generated gains on sale of $13.5 million. In 2009, the Bank had securitized $1.0 billion in residential mortgage loans and generated gains on sale of $37.4 million. The lower gains mainly reflect the tighter spreads on mortgage loans sold. Income from securitization operations was also negatively affected by mark-to-market revaluation of seller swaps, partly offset by servicing revenues, as further detailed in Note 6 to the annual consolidated financial statements.
NET INTEREST INCOME(in millions of dollars)
2006 2007 2008 2009 2010350
425
500
357.2
390.2
405.3
423.8
496.4
2.14
2.21
2.07
2.15
2.31
NET INTEREST MARGIN(as a percentage of average assets)
2006 2007 2008 2009 20102.00
2.25
2.50

32 laurentian banK 2010 Annual Report
management’s discussion and analysis
TABLE 11OTHER InCOMEFor the years ended October 31 (in thousands of dollars, except percentage amounts)
2010 2009 2008vARIANCE
10 / 09
Fees and commissions on loans and deposits Deposit service charges Lending fees Card service revenues
$ 54,172
38,985 20,543
$ 53,377 30,028 18,040
$ 52,314
22,976 16,623
1
30 14
%
Sub-total – fees and commissions on loans and deposits 113,700 101,445 91,913 12
Other Income from brokerage operations Income from treasury and financial market operations Credit insurance income Income from sales of mutual funds Income from registered self-directed plans Securitization income Trust services Other
52,934 18,035 17,785 15,012
8,680 5,996 1,020 7,863
51,788 10,472 15,994 12,429
7,960 34,441
1,038 7,158
28,707 24,474 13,717 14,170 8,736
35,865 1,152 6,484
2 72 11 21
9 (83
(2 10
))
Sub-total – other 127,325 141,280 133,305 (10)
Total – other income $241,025 $242,725 $225,218 (1)%
182.6
225.2
242.7
193.7
241.0
OTHER INCOME(in millions of dollars)
2006 2007 2008 2009 2010175
200
225
250
PROvISIOn FOR LOAn LOSSESThe provision for loan losses amounted to $68.0 million for fiscal 2010, compared with $56.0 million for fiscal 2009. The increase mainly reflects losses related to certain commercial and real estate accounts, which were impacted by the soft North American economic environment, as well as the higher loan volumes. Nonetheless, overall credit quality improved in the latter part of the year. Retail portfolios performed well during the year, as borrowers benefited from improved employment conditions in Canada and a low interest rate environment. The following table details the provision for loan losses from 2008 to 2010.
TABLE 12PROvISIOn FOR LOAn LOSSES For the years ended October 31 (in thousands of dollars, except percentage amounts)
2010 2009 2008
Personal loansResidential mortgage loansCommercial mortgage loansCommercial and other loans
$31,460 3,486 8,729
24,325
$37,112 1,527
980 16,381
$29,541 582 510
9,867
Sub-totalIncrease in general allowances
68,000
–
56,000 –
40,500 8,000
Total – provision for loan losses $68,000 $56,000 $48,500
As a % of average loans and acceptances 0.40% 0.38% 0.35%

management’s discussion and analysis
laurentian banK 2010 Annual Report 33
nOn-InTEREST ExPEnSES Non-interest expenses totalled $504.2 million for fiscal 2010, compared with $472.0 million for fiscal 2009. Salaries and employee benefits increased by 11% or $26.3 million compared with fiscal 2009. The increase is principally attributable to higher salaries and costs related to growth and customer service ini-tiatives, as well as higher pension costs and compensation tax.
Premises and technology costs increased to $132.5 million for fiscal 2010, compared with $120.1 million for fiscal 2009, mainly as a result of higher amortization expense related to IT develop - ment projects and overall increases in technology costs to support higher business activity levels.
Other expenses stood at $95.7 million in 2010, compared with $102.3 million in 2009. Expenses for 2009 included the effect of a $5.5 million charge related to two specific operational issues, which were partially recovered in 2010. Excluding this item, other expenses were relatively unchanged, as lower capital tax char-ges were offset by increases in advertising and business development costs. Table 13 illustrates the changes in non- interest expenses from 2008 to 2010.
TABLE 13nOn-InTEREST ExPEnSESFor the years ended October 31 (in thousands of dollars, except percentage amounts)
2010 2009 2008 vARIANCE
10 / 09
Salaries and employee benefits Salaries Employee benefits Performance-based compensation
$ 181,040 55,795 39,129
$ 166,256
46,629 36,773
$ 155,691
50,127 30,462
Sub-total – salaries and employee benefits 275,964 249,658 236,280 11 %
Premises and technology Equipment and computer services Rent and property taxes Depreciation Maintenance and repairs Public utilities Other
52,108 37,731 35,987
5,271 1,355
88
45,859 35,333 32,380
4,745 1,361
376
45,243 34,475 29,872
5,491 1,277 2,834
Sub-total – premises and technology 132,540 120,054 119,192 10%
Other Advertising and business development Fees and commissions Communications and travelling expenses Taxes and insurance Stationery and publications Recruitment and training Other
22,089 21,700 19,037 16,518
5,962 4,591 5,835
21,057 21,395 18,068
20,720 5,905 3,563
11,570
18,041 21,078 18,907
17,571 6,333 3,717 4,872
Sub-total – other 95,732 102,278 90,519 (6)%
Total – non-interest expenses $504,236 $ 471,990 $ 445,991 7%
As a % of total revenue (efficiency ratio) 68.4 % 70.8 % 70.7 %

34 laurentian banK 2010 Annual Report
management’s discussion and analysis
EFFICIEnCy RATIO The efficiency ratio (non-interest expenses divided by total revenue) improved markedly to 68.4% for fiscal 2010, compared with 70.8% for fiscal 2009, driven by strong revenue growth. This translated into a 3.8% positive operating leverage (percentage growth in total revenues, less percentage growth in non-interest expenses).
The accompanying graph shows the Bank’s performance in this regard over the last five years.
InCOME TAx ExPEnSEFor fiscal 2010, income tax expense totalled $42.3 million and the effective income tax rate stood at 25.6%, compared with $36.8 million and 26.6%, respectively, for fiscal 2009. Note 17 to the annual consolidated financial statements provides further information on income tax expense.
TABLE 14RECOnCILIATIOn OF THE InCOME TAx ExPEnSE FROM COnTInuInG OPERATIOnS TO THE DOLLAR AMOunT OF InCOME TAx uSInG THE STATuTORy RATEFor the years ended October 31 (in thousands of dollars, except percentage amounts)
2010 2009
Income taxes at statutory rates Change resulting from: Income related to foreign credit insurance operations Dividends and tax-exempt gains
$50,027
(4,891 (1,919
))
30.3
(3.0 (1.2
%
))
$43,312
(4,471 (1,626
))
31.3
(3.2 (1.2
%
))
Resolution of income tax exposuresTax rate changesOther
43,217 (1,010
587 (525
)
)
26.1 (0.6 0.4
(0.3
)
)
37,215 (2,418
– 2,051
) 26.9 (1.7
– 1.4
)
Income taxes from continuing operations, as reported in the consolidated statement of income and effective tax rate $42,269 25.6% $36,848 26.6%
TRAnSACTIOnS WITH RELATED PARTIESThe Bank provides loans to directors and officers and their related companies. Loans to directors are granted under market condi-tions for similar risks and are measured at the exchanged amount. Loans to officers consist mostly of residential mortgage loans at posted rates less 2%, as well as personal loans and personal lines of credit at market rates less a discount based on the type and amount of the loan. Loans to related companies are granted under terms similar to those offered to arm’s length parties. The interest earned on these loans is recorded under interest income in the consolidated statement of income. In the normal course of business, the Bank also provides usual banking services to certain directors and officers, including bank accounts (deposits) under terms similar to those offered to arm’s length parties. The Bank also offers employees a subsidy on annual credit card fees. See Note 19 to the annual consolidated financial statements for additional information on related party transactions.
OvERvIEW OF FISCAL 2009For the year ended October 31, 2009, the Bank reported net income of $113.1 million, or diluted earnings of $4.23 per share, compared with $102.5 million, or diluted earnings of $3.80 per share in 2008. Return on common shareholders’ equity was 11.4% in 2009, compared with 11.0% in 2008.
Net income in 2009 includes income from discontinued operations of $11.5 million, or $0.48 diluted per share, related to the sale of asset management activities in fiscal 2005. Net income in 2008 included income from discontinued operations of $4.4 million, or $0.19 diluted per share. Income from continuing operations was $101.6 million in 2009, or $3.75 diluted per share, compared with $98.1 million, or $3.61 diluted per share in 2008.
The Bank delivered a solid performance in 2009. Record growth in personal and commercial loan and deposit portfolios signifi-cantly improved revenues, while tight cost control contributed to improve efficiency. However, higher loan losses resulting from poor economic conditions throughout the year and losses on securities dampened the Bank’s results.
76.1
70.7 70.8
73.2
68.4
EFFICIENCY RATIO(Non-interest expenses as a percentage of total revenue)
2006 2007 2008 2009 201065
70
75
80

management’s discussion and analysis
laurentian banK 2010 Annual Report 35
analysis oF quarterly results
SuMMARy AnALySIS OF RESuLTS FOR THE FOuRTH QuARTER OF FISCAL 2010Net income for the fourth quarter ended October 31, 2010 was $32.5 million, compared with $38.2 million for the same period last year. Net income for the fourth quarter of 2009 included income from discontinued operations of $11.5 million related to the sale of asset management activities in fiscal 2005. Income from continuing operations amounted to $26.8 million for the fourth quarter of 2009.
Total revenueTotal revenue increased by 6% to $190.1 million in the fourth quarter of 2010, compared with $178.5 million in the fourth quarter of 2009. Net interest income increased to $128.2 million in the fourth quarter of 2010 from $118.2 million in the fourth quarter of 2009, mainly attributable to the strong loan and deposit growth year-over-year. Interest margins decreased slightly in the fourth quarter of 2010, when compared to the fourth quarter of 2009 as interest margins remained under pressure, because of sustained competition for retail customers, a flatter yield curve and the continued low interest rate environment.
Other income improved to $61.9 million in the fourth quarter of 2010, compared to $60.3 million in the fourth quarter of 2009. Overall retail business growth contributed to higher fees and commissions on loans and deposits, as well as to the increase in credit insurance income. In addition, income from treasury and financial market operations improved by more than $5.0 million in the fourth quarter of 2010, when compared to the fourth quarter of 2009, as results for 2009 were hampered by net losses on securi - ties of $3.5 million. Securitization income decreased by $5.0 million compared to the same quarter a year ago, as a result of lower gains on reduced level of mortgage loan securitization and tighter spreads on mortgage loans sold. Income from brokerage opera-tions decreased by $2.0 million in the fourth quarter of 2010, when compared to the fourth quarter of 2009. Results from these operations, for the fourth quarter of 2009, benefitted from the recovering equity markets, as well as from the particularly good quarter for the Institutional Fixed Income division of Laurentian Bank Securities. At $14.9 million for the fourth quarter of 2010, brokerage revenues were nonetheless satisfactory.
Provision for loan lossesThe provision for loan losses amounted to $16.0 million in the fourth quarter of 2010, unchanged from the fourth quarter of 2009, as lower losses on retail portfolios were offset by in-creases in commercial portfolios. This level of losses is in line with the overall good credit quality of the Bank’s loan portfolio given the current soft North American economic conditions.
non-interest expensesNon-interest expenses totalled $132.5 million for the fourth quarter of 2010, compared with $128.1 million for the fourth quarter of 2009. Salaries and employee benefits rose by $6.1 million, mainly as a result of higher salary charges, compen-sation tax and pension costs. Over the last twelve months, headcount has increased by more than one hundred mainly to support growth and service quality initiatives. Premises and technology costs rose from $31.9 million for the fourth quarter of 2009 to $35.2 million for the fourth quarter of 2010, mainly as a result of higher amortization expenses related to recently completed IT development projects, technology costs to support business growth and rental costs. Other non-interest expenses decreased from $30.2 million for the fourth quarter of 2009 to $25.2 million for the fourth quarter of 2010. Other expenses for 2009 included the effect of a $5.5 million charge related to two specific operational issues. Excluding this item, other expenses were relatively stable as a result of sustained cost control.
The efficiency ratio improved to 69.7% in the fourth quarter of 2010, compared with 71.8% in the fourth quarter of 2009; reflecting a 3.1% positive operating leverage.
Income taxesFor the quarter ended October 31, 2010, income tax expense was $9.1 million and the effective tax rate was 21.8%. The lower tax rate, compared to the statutory rate, mainly resulted from the favourable effect of holding investments in Canadian secu-rities that generate non-taxable dividend income and the lower taxation level on revenues from credit insurance operations. Results for the fourth quarter also include year-end favourable adjustments of $2.2 million to future income taxes. For the quarter ended October 31, 2009, the income tax expense related to continuing operations was $7.6 million and the effective tax rate was 22.1%.
AnALySIS OF THE EvOLuTIOn OF THE QuARTERLy RESuLTSThe Bank’s intermediation business provides a relatively steady source of income, stemming from large volumes of loans and deposits not likely to experience significant fluctua-tions in the short term. However, treasury operations and certain activities related to financial markets, such as securi-tization operations and trading activities, may result in significant volatility. In addition, sharp variations in market interest rates or equity markets may also influence operating results. Other transactions, specific events or regulatory developments may also influence the Bank’s results. given that the second quarter usually consists of only 89 days, compared with 92 days for the other quarters, net interest income for that quarter is generally lower. Table 15 summarizes quarterly results for fiscal 2010 and 2009.
36 laurentian banK 2010 Annual Report
management’s discussion and analysis
TABLE 15QuARTERLy RESuLTSFor the quarters ended (in thousands of dollars, except per share and percentage amounts)
2010 2009
Oct. 31 July 31 April 30 Jan. 31 Oct. 31 July 31 April 30 Jan. 31
Net interest incomeOther income
$128,202 61,872
$129,870 58,940
$117,633 60,480
$120,716 59,733
$118,235 60,305
$112,766 63,891
$94,073 60,695
$98,703 57,834
Total revenueProvision for loan lossesNon-interest expenses
190,074 16,000
132,484
188,810 20,000
127,820
178,113 16,000
123,549
180,449 16,000
120,383
178,540 16,000
128,143
176,657 16,000
119,081
154,768 12,000
114,034
156,537 12,000
110,732
Income from continuing operations before income taxesIncome taxes
41,590 9,076
40,990 10,926
38,564 10,215
44,066 12,052
34,397 7,618
41,576 12,893
28,734 7,579
33,805 8,758
Income from continuing operationsIncome from discontinued operations, net of income taxes
32,514
–
30,064
–
28,349
–
32,014
–
26,779
11,469
28,683
–
21,155
–
25,047
–
Net income $ 32,514 $ 30,064 $ 28,349 $ 32,014 $ 38,248 $ 28,683 $21,155 $25,047
Earnings per share from continuing operations Basic Diluted
$ 1.24 $ 1.24
$ 1.13 $ 1.13
$ 1.06 $ 1.06
$ 1.21 $ 1.21
$ 0.99 $ 0.99
$ 1.08 $ 1.08
$ 0.76 $ 0.76
$ 0.92 $ 0.91
Earnings per share Basic Diluted
$ 1.24 $ 1.24
$ 1.13 $ 1.13
$ 1.06 $ 1.06
$ 1.21 $ 1.21
$ 1.47 $ 1.47
$ 1.08 $ 1.08
$ 0.76 $ 0.76
$ 0.92 $ 0.91
Net interest income (as a percentage of average assets)
Return on common shareholders’ equity
2.15
11.8
%
%
2.22
11.0
%
%
2.10
10.9
%
%
2.13
12.3
%
%
2.19
15.3
%
%
2.15
11.6
%
%
1.92
8.5
%
%
2.00
10.0
%
%
Segment net income (loss) Retail & SME Québec Real Estate & Commercial B2B Trust Laurentian Bank Securities and Capital Markets Other
$ 9,746 12,319 12,156
3,468 (5,175)
$ 14,633 10,427 11,818
2,100 (8,914
)
$ 10,082 13,655 11,359
2,586 (9,333)
$ 12,552 12,688 11,061
1,834 (6,121)
$ 21,482 7,611 7,468
2,730 (1,043)
$ 9,674 11,170
8,665
3,379 (4,205)
$ 9,756 7,600 7,833
3,344 (7,378)
$ 10,180 8,040 8,126
2,523 (3,822)
Net income $ 32,514 $ 30,064 $ 28,349 $ 32,014 $ 38,248 $ 28,683 $21,155 $25,047
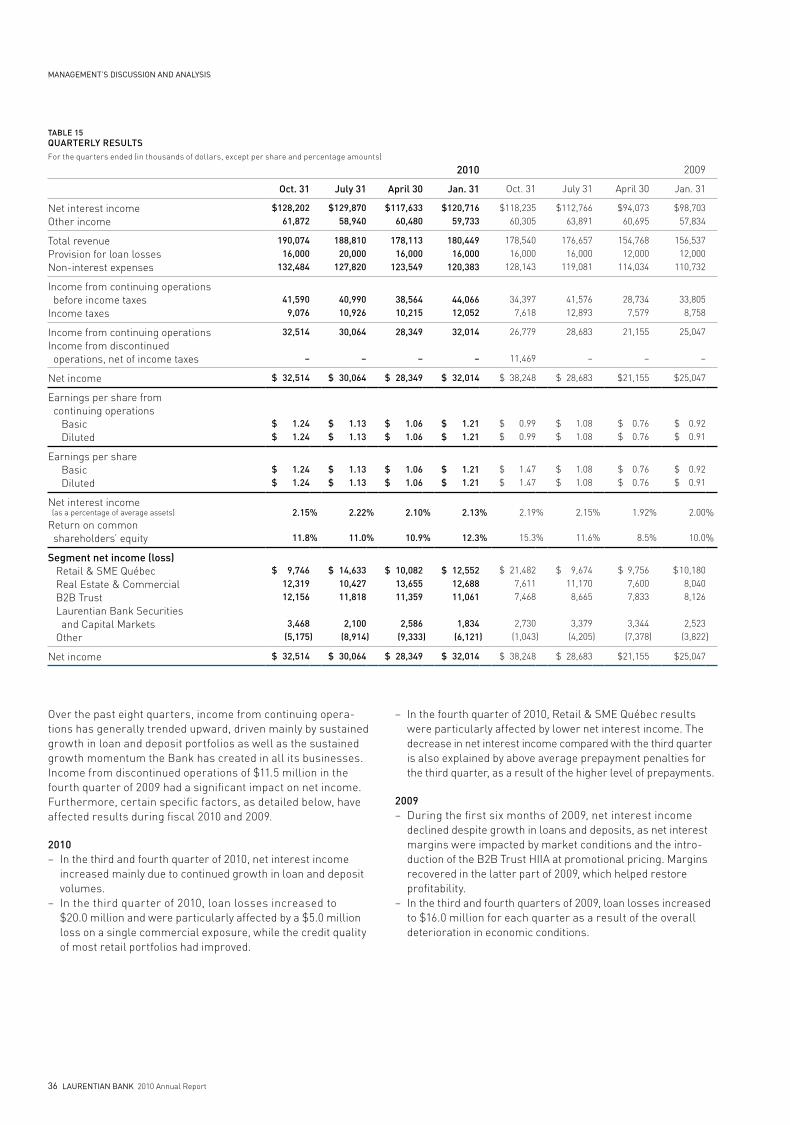
Over the past eight quarters, income from continuing opera-tions has generally trended upward, driven mainly by sustained growth in loan and deposit portfolios as well as the sustained growth momentum the Bank has created in all its businesses. Income from discontinued operations of $11.5 million in the fourth quarter of 2009 had a significant impact on net income. Furthermore, certain specific factors, as detailed below, have affected results during fiscal 2010 and 2009.
2010– In the third and fourth quarter of 2010, net interest income
increased mainly due to continued growth in loan and deposit volumes.
– In the third quarter of 2010, loan losses increased to $20.0 million and were particularly affected by a $5.0 million loss on a single commercial exposure, while the credit quality of most retail portfolios had improved.
– In the fourth quarter of 2010, Retail & SME Québec results were particularly affected by lower net interest income. The decrease in net interest income compared with the third quarter is also explained by above average prepayment penalties for the third quarter, as a result of the higher level of prepayments.
2009– During the first six months of 2009, net interest income
declined despite growth in loans and deposits, as net interest margins were impacted by market conditions and the intro-duction of the B2B Trust HIIA at promotional pricing. Margins recovered in the latter part of 2009, which helped restore profitability.
– In the third and fourth quarters of 2009, loan losses increased to $16.0 million for each quarter as a result of the overall deterioration in economic conditions.

management’s discussion and analysis
laurentian banK 2010 Annual Report 37
analysis oF Financial condition
Over the past three years, the growth momentum the Bank has created in all its businesses has significantly strengthened its balance sheet. In addition, improved profitability has translated into a stronger capital position and provided the Bank with added flexibility to pursue its growth initiatives and to meet new pending regulatory capital requirements.
As at October 31, 2010, the Bank reported total assets of $23.8 billion, compared with $22.2 billion as at October 31, 2009, as shown in Table 16. Assets under administration amounted to $15.0 billion, compared with $14.3 billion at the end of fiscal 2009. These changes are explained in the following sections of this MD&A.
TABLE 16BALAnCE SHEET ASSETSAs at October 31 (in thousands of dollars, except percentage amounts)
2010 2009 2008 vARIANCE
10 / 09
Cash, deposits with other banks and securitiesSecurities purchased under reverse repurchase agreementsLoans Personal Residential mortgage Commercial mortgage Commercial and other
$4,424,903 803,874
5,630,788 8,582,548 1,638,861 1,691,190
$ 4,732,799 536,064
5,655,055 7,219,830 1,285,012 1,555,956
$ 3,638,873 661,391
5,694,574 6,182,871
932,688 1,454,799
(7 50
– 19 28
9
)%
Allowance for loan losses 17,543,387
(138,143) 15,715,853
(114,546) 14,264,932
(112,434) 12 21
Total loansCustomers' liabilities under acceptancesOther assets
17,405,244 165,450
1,000,532
15,601,307 216,817
1,077,793
14,152,498 110,342
1,016,368
12 (24
(7))
Balance sheet assets $23,800,003 $22,164,780 $19,579,472 7%
Cash, deposits with other banks, securities and securities purchased under reverse repurchase agreements as a % of balance sheet assetsTotal loans and acceptances as a % of balance sheet assets
22.0 73.8
%%
23.8 71.4
%%
22.0 72.8
%%
LIQuID ASSETSLiquid assets consist of cash, deposits with other banks, securities and securities purchased under reverse repurchase agree-ments. As at October 31, 2010, these assets totalled $5.2 billion and were relatively unchanged compared to October 31, 2009 where they stood at $5.3 billion. However, liquid assets now represent 22% of total assets, compared to 24% at the begin-ning of the year as the Bank is gradually reducing its level of liquid assets to fund loan disbursements. This has helped net interest margins year over year. Nevertheless, the Bank pru-dently maintained a relatively high level of lower yielding liquid assets during the year, fuelled by the growth of its deposit base.
As at October 31, 2010, the Bank held securities amounting to $4.3 billion, including a portfolio of available-for-sale securities totalling $1.1 billion. Net unrealized gains, included in accumulated other comprehensive income (AOCI), increased $6.5 million in 2010 to $11.4 million as at October 31, 2010.
Additional information on liquidity and funding risk management is included on page 53 of this MD&A.
LOAn PORTFOLIOLoans and bankers’ acceptances rose by $1.8 billion and totalled $17.7 billion as at October 31, 2010, compared with $15.9 billion at October 31, 2009. The Bank’s ability to meet customers’ needs, combined with the low interest rate environment, better economic conditions and overall favourable housing markets in Canada contributed to maintain the momentum in this portfolio’s growth and yielded an 11% growth rate for the second consecutive year.
The residential mortgage loan portfolio was up $1.4 billion to $8.6 billion at the end of 2010. Considering securitized loans, as shown in the table 17, total residential mortgage loans amounted to $11.3 billion as at October 31, 2010.
Commercial mortgage loans and commercial loans, including banker’s acceptances, increased by a combined $437.7 million, as the Bank continued to capitalize on growth opportunities in the Canadian market. Personal loans decreased slightly and were down $24.3 million in 2010, as growth in investment loans and home equity lines of credit did not fully compensate for ongoing run-offs in point-of-sale financing.

38 laurentian banK 2010 Annual Report
management’s discussion and analysis
TABLE 17RESIDEnTIAL MORTGAGE LOAnS PORTFOLIOAs at October 31 (in thousands of dollars)
2010 2009 vARIANCE
10 / 09
On-balance sheet residential mortgage loansSecuritized residential mortgage loans (off-balance sheet)
$ 8,582,548 2,715,535
$7,219,830 2,702,762
$1,362,718 12,773
Total residential mortgage loans, including securitized loans $11,298,083 $9,922,592 $1,375,491
Impaired loansgross impaired loans rose from $137.5 million in 2009 to $188.1 million in 2010, while net impaired loans stood at $50.0 million as at October 31, 2010, compared with $22.9 million as at October 31, 2009. The increase in impaired loans since October 31, 2009 essentially results from certain specific com-mercial loans and commercial mortgage loans as well as loan growth. Conversely, despite ongoing credit market challenges resulting from a slow economic recovery, the credit quality of retail portfolios has improved. See Note 5 to the annual con-solidated financial statements for additional information.
Additional information on the Bank’s risk management practices and detailed disclosure on loan portfolios are provided in the Integrated Risk Management Framework section.
OTHER ASSETS Other assets, excluding customers’ liabilities under accep-tances, decreased to $1.0 billion as at October 31, 2010 from $1.1 billion as at October 31, 2009. The decline mostly resulted from changes in the fair value of derivative financial instru-ments, which are mainly used to hedge the Bank’s exposure to market risks.
DEPOSITSThe deposit portfolio was up $1.4 billion to $19.7 billion as at October 31, 2010 from $18.3 billion as at October 31, 2009. Personal deposits of $15.4 billion represented 78% of total deposits at October 31, 2010, an increase of $286.1 million compared to October 31, 2009. growth in personal deposits was limited during the year, as the Bank opted for other sources of funding and gradually reduced its liquidity level. Nonetheless, the Bank maintained its privileged access to the retail market through its Retail &SME Québec and B2B Trust business seg-ments. Business and other deposits increased by $1.1 billion during the year to $4.3 billion as at October 31, 2010. Specific initiatives were launched during the year to gather deposits from the Bank’s commercial clients. This led to net new deposits in excess of $250 million. In addition, the Bank increased its presence in the institutional money market which enabled it to raise $0.8 billion. These new sources of funding will provide additional flexibility in the future.
Additional information on deposits and other funding sources is included in the Liquidity and Funding Risk Management sub-section of the Integrated Risk Management Framework section.
OTHER LIABILITIES Other liabilities increased to $2.7 billion as at October 31, 2010 from $2.5 billion as at October 31, 2009. The year-over-year increase resulted mainly from higher obligations related to securities sold short, which offset decreases in acceptances and obligations related to securities sold under repurchased agreements, as the Bank relied more heavily on deposits to fund purchases of securities.
SuBORDInATED DEBEnTuRES As at October 31, 2010, subordinated debentures totalled $150.0 million, unchanged from last year. As further explained below, these debentures are an integral part of the Bank’s regulatory capital and afford its depositors additional protection.
On November 2, 2010, the Bank completed the issuance of $250.0 million Medium Term Notes (subordinated indebtedness) due November 2, 2020. On December 6, 2010, the Bank also announced its intention to redeem the $150.0 million subordinated debentures Series 10. When combined, these transactions will provide the Bank with added flexibility to pursue its growth initiatives and contribute to meeting regulatory capital requirements.
See Note 29 to the annual consolidated financial statements for additional information.
SHAREHOLDERS’ EQuITy Shareholders’ equity was $1,239.4 million as at October 31, 2010, compared with $1,171.2 million as at October 31, 2009. This increase mainly resulted from net income for fiscal 2010, net of declared dividends, partly offset by a decrease in the net gain related to interest rate swaps designated as cash flow hedges presented in accumulated other comprehensive income (AOCI). The Bank’s book value per common share, excluding AOCI, appreciated to $41.87 as at October 31, 2010 from $38.68 as at October 31, 2009. The table below provides the details of the capital stock.
TABLE 18SHARES ISSuED AnD OuTSTAnDInGAs at December 1, 2010 (in number of shares/options)
Preferred shares Series 9 Series 10
4,000,0004,400,000
Total preferred shares 8,400,000
Common shares 23,921,762
Options 53,275

management’s discussion and analysis
laurentian banK 2010 Annual Report 39
oFF-balance sHeet arrangements
In the normal course of its operations, the Bank makes ample use of off-balance sheet arrangements. In particular, the Bank manages or administers clients’ assets that are not reported on the balance sheet. Moreover, off-balance sheet items include derivative instruments, as well as assets and liabilities arising from the utilization of special purpose entities set up for financing purposes.
ASSETS unDER ADMInISTRATIOn AnD ASSETS unDER MAnAGEMEnT Assets under administration and assets under management mainly include assets of clients to whom the Bank provides various administrative services, as well as residential mortgage
loans under management related to securitization operations. Through its subsidiary Laurentian Bank Securities, the Bank also manages retail and institutional investment portfolios. Table 19 below summarizes assets under administration and assets under management. As at October 31, 2010, these items totalled $15.0 billion, up $784.9 million compared with October 31, 2009. Fees, commissions and other income related to these assets contribute significantly to the Bank’s profit-ability. Certain fees, commissions and other income related to these assets are shown in Table 11.
TABLE 19ASSETS unDER ADMInISTRATIOn AnD ASSETS unDER MAnAGEMEnTAs at October 31 (in thousands of dollars)
2010 2009
Self-directed RRSPs and RRIFsMortgage loans under managementClients' brokerage assetsMutual fundsInstitutional assetsOther – Personal
$ 7,820,707 2,923,236
2,274,998 1,697,377
299,927 25,034
$ 7,599,034 2,876,695 1,969,917 1,440,852
341,628 28,299
Total – assets under administration and assets under management $15,041,279 $14,256,425
Assets related to self-directed plans grew $221.7 million compared with last year owing to recovering markets, partially offset by increased competition. Helped by a favourable regulatory environment, financial institutions are motivated to manage their own clients’ self-directed plans themselves. As a result, over the medium term, these activities should continue to be impacted negatively, regardless of market valuations.
Mortgage loans under management were up $46.5 million, as securitization operations carried out during fiscal 2010 more than offset maturities and pre-payments on mortgage loans sold in prior years.
Clients’ brokerage assets rose by more than 15%, driven by solid organic growth and a good market performance in 2010.
Mutual fund assets under administration increased by $256.5 million or 18% during fiscal 2010, owing to favourable market conditions and strong net annual sales of mutual funds.
Institutional assets related to trust services were relatively unchanged at $300.0 million, compared with the October 31, 2009 level.
DERIvATIvE FInAnCIAL InSTRuMEnTS In the normal course of its operations, the Bank enters into various contracts and commitments to protect itself against the risk of fluctuations in interest rates, foreign exchange rates and indices on which returns of index-linked deposits are based, as well as to provide protection against the risk of
fluctuations in interest rates to special purpose entities with regard to the Bank’s securitization transactions, meet clients’ requirements and generate revenues from trading activities. These contracts and commitments constitute derivatives. The Bank does not enter into any credit default swaps.
All derivatives are recorded in the balance sheet at fair value. Derivative values are calculated using notional amounts. However, these amounts are not recorded in the balance sheet, as they do not represent the actual amounts exchanged. Likewise, notional amounts do not reflect the credit risk related to derivative financial instruments, although they serve as a reference for calculating payments.
The notional amounts of the Bank’s derivatives totalled $19.0 billion as at October 31, 2010, compared with $19.9 billion as at October 31, 2009. The net negative fair value of derivative financial instruments stood at $51.1 million as at October 31, 2010, compared with a net positive fair value of $43.1 million as at October 31, 2009, resulting in a net decrease in fair value of $94.2 million. The year-over-year decrease resulted mainly from interest receipts totalling $116.3 million during the year relating to interest rate swaps held for hedging purposes, partly compensated by the effect of changes in interest rates in 2010, as well as the decline in value of seller swaps.
Notes 20 to 22 to the annual consolidated financial statements provide further information on the various types of derivative products and their recognition.

40 laurentian banK 2010 Annual Report
management’s discussion and analysis
SECuRITIZATIOn ACTIvITIESThe Bank uses special purpose entities to securitize mortgage loans in order to obtain funding and, to some extent, to reduce credit risk and manage its capital position. The Bank does not act as an agent for clients engaged in this type of activity.
As part of a securitization transaction, an entity transfers assets to a special purpose entity, which generally consists of a Canadian trust, in exchange for cash. The special purpose entity finances these purchases through the issuance of term bonds or commercial paper. Sales of receivables are sometimes accompanied by credit enhancement features to improve the bonds’ or commercial paper’s credit ratings. Credit enhancements mainly take the form of cash reserve accounts, over-collateral-ization in the form of excess assets, and liquidity guarantees. Securitization programs generally include seller swap contracts to protect the special purpose entities against certain interest rate and prepayment risks. Securitization opera - tions are reported as sales of assets only when the seller is deemed to have surrendered control over these assets and to the extent it receives consideration other than beneficial interests in the transferred assets.
The Bank securitizes mortgage loans primarily through the Canada Mortgage Bonds Program (CMB Program) developed by the Canada Mortgage and Housing Corporation (CMHC) and multi-seller conduits set up by large Canadian banks. As part of transactions with multi-seller conduits, the Bank provides credit enhancements in the form of cash reserve accounts and rights to future excess interests, which constitute retained interests. Similarly, the Bank has concluded seller swap agree-ments designed to protect the special purpose entities against interest rate risks. With regard to the CMB Program, the Bank must manage the maturity and duration mismatch between the amortizing mortgage pool and the Canada Mortgage Bonds (CMB), as well as the ensuing reinvestment risk. As part of this arrangement, the Bank enters into seller swaps which guarantee payments to investors. These seller swaps are derivatives and were therefore marked-to-market through the consolidated statement of income.
The Bank also continues to manage all securitized assets after they are sold. As at October 31, 2010, total outstanding securi-tized residential mortgage loans amounted $2.7 billion. Total outstanding securitized residential mortgage loans also amounted to $2.7 billion as at October 31, 2009.
Revenues of $6.0 million were recorded in 2010 as part of secu-ritization operations, including $13.5 million in gains on sale and $7.0 million in servicing revenues, offset by net charges of
$14.4 million mainly related to changes in fair values of retained interest, securitization swaps and financial instruments held for economic hedging purposes.
The Bank does not act as an agent for clients engaged in this type of activity and has no other significant involvement, such as liquidity and credit enhancement facilities, with any securiti-zation conduit.
Notes 6 and 25 to the annual consolidated financial statements and the discussion on critical accounting policies and estimates on page 58 of this MD&A provide additional information on these transactions.
Effect of securitization programs on regulatory capital ratiosTransfers made through the Canada Mortgage Bonds Program do not significantly impact Tier 1 and Total capital ratios, as the mortgage loans sold are insured by CMHC and already have a 0% risk weight. Similarly, transfers of conventional residential mortgage loans generally do not have a significant impact on capital ratios, as regulatory capital is adjusted to take into account the credit risk that the Bank continues to assume through retained interests. However, these sales do reduce the assets to capital multiple, as the mortgage loans are derecog-nized under Canadian gAAP.
Transfers of commercial mortgage loans performed by the Bank generally have a positive effect on capital ratios, as the Bank does not usually retain any credit risk when transferring such loans.
CREDIT COMMITMEnTSIn the normal course of its operations, the Bank uses various off-balance sheet credit instruments. The credit instruments used as a means of meeting client financial needs represent the maximum amount of additional credit that the Bank may be required to extend if the commitments are fully used. See Note 24 to the annual consolidated financial statements for further information.
GuARAnTEES In the normal course of its operations, the Bank enters into guarantee agreements that satisfy the definition of guarantees established by the Canadian Institute of Chartered Accountants (CICA) in Accounting guideline No. 14, Disclosure of guarantees. The principal types of guarantees are standby letters of credit and performance guarantees. Note 24 to the annual consolidated financial statements provides additional information on these guarantees.
TABLE 20CREDIT COMMITMEnTS AnD GuARAnTEESAs at October 31 (in thousands of dollars)
2010 2009
undrawn amounts under approved credit facilities (1)
Documentary letters of creditStandby letters of credit and performance guarantees
$2,468,800 $ 6,670 $ 175,245
$2,581,176 $ 8,675 $ 157,102
(1) Exclude personal credit facilities totalling $1.4 billion ($1.3 billion as at October 31,2009) and credit card lines amounting to $1.0 billion ($0.8 billion as at October 31, 2009) since they are revocable at the Bank’s option.

management’s discussion and analysis
laurentian banK 2010 Annual Report 41
caPital management
Management’s objective is to maintain an adequate level of capi - tal, in line with its risk profile, to support the Bank’s activities while enhancing shareholder value.
The Bank has an Internal Capital Adequacy Assessment Process (ICAAP) in place, which forms an integral part of the capital management planning process. Capital adequacy depends on various internal and external factors. The Bank’s capital level underscores its solvency and capacity to cover risks related to its operations while providing depositors and creditors with the safeguards they seek. Moreover, capital requirements are aligned with its Strategic Plan, industry capitalization levels and investors’ and shareholders’ expecta-tions. While rating agencies do not assign credit ratings to the Bank based solely on capital levels, the Bank’s capital must be consistent with the credit rating sought. As a result, the Bank’s capital adequacy targets vary over time in line with these factors. The ICAAP starts with strategic planning, which sets main targets and priorities for the Bank. The guidelines ensuing from the ICAAP, combined with a report assessing capital adequacy relative to the Bank’s objectives, serve as inputs to the Capital Plan, which itself defines guidelines governing proactive capital management.
As shown in the following diagram, capital adequacy is influenced by various factors.
Each year, the Board of Directors reviews and approves several capital-related documents, including the Capital Management and Adequacy Policy, the Business and Financial Three-Year Plan and the Capital Plan. Management monitors capital ratios on a monthly basis, while the Board’s Risk Management Committee reviews capital adequacy on a quarterly basis. The Integrated Risk Management group oversees the Bank’s capital management framework, particularly through the Capital Management and Adequacy Policy. The group also monitors capital limits and adequacy. The Bank’s Treasury Department reviews the Capital Plan and manages capital on an ongoing basis.
REGuLATORy CAPITALRegulatory capital calculation is determined based on the guidelines issued by the Office of the Superintendent of Financial Institutions Canada (OSFI) originating from the Basel Committee on Banking Supervision (BCBS) regulatory risk-based capital framework. Tier 1 capital represents more permanent forms of capital, is free of mandatory fixed charges against earnings and has a subordinate legal position to the rights of depositors and other creditors of the financial institution. Tier 2 capital consists of supplementary capital instruments that contribute to the overall strength of a financial institution as a going concern. Total capital is defined as the sum of Tier 1 and Tier 2 capital.
Regulatory capital requirements impose minimum levels of capital that have to be taken into consideration with the other factors mentioned above when assessing the Bank’s capital adequacy. under BCBS standards, banks must maintain a mini - mum Tier 1 capital ratio of 4% and a total capital ratio of at least 8%. OSFI requires that Canadian deposit-taking financial institutions maintain a minimum Tier 1 capital ratio of 7% and a total capital ratio of at least 10%. The Bank opted for the stan-dardized approach in determining credit risk capital and used the basic indicator approach in determining operational risk capital. Tables 21 and 22 outline the risk-weighted assets and regulatory capital used to calculate BCBS ratios. The Bank and its subsidiaries were in compliance with OSFI’s capital require-ments throughout the year.
PROPOSAL FOR nEW CAPITAL AnD LIQuIDITy REGuLATORy MEASuRESIn December 2009, the BCBS published proposals on new capital and liquidity requirements. updates were also published in July and September 2010, providing additional information. The proposals introduce new global liquidity standards and provide more stringent capital adequacy standards. More information regarding these new regulatory requirements is expected over the coming months. At this stage, it is still too early to deter-mine the definitive impact on capital ratios and liquidity requirements, considering the proposals are yet to be finalized at both the international (BCBS) and national (OSFI) levels and may further change between now and when the final rules take effect. Nonetheless, considering the Bank’s strong capital position and the nature of its operations, and based on available information, management believes that the Bank is well posi-tioned to meet upcoming capital requirements.
RATINGAGENCIES
INDUSTRYCAPITALIZATION
LEVELCA
PIT
AL
LE
VEL
REGULATORS
STRATEGICPLAN
INHERENT RISKS OF THE BANK
INVESTORS
FACTORS INFLUENCING CAPITAL ADEQUACY

42 laurentian banK 2010 Annual Report
management’s discussion and analysis
TABLE 21RISK-WEIGHTED ASSETSAs at October 31 (in thousands of dollars)
2010
0% 20% 35% 50% 75% 100% 150% TOTAL
RISK- WEIGHTED
ASSETS
Exposure Class Corporate Sovereign Bank Retail residential mortgage loans Other retail Small business entities treated as other retail Equity Securitization Other assets
$ 1,622 3,740,188
–
4,046,779 638,031
90,388 – –
61,599
$ 29,210 139,289 209,246
– –
– –
21,187 115,710
$ – – –
4,415,333 –
– – – –
$48,368 – –
– –
– –
6,006 –
$ – – –
– 2,667,424
343,749 – – –
$3,761,869 – –
35,299 10,833
– 260,099
1,646 490,605
$36,949 – –
– –
– – – –
$ 3,878,018 3,879,477
209,246
8,497,411 3,316,288
434,137 260,099
28,839 667,914
$ 3,847,319 27,858 41,849
1,580,666 2,011,401
257,812 260,099
8,886 513,747
8,578,607 514,642 4,415,333 54,374 3,011,173 4,560,351 36,949 21,171,429 8,549,637
Derivative financial instruments Credit-related commitments Operational risk
135
34,338
273,850
6,000
–
–
–
–
–
–
14,534
520,634
–
–
288,519
560,972
69,304
521,834 1,247,275
$8,613,080 $794,492 $4,415,333 $54,374 $3,011,173 $5,095,519 $36,949 $22,020,920 $10,388,050
Balance sheet items Cash resources Securities Mortgage loans Other loans and customers’ liabilities under acceptances Other assets
$ 7,004 409,363
3,907,555 3,710,884
514,831
$ 8,549,637
2009
0% 20% 35% 50% 75% 100% 150% TOTAL
RISk- WEIgHTED
ASSETS
Exposure Class Corporate Sovereign Bank Retail residential mortgage loans Other retail Small business entities treated as other retail Equity Securitization Other assets
$ 2,9644,469,789
–
3,588,597580,959
84,267––
55,206
$ 18,36390,987
229,054
––
––
14,32860,283
$ –––
3,477,915–
––––
$32,628––
––
––
6,604–
$ –––
–2,947,036
392,550–––
$ 3,249,101––
31,17116,009
–118,983
1,539503,578
$23,799––
––
––––
$ 3,326,8554,560,776
229,054
7,097,6833,544,004
476,817118,983
22,471619,067
$3,304,78718,19745,811
1,248,4412,226,286
294,413118,983
7,707515,635
8,781,782 413,015 3,477,915 39,232 3,339,586 3,920,381 23,799 19,995,710 7,780,260
Derivative financial instruments Credit-related commitments Operational risk
997
36,191
298,827
8,000
–
–
291
–
–
–
16,106
469,433
–
–
316,221
513,624
76,017
471,0331,153,513
$8,818,970 $719,842 $3,477,915 $39,523 $3,339,586 $4,405,920 $23,799 $20,825,555 $9,480,823
Balance sheet items Cash resources Securities Mortgage loans Other loans and customers’ liabilities under acceptances Other assets
$ 12,697220,257
3,222,8673,807,878
516,561
$7,780,260

management’s discussion and analysis
laurentian banK 2010 Annual Report 43
TABLE 22REGuLATORy CAPITAL – BISAs at October 31 (in thousands of dollars, except percentage amounts)
2010 2009 vARIANCE
10 / 09
Tier 1 capital Common shares Contributed surplus Retained earnings Non-cumulative preferred shares goodwill Securitization-related deductions and other
$ 259,363 243
741,911 210,000 (53,790 (23,436
))
$ 259,208 209
665,538 210,000 (53,790 (35,341
))
– 16 11
– –
(34
%
)
Total Tier 1 capital (A) 1,134,291 1,045,824 8
Tier 2 capital Subordinated debentures general allowances Securitization-related deductions and other
150,000 73,250
(20,214)
150,000 72,864
(32,822)
– 1
(38)
Total Tier 2 capital 203,036 190,042 7
Total regulatory capital - BIS (B) $ 1,337,327 $1,235,866 8 %
Total risk-weighted assets (Table 21) (C)Tier 1 BIS capital ratio (A/C)Total BIS capital ratio (B/C)Assets to capital multipleTangible common equity as a percentage of risk-weighted assets
$10,388,050 10.9 12.9 17.9
9.0
%% x%
$9,480,823 11.0 13.0 18.0
9.1
%% x%
DIvIDEnDSThe Board of Directors must approve dividend payments on preferred and common shares on a quarterly basis. The decla-ration and payment of dividends are subject to certain legal restrictions, as explained in Note 13 to the annual consolidated financial statements. The level of dividends declared on common
shares reflects management and Board views of the Bank’s financial outlook and takes into consideration market and regulatory expectations, as well as the Bank’s growth objectives in its Strategic Plan. The following table summarizes dividends declared for the last three years.
TABLE 23
SHARE DIvIDEnDS AnD PAyOuT RATIOFor the years ended October 31 (in thousands of dollars, except per share amounts and payout ratios)
2010 2009 2008
Dividends declared on preferred sharesDividends declared per common shareDividends declared on common sharesPayout ratio
$11,775 $ 1.44
$34,446 31.1 %
$11,775 $ 1.36
$32,453 32.1 %
$11,775 $ 1.30
$30,993 34.2%

44 laurentian banK 2010 Annual Report
management’s discussion and analysis
integrated risK management FrameWorK
The Bank is exposed to various types of risks owing to the nature of the activities it pursues. To ensure that all of the significant risks to which the Bank could be exposed are taken into consideration, an Integrated Risk Management Framework has been developed. The framework provides a comprehensive view of risk assessment and control for various stakeholders.
The main objective of this framework is to develop and maintain a risk management culture centered on establishing measures that allow for the optimization of the risk/return ratio in all of the Bank’s areas of activity. The framework also highlights the following objectives:– The establishment of processes to continuously detect,
understand and evaluate major risks; – The adoption of sound and prudent risk limits and risk
management policies; – The establishment and application of effective internal
controls;– The definition of the Management Committee’s roles and
responsibilities regarding risk management;– The alignment of the Bank’s strategy and objectives with
its risk tolerance; and– The reporting to the Board of Directors of all risks through
a quarterly Integrated Risk Management Report.
Risk management is conducted according to tolerance levels established by management committees and approved by the Board of Directors through its committees. Risks are therefore managed in compliance with policies and risk limits approved by the Board of Directors and in accordance with the governance structure outlined hereafter.
ROLES AnD RESPOnSIBILITIES OF THE BOARD OF DIRECTORS’ COMMITTEES The Board of Directors ascertains that the Bank is equipped with an appropriate strategic management process that takes risks into consideration. Moreover, on the strength of the certi-fications and consolidated reports prepared by management, the Board of Directors assesses, on a yearly basis, whether the Bank presents an environment conducive to control.
The Board of Directors’ Risk Management Committee must ascertain whether the Integrated Risk Management Framework has been properly implemented, and periodically reviews its operation. It must also ascertain whether the Framework is equipped with an appropriate risk management process directed at identifying, measuring, quantifying and managing risks, as well as setting appropriate policies with regard to market, liquidity and funding, credit, reputational and operational risks.
ROLES AnD RESPOnSIBILITIES OF InTERnAL RISK MAnAGEMEnT COMMITTEESThe Management Committee, chaired by the President and Chief Executive Officer, functions as the Bank’s primary risk management committee. It ensures that the Integrated Risk Management Framework is properly implemented. The Committee also reviews the Code of Ethics and the Regulatory Risk Management Policy and is responsible for implementing the necessary framework for business, regulatory, strategic, reputation and insurance risk management. Furthermore, the Committee, assisted by the Risk Management Committees, assesses and reviews the risk management policies on market, liquidity and funding, credit, reputation and operational risks.
STRATEGIC AND BUSINESS RISKS
LIQUIDITY AND FUNDING RISK
INSURANCE RISK
REGULATORY RISK
OPERATIONAL RISK
ENVIRONMENTAL RISK
CREDIT RISK
REPUTATION RISK
MARKET RISK
BOARD OFDIRECTORS
RISK MANAGEMENTCOMMITTEE OFTHE BOARD (1)
MANAGEMENTCOMMITTEE
RISK MANAGEMENTCOMMITTEE
OPERATIONAL RISKMANAGEMENT
COMMITTEE
ALMCOMMITTEE
CREDITCOMMITTEE
OPERATIONAL MARKET (STRUCTURAL)
MARKET(GLOBAL) CREDIT
LIQUIDITYAND FUNDING ENVIRONMENTAL
STRATEGIC
BUSINESS
REPUTATION
REGULATORY
INSURANCE
GOVERNANCE STRUCTURE
(1) Other Board committees are also responsible for certain risks.

management’s discussion and analysis
laurentian banK 2010 Annual Report 45
The Operational Risk Management Committee reviews and recommends to the Management Committee the approval of policies on operational risk management and reviews the report on operational losses incurred. Moreover, it reviews and approves the tools for the identification and evaluation of oper-ational risks, reviews reports for the Management Committee on the business segments’ action plans designed to mitigate and better manage operational risk, and finally, reviews the operational risk indicators. Furthermore, this committee is responsible for the supervision of the business continuity plan.
The Asset and Liability Management (ALM) Committee over-sees the activities related to the management of structural interest rate risk and of liquidity and funding risk, as well as to capital management. Specifically, it:– Oversees general orientations pertaining to structural interest
rate risk, as well as the risk sensitivity of interest margin results by business segment;
– Approves ALM and liquidity assumptions and ascertains whether the transfer pricing rules are in compliance with these assumptions; and
– Approves the strategies related to funding and capital.
The Credit Committee is primarily responsible for ensuring that credit policies and procedures are drafted and that infor-mation systems related to the management of the Bank’s current and potential credit risks are implemented, as well as for approving loans within established limits. It also reviews delinquency on all types of loans, authorizes loan losses within established limits and ensures the adequacy of the provisions for loan losses.
GOvERnAnCE FunCTIOnS SuPPORTInG InTEGRATED RISK MAnAGEMEnT The following table presents the Bank’s corporate control and governance structure (hereafter the “Structure”), which in-cludes several governance functions designed to contribute to integrated risk management. The Structure is divided into two distinct areas: the control environment and the corporate gov-ernance. The control environment refers to the documented and applied monitoring and control processes, procedures and measures that allow the Bank to manage and control its com-mercial activities, as well as the significant risks it incurs. The control environment thus rests on five functions: human resources, strategic planning, financial integrity, risk manage-ment and compliance. Regarding corporate governance, the Board of Directors has the ultimate responsibility to ensure, as much as possible, that global risk tolerance is consistent with the Bank’s strategies and objectives, and that its resources, technologies and processes are aligned with its objectives. Responsibility for each function is delegated to particular mem-bers of management acting as control environment coordinators, under supervision by the Board of Directors’ committees.
The Internal Audit Department also plays a key role, as it is responsible for implementing and maintaining a reliable and comprehensive system to adequately monitor the effectiveness of the controls exercised within the different Framework func-tions. In addition, regulatory and statutory requirements are an integral part of the Bank’s Integrated Risk Management Framework.
STRATEGIC AnD BuSInESS RISK MAnAGEMEnTStrategic risk results from inadequate business plans, strategies, decision-making processes, allocation and use of the Bank’s resources, as well as its inability to adapt to changes in its operational framework.
Business risk is the potential adverse effect of changes in tax, economic, competitive, legal or accounting conditions on the Bank’s results.
REGULATION
CONTROL ENVIRONMENT CORPORATE GOVERNANCE(1)
HR AND CORPORATE GOVERNANCE COMMITTEE
BOARD OF DIRECTORS
AUDIT COMMITTEE
RISK MANAGEMENT COMMITTEE
RISK MANAGEMENT COMMITTEE
COORDINATORS
CHIEF EXECUTIVE OFFICER / CHIEF FINANCIAL OFFICER
CHIEF FINANCIAL OFFICER
CHIEF RISK OFFICER
CHIEF COMPLIANCE OFFICER
FUNCTIONS
MA
NA
GE
RS STRATEGIC PLANNING
FINANCIAL INTEGRITY
RISK MANAGEMENT
COMPLIANCE
INTERNAL AUDIT
CORPORATE CONTROL AND GOVERNANCE STRUCTURE
(1) Corporate governance provided by the Board of Directors and its committees.
HUMAN RESOURCES CORPORATE HUMAN RESOURCES

46 laurentian banK 2010 Annual Report
management’s discussion and analysis
Senior management is responsible for managing the Bank’s strategic and business risk. Each year, a strategic planning process is carried out. The Bank then analyzes strengths, weaknesses, threats and opportunities to determine the profit-ability and risk profile of its different business segments. The Bank’s overall strategy is therefore established by senior man-agement and submitted to the Board of Directors for approval.
CREDIT RISK MAnAGEMEnT Credit risk is the risk of a financial loss occurring if a counter-party (including a debtor, an issuer or a guarantor) does not fully honour its contractual or financial obligations towards the Bank with regard to a balance sheet or an off-balance sheet financial instrument.
Credit risk management is independent of operations, thus protecting the independence and integrity of risk assessment. The Credit Committee is responsible for operational oversight of overall credit risk management. The integrated risk man-agement report, presented quarterly to the Management Committee and to the Board of Directors’ Risk Management Committee, provides a summary of key information on credit risks. The credit risk management policies adopted by the Bank provide for appropriate risk assessment. These policies cover approval of credit applications by authority level, assignment of risk ratings, management of impaired loans, establishment of general and specific provisions, and risk-based pricing. The policies are periodically reviewed and approved by the Board of Directors’ Risk Management Committee.
The authorization process for counterparties and loans is centralized. The Bank uses expert systems to support the decision-making process for most applications for consumer credit, residential mortgage loans and credit cards, as well as for small commercial loans. With regard to other commercial loans, applications are analyzed on a case-by-case basis by specialized teams. Acting through its credit risk management group, the Bank monitors its financial instrument portfolios in terms of both quality and quantity through: [i] mechanisms and policies governing the review of various types of files; [ii] risk rating systems, and [iii] pricing analysis. Each month, the Bank’s Credit Committee reviews impaired loans and performs high-level analyses on loans where payment is past due by 90 days or more. Collection processes are centralized and are based on specialized expertise.
The Bank has various risk management tools at its disposal. These include an 18-level risk rating system used to evaluate all types of commercial credit. Above a specific rating, files are considered to be under credit watch and are managed accord-ing to specific procedures. With regard to the portfolios’
quality, a loan is considered impaired when interest payments are past due by three months or more, or if management con-siders that there is reasonable doubt that all of the interest and principal will be repaid at maturity.
Specific allowances for losses are established to adjust the book value of impaired loans to the estimated realizable present value. Commercial and real estate impaired loan allowances are revised on an individual basis, as part of a continuous process.
For impaired loans related to consumer loan portfolios, provi-sions are generally established on a portfolio basis, using models that take into account the loss history. Further details on impaired loans are provided in Tables 24 and 25.
In addition to specific provisions, the Bank establishes a general provision in order to provide for losses arising from its per-forming loan portfolios, according to a method that includes factors such as the size of the portfolios, their risk profile and loss history.
Diversification is one of the fundamental principles of risk management. To this effect, the credit policy establishes the guidelines intended to limit concentration of credit by counter-party and sector of activity, and identifies sectors considered risky and thus to be avoided. The loan portfolio mix is detailed in the following graphs.
Loan portfolio mix The Bank’s loan portfolio consists of personal loans, residential mortgage loans, commercial mortgage loans and commercial loans, including bankers’ acceptances. The loan portfolio mix as at October 31, 2010 remains relatively unchanged, compared with a year ago. Residential mortgage loans mainly include retail mortgage loans, as well as mortgage loans on larger residential real estate development properties and projects of $0.5 billion.
Reflecting the Bank’s strong presence with personal clients through its Retail & SME Québec and B2B Trust business segments, exposures to individuals and micro-enterprises represent close to 80% of the Bank’s total loan portfolio. Furthermore, commercial loans and mortgage loans are essentially granted to small and medium-sized businesses.
LOAN PORTFOLIO MIX(in billions of dollars)
RESIDENTIALMORTGAGE LOANS
PERSONALLOANS
COMMERCIALMORTGAGELOANS
COMMERCIALAND OTHERLOANS (including acceptances)
2006 2007 2008 2009 20100
6
12
18

management’s discussion and analysis
laurentian banK 2010 Annual Report 47
Geographic distributionThe Bank operates across Canada. In Québec, it offers most of its lending products mainly through its retail branch network and commercial banking centers. Throughout Canada, the Bank extends its operations through several other commercial banking centers. The Bank also offers its products to a wide network of independent financial intermediaries through B2B Trust. As of October 31, 2010, the proportion of loans granted in Québec represented 63% of total loans while loans granted outside of Québec stood at 37% (unchanged from October 31, 2009).
Insurance and guaranteesA significant proportion of the Bank’s loan portfolio is insured by Canada Mortgage and Housing Corporation (CMHC), or secured by assets pledged as collateral by borrowers.
CMHC offers a mortgage loan insurance program which ulti-mately aims to improve access to affordable mortgage loan financing for Canadians. As an approved lender under the program, the Bank benefits from insurance coverage, thereby reducing its global credit risk and improving its capital ratios. Moreover, by maintaining a high proportion of insured residential mortgage loans, the Bank retains its capacity to engage in securitization operations to finance its activities at optimal cost and manage its cash resources. By the end of fiscal 2010, 47% of residential mortgage loans were insured by CMHC, compared with 48% in 2009. The Bank considers that it holds excellent guarantees for the other conventional mortgage loans whose loan value never exceeds 80% of the initially estimated value of the property, in accordance with legal requirements.
Commercial mortgage loans are further secured by specific assets, including construction projects, commercial properties, shopping centers, office buildings, plants, warehouses and industrial condominiums. In general, the value of these loans does not exceed 60% to 75% of the initially estimated value of the property, depending on the nature of the loan.
B2B Trust’s investment loan portfolio consists mainly of mutual fund loans. Loan underwriting is subject to a rigorous process which allows for the efficient assessment of client credit risk. Authorizations are heavily based on clients’ loan servicing ability and overall financial strength, mainly based on credit scoring. Moreover, the portfolio is periodically analyzed to identify potential credit issues. In addition, loans are collateralized by a comprehensive list of eligible mutual and segregated funds. Stricter credit criteria must be met as loan-to-value ratios increase. For loans where disbursements are significant, addi-tional personal income and net worth information are usually required. Loan underwriting for home equity lines of credit and point-of-sale financing loans allows for the assessment of client credit risk. In addition, these loans are collateralized by real estate assets and other assets. Also, more than 10% of the Bank’s personal loan portfolio consists of student loans and loans granted under the Immigrant Investor program, which are guaranteed by the federal or provincial government.
Changes in loan portfolio mix Personal loans As at October 31, 2010, the personal loan portfolio was $5.6 billion, a slight decrease of $24.3 million compared to October 31, 2009. This resulted mainly from the decline in the point-of-sale financing portfolio, reflecting management’s decision to gradually reduce the risk related to these operations. Home equity lines of credit and B2B Trust’s investment loan portfolio rose by $74.4 million and $95.8 million respectively during the year.
QUÉBEC
GEOGRAPHIC DISTRIBUTION OF LOANS(in billions of dollars)
2008 2009 2010
PERSONALLOANS
RESIDENTIALMORTGAGE LOANS
COMMERCIALMORTGAGELOANS
COMMERCIALAND OTHERLOANS(including acceptances)
OTHER CANADIAN PROVINCES
2008 2009 20100
3
6
9
12
0
3
6
9
12
(1) Including credit card loans, student loans, loans granted under the Immigrant Investor program and other loans.
PERSONAL LOAN PORTFOLIO MIX(in billions of dollars)
INVESTMENTLOANS
LINESOF CREDIT
POINT-OF-SALEFINANCING
OTHERLOANS (1)
2006 2007 2008 2009 20100
2
4
6

48 laurentian banK 2010 Annual Report
management’s discussion and analysis
Residential mortgage loansAs shown in Table 17 on page 38, the residential mortgage loan portfolio, including on-balance sheet loans and securitized loans, increased by $1.4 billion or 14% during fiscal 2010. The Bank’s ability to meet customer’s needs, combined with the low interest rate environment, a better economic outlook and over-all favourable housing market conditions in Canada contributed to maintaining the momentum in this portfolio’s growth.
Commercial mortgage loansCommercial mortgage loans were up 27.5% over fiscal 2009, totalling $1.6 billion as at October 31, 2010, compared with $1.3 billion as at October 31, 2009. Through its Real Estate & Commercial business segment, the Bank continued to generate significant growth in this portfolio. In 2010, the proportion of fixed term loans within this portfolio increased to 63%, from 53% at the end of fiscal 2009. The term business, although yielding narrower margins, provides additional stability to the portfolio as it turns over less frequently than construction lending.
The portfolio provides for sound risk diversification. As at October 31, 2010, the proportion of the portfolio granted in Ontario and Western Canada represented 64% of the total commercial mortgage loan portfolio and 34% in Québec, unchanged from October 31, 2009. The average loan value was $2.3 million as at October 31, 2010 ($1.9 million as at October 31, 2009).
COMMERCIAL MORTGAGE LOANS BY PROPERTY TYPE(in billions of dollars)
2006 2007 2008 2009 20100.0
0.6
1.2
1.8
INDUSTRIAL
OTHERS
SHOPPINGCENTERS
OFFICEBUILDINGS
COMMERCIAL
Commercial loans As at October 31, 2010, the portfolio of commercial loans, including bankers’ acceptances, amounted to $1.9 billion, up $83.9 million from $1.8 billion as at October 31, 2009. This increase results mainly from the small and medium enterprise business in Québec. As presented in Table 24, the portfolio covers a wide range of industries, with no specific industry representing more than 20% of the overall portfolio.
Impaired loansgross impaired loans were up $50.6 million since the beginning of the year, totalling $188.1 million as at October 31, 2010. Net impaired loans amounted to $50.0 million as at October 31, 2010, compared with $23.0 million as at October 31, 2009. The increase since October 31, 2009 essentially resulted from the commercial loan and commercial mortgage loans portfolios, as the recent economic slowdown strained certain commercial and real estate accounts. However, the overall quality of the portfolio remains good. On the other hand, the retail portfolios performed very well. Impaired loans related to the Bank’s point-of-sale portfolio improved markedly, as a result of mea-sures taken to lower the Bank’s risk profile in recent years. In addition, borrowers continued to benefit from the improved employment conditions in Canada and a low interest rate envi-ronment. At approximately 34% of gross impaired loans, specific provisioning was relatively stable compared to the be-ginning of the year when it stood at 30%. This level of provision reflects the good quality of the underlying collateral.
general allowances amounted to $73.3 million as at October 31, 2010, the same level as a year ago. This general provision reflects the estimated losses due to the deterioration in credit quality of loans not yet classified as impaired.
See Note 5 to the annual consolidated financial statements for additional information.
RESIDENTIAL MORTGAGE LOANS BY PROPERTY TYPE(in billions of dollars)
SINGLEDWELLINGS
2-5 UNITS
6 UNITSAND MORE
CONDOMINIUMSAND OTHER
2006 2007 2008 2009 20100
3
6
9

management’s discussion and analysis
laurentian banK 2010 Annual Report 49
TABLE 24DISTRIBuTIOn OF LOAnS By CREDIT PORTFOLIO AnD InDuSTRyAs at or for the years ended October 31 (in thousands of dollars, except percentage amounts)
2010
LOAnS
GROSSIMPAIRED
LOAnSSPECIFIC
ALLOWAnCES
nETIMPAIRED
LOAnS
PROvISIOnFOR LOAn
LOSSES(1)
PersonalResidential mortgageCommercial mortgage
$ 5,630,7888,582,5481,638,861
$ 16,39739,30434,316
$ 5,3124,256
10,934
$ 11,08535,04823,382
$31,4603,4868,729
15,852,197 90,017 20,502 69,515 43,675
Commercial and other Manufacturing Transformation and natural resources Agriculture Public utilities Wholesale and retail Construction Financial services Real estate, renting and lease Other services and government Transportation and communication Other
194,993138,407220,957
53,640310,949140,702105,254346,338200,180101,974
43,246
27,04224,94815,168
3,38510,272
2,006332
5,6052,0376,0381,273
18,5404,5201,4711,0006,4351,485
2724,8051,1534,377
333
8,50220,42813,697
2,3853,837
52160
800884
1,661940
1,856,640 98,106 44,391 53,715 24,325
Total $17,708,837 $188,123 $64,893 123,230 $68,000
general allowance (73,250)
Total – net impaired loans $ 49,980
As a % of average loans and acceptances 1.11 % 0.30 %
(1) Recorded in the consolidated statement of income
2009
LOANS
gROSSIMPAIRED
LOANSSPECIFIC
ALLOWANCES
NETIMPAIRED
LOANS
PROvISIONFOR LOAN
LOSSES(1)
PersonalResidential mortgageCommercial mortgage
$ 5,655,055 7,219,830 1,285,012
$ 23,738 32,368 11,230
$ 7,048 1,878 2,525
$ 16,690 30,490
8,705
$37,112 1,527
980
14,159,897 67,336 11,451 55,885 39,619
Commercial and other Manufacturing Transformation and natural resources Agriculture Public utilities Wholesale and retail Construction Financial services Real estate, renting and lease Other services and government Transportation and communication Other
240,218 132,090 210,910 104,104 253,103 110,258
68,698 344,606 178,480 100,980
29,326
22,960 16,187 12,413
4,809 4,024 2,561 1,944 1,547
719 618
2,376
9,002 8,668 1,761 1,000 2,921 1,384
743 1,476
699 601
1,590
13,958 7,519
10,652 3,809 1,103 1,177 1,201
71 20 17
786
1,772,773 70,158 29,845 40,313 16,381
Total $15,932,670 $137,494 $41,296 96,198 $56,000
general allowance (73,250)
Total – net impaired loans $ 22,948
As a % of average loans and acceptances 0.93% 0.15%
(1) Recorded in the consolidated statement of income

50 laurentian banK 2010 Annual Report
management’s discussion and analysis
TABLE 25GEOGRAPHIC DISTRIBuTIOn OF LOAnS By CREDIT PORTFOLIOAs at October 31 (in thousands of dollars)
2010 2009
LOAnS
GROSSIMPAIRED
LOAnS LOANS
gROSSIMPAIRED
LOANS
Québec Personal Residential mortgage Commercial mortgage Commercial and other
$ 2,623,991 6,489,265
589,498 1,441,310
$ 4,667 13,870 13,473 82,987
$2,612,611
5,588,148 452,838
1,376,204
$ 6,516 10,711
5,998 62,493
11,144,064 114,997 10,029,801 85,718
Other Canadian provinces Personal Residential mortgage Commercial mortgage Commercial and other
3,006,797 2,093,283 1,049,363
415,330
11,730 25,434 20,843 15,119
3,042,444 1,631,682
832,174 396,569
17,222 21,657
5,232 7,665
6,564,773 73,126 5,902,869 51,776
Total $17,708,837 $188,123 $15,932,670 $137,494
MARKET RISK MAnAGEMEnT Market risk represents the financial losses that the Bank could incur following unfavourable fluctuations in the value of financial instruments subsequent to changes in the underlying factors used to measure them, such as interest rates, exchange rates or equity prices. This risk is inherent to the Bank’s financing, investment, trading and asset and liability management (ALM) activities.
Interest rate risk represents the potential adverse impact of interest rate movements. The section covering asset and liability management activities describes the global management of interest rate risk. Structural market risk arises mainly from the differences in maturity dates or re-pricing dates of balance sheet and off-balance sheet items, as well as from the options embedded in certain banking products, such as loan repayment and deposit redemption clauses.
Foreign exchange risk is defined as the losses that the Bank may incur subsequent to adverse exchange rate fluctuations. It originates mainly from foreign exchange positions held by the Bank to support the offering of products and services in currencies other than the Canadian dollar, trading operations and, to a lesser extent, mismatches in currencies of balance sheet and off-balance sheet assets and liabilities, as well as mismatches in receipts and payments of funds in foreign currencies.
Equity risk is defined as financial losses that the Bank may incur subsequent to adverse fluctuations in certain equity prices or the stock market in general.
Policies and standards The primary objective of effective market risk management is to adequately measure significant market risks and ensure that these risks stay within the Bank’s risk tolerance level. The Bank has thus adopted policies and limits to oversee and frame exposure to market risks arising from its trading, investment and asset and liability management activities. The policies and limits establish the Bank’s management practices pertaining to various risks associated with its treasury activities. These policies and limits are approved by the Management Committee and the Board of Directors’ Risk Management Committee at least annually, to ensure their compliance with the retained principles, objectives and management strategies.
Detailed risk level and limit monitoring reports are produced daily and are presented: – Daily, to risk and portfolio managers; and– Quarterly, to the Management Committee and to the Board
of Directors’ Risk Management Committee.
Market risk assessment and management methods (interest rate, foreign exchange and equity)The evaluation of the Bank’s market risks is supported by a combination of various measures such as:– Limits on notional amount; – value at Risk (vaR); and– Stress testing and other sensitivity measures.

management’s discussion and analysis
laurentian banK 2010 Annual Report 51
The Bank sets limits that are consistent with its business plan and its tolerance for market risk. In setting limits, the Bank takes into account market volatility, market liquidity, organiza-tional experience and business strategies. Limits are set at the portfolio level, the business segment level, the risk factor level, as well as at the aggregate Bank level, and are monitored on a daily basis. Market risk limits are based on the key risk drivers in the business and can include limits on notionals, sensitivity measures, vaR and other stress testing. The Bank uses a combination of these methods according to the complexity and nature of its activities.
value at Risk value at Risk corresponds to the potential loss the Bank may incur over a one-day period, with a confidence level of 99%. Consequently, the chances that real losses incurred on any given day exceed the vaR are theoretically 1%. To calculate the vaR, historical simulations that implicitly take into account correla-tions between various risk factors are performed. The vaR is based on 300 days of historical data. values at risk are calcu-lated daily for all financial market activities. The Bank uses backtesting processes to compare theoretical profits and losses to the results of the vaR for trading activities. This allows the validation of the vaR model’s statistical hypotheses. These tests are conducted for each business segment and each risk factor, as well as for the entire trading portfolio. The theoretical change in profits and losses is generated using the daily price movements, and on the assumption that there is no change in the composition of the portfolio.
Stress tests and sensitivity measuresParallel to vaR calculations, the impact of stress tests on profits and losses is assessed for the trading and investment portfolios, and results are used to assess the impact of exceptional market situations. Stress tests constitute a complementary risk mea-sure to vaR and strive to provide an estimate of the worst loss the Bank could incur. The Bank’s stress testing program com-bines historical and statistical scenarios to simulate the impact of significant changes in risk factors on the portfolios’ market value. The Bank also produces daily sensitivity measures (in-cluding measures of volatility and parallel yield curve shifts) on specific business units and financial markets activities as a whole.
Trading activitiesTrading activities are aligned with the needs of the Bank and those of its customers. The market risk associated with trading activities ensues from activities for which the Bank acts as the principal or agent for its customers. These activities are pri-marily carried out by Laurentian Bank Securities and, to a lesser extent, by the Bank’s Corporate Treasury. The following graph presents the daily total vaR of the trading portfolio for the 2010 fiscal year. In December 2009, the Bank participated in an important equity underwriting which resulted in a tempo-rary increase in vaR. The vaR was reduced shortly thereafter as equity instruments were sold.
Asset and liability management activitiesThe purpose of asset and liability management activities is to control structural interest rate risk, which corresponds to the potential negative impact of interest rate movements on the Bank’s revenues and economic value. This risk is mainly attributable to differences in maturity dates or re-pricing dates of balance sheet and off-balance sheet items along with the options embedded in certain banking products, notably clauses on prepayment, deposit redemption and mortgage loan commitments.
Structural risk management requires rigorous monitoring of four distinct portfolio groups:– Banking activities of the Bank’s clientele, which are affected
by customer choices, product availability and term-dependent pricing policies;
– Investment activities, comprising marketable securities and institutional funding;
– Securities trading activities, which are marked-to-market on a daily basis in line with rate movements; and
– A hedging portfolio that helps the Bank control overall interest rate risk within strict internal limits.
Dynamic management of structural risk is intended to maximize the Bank’s profitability while preserving the economic value of common shareholders’ equity. To attain this objective, various treasury and derivative instruments, mainly interest rate swaps, futures and options, are used to modify the interest rate characteristics of the instruments underlying the Bank’s balance sheet and to cover the risk inherent in options embedded in loan and deposit products.
Structural risk is globally managed by the Bank’s Corporate Treasury Department and monitored by the Asset and Liability Management Committee in accordance with the structural risk management policy, which is approved by the Risk Management Committee of the Board of Directors. This policy defines limits relative to the measurement of economic value and net interest income risk. Risk limits are calculated by simulating the impact of immediate and sustained parallel movements of 100 basis points in rates for all maturities.
DAILY TRADING VAR OVER THE LAST 12 MONTHS (in thousands of dollars)
Nov
-09
Jan-
10
May
-10
Aug
-10
Oct
-10
(2,600)
(2,000)
(1,400)
(800)
(200)
(2,600)
(2,000)
(1,400)
(800)
(200)

52 laurentian banK 2010 Annual Report
management’s discussion and analysis
Net interest income risk measures the negative impact on net interest income from interest rate movements over the next 12 months. Economic value of shareholders’ equity risk mea-sures the net negative impact on the present value of balance sheet and off-balance sheet assets and liabilities.
Portfolio positions are reviewed periodically by the Asset and Liability Management Committee, which is in charge of moni-toring the Bank’s positioning with regard to anticipated interest rate movements and recommending hedging of all undesirable or unforeseen interest rate risk. In addition, risk monitoring reports are presented periodically to the Management Committee and the Board of Directors’ Risk Management Committee.
To ensure sound management of structural risk, a repricing gap report is produced monthly. This statement is then used as the basis for the simulation analysis of the impact of inter-
est rate variation on net interest income and economic value of shareholders’ equity. One of the simulation exercises consists of subjecting the Bank’s balance sheet to sudden parallel and sustained 1% and 2% increases and decreases in interest rates. For example, as at October 31, 2010, for all portfolios, a 1% increase in interest rate would have triggered an increase of approximately $4.7 million in net interest income before taxes over the next 12 months and a $22.6 million negative impact on the economic value of common shareholders’ equity. Table 26 below details other interest rate movements. These results reflect management’s efforts to take advantage of anticipated short-term and long-term interest rate movements, while maintaining the sensitivity to these fluctuations well within approved limits. The Bank’s interest rate gap position as at October 31, 2010 appears in Note 21 to the annual consolidated financial statements.
TABLE 26RISK SEnSITIvITy AnALySISAs at October 31 (in thousands of dollars)
2010 2009
nET InTERESTInCOME (1)
ECOnOMIC vALuE OF COMMOn
SHAREHOLDERS’ EQuITy (2)
NET INTERESTINCOME (1)
ECONOMIC vALuE OF COMMON
SHAREHOLDERS’ EQuITY (2)
Impact of: 100bp increase in rates 100bp decrease in rates
$ 4,650 (10,411)
$ (22,638 25,714
)
$ (4,779 (21,506
))
$(19,626 22,682
)
Impact of: 200bp increase in rates 200bp decrease in rates
9,091 $(46,073)
(44,050 $ 49,540
)
(9,540$(67,298
))
(38,160 $ 22,063
)
(1) As a result of the unusually low interest rate levels at year end, the rate sensitivity analysis provides certain asymmetrical results with regards to the impact on net interest income over the next 12 months.
(2) Net of income taxes
OPERATIOnAL RISK MAnAGEMEnT Operational risk is inherent to the activities of financial institu-tions. It results from inadequacy or failure attributable to processes, persons or internal systems or from external events.
The Operational Risk Management Policy, reviewed annually by the Board of Directors’ Risk Management Committee, des-cribes the operational risk management framework and defines the roles and responsibilities of various stakeholders. The Operational Risk Management Committee, which reports to the Management Committee, constitutes one of the basic ele - ments of the operational risk governance structure. However, it is incumbent upon managers of business units and subsidiaries to proactively manage the operational risk inherent in their daily operations. The Operational Risk Management group oversees the operational risk management process. The Bank’s Internal Audit Department contributes to this process by transmitting the conclusions of its auditing mandates to the Operational Risk Management group as well as to the Board of Directors’ Risk Management and Audit Committees.
The Bank’s operational risk management process includes the following steps:
Adoption of policies by the Board of DirectorsThe operational risk management framework includes the following policies: operational risk management policy; outsourcing risk management policy; business continuity mana - gement policy; information security risk management policy; protection of personal information policy, and professional liability risk management policy.
Collection of operational loss dataData concerning operational losses are centralized within the Operational Risk Management group.
Identification of operational riskManagers must identify the risks ensuing from their activities, including risks related to new products, new activities and new processes.
management’s discussion and analysis
laurentian banK 2010 Annual Report 53
Evaluation of operational risks All of the Bank’s activities are grouped within large processes. Following any significant change to these processes or to the implementation of a new process, managers must perform an assessment to assign appropriate risk ratings to each of their processes. If necessary, action plans are designed to minimize any significant detected risks.
Management of operational riskOperational risk management means, among other things, deciding to accept, reduce, avoid or transfer certain risks and put in place appropriate procedures and control measures. The Bank uses several means to minimize or transfer its risks, including participation in a corporate insurance program and elaboration of a global and integrated plan for business conti-nuity. Furthermore, a Fraud Prevention Committee, composed of security specialists and business unit representatives meets periodically to analyze fraud trends and continuously improve the Bank’s methods and means of preventing fraud.
Production of operational risk reportsThe Operational Risk Management group produces reports that are sent to managers, members of the senior management team and the Risk Management Committee of the Board. These reports include information on operational losses per risk category and major business segment.
Outsourcing managementThe Bank has to rely on strategies to maintain a competitive cost structure and product diversification. Outsourcing consti-tutes one of these important strategies. It facilitates access to state-of-the-art technologies, fosters economies of scale and allows for process efficiency improvements. An outsourcing agreement will be deemed acceptable if it provides short- and long-term advantages to the Bank and involves an acceptable level of risk. The Bank has implemented an outsourcing risk management policy covering all of the Bank’s businesses. It is designed to oversee outsourcing activities and ensure that the major agreements are managed in a prudent manner and that their monitoring and supervision are adequate in accordance with their significance.
LIQuIDITy AnD FunDInG RISK MAnAGEMEnT Liquidity and funding risk represents the possibility that the Bank may not be able to gather sufficient cash resources when required and on reasonable conditions, to meet its financial obligations.
The Bank’s overall liquidity risk is managed by Corporate Treasury with oversight by a management committee in charge of asset and liability management, in accordance with the policies governing cash resources, financing and collateral manage-ment. The main purpose of these policies is to ensure that the Bank has sufficient cash resources to meet its current and future financial obligations, under both normal and stressed conditions.
The Bank monitors cash resources daily and ensures that liquidity indicators are within established limits. Liquidity management pays particular attention to deposit and loan maturities, as well as to funding availability and demand when planning financing. The Bank maintains a reserve of unencum-bered liquid assets that are readily available to face contin - gencies. It defines its cash requirements based on scenarios evaluating survival horizons that measure the period during which liquid assets could cover the withdrawal of wholesale financing and retail deposits. The Bank strives to maintain a stable volume of base deposits originating from its retail and brokerage clientele, as well as well-diversified financing sources. The Bank monitors guidelines on funding sources at the mana-gement and board level. Financing strategies also include loan securitization and the issuance of equity or debt instruments through capital markets. A liquidity contingency plan is pre-pared and reviewed on a regular basis. It provides a detailed action plan that would enable the Bank to fulfill its obligations in the event of an internal or external liquidity crisis.

54 laurentian banK 2010 Annual Report
management’s discussion and analysis
Detailed information on liquid assetsThe Bank’s liquid assets consist of cash and non-interest bearing deposits with other banks, interest-bearing deposits with other banks, securities and securities purchased under reverse repurchase agreements. As at October 31, 2010, these assets totalled $5.2 billion, a slight decrease compared with $5.3 billion as at October 31, 2009. More than 80% of the Bank’s liquid assets are composed of marketable securities issued or guaranteed by the Canadian government, provinces or municipal corpora-tions. Liquid assets provide the Bank with flexibility to manage its loans and deposit portfolio maturities and commitments, and meet other current operating needs. In addition, within the marketable securities portfolio, held-for-trading and designated-as-held-for-trading portfolios offer fixed-income trading opportunities or are used to hedge certain exposures.
Funding The Bank relies mainly on retail deposits (both branch and ad-visor-sourced) to fund its operations. Retail deposits continue to be a particularly stable source of funding for the Bank, owing to their availability and lower cost when compared to institu-tional deposits. To a lesser extent, the Bank also uses securitization of residential mortgage loans through the Canada Mortgage Bonds (CMB) Program. This liquidity source provides added flexibility to meet specific increases in funding needs. The introduction of B2B Trust HIIA, in 2009, has also provided a significant new source of retail funding and temporarily reduced the Bank’s use of institutional money-market funding.
A. PERSONAL TERM DEPOSITS 45.2%B. PERSONAL NOTICE AND DEMAND DEPOSITS 19.7%C. BUSINESS AND OTHER DEPOSITS 11.8%D. SECURITIZATION 11.4%E. INSTITUTIONAL DEPOSITS 6.1%F. SHAREHOLDERS’ EQUITY AND SUBORDINATED DEBENTURES 5.8%
AB
C
DEF
FUNDING SOURCES(as a percentage)
Personal depositsTotal personal deposits increased $0.3 billion, to $15.4 billion as at October 31, 2010, compared with $15.1 billion as at October 31, 2009. This muted growth in deposits reflects the Bank’s continued optimization of its liquidity levels, maintaining its privileged position in the retail market and advisor-sourced deposit market in particular. A significant proportion of these deposits is insured by the Canada Deposit Insurance Corporation, up to $100,000 per client, per regulated deposit-taking financial institution. As at October 31, 2010, these deposits represented 78% of the Bank’s total deposit portfolio.
Business, banks and other depositsDeposits from businesses, banks and other increased by $1.1 billion, totalling $4.3 billion as at October 31, 2010, compared with $3.2 billion as at October 31, 2009. This growth stemmed mainly from semi-institutional and institutional money market funding, but also from initiatives to raise deposits related to commercial accounts, which resulted in increases of more than $250 million during the year.
SECURITIES(in billions of dollars)
SECURITIES ISSUED OR GUARANTEED BY CANADA, PROVINCES AND MUNICIPAL CORPORATIONS
OTHER DEBTSECURITIES
SHARESAND OTHER
2006 2007 2008 2009 20100
1
2
3
4
5

management’s discussion and analysis
laurentian banK 2010 Annual Report 55
TABLE 27DEPOSITSAs at October 31 (in thousands of dollars, except percentage amounts)
2010 2009
Personal Notice and demand Branch network Financial intermediaries
$ 2,112,762 2,567,341
10.7 13.1
% $ 1,992,975 2,571,138
10.9 14.0
%
4,680,103 23.8 4,564,113 24.9
Term Branch network Financial intermediaries
4,996,163 5,748,510
25.4 29.2
4,894,401
5,680,123 26.8 31.0
10,744,673 54.6 10,574,524 57.8
Sub-total – personal 15,424,776 78.4 15,138,637 82.7
Business, banks and other Notice and demand Term
2,332,541 1,918,278
11.9 9.7
2,186,101 975,228
12.0 5.3
Sub-total – Business, banks and other 4,250,819 21.6 3,161,329 17.3
Total – deposits $19,675,595 100.0 % $18,299,966 100.0 %
Credit ratingsPersonal deposits, collected through the branch network and financial intermediaries, constitute the most important source of financing for the Bank. In certain circumstances, however, particularly during periods of strong growth, the Bank must turn to the markets to obtain financing through securitization and unsecured financing. The Bank’s capacity to obtain such financing, as well as the related conditions, are tied to the credit ratings set by rating agencies such as DBRS Limited and Standard & Poor’s. Revisions of the Bank’s credit ratings may therefore have an effect on the financing of operations as well as on requirements with regard to guarantees.
On July 22, 2010, Standard & Poor’s upgraded the Bank’s long-term counterparty credit rating to BBB+ from BBB and subordinated debt rating to BBB from BBB-, reflecting the Bank’s improved and more sustainable core operating perfor-mance and stable asset quality. During fiscal 2010, all other ratings for the Bank were confirmed and remained unchanged. As of the date of this report, the ratings outlook, as determined by the DBRS Limited and Standard & Poor’s credit rating agencies, were stable.1
The following table presents the Bank’s credit ratings as established by the rating agencies.
TABLE 28CREDIT RATInGSAs at October 31, 2010
DBRSSTAnDARD &
POOR’S
Deposits and senior debtShort-term instrumentsSubordinated debenturesPreferred shares
BBB (high) R-1 (low)
BBB Pfd-3 (low)
BBB+ A-1 (low)
BBB BBB-
1 A S&P rating outlook assesses the potential direction of a long-term credit rating over the intermediate term (typically six months to two years). In determining a rating outlook, consideration is given to any changes in the economic and/or fundamental business conditions. An outlook is not necessarily a precursor of a rating change or future action. The S&P rating outlooks have the following meanings:– “Positive” means that a rating may be raised– “Negative” means that a rating may be lowered– “Stable” means that a rating is not likely to change– “Developing” means a rating may be raised or lowered
Each DBRS rating category is appended with one of three rating trends—“Positive,” “Stable,” “Negative”—in addition to “under Review.” The rating trend helps to give the investor an understanding of DBRS’s opinion regarding the outlook for the rating in question. However, the investor must not assume that a positive or negative trend necessarily indicates that a rating change is imminent.

56 laurentian banK 2010 Annual Report
management’s discussion and analysis
Contractual obligations In the normal course of its activities, the Bank enters into various types of contractual agreements. Its main obligations follow from the issuance of debt instruments, including depos-its written with individuals, businesses and other institutions. This financing, combined with the issuance of capital, is used primarily to finance loan and investment operations.
In addition, the Bank must also ensure that cash resources are available to meet the requirements related to some infrastruc-ture investments, notably the maintenance of its branch network,
the modernization of its information technology platforms, as well as to projects related to compliance with regulatory requirements. These projects inevitably require significant investments annually.
The following table summarizes the Bank’s principal contractual obligations as at October 31, 2010, maturing over each of the next five years and thereafter. Note 24 to the annual consolidated financial statements provides further information on this subject.
TABLE 29COnTRACTuAL OBLIGATIOnSAs at October 31, 2010 (in thousands of dollars)
NO FIxED
MATuRITY 2011 2012 2013 2014 2015 THEREAFTER TOTAL
DepositsObligations related to securities sold shortObligations related to securities sold under repurchase agreementsSubordinated debenturesCommitments under leases, technology services and other contracts
$7,012,644
–
– –
–
$5,561,877
1,362,336
60,050150,000
74,671
$3,519,030
–
– –
72,579
$1,850,539
–
– –
71,007
$898,851
–
– –
52,040
$814,386
–
– –
49,169
$ 18,268
–
– –
89,560
$19,675,595
1,362,336
60,050 150,000
409,026
Total $7,012,644 $7,208,934 $ 3,591,609 $1,921,546 $950,891 $863,555 $107,828 $21,657,007
REPuTATIOn RISK MAnAGEMEnT Reputation risk corresponds to the risk that a decision, an event or a series of events affect, either directly or indirectly the Bank’s image with shareholders, clients, employees, the general public or any other stakeholders, and may negatively impact the Bank’s revenues, operations and, ultimately, its value.
Reputation risk most often results from the inadequate man-agement of other risks and may affect almost every activity of a financial institution, even when operations are, from a technical point of view, in compliance with legal, accounting and regulatory requirements. Reputation is a critical asset that favours com-pany growth as well as continued trust from clients and the general public, and optimizes company value in the eyes of shareholders. Reputation is therefore a strategic asset.
To protect the Bank from any impairment to its reputation and considering the importance of this risk, the Management Committee controls and supervises reputation risk manage-ment through the application of a specific policy. Other policies and committees also enable the Management Committee to properly manage potential threats that could have a direct or indirect impact on reputation.
REGuLATORy RISK MAnAGEMEnT Regulatory risk refers to the risk of non-compliance by the Bank with applicable laws, regulations, regulatory authority guide-lines and voluntary codes. The regulatory risk management policy implements the Bank’s Regulatory Risk Management Framework, which comprises the following elements:– Identification of the regulatory requirements applicable
to the Bank;– Assessment of the risk attributable to each regulatory
requirement;– Development, updating and application of controls designed
to ensure compliance with the regulatory requirement;– Evaluation of the effectiveness of the controls; and– Identification and correction of situations of non-compliance.
Compliance reports are submitted at least quarterly to the Management Committee and the Board of Directors’ Risk Management Committee. A review mechanism, designed to evaluate the Regulatory Risk Management Framework’s effectiveness, is also in place.
management’s discussion and analysis
laurentian banK 2010 Annual Report 57
InSuRAnCE RISK MAnAGEMEnTInsurance risk is the risk of loss that may occur when hypothe-ses related to creditor insurance products offered by the Bank, notably with regard to the determination of assumptions used to set premiums or for valuation of reserves, differ from actual insurance underwriting results.
Insurance risk is managed within an independently managed program overseen by experts in the insurance field and by Bank representatives. Reinsurance protections are underwritten to reduce the Bank’s exposure that would arise from significant claims and catastrophes, including terrorist events. In addition, design and pricing of insurance products distributed by the Bank are reviewed by actuarial consultants, based on best practices.
EnvIROnMEnTAL RISK MAnAGEMEnTEnvironmental risk is the risk of financial loss when restoring the assets of the Bank or those seized from clients to a sound environmental state.
Environmental risk related to financing activities is managed within the loan approval process, while risks related to the Bank’s assets, although limited, are mainly managed by the Real Estate segment.
ADDITIOnAL RISKS THAT COuLD POTEnTIALLy AFFECT FuTuRE RESuLTSThe major business risks that may affect the Bank’s results are detailed in the previous sections. This section describes other factors that could have a significant impact on the Bank’s results and cause these results to differ materially from our forward-looking statements as described at the beginning of this Annual Report. Although the Bank maintains comprehen-sive controls and processes to mitigate the risks associated with these factors, by their very nature, they may significantly impact the Bank’s performance.
Economic climate in CanadaThe Bank operates mainly in Québec and Ontario but also, to a lesser extent, in the rest of Canada. Consequently, its earnings are particularly sensitive to the economic and commercial cli-mate in Canada. Major factors include interest rates, inflation, capital market fluctuations, the strength of the economy and the Bank’s volume of business in certain key regions. A pro-longed deterioration in the Canadian economic climate could therefore adversely affect the Bank’s activities.
Monetary policies and other policiesThe monetary policies adopted by the Bank of Canada and the u.S. Federal Reserve’s Board of governors, as well as other measures adopted by central banks, have a major impact on several variables, such as interest rates, exchange rates and bond markets, that can have an impact on the Bank’s earnings. The Bank has no control, however, on changes in monetary policies, nor on capital markets fluctuations.
CompetitionThe Bank’s performance is affected by the level of competition in its markets. The intense competition in the financial services industry could interfere with the Bank’s capacity to reach its objectives. Several factors, including the price of products and services, their quality and variety, and also the actions taken by its competitors, could negatively impact the Bank’s positioning.
Legislative and regulatory amendments and legal proceedingsLegislative and regulatory amendments could affect the Bank by impacting its product and service offering and modifying the financial industry’s competitiveness. Moreover, the Bank’s fail-ure to comply with applicable legislation and regulations could result in sanctions and financial penalties that would have a negative impact on its earnings and reputation. As well, legal proceedings could affect the Bank negatively. Further details are provided in Note 26 to the annual consolidated financial statements.
Ability to attract and retain key employeesThe Bank’s future performance is largely dependent on its ability to attract and retain key employees. Within the financial industry, competition for employees and executives is quite in-tense, and there can be no assurance that the Bank will be able to attract and retain these individuals, which could significantly impact its operations and competitiveness.
Business infrastructureThe Bank deals with third parties to secure the components essential to its business infrastructure, such as Internet connections and various communication and database ser-vices. Disruption of such services could adversely affect the Bank’s capacity to provide its products and services to its various clienteles, and ensure the continuity of its ongoing operations.
Other factorsOther factors, which are not under the Bank’s control, could affect results, as discussed in the Caution Regarding Forward-Looking Statements at the beginning of this Annual Report. It should be noted that the foregoing list of factors is not exhaustive.

58 laurentian banK 2010 Annual Report
management’s discussion and analysis
disclosure controls and Procedures and internal control oVer Financial rePorting
Disclosure controls and procedures (DC&P) are designed to provide reasonable assurance that all relevant information has been collected and submitted to the Bank’s senior management which ensures adequate disclosure of such information. Internal control over financial reporting (ICFR) is a process designed to provide reasonable assurance regarding the reliability of financial reporting and the preparation of financial statements in accor-dance with the Canadian gAAP.
The President and Chief Executive Officer, and the Executive vice-President and Chief Financial Officer are responsible for the implementation and maintenance of DC&P and ICFR, as set out in Multilateral Instrument 52-109 regarding the Certifi-cation of Disclosure in Issuers’ Annual and Interim Filings. They are assisted in this task by the Disclosure Committee, which is comprised of members of the Bank’s senior management.
The President and Chief Executive Officer and the Executive vice-President and Chief Financial Officer caused to be evalu-ated under their supervision the effectiveness of DC&P as at October 31, 2010 and, based on that evaluation, concluded that they were effective at that date and adequately designed.
Also as at October 31, 2010, the President and Chief Executive Officer and the Executive vice-President and Chief Financial Officer caused to be evaluated under their supervision the effectiveness of ICFR and, based on that evaluation, concluded that it was effective at that date and adequately designed.
The DC&P evaluation was performed using the control framework established by the Committee of Sponsoring Organizations of the Treadway Commission (COSO). The evalu-ation of the design and effectiveness of internal control over financial reporting was performed in accordance with the COSO control framework for entity level and financial controls, and Control Objectives for Information and Related Techno-logies (COBIT) for general IT controls.
given the inherent limitations of any control systems, ma-nagement’s evaluation of controls can only provide reasonable, not absolute assurance that all control issues that may result in material misstatement, if any, have been detected.
Changes to Internal Control over Financial Reporting During the year ended October 31, 2010, no changes to internal control over financial reporting affected materially, or are rea-sonably likely to materially affect, internal control over financial reporting.
critical accounting Policies and estimates
The significant accounting policies followed by the Bank are outlined in Notes 2 and 3 to the annual consolidated financial statements. Some of these accounting policies are deemed critical as they require management to make estimates that, by their very nature, involve uncertainties. Changes in these estimates could materially affect the Bank’s consolidated financial statements. The critical accounting policies that require management’s judgment and estimates are described below.
ALLOWAnCE FOR LOAn LOSSES The allowance for loan losses reflects management’s estimate of losses related to the loan portfolios. Management regularly reviews the portfolios’ credit quality to ensure the adequacy of the allowance for loan losses. This allowance is dependent upon the evaluation of the amounts and dates of future cash flows, the fair value of guarantees and realization costs, and the interpretation of the impact of market and economic conditions.
Considering the materiality of the amounts and their inherent uncertainty, the use of estimates and assumptions that differ from those used in determining the allowance for loan losses could produce significantly different levels of allowances. Changes in circumstances may cause future assessments of credit risk to be materially different from current assessments and may consequently entail a significant increase or a decrease in the allowance for loan losses in the consolidated statement of income for a given fiscal year. A detailed description of the methods used to determine the allowance for loan losses can be found in Note 3 to the annual consolidated financial statements, and in the Credit Risk Management section on page 46 of this MD&A.
Management has developed a valuation model for the general allowance, based on the historical losses of the various portfolios. This model validates the $73.3 million allowance as at October 31, 2010. Changes in assumptions and parameters to this model could have produced different valuations.
This critical accounting estimate affects all business segments.

management’s discussion and analysis
laurentian banK 2010 Annual Report 59
FAIR vALuE OF FInAnCIAL InSTRuMEnTSThe Bank reports most of its financial instruments, including derivative financial instruments, at fair value. Fair value is defined as the amount of consideration that would be agreed upon in an arm’s length transaction between knowledgeable, willing parties who are under no compulsion to act. Changes in the fair value of the Bank’s trading book’s securities and obligations related to assets sold short, as well as derivatives not designated in hedge relationships, are generally recognized under other income.
Management uses quoted market prices in active markets, when available, as the best evidence of fair value of its financial instruments as it requires minimal subjectivity. Quoted prices include those obtained from an exchange, a broker, dealer, industry group or from pricing services. If quoted market prices are not available, the Bank typically uses pricing models based on the discounted value of future cash flows. These models may include observable or unobservable market parameters.
Management’s judgment is required when observable market prices do not exist or when only prices from inactive markets are available. Judgment may also be required to develop valua-tion techniques and determine parameters that are not readily observable on the market. Additional information on fair value is presented in Note 20 to the annual consolidated financial statements.
Available-for-sale financial assets are assessed for impair-ment periodically, and management must examine various factors to determine whether a decline in fair value is other than temporary. These factors include the type of investment as well as the length of time and extent by which fair value is below amortized cost. In addition, management considers other factors such as bankruptcy, capital restructuring or dilution, significant modifications in the issuer’s operations or other uncertainties. Management must also assert its intent and ability to hold the securities until recovery.
The use of other alternative assumptions could translate into significantly different income recognition.
These critical accounting estimates mainly affect the Laurentian Bank Securities & Capital Markets and Other segments. Addi-tional information on the calculation of fair value is provided in Note 20 to the annual consolidated financial statements.
SECuRITIZATIOnSecuritization is a process whereby financial assets, essentially mortgage loans for the Bank, are converted into securities and sold to investors. When the Bank surrenders control over the receivables sold and receives a consideration other than a beneficial interest in the transferred assets, the transaction is accounted for as a sale.
The determination of the initial gain, in such circumstances, depends on the fair value attributed to certain retained inter-ests, mainly rights to future excess interest spreads and cash reserve accounts, as well as to seller swaps. Since quoted market prices generally do not exist for these financial instru-ments, management estimates their fair value based on the present value of expected future cash flows. Management must therefore use best estimates with respect to key assumptions, particularly for expected credit losses, anticipated prepayment rates, risk-adjusted discount rates and other factors that influ-ence the value of these instruments. Moreover, these fair values must be reviewed periodically thereafter.
The fair value of retained interests for securitized mortgage loans was $97.1 million as at October 31, 2010. Note 6 to the annual consolidated financial statements presents a sensitivity analysis of the current fair value of these retained interests to immediate 10% and 20% adverse changes in key assumptions. The fair value of seller swaps was –$81.9 million as at October 31, 2010. Different assumptions with regard to anti-cipated prepayment rates and risk-adjusted discount rates could translate into significantly different fair values for these instruments.
This critical accounting estimate mainly affects the Other segment.
The Off-Balance Sheet Arrangements section on page 39 of this MD&A provides further information on these transactions.
EMPLOyEE FuTuRE BEnEFITSvaluation of employee future benefits for defined benefit plans and other post-employment benefits is based on a number of assumptions such as discount rates, expected returns on plan assets, future salary levels, health-care cost escalation, em-ployee turnover rate and retirement age of employees. These assumptions are reviewed annually in accordance with accepted actuarial practice and approved by management.
The discount rate used in determining the actual costs and obligations related to pension plans and other future benefits reflects the market yields, as at the measurement date, on high-quality debt instruments with cash flows matching ex-pected benefit payments. The expected rate of return on the plans’ assets corresponds to the expected returns on various asset categories, weighted by the portfolio’s allocation during the fiscal year. Anticipated future long-term performance of individual asset categories is taken into account, according to the expected future inflation rate and the effective yields on fixed income securities and equities. Other assumptions are based on the plans’ actual results and management’s best estimates.
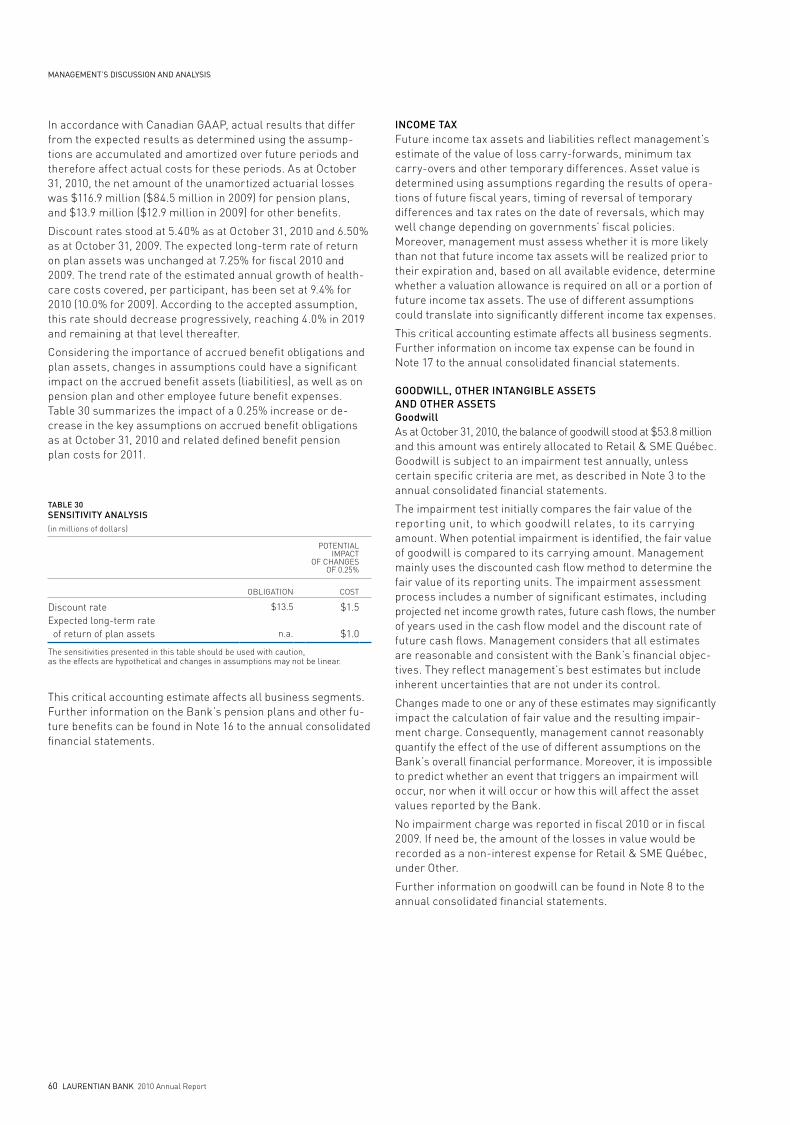
60 laurentian banK 2010 Annual Report
management’s discussion and analysis
In accordance with Canadian gAAP, actual results that differ from the expected results as determined using the assump-tions are accumulated and amortized over future periods and therefore affect actual costs for these periods. As at October 31, 2010, the net amount of the unamortized actuarial losses was $116.9 million ($84.5 million in 2009) for pension plans, and $13.9 million ($12.9 million in 2009) for other benefits.
Discount rates stood at 5.40% as at October 31, 2010 and 6.50% as at October 31, 2009. The expected long-term rate of return on plan assets was unchanged at 7.25% for fiscal 2010 and 2009. The trend rate of the estimated annual growth of health-care costs covered, per participant, has been set at 9.4% for 2010 (10.0% for 2009). According to the accepted assumption, this rate should decrease progressively, reaching 4.0% in 2019 and remaining at that level thereafter.
Considering the importance of accrued benefit obligations and plan assets, changes in assumptions could have a significant impact on the accrued benefit assets (liabilities), as well as on pension plan and other employee future benefit expenses. Table 30 summarizes the impact of a 0.25% increase or de-crease in the key assumptions on accrued benefit obligations as at October 31, 2010 and related defined benefit pension plan costs for 2011.
TABLE 30SEnSITIvITy AnALySIS(in millions of dollars)
POTENTIAL IMPACT
OF CHANgES OF 0.25%
OBLIgATION COST
Discount rateExpected long-term rate of return of plan assets
$13.5
n.a.
$1.5
$1.0
The sensitivities presented in this table should be used with caution, as the effects are hypothetical and changes in assumptions may not be linear.
This critical accounting estimate affects all business segments. Further information on the Bank’s pension plans and other fu-ture benefits can be found in Note 16 to the annual consolidated financial statements.
InCOME TAx Future income tax assets and liabilities reflect management’s estimate of the value of loss carry-forwards, minimum tax carry-overs and other temporary differences. Asset value is determined using assumptions regarding the results of opera-tions of future fiscal years, timing of reversal of temporary differences and tax rates on the date of reversals, which may well change depending on governments’ fiscal policies. Moreover, management must assess whether it is more likely than not that future income tax assets will be realized prior to their expiration and, based on all available evidence, determine whether a valuation allowance is required on all or a portion of future income tax assets. The use of different assumptions could translate into significantly different income tax expenses.
This critical accounting estimate affects all business segments. Further information on income tax expense can be found in Note 17 to the annual consolidated financial statements.
GOODWILL, OTHER InTAnGIBLE ASSETS AnD OTHER ASSETS Goodwill As at October 31, 2010, the balance of goodwill stood at $53.8 million and this amount was entirely allocated to Retail & SME Québec. goodwill is subject to an impairment test annually, unless certain specific criteria are met, as described in Note 3 to the annual consolidated financial statements.
The impairment test initially compares the fair value of the reporting unit, to which goodwill relates, to its carrying amount. When potential impairment is identified, the fair value of goodwill is compared to its carrying amount. Management mainly uses the discounted cash flow method to determine the fair value of its reporting units. The impairment assessment process includes a number of significant estimates, including projected net income growth rates, future cash flows, the number of years used in the cash flow model and the discount rate of future cash flows. Management considers that all estimates are reasonable and consistent with the Bank’s financial objec-tives. They reflect management’s best estimates but include inherent uncertainties that are not under its control.
Changes made to one or any of these estimates may significantly impact the calculation of fair value and the resulting impair-ment charge. Consequently, management cannot reasonably quantify the effect of the use of different assumptions on the Bank’s overall financial performance. Moreover, it is impossible to predict whether an event that triggers an impairment will occur, nor when it will occur or how this will affect the asset values reported by the Bank.
No impairment charge was reported in fiscal 2010 or in fiscal 2009. If need be, the amount of the losses in value would be recorded as a non-interest expense for Retail & SME Québec, under Other.
Further information on goodwill can be found in Note 8 to the annual consolidated financial statements.

management’s discussion and analysis
laurentian banK 2010 Annual Report 61
Other intangible assets and other assets Other intangible assets with finite lives are also tested for impairment when events or changes in circumstances indicate that the carrying value may not be fully recoverable. As it con-ducts this test, management evaluates the future cash flows it expects to realize from these assets, along with their possible disposition. An impairment loss is recognized if the sum of the expected future undiscounted cash flows is less than the car-rying amount of the asset. No significant impairment charge was reported in fiscal 2010 or in fiscal 2009.
Management also periodically reviews the value of the Bank’s other assets, such as fixed assets and other deferred charges, in order to identify potential losses in value and to validate the related amortization periods. Changes in estimates and assumptions could significantly impact results.
Future cHanges to accounting Policies
BuSInESS COMBInATIOn On January 5, 2009, three new sections of the CICA Handbook were issued: Section 1582, Business Combinations, Section 1601, Consolidated Financial Statements, and Section 1602, Non-controlling Interests. These new standards are applicable to the Bank effective November 1, 2011. Earlier application is permitted provided Section 1582 is applied at the same time. However, to date, the Bank has not opted to early adopt these new sections.
The new sections retain the fundamental requirements in Section 1581 that require the acquisition method of accounting for all business combinations and for an acquirer to be identified for every business combination. They also retain the guidance in Section 1581 for identifying and recognizing intangible assets separately from goodwill. Additionally, the new sections mainly: i) require the acquirer to account for acquisition-related costs incurred in connection with the business combination sepa-rately from the business combination (generally as expenses); ii) require the acquirer to measure and recognize the fair value of the assets acquired and liabilities assumed as part of the business combination, with limited exceptions; iii) modify the accounting related to future income tax benefits that are recog-nizable as a result of that business combination; and iv) modify the accounting and presentation of non-controlling interests subsequent to a business combination.
InTERnATIOnAL FInAnCIAL REPORTInG STAnDARDS In February 2008, the Accounting Standards Board confirmed the convergence of financial reporting standards for Canadian public companies with International Financial Reporting Standards (IFRS). As a result, the Bank will adopt IFRS commencing on November 1, 2011 and will publish its first consolidated financial statements, prepared in accordance with IFRS, for the quarter ending January 31, 2012. Comparative financial information for fiscal 2011 will be provided at that time, prepared in accordance with IFRS, including an opening balance sheet as at November 1, 2010.
The Bank has prepared a conversion plan and assembled a project team, including both internal and external resources, to coordinate and execute the conversion to IFRS. The Bank considers having the appropriate resources to finalize the IFRS conversion plan on schedule. The key elements of the IFRS transition plan include developing a project governance frame-work, updating accounting policies, preparing financial statements, building financial reporting expertise, identifying impact on business processes and information technology; implementing internal control over financial reporting (ICFR), and implementing appropriate disclosure controls and proce-dures (DC&P), including investor relations and communication plans.
The conversion plan consists of the following phases:– Preliminary assessment – This phase served to heighten
management’s awareness of the key conversion issues and establish a timeline mapping out the Bank’s priorities with regard to analyses and significant issues.
– Financial standards analysis – This phase consists of a detailed assessment of the quantitative, qualitative and technological impact of IFRS implementation.
– Selection of key accounting policies – The initial adoption of IFRS will require the Bank to make certain elections.
– Implementation – This phase consists of implementing the necessary information systems to comply with the new IFRS requirements.
62 laurentian banK 2010 Annual Report
management’s discussion and analysis
The Bank completed its preliminary assessment of the IFRS impact during the planning stage of the project in early 2009. Work on the financial standards analysis is nearly completed as at the end of the fourth quarter of 2010, subject to changes to IFRS by the International Accounting Standards Board (IASB). key differences between IFRS and Canadian gAAP have been summarized below. The impact of certain key differences is still being evaluated. The selection of key accounting policies is currently being assessed concurrently with standards analysis. The Bank is now progressing to the implementation of the nec-essary changes to processes and systems. The implementation phase is expected to be completed by the end of fiscal 2011. The Bank has therefore not finalized the estimation and analysis of the expected financial impact of its IFRS conversion as at the end of the year 2010.
Governance of the IFRS conversion planThe Bank has put in place a Steering Committee that is respon-sible for ensuring the conversion plan is adequately followed. The Bank’s Board of Directors, mainly through its Audit Committee, is also involved in the IFRS conversion plan. They receive quarterly updates of the timeline for implementation, the implications of IFRS standards on the business and an overview of the impact on the financial statements. The Audit Committee will continue to receive quarterly project status updates to ensure proper oversight of the conversion project. Another important component of the IFRS conversion plan con-sists of training key finance and operational staff. This ongoing process was initiated in 2008. As the Bank progresses in its conversion plan in 2011, it will also, together with other members of the banking community, communicate IFRS implications to the various interested stakeholders.
Progress to dateThe following project statuses have been presented to the Audit Committee in 2010:
First quarter– A preliminary IFRS analysis, which consisted of an assessment
of the quantitative, qualitative and technological impact of IFRS implementation;
– A list of potential transition date and ongoing accounting policy choices;
– A list of technological changes which have been identified with respect to certain items, namely hedging, securitization, im-paired loans, share-based compensation and customer loyalty programs. The necessary adjustments to the information system supporting these items are expected to be completed before the end of 2010.
Second quarter– An assessment of the main IFRS disclosure impacts based
on the October 31, 2009 year end financial statements. This exercise was aimed at identifying the areas where additional disclosure is required.
– A communication plan highlighting the impact for all known stakeholders.
Third quarter – A summary of the main findings from a pro forma conversion
of the 2009 year-end financial statements to IFRS. This exercise allowed the Bank to better assess the workload and potential impact of first-time adoption and future accounting policy choices under IFRS, as well as to evaluate the potential impact on capital and other financial ratios.
– An update of certain IFRS analyses pursuant to new develop-ments published by the IASB. The Bank will continue to monitor future developments.
– An IT strategy defined to appropriately manage the dual- accounting period in fiscal 2011.
Fourth quarter – A summary of the potential impact of IFRS on the Bank’s financial
forecasts for the next three years.– A pro forma conversion of the third quarter financial statements
under IFRS. Similar to the work done for the 2009 year-end financial statements, this exercise allowed the Bank to assess the workload and prepare the supporting documents for the up-coming reporting in the dual-accounting period in fiscal 2011.
– updated status regarding IFRS conversion plan, specifically related to securitization, loan provisioning, hedge accounting and employee benefits.
Analysis of key differencesIFRS were developed using a conceptual framework similar to Canadian gAAP, although significant differences exist in certain areas including recognition, measurement and disclosures. The following key differences between the Bank’s current accounting practices and the corresponding accounting treat-ment under IFRS have been identified:
a) Loan provisioningIn line with current Canadian gAAP, the Bank’s provisioning for impaired loans is designed to take into account incurred losses in the Bank’s loan portfolio. This principle will not change as IFRS also currently require that provisioning be based on incurred losses. However, under IFRS, loan losses and allow-ances will be presented based on whether they are assessed individually or collectively for groups of similar loans. The methodologies to calculate these provisions are still being de-veloped. As a result, there may be changes in the amount of the Bank’s collective provisioning, mainly for loans which are not classified as impaired.
Specific provisions for loan losses must be based on the dis-counted values of estimated future cash flows. This amount is accreted over the period from the initial recognition of the provision to the eventual recovery of the present value of the loan, resulting in the recording of interest in the statement of income, within interest income. under Canadian gAAP, the accretion amount is generally presented as a reduction of the provision for credit losses.

management’s discussion and analysis
laurentian banK 2010 Annual Report 63
b) SecuritizationThe combined effect of financial asset derecognition rules and the consolidation of special purpose entity rules will impact securitization arrangements involving the Bank’s off balance sheet loans. The rules provide more stringent criteria for the derecognition of financial assets. Based on the financial stan-dards analysis, the criteria would not be met. This should lead to a gross-up of the Bank’s balance sheet of approximately $2.7 billion at transition. In addition, prior net unrealized gains related to these transactions would be eliminated and the corresponding net interest income recorded in future period earnings. In July, the IFRS Interpretations Committee issued an Exposure Draft which would modify guidance applicable on transition (IFRS 1) with regard to the derecognition exemption. The revised IFRS 1 would provide the option to grandfather cer-tain securitization transactions up to October 31, 2010, instead of January 1, 2004. The Bank will closely monitor this proposed change and reassess its choices accordingly.
c) Employee benefitsAt transition, IFRS generally provide for a retrospective adoption of the Employee Benefits standard (IAS 19). To date, the Bank has not determined its potential impact given the significant challenge posed by the complexity of pension benefit plans and the fact that the Bank has been offering pension plans for more than 30 years. However, IFRS provide the option of not retro-spectively applying IAS 19. If this election is made, gains and losses accumulated to the date of transition amounting to $130.7 million would be charged to retained earnings. This may have a significant effect on shareholders’ equity. Actuarial gains or losses post transition to IFRS could be recognized in income immediately, amortized to income using a “Corridor Method” similar to Canadian gAAP, or directly in equity (the “SORIE Method”). The Bank is currently assessing its options and will make its election in 2011, mainly based on regulatory capital requirements.
d) Share-based paymentsIFRS introduce a new requirement for the Bank to recognize as an expense the fair value of stock appreciation rights. under Canadian gAAP, these rights are presently accounted for using the intrinsic value method. This should lead to an adjustment of the Bank’s financial liabilities and shareholders’ equity. With respect to stock option awards granted prior to November 1, 2002, the Bank is not required to apply IFRS 2 – Share-based Payment retrospectively, therefore, the Bank will continue to apply the previous Canadian gAAP under which no compensation cost is recognized for these options. In the second quarter of 2010, a new software application was implemented that will allow the Bank to automate the calculations and ensure appropriate internal controls.
e) Business combinationsIFRS 3 and Section 1582 of the CICA Handbook have been harmonized since January 2009. Henceforth, there will be no accounting differences beyond the IFRS transition date. However, at the transition date, the Bank has to make an elec-tion to either apply IFRS 3 retrospectively to all past business acquisitions before a chosen date or apply it prospectively from the transition date. The Bank is currently analyzing the impact of the two options and will make an election in the coming months.
f) Earnings per shareIAS 33 is similar to Section 3500 of the CICA Handbook in many regards. However, based on its financial standards analysis, the Bank concluded that, in their current form, its perpetual preferred shares would have been included in the calculation of the diluted earnings per share as they may have been con-verted into common shares; even though the conversion option was up to the Bank. As a result, in order to increase consistency in the Bank’s diluted earnings per share calculation under current gAAP and IFRS and avoid irrelevant dilution, the Bank waived its conversion right on November 17, 2010.
The differences identified in the above discussion on IFRS tran-sition should not be regarded as an exhaustive list and other changes may result from the transition to IFRS. Furthermore, the disclosed impacts of the transition to IFRS reflect the most recent assumptions, estimates and expectations, including the assessment of IFRS expected to be applicable at the time of transition. As a result of changes in circumstances, such as economic conditions or operations, and the inherent uncertainty from the use of assumptions, the actual impacts of the transi-tion to IFRS may be different from those presented above.

64 laurentian banK 2010 Annual Report
management’s discussion and analysis
Throughout the current year and the period leading up to the transition to IFRS in 2012, the Bank will continue to monitor the above-mentioned accounting policies and finalize its assess-ment of policy decisions available under IFRS in order to prepare the Bank for an orderly transition to IFRS. The evolving nature of IFRS will also likely result in additional accounting changes, some of which may be significant, in the years following the initial conversion. The Bank will continue to actively monitor all of the IASB’s projects that are relevant to the Bank’s financial reporting and accounting policies and adjust its IFRS conversion project accordingly.
Furthermore, the Bank is specifically addressing internal controls, lending practices and capital issues, as summarized below, as well as all other matters to ensure an orderly transition.
Internal control over financial reporting (ICFR)As the review of accounting policies is completed, appropriate changes to ensure the integrity of internal control over financial reporting and disclosure controls and procedures will be made. Based on existing IFRS, the Bank has not identified the need for any significant modifications to its financial information technology architecture or to existing internal control over financial reporting and disclosure controls. ICFR will be appro-priately addressed as processes and system assessments are finalized in the upcoming periods.
Lending practicesThe transition to IFRS will not only impact the Bank’s financial statements, but also some of its clients’ financial statements. This will have repercussions on the various loan covenants monitored by underwriting groups and the credit department. The Bank has met with commercial account managers as well as credit analysts, to foster a better internal understanding of IFRS to properly analyze the clients’ IFRS financial statements and the impacts on ratios and covenants.
Capital implicationsThe Bank is closely monitoring the potential impact of IFRS conversion on capital requirements. Securitization and employee benefits are the two main areas which could have a significant impact on capital.
The Office of the Superintendent of Financial Institutions (OSFI) has issued an IFRS advisory that permits a five-quarter phase-in of the adjustment to retained earnings arising from the first time adoption of certain IFRS changes for purposes of calculating certain ratios. Transitional relief for the impact to the asset to capital multiple will also be provided in the form of exclusion of the effect of any on-balance sheet recognition of mortgage loans sold through CMHC programs up to March 31, 2010, that under current practice are not reported on the Bank’s balance sheet.
The potential implications of the proposed capital and liquidity requirements issued by the Basel Committee on Banking Supervision in December 2009 and further detailed in July and September 2010 are also being considered closely as part of the IFRS transition plan.
Other considerationsThe Bank is also assessing the impact of the IFRS conversion on its performance measurement processes, including planning and budgeting.
BASIS OF PRESEnTATIOnThis Management’s Discussion and Analysis (MD&A) refers to the results of operations and financial condition of the Bank for the year ended October 31, 2010 and presents the views of the Bank’s management as at December 8, 2010. The information is presented on the same basis as in the annual consolidated financial statements and has been prepared in accordance with Canadian generally accepted accounting principles (“gAAP”) and the accounting requirements of the Office of the Superintendent of Financial Institutions Canada.
Additional information on Laurentian Bank of Canada, including the Annual Information Form for the year ended October 31, 2010, can be found on the Bank’s website at www.laurentianbank.ca and on SEDAR at www.sedar.com.
METHODOLOGy FOR THE AnALySIS OF RESuLTSDiscontinued operationsManagement generally evaluates the Bank’s performance as reported in the consolidated financial statements. The financial statements present results from continuing operations and results from discontinued operations arising from the disposal of the wealth management operations associated with the BLC-Edmond de Rothschild Asset Management Inc. joint venture in 2005.
non-GAAP Financial Measures The Bank uses both gAAP and certain non-gAAP measures to assess performance, such as return on common shareholders’ equity, tangible common equity ratio, net interest margin and efficiency ratios. With regard to the calculation of the return on common shareholders’ equity, the Bank considers that net income is the best measure of profitability and that common shareholders’ equity, excluding accumulated other comprehensive income, should be used as a measure of capital. The calculation of the Bank’s book value per share is also based on common shareholders’ equity, excluding accumulated other comprehensive income. Tangible common equity is defined as common shareholders’ equity, excluding accumulated other comprehensive income, less goodwill and contractual and customer relationship intangible assets. The tangible common equity ratio is defined as the tangible common equity divided by the risk-weighted assets.
Non-gAAP measures do not have any standardized meaning prescribed by gAAP and are unlikely to be comparable to any similar measures presented by other companies. The Bank believes that these non-gAAP financial measures provide investors and analysts with useful information so that they can better understand financial results and analyze the Bank’s growth and profit potential more effectively.
Certain comparative figures for fiscal 2009 have been reclassified to conform to the current year presentation.