Comparing Utility Interconnection Timelines for Small-‐Scale Solar PV

energy.gov/sunshot
Enabling 100s GW of Solar
SunShot Systems Integration R&D Program Overview
Guohui Yuan, PhD
1/28/2016

• SunShot Vision and Goals
• Challenges and opportunities
• Recent progress in SunShot funded R&D
• Solar forecasting
• PV Hosting capacity
• Smart inverters
• Interconnection codes and standards
• Future work
Outlines

Growth of Solar in the U.S.
3
Installed solar generation capacity rapid
increasing
(>20 GW cumulative by end of 2014)
Installed cost of solar system rapidly
decreasing
(< $2/W for utility–scale system)
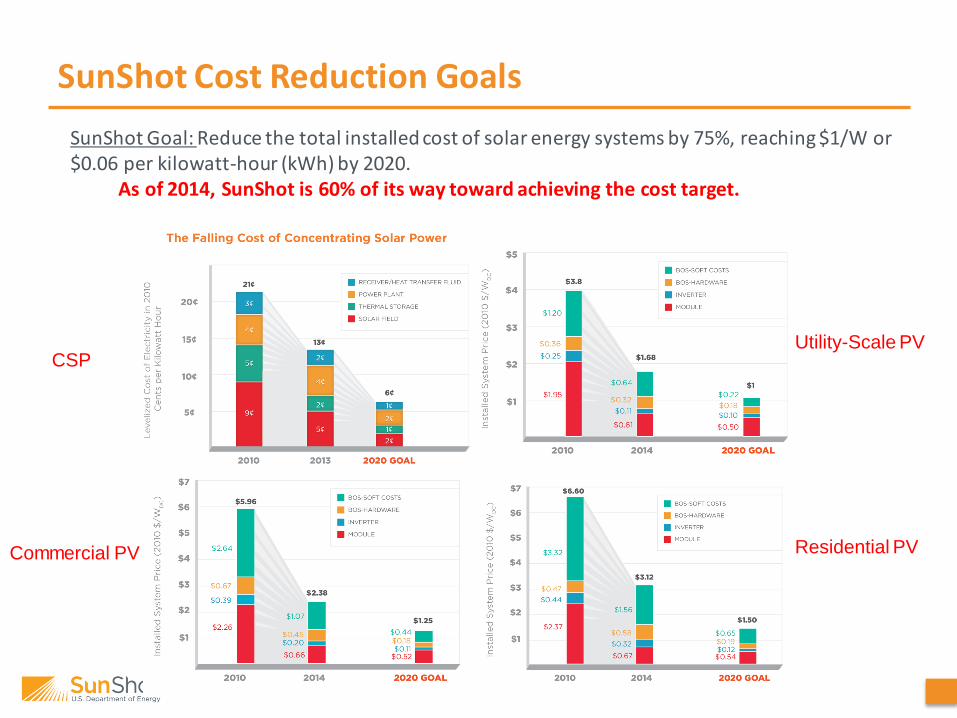
SunShot Cost Reduction Goals
Utility-Scale PV
Commercial PV Residential PV
SunShot Goal: Reduce the total installed cost of solar energy systems by 75%, reaching $1/W or $0.06 per kilowatt-hour (kWh) by 2020.
As of 2014, SunShot is 60% of its way toward achieving the cost target.
CSP

Solar can meet 14% (300GW) by 2030 and 27% (600 GW) by 2050 of U.S. electricity demand
SunShot Vision on Deployment
DOE SunShot Vision Study (2012)

• Germany:
• 38 GW as of 2014, about 20% by generation capacity, 7% by energy
• On June 9th, solar peaked at 24 GW, supplying 50 percent of instantaneous demand.
• Grid Code mandating the use of smart inverters.
• California:
• 33% by 2020 and 50% by 2030 preferred renewable resources
• In 2015, Instantaneous solar generation > 6GW, about 10% by capacity, >5% by energy.
• CPUC is mandating smart inverters through Rule 21 revision.
• Hawaii:
• 100% renewable energy by 2045
• In 2015, 400 MW installed capacity, 48,000 distributed rooftop solar, 6% by energy
• In some areas >100% day time minimum loads.
• Through the inverter testing work at NREL, HECO decided to raise allowable solar penetration threshold from 120 to 250 percent of DML
• Texas:
• Austin Energy received bids of 4c/KWh for 1.2GW of utility-scale solar, which is below all-in cost of natural gas plants. It projects the cost of solar energy can be as low as $20/MWh at 2020. (GTM)
The Hot Spots!

Increasing Ramp Rate due to High Penetration of Solar
CAISO “Duck Curve”
HECO “Nessie Curve”

Frequency Response Concerns
Source: Robert Cummings, NREC 8
• Frequency response is decreasing (EI requirement is -1002 MW/0.1 Hz)
• System inertia is decreasing due to inverter-based generation (wind, solar)
• Also, load response to frequency is changing

Distribution Voltage Issues
• Reverse power flow
• Solar variability and intermittency
• Voltage fluctuation
9
Without PV With PV

•Variable and uncertain resources
•Cycling and ramping of conventional generation (Flexibility requirements)
•Generation curtailment
Dispachability
•Impact on operating reserves
•Impact on resource expansion planning
•Transmission utilization patterns
Grid Reliability
•Large-scale system stability
•Frequency response and AGC
•Small signal stability and decreasing system inertia
Grid Stability
•Steady-state and transient stability models•Short-circuit and dynamic simulation models•Interconnection and grid performance
standards (NERC, IEEE 1547)
Modeling, Codes and Standards
• Rigorous production cost modeling
• Ancillary services market
• RTO/ISO and BA processes
Market Operation
• Overvoltage
• Voltage deviations
• UnbalanceVoltage
• Increased fault current contribution
• Sympathetic tripping + fuse saving
• Two-way power flowProtection
•Safety and anti-islanding scheme•Transient overvoltage•Out of phase reclosing and decrease reliability
Unintentional Islanding
•Quasi Static Time Series Analysis **•Hosting Capacity, Feeder Classification•Feeder monitoring devices, Interoperability
Distribution Modeling Tools
•Traditional Voltage Regulation Equipment•Smart Inverters•Holistic control across the feeder
Visibility and Control
•Interconnection Standards (IEEE 1547)•Impact studies•Utility Planning and Operation tools
Interconnect-ion Process
DistributionTransmission
Summary of Technical and Market Challenges

SunShot Systems Integration Vision
To proactively anticipate and address potential challenges under a scenario in which hundreds (100s) of gigawatts of solar energy are interconnected to the electricity grid, the SI sub-program has identified the challenges to be addressed in four broad, inter-related areas:

Four Focused Areas
12
Grid Performance and Reliability: Maintain and
enhance the efficiency and reliability of electric transmission and distribution systems in a cost-effective, safe manner with hundreds of gigawatts of solar generation deployed onto the nation’s power system.
Dispatchability: Ensure that solar power is available on-
demand, when and where it is needed and at the desired amounts, in a manner that is comparable to or better than conventional power plants.
Power Electronics: Develop intelligent devices that
maximize the power output from solar power plants and interface with the electric grid (or end use circuits), while ensuring overall system performance, safety, reliability, and controllability at minimum cost.
Communications: Create infrastructure that is used to
inform, monitor and control generation, transmission, distribution and consumption of solar energy effectively under broad temporal and spatial scales.
SHINES (2015)
SEGIS-AC (2011)

• Two-way Power Flow
• Dynamic Characteristics of Solar Generation
• Coupled Transmission Grid and Distribution System
• Integration of Sensors, Communications and Data Science Technologies into Power Systems
13
Major Challenges Under High Penetration Scenarios
Grid Performance and Reliability Communications
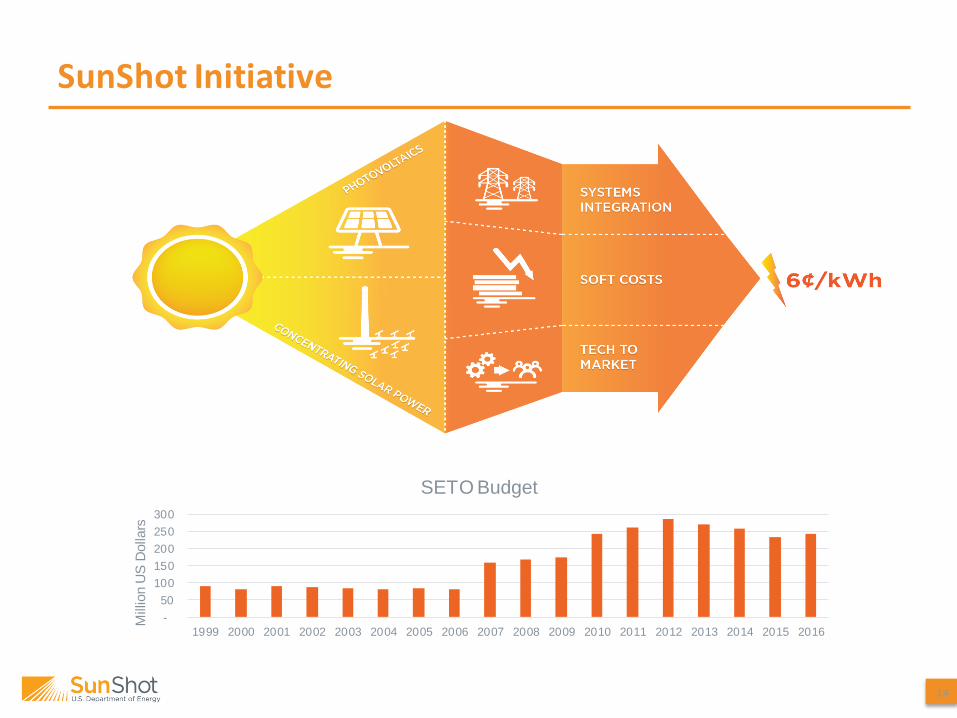
SunShot Initiative
14
-
50
100
150
200
250
300
1999 2000 2001 2002 2003 2004 2005 2006 2007 2008 2009 2010 2011 2012 2013 2014 2015 2016
Mill
ion U
S D
olla
rs
SETO Budget

SunShot Systems Integration
SuNLaMP (2015)
SHINES (2015)
SUNRISE (2013)
National Lab R&D (2012)
Hi-Pen (2012)
Plug and Play (2012)
Solar Forecasting (2012)
SEGIS-AC (2011)

Solar Forecasting
16
Data Inputs
Physics Modeling
Irradiance Prediction
Power Prediction
Utility Operation
Forecasting Type Forecasting Horizon Existing Methods Input Data / Sensors
Long-term 24-48 hours (DayAhead)
NWP models Satellite, ground and sensors
Mid-term 6-12 hours Numerical Weather Prediction (NWP)
Satellite, ground and sensors
Short-term 1-6 hours (Hour Ahead) Satellite images Satellite
Real-time 1-60 minutes Persistence algorithms Total sky imager, radiometers
17
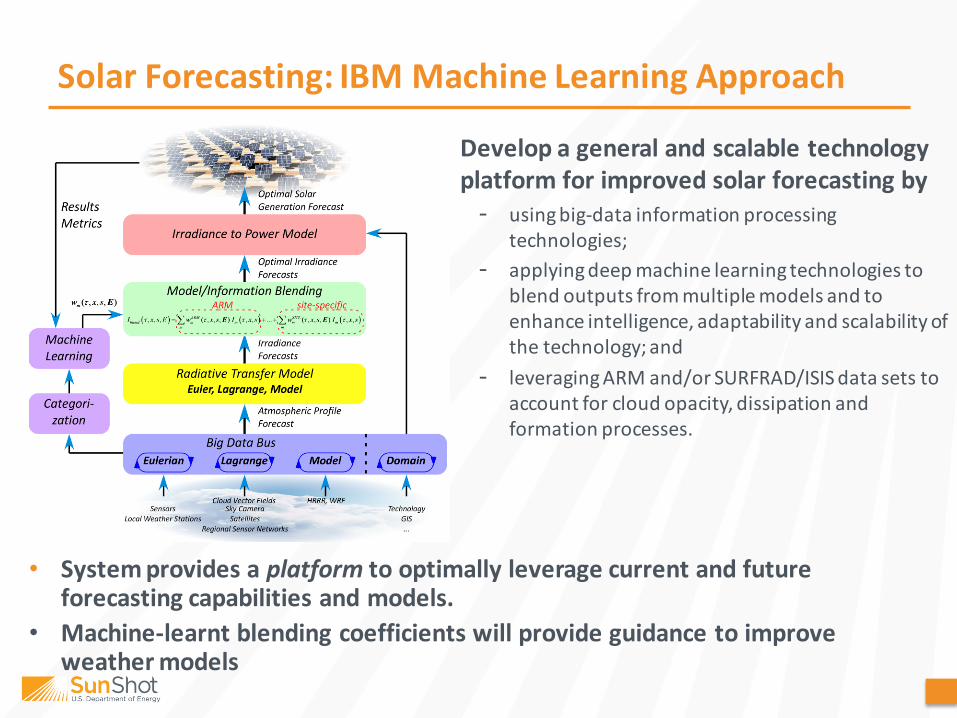
Solar Forecasting: IBM Machine Learning Approach
Develop a general and scalable technology platform for improved solar forecasting by- using big-data information processing
technologies;
- applying deep machine learning technologies to blend outputs from multiple models and to enhance intelligence, adaptability and scalability of the technology; and
- leveraging ARM and/or SURFRAD/ISIS data sets to account for cloud opacity, dissipation and formation processes.
• System provides a platform to optimally leverage current and future forecasting capabilities and models.
• Machine-learnt blending coefficients will provide guidance to improve weather models
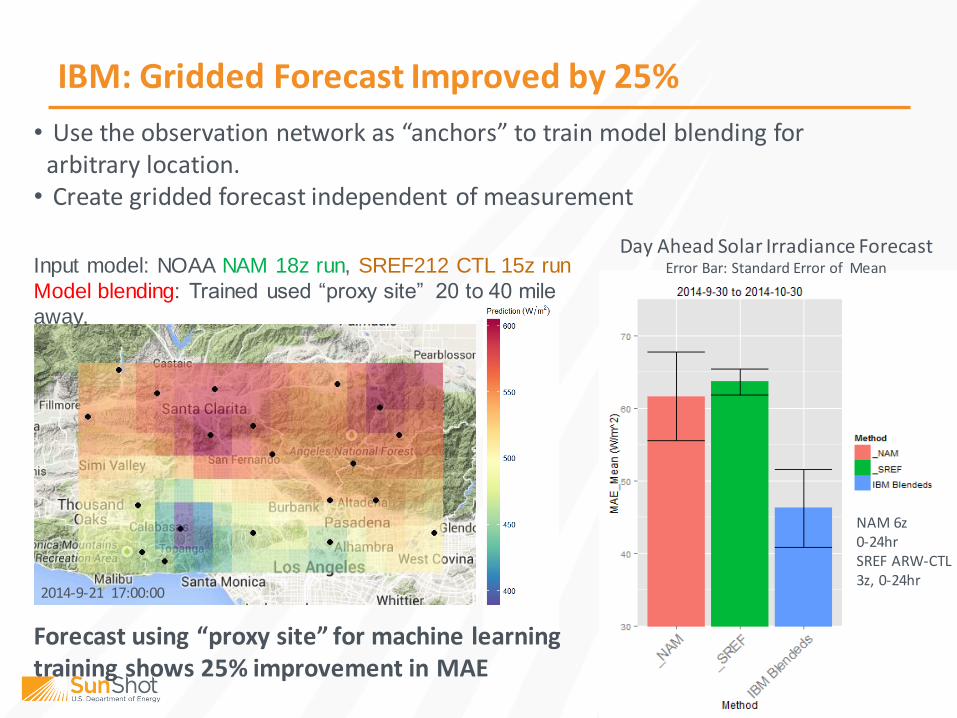
IBM: Gridded Forecast Improved by 25%
• Use the observation network as “anchors” to train model blending for arbitrary location.
• Create gridded forecast independent of measurement
2014-9-21 17:00:00
Day Ahead Solar Irradiance ForecastError Bar: Standard Error of MeanInput model: NOAA NAM 18z run, SREF212 CTL 15z run
Model blending: Trained used “proxy site” 20 to 40 mile
away.
Forecast using “proxy site” for machine learning training shows 25% improvement in MAE
NAM 6z 0-24hrSREF ARW-CTL3z, 0-24hr

PV Hosting Capacity in Distribution Systems(NREL, Sandia, CPUC, EPRI)
5000 cases shown
Each point = highest primary voltage
ANSI voltage limit
Ma
xim
um
Fe
ed
er V
olta
ge
s (p
u)
Increasing penetration (kW)
Minimum Hosting Capacity
Maximum Hosting Capacity
No observable violations regardless of
size/location
Possible violations based upon size/location
Observable violations occur regardless of
size/locationTotal PV:
540 kW
Total PV:
1173 kW
Voltage violation
Source: Jeff Smith, EPRI
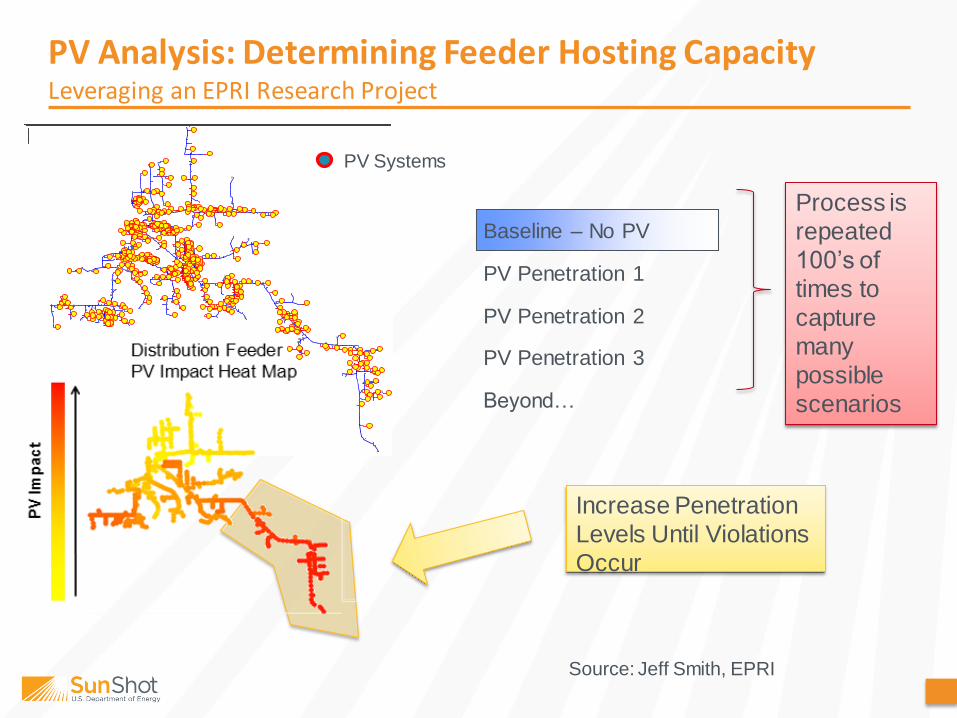
PV Analysis: Determining Feeder Hosting CapacityLeveraging an EPRI Research Project
Baseline – No PV
PV Penetration 1
PV Penetration 2
PV Penetration 3
Beyond…
Increase Penetration
Levels Until Violations
Occur
PV Systems
Process is
repeated
100’s of
times to
capture
many
possible
scenarios
Source: Jeff Smith, EPRI
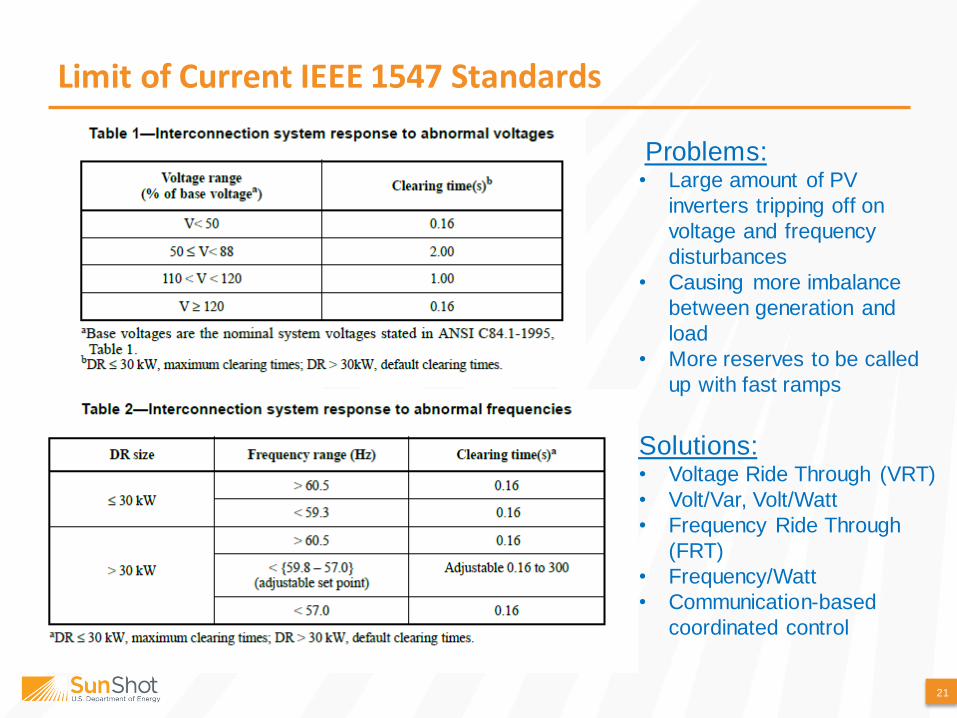
Limit of Current IEEE 1547 Standards
21
Problems:• Large amount of PV
inverters tripping off on
voltage and frequency
disturbances
• Causing more imbalance
between generation and
load
• More reserves to be called
up with fast ramps
Solutions:• Voltage Ride Through (VRT)
• Volt/Var, Volt/Watt
• Frequency Ride Through
(FRT)
• Frequency/Watt
• Communication-based
coordinated control
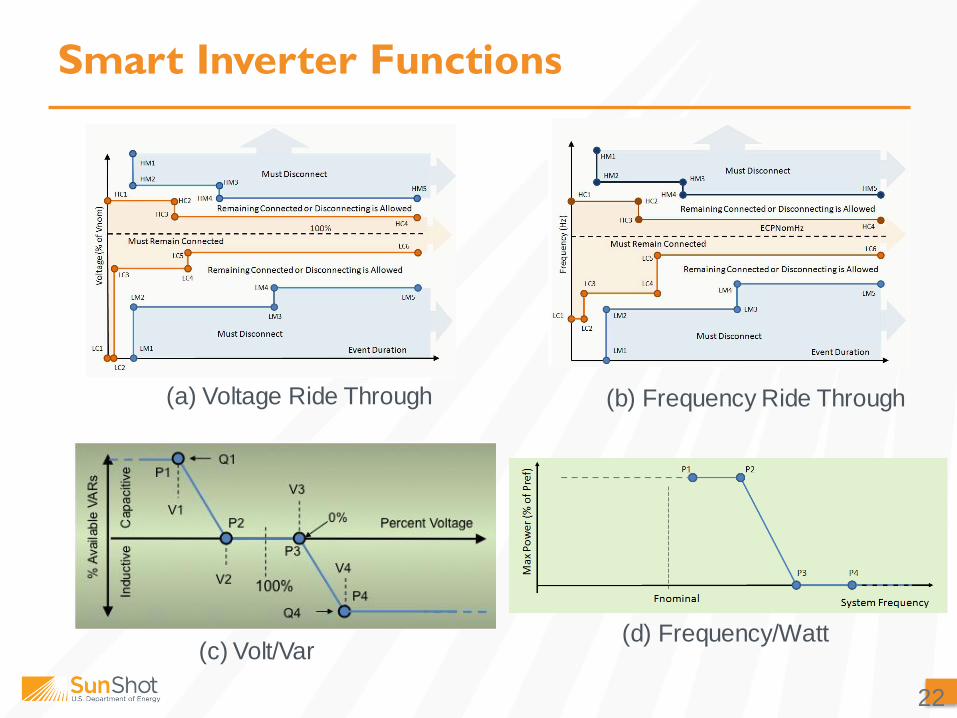
Smart Inverter Functions
22
(a) Voltage Ride Through (b) Frequency Ride Through
(c) Volt/Var(d) Frequency/Watt

Inverter Lab Testing
23
• Grid simulator
• PV simulator
• Communication
• Remote control
• Manufacturer lab testing
• Power HIL Modeling real
feeder topology
• Using real event data
NREL ESIF
EPRI Knoxville Lab

Hardware in the Loop (HIL) Test Results
24
0
10
20
30
40
50
60
70
80
90
100
-80
-60
-40
-20
0
20
40
60
80
93
%
94
%
95
%
96
%
97
%
98
%
99
%
10
0%
10
1%
10
2%
10
3%
10
4%
10
5%
10
6%
10
7%
kW
kVA
R
Voltage (% of Nominal)
kVar (max) Nebland Inverter Settings kW
40%
50%
60%
70%
80%
90%
100%
110%
120%
130%
140%
0.010 0.100 1.000 10.000V
olt
age
(%
No
min
al)
Time (s)
Event Duration DUT Trip DUT Ride-Thru HVRT Limit LVRT Limit
Volt/Var L/HVRT
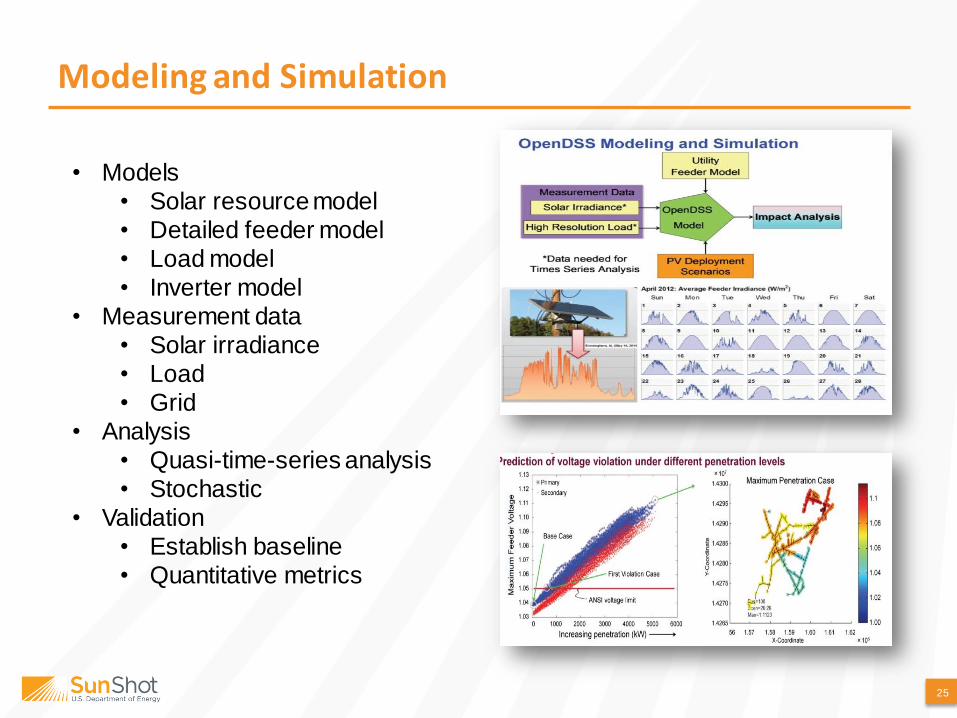
Modeling and Simulation
25
• Models
• Solar resource model
• Detailed feeder model
• Load model
• Inverter model
• Measurement data
• Solar irradiance
• Load
• Grid
• Analysis
• Quasi-time-series analysis
• Stochastic
• Validation
• Establish baseline
• Quantitative metrics
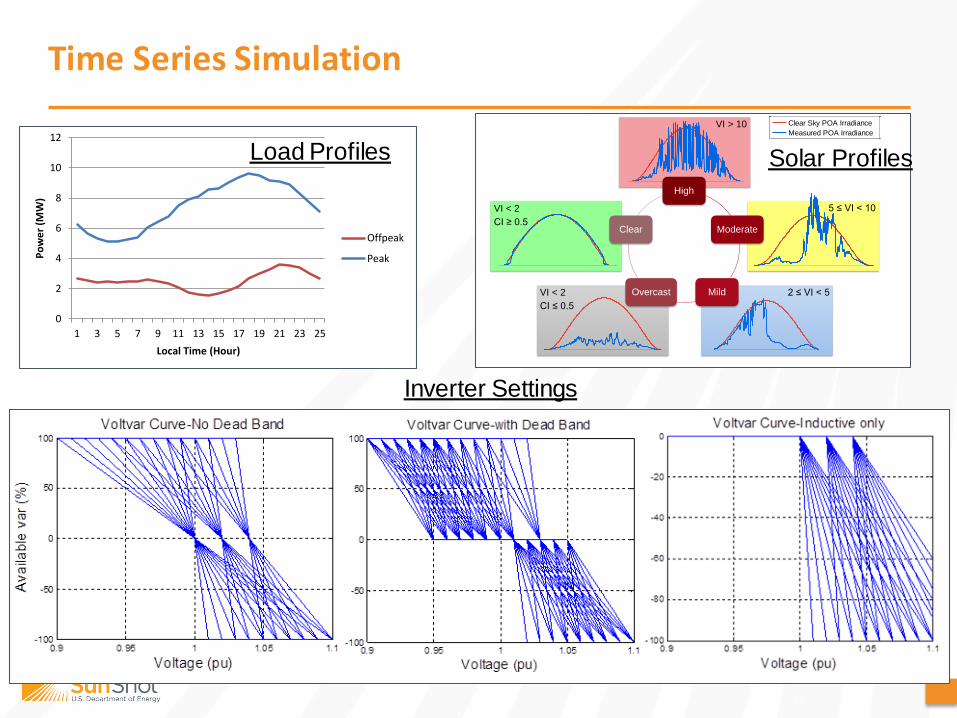
Time Series Simulation
26
Sandia’s variability index (VI) and clearness index (CI) to classify days
Clear Sky POA Irradiance
Measured POA Irradiance
Clear Sky POA Irradiance
Measured POA Irradiance
High
Moderate
MildOvercast
Clear
VI < 2
CI ≥ 0.5
VI < 2
CI ≤ 0.5
2 ≤ VI < 5
5 ≤ VI < 10
VI > 10
0
2
4
6
8
10
12
1 3 5 7 9 11 13 15 17 19 21 23 25
Po
we
r (M
W)
Local Time (Hour)
Offpeak
Peak
Load Profiles Solar Profiles
Inverter Settings

Recommended Control Settings … it depends
27
depend on performance objective depend on feeder characteristics
depend on inverter sizing depend on load & solar profile

Field Demonstration with Utility Partners
28
• Instrumentation
• Inverter upgrade
• PMC
• Communication
• DERMS software
• Remote control

Codes and Standards Landscape
Source: Tom Basso, NREL
• California Rule 21 (Phase 1, 2, & 3)
• Coordination with NERC standards

Lab Project #2: Accelerating Revisions of IEEE 1547 Series of
Interconnection Standards for DER
Source: Tom Basso, NREL
Balloted in 2014
Smart
Inverters
Microgrid
Balloted in 2014

Smart Inverter Standards
Smart Inverter Functions• Volt/Var
• Volt/Watt
• Freq-watt
• Voltage ride through
• Output control
• Remote connect/disconnect
• Adjustable power factor
EPRI Smart
Inverter Comm.
IEC 61850
Model
DNP3
SunSpec
Modbus
SEP 2
IEEE 1547.a
& 1547.1a
CA Rule 21
Other States
(NG Solar II)
Other
UtilitiesDER Management
System (DERMS)CIM
MultiSpeak

Sustainable and Holistic Integration of Energy Storage and Solar PV (SHINES)
FORECASTING
ENERGY STORAGE
LOAD CONTROLLOAD SHIFTING
SHINES (2015)$18M + 50% cost share
• Austin Energy
• Carnegie Mellon University
• Fraunhofer CSE
• ComEd
• EPRI
• HECO
http://energy.gov/eere/sunshot/listings/sunshot-news

SunShot National Laboratory Multiyear Partnership (SuNLaMP) – DOE Grid Modernization Initiative (GMI)
SuNLaMP (FY16-FY18)$49M + cost share
• 8 National Labs
• 16 projects
• University and Industry
partners
• Part of GMI $220M
awards – cross-cutting
& program-specific
http://cms.doe.gov/doe-grid-modernization-laboratory-consortium-gmlc-awards
Impact the Future of Solar Energy
Design national R&D strategies in the following areas:
Photovoltaics
CSP
Systems Integration
Soft Costs
Tech to Market
To receive a current list of job opportunities available with the SunShot Initiative, please contact [email protected].
Join our team! Take on the SunShot grand challenge to make solar energy cost-competitive with traditional energy sources by 2020.

energy.gov/sunshot
Thank You!
& Let’s work together!
STAY UPDATED and sign
up for our e-newsletter
@energy.gov/sunshot