ENABLENCE TECHNOLOGIES INC. … enablence technologies inc. management’s discussion and analysis...
21
1 ENABLENCE TECHNOLOGIES INC. MANAGEMENT’S DISCUSSION AND ANALYSIS OF FINANCIAL CONDITION AND RESULTS OF OPERATIONS (“MD&A”) FOR THE THREE AND SIX MONTHS ENDED DECEMBER 31, 2011 DATED: FEBURARY 24, 2012
Transcript of ENABLENCE TECHNOLOGIES INC. … enablence technologies inc. management’s discussion and analysis...

1
ENABLENCE TECHNOLOGIES INC.
MANAGEMENT’S DISCUSSION AND ANALYSIS OF FINANCIAL CONDITION AND RESULTS OF OPERATIONS (“MD&A”)
FOR THE THREE AND SIX MONTHS ENDED DECEMBER 31, 2011
DATED: FEBURARY 24, 2012

2
MANAGEMENT'S DISCUSSION AND ANALYSIS OF FINANCIAL CONDITION AND RESULTS OF OPERATIONS (“MD&A”) The following is a discussion and analysis of the financial condition of Enablence Technologies Inc. (“Enablence” or the “Company”) as at December 31, 2011 compared to June 30, 2011 and results of operations for the three and six months ending December 31, 2011 compared to the three and six months ended December 31, 2010. This MD&A should be read in conjunction with our unaudited condensed consolidated interim financial statements and accompanying notes for the three and six months ended December 31, 2011 (the “financial statements”). The Company adopted International Financial Reporting Standards (“IFRS”) effective July 1, 2011 and, accordingly, the financial statements for the three and six months ended December 31, 2011 have been prepared using accounting policies which are consistent with IFRS. Comparative financial information presented herein was restated effective May 1, 2010 and are comparable to the fiscal 2012 results and financial position. In addition, the Company determined that its presentation currency should be United States dollars (“USD”) as it is the currency of the primary economic environment in which the Company operates and the Company elected to present its consolidated financial statements in USD commencing in the first quarter for fiscal 2012. All amounts in this MD&A are in USD, except where otherwise noted. Comparative information has been restated to reflect IFRS and USD results. This MD&A should be read in conjunction with the Company’s other continuous disclosure filings available on www.sedar.com. Filings prior to fiscal 2012 (i.e. June 30, 2011 and prior) were reported in Canadian dollars and then-existing Canadian Generally Accepted Accounting Principles (“GAAP”). The effective date of this MD&A is February 24, 2012. The financial statements include the assets, liabilities, revenues and expenses of Enablence and its subsidiaries. The results from Enablence’s Systems segment have been reported as discontinued operations due to the Company’s decision in April 2011 to divest the Systems business, which is discussed in more detail later in this MD&A. References made herein to “Enablence”, the “Company”, “we” and “our” mean Enablence and its subsidiaries, collectively, unless the context indicates otherwise. All amounts included in the MD&A are in thousands, except per share amounts or as indicated otherwise. All financial amounts are in USD, unless stated otherwise. FORWARD-LOOKING STATEMENTS This MD&A includes certain forward-looking statements that are based upon current expectations, which involve risks and uncertainties associated with our business and the environment in which the business operates. Any statements contained herein that are not statements of historical facts may be deemed to be forward-looking statements, including those identified by the expressions “anticipate”, “believe”, “plan”, “estimate”, “expect”, “intend” and similar expressions to the extent they relate to the Company or its management. The forward-looking statements are not historical facts, but reflect management’s current expectations regarding future results or events. These forward-looking statements are subject to a number of risks and uncertainties that could cause actual results or events to differ materially from current expectations. The Company does not undertake or accept any obligation to release publicly any updates or revisions to any forward-looking statements to reflect any change in the Company’s expectations, except as prescribed by applicable securities laws.

3
Key assumptions made in preparing the forward-looking statements contained in this MD&A include, but are not limited to, the following:
• The Company will successfully divest or shut its Systems segment with minimal impact to continuing operations and cash balances.
• The Company will be able to generate or raise sufficient cash in order to meet its financial obligations as they come due, including the $10,000 subordinated note due June 23, 2012.
• The Company will continue to successfully reduce product costs to improve the Company’s gross margin and/or avoid any margin erosion associated with competitive pricing pressure.
• The Company will develop and deliver new products on time in order to satisfy the demands of current and future customers and contribute to near term profitability.
• The average exchange rates for Canadian dollars to US dollars will be at or near CDN$1.00 = US$1.00.
• The China joint venture, referred to as “Sunblence”, will commence operations and will begin generating customer revenues towards the end of the quarter ending March 31, 2012, or towards the beginning of the quarter ending June 30, 2012 with substantial volume growth in succeeding quarters.
Factors that could cause actual results to differ materially from expected results include, but are not limited to, the following:
• The Company’s quarterly revenue is generally dependent upon conversion of opportunities in the sales pipeline during the quarter and, as a result, revenues and operating results can be difficult to predict and can fluctuate substantially. The Company’s success in realizing customer opportunities may be negatively impacted by depressed economic conditions, changes in sales cycles, and/or weaker than expected success versus competitors.
• Inability to find suitable acquirer(s) for the Company’s Systems segment, or come to acceptable terms on a divestiture of the Systems segment in a timely manner.
• Delays in product development programs for new products and new product features which lead to cost overruns and /or missed customer opportunities.
• The Company’s gross margin and operating results may be adversely affected by the level of pricing required to compete successfully and/or a failure by the Company to achieve its product cost targets.
• Weaker than expected market acceptance of new products to be introduced by the Company.
• Product issues that result in increased costs to the Company and/or lost revenue opportunities.
• Longer than expected lead times from suppliers could result in production delays and potentially delayed or lost revenues.
• Shifts in value of the US dollar relative to the Canadian dollar may cause the Company’s operating costs to fluctuate significantly.
Additional risks are discussed herein and under "Risk Factors" in the Company’s Annual Information Form available online at www.sedar.com.

4
OVERVIEW ENABLENCE’S BUSINESS Enablence designs, manufactures and sells optical components and subsystems for access, metro and long-haul markets to a global customer base. It utilizes its patented technologies including planar lightwave circuit (“PLC”) intellectual property, know-how and trade secrets in the production of an array of photonics components. The Company’s product lines address all three segments of optical networks: access, connecting homes and businesses to the network; metro, communication rings within large cities; and long-haul, linking cities, countries and continents, however is predominately focused on the Metro and Long-haul segments. The Company offers leading expertise in transmission, switching & routing, wavelengths management, and signal performance management for 1.25 giga-bit per second (“G”) to 100G networks. The Company’s expanding product line includes reconfigurable optical add/drop multiplexer (“ROADM”) components, photodiodes, arrayed waveguide grating (“AWG”) products, variable optical attenuators (“VOA”) and multiplexer and demultiplexer (“VMUX”) products which combine AWG and VOA functions in one product. The Company also provides engineering and design services and will be introducing optical splitter chips through its joint venture in China later in the current fiscal year. Enablence is one of a few companies that possesses the capability to manufacture optical wafers in the three key optical material groups, namely silica-on-silicon, polymer and indium phosphide with commercially available products using all three substrates. Enablence’s PLC optical chip technology enables the integration of sub-components (waveguides, photodetectors, lasers and transimpedance amplifiers) onto one platform. The Company’s core technology is portable to numerous markets including long-haul and metro area fiber optic networks that require filtering technology to separate and multiplex various optical signals. The chip-based integration capabilities of the Enablence platform technology makes it also suitable for an array of applications outside of telecommunications, including biomedical and aerospace applications, instrumentation, data centres and sensor systems which are experiencing growing demand due in part to infrastructure projects worldwide. In April 2011, the Company announced that it had begun an initiative to explore strategic alternatives to divest, including sale, partial sale or closure, of the Systems segment. The Systems segment manufactures and sells fiber-to-the-premises (“FTTP”) equipment and multi-service access platforms (“MSAP”) that enable voice, data, video and internet communications. The results from operations of the Systems segment have been reclassified as discontinued operations, and therefore are not included in the detailed discussion of financial results, or included in the current period or comparative financial information, except to the extent they are addressed as discontinued operations. On September 15, 2011, the Company completed the sale of the majority of its US-based Systems segment, and continues to explore options for the remaining elements, mainly the Teledata business operating from Israel. The Company does not expect any significant cash proceeds from the sale or closure of the remaining business. In the Company’s MD&A filed on December 19, 2011, the Company indicated it was targeting having a definitive agreement to complete the divestiture of the Teledata business by December 31, 2011. This target was not achieved, and as of February 24, 2012, the Company continues to work towards the divestiture of Teledata. While the Company has continued negotiations with several parties surrounding the sale of Teledata, it has been unable to complete a sale of Teledata under terms that are

5
acceptable to the various stakeholders. Management continues to work with potential buyers on the ultimate sale, and expects to finalize its divestiture prior to the fiscal year end, June 30, 2012. In the event an acceptable transaction is not available, the Company will divest Teledata through a structured liquidation. HIGHLIGHTS AND SUMMARY The following summarizes the key highlights during the second fiscal quarter ending December 31, 2011:
Reported revenues of $3.6 million, resulting in a loss from continuing operations of $(2.6) million and Adjusted EBITDA (a non-GAAP measure defined below) loss of $(2.1) million. Revenues were down 59% from the previous year due to a general market slowdown, and Adjusted EBITDA was $1.8 million worse than the previous year, due to the decline in revenue;
Completed the construction of the cleanrooms in its Chinese joint venture, Sunblence, including the installation of all major equipment required to produce splitter chips;
Successfully completed a contract with a Tier 1 global telecommunications systems manufacturer to develop Enablence's planar lightwave circuit (“PLC”) based components for 100G applications. The Company is in the midst of transitioning the manufacturing for these components from its design centre in Ottawa, Ontario to its manufacturing operation in Fremont, California. The transition is expected to be completed by June 2012;
Delivered high port count multicast switches to two tier-1 equipment vendors for their long-haul equipment; and,
Shareholders elected Peter Dey, John Roland, Steve Bower and Tim Thorsteinson as directors of Enablence in December 2011. Mr. Dey was then appointed non-executive Chair of the Board.
Certain of these developments are described in more detail throughout this MD&A. Update on the Chinese Joint Venture The Company continues to support the launch of its joint venture with SUNSEA Telecommunications Co. Ltd. (the “JV Partner”). The joint venture has been renamed Sunblence Technologies Co., Ltd (the “China JV”, or “Sunblence”). Sunblence positions Enablence to capitalize on the vast opportunity presented by the Chinese market for optical splitter components required for very high-speed broadband telecommunications equipment. Enablence anticipated it would produce its initial wafers in Sunblence by December 31, 2011. As of February 24, 2012, initial wafers have been produced, however further process development is ongoing to generate competitive splitter chips. While all the equipment required to produce splitter chips was installed according to management’s expectations, there was an unforeseen delay on importing certain parts and chemicals required for the fabrication process. Sunblence continues to target generating revenues towards the end of the March 2012 quarter, however this delay makes it more likely that revenues will start to be generated in the June 2012 quarter. This delay has not impacted the Company’s revenue expectations for Sunblence for the calendar year of 2012 in total, and are targeting revenues of between $8-10 million for the calendar year. Enablence’s owns a 49% interest in Sunblence. Revenues are expected to rise significantly in the second and subsequent years of operation. Management expects Sunblence to be profitable and accretive to Enablence’s Adjusted EBITDA (as defined below) within calendar 2012, although no assurances can be given that the revenue, growth and profit

6
forecasts will be realized. Enablence will record 49% of these results in its financial statements, reflecting its ownership share. RESULTS OF OPERATIONS SUMMARY OF UNAUDITED QUARTERLY RESULTS The following table sets forth unaudited summary results of operations for the past eight (8) fiscal periods. The information for the fiscal period ending June 30, 2010 and subsequent quarters has been taken from our unaudited consolidated financial statements that, in management’s opinion, have been prepared on a basis consistent with the unaudited financial statements for the fiscal period ended December 31, 2011. Information for quarters ending prior to June 30, 2010 has been prepared on the same basis as the Company’s then-Canadian GAAP Canadian dollar consolidated financial statements and accompanying notes for the fiscal year ended April 30, 2010. All necessary adjustments, consisting only of normal recurring adjustments, necessary for a fair presentation of information presented have been included in the amounts stated below to present fairly the unaudited quarterly results when read in conjunction with the above noted consolidated financial statements and the notes to those statements. As a result of a change in the Company’s year end from April 30 to June 30, 2011 the fiscal period ended June 30, 2010 covers only two months, rather than the conventional three months for all other fiscal periods presented. The operating results for the two-month period ended June 30, 2010 are not readily comparable to the other three-month fiscal periods.
Amounts in thousands except per share dataRevenues $ 3,551 $ 5,821 $ 5,645 $ 8,294 $ 8,715 $ 8,117 $ 4,229 $ 6,925 Gross Margin 99 1,481 1,132 2,693 2,870 2,190 671 1,751 Gross Margin % 2.8% 25.4% 20.1% 32.5% 32.9% 27.0% 15.9% 25.3%Expenses
Research & development 1,433 1,508 1,573 1,253 1,376 1,289 929 1,542 Sales & marketing 257 302 240 367 419 434 263 487 General & administrative 950 1,144 1,666 1,382 1,706 1,265 933 1,681 Stock-based compensation 169 240 267 292 303 210 153 224 Amortization 148 175 71 362 385 375 243 372 Restructuring charges - - 381 151 83 796 - 1,786
Operating loss (2,858) (1,888) (3,066) (1,114) (1,402) (2,179) (1,850) (4,341) Impairment of intangible assets - - - - - - - - Other income (expense) (246) (250) (270) (231) (238) (228) (30) (50) Foreign exchange gain (loss) 389 (846) (8) 266 377 337 (162) (198) Recovery of future income taxes 114 114 123 114 118 217 5 (797)
Net loss for the period (2,601) (2,870) (3,221) (965) (1,145) (1,853) (2,037) (5,386) Loss from Discontinued Operations (446) (2,611) (43,827) (42,991) (4,268) (6,441) (2,510) (3,245)
Net loss for the Period $ (3,047) $ (5,481) $ (47,048) $ (43,956) $ (5,413) $ (8,294) $ (4,547) $ (8,631)
Weighted average shares outstanding 466,546 466,546 449,357 421,046 394,387 384,196 333,983 323,488 Basic & diluted loss per share
Continuing Operations $ (0.01) $ (0.01) $ (0.01) $ (0.00) $ (0.00) $ (0.01) $ (0.01) $ (0.02) Discontinued Operations (0.00) (0.01) (0.10) (0.10) (0.01) (0.02) (0.01) (0.01)
Adjusted EBITDA(3) $ (2,094) $ (1,020) $ (1,872) $ 83 $ (215) $ (393) $ (1,202) $ (1,570)
December 31, 2011
September 30, 2011
June 30, 2011
March 31, 2011
December 31, 2010
September 30, 2010
2 months ending June
30, 2010
3 months ending April
30, 2010
F2010 (2)
3 months ending 3 months ending Fiscal 2012 (1) Fiscal 2011 (1)
(1) All figures in fiscal 2012 and fiscal 2011 are reported under IFRS and in USD. (2) Figures in fiscal 2010 are reporting under then-existing Canadian GAAP, and in Canadian dollars. (3) Adjusted EBITDA does not have any standardized meaning according to IFRS and is defined and reconciled
to net loss below.

7
Non-GAAP Financial Measures The Company’s management reports and analyzes its financial results and performance using a range of financial measures. Some of these measures, such as revenues, net loss and cash flow from operating activities, are defined by IFRS. Other measures are not defined by IFRS. One non-GAAP measure used by management is “Adjusted EBITDA”. Adjusted EBITDA comprises: Net loss excluding the following – finance income and expense, income tax recovery and expense, depreciation and amortization, asset impairment charges, foreign exchange gains and losses in earnings, stock-based compensation expense and restructuring charges. Adjusted EBITDA does not have any standardized meaning according to IFRS. It is therefore unlikely to be comparable to similar measures presented by other companies. The reconciliation of Adjusted EBITDA with the IFRS measure of net loss is as follows:
Amounts in thousands Net loss for the period $ (3,047) $ (5,481) $ (47,048) $ (43,956) $ (5,413) $ (8,294) $ (4,547) $ (8,631) Add back Loss from Discontinued Operations 446 2,611 43,827 42,991 4,268 6,441 2,510 3,245 Net interest and other expense (income) 246 250 270 231 238 228 30 50 Amortization (note 3) 595 628 546 754 801 780 495 760 Impairment of intangible assets and goodwill - - - - - - - - (Recovery of) Provision for future income taxes (114) (114) (123) (114) (118) (217) (5) 797
"EBITDA" (1,874) (2,106) (2,528) (94) (224) (1,062) (1,517) (3,779) Realized foreign exchange (gain) loss (389) 846 8 (266) (377) (337) 162 198 Stock-based compensation 169 240 267 292 303 210 153 224 Restructuring charges - - 381 151 83 796 - 1,787
"Adjusted EBITDA" $ (2,094) $ (1,020) $ (1,872) $ 83 $ (215) $ (393) $ (1,202) $ (1,570)
3 months ending 2 months ending June
30, 2010
3 months ending April
30, 2010 December
31, 2011
F2012 (1)
September 30, 2011
June 30, 2011
March 31, 2011
December 31, 2010
September 30, 2010
3 months ending F2011 (1) F2010 (2)
(1) All figures in fiscal 2012 and fiscal 2011 are reported under IFRS and in USD. (2) Figures in fiscal 2010 are reporting under then-existing Canadian GAAP, and in Canadian dollars. (3) Amortization includes amounts that are recorded as part of cost of revenues and therefore does not equal
the amount on the face of the Consolidated Statements of Loss, Other Comprehensive Loss and Comprehensive Loss. Instead the Amortization figure used above is found in the Consolidated Statements of Cash Flows, which includes all amortization.
The following chart reflects a pro forma operating statement, showing the elements that comprise Adjusted EBITDA.
Amounts in thousands Revenues $ 3,551 $ 5,821 $ 5,645 $ 8,294 $ 8,715 $ 8,117 $ 4,229 $ 6,925 Adjusted gross margin 546 1,934 1,607 3,085 3,286 2,595 923 2,140 Adjusted gross margin % 15% 33% 28% 37% 38% 32% 22% 31%Expenses
Research & development 1,433 1,508 1,573 1,253 1,376 1,289 929 1,542 Sales & marketing 257 302 240 367 419 434 263 487 General & administrative 950 1,144 1,666 1,382 1,706 1,265 933 1,681 Operating expenses 2,640 2,954 3,479 3,002 3,501 2,988 2,125 3,710
Adjusted EBITDA (2,094) (1,020) (1,872) 83 (215) (393) (1,202) (1,570)
F2012 (1) F2011 (1) F2010 (2)
3 months ending 3 months ending 2 months ending June
30, 2010
3 months ending April
30, 2010 December 31, 2011
September 30, 2011
June 30, 2011
March 31, 2011
December 31, 2010
September 30, 2010
(1) All figures in fiscal 2012 and fiscal 2011 are reported under IFRS and in USD. (2) Figures in fiscal 2010 are reporting under then-existing Canadian GAAP, and in Canadian dollars.
Adjusted gross margin above reflects reported gross margin after removing amortization expense. The Company uses Adjusted EBITDA as one financial metric to evaluate the profitability and potential recurring cash flows of its business, and continues to take actions to improve this financial metric as outlined in the Outlook section below.
8
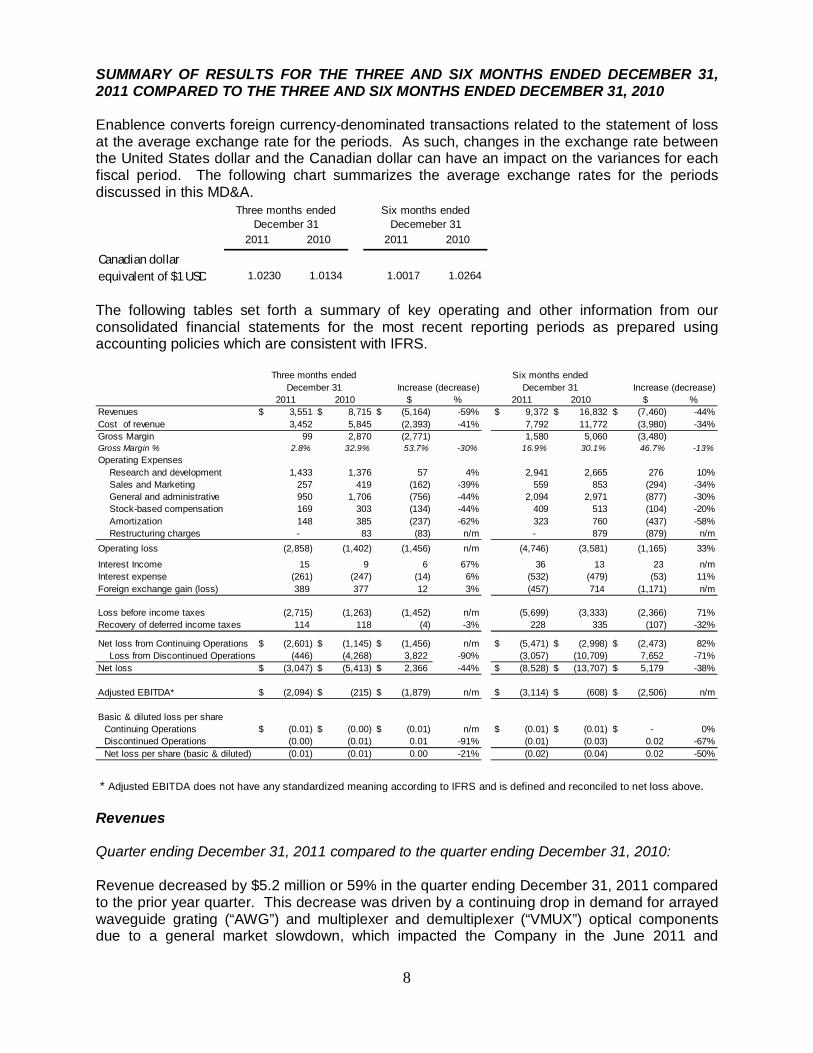
SUMMARY OF RESULTS FOR THE THREE AND SIX MONTHS ENDED DECEMBER 31, 2011 COMPARED TO THE THREE AND SIX MONTHS ENDED DECEMBER 31, 2010 Enablence converts foreign currency-denominated transactions related to the statement of loss at the average exchange rate for the periods. As such, changes in the exchange rate between the United States dollar and the Canadian dollar can have an impact on the variances for each fiscal period. The following chart summarizes the average exchange rates for the periods discussed in this MD&A.
2011 2010 2011 2010
1.0230 1.0134 1.0017 1.0264
Three months ended December 31
Six months ended Decemeber 31
Canadian dollar equivalent of $1 USD The following tables set forth a summary of key operating and other information from our consolidated financial statements for the most recent reporting periods as prepared using accounting policies which are consistent with IFRS.
$ % $ % Revenues $ 3,551 $ 8,715 $ (5,164) -59% $ 9,372 $ 16,832 $ (7,460) -44%Cost of revenue 3,452 5,845 (2,393) -41% 7,792 11,772 (3,980) -34%Gross Margin 99 2,870 (2,771) 1,580 5,060 (3,480) Gross Margin % 2.8% 32.9% 53.7% -30% 16.9% 30.1% 46.7% -13%Operating Expenses Research and development 1,433 1,376 57 4% 2,941 2,665 276 10% Sales and Marketing 257 419 (162) -39% 559 853 (294) -34% General and administrative 950 1,706 (756) -44% 2,094 2,971 (877) -30% Stock-based compensation 169 303 (134) -44% 409 513 (104) -20% Amortization 148 385 (237) -62% 323 760 (437) -58% Restructuring charges - 83 (83) n/m - 879 (879) n/mOperating loss (2,858) (1,402) (1,456) n/m (4,746) (3,581) (1,165) 33%
Interest Income 15 9 6 67% 36 13 23 n/mInterest expense (261) (247) (14) 6% (532) (479) (53) 11%Foreign exchange gain (loss) 389 377 12 3% (457) 714 (1,171) n/m
Loss before income taxes (2,715) (1,263) (1,452) n/m (5,699) (3,333) (2,366) 71%Recovery of deferred income taxes 114 118 (4) -3% 228 335 (107) -32%
Net loss from Continuing Operations $ (2,601) $ (1,145) $ (1,456) n/m $ (5,471) $ (2,998) $ (2,473) 82% Loss from Discontinued Operations (446) (4,268) 3,822 -90% (3,057) (10,709) 7,652 -71%Net loss $ (3,047) $ (5,413) $ 2,366 -44% $ (8,528) $ (13,707) $ 5,179 -38%
Adjusted EBITDA* $ (2,094) $ (215) $ (1,879) n/m $ (3,114) $ (608) $ (2,506) n/m
Basic & diluted loss per shareContinuing Operations $ (0.01) $ (0.00) $ (0.01) n/m $ (0.01) $ (0.01) $ - 0%Discontinued Operations (0.00) (0.01) 0.01 -91% (0.01) (0.03) 0.02 -67%Net loss per share (basic & diluted) (0.01) (0.01) 0.00 -21% (0.02) (0.04) 0.02 -50%
Increase (decrease) Increase (decrease) 2011 2010 2011 2010
Three months ended December 31
Six months ended December 31
* Adjusted EBITDA does not have any standardized meaning according to IFRS and is defined and reconciled to net loss above. Revenues Quarter ending December 31, 2011 compared to the quarter ending December 31, 2010: Revenue decreased by $5.2 million or 59% in the quarter ending December 31, 2011 compared to the prior year quarter. This decrease was driven by a continuing drop in demand for arrayed waveguide grating (“AWG”) and multiplexer and demultiplexer (“VMUX”) optical components due to a general market slowdown, which impacted the Company in the June 2011 and

9
September 2011 quarters, continued into the current quarter. The Company did not generate any significant revenues from new products during the quarter, and is planning to introduce several new products in the coming quarters to help reverse the decline in revenue. During the three months ended December 31, 2011, one customer accounted for 26% of the Company’s total revenue and one customer accounted for 41% of the accounts receivable balance at December 31, 2011. During the three months ended December 31, 2010, three customers accounted for 55% of the Company’s total revenue (27%, 15% and 13% individually), and two customers accounted for 46% (24% and 22% individually) of the accounts receivable balance at June 30, 2011. $3.3 million, or 64%, of the decrease in revenue is attributable to two customers, who have experienced a drop in projects that use Enablence products. Six months ending December 31, 2011 compared to six months ending December 31, 2010: Revenue decreased by $7.5 million or 44% compared to the prior year. As above, this decrease was driven by a slowdown in demand for Enablence products and as part of a general market slowdown. Revenue was also negatively impacted compared to the prior year due to a key customer in Europe whose volumes have decreased significantly from the prior year. During the six months ended December 31, 2011, one customer accounted for 16% of the Company’s total revenue. During the six months ended December 31, 2010, three customers accounted for 54% of the Company’s total revenue (25%, 17% and 12% individually). $5.8 million, or 77%, of the decrease in revenue is attributable to two customers, who have experienced a drop in projects that use Enablence products. Management expects revenues for the quarter ending March 31, 2012 to be similar to the quarter ended December 31, 2011, however the Company expects revenue to improve in subsequent quarters, as the Company begins to generate revenue from its new products and the Company’s customers resume their historical buying patterns. The Company will be introducing its multi-channel 100G optical components, including transmitter/receiver optical sub-assembly (“TOSA/ROSA”), as well as 40G differential quadrature phase shift keying (“DQPSK”) products among others during fiscal 2012. Sunblence is expected to achieve initial evaluation wafer production in the quarter ending March 31, 2012, and to begin generating customer revenues in the quarter ending June 30, 2012, with the primary customer being the JV Partner. Revenue (based on ship-to location of the customer) is split by region as follows:
Region $ % $ % $ % $ %
Americas 1,288 36% 3,337 38% 4,754 51% 7,103 43%Asia Pacific 1,535 43% 2,622 30% 3,255 35% 4,797 28%Europe, Middle East and Africa 728 21% 2,756 32% 1,364 15% 4,932 29%
3,551$ 100% 8,715$ 100% 9,373$ 100% 16,832$ 100%
Three months ended December 31,2011 2010 2011 2010
Six months ended December 31,
Revenue decreased significantly in Europe from the prior year quarter, due to a decline with one key customer whose volumes have decreased significantly. Asia Pacific and the Americas decreased due to general market conditions. Revenue is expected to shift towards Asia Pacific as the China JV starts generating revenue. This regional revenue mix may change quarterly due to individual projects, however it is expected to remain significant outside North America. The Company does not generate significant revenue in Central and Latin America, therefore that geography has been combined in the Americas region.

10
Gross Margin The Company’s cost of revenues (or ”COGS”) is comprised of a number of elements, some of which vary with revenues, such as material costs and the cost of products manufactured by third parties, and some of which do not vary significantly with the level of revenues, including many overhead costs such as compensation of operations staff, amortization and facilities costs. The following chart summarizes the fixed and variable elements included in gross margin:
$ % $ %
Revenues $ 3,551 $ 8,715 $ (5,164) -59% $ 9,372 $ 16,832 $ (7,460) -44%Variable Cost of Revenues 2,123 4,148 (2,025) -49% 5,069 8,339 (3,270) -39%Variable gross margin 1,428 4,567 (3,139) 4,303 8,493 (4,190) Variable gross margin % 40% 52% 46% 50%
Amortization 447 418 29 900 822 78 Other fixed COGS 882 1,280 (398) 1,824 2,611 (788) Total COGS 3,452 5,845 (2,394) 7,792 11,772 (3,980) Reported Gross Margin 99 2,870 (2,770) 1,580 5,060 (3,480) Reported Gross Margin % 2.8% 32.9% 16.9% 30.1%
2011 2010 2011 2010 Increase (decrease) Increase (decrease)Three months ended Six months ended
Quarter ending December 31, 2011 compared to the quarter ending December 31, 2010: Gross margin decreased from 32.9% in the prior year quarter to 2.8% in the current fiscal quarter. Gross margin was negatively impacted by approximately 28 points due to lower volumes, where the fixed and semi-variable costs have been absorbed by lower revenues. Gross margin was also negatively impacted by pricing pressures during the quarter by approximately 9 points as demand dropped and competitive pressures increased in the market. Partially offsetting the decline due to volume is approximately 7 points of margin improvement due to cost reductions completed at the end of fiscal 2011. The Company combined its U.S. manufacturing in its Fremont, California location, generating approximately $0.25 million of savings per quarter. Gross margin decreased from 30.1% in the prior year to 16.9% in the current fiscal year. Gross margin was negatively impacted by approximately 16 points due to lower volumes and 3 points due to pricing pressure. The Company offset these declines by approximately 6 points from cost reductions. Operating expenses Research & Development (“R&D”) expenses for the second quarter of fiscal 2012 increased by $0.1 million, or 4% over the prior year period, as the Company added R&D capability to support its product roadmap, focused on new products addressing the anticipated growth in demand for 100G capable products, and expand development for its photodiode business. The Company also increased its engineering resources to generate additional engineering services (“NRE”) revenue, however these costs are recorded as part of cost of revenue. R&D expenses for the six months ended December 31, 2011 increased by $0.3 million, or 10%. The Company anticipates some continued growth in R&D spending by adding key resources to support the Company’s development in TOSA / ROSA and DQPSK products.

11
Sales & Marketing expenses for the second quarter of fiscal 2012 decreased by $0.2 million or 39%, compared to the prior year quarter. During fiscal 2011, the Company shut down its corporate marketing function in order to reduce costs. Sales and marketing expenses for the six months ended December 31, 2011 decreased by $0.3 million or 34%, primarily due to the Company shut down of its corporate marketing function in fiscal 2011. The Company is evaluating the impact of increasing its sales & marketing expenses to add more sales resources in strategic locations in order to expand its addressable market and expand the Company’s customer base. General & Administration expenses for the second quarter of fiscal 2012 decreased by $0.8 million, or 44%, compared to the prior year period. The decrease in spending was driven by a reduction in certain consulting expenses incurred in the prior year quarter, as well as the impact of combining the US operations. Costs pertaining to divestiture activities in the quarter have been reclassified with discontinued operations. General and administration expenses for the six months ended December 31, 2011 decreased by $0.9 million or 30% due to the combining of US operations, and prior year spending that included certain consulting expenses that have not been continued in fiscal 2012. The Company expects general & administration expenses to remain at their current level, however will continue to target cost reductions in this area. Stock-based compensation for the second quarter of fiscal 2012 decreased by $0.1 million, or 44% compared to the prior year period. Stock-based compensation for the six months ended December 31, 2011 decreased by $0.1 million, or 20% compared to the prior period. The decrease resulted from lack of any new options being granted, and the first tranche of options granted in September 2011 being fully amortized. The Company did not grant any options during the quarter ending December 31, 2011. Total stock options outstanding as at December 31, 2011 were 24,991 compared to 28,867 as at June 30, 2011. The decrease in stock options outstanding is due largely to staff reductions made in the Systems segment. Stock-based compensation expense related to employees in the Systems segment has been reclassified to discontinued operations. Amortization for the second quarter of fiscal 2012 decreased by $0.2 million compared to the prior year period, due to decreased intangible asset amortization. Amortization for the six months ended December 31, 2011 decreased by $0.4 million, also due to decreased intangible asset amortization. Amortization related to intangible assets decreased as certain assets were fully amortized at the end of fiscal 2011. Restructuring charges for the second quarter of fiscal 2012 were $nil, compared to $0.1 million in the prior year period. Restructuring charges for the six months ended December 31, 2011 were $nil, compared to $0.9 million in the prior year period. In the prior year, the Company incurred costs related to closing the corporate marketing function and to relocating the Company’s polymer-based production from its Wilmington, Massachusetts fabrication facility to its Fremont, California fabrication facility, and were comprised of employee related and facility exit costs.

12
Interest income Enablence invests cash and cash equivalents in short-term investments with a Canadian chartered bank. During the second quarter of fiscal 2012, Enablence earned interest income on these investments of $15 as compared to $9 during the prior year period. The Company earned $36 of interest for the six months ended December 31, 2011 as compared to $13 during the six months ended December 31, 2010. Interest income is a function of prevailing interest rates and the amount of funds invested. Interest expense Interest expense during the second quarter of fiscal 2012 was $261 compared to $247 during the prior year period. For the six months ended December 31, 2011, interest expense was $532 compared to $479 in the prior year period. The increase in the current year quarter was due mainly to the addition of a $3.5 million of secured note payable in May 2011, partially offset due to lower interest on the Company’s other secured note payable, due to repayment of principal amounts. The Company’s interest expense is a function of the balance of debt, the prevailing interest rates, and the average foreign exchange rate between the underlying currency of the debt security and the Canadian dollar. The table below sets out the balances outstanding at the end of each period:
Secured note payable (a) $ 3,247 $ 4,212Secured note payable (b) 3,500 3,500Convertible notes payable 2,929 3,000Subordinated notes payable 10,000 10,000Subordinated notes payable Interest 762 531Total $ 20,438 $ 21,243
Current portion 13,347 12,800Long term portion 7,091 8,443
December 31, 2011
June 30, 2011
The secured note payable (a) was issued on July 16, 2010 and has an interest rate based on the Wall Street Journal prime rate plus 1.50%, resulting in an interest rate of 4.75% at December 31, 2011. The secured note payable (b) was issued on May 10, 2011 and has an interest rate based on the greater of 5.5% and the Wall Street Journal prime rate plus 1.50% (which was 4.75% at December 31, 2011), resulting in an interest rate of 5.5% at December 31, 2011. The interest rate on the convertible notes and subordinated notes is 5%. Foreign exchange gain (loss) Foreign exchange gains and losses include realized and unrealized gains and losses on foreign exchange, including those that arise as a result of converting assets and liabilities denominated in currencies other than the functional currency of the entity into the functional currency of the entity at the balance sheet date and realized gains or losses arising from the settlement of these balances during the period. During the three months ended December 31, 2011 the Company recorded a foreign exchange gain of $0.4 million compared to a foreign exchange gain $0.4 million during the three months ended December 31, 2010. The gain in the current quarter is due mainly to the strengthening of the CAD compared to the USD, and the impact this had on certain USD-denominated debts carried in Canadian entities. During the six months ended December 31, 2011 the Company recorded a foreign exchange loss of $0.5 million mainly due

13
to the weakening of the Canadian dollar, as compared to a foreign exchange gain of $0.7 million during the six months ended December 31, 2010. The main driver of the foreign exchange gains and losses are the notes payable that are denominated in US Dollars, but carried in a Canadian functional currency company. Income taxes There are no income taxes currently payable or recoverable by the Company or its subsidiaries. Deferred income tax recovery is due to the amortization of the intangible assets recognized on acquisitions and the related future tax liabilities that were recorded at that time, as well as the timing differences between amortization for accounting and tax on certain property, plant and equipment. The future tax liability is drawn down in line with the amortization differences and impairment of the related assets. No future tax asset has been recorded, and none will be recorded until, in the opinion of management, it is more likely than not that the future tax assets will be realized. During the three months ended December 31, 2011, the Company recorded a deferred income tax recovery of $0.1 million as to $0.1 million during the three months ended December 31, 2010. During the six months ended December 31, 2011 the Company recorded a future income tax recovery of $0.2 million, as compared to $0.3 million during the six months ended December 31, 2010. Net loss from continuing operations Net loss from continuing operations excludes the results from operations of the Systems business. The net loss from continuing operations for the three months ended December 31, 2011 was $ 2.6 million compared to $ 1.1 million in the three months ended December 31, 2010 due to the factors above. The main drivers in the increased net loss from continuing operations were decreased revenues, and the related impact on gross margin, offset by reduced general and administrative expenses, amortization and foreign exchange gains, discussed in more detail above. The net loss from continuing operations for the six months ended December 31, 2011 was $5.5 million compared to $3.0 million for the six months ending December 31, 2010. The increase in net loss from continuing operations was mainly driven by decreased revenues and foreign exchange losses, offset by reduced restructuring costs, general and administrative expenses and amortization.

14
Loss from discontinued operations The loss from discontinued operations represents the financial results from the Company’s Systems segment. The summary operating results from discontinued operations are as follows:
$ % $ % Revenues $ 12,159 $ 25,409 $ (13,250) -52% $ 20,361 $ 44,284 $ (23,923) -54%Cost of revenue 9,286 17,454 (8,168) -47% 14,485 30,719 (16,234) -53%Gross Margin 2,873 7,955 (5,082) 5,876 13,565 (7,689) Gross Margin % 23.6% 31.3% -8% 38% 28.9% 30.6% -2% 32%Operating Expenses Research and development 1,485 3,917 (2,432) -62% 4,419 8,106 (3,687) -45% Sales and Marketing 1,157 3,504 (2,347) -67% 2,896 6,691 (3,795) -57% General and administrative 581 1,331 (750) -56% 814 2,831 (2,017) -71% Stock-based compensation 9 605 (596) -99% 310 717 (407) -57% Amortization 94 3,530 (3,436) -97% 251 7,241 (6,990) -97% Restructuring charges - - - n/m (134) 218 (352) -161%
Operating loss (453) (4,932) 4,479 -91% (2,680) (12,239) 9,559 -78%Interest Income (1) (60) 59 n/m - 6 (6) -100%Interest expense (52) 12 (64) n/m (757) 12 (769) -6408%Foreign exchange gain (loss) 60 193 (133) n/m 380 75 305 407%
Loss before income taxes (446) (4,787) 4,341 -91% (3,057) (12,146) 9,089 -75%Recovery of deferred income taxes - 906 (906) -100% - 1824 (1,824) -100%
Loss from Discontinued Operations $ (446) $ (3,881) $ 3,435 -89% $ (3,057) $ (10,322) $ 7,265 -70%
Increase (decrease) 2011 2010 2011 2010
Increase (decrease)Three months ended
December 31Six months ended
December 31
Revenues declined in the current quarter compared to the prior year primarily due to the divestiture of the majority of the US-based Systems business, combined with the announcement that Enablence was exiting the Systems business, as well as the quarterly fluctuation in shipments to key customers. Gross margins decreased in the current quarter compared to the prior year period due to the large decrease in revenue, as fixed costs are spread over less revenue. Operating expenses declined as a result of cost reduction activities, mainly in North America, including the divestiture of the majority of the US based operations. Amortization decreased year over year as the intangible assets that were being amortized were written off to $nil in the quarters ending March 31 and June 30, 2011. Restructuring charges in the prior year period relate to acquisition costs associated with the acquisition of Teledata. These costs were previously included in goodwill, however with the change to IFRS, these costs are expensed. The recovery of restructuring charges in the current year relate to charges taken in the prior year that were reversed based on updated information. Interest expense in the current year to date period is due to certain late payment charges from certain service and product providers incurred in the September 2011 quarter. The recovery of deferred income taxes is the result of amortization of intangible assets. As a result of the decrease in amortization expense, the deferred income tax recovery amount was reduced to $nil in the current quarter.

15
Loss per common share The table below presents the basic and diluted loss per common share for each of the comparative fiscal periods.
2011 2010 2011 2010
Basic and Diluted Loss per Common Share - From continuing operations (0.01) (0.00) (0.01) (0.01) - From discontinued operations (0.00) (0.01) (0.01) (0.03) Weighted Average Number of Common Shares 466,546 394,387 466,546 389,291
Three months ended December 31 Six months ended Decemeber 31
Due to a net loss, financial instruments including warrants and options are anti-dilutive. CHANGE IN ACCOUNTING POLICIES
Adoption of International Financial Reporting Standards ("IFRS") The Company adopted IFRS effective July 1, 2011 and, as a result, certain of the accounting policies under which the Company’s financial results are reported have changed from prior periods. Note 3 to the Company’s financial statements explains the revised accounting policies adopted by the Company, which are consistent with IFRS. Note 18 to the Company’s financial statements explains the principal adjustments made by the Company in restating its Canadian GAAP statement of financial position as at May 1, 2010 and its previously published Canadian GAAP financial statements for the fiscal year ending June 30, 2011 and three and six months ending December 31, 2010. The principal areas of impact in measurement and recognition were as follows: IFRS 2 Share-based Payments – Stock options generally vest over a four-year period. Prior to the adoption of IFRS 2, the Company recognized the fair value of stock options on a straight-line basis over the four-year vesting period. Under IFRS 2, Share-Based Payments, the fair value of each tranche of the award is determined separately and recognized as compensation expense over the term of its respective vesting period. This will result in accelerated recognition of stock compensation expense under IFRS. The impact of this change resulted in increased stock-based compensation expense for the three and six months ending December 31, 2010 by $255 and $315 respectively. The increase was offset by the reclassification to discontinued operations for the stock based compensation that is related to Systems segment personnel for the three and six months ending December 31, 2010 of $605 and $717 respectively. IAS 20 Government Grants –The Company’s government assistance in Israel for research and development of products meets the definition of a forgivable loan. IFRS differs from Canadian GAAP in the recognition of the grant on the balance sheet and in earnings, as IFRS requires the entity to meet the terms of forgiveness in order to recognize into income; as such, the Company has recognized a liability under IFRS as the terms of forgiveness has not been met. Government grants are only applicable to the Company’s subsidiary in Israel (“Teledata”), which is reported as part of discontinued operations. The Company has adjusted the Teledata purchase price equation to include an $8.6 million liability for the repayment of government

16
grants. The Company reduced the carrying value of the liability at June 30, 2011 to $5.7 million based on revised fair value estimates applicable at that date. IAS 21 Effect of Changes in Foreign Exchange Rates – The Company has restated its financial statements to USD from Canadian dollars. While this change was not due to the change to IFRS, it did impact accumulated other comprehensive loss in the May 1, 2010 balance sheet, as the cumulative translation adjustment (“CTA”) changed from a balance of Canadian $3.9 million to a negative balance of $2.7 million. As permitted under IFRS1 elections, the Company has reset its CTA to $nil, on the transition date of May 1, 2010. This resulted in an adjustment of $2.7 million to accumulated other comprehensive loss and accumulated deficit as at May 1, 2010. OUTLOOK Following the planned divestiture through a sale, partial sale or closure of Teledata, management will focus solely on its optical components and subsystems business, including the recently formed China JV, Sunblence. There is significant uncertainty on the outcome of the Company’s efforts to divest of Teledata, but management continues to work to optimize the return to shareholders on disposition or closure. Accordingly, the remainder of this Outlook section reflects comments on the continuing operations of Enablence. Management believes the market growth rate for its products is approximately 15% annually over the next three years, based on certain market research reports. Initiatives for Enablence to maintain and exceed the expected market growth include:
identifying and addressing adjacent markets, channels and applications for our products; expanding our product portfolio through existing product evolution, including products
that address the growing need for higher speed networks and more flexible/dynamic networks, and new products identified through our non-recurring engineering (“NRE”) services and sales; and
supporting Sunblence to provide growing volumes and access to the Chinese market for optical components based on Enablence's proprietary PLC technology.
adding sales and marketing resources to expand its customer base; The primary focus areas for the Company are:
introducing the Company’s TOSA/ROSA products and migrating production from Ottawa to Fremont;
moving Sunblence’s operations from pre-production to initial customer revenues and subsequent high growth; and
refinancing the business. A number of product developments are planned and being implemented in the next twelve months, including:
several multi-channel 100G optical components, aimed at the long-haul, metro loop and datacom optical fibre markets, including Transmitter Optical Sub-Assembly and Receiver Optical Sub-Assembly (“TOSA/ROSA”) products. These products are being designed with a number of formats, including 100G coherent, 4X25G and 10X10G. The Company is in the midst of transitioning these products from its development centre in Ottawa, Ontario, to its manufacturing facility in Fremont, California, in order to produce at lower costs and higher volumes.
PLC-based products for deployment in homeland security applications that require ultra-fast interpretation of significant amounts of complex data in order to operate effectively.

17
increasing our value-add in photodiodes by doing our own packaging and producing higher-speed avalanche photodiodes (“APD’s”).
These development programs will be funded, in part, by third party funded design contracts, where Enablence retains the rights to the intellectual property developed and gains a “lead customer” for initial product revenues during a defined period of exclusivity. The Company will be showing several new products at the annual Optical Fiber Communication Conference and Exposition (“OFC”) in Los Angeles in March 2012, including:
10 X 10G TOSA ROSA chips, which provide Enablence with a photonic integrated circuit (“PIC”) platform for high-speed Dense Wavelength Division Multiplexing (“DWDM”) and Coarse Wavelength Division Multiplexing (“CWDM”) transceivers.
100G coherent transmitter (“Tx”) and receiver (“Rx”) (transmission and receiving) optical sub-assemblies (“OSA”)
32 channel DWDM integrated receiver module 20 GHz packaged photodiodes as the Company’s first products in the packaged
photodiode space The Company’s initiatives to manage working capital and cash flow include:
continuing to work closely with our key vendors and customers to optimize cash flow; exploring opportunities for establishing banking relationships to provide access to additional debt financing;
continuing to evaluate opportunities to generate capital and strengthen the Company’s balance sheet to accelerate growth by being a lower risk supplier to our customers and allowing flexibility to address growth opportunities as they arise; and
refinancing the notes payable. The Company has initiated discussions with certain noteholders about the alternatives for refinancing or deferring settlement of the Notes beyond their current maturity date. However, there can be no assurance that the Company will be successful in restructuring these instruments.
LIQUIDITY The Company’s objectives when managing its liquidity and capital structure are to generate sufficient cash to fund the Company’s operating and debt service requirements (debt service costs are currently $0.7 million per quarter, increasing to $0.9 million per quarter in May of 2012), and refinance the Notes on or prior to maturity (the subordinated note payable of $10 million plus $1 million of accrued interest is currently due to mature on June 23, 2012). The Company has not generated positive cash flow from operations since its inception, and has relied on cash from the issuance of shares and debt to fund its operations. The table below sets out the cash, cash equivalents, short-term investments and working capital at the end of the current quarter and most recent year end fiscal periods.
Cash and Cash Equivalents - Continuing operations $ 4,960 $ 8,131 $ 10,404 - Discontinued operations 2,377 4,044 1,523 Working Capital - Continuing operations (1,776) 1,511 4,947 - Discontinued operations (4,349) (4,370) (3,506)
December 31, 2011 June 30, 2011
September 30, 2011
18
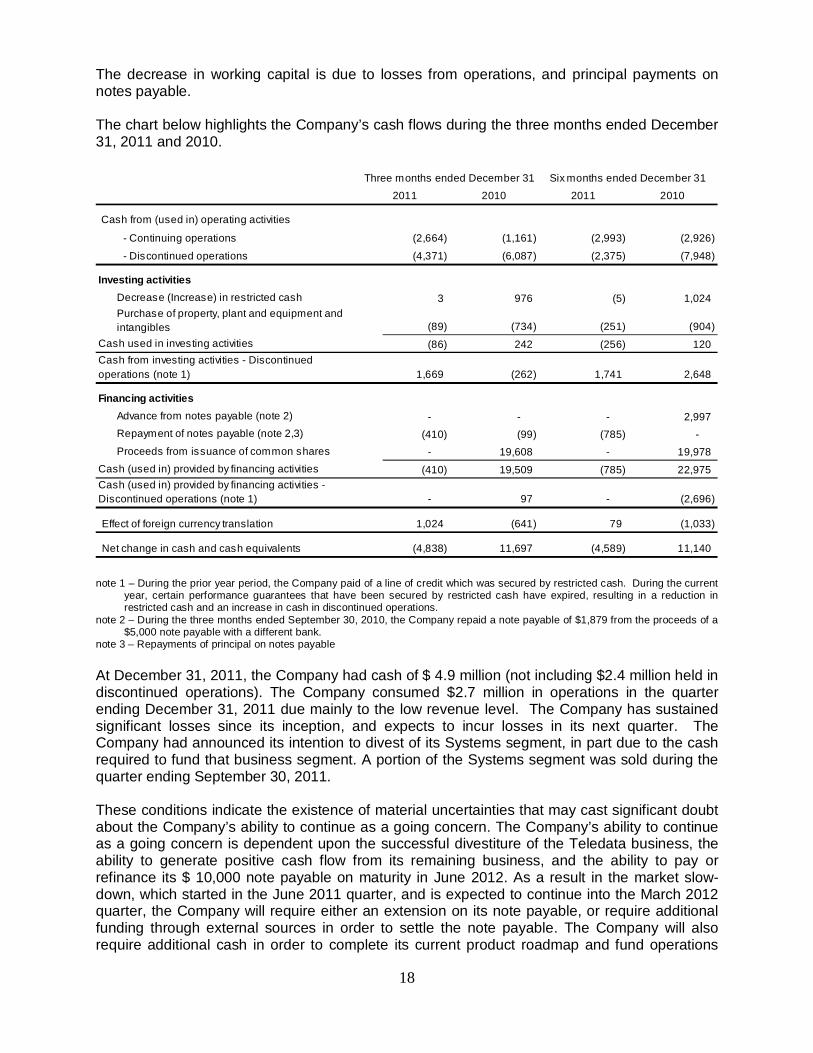
The decrease in working capital is due to losses from operations, and principal payments on notes payable. The chart below highlights the Company’s cash flows during the three months ended December 31, 2011 and 2010.
Cash from (used in) operating activities
- Continuing operations (2,664) (1,161) (2,993) (2,926)
- Discontinued operations (4,371) (6,087) (2,375) (7,948)
Investing activitiesDecrease (Increase) in restricted cash 3 976 (5) 1,024 Purchase of property, plant and equipment and intangibles (89) (734) (251) (904)
Cash used in investing activities (86) 242 (256) 120
1,669 (262) 1,741 2,648
Financing activitiesAdvance from notes payable (note 2) - - - 2,997 Repayment of notes payable (note 2,3) (410) (99) (785) - Proceeds from issuance of common shares - 19,608 - 19,978
Cash (used in) provided by financing activities (410) 19,509 (785) 22,975
- 97 - (2,696)
Effect of foreign currency translation 1,024 (641) 79 (1,033)
Net change in cash and cash equivalents (4,838) 11,697 (4,589) 11,140
2011 2010Six months ended December 31
Cash (used in) provided by financing activities - Discontinued operations (note 1)
Cash from investing activities - Discontinued operations (note 1)
2011 2010Three months ended December 31
note 1 – During the prior year period, the Company paid of a line of credit which was secured by restricted cash. During the current
year, certain performance guarantees that have been secured by restricted cash have expired, resulting in a reduction in restricted cash and an increase in cash in discontinued operations.
note 2 – During the three months ended September 30, 2010, the Company repaid a note payable of $1,879 from the proceeds of a $5,000 note payable with a different bank.
note 3 – Repayments of principal on notes payable At December 31, 2011, the Company had cash of $ 4.9 million (not including $2.4 million held in discontinued operations). The Company consumed $2.7 million in operations in the quarter ending December 31, 2011 due mainly to the low revenue level. The Company has sustained significant losses since its inception, and expects to incur losses in its next quarter. The Company had announced its intention to divest of its Systems segment, in part due to the cash required to fund that business segment. A portion of the Systems segment was sold during the quarter ending September 30, 2011. These conditions indicate the existence of material uncertainties that may cast significant doubt about the Company’s ability to continue as a going concern. The Company’s ability to continue as a going concern is dependent upon the successful divestiture of the Teledata business, the ability to generate positive cash flow from its remaining business, and the ability to pay or refinance its $ 10,000 note payable on maturity in June 2012. As a result in the market slow-down, which started in the June 2011 quarter, and is expected to continue into the March 2012 quarter, the Company will require either an extension on its note payable, or require additional funding through external sources in order to settle the note payable. The Company will also require additional cash in order to complete its current product roadmap and fund operations

19
until the business is able to generate cash from operations. Management believes it has sufficient cash to continue operations until May, 2012, at which time additional cash will be required to continue to fund operations. While management believes it will be able to source sufficient resources to fund the business moving forward, there is substantial risk in the divestiture plans of the Systems segment. The Company’s ability to reach profitability is dependent on divesting its Systems segment as soon as practical, while minimizing the cash required to support it during the divestiture process including a sale, partial sale or closure. Other dependencies include the successful introduction of new products and the success of the China JV. There can be no assurance that Enablence will gain adequate market acceptance, or that the Company will achieve higher gross margins, even though management has identified specific actions to reduce its cost of revenues in the current conditions. The Company has not yet earned operating profits. The Company believes that the existing working capital and forecasted revenues will not be sufficient to cover the Company’s total cash requirements to and beyond June 30, 2012, based upon its operating forecasts. The Company will require additional cash to operate the business, estimated to be between $7 and $10 million, in order to operate the Company to break even. This amount does not include any amounts required to refinance the $10 million subordinated note or divest of the Systems segment. These forecasts include assumptions regarding:
the divestiture of the Systems segment with minimal funding for ongoing operations prior to its sale or closure;
revenue growth from the acceptance of the Company’s new products; impacts of continued price erosion in the market, and a continued slow recovery of the
market; an increase in design services revenue and margins from key optical component
customers; improvements in supply chain and inventory management performance; and improved treasury management, particularly as it relates to accounts receivable.
The Company expects to invest up to $1.0 million during the next 12 months on component manufacturing equipment to improve manufacturing processes with the ultimate objective of improving gross margins and product offerings, and on design and test equipment. CAPITAL RESOURCES Enablence finances its operations through the issuance of common shares and certain notes payable. The Company had established a $1 million line of credit which expired on December 31, 2011. This line of credit was subject to certain limitations, including the amount and age of certain of the Company’s accounts receivable. The Company had not drawn any amounts against the line as at December 31, 2011, and could not draw on it based on the level of accounts receivable outstanding, and therefore decided not to renew the facility on December 31, 2011. Enablence may receive cash proceeds on the issue of additional common shares on the exercise of options and warrants depending in part on the market price for its shares. The Company periodically evaluates the opportunity to raise additional funds through either the public or private placement of equity capital to strengthen its financial position and to provide sufficient cash reserves to protect itself from the effects of the current unpredictable economic conditions.

20
Enablence is authorized to issue an unlimited number of common shares of which 466,546,094 common shares are issued and outstanding as of February 24, 2012. The common shares of Enablence trade on the TSX Venture Exchange under the symbol “ENA” or “ENA.V”.
OFF BALANCE SHEET ARRANGEMENTS A Canadian chartered bank has issued a letter of guarantee in the amount of $100 on behalf of the Company, to secure a performance guarantee of $2,850. This letter of guarantee has been secured with a cash deposit in that bank. This cash deposit is recorded as restricted cash on the Company’s balance sheet. In January of 2012, this letter of guarantee expired, and the $100 of restricted cash was released. The table below presents the Company’s contractual obligations from continuing operations (note that amounts include future interest costs).
Secured notes payable $ 7,378 $ 2,865 $ 3,209 $ 1,304 $ - Subordinated notes payable 11,001 11,001 - - - Convertible notes payable 3,436 566 1,066 981 823
Facilities leases 1,572 504 1,050 18 -
$ 23,387 $ 14,936 $ 5,325 $ 2,303 $ 823
Less than 1 Year After 5 YearsTotal 1-3 Years 4-5 Years
The Company is exposed to currency risk as certain transactions are denominated in Canadian dollars, Swiss francs and Israeli shekels. Management is evaluating foreign exchange risk management strategies. However, the Company has not entered into forward, swap or option contracts to manage its exposures to fluctuations in foreign exchange rates. Enablence has not entered into any other material off-balance sheet arrangements such as guarantee contracts, contingent interests in assets transferred to unconsolidated entities, or derivative instrument obligations, or with respect to any obligations under a variable interest entity arrangement. TRANSACTIONS WITH RELATED PARTIES During the three and six months ended December 31, 2011 the Company did not enter into any transactions with related parties (2010 - consulting costs pursuant to a contract with a former executive of the Company were paid for the three and six months ending December 31, 2010 of $75 and $150 respectively).
RISKS AND UNCERTAINTIES The Company operates in a dynamic, rapidly changing environment that involves risks and uncertainties and as a result management expectations may not be realized for a number of reasons. An investment in Enablence common shares is speculative and involves a high degree of risk and uncertainty. The current global economic crises pose additional risks and uncertainties which may materially affect management’s expectations.
21
Any investor should also consider carefully these risks and the risks and uncertainties that are detailed in our Annual Information Form filed on October 20, 2011, and available at: www.sedar.com. CRITICAL ACCOUNTING ESTIMATES The preparation of financial statements, in conformity with IFRS, requires management to make estimates and assumptions that affect the reported amounts of assets and liabilities and the disclosure of contingent assets and liabilities as at the date of the financial statements and the reported amount of revenue and expenses during the reporting periods. Actual results could differ from those estimates. Significant estimates include, but are not limited to, investment tax credits, allowance for doubtful accounts, inventory provisions, inventory valuation, asset impairments, accruals, stock-based compensation, the estimated useful lives and valuation of property, plant and equipment, deferred income taxes, carrying value of intangible assets and goodwill.
Disclosure Controls and Internal Control over Financial Reporting Disclosure controls and procedures (“DC&P”) have been designed to ensure that information required to be disclosed by the Company is accumulated and communicated to the Company’s management as appropriate to allow timely decisions regarding required disclosure. Enablence’s Chief Executive Officer and Chief Financial Officer have concluded, based on their evaluation as of the end of the period covered by the annual filings that the Company’s disclosure controls and procedures (“ICFR”) for the three months ended December 31, 2011 are effective to provide reasonable assurance that material information related to Enablence is made known to them. Following the disposition of the Systems segment, ICFR and DC&P will be adjusted to reflect the modifications to the Company’s reporting requirements. FINANCIAL AND OTHER INSTRUMENTS Enablence's financial instruments consist of cash and cash equivalents, accounts receivable, restricted cash, accounts payable and accrued liabilities, and notes payable. Unless otherwise noted, it is the opinion of Enablence's management that Enablence is not exposed to significant interest, currency or credit risk arising from these financial instruments. The fair value of these financial instruments approximates their carrying value due to their short-term maturity or capacity of prompt liquidation. ADDITIONAL INFORMATION Additional information related to the Company can be found on SEDAR at: www.sedar.com.