
enA imaging: seeing the invisible
13
Johns hopkins ApL TechnicAL DigesT, VoLume 26, number 2 (2005) 143 I enA imaging: seeing the invisible Pontus C. Brandt, Donald G. Mitchell, Edmond C. Roelof, Stamatios M. Krimigis, Christopher P. Paranicas, Barry H. Mauk, Joachim Saur, and Robert DeMajistre n what follows, we describe the technique and history of energetic neutral atom (enA) imaging of space plasma and present recent results from international collabora- tions involving enA imaging experiments as well as results from the imAge mission at earth and the cassini mission at Jupiter and saturn. both imAge and cassini carry ApL-built enA cameras. The henA instrument onboard the imAge mission provides global images of the ring current around the earth and reveals the importance of the electrical coupling between the ring current and the ionosphere. The incA instrument onboard cassini returns enA images from the enormous magnetosphere around saturn, giving unprecedented insight into the dynamics of the hot plasma and its interaction with neutral gas. The review ends with a brief description of enA imaging of the heliospheric boundary and future projects using enA instrumentation. INTRODUCTION encased in the earth’s magnetic field is an enor- mous region filled with trapped electrons and ions with energies ranging from those of the low-energy thermal plasma (on the order of a few electronvolts) to those of the high-energy radiation belts (ranging upward from 100 keV). This region has been termed the mag- netosphere and exists because of the pressure balance between the geomagnetic field and the solar wind, an ever-present flow of magnetized plasma from the sun penetrating the entire solar system. in general, magne- tized bodies such as earth are not the only bodies that interact strongly with the solar wind. The ionospheres of weakly magnetized planets such as Venus and mars set up currents that partially deflect the solar wind flow around the planet. For a more complete review of planetary magnetospheres, see the article by paranicas et al., this issue. Figure 1 summarizes what we know about the struc- ture of the terrestrial magnetosphere. This figure was assembled from decades of research using local mea- surements of charged particles as well as magnetic and electric fields and represents in some sense the average state of the magnetosphere. 1,2 The charged particles in the magnetosphere are guided by magnetic and electric fields. ions and electrons gyrate around magnetic field lines in helical orbits and also move up and down along the field lines in a “bouncing” motion, so that the field lines can be thought of as “flux tubes” filled with plasma. Above the ionosphere and out to a couple of earth radii ( R e ) is the so-called plasmasphere consisting of a cloud
Transcript of enA imaging: seeing the invisible
Johns hopkins ApL TechnicAL DigesT, VoLume 26, number 2 (2005) 143
enA imAging: seeing The inVisibLe
I
enA imaging: seeing the invisible
Pontus C. Brandt, Donald G. Mitchell, Edmond C. Roelof, Stamatios M. Krimigis, Christopher P. Paranicas, Barry H. Mauk, Joachim Saur, and Robert DeMajistre
n what follows, we describe the technique and history of energetic neutral atom (enA) imaging of space plasma and present recent results from international collabora-tions involving enA imaging experiments as well as results from the imAge mission at earth and the cassini mission at Jupiter and saturn. both imAge and cassini carry ApL-built enA cameras. The henA instrument onboard the imAge mission provides global images of the ring current around the earth and reveals the importance of the electrical coupling between the ring current and the ionosphere. The incA instrument onboard cassini returns enA images from the enormous magnetosphere around saturn, giving unprecedented insight into the dynamics of the hot plasma and its interaction with neutral gas. The review ends with a brief description of enA imaging of the heliospheric boundary and future projects using enA instrumentation.
INTRODUCTIONencased in the earth’s magnetic field is an enor-
mous region filled with trapped electrons and ions with energies ranging from those of the low-energy thermal plasma (on the order of a few electronvolts) to those of the high-energy radiation belts (ranging upward from 100 keV). This region has been termed the mag-netosphere and exists because of the pressure balance between the geomagnetic field and the solar wind, an ever-present flow of magnetized plasma from the sun penetrating the entire solar system. in general, magne-tized bodies such as earth are not the only bodies that interact strongly with the solar wind. The ionospheres of weakly magnetized planets such as Venus and mars set up currents that partially deflect the solar wind flow around the planet. For a more complete review of
planetary magnetospheres, see the article by paranicas et al., this issue.
Figure 1 summarizes what we know about the struc-ture of the terrestrial magnetosphere. This figure was assembled from decades of research using local mea-surements of charged particles as well as magnetic and electric fields and represents in some sense the average state of the magnetosphere.1,2 The charged particles in the magnetosphere are guided by magnetic and electric fields. ions and electrons gyrate around magnetic field lines in helical orbits and also move up and down along the field lines in a “bouncing” motion, so that the field lines can be thought of as “flux tubes” filled with plasma. Above the ionosphere and out to a couple of earth radii (Re) is the so-called plasmasphere consisting of a cloud

144 Johns hopkins ApL TechnicAL DigesT, VoLume 26, number 2 (2005)
p. c. brAnDT et al.
of relatively low-energy (a couple of electronvolts) elec-trons and ions. beyond the plasmasphere is the ring cur-rent, the energetic (1 to a few 100 keV) electron and ion distribution that flows from the nightside around the earth. under certain circumstances the ring current can flow out of the dayside magnetopause or circle earth like a ring of plasma. The ring current plasma is fed from the plasmasheet in the tail of the magnetosphere.
imagine what our understanding of the weather would be without imaging satellites looking down at earth, imaging evolving weather systems. We would have only point measurements of wind velocities, precipitation, and pressure. undoubtedly, models of this system would require a complex system of equations with many free parameters and would provide only an average picture of the weather patterns. The same was true for space phys-ics for a long time, before the first auroral imagers yielded an instantaneous global view of the aurora, answering the question of how the aurora changes over the polar regions with changing solar wind conditions. one of the biggest problems still remained: how can we obtain that same global information about the energetic plasma in the entire magnetosphere, far above the aurora?
The most abundant ion species in the magnetosphere are protons. The magnetospheric plasma interacts with the terrestrial magnetic field and the ionosphere, con-stituting a dynamic system that constantly changes in response to the solar wind. unfortunately, there is no way to take a picture of this confined plasma. A proton does not have an electron that can produce a photon, whose detection enables imaging.
ficiently dense to provide a charge exchange medium for the ions in the plasma. During charge exchange, a singly charged energetic ion picks up an electron from a neutral gas atom or molecule of the exosphere or the upper atmosphere, so the ion is thereby neutralized and becomes an enA. since the enA is now neutral, its motion is no longer governed by the magnetic and elec-tric fields. if the enA is sufficiently energetic, it is also unaffected by the gravitational field, so that it propa-gates in a straight trajectory, much like a photon. unlike a photon, however, the enA is a sample of the source population, carrying with it not only spectral informa-tion but also information about the composition of the source plasma. The charge exchange process is illus-trated in Fig. 2. Assuming no further collisions between the charge exchange and the detector, the flux of the enAs at energy E (in units of the number of enAs per unit area per solid angle per unit time per unit energy) can be written as a line-of-sight integral over the ion flux jion and the number density of the cold neutral gas n in which the plasma is submerged, multiplied by the charge exchange cross section s10.
j E j E E denA ion( ) ( , ) ( ) ( ) .= ∫ l l ln s
100
(1)
HISTORYThe first identification of enAs is believed to have
been made by Vegard,6 who correctly interpreted Doppler-shifter Lyman-b emissions from the ground as
Solar wind fl ow
Cusp
Inter planetar y magnetic field
Nightside magnetopause
current
current
Plasm a mantl e
Plasma sheet boundar y la ye r
Magnetotai l lobe
Dayside magnetopause
current Magnetopause
A uroral z one
Plasma-sphere
Ionosphere
Co nv ecting plasm a
Lo w-latitude boundar y la ye r
Cross-tai l current
Central plasma sheet
Field-aligned current
Ring current
Figure 1. The structure of the terrestrial magnetosphere.
however, a decade of research, starting with the interpretation by hovestadt and scholer3 of an observation by krimigis et al.,4 led to the realization that energetic ions trapped in the magnetosphere that are neutralized by charge exchange can escape their entrapment and therefore be detected far from their source. This discovery gave birth to the energetic neutral atom (enA) imaging technique,5 which today has provided unprecedented insight into the global plasma dynamics, not only at earth but also at Jupiter, saturn, Titan, and mars.
ENA PRODUCTIONmost planets, including earth,
are surrounded by a distribution of cold neutral gas known as the exosphere, which can be thought of as the extension of the upper atmosphere. This neutral gas is suf-
Johns hopkins ApL TechnicAL DigesT, VoLume 26, number 2 (2005) 145
enA imAging: seeing The inVisibLe
fast, neutral hydrogen bombarding earth’s upper atmo-sphere.7 however, the discoveries leading to the con-struction of the first enA image5 started with a series of key observations of enAs escaping planetary mag-netospheres. krimigis et al.4 reported an observation from imp-7 and -8 (positioned outside earth’s magneto-sphere) of particles coming from the direction of earth. The initial interpretation led them to believe that these were charged particles escaping the terrestrial magneto-sphere. Just a couple of years earlier, the equatorial, low-altitude satellite Azur had detected neutral atoms pre-cipitating onto earth’s upper atmosphere.8,9 With these two key observations in mind, hovestadt and scholer3 realized that it was enAs, not charged particles, that were being emitted from the earth’s magnetosphere. soon thereafter, observations by Voyager-1 at Jupiter and saturn, in search of auroral X-rays, showed similar signatures of escaping radiation, but the explanation as escaping enAs was favored because of spectral shape and intensity.10,11
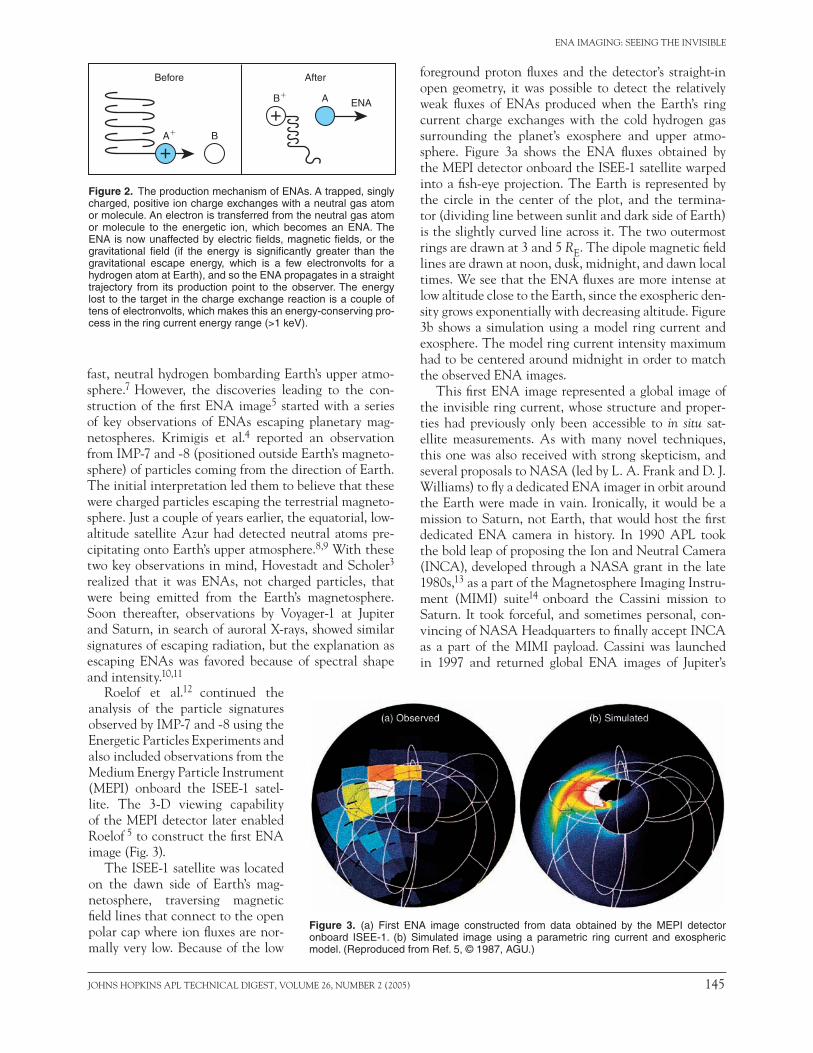
foreground proton fluxes and the detector’s straight-in open geometry, it was possible to detect the relatively weak fluxes of enAs produced when the earth’s ring current charge exchanges with the cold hydrogen gas surrounding the planet’s exosphere and upper atmo-sphere. Figure 3a shows the enA fluxes obtained by the mepi detector onboard the isee-1 satellite warped into a fish-eye projection. The earth is represented by the circle in the center of the plot, and the termina-tor (dividing line between sunlit and dark side of earth) is the slightly curved line across it. The two outermost rings are drawn at 3 and 5 Re. The dipole magnetic field lines are drawn at noon, dusk, midnight, and dawn local times. We see that the enA fluxes are more intense at low altitude close to the earth, since the exospheric den-sity grows exponentially with decreasing altitude. Figure 3b shows a simulation using a model ring current and exosphere. The model ring current intensity maximum had to be centered around midnight in order to match the observed enA images.
This first enA image represented a global image of the invisible ring current, whose structure and proper-ties had previously only been accessible to in situ sat-ellite measurements. As with many novel techniques, this one was also received with strong skepticism, and several proposals to nAsA (led by L. A. Frank and D. J. Williams) to fly a dedicated enA imager in orbit around the earth were made in vain. ironically, it would be a mission to saturn, not earth, that would host the first dedicated enA camera in history. in 1990 ApL took the bold leap of proposing the ion and neutral camera (incA), developed through a nAsA grant in the late 1980s,13 as a part of the magnetosphere imaging instru-ment (mimi) suite14 onboard the cassini mission to saturn. it took forceful, and sometimes personal, con-vincing of nAsA headquarters to finally accept incA as a part of the mimi payload. cassini was launched in 1997 and returned global enA images of Jupiter’s
Before
ENA
A� B
B� A
After
+
+
Figure 2. The production mechanism of ENAs. A trapped, singly charged, positive ion charge exchanges with a neutral gas atom or molecule. An electron is transferred from the neutral gas atom or molecule to the energetic ion, which becomes an ENA. The ENA is now unaffected by electric fields, magnetic fields, or the gravitational field (if the energy is significantly greater than the gravitational escape energy, which is a few electronvolts for a hydrogen atom at Earth), and so the ENA propagates in a straight trajectory from its production point to the observer. The energy lost to the target in the charge exchange reaction is a couple of tens of electronvolts, which makes this an energy-conserving pro-cess in the ring current energy range (>1 keV).
Figure 3. (a) First ENA image constructed from data obtained by the MEPI detector onboard ISEE-1. (b) Simulated image using a parametric ring current and exospheric model. (Reproduced from Ref. 5, © 1987, AGU.)
roelof et al.12 continued the analysis of the particle signatures observed by imp-7 and -8 using the energetic particles experiments and also included observations from the medium energy particle instrument (mepi) onboard the isee-1 satel-lite. The 3-D viewing capability of the mepi detector later enabled roelof 5 to construct the first enA image (Fig. 3).
The isee-1 satellite was located on the dawn side of earth’s mag-netosphere, traversing magnetic field lines that connect to the open polar cap where ion fluxes are nor-mally very low. because of the low
146 Johns hopkins ApL TechnicAL DigesT, VoLume 26, number 2 (2005)
p. c. brAnDT et al.
magnetosphere in 2000,15,16 and also produced an image of earth’s ring current during cassini’s flyby in 1997.14
The satellite was captured in orbit around saturn in July 2004, and the incA images have immediately revealed a magnetosphere that is far more dynamic than previ-ously anticipated (see more below).
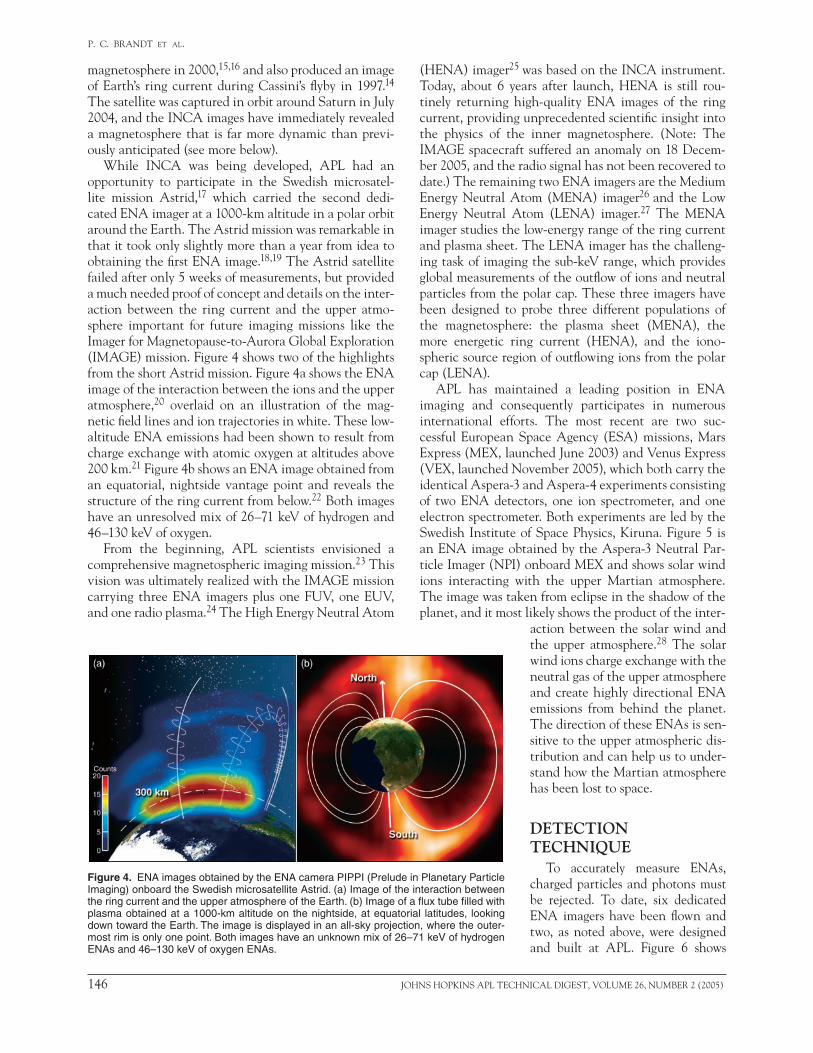
While incA was being developed, ApL had an opportunity to participate in the swedish microsatel-lite mission Astrid,17 which carried the second dedi-cated enA imager at a 1000-km altitude in a polar orbit around the earth. The Astrid mission was remarkable in that it took only slightly more than a year from idea to obtaining the first enA image.18,19 The Astrid satellite failed after only 5 weeks of measurements, but provided a much needed proof of concept and details on the inter-action between the ring current and the upper atmo-sphere important for future imaging missions like the imager for magnetopause-to-Aurora global exploration (imAge) mission. Figure 4 shows two of the highlights from the short Astrid mission. Figure 4a shows the enA image of the interaction between the ions and the upper atmosphere,20 overlaid on an illustration of the mag-netic field lines and ion trajectories in white. These low-altitude enA emissions had been shown to result from charge exchange with atomic oxygen at altitudes above 200 km.21 Figure 4b shows an enA image obtained from an equatorial, nightside vantage point and reveals the structure of the ring current from below.22 both images have an unresolved mix of 26–71 keV of hydrogen and 46–130 keV of oxygen.
From the beginning, ApL scientists envisioned a comprehensive magnetospheric imaging mission.23 This vision was ultimately realized with the imAge mission carrying three enA imagers plus one FuV, one euV, and one radio plasma.24 The high energy neutral Atom
(henA) imager25 was based on the incA instrument. Today, about 6 years after launch, henA is still rou-tinely returning high-quality enA images of the ring current, providing unprecedented scientific insight into the physics of the inner magnetosphere. (note: The imAge spacecraft suffered an anomaly on 18 Decem-ber 2005, and the radio signal has not been recovered to date.) The remaining two enA imagers are the medium energy neutral Atom (menA) imager26 and the Low energy neutral Atom (LenA) imager.27 The menA imager studies the low-energy range of the ring current and plasma sheet. The LenA imager has the challeng-ing task of imaging the sub-keV range, which provides global measurements of the outflow of ions and neutral particles from the polar cap. These three imagers have been designed to probe three different populations of the magnetosphere: the plasma sheet (menA), the more energetic ring current (henA), and the iono-spheric source region of outflowing ions from the polar cap (LenA).
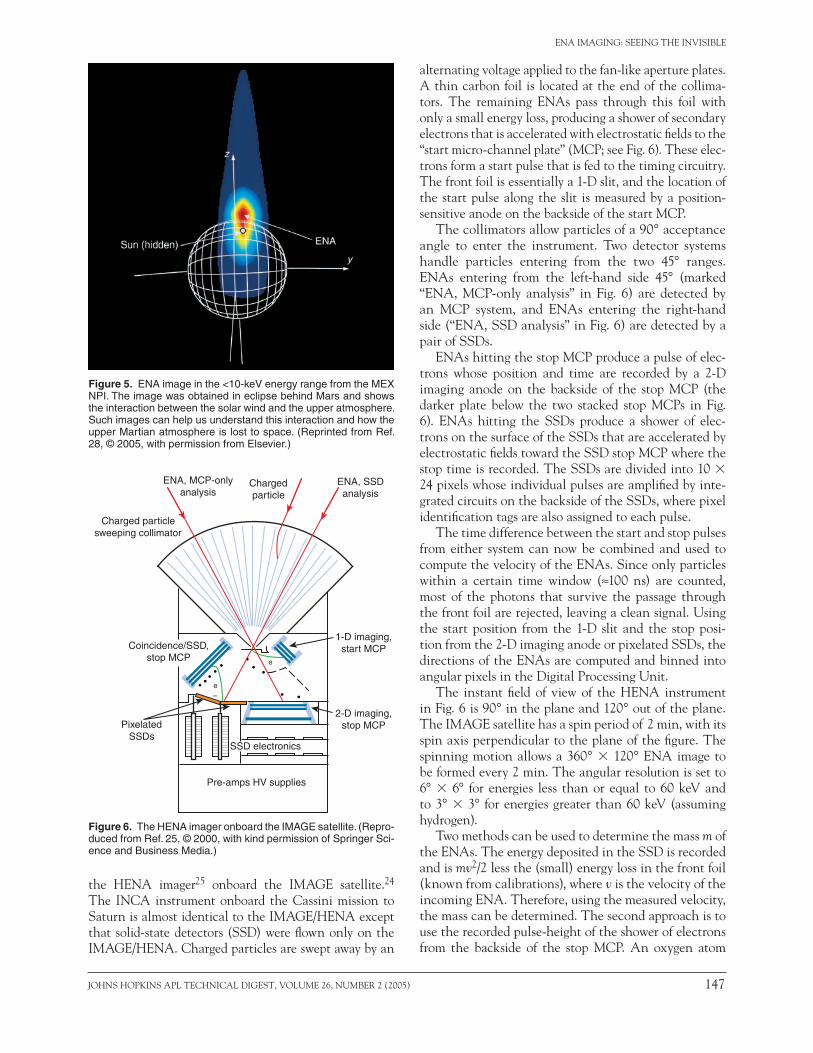
ApL has maintained a leading position in enA imaging and consequently participates in numerous international efforts. The most recent are two suc-cessful european space Agency (esA) missions, mars express (meX, launched June 2003) and Venus express (VeX, launched november 2005), which both carry the identical Aspera-3 and Aspera-4 experiments consisting of two enA detectors, one ion spectrometer, and one electron spectrometer. both experiments are led by the swedish institute of space physics, kiruna. Figure 5 is an enA image obtained by the Aspera-3 neutral par-ticle imager (npi) onboard meX and shows solar wind ions interacting with the upper martian atmosphere. The image was taken from eclipse in the shadow of the planet, and it most likely shows the product of the inter-
Figure 4. ENA images obtained by the ENA camera PIPPI (Prelude in Planetary Particle Imaging) onboard the Swedish microsatellite Astrid. (a) Image of the interaction between the ring current and the upper atmosphere of the Earth. (b) Image of a flux tube filled with plasma obtained at a 1000-km altitude on the nightside, at equatorial latitudes, looking down toward the Earth. The image is displayed in an all-sky projection, where the outer-most rim is only one point. Both images have an unknown mix of 26–71 keV of hydrogen ENAs and 46–130 keV of oxygen ENAs.
action between the solar wind and the upper atmosphere.28 The solar wind ions charge exchange with the neutral gas of the upper atmosphere and create highly directional enA emissions from behind the planet. The direction of these enAs is sen-sitive to the upper atmospheric dis-tribution and can help us to under-stand how the martian atmosphere has been lost to space.
DETECTION TECHNIQUE
To accurately measure enAs, charged particles and photons must be rejected. To date, six dedicated enA imagers have been flown and two, as noted above, were designed and built at ApL. Figure 6 shows
Johns hopkins ApL TechnicAL DigesT, VoLume 26, number 2 (2005) 147
enA imAging: seeing The inVisibLe
the henA imager25 onboard the imAge satellite.24 The incA instrument onboard the cassini mission to saturn is almost identical to the imAge/henA except that solid-state detectors (ssD) were flown only on the imAge/henA. charged particles are swept away by an
alternating voltage applied to the fan-like aperture plates. A thin carbon foil is located at the end of the collima-tors. The remaining enAs pass through this foil with only a small energy loss, producing a shower of secondary electrons that is accelerated with electrostatic fields to the “start micro-channel plate” (mcp; see Fig. 6). These elec-trons form a start pulse that is fed to the timing circuitry. The front foil is essentially a 1-D slit, and the location of the start pulse along the slit is measured by a position-sensitive anode on the backside of the start mcp.
The collimators allow particles of a 90° acceptance angle to enter the instrument. Two detector systems handle particles entering from the two 45° ranges. enAs entering from the left-hand side 45° (marked “enA, mcp-only analysis” in Fig. 6) are detected by an mcp system, and enAs entering the right-hand side (“enA, ssD analysis” in Fig. 6) are detected by a pair of ssDs.
enAs hitting the stop mcp produce a pulse of elec-trons whose position and time are recorded by a 2-D imaging anode on the backside of the stop mcp (the darker plate below the two stacked stop mcps in Fig. 6). enAs hitting the ssDs produce a shower of elec-trons on the surface of the ssDs that are accelerated by electrostatic fields toward the ssD stop mcp where the stop time is recorded. The ssDs are divided into 10 3 24 pixels whose individual pulses are amplified by inte-grated circuits on the backside of the ssDs, where pixel identification tags are also assigned to each pulse.
The time difference between the start and stop pulses from either system can now be combined and used to compute the velocity of the enAs. since only particles within a certain time window (≈100 ns) are counted, most of the photons that survive the passage through the front foil are rejected, leaving a clean signal. using the start position from the 1-D slit and the stop posi-tion from the 2-D imaging anode or pixelated ssDs, the directions of the enAs are computed and binned into angular pixels in the Digital processing unit.
The instant field of view of the henA instrument in Fig. 6 is 90° in the plane and 120° out of the plane. The imAge satellite has a spin period of 2 min, with its spin axis perpendicular to the plane of the figure. The spinning motion allows a 360° 3 120° enA image to be formed every 2 min. The angular resolution is set to 6° 3 6° for energies less than or equal to 60 keV and to 3° 3 3° for energies greater than 60 keV (assuming hydrogen).
Two methods can be used to determine the mass m of the enAs. The energy deposited in the ssD is recorded and is mv2/2 less the (small) energy loss in the front foil (known from calibrations), where v is the velocity of the incoming enA. Therefore, using the measured velocity, the mass can be determined. The second approach is to use the recorded pulse-height of the shower of electrons from the backside of the stop mcp. An oxygen atom
Figure 5. ENA image in the <10-keV energy range from the MEX NPI. The image was obtained in eclipse behind Mars and shows the interaction between the solar wind and the upper atmosphere. Such images can help us understand this interaction and how the upper Martian atmosphere is lost to space. (Reprinted from Ref. 28, © 2005, with permission from Elsevier.)
Figure 6. The HENA imager onboard the IMAGE satellite. (Repro-duced from Ref. 25, © 2000, with kind permission of Springer Sci-ence and Business Media.)
ENA, MCP-only analysis
Charged particle
ENA, SSD analysis
Charged particle sweeping collimator
Coincidence/SSD,stop MCP e
e –
–
Pixelated SSDs
SSD electronics
Pre-amps HV supplies
2-D imaging,stop MCP
1-D imaging,start MCP
148 Johns hopkins ApL TechnicAL DigesT, VoLume 26, number 2 (2005)
p. c. brAnDT et al.
hitting the stop mcp produces a pulse that is several times higher than one for a hydrogen atom. This second technique has been applied to both the henA and incA instrument designs.
ENA IMAGING
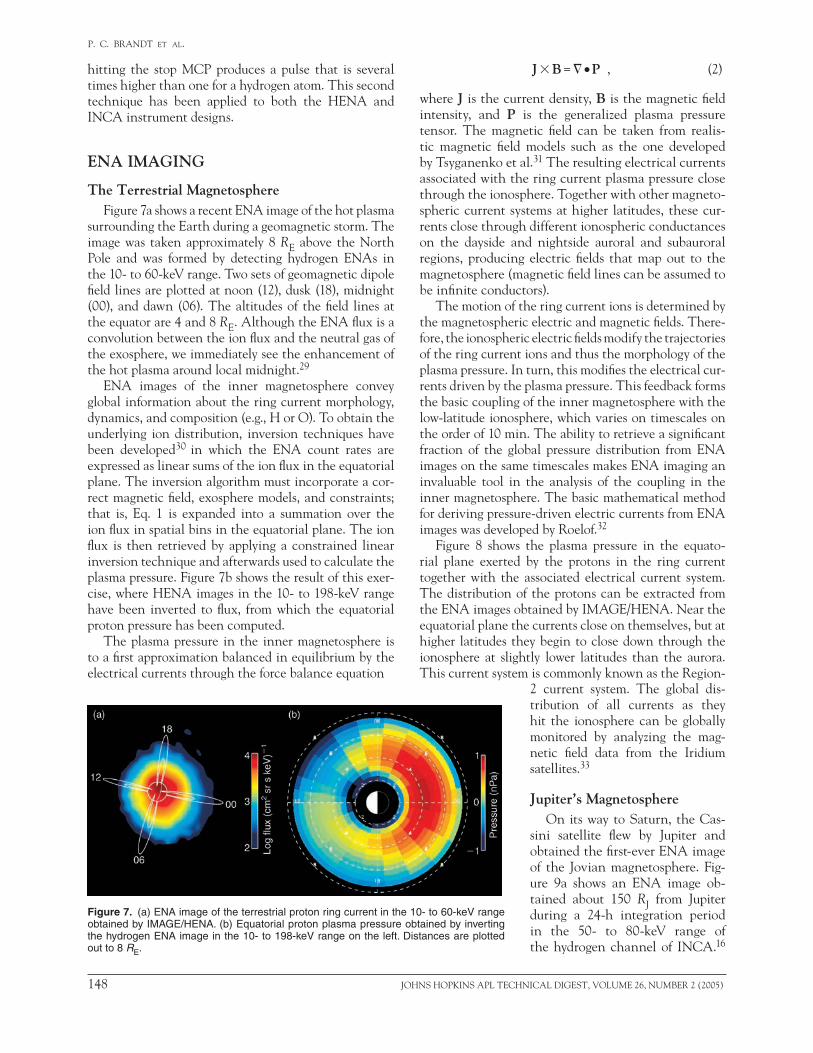
The Terrestrial MagnetosphereFigure 7a shows a recent enA image of the hot plasma
surrounding the earth during a geomagnetic storm. The image was taken approximately 8 R e above the north pole and was formed by detecting hydrogen enAs in the 10- to 60-keV range. Two sets of geomagnetic dipole field lines are plotted at noon (12), dusk (18), midnight (00), and dawn (06). The altitudes of the field lines at the equator are 4 and 8 Re. Although the enA flux is a convolution between the ion flux and the neutral gas of the exosphere, we immediately see the enhancement of the hot plasma around local midnight.29
enA images of the inner magnetosphere convey global information about the ring current morphology, dynamics, and composition (e.g., h or o). To obtain the underlying ion distribution, inversion techniques have been developed30 in which the enA count rates are expressed as linear sums of the ion flux in the equatorial plane. The inversion algorithm must incorporate a cor-rect magnetic field, exosphere models, and constraints; that is, eq. 1 is expanded into a summation over the ion flux in spatial bins in the equatorial plane. The ion flux is then retrieved by applying a constrained linear inversion technique and afterwards used to calculate the plasma pressure. Figure 7b shows the result of this exer-cise, where henA images in the 10- to 198-keV range have been inverted to flux, from which the equatorial proton pressure has been computed.
The plasma pressure in the inner magnetosphere is to a first approximation balanced in equilibrium by the electrical currents through the force balance equation
J 3 B = = • P , (2)
where J is the current density, B is the magnetic field intensity, and P is the generalized plasma pressure tensor. The magnetic field can be taken from realis-tic magnetic field models such as the one developed by Tsyganenko et al.31 The resulting electrical currents associated with the ring current plasma pressure close through the ionosphere. Together with other magneto-spheric current systems at higher latitudes, these cur-rents close through different ionospheric conductances on the dayside and nightside auroral and subauroral regions, producing electric fields that map out to the magnetosphere (magnetic field lines can be assumed to be infinite conductors).
The motion of the ring current ions is determined by the magnetospheric electric and magnetic fields. There-fore, the ionospheric electric fields modify the trajectories of the ring current ions and thus the morphology of the plasma pressure. in turn, this modifies the electrical cur-rents driven by the plasma pressure. This feedback forms the basic coupling of the inner magnetosphere with the low-latitude ionosphere, which varies on timescales on the order of 10 min. The ability to retrieve a significant fraction of the global pressure distribution from enA images on the same timescales makes enA imaging an invaluable tool in the analysis of the coupling in the inner magnetosphere. The basic mathematical method for deriving pressure-driven electric currents from enA images was developed by roelof.32
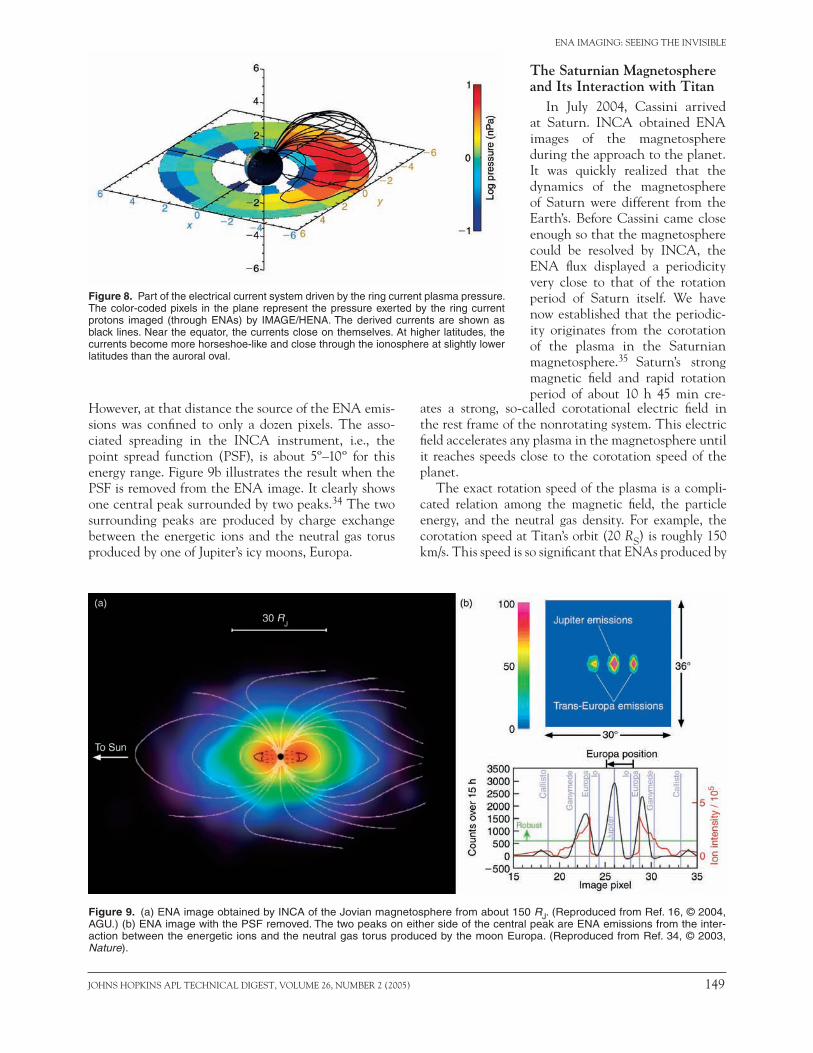
Figure 8 shows the plasma pressure in the equato-rial plane exerted by the protons in the ring current together with the associated electrical current system. The distribution of the protons can be extracted from the enA images obtained by imAge/henA. near the equatorial plane the currents close on themselves, but at higher latitudes they begin to close down through the ionosphere at slightly lower latitudes than the aurora. This current system is commonly known as the region-
Figure 7. (a) ENA image of the terrestrial proton ring current in the 10- to 60-keV range obtained by IMAGE/HENA. (b) Equatorial proton plasma pressure obtained by inverting the hydrogen ENA image in the 10- to 198-keV range on the left. Distances are plotted out to 8 RE.
2 current system. The global dis-tribution of all currents as they hit the ionosphere can be globally monitored by analyzing the mag-netic field data from the iridium satellites.33
Jupiter’s Magnetosphereon its way to saturn, the cas-
sini satellite flew by Jupiter and obtained the first-ever enA image of the Jovian magnetosphere. Fig- ure 9a shows an enA image ob-tained about 150 RJ from Jupiter during a 24-h integration period in the 50- to 80-keV range of the hydrogen channel of incA.16
Johns hopkins ApL TechnicAL DigesT, VoLume 26, number 2 (2005) 149
enA imAging: seeing The inVisibLe
however, at that distance the source of the enA emis-sions was confined to only a dozen pixels. The asso-ciated spreading in the incA instrument, i.e., the point spread function (psF), is about 5º–10º for this energy range. Figure 9b illustrates the result when the psF is removed from the enA image. it clearly shows one central peak surrounded by two peaks.34 The two surrounding peaks are produced by charge exchange between the energetic ions and the neutral gas torus produced by one of Jupiter’s icy moons, europa.
The Saturnian Magnetosphere and Its Interaction with Titan
in July 2004, cassini arrived at saturn. incA obtained enA images of the magnetosphere during the approach to the planet. it was quickly realized that the dynamics of the magnetosphere of saturn were different from the earth’s. before cassini came close enough so that the magnetosphere could be resolved by incA, the enA flux displayed a periodicity very close to that of the rotation period of saturn itself. We have now established that the periodic-ity originates from the corotation of the plasma in the saturnian magnetosphere.35 saturn’s strong magnetic field and rapid rotation period of about 10 h 45 min cre-
Figure 8. Part of the electrical current system driven by the ring current plasma pressure. The color-coded pixels in the plane represent the pressure exerted by the ring current protons imaged (through ENAs) by IMAGE/HENA. The derived currents are shown as black lines. Near the equator, the currents close on themselves. At higher latitudes, the currents become more horseshoe-like and close through the ionosphere at slightly lower latitudes than the auroral oval.
Figure 9. (a) ENA image obtained by INCA of the Jovian magnetosphere from about 150 RJ. (Reproduced from Ref. 16, © 2004, AGU.) (b) ENA image with the PSF removed. The two peaks on either side of the central peak are ENA emissions from the inter-action between the energetic ions and the neutral gas torus produced by the moon Europa. (Reproduced from Ref. 34, © 2003, Nature).
ates a strong, so-called corotational electric field in the rest frame of the nonrotating system. This electric field accelerates any plasma in the magnetosphere until it reaches speeds close to the corotation speed of the planet.
The exact rotation speed of the plasma is a compli-cated relation among the magnetic field, the particle energy, and the neutral gas density. For example, the corotation speed at Titan’s orbit (20 Rs) is roughly 150 km/s. This speed is so significant that enAs produced by
150 Johns hopkins ApL TechnicAL DigesT, VoLume 26, number 2 (2005)
p. c. brAnDT et al.
ions with a bulk flow velocity toward cassini will have almost a 10-keV higher energy when they are detected by incA. enAs produced by ions with a bulk flow away from cassini will have lower energies when detected by incA. With a sloping energy spectrum, the result is therefore an increase in enA intensity produced from ions moving toward the detector and a decrease of enA intensity from ions moving away from the detector.36 This variation is known as the compton-getting effect.
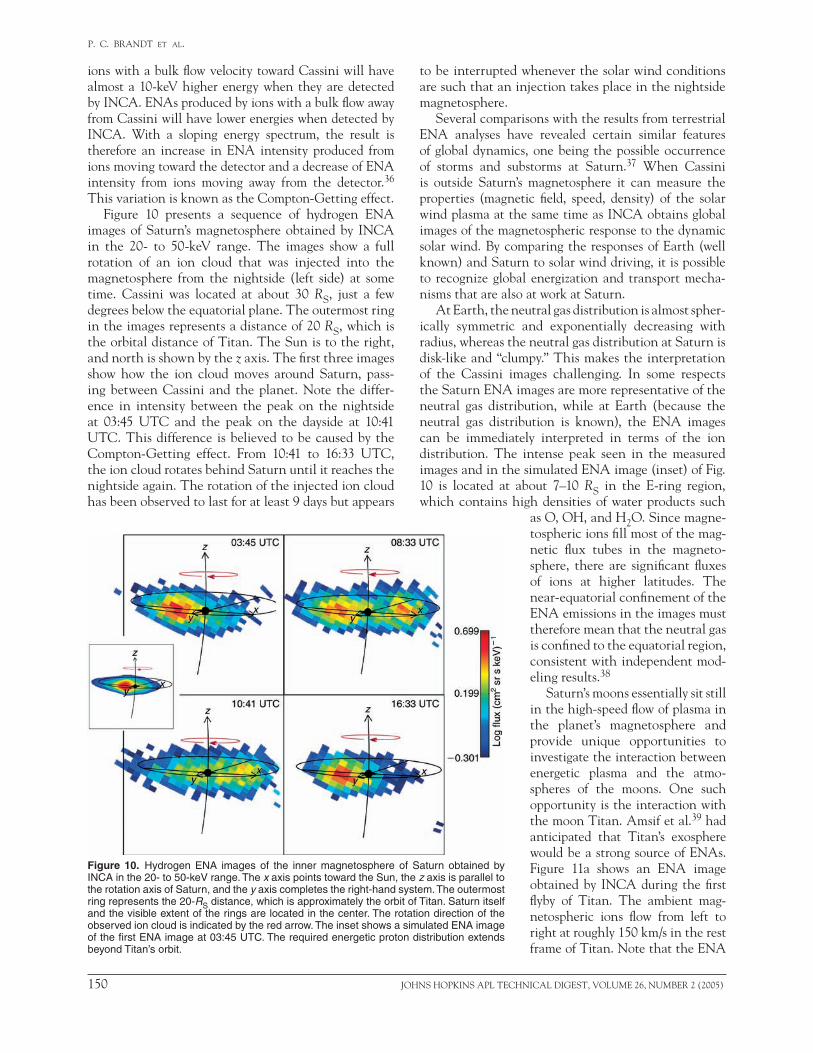
Figure 10 presents a sequence of hydrogen enA images of saturn’s magnetosphere obtained by incA in the 20- to 50-keV range. The images show a full rotation of an ion cloud that was injected into the magnetosphere from the nightside (left side) at some time. cassini was located at about 30 Rs, just a few degrees below the equatorial plane. The outermost ring in the images represents a distance of 20 Rs, which is the orbital distance of Titan. The sun is to the right, and north is shown by the z axis. The first three images show how the ion cloud moves around saturn, pass-ing between cassini and the planet. note the differ-ence in intensity between the peak on the nightside at 03:45 uTc and the peak on the dayside at 10:41 uTc. This difference is believed to be caused by the compton-getting effect. From 10:41 to 16:33 uTc, the ion cloud rotates behind saturn until it reaches the nightside again. The rotation of the injected ion cloud has been observed to last for at least 9 days but appears
to be interrupted whenever the solar wind conditions are such that an injection takes place in the nightside magnetosphere.
several comparisons with the results from terrestrial enA analyses have revealed certain similar features of global dynamics, one being the possible occurrence of storms and substorms at saturn.37 When cassini is outside saturn’s magnetosphere it can measure the properties (magnetic field, speed, density) of the solar wind plasma at the same time as incA obtains global images of the magnetospheric response to the dynamic solar wind. by comparing the responses of earth (well known) and saturn to solar wind driving, it is possible to recognize global energization and transport mecha-nisms that are also at work at saturn.
At earth, the neutral gas distribution is almost spher-ically symmetric and exponentially decreasing with radius, whereas the neutral gas distribution at saturn is disk-like and “clumpy.” This makes the interpretation of the cassini images challenging. in some respects the saturn enA images are more representative of the neutral gas distribution, while at earth (because the neutral gas distribution is known), the enA images can be immediately interpreted in terms of the ion distribution. The intense peak seen in the measured images and in the simulated enA image (inset) of Fig. 10 is located at about 7–10 Rs in the e-ring region, which contains high densities of water products such
Figure 10. Hydrogen ENA images of the inner magnetosphere of Saturn obtained by INCA in the 20- to 50-keV range. The x axis points toward the Sun, the z axis is parallel to the rotation axis of Saturn, and the y axis completes the right-hand system. The outermost ring represents the 20-RS distance, which is approximately the orbit of Titan. Saturn itself and the visible extent of the rings are located in the center. The rotation direction of the observed ion cloud is indicated by the red arrow. The inset shows a simulated ENA image of the first ENA image at 03:45 UTC. The required energetic proton distribution extends beyond Titan’s orbit.
as o, oh, and h2o. since magne-tospheric ions fill most of the mag-netic flux tubes in the magneto-sphere, there are significant fluxes of ions at higher latitudes. The near-equatorial confinement of the enA emissions in the images must therefore mean that the neutral gas is confined to the equatorial region, consistent with independent mod-eling results.38
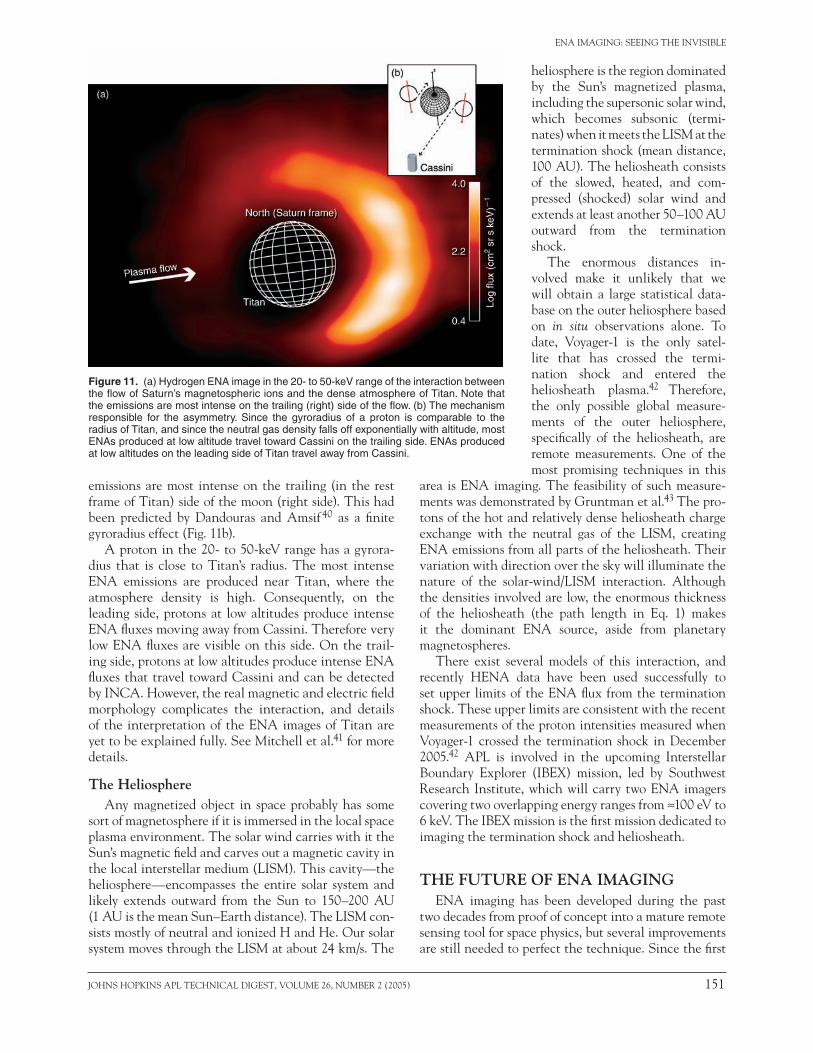
saturn’s moons essentially sit still in the high-speed flow of plasma in the planet’s magnetosphere and provide unique opportunities to investigate the interaction between energetic plasma and the atmo-spheres of the moons. one such opportunity is the interaction with the moon Titan. Amsif et al.39 had anticipated that Titan’s exosphere would be a strong source of enAs. Figure 11a shows an enA image obtained by incA during the first flyby of Titan. The ambient mag-netospheric ions flow from left to right at roughly 150 km/s in the rest frame of Titan. note that the enA
Johns hopkins ApL TechnicAL DigesT, VoLume 26, number 2 (2005) 151
enA imAging: seeing The inVisibLe
emissions are most intense on the trailing (in the rest frame of Titan) side of the moon (right side). This had been predicted by Dandouras and Amsif 40 as a finite gyroradius effect (Fig. 11b).
A proton in the 20- to 50-keV range has a gyrora-dius that is close to Titan’s radius. The most intense enA emissions are produced near Titan, where the atmosphere density is high. consequently, on the leading side, protons at low altitudes produce intense enA fluxes moving away from cassini. Therefore very low enA fluxes are visible on this side. on the trail-ing side, protons at low altitudes produce intense enA fluxes that travel toward cassini and can be detected by incA. however, the real magnetic and electric field morphology complicates the interaction, and details of the interpretation of the enA images of Titan are yet to be explained fully. see mitchell et al.41 for more details.
The Heliosphere Any magnetized object in space probably has some
sort of magnetosphere if it is immersed in the local space plasma environment. The solar wind carries with it the sun’s magnetic field and carves out a magnetic cavity in the local interstellar medium (Lism). This cavity—the heliosphere—encompasses the entire solar system and likely extends outward from the sun to 150–200 Au (1 Au is the mean sun–earth distance). The Lism con-sists mostly of neutral and ionized h and he. our solar system moves through the Lism at about 24 km/s. The
Figure 11. (a) Hydrogen ENA image in the 20- to 50-keV range of the interaction between the flow of Saturn’s magnetospheric ions and the dense atmosphere of Titan. Note that the emissions are most intense on the trailing (right) side of the flow. (b) The mechanism responsible for the asymmetry. Since the gyroradius of a proton is comparable to the radius of Titan, and since the neutral gas density falls off exponentially with altitude, most ENAs produced at low altitude travel toward Cassini on the trailing side. ENAs produced at low altitudes on the leading side of Titan travel away from Cassini.
heliosphere is the region dominated by the sun’s magnetized plasma, including the supersonic solar wind, which becomes subsonic (termi-nates) when it meets the Lism at the termination shock (mean distance, 100 Au). The heliosheath consists of the slowed, heated, and com-pressed (shocked) solar wind and extends at least another 50–100 Au outward from the termination shock.
The enormous distances in-volved make it unlikely that we will obtain a large statistical data-base on the outer heliosphere based on in situ observations alone. To date, Voyager-1 is the only satel-lite that has crossed the termi-nation shock and entered the heliosheath plasma.42 Therefore, the only possible global measure-ments of the outer heliosphere, specifically of the heliosheath, are remote measurements. one of the most promising techniques in this
area is enA imaging. The feasibility of such measure-ments was demonstrated by gruntman et al.43 The pro-tons of the hot and relatively dense heliosheath charge exchange with the neutral gas of the Lism, creating enA emissions from all parts of the heliosheath. Their variation with direction over the sky will illuminate the nature of the solar-wind/Lism interaction. Although the densities involved are low, the enormous thickness of the heliosheath (the path length in eq. 1) makes it the dominant enA source, aside from planetary magnetospheres.
There exist several models of this interaction, and recently henA data have been used successfully to set upper limits of the enA flux from the termination shock. These upper limits are consistent with the recent measurements of the proton intensities measured when Voyager-1 crossed the termination shock in December 2005.42 ApL is involved in the upcoming interstellar boundary explorer (ibeX) mission, led by southwest research institute, which will carry two enA imagers covering two overlapping energy ranges from ≈100 eV to 6 keV. The ibeX mission is the first mission dedicated to imaging the termination shock and heliosheath.
THE FUTURE OF ENA IMAGINGenA imaging has been developed during the past
two decades from proof of concept into a mature remote sensing tool for space physics, but several improvements are still needed to perfect the technique. since the first
152 Johns hopkins ApL TechnicAL DigesT, VoLume 26, number 2 (2005)
p. c. brAnDT et al.
enA image, the angular resolution has decreased to just a few degrees, and hydrogen can be imaged separately from oxygen. one challenge is to expand the currently achievable energy range to approximately 500 keV, which should be available in about 5 years. This energy range covers most of the plasma pressure of the inner magnetosphere as well as a fraction of the higher-energy radiation belts (>300 keV). Therefore, this energy range is highly desirable for terrestrial enA imagers.
While many enA cameras are focused on the high-energy range, a few have taken on the challenge of imag-ing in the sub-keV range. because of the low velocity of sub-keV enAs, the techniques used to image low- and high-energy particles are completely different. imaging low-energy particles relies on converting the incident neutral particles to ions by allowing them to interact with a surface. The ions can then be analyzed by an ion spectrometer. sub-keV enA imaging has enabled the imAge/LenA instrument to study the ion out-flow from the earth’s polar regions. The enA detectors onboard the meX return data in the sub-keV range to study the atmospheric loss of mars. in April 2006, the almost identical experiment Aspera-4 (ApL as co-i) onboard the esA mission VeX will start returning simi-lar data from Venus.
sub-keV measurements will be essential for imag-ing the magnetosphere of mercury. The search for exospheric refilling and emitted natural Abundances (serenA) experiment (with ApL as a co-i) onboard the esA bepi-colombo mission will carry enA detec-tors in the 100-eV to 10-keV range. The magnetic field of mercury is weaker than that of earth, so the mag-netosphere is much smaller in relation to the planet. consequently, a trapped ring current and radiation belt region would be below the surface of mercury; that is, stably trapped ions or electrons at mercury are not likely. The short spatial scale also places limits on the accelera-tion of charged particles that can occur. in the terres-trial magnetosphere, meV particles are not uncommon, but mercury is unlikely to be capable of accelerating particles to more than a few tens of keV.
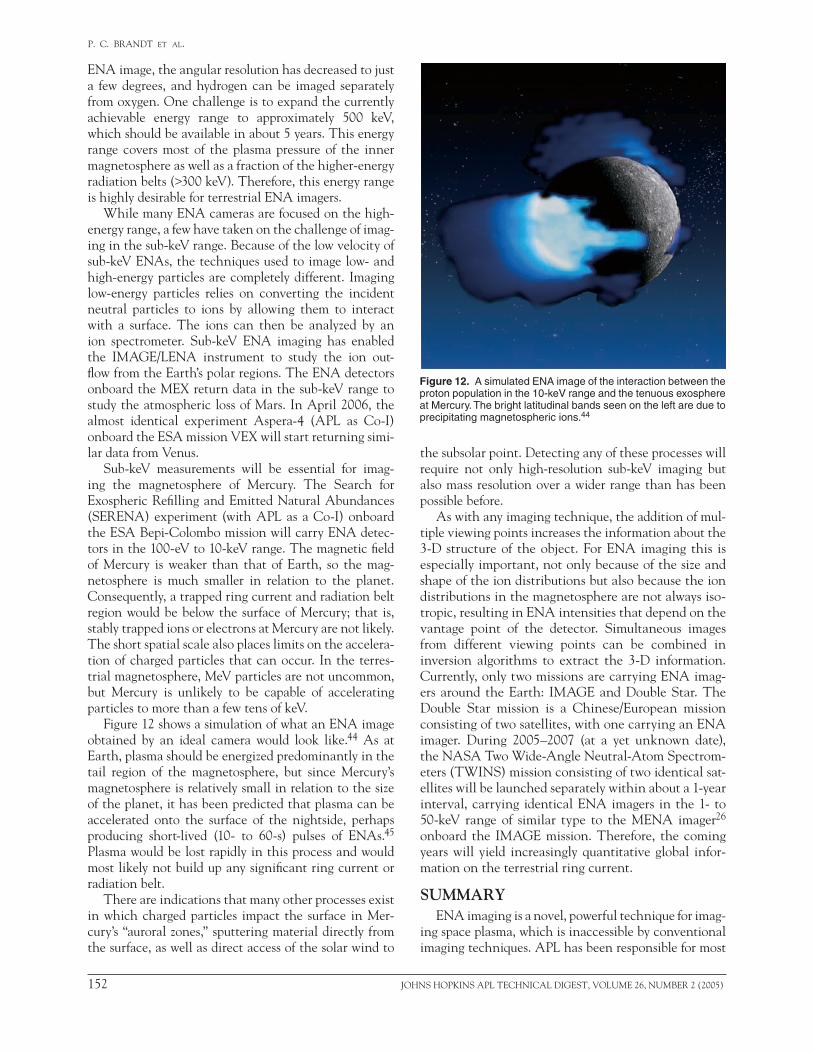
Figure 12 shows a simulation of what an enA image obtained by an ideal camera would look like.44 As at earth, plasma should be energized predominantly in the tail region of the magnetosphere, but since mercury’s magnetosphere is relatively small in relation to the size of the planet, it has been predicted that plasma can be accelerated onto the surface of the nightside, perhaps producing short-lived (10- to 60-s) pulses of enAs.45 plasma would be lost rapidly in this process and would most likely not build up any significant ring current or radiation belt.
There are indications that many other processes exist in which charged particles impact the surface in mer-cury’s “auroral zones,” sputtering material directly from the surface, as well as direct access of the solar wind to
Figure 12. A simulated ENA image of the interaction between the proton population in the 10-keV range and the tenuous exosphere at Mercury. The bright latitudinal bands seen on the left are due to precipitating magnetospheric ions.44
the subsolar point. Detecting any of these processes will require not only high-resolution sub-keV imaging but also mass resolution over a wider range than has been possible before.
As with any imaging technique, the addition of mul-tiple viewing points increases the information about the 3-D structure of the object. For enA imaging this is especially important, not only because of the size and shape of the ion distributions but also because the ion distributions in the magnetosphere are not always iso-tropic, resulting in enA intensities that depend on the vantage point of the detector. simultaneous images from different viewing points can be combined in inversion algorithms to extract the 3-D information. currently, only two missions are carrying enA imag-ers around the earth: imAge and Double star. The Double star mission is a chinese/european mission consisting of two satellites, with one carrying an enA imager. During 2005–2007 (at a yet unknown date), the nAsA Two Wide-Angle neutral-Atom spectrom-eters (TWins) mission consisting of two identical sat-ellites will be launched separately within about a 1-year interval, carrying identical enA imagers in the 1- to 50-keV range of similar type to the menA imager26
onboard the imAge mission. Therefore, the coming years will yield increasingly quantitative global infor-mation on the terrestrial ring current.
SUMMARYenA imaging is a novel, powerful technique for imag-
ing space plasma, which is inaccessible by conventional imaging techniques. ApL has been responsible for most
Johns hopkins ApL TechnicAL DigesT, VoLume 26, number 2 (2005) 153
enA imAging: seeing The inVisibLe
of the development and discovery of enA imaging. Today ApL leads two enA imaging experiments, one in orbit around earth (on the imAge mission) and the other in orbit around saturn (on the cassini mission). ApL participates in national and international col-laborations involving enA imaging experiments such as TWins, meX, VeX, ibeX, and bepi-colombo. We have shown how the imAge/henA camera can obtain snapshots (≈10 min) of the global plasma pressure distri-bution of the inner magnetosphere, which allows us to understand the dynamics of the ring current and how the magnetosphere connects to the ionosphere on a global scale.
The incA/enA imager orbiting saturn has revealed a huge magnetosphere that includes injections of ener-getic ion clouds rotating with the planet and interact-ing with its moons and their atmospheres. enA imag-ing is also one of the few methods to remotely explore the boundaries of the heliosphere, where enAs are produced when shocked solar wind ions interact with the interstellar medium. The ibeX mission to image the boundaries of the entire heliosphere is a nAsA mission currently in preparation by southwest research insti-tute and ApL.
AcknoWLeDgmenTs: The cassini/mimi program at ApL is supported by the nAsA office of space sci-ence under Task order 003 of contract nAs5-97271 between the nAsA goddard space Flight center and The Johns hopkins university. The imAge/henA program is supported by nAsA contract nAs5-96020 through a subcontract with the southwest research institute, Texas.
reFerences 1mitchell, D. g., “guest editor’s introduction,” Johns Hopkins APL
Tech. Dig. 11(3-4), 224–227 (1990). 2Lui, A. T. Y., “extended consideration of a synthesis model for mag-
netospheric substorms,” AGU Geophys. Monogr. Ser. 64, Magneto-spheric Substorms, J. r. kan, T. A. potemra, s. kokubun, and T. iijima (eds.), Agu, Washington, Dc, pp. 43–60 (1991).
3hovestadt, D., and scholer, m., “radiation belt–produced energetic hydrogen in interplanetary space,” J. Geophys. Res. 81(28), 5039–5042 (1976).
4krimigis, s. m., kohl, J. W., and Armstrong, T. p., “The magne-tospheric contribution to the Quiet-Time Low energy nucleon spectrum in the Vicinity of earth,” Geophys. Res. Lett. 2, 457–460 (1975).
5roelof, e. c., “energetic neutral Atom image of a storm-Time ring current,” Geophys. Res. Lett. 14, 652–655 (1987).
6Vegard, L., “hydrogen showers in the Auroral region,” Nature 144, 1089–1090 (1939).
7Vegard, L., “emission spectra of the night sky and Aurora,” in Reports of the Gassiot Committee 82, Year book, physical soc. of London, pp. 570–578 (1948).
8moritz, J., “energetic protons at Low equatorial Altitudes: A newly Discovered radiation belt phenomenon and its explanation,” Z. Geophys. 38, 701 (1972).
9hovestadt, D., häusler, b., and scholer, m., “observation of ener-getic particles at Very Low Altitudes near the geomagnetic equator,” Phys. Rev. Lett. 28, 1340–1344 (1972).
10kirsch, e., krimigis, s. m., ip, W. h., and gloeckler, g., “X-ray and energetic neutral particle emission from saturn’s magnetosphere: measurements by Voyager-1,” Nature 292, 718–721 (1981).
11kirsch, e., krimigis, s. m., kohl, J. W., and keath, e. p., “upper Limits for X-ray and energetic neutral particle emission from Jupi-ter: Voyager-1 results,” Geophys. Res. Lett. 8, 169–172 (1981).
12roelof, e. c., mitchell, D. g., and Williams, D. J., “energetic neutral Atoms (E ~ 50 keV) from the ring current: imp-7/8 and isee-1,” J. Geophys. Res. 90(A11), 10,991–11,008 (1985).
13cheng, A. F., keath, e. p., krimigis, s. m., mauk, b. h., mcentire, r. W., et al., “imaging neutral particle Detector,” Remote Sensing Rev. 8, 101–145 (1993).
14krimigis, s. m., mitchell, D. g., hamilton, D. c., Livi, s., et al., “magnetospheric imaging instrument on the cassini mission to saturn/Titan,” Space Sci. Rev. 114, 233–329 (2004).
15krimigis, s. m., mitchell, D. g., hamilton, D. c., Dandouras, i., Armstrong, T. p., et al., “A nebula of gases from io surrounding Jupiter,” Nature 415, doi:10.1038/415994a (2002).
16mitchell, D. g., paranicas, c. p., mauk, b. h., roelof, e. c., and krimigis, s. m., “energetic neutral Atoms from Jupiter measured with the cassini magnetospheric imaging instrument: Time Dependence and composition,” J. Geophys. Res. 109(A09s11), doi:10.1029/2003JA010120 (2004).
17barabash, s., norberg, o., Lundin, r., olsen, s., Lundin, k., et al., “energetic neutral Atom imager on the swedish micro satellite Astrid,” in AGU Geophys. Monogr. Ser. 103, Measurement Techniques in Space Plasmas, r. F. pfaff (ed.), Agu, Washington, Dc, pp. 257–262 (1998).
18barabash, s., Satellite Observations of Plasma-Neutral Coupling Near Mars and the Earth, ph.D. Thesis, The swedish institute of space physics, kiruna (Dec 1995).
19brandt, p. c., barabash, s., norberg, o., Lundin, r., roelof, e. c., and chase, c. J., “enA imaging at Low Altitudes from the swed-ish micro satellite Astrid: images and spectral Analysis,” J. Geophys. Res. 104(A2), 2367–2379 (1999).
20brandt, p. c., barabash, s., roelof, e. c., and chase, c. J., “enA imaging at Low Altitudes from the swedish microsatellite Astrid: extraction of the equatorial ion Distribution,” J. Geophys. Res. 106(A11), 25,731–25,744 (2001).
21roelof, e. c., “enA emission from nearly-mirroring magnetospheric ions interacting with the exosphere,” Adv. Space Res. 20(3), 361–366 (1997).
22brandt, p. c., ebihara, Y., barabash, s., and roelof, e. c., “enA images of a narrow Flow channel from the plasmasheet During Quiet conditions. Astrid-1 observations,” J. Geophys. Res. 107(A10), doi:10.1029/2001JA000230 (2002).
23Williams, D. J., roelof, e. c., and mitchell, D. g., “global magneto-spheric imaging,” Rev. Geophys. 30(3), 183–208 (1992).
24burch, J. L., “The imAge mission,” Space Sci. Rev. 91(1), (2000).25mitchell, D. g., Jaskulek, s. e., schlemm, c. e., keath, e. p., Thomp-
son, r. e., et al., “high energy neutral Atom (henA) imager for the imAge mission,” Space Sci. Rev. 91, 67–112 (2000).
26pollock, c. J., Asamura, k., baldonado, J., balkey, m. m., barker, p., et al., “medium energy neutral Atom (menA) imager for the imAge mission,” Space Sci. Rev. 91(1), 113–154 (2000).
27moore, T. e., chornay, D. J., collier, m. r., herrero, F. A., Johnson, J., et al., “The Low-energy neutral Atom imager for imAge,” Space Sci. Rev. 91(1), 155–195 (2000).
28brinkfeldt, k., gunell, h., brandt, p. c., barabash, s., Winningham, J. D., et al., “enA measurements from mars eclipse,” Icarus (in press, 2005).
29brandt, p. c., ohtani, s., mitchell, D. g., Fok, m.-c., roelof, e. c., and Demajistre, r., “global enA observations of the storm mainphase ring current: implications for skewed electric Fields in the inner magnetosphere,” Geophys. Res. Lett. 29(20), doi:10.1029/2002gL015160 (2002).
30Demajistre, r., roelof, e. c., brandt, p. c., and mitchell, D. g., “retrieval of global magnetospheric ion Distributions from high energy neutral Atom (enA) measurements by the imAge/henA instrument,” J. Geophys. Res. 109(A04214), doi:10.1029/2003JA010322 (2004).
31Tsyganenko, n. A., singer, h. J., and kasper, J. c., ”storm-Time Distortion of the inner magnetosphere: how severe can it get?” J. Geophys. Res. 108(A5), doi:10.1029/2002JA009808 (2003).
154 Johns hopkins ApL TechnicAL DigesT, VoLume 26, number 2 (2005)
p. c. brAnDT et al.
32roelof, e. c., “remote sensing of the ring current using energetic neutral Atoms,” Adv. Space Res. 9(12), 195–203 (1989).
33Waters, c. L., Anderson, b. J., and Liou, k., “estimation of global Field Aligned currents using iridium magnetometer Data,” Geophys. Res. Lett. 28(11), 2165–2168 (2001).
34mauk, b. h., mitchell, D. g., krimigis, s. m., roelof, e. c., and paranicas, c. p., “energetic neutral Atoms from a Trans-europa gas Torus at Jupiter,” Nature 421, 920–922 (2003).
35krimigis, s. m., mitchell, D. g., hamilton, D. c., krupp, n., Livi, s., et al., “Dynamics of saturn’s magnetosphere from mimi During cassini’s orbital insertion,” Science 307(5713), 1270–1273 (2005).
36paranicas, c. p., mitchell, D. g., brandt, p. c., krimigis, s. m., and mauk, b. h., “periodic intensity Variations in global enA images of saturn,” Geophys. Res. Lett. 32(21), L21101, doi: 10.1029/2005gL023656 (2005).
37mitchell, D. g., brandt, p. c., roelof, e. c., Dandouras, i., krimigis, s. m., et al., “energetic ion Acceleration in saturn’s magnetotail: substorms on saturn?” Geophys. Res. Lett. 32, L20s01, doci:10.1029/2005gL022647 (2005).
38Jurac, s., and richardson, J. D., “A self-consistent model of plasma and neutrals at saturn: neu-tral cloud morphology,” J. Geophys. Res. 110, A09220, doi:10.1029/2004JA010635 (2005).
39Amsif, A., Dandouras i., and roelof, e. c., “modelling the production and the imaging of energetic neutral Atoms from Titan’s exosphere,” J. Geophys. Res. 107(A10), 22,169–22,181 (1997).
40Dandouras, J., and Amsif, A., “production and imaging of energetic neutral Atoms from Titan’s exosphere: A 3-D model,” Planet. Space Sci. 47(10-11), 1355–1369 (1999).
41mitchell, D. g., brandt, p. c., roelof, e. c., Dandouras, i., krimigis, s. m., and mauk, b. h., “energetic neutral Atom emissions from Titan interaction with saturn’s magnetosphere,” Sci-ence 308, 989–992, doi:10.1126/science.1109805 (2005).
42Decker, r. b., krimigis, s. m., roelof, e. c., hill, m. e., Armstrong, T. p., et al., “Voyager-1 in the Foreshock, Termination shock, and heliosheath,” Science 309(5743), doi:10.1126/sci-ence.1117569 (2005).
43gruntman, m. A., roelof, e. c., mitchell, D. g., Fahr, h.-J., Funsten, h. o., and mccomas, D. J., “energetic neutral Atom imaging of the heliospheric boundary region,” J. Geophys. Res. 106(A8), 15,767–15,758 (2001).
44brandt, p. c., ENA Imaging of Planetary Magnetospheres, ph.D. Thesis, swedish institute of space physics, kiruna (Dec 1999).
45barabash, s., Lukyanov, A. V., brandt, p. c., and Lundin, r., “energetic neutral Atom imaging of mercury’s magnetosphere 3. simulated images and instrument requirements,” Planet. Space Sci. 49(14–15), 1685–1692 (2001).
Johns hopkins ApL TechnicAL DigesT, VoLume 26, number 2 (2005) 155
enA imAging: seeing The inVisibLe
THE AUTHORS
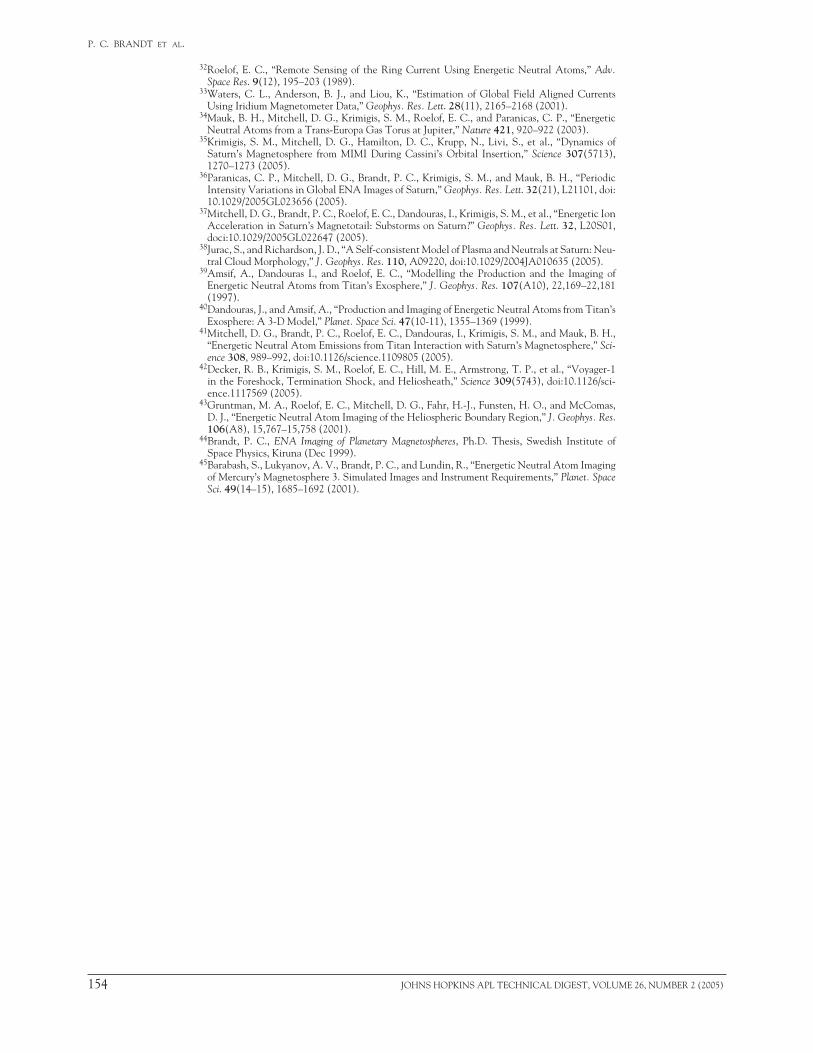
Pontus C. Brandt received his ph.D. in December 1999 from the swedish institute of space physics, kiruna, in space plasma physics, with a thesis entitle ENA Imaging of Planetary Magnetospheres. Dr. brandt joined ApL in 2000 as a postdoctoral fellow and has been a senior staff member since 2002. he is currently involved in the cassini, imAge, mars express, and Venus express missions, working on magnetospheric research with a focus on enA imaging. Donald G. Mitchell is the principal investigator of the henA and incA instruments and is involved in numerous instrument development efforts at ApL includ-ing ibeX. Dr. mitchell is also involved in the science analysis of energetic particle measurements from imAge, cassini, bepi-colombo, messenger, and others. he received his ph.D. in 1975 from the university of new hampshire and joined ApL in 1978, where he became a principal staff member in 1991. Edmond C. Roelof received his ph.D. from the university of california, berkeley, in 1966 and joined ApL in 1974, where he now holds a principal professional staff position. Dr. roelof is involved in numerous science investigations, including galileo, ulysses, geotail, Astrid, cassini, Ace, imAge, TWins, mars express, Venus express, and ibeX. Stamatios M. Krimigis received his ph.D. from the university of iowa in 1965, joined ApL in 1968, and was head of the space physics and instrumentation group. Dr. krimigis became chief scientist in 1980 and head of the space Department in 1991 and emeritus head in 2004. his research interests include the earth’s environment and magnetosphere, the sun, the interplanetary medium, and the magnetospheres of the planets and other astrophysical objects. he has been the principal investigator or co-investigator on several nAsA spacecraft, including the Lecp experiment on Voyagers 1 and 2, AmpTe, the cassini mission, and the galileo, ulysses, Ace, and messenger missions. Christopher P. Paranicas has done research on earth’s magnetosphere and the planetary magnetospheres for about 20 years. Dr. paranicas is working on charged and neutral particle data sets from the galileo and cassini missions. his main interest is the weathering
Joachim saur
robert Demajistre
christopher p. paranicas
stamatios m. krimigis
edmond c. roelof
pontus c. brandt
Donald g. mitchell
barry h. mauk
of satellite surfaces in planetary magnetospheres. Barry H. Mauk is the supervisor of the particles and Fields section of the space physics group at ApL. Dr. mauk is a co-investigator on the Voy-ager Lecp and cassini/mimi instruments. Joachim Saur received his ph.D. from the university of cologne, germany, in 2000 and joined ApL in 2003. Dr. saur’s specialty is plasma interactions with the moons of Jupiter and saturn. Robert DeMajistre received his ph.D. in computational physics in 2002 from the george mason university, Fairfax, Virginia. Dr. Demajistre joined ApL in 1994 as a senior staff member and is currently involved in developing inversion techniques for remote
sensing measurements of the magnetosphere and thermosphere obtained from the imAge and TimeD missions. Further information on this topic can be obtained from Dr. brandt. his e-mail address is [email protected].


![[G4]image deblurring, seeing the invisible](https://static.fdocuments.in/doc/165x107/559650e71a28abd30e8b47d0/g4image-deblurring-seeing-the-invisible.jpg)


