Employment and Skill Development - Planning Commissionplanningcommission.gov.in/hackathon/Skill...
40
EMPLOYMENT 22.1. Generation of productive and gainful employ- ment with decent working conditions on a sufficient scale to absorb the growing labour force was a critical element in the Eleventh Plan strategy for achieving inclusive growth. The Eleventh Plan aimed at bring- ing the overall unemployment down by generating new work opportunities exceeding the projected addition to the labour force. The results of NSS 66th round (2009–10) indicate that 18 million new work opportunities were created on CDS basis between 2004–05 and 2009–10. The unemployment in abso- lute terms came down by 6.3 million and the unem- ployment rate declined to 6.6 per cent in 2009–10 for the first time since 1993–94, after increasing to 7.31 per cent in 1999–2000 and 8.28 per cent in 2004–05. On UPSS basis also, during the same period, the unemployment rate declined to 2 per cent in 2009–10 from 2.3 per cent in 2004–05. The overall labour force expanded by just 11.7 million. The increase in labour force was lower compared to previous years. This, however, is a positive develop- ment as it can be attributed to higher retention of the young in schools and colleges, and also lower distress labour participation by working age women as fam- ily incomes improved in both rural and urban areas. 22.2. The employment elasticity in India in the last decade declined from 0.44 in the first half of the decade 1999–2000 to 2004–05, to as low as 0.01 dur- ing second half of the decade 2004–05 to 2009–10. The similar trends have been witnessed at the sec- toral level, namely agriculture, service, and manu- facturing sectors. In agriculture and manufacturing 22 Employment and Skill Development employment elasticity in the latter half of the decade has been negative. The negative employment elastic- ity in agriculture indicates movement of people out of agriculture to other sectors where wage rates are higher. This migration of surplus workers to other sectors for productive and gainful employment is necessary for inclusive growth. However, the nega- tive employment elasticity in manufacturing sector is a cause of concern particularly when the sector has achieved 6.8 per cent growth in output during Eleventh Plan. TRENDS IN THE LABOUR FORCE AND WORK FORCE PARTICIPATION RATES Quantitative Dimensions of Employment 22.3. The quantitative dimensions of employment captures the trends in Labour Force, Work force at rural–urban, Male Female and sectoral level. Table 22.1 provides the Labour Force (LFPR) and Work Force Participation Rates (WFPR) during the decade 1999–2000 and 2009–10. It emerges that the second half of the last decade witnessed the decline in LFPR in spite of increase in the population growth. Further it emerges that there has been decline in both rural and urban LFPRs and WFPRs during the second half of the decade. Female LFPR and WFPR show greater fluctuations particularly in rural India. The rise in female LFPR and WFPR during the first half of the decade might be the result of agricultural dis- tress which depressed household income and pushed women into the labour force. Since all women enter- ing the labour force did not get employment, the first half of the decade was also characterised by an increase
Transcript of Employment and Skill Development - Planning Commissionplanningcommission.gov.in/hackathon/Skill...

EMPLOYMENT22.1. Generation of productive and gainful employ-ment with decent working conditions on a sufficient scale to absorb the growing labour force was a critical element in the Eleventh Plan strategy for achieving inclusive growth. The Eleventh Plan aimed at bring-ing the overall unemployment down by generating new work opportunities exceeding the projected addition to the labour force. The results of NSS 66th round (2009–10) indicate that 18 million new work opportunities were created on CDS basis between 2004–05 and 2009–10. The unemployment in abso-lute terms came down by 6.3 million and the unem-ployment rate declined to 6.6 per cent in 2009–10 for the first time since 1993–94, after increasing to 7.31 per cent in 1999–2000 and 8.28 per cent in 2004–05. On UPSS basis also, during the same period, the unemployment rate declined to 2 per cent in 2009–10 from 2.3 per cent in 2004–05. The overall labour force expanded by just 11.7 million. The increase in labour force was lower compared to previous years. This, however, is a positive develop-ment as it can be attributed to higher retention of the young in schools and colleges, and also lower distress labour participation by working age women as fam-ily incomes improved in both rural and urban areas.
22.2. The employment elasticity in India in the last decade declined from 0.44 in the first half of the decade 1999–2000 to 2004–05, to as low as 0.01 dur-ing second half of the decade 2004–05 to 2009–10. The similar trends have been witnessed at the sec-toral level, namely agriculture, service, and manu-facturing sectors. In agriculture and manufacturing
22Employment and Skill Development
employment elasticity in the latter half of the decade has been negative. The negative employment elastic-ity in agriculture indicates movement of people out of agriculture to other sectors where wage rates are higher. This migration of surplus workers to other sectors for productive and gainful employment is necessary for inclusive growth. However, the nega-tive employment elasticity in manufacturing sector is a cause of concern particularly when the sector has achieved 6.8 per cent growth in output during Eleventh Plan.
TRENDS IN THE LABOUR FORCE AND WORK FORCE PARTICIPATION RATES
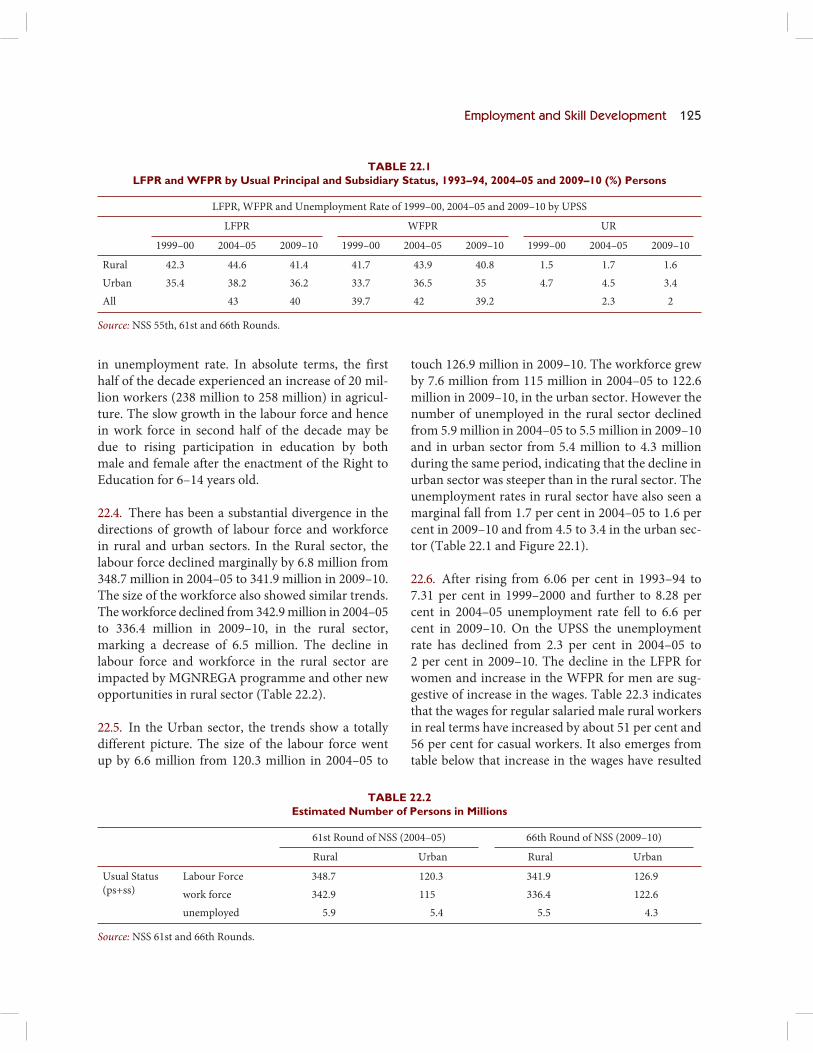
Quantitative Dimensions of Employment22.3. The quantitative dimensions of employment captures the trends in Labour Force, Work force at rural–urban, Male Female and sectoral level. Table 22.1 provides the Labour Force (LFPR) and Work Force Parti cipation Rates (WFPR) during the decade 1999–2000 and 2009–10. It emerges that the second half of the last decade witnessed the decline in LFPR in spite of increase in the population growth. Further it emerges that there has been decline in both rural and urban LFPRs and WFPRs during the second half of the decade. Female LFPR and WFPR show greater fluctuations particularly in rural India. The rise in female LFPR and WFPR during the first half of the decade might be the result of agricultural dis-tress which depressed household income and pushed women into the labour force. Since all women enter-ing the labour force did not get employment, the first half of the decade was also characterised by an increase
Employment and Skill Development 125
in unemployment rate. In absolute terms, the first half of the decade experienced an increase of 20 mil-lion workers (238 million to 258 million) in agricul-ture. The slow growth in the labour force and hence in work force in second half of the decade may be due to rising participation in education by both male and female after the enactment of the Right to Education for 6–14 years old.
22.4. There has been a substantial divergence in the directions of growth of labour force and workforce in rural and urban sectors. In the Rural sector, the labour force declined marginally by 6.8 million from 348.7 million in 2004–05 to 341.9 million in 2009–10. The size of the workforce also showed similar trends. The workforce declined from 342.9 million in 2004–05 to 336.4 million in 2009–10, in the rural sector, marking a decrease of 6.5 million. The decline in labour force and workforce in the rural sector are impacted by MGNREGA programme and other new opportunities in rural sector (Table 22.2).
22.5. In the Urban sector, the trends show a totally different picture. The size of the labour force went up by 6.6 million from 120.3 million in 2004–05 to
touch 126.9 million in 2009–10. The workforce grew by 7.6 million from 115 million in 2004–05 to 122.6 million in 2009–10, in the urban sector. However the number of unemployed in the rural sector declined from 5.9 million in 2004–05 to 5.5 million in 2009–10 and in urban sector from 5.4 million to 4.3 million during the same period, indicating that the decline in urban sector was steeper than in the rural sector. The unemployment rates in rural sector have also seen a marginal fall from 1.7 per cent in 2004–05 to 1.6 per cent in 2009–10 and from 4.5 to 3.4 in the urban sec-tor (Table 22.1 and Figure 22.1).
22.6. After rising from 6.06 per cent in 1993–94 to 7.31 per cent in 1999–2000 and further to 8.28 per cent in 2004–05 unemployment rate fell to 6.6 per cent in 2009–10. On the UPSS the unemployment rate has declined from 2.3 per cent in 2004–05 to 2 per cent in 2009–10. The decline in the LFPR for women and increase in the WFPR for men are sug-gestive of increase in the wages. Table 22.3 indicates that the wages for regular salaried male rural workers in real terms have increased by about 51 per cent and 56 per cent for casual workers. It also emerges from table below that increase in the wages have resulted
TABLE 22.1LFPR and WFPR by Usual Principal and Subsidiary Status, 1993–94, 2004–05 and 2009–10 (%) Persons
LFPR, WFPR and Unemployment Rate of 1999–00, 2004–05 and 2009–10 by UPSS
LFPR WFPR UR
1999–00 2004–05 2009–10 1999–00 2004–05 2009–10 1999–00 2004–05 2009–10
Rural 42.3 44.6 41.4 41.7 43.9 40.8 1.5 1.7 1.6
Urban 35.4 38.2 36.2 33.7 36.5 35 4.7 4.5 3.4
All 43 40 39.7 42 39.2 2.3 2
Source: NSS 55th, 61st and 66th Rounds.
TABLE 22.2Estimated Number of Persons in Millions
61st Round of NSS (2004–05) 66th Round of NSS (2009–10)
Rural Urban Rural Urban
Usual Status
(ps+ss)
Labour Force 348.7 120.3 341.9 126.9
work force 342.9 115 336.4 122.6
unemployed 5.9 5.4 5.5 4.3
Source: NSS 61st and 66th Rounds.

126 Twelfth Five Year Plan
TABLE 22.3Unemployment, Wages and Consumption Expenditure, 1993–4 to 2009–10
Unemployment Rate
(%)
(CDS)
Salaries and Wages Consumption
Regular Casual Rural Urban
` Per day, for male rural workers Monthly per capita (in `)
1993–94 6.06 58.48
(33.23)
23.18
(13.17)
281.4
(159.9)
458.04
(264.8)
1999–00 7.31 127.32
(46.98)
45.48
(16.78)
2004–05 8.2 144.93
(45.43)
55.03
(17.25)
558.78
(175.2)
1,052.36
(311.3)
2009–10 6.6 249.15
(50.44)
101.53
(20.55)
927.7
(187.8)
1,785.81
(355.0)
Source: NSS Rounds.
Note: Figures in parentheses are at constant prices. For rural areas derived from CPI for agricultural labourers with base 1986–87 = 100,
and for urban areas derived from CPI for urban non-manual employees with base 1984–85 = 100.
in increase in the consumption both in the rural and urban areas by 17.4 per cent and 34 per cent respec-tively during 1993–94 to 2009–10.
22.7. The rise in employment for males and wages has led to a sharp rise in consumption. As per NSSO data on consumption (NSS 66th Round) Monthly per capita consumption expenditure in rural areas in real terms increased to 1.4 per cent per year in the five years from 2004–05 to 2009–10 from 0.8 per cent per year in the 1993–94 to 2004–05 period. For urban areas, the real per capita expenditures grew faster during the same period from 1.47 per cent between 1993–94 and 2004–05 to 2.67 per cent between 2004–05 and 2009–10. The Conceptual framework
of employment and unemployment indicators are presented in Box 22.1.
22.8. In terms of Sectoral shares in employment it emerges that the agriculture share in employ-ment declined from 59.9 per cent at the beginning of decade to 53.2 per cent at the end of the decade. However, this is still very high compared with the share of agriculture in other countries in the region. The share of manufacturing in the total employment after increasing to 12.2 per cent in the first half of the decade declined to 11 per cent in the second half of the decade indicating usage of more capital intensive technology in the absence of skilled manpower. The share of services has increased from 23.7 per cent in
2009–10
6.6
109.22
6.06
1983 1993–94 1999–2000
Unemployment rate (%)
2004-05
7.31
8.288
6
4
2
0
Source: NSS Rounds.
FIGURE 22.1: Trend in Unemployment Rate

Employment and Skill Development 127
Box 22.1Conceptual Framework of Key Employment and Unemployment Indicators
Different approaches for determining activity status: On the basis of activities pursued by individuals during certain specified reference periods. There are three reference periods, namely (i) one year, (ii) one week and (iii) each day of the reference week. Based on these three periods, three different measures of activity status are arrived at. These are termed respectively as usual status, current weekly status and current daily status.
Usual activity status: The activity status on which a person spent relatively longer time (major time criterion) during the 365 days preceding the date of survey is considered the usual principal activity status of the person.
Subsidiary economic activity status: A person whose principal usual status is determined on the basis of the major time criterion may have pursued some economic activity for 30 days or more during the reference period of 365 days preceding the date of survey. The status in which such economic activity is pursued during the reference period of 365 days preceding the date of survey is the subsidiary economic activity status of the person.
Current weekly activity status: The current weekly activity status of a person is the activity status obtaining for a person during a reference period of 7 days preceding the date of survey. It is decided on the basis of a certain priority cum major time criterion. A person is considered working (or employed)) if s/he, while pursuing any economic activity, had worked for at least one hour on at least one day during the 7 days preceding the date of survey. A person is considered ‘seeking or available for work (or unemployed)’ if during the reference week no economic activity was pursued by the person but s/he made efforts to get work or had been available for work any time during the reference week though not actively seeking work in the belief that no work was available.
Current daily activity status: The current daily activity status for a person is determined on the basis of her/his activity status on each day of the reference week using a priority-cum-major time criterion (day to day labour time disposition).
Labour force participation rate (LFPR): Labour force refers to the population which supplies or offers to supply labour for pursuing economic activities for the production of goods and services and, therefore, includes both ‘employed’ and ‘unemployed’ persons/person days. Labour-force participation rate (LFPR) is defined as the proportion of persons/person days in the labour-force to the total persons/person-days.
Worker Population Ratio (WPR): The estimates of employed (or worker) according to the usual principal status gives the number of persons who worked for a relatively long part of the 365 days preceding the date of survey. The work force, considering both the usual principal status and the subsidiary status, includes the persons who (i) either worked for a relatively long part of the 365 days preceding the date of survey and (ii) also those persons from among the remaining population who had worked at least for 30 days during the reference period of 365 days preceding the date of survey.
Unemployment rate (UR): Unemployment Rate (UR) is the ratio of number of unemployed persons/person-days to the number of persons/person-days in labour force (that is, number of employed and unemployed person/person-days). Estimates of UR are obtained by the three approaches used for classification of the activity statuses of the person.
Source: NSS Reports.
the beginning of the decade in 1999–2000 to 25.3 per cent in the end of the decade. The non-manufacturing sector has seen a sharp increase in employment and this is mostly in the construction sector (Table 22.4).
Sector-wise Employment Generation22.9. During the period between 2004–05 and 2009–10 a total of 18 million work opportunities on CDS basis and 2 million at UPSS basis have been cre-ated. The performance varied across different sec-tors. The mining, manufacturing, trade, electricity
TABLE 22.4 Proportionate Share of Sectors in Employment
Sectors 1999–2000 2004–5 2009–10
Agriculture 59.9 56.6 53.2
Manufacturing 11.1 12.2 11.0
Non-manufacturing 5.3 6.5 10.5
Services 23.7 24.7 25.3
Total 100 100 100
Source: NSS Various rounds.
128 Twelfth Five Year Plan
related sectors witnessed a decline in employment opportunities in spite of good sectoral growth. In all the sectors the performance was slightly short of the projections at the beginning of the Plan. The data in respect of employment in different sectors is given in Annexure 22.1.
22.10. Agriculture witnessed an oscillating trend in the employment in the last decade. While in the first half of the decade there was an increase in employ-ment from 237.67 million in 1999–2000 to nearly 258.93 million in 2004–05, an increase of 21.26 mil-lion, there was a substantial decline in the number of people employed in agriculture in the later half of the decade from 258.93 million to 244.85 million, a decline of about 14.08 millions. However, total agri-cultural employment at the end of the decade was still higher by 3 per cent than it was at its beginning (Annexure 22.1). This suggests that the process of structural change in employment that one would expect with a period of unprecedented growth in output in the economy outside of agriculture, is not occurring fast enough.
22.11. The manufacturing sector witnessed an abso-lute increase in employment in the first half of the decade from 44.05 million to nearly 55.77 million in 2004–05. However, the second half of the decade witnessed a decline by about 5 million to reach the employment level of 50.74 million. However, this was still 15 per cent higher than the employment in the beginning of the decade. This change in the trend in employment generation in manufacturing sector may perhaps be due to faster increase in the aver-age annual increase in real wages in India driven by a greater shortage of skilled workers (use of capital intensive technologies) and unskilled casual work-ers. The employment elasticity for manufacturing sector has shown a downward trend from 0.76 in the first half of the decade to –0.31 in the second half of the decade. This suggests substitution of labour by capital intensive technology resulting in fall in total employment despite an increase in total manufactur-ing output.
22.12. A close look at the employment trend in the main manufacturing industries given in Annexure 22.2
reveals interesting results. It emerges that the indus-tries that registered an increase in employment in the first half of the decade, more than 80 per cent of them registered decline in the employment dur-ing the latter half of the decade. This decline was observed in the labour intensive industries which accounted for 68 per cent of total manufacturing employment in 1999–2000. The decline may be due to fall in the international demand for these prod-ucts such as textiles, food products; tobacco, wearing apparel, wood products, fabricated metal and so on. These six industries registered an increase of 8.7 mil-lion employment during the first half of the decade, and a decline of 7.6 million employment during the second half.
22.13. The employment in the non-manufacturing sector in the decade 1999–2009 has increased by 27.44 million to reach 48.28 million in 2009–10, an increase of 2.3 times relative to 1999–2000. In the first half of the decade non-manufacturing employ-ment increased from 21 million in 1999–2000 to 30 million in 2004–05, nearly a 50 per cent increase from 1999–2000. The absolute size of employment in non-manufacturing by the end of the decade was 1.6 times compared to 2004–05, or 2.3 times rela-tive to the level in 1999–2000. This is comparable to employment in manufacturing sector which is 50 million during the same period. The main increase has been contributed by construction sector where the employment in the decade increased by 26.6 mil-lion of which 8.5 million was in the first half and 18.1 million during the second half. The other important sectors, namely mining and quarrying, electricity, gas and water supply have witnessed a very marginal increase (Annexure 22.1).
22.14. The Services/Tertiary sector witnessed an increase in the employment in the decade to reach a level of 116.34 million in 2009–10, contribut-ing about 25.3 per cent to total employment. The growth in employment in the services sector was lower in the second half of the decade than in the first half. Within services, trade was the most impor-tant contributor to employment and accounted for one third of total services and employment in the economy both at the beginning as well as at the end

Employment and Skill Development 129
of the decade. It accounted for around 36 per cent (nearly 7 crore) of the increase in employment that occurred in the service sector in India in first half of the decade as compared to second half of the decade, when there was hardly any increase in employment. The second most important sector within services is transport, storage and communication whose contri-bution to total employment increased from 15.5 per cent at the beginning of the decade to 17.2 per cent at the end of the decade in 2009–10.
22.15. The employment in public sector services stagnated and there is, severe shortage in the public services of doctors, nurses, teachers, policemen, and judges. A rapidly growing economy cannot function without the simultaneous rapid expansion of such services. As this transition occurs in India in the next ten years a substantial improvement in higher quality jobs in public sector services may occur. The other services sector viz; banking and financial ser-vices and real estate have also witnessed an increase. The Employment in banking and insurance, which was 2.25 million in 1999–2000, had risen to 3.82 mil-lion in 2009–10 and in real estate from 2.7 million in 1999–2000 to 5.7 million at its end. The growth in real estate employment commensurate with increased focus of the government on both housing as well as infrastructure investment in the Eleventh Plan period.
22.16. Investment in infrastructure is expected to grow from $500 billion during the Eleventh Five Year Plan to 1 trillion dollars in the Twelfth Plan, that is, to nearly 10 per cent of GDP. NSS data on employ-ment in health and education services show marginal increase in the second half of the decade although first half had witnessed an increase. However while the GVA for education sector increased to 8.4 per cent per annum in the latter half of the decade from 7.1 per cent in the first half, for health sector the growth rate of GVA in was robust (10.1 per cent per annum) in the first half of the decade and declined to 4.2 per cent per annum in the second half of the dec-ade, which perhaps explains the rather small increase in employment in the health sector in the latter half of the decade. With persistent shortage of health workers even post National Rural Health Mission.
The greater thrust of the government on educa-tion, skill development and health in the Twelfth Plan will increase employment in the sector in the Twelfth Plan.
EMPLOYMENT SCENARIO IN THE STATES22.17. The variation in population increase in dif-ferent states and in turn working age population has implication for employment generation. The present analysis of trends in employment in different sectors in different States would highlight the sectors that are contributing and would contribute to employ-ment in future.
Agriculture22.18. In agriculture at the national level there has been increase in the absolute number of people employed in the last decade (1999–2000 to 2009–10) although in the second half of the decade the propor-tion has declined marginally. The vast majority of the states have also experienced a decline in employ-ment in agriculture between 2004–05 and 2009–10. However, since the total fall in employment in agri-culture in the latter half of the decade was only 14.08 million, the distribution of this decline among the states did not lead to a significant shift of workers out of agriculture to industry or services. This does not indicate that temporary migration from rural to urban areas was not occurring. In fact for the first time since the Census of 1921 within the last decade, that is, 2001 to 2011 Census, the increase in the urban population (91 million) has been greater than the increase in the rural population over the decade (90 million). This may be because workers do migrate from rural to urban but only for temporary periods during the lean season for agriculture and move back during the peak season. Therefore, this workforce is not available for work in manufacturing or modern services due to lack of appropriate skill set. Their migration reflects rural distress, driven by the fact that 84 per cent of India’s farmers are small and marginal, tilling less than 2.5 acres of land.
22.19. In this context, it is important to mention that just two states alone accounted for nearly half of the decline in agricultural employment in the lat-ter half of the decade. Thus, in Bihar employment in

130 Twelfth Five Year Plan
agriculture fell from 21.2 million in 2004–05 to 17.2 million at the end of the decade. Similarly, in U.P. employment in agriculture fell from 43.3 million in the middle of the decade to nearly 39.7 million at its end. On the contrary, the state of Maharashtra wit-nessed an increase in the employment in agriculture 3.97 million in the latter half of the decade. Another state which saw an increase in agriculture in the latter half of the decade was Punjab, from 3.6 to 4.7 million.
Manufacturing22.20. The employment in manufacturing sec-tor at All India level has fallen in the second half of the decade from 55.77 to 50.74 million. Most of this decline in employment was confined to states like Maharashtra (1.81 million) Tamil Nadu (0.98 million), Uttar Pradesh (0.85 million) and Jharkhand (0.25 million). The most distressing part was the fall in employment in the most industrialised states, namely Maharashtra, Tamil Nadu which accounted for 75 per cent of the decline in the manufacturing employment in the country in the second half of the decade.
22.21. In terms of state wise share of employment, it emerged that the national average for the share of manufacturing employment accounted for 11 per cent of total employment in 2009–10. There are 9 major states where this share is greater than the national average: Andhra Pradesh (11.9 per cent) Delhi (24.84 per cent), Gujarat (12.6 per cent), Haryana (12.2 per cent), Kerala (13.5 per cent), Punjab (15.9 per cent), Tamil Nadu (19.6 per cent), Uttar Pradesh (11.1 per cent) and West Bengal (18.4 per cent). Given the fact that there are advantages of agglomeration in the manufacturing sector it is likely that even in the future these states will continue to account for growth in manufacturing of GVA and employment. The state of Karnataka (9.4 per cent) also has similar proportion in employment as at national.
22.22. In terms of the share of manufacturing in state GVA, seven states have higher than the national aver-age of manufacturing share in GDP (15.9 per cent) in 2009–10: Chhattisgarh, Gujarat, Haryana, Jharkhand, Karnataka, Maharashtra, and Tamil Nadu. These
states could continue to grow fast during the Twelfth Plan period. But this depends to a larger extent on the manufacturing employment elasticity of out-put. While States of Chhattisgarh, Gujarat, Haryana, Delhi, Uttarakhand and West Bengal have posi-tive employment elasticity, the states of Jharkhand, Maharashtra and Tamil Nadu have negative employ-ment elasticity which implies usage of more capital intensive technology.
Non-Manufacturing22.23. All the States experienced increase in non-manufacturing employment, mainly in construction sector in the second half of the decade.
Services22.24. Services sector contributed about 25.3 per cent of total employment in 2009–10. Most of the states have shown a positive trend in the employ-ment generation in the services sector in the latter half of the decade with exception of Andhra Pradesh, Madhya Pradesh, Maharashtra and Punjab which have shown decline in the service sector employment and negative employment elasticity. There is need for state governments to focus their attention on pro-motion of services for employment generation. 11 states share of services in total employment is greater than the national average namely Delhi (67.9 per cent), Haryana (25.2 per cent), Kerala (39.2 per cent), Maharashtra (29.8 per cent), Punjab (29.1 per cent), Tamil Nadu (27.0 per cent) and West Bengal (30.4 per cent).
QUALITATIVE DIMENSIONS IN EMPLOYMENT TRENDS22.25. While the above analysis provide trends in cre-ation of total employment both at the macro level and at state level as also the sectoral composition of the employment so created, it is necessary to look into the qualitative dimensions of employment in terms of equity, dignity, social security, status of employment and so on. This would help in formulating strategy for India’s future challenges in generating productive employment, with decent working conditions.
Informalisation of Employment22.26. A critical issue in assessing employ-ment behavior of the economy is the growth of

Employment and Skill Development 131
employment in the organised sector vis-à-vis the unorganised sector and particularly in terms of formal and informal employments. It is generally opined that unorganised sector employment is of low quality compared to organised sector employ-ment. Table 22.5 presents the employment in organ-ised and unorganised sector in terms of formal and informal employment.
22.27. The above data shows a decline in the employ-ment in the unorganised sector from 86 per cent in 2004–05 to 84 per cent in 2009–10. This means that the share of organised sector employment has increased to 16 per cent in 2009–10 from 14 per cent in both 1999–2000 and 2004–05. However, the increase in the organised sector employment is mainly in the informal category. The informal employment in the organised sector has increased from 46.4 per cent in 2004–05 to about 57.8 per cent in 2009–10. The informal employment in the unorganised sector remains the same. Nearly 93 per cent of the total workforce in 2009–10 is in informal employment, a rise from 91 per cent in 1999–2000. If agriculture is excluded from the work-force, the share of informal workers in the total non-agricultural workforce drops to 85.6 per cent from
93 per cent, which is still very high as compared to that in Brazil (51 per cent), Mexico (50 per cent), Indonesia (78 per cent), Philippines (72 per cent), and Thailand (49 per cent).
22.28. The above trend is indicative of movement of workers from informal agricultural sector employ-ment to informal non-agricultural sectors. The tran-sition from informal employment in the unorganised sectors to informal employment in the organised sec-tors is indicated by a decline of 8.4 million informal workers in unorganised sector along with an increase of 13 million informal workers in the organised sector. What is notable is that formal employment in the organised sector is not increasing. This shows that organised enterprises employers are increas-ingly hiring workers on contractual terms due to labour laws and other concerns. Small and medium size enterprises generally belong to the unorganised sector and employ informal workers. Hence analys-ing employment by size of enterprises would pro-vide some insights on the qualitative dimensions of employment.
Size of Enterprises by Employment22.29. The data in Table 22.6 on size class of enter-prises by the number of workers that they employ shows an occurrence of shift in non-agricultural employment in the 2000s. The workers in the enter-prises with less than six employees (that is, micro enterprises) show a remarkable decline both in abso-lute as well as in relative terms between 2004–05 and 2009–10. Such micro enterprises accounted for 152.5 million workers in the middle of the decade, or 75 per cent of all non-agricultural workers. By the end of the decade the number of workers in such enterprises had fallen by nearly 4 million, and the share of such micro enterprises in the total non-agricultural employment was down to 65.6 per cent. Correspondingly there was an increase in the num-ber of workers employed in enterprises with 6 and above but less than 10 workers, from 15.2 million in the middle of the decade to nearly 24 million at its end, thus raising the share of workers in such enter-prises from 7.5 per cent to 10.5 per cent of all non-agricultural employment in the country. It is better for workers since it reduces the fragmentation and enables them to organise.
TABLE 22.5Formal and Informal Employment in Organized and
Unorganised Sector (millions)
Sectors Employment
2009–10
Informal Formal Total
Unorganised 385.08 2.26 387.34
Organised 42.14 30.74 72.88
Total 427.22 33.00 460.22
2004–05
Unorganised 393.5 1.4 394.9
Organised 29.1 33.4 62.6
Total 422.6 34.9 457.5
1999–2000
Unorganised 341.3 1.4 342.6
Organised 20.5 33.7 54.1
Total 361.7 35.0 396.8
Source: For 2009–10, computed from NSS 66th round, for other
years taken from NCEUS, 2007.

132 Twelfth Five Year Plan
Category of Workers by Employment Status22.30. In the labour market casual labour and self-employed are most vulnerable. Table 22.7 shows the annual increase in the work-force by category of employment in first half of the decade compared with second half of the decade. A notable feature is the increase in the number of jobs created at regular salaried wage and as casual worker. This may be due to increase in non manufacturing and service sector employment as discussed earlier.
TABLE 22.7 Number of Workers According to Usual Status
(PS+SS) Approach by Broad Employment Status (Million Workers)
1999–00 2004–05 2009–10
Self employed 209.3 (52.6) 258.4 (56.4) 232.7 (50.7)
Regular/Salaried
employee
58.2 (14.6) 69.7 (15.2) 75.1 (16.4)
Casual labour 130.3 (32.8) 129.7 (28.3) 151.3 (33.0)
Source: Compiled from NSS, 55th, 61st and 66th Rounds.
Unemployment among Young and the Educated22.31. The data and the Figure 22.2 show that Unemployment is higher among the youth and the educated who are looking for better quality jobs. The figure shows that unemployment among the age group 15–29 years for both males and females and in urban and rural areas is significantly higher than the average level of unemployment of all persons.
22.32. The incidence of employment by level of edu-
cation in India (by UPSS) in Annexure 22.3 indicates
that illiterates have the lowest rate of unemployment,
and the rate of unemployment tends to rise with
every level of education, with the highest unemploy-
ment rate for those with diploma/certificates (or
those with one or two years of post higher secondary
education). The unemployment rate for Diploma/
Certificate holders was 9.6 per cent at the end of the
decade. The unemployment rate does decline for
graduates and slightly again for postgraduates and
above, but not significantly.
EMPLOYMENT TRENDS AMONG THE SOCIAL GROUPS
Women’s Employment22.33. Although there has been consistent decline in
workforce participation rate (WPR) of women since
1980s but the decline seems to have accelerated in the
later half of the decade, that is, between 2004–05 and
2009–10 pushing down the overall LFPR and WFPR
to a low level. The decline in female labour force
participation has occurred in both rural and urban
areas, though the decline is much sharper in rural
compared to urban areas. This points to the fact that
that in both urban and rural areas girls over 14 years
of age (that is, of working age) are either attending
the educational institution or have withdrawn from
work due to improvement in the family income. The
most serious problem that women in the work force
face is poor quality of work. For the vast majority of
TABLE 22.6Number of Workers by Size of Enterprise in Industry and Services
Number of Workers in
Enterprises
2004–05 2009–10
Number of Workers in Million Share % Number of Workers in Million Share %
Less than 6 152.5 74.93 148.7 65.6
6 and above but less than 10 15.2 7.46 23.8 10.5
10 and above but less than 20 11.8 5.81 15.4 6.8
20 and above 24.0 11.8 38.8 17.1
Total 100 100
Source: Compiled from NSS, 2009–10 (66th Round) and NSS, 2004–05 (61st Round).

Employment and Skill Development 133
Unemployment Rate Among Youth (15–29 years)
25
1992–94
Rural Male
Rural Female
Urban Male
Urban Female
1999–2000 2004–05 2009–10
20
15
10
5
9
7.6
13.7
21.2
11.1
10.6
14.7
19.1
12
12.7
13.7
21.5
10.9
12
10.5
18.9
0
Source: NSS 55th, 61st and 66th rounds.
FIGURE 22.2: Unemployment Rate among Youth
women in non-agricultural employment they tend to work from home in home-based work, usually sub-contracted to them by male contractors in a variety of low-productivity work (for example, bidi-making, zari-making, and so on) or as helper in the construc-tion industry. It is expected that attainment of the education would empower the women to join the labour market at a slightly later age better qualified and in quality employment though in unorganised sector (Tables 22.8 and 22.9).
22.34. At the policy level, there is need to give priority to Women in the National Rural Livelihood Mission (of the Ministry of Rural Development). NRLM will facilitate the creation of self-help groups of women at national scale and provide credit to SHGs to enable them to undertake self-sustaining economic activity.
Child Labour22.35. Table 22.10 analyses incidence of Child labour since 1993–94. The incidence of child labour has declined since 1990s.
TABLE 22.10 Child Workforce Participation Rate by UPSS (Percentage), 1993–04, 2004–05 and 2009–10
Area 1993–04 2004–05 2009–10
Boys Girls Children Boys Girls Children Boys Girls Children
Rural 6.8 7.8 7.3 3.5 3.7 3.6 2.0 2.4 2.2
Urban 3.5 2.7 3.1 2.6 1.9 2.3 0.7 1.5 1.1
Combined 6.2 6.0 6.2 3.3 3.3 3.3 1.7 2.2 2.0
Source: NSSO 1993–04, 2004–05 and 2009–10.
TABLE 22.8LFPR by Usual Principal and Subsidiary Status, 1993–04, 2004–05 and 2009–10 (%) by Gender
Sector Males Females
1993–04 2004–05 2009–10 1993–04 2004–05 2009–10
Rural 87.6 85.9 82.5 49 49.4 37.8
Urban 80.1 79.2 76.2 23.8 24.4 19.4
TABLE 22.9WPR by Usual Principal and Subsidiary Status, 1993–04, 2004–05 and 2009–10 (%) by Gender
Male Female
1993–04 2004–05 2009–10 1993–04 2004–05 2009–10
86.4 84.6 81.2 48.7 48.5 37.2
76.8 76.3 74 22.3 22.7 18.3
134 Twelfth Five Year Plan
22.36. It emerges that the active participation of both boys and girls in the labour market is falling. The decline in child labour commensurate with signifi-cant increase in school enrolment of both boys and girls. Since the proportion of girls who were out of school was higher than that for boys until the middle of the 2000s, the decrease in the incidence of female child labour is largely on account of their enrolment in schools. However, the NSS data for 1993–94 and 2007–08 reveals that girls are still being held back at home in order to perform household chores. In the proportion of children in the age of 5–14 who are categorised neither as child labourers nor as students enrolled in schools 11.4 per cent of girls belong to the category of nowhere girls in the 6–14 year old age group, while only 3.8 per cent of boys in the same age group belong to nowhere children. The educa-tion sector has a pre-eminent role in ensuring that all children in the age group 6–14 years are at school. The stricter implementation of SSA and Child labour regulations can ensure that the child labour is eradi-cated from the country.
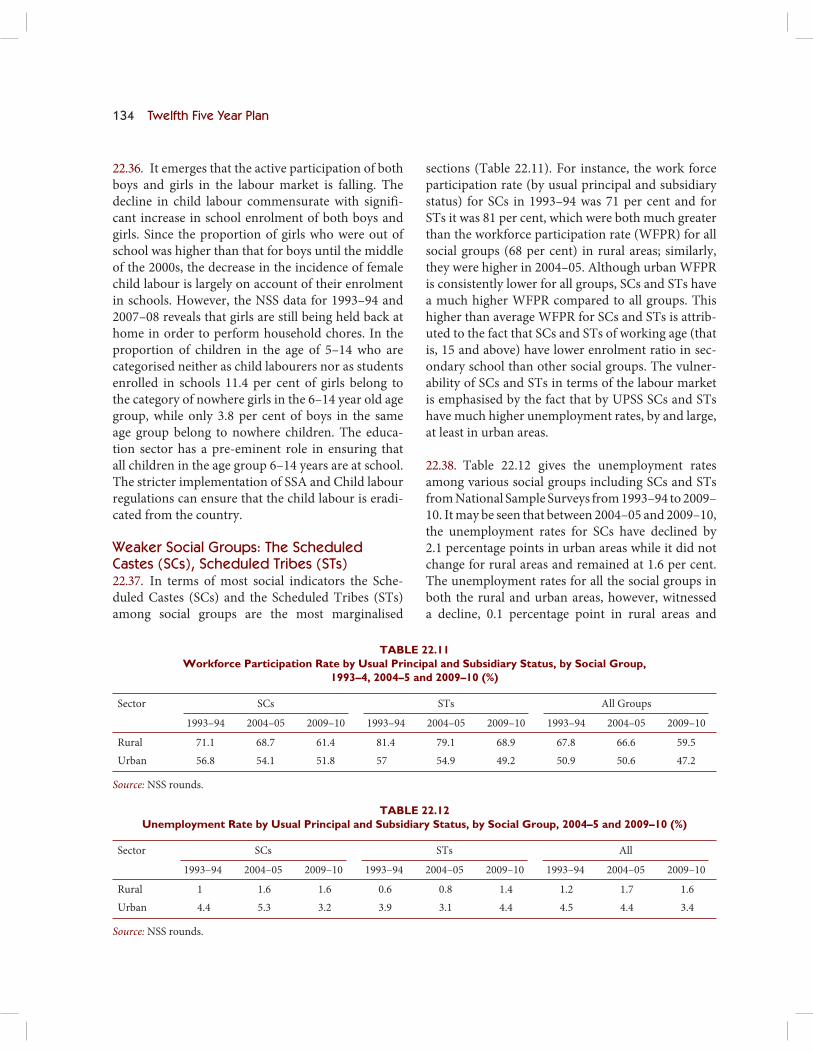
Weaker Social Groups: The Scheduled Castes (SCs), Scheduled Tribes (STs)22.37. In terms of most social indicators the Sche-duled Castes (SCs) and the Scheduled Tribes (STs) among social groups are the most marginalised
sections (Table 22.11). For instance, the work force participation rate (by usual principal and subsidiary status) for SCs in 1993–94 was 71 per cent and for STs it was 81 per cent, which were both much greater than the workforce participation rate (WFPR) for all social groups (68 per cent) in rural areas; similarly, they were higher in 2004–05. Although urban WFPR is consistently lower for all groups, SCs and STs have a much higher WFPR compared to all groups. This higher than average WFPR for SCs and STs is attrib-uted to the fact that SCs and STs of working age (that is, 15 and above) have lower enrolment ratio in sec-ondary school than other social groups. The vulner-ability of SCs and STs in terms of the labour market is emphasised by the fact that by UPSS SCs and STs have much higher unemployment rates, by and large, at least in urban areas.
22.38. Table 22.12 gives the unemployment rates among various social groups including SCs and STs from National Sample Surveys from 1993–94 to 2009–10. It may be seen that between 2004–05 and 2009–10, the unemployment rates for SCs have declined by 2.1 percentage points in urban areas while it did not change for rural areas and remained at 1.6 per cent. The unemployment rates for all the social groups in both the rural and urban areas, however, witnessed a decline, 0.1 percentage point in rural areas and
TABLE 22.11Workforce Participation Rate by Usual Principal and Subsidiary Status, by Social Group,
1993–4, 2004–5 and 2009–10 (%)
Sector SCs STs All Groups
1993–94 2004–05 2009–10 1993–94 2004–05 2009–10 1993–94 2004–05 2009–10
Rural 71.1 68.7 61.4 81.4 79.1 68.9 67.8 66.6 59.5
Urban 56.8 54.1 51.8 57 54.9 49.2 50.9 50.6 47.2
Source: NSS rounds.
TABLE 22.12Unemployment Rate by Usual Principal and Subsidiary Status, by Social Group, 2004–5 and 2009–10 (%)
Sector SCs STs All
1993–94 2004–05 2009–10 1993–94 2004–05 2009–10 1993–94 2004–05 2009–10
Rural 1 1.6 1.6 0.6 0.8 1.4 1.2 1.7 1.6
Urban 4.4 5.3 3.2 3.9 3.1 4.4 4.5 4.4 3.4
Source: NSS rounds.

Employment and Skill Development 135
1.0 percentage points in urban areas. But the unem-ployment for STs has increased in both rural and urban areas during the period 2004–05 to 2009–10.
LABOUR FORCE AND WORKFORCE PROJECTIONS FOR THE TWELFTH PLAN
Labour Force Projections22.39. The projections of labour force have been made using the latest population projections made by the NSSO and 2011 census data. The projected increase in labour force during the Twelfth Plan period for the 15 and above age group is now esti-mated to be around 24.5 million from 477.9 million in 2011 to 502.4 million by the end of 2017. This is calculated on the basis of age specific LFPRs and population distribution trend that has existed since 2004–05. India has seen deceleration in population growth rate (Census 1991, 2001 and 2011). The 66th Round has also shown a decline in the female par-ticipation rate, which could be the effect of increas-ing enrolment in educational institutions, as also the impact of rising incomes, where women do not want to do low quality jobs (backward bending labour sup-ply curve). With the focus of the policy planners on raising the gross enrollment ratio in secondary and higher education, the number of people entering the labour force may not see a significant rise. Assuming the rate of decline in population growth rate to be in line with the past trend, and taking into account the effect of education and rising family income on female work participation, the LFPR is expected to decline further. The absolute increase in the labour force by the end of Twelfth plan is therefore expected to be small. Based on these assumptions,
the population and labour force projections for the Twelfth Five Year Plan are shown in the Table 22.13.
22.40. With the enactment of Right to Education (RTE), introduction of the National Skills Quali-fication Framework (NSQF) and integration of vocational education with the secondary education, drop-out rates are likely to decrease. Creating non-farm employment opportunities for the educated youth will be a challenge for the country in near future. To meet the education targets of near full universalisation of secondary education (>90 per cent), GER of 65 per cent in higher secondary classes and expected increase of enrollment in universities and colleges from 200.3 lakhs in 2011–12 to 300.2 lakhs by 2016–17, about 28 million will be drawn out of the labor force (15–59 age group). Therefore, in order to ensure that the overall labor force partici-pation rate does not fall much over the Plan period; efforts have to be made to raise the female work par-ticipation rates.
Work Force Projections: Total and Sectoral Employment Projections22.41. The total employment over the period has been estimated on the basis of employment projec-tions for individual sectors which are then aggre-gated for the economy as a whole. These sectoral employment projections are based on sectoral GDP growth rates combined with computed employ-ment elasticities (1999–2000 to 2009–10). There are two plausible scenarios with respect to employment situation over the Twelfth Plan period. First is the business-as-usual scenario, where projections rely on an analysis of growth and employment trends
TABLE 22.13Population and Labour Force Projections
Year 2011 2012 2013 2014 2015 2016 2017
Total population (0+) 1,210.2 1,227.1 1,244.0 1,260.6 1,277.1 1,293.5 1,309.7
15 and above population (%) 70.2 71.0 71.8 72.6 73.4 74.2 75.0
Population (15 and above) in millions 849.6 871.3 893.2 915.2 937.4 959.8 982.2
LFPR for 15 and above age group (%) 56.3 55.4 54.6 53.7 52.9 52.0 51.2
Labor force (15 and above) (in millions) 477.9 482.7 487.2 491.5 495.4 499.1 502.4
Source: NSS Round and Census 2011.

136 Twelfth Five Year Plan
Eleventh Plan (Table 22.14), the projected employ-ment (15 and above age group) on a pure demand side basis is about 508.9 million. This would lead to a reduction in unemployment rate, and when adjusted for labor force participation rates, the employment in agriculture is expected to decline. Even with busi-ness-as-usual growth rates, the farm sector share in employment is expected to drop from 51.8 per cent in 2011–12 to 47.3 per cent in 2016–17. This also shows that shift from the farm to non-farm sector would be small, if the skill up-gradation and expan-sion of employment opportunities in manufacturing and services does not take place (Tables 22.15 and 22.16).
Twelfth Plan Scenario22.44. If the manufacturing sector becomes an engine of growth, by growing at the targeted two per-centage points above the overall growth rate (11 per cent); and the agriculture sector grows at 4 per cent, the sectoral growth rates would be as given in the Table 22.17.
for agriculture, manufacturing, non-manufacturing industry and services over the last Five Year Plan period. It is built on the assumption that the growth pattern of various sectors during the Twelfth Plan would be similar to what it was during the Eleventh Plan period. Second is the Twelfth Plan scenario, which takes into account the aim of the Twelfth Five Year Plan of creating quality and productive employ-ment opportunities, with focus on acceleration of the rate of transition of labor out of low productiv-ity agriculture to higher productivity industry and services sectors. If the manufacturing sector is able to reverse the declining trend of employment growth with focus on expanding the labor-intensive manu-facturing, agriculture is able to grow at 4 per cent with improvements in productivity and diversifica-tion, and the contribution from the non-manufac-turing sectors, particularly construction and services continues to increase, the planned scenario gives the alternative set of employment projections (Set 2). One of the main objectives of the growth strategy in the Twelfth Plan period must be to ensure that this process of structural change in terms of employment opportunities is accelerated.
Employment Elasticity22.42. Sectoral employment elasticities have been calculated by running a log-log regression on observed sectoral GDP figures at constant prices from 1999–2000 to 2009–10 (independent vari-able) and employment figures for the same period, obtained by interpolating the series on the 1999–2000, 2004–05 and 2009–10 employment outcomes obtained from various NSSO rounds.
Business-as-Usual Scenario22.43. If the economy and its sectors continue to grow at the rates with which they grew during the
TABLE 22.14 Employment Elasticity from Past Data
Agriculture Mining
and
Quarrying
Manufacturing Utilities Construction Trade,
Transport
and so on
Finance,
Real Estate,
and so on
Other
Services
Total
Employment
elasticity
0.04 0.52 0.09 0.04 1.13 0.19 0.66 0.08 0.19
TABLE 22.15Sectoral Growth Rates: Business-as-usual Scenario
Sector Growth Rates
Agriculture 3.3
Mining and quarrying 3.2
Manufacturing 6.8
Utilities 6.0
Construction 7.3
Trade, transport, hotels, and so on 10.0
Finance, insurance, real estate and so on 10.7
Community, social and personal services 8.3
Total 7.9

Employment and Skill Development 137
TABLE 22.16Sectoral Employment (in million): Business-as-usual Scenario
Year Agriculture Mining and
Quarrying
Manufacturing Utilities Construction Trade,
Transport,
Hotels,
and so on
Finance,
Banking,
Real Estate,
and so on
Community,
Personal
and Social
Services
Total
2009–10 241.7 2.7 50.0 1.4 43.6 68.6 9.5 37.2 454.7
2011–12 242.3 2.8 50.6 1.4 51.1 71.2 10.9 37.7 468.0
2016–17
(pure demand
side)
243.9 3.1 52.2 1.4 75.8 78.2 15.4 39.0 508.9
2016–17
(adjusted for
labour force
participation
rates)
237.4 3.1 52.2 1.4 75.8 78.2 15.4 39.0 502.4
Projected Share of Employment in per cent
2011–12 51.77 0.60 10.81 0.29 10.91 15.22 2.34 8.06 100.0
2016–17 47.25 0.61 10.38 0.28 15.09 15.57 3.06 7.77 100.0
TABLE 22.17Sectoral Growth Rates—Twelfth Plan Scenario
Agriculture Mining and
Quarrying
Manufacturing Utilities Construction Trade,
Transport,
Hotels,
and so on
Finance,
Insurance,
Real Estate
and so on
Community,
Social and
Personal
Services
Total
Growth
Rates
4.0 3.2 11.0 6.0 7.3 10.0 10.7 8.3 9.0
22.45. The cornerstone of the manufacturing policy for the Twelfth Plan is to create 10 million addi-tional jobs in the manufacturing sector by focusing on labor-intensive manufacturing and by suitable amendments to the labor regulatory framework, so that manufacturing becomes a genuine engine of employment growth in the country. If we focus on more productive and quality (organised and self-employed) employment in the manufacturing and services sector, additional 50 million job opportuni-ties can be created in the non-farm sector. But this will need a huge effort in the form of skill devel-opment aligned to the market needs. In particu-lar, manufacturing, construction, trade, transport, hospitality and financial services are the promising sectors where skill development can lead to a faster growth in employment opportunities.
22.46. As more skilled people coming back to the labor force after completing their education and training to join the work force, those under-employed in agriculture will be drawn out to fill the job oppor-tunities created by the non-farm sector. This could, in the planned scenario, bring down the projected share of employment in farm sector to about 45 per cent of the total. The details are summarised in the Table 22.18.
22.47. To summarise, the Twelfth Plan should focus on demand aligned skill development, and aim at significantly stepping up growth in employment in manufacturing, so that under-employed labour force can speedily move from low-paid farm jobs to bet-ter paid, more productive manufacturing and ser-vices sectors. Simultaneously, we should improve

138 Twelfth Five Year Plan
the working conditions for women to improve their work participation rates, and focus on greater organ-ised sector jobs that will meet the aspirations of the rising number of educated and skilled youth in the country.
CHALLENGES FOR EMPLOYMENT POLICY
Expanding Employment Opportunities22.48. The employment elasticity of the manufac-turing sector has witnessed a decline in spite of increase in the gross value added in the sector. The usual structural transformation associated with high growth does not seem to have happened in India and more people continued to be employed in agricul-ture and other forms of informal employment. The Twelfth Plan hopes to make the manufacturing sec-tor a genuine engine of growth, which could gener-ate 100 million work opportunities by 2022. The employment contribution of labour intensive manu-facturing, namely textile and garments, leather and footwear, gems and jewellery, food processing indus-tries and so on can be greatly enhanced provided the Government puts supportive policies in place. Some of these are mentioned in the sub-section below.
22.49. Incentives will have to be improved for expanding employment in the organised sector. Services like information technology, finance and banking, tourism, trade and transport are going to be
major generators of employment in the Twelfth Plan period and beyond. Sector specific strategies need to be adopted to ensure sustained expansion of employ-ment opportunities in these areas.
Simplifying Regulatory Framework22.50. The multiplicity of labour laws administered both by the Central and the State governments are not conducive for the congenial development of the factory sector. The 84 per cent of the unorgan-ised sector is outside the purview of the labour laws, while the 16 per cent organised sector is over-burdened with regulatory interference at all levels. There is need to simplify labour laws both at the Centre and the State level. In particular the following actions need to be taken on an urgent basis:
I. To ensure speedy resolution of industrial dis-putes, particularly the collective disputes which have a bearing on law and order, the District Collector or the Sub-Divisional Magistrate may be appointed as Conciliatory Officers under the Industrial disputes Act, 1947.
II. A comprehensive social security must be put into place for workers in the organised sector, which provides for pension, medical insurance and unemployment benefits that are seamlessly transferable across employers in all sectors of the economy. Suitable provisions need to be made for workers in the unorganised sector, where
TABLE 22.18Sectoral EMPLOYMENTS (in million): Twelfth Plan Scenario
Year Agriculture Mining and
Quarrying
Manufacturing Utilities Construction Trade,
Transport,
Hotels, and
so on
Finance,
Banking,
Real Estate,
and so on
Community,
Personal and
Social Services
Total
2011–12 242.4 2.8 51.0 1.4 51.1 71.2 10.9 37.7 468.6
2011–12 Farm
242.4
Non Farm
226.1
2016–17 226.0 3.1 63.5 1.4 75.8 78.2 15.4 39.0 502.4
2016–17 Farm
226.0
Non Farm
276.4
Projected Share of Employment (in per cent)
2011–12 51.74 0.60 10.88 0.29 10.90 15.20 2.33 8.06 100.00
2016–17 44.99 0.61 12.65 0.28 15.09 15.57 3.06 7.77 100.00
Employment and Skill Development 139
their own contributions can be supplemented by some support from the Government.
III. To generate greater overall employment, at least labour intensive manufacturing industries like textiles and garments, leather and footwear, gems and jewellery, food processing and so on must be permitted to adjust its labour force, in response to fluctuations in demand. The focus should be on promoting labour market flexibil-ity without compromising fairness to labour.
Addressing the Problems of Specific Categories22.51. NSS data shows that female employment has declined both in rural areas and urban areas in recent years. This is a major concern and needs to be addressed during the Twelfth Plan period. While this could be partly due to improved enrolment of girls and young women in secondary and higher educa-tion, the effect of increasing household income on female work participation rates is also being felt. As household incomes rise and budget constraints relax, women weigh the trade-offs between available employment opportunity and home making more carefully. The only way to slow down the declining female work participation rate is to make the work environment more conducive to women, and provide for the genuine needs of home-making and child care.
22.52. Unemployment among educated people is going to be a major issue during the Twelfth Plan period. India is one of the few countries which have educated unemployed in large numbers. The major reason is the dearth of vocational and technical education leading to skill mismatch in the job mar-ket. Similarly, the issue of promoting employment opportunities for minorities, SC/ST and disabled people assumes greater importance, and employ-ment oriented education needs to be provided in a manner that ensures the needs of the vulnerable sec-tions of the society are taken care of.
Bridging the Skill Gap22.53. There is need for skilling and reskilling the per-sons entering the labour force to harness the demo-graphic dividend that India enjoys. While the enrolment in technical higher education has grown,
the employers continue to complain about non avail-
ability of requisite number of skilled persons. This
challenge needs to be addressed at the All India as
well as the State level in a mission mode manner,
as otherwise the benefits of demographic dividend
would be lost. The skill enhancement also leads to
increased wages for the people and a positive growth
outcome for the economy at large.
22.54. The employment challenges as reflected above
needs to be addressed so as to meet the faster and
inclusive growth agenda for the Twelfth Plan. Skill
development should, therefore, occupy centre-stage
in any employment strategy for the Twelfth Plan. The
following paras will discuss the current status of skill
development in India, the challenges emerging from
thereon and the road map for skilling the requisite
manpower so as to reap the demographic dividend
on one hand and enhance the employability of the
labour force for inclusive growth on the other.
SKILL DEVELOPMENT: THE CHALLENGE22.55. Skill development is critical for achieving
faster, sustainable and inclusive growth on the one
hand and for providing decent employment oppor-
tunities to the growing young population on the
other. The demographic window of opportunity
available to India would make India the skill capi-
tal of world. India would be in position to meet the
requirement of technically trained manpower not
only for its growing economy but also of the aging
advanced economies of the world. Hon’ble Prime
Minister has rightly indicated that young population
is an asset only if it is educated, skilled and finds pro-
ductive employment. If this happens then our dream
of realising India’s potential to grow at 10 per cent or
more per annum for a substantial period of time can
become a reality. Boston Consultancy Group’s study
in 2007 had clearly indicated that by 2020 while
India will have surplus of 56 million working people,
the rest of the world will encounter a shortage of 47
million working people. However, skilling this large
and growing young population from an exceed-
ingly small base would be a big challenge for India.
The skill strategy for the Twelfth Plan would have to
accordingly model for these skill challenges in terms

140 Twelfth Five Year Plan
of outreach, quality, systemic/institutional setups, current status of skill development efforts and vari-ous economic policies proposed in the Twelfth Plan.
22.56. Structural shifts in the economy in terms of increase in contribution of secondary and ter-ritory sectors to GDP and demographic dividend have implications for skills development strategy. India will have about 63 per cent of its population in the working age group by 2022. China’s demo-graphic dividend would start tapering off by 2015, but India would continue to enjoy it till 2040. India needs to provide skills and training to its young workforce if this window of opportunity is not to be lost. However, the availability of demographic divi-dend varies across the country with wide variation in Northern and Southern states. While the Northern states would have young population the southern states have already started aging. It emerges from the Annexure 22.4 that the Dependency ratio in UP and Bihar at 1.05 and 1.08 respectively is lower than the dependency ratio in Tamil Nadu and Kerala at 1.74 and 1.79 respectively. This is also lower than the dependency ratio at All India Level at 1.33.
22.57. The rise in the share of the working-age popu-lation would lead to increase in demand for decent
employment opportunities. However, the realisa-tion of full potential of the demographic dividend depends on generation of adequate decent non-farm employment opportunities and up gradation of skills of existing as well as new entrants to the workforce.
The Level of Education of the Labour Force22.58. As per the 66th round of NSS (Table 22.19) the general education level of over 50 per cent of India’s labour force in the age group 15–59 remains extremely low. Of the total labour force of 431 mil-lion on UPSS basis about 29 per cent are not even literate and another about 24 per cent were having education up to primary level. Of the balance, about 29 per cent had education level up to secondary which included 17.6 per cent with middle level edu-cation. Only about 17 per cent have higher levels of education (including higher secondary, diploma/cer-tificate, graduates, and higher than graduation).
22.59. As indicated earlier in the chapter the growth is expected to lead to transition of labour out of agri-culture into industry and services sectors. However, the low education levels of the labour force, espe-cially those engaged in agriculture would make transition to non-farm sector difficult except as low
TABLE 22.19General Education Level of Labour Force (PS+SS) in the Age Group 15–59
Numbers
(mn.)
Share in Labour Force in Age
Group 15–59 per cent
Share in Labour Force
(470.1 million) per cent
Not literate 125.65 29.14 26.73
Literate without formal schooling 2.12 0.49 0.45
Below primary + Primary 102.38 23.74 21.78
Middle 76.08 17.64 16.18
Secondary 52.39 12.15 11.14
Higher secondary 29.19 6.77 6.21
Diploma/certificate course 6.02 1.40 1.28
Graduate 28.01 6.49 5.96
Graduate and above 9.40 2.18 2.00
Total 431.23 100.00 91.73
Source: NSS 66th Round 2009–10.

Employment and Skill Development 141
TABLE 22.20Estimated Number of Workers (PS+SS in the age group of 15–59) by Level of Education by Sector (millions),
2009–10
Agriculture and Allied Manufacture Non-Manufacture Service Total
Not Literate 87.36 9.56 14.42 13.65 124.99
Literate without formal schooling 1.23 0.25 0.21 0.42 2.11
Below primary + Primary 57.62 12.69 12.47 18.32 101.10
Middle 36.20 10.27 8.67 18.98 74.12
Secondary 21.30 7.02 4.27 18.21 50.79
Higher secondary 10.36 3.21 1.45 12.43 27.45
Diploma/certificate course 0.58 1.16 0.53 3.12 5.39
Graduate 3.84 3.01 1.25 17.82 25.93
Graduate and above 0.74 0.73 0.24 7.00 8.70
Total 219.23 47.90 43.50 109.96 420.59
Source: Computed from NSS (66th Round), 2009–10.
paid laborers in the construction industry. In other words, there is need to ensure basic skill, that is, at least functional literacy and numeracy among the labour force.
The Share of Vocationally Trained in the Labour Force22.60. As per the 66th Round of NSS (2009–10), the vocationally trained in the age group 15–59 in the labour force are around 10 per cent of the Labour Force in that age group. The absolute number of those who are receiving formal vocational training is 1.9 mn in 2009–10. An additional 9 mn in the labour force have already received vocational training for-mally. Finally, an additional 32.7 mn have received non-formal vocational training. Thus, the total num-ber of those received or receiving vocational training in the labour force (15–59) was 43 mn in 2009–10.
Educational Qualification and Vocational Training of Workers22.61. A look at the profile of workers by economic sectors in Table 22.20 indicates that the proportion of illiterate workers is highest in agriculture and allied activities (about 40 per cent), followed by the non-manufacturing sector (33 per cent).
22.62. Overall 10 per cent of the workforce in the age group of 15–59 years received some form of
vocational training. The proportion of workers who received vocational training was the highest in the services sector (33 per cent), followed by manu-facturing (31 per cent), agriculture (27 per cent), and non-manufacturing and allied activities (9 per cent). But the important thing is that vast majority of workers received non-formal vocational training. The proportion of workers with non-formal voca-tional training was the highest in agriculture and it was primarily in the form of hereditary transfer of knowledge. In the non-agricultural sector, the non-formal vocational training was in the form of on the job learning. Dependence on non-formal vocational training to such an extent highlights the grossly inadequate system of vocational training that cur-rently exists in the country. What is remarkable is that there is little difference between manufacturing and agriculture in the share of those with vocational training who only received non-formal training: 86 per cent in agriculture and 91.7 per cent in manu-facturing. Only in services is the share of those informal training much lower at 56 per cent (Table 22.21).
THE SKILL TARGETS FOR TWELFTH PLAN22.63. During the Twelfth Five Year Plan (2012–17), 50 million non-farm employment opportunities are proposed to be created and at least equivalent num-ber of people would be provided skill certification.

142 Twelfth Five Year Plan
TABLE 22.21Distribution of Formally and Informally Vocationally Trained Workers (PS+SS in the age group of 15–59)
Within Primary, Secondary and Tertiary Sectors (%) in 2009–10
Agriculture and Allied Manufacture Non-Manufacture Service Total
Receiving formal vocational training 18.7 16.6 5.5 59.2 100
Received vocational training: Formal 7.8 19.8 8.1 64.4 100
Received vocational training non-formal,
of which:
31.9 35.0 11.0 39.7 100
Received vocational training non-formal:
Hereditary
56.9 26.3 4.1 12.6 100
Received vocational training non-formal:
Self-learning
26.4 33.5 9.2 30.8 100
Received vocational training non-formal:
Learning on the Job
11.1 45.1 14.5 29.3 100
Received vocational training non-formal:
others
22.0 33.6 7.0 37.4 100
Total 26.8 31.4 8.7 33.1 100
Source: Computed from NSS (66th Round), 2009–10.
The existing annual training capacity in the country is 4.5 million. It needs to be more than doubled to achieve the target.
AN OVERVIEW OF THE ELEVENTH PLAN22.64. The Eleventh Five Year Plan while focus-ing on utilisation of the human resources for eco-nomic growth, recognised that skill building is not a static process and that individual’s skills needs to be upgraded continuously for workforce to remain relevant and employable. To realise this Coordinated Action on Skill Development was initi-ated in 2008 which provides for a three tier gover-nance structure, namely Prime Minister’s Council on Skill Development as apex body for policy direc-tion to be supported by National Skill Development Coordination Board (NSDCB) in Planning Commis-sion for coordinating and synergising the efforts of the various central ministries that are involved in the skill development and National Skill Development Corporation for catalysing private sector efforts in the skill development. During the Eleventh Plan most of the states have set up state skill development mis-sions for focused and synergised approach for scal-ing up of skill efforts in respective states. A National Policy on Skill Development was also formulated in 2009 which focuses on policy coherence, inclusivity,
improving the quality with emphasis on employ-ment outcomes. The government has, therefore, put in place a governance structure for implementation of skill initiatives at highest level and the policy for providing an enabling environment and framework to address the challenges of skill development.
National Policy on Skill Development Policy, 200922.65. The National Policy on Skill Development Policy formulated in 2009 envisions empowering all individuals through improved skills, knowledge, and nationally and internationally recognised qualifica-tion to gain access to decent employment and ensure India’s competitiveness in the global market. The Key Features of the Policy for addressing the chal-lenges in the skill space are given in Box 22.2.
Expansion of Training Capacity—Industrial Training Institutes, Modular Employable Skills (Vocational Training Providers) and Polytechnics22.66. The training infrastructure in terms of Gov-ernment Industrial Training institutes as well as Industrial Training Centers run by private sector saw a significant increase to reach a level of 9,447 in the Eleventh Plan from about 5,114 in the beginning of

Employment and Skill Development 143
Box 22.2Skill Policy for Promoting India’s Competitiveness in the Global Market
Objectives• Expanding the outreach by adopting established and innovative approaches to ensure equitable access to training to all
irrespective of any gender, regional, social and sectoral divide.• Promoting greater and active involvement of all stakeholders including social partners and forging a strong, symbiotic,
private-public partnership in skill development.• Develop a high-quality demand driven skilled workforce/entrepreneur relevant to current and emerging employment
market needs.• Enable the establishment of flexible delivery mechanisms that respond to the characteristics of a wide range of needs of
stakeholders.• Enable effective coordination between different ministries, the Centre and the States and public and private providers.• Creating institutional mechanism for reaserch, development, quality assurance, examination and certification, affiliation
and accreditation and coordination of skill development across the country.
CoverageThe National Skill Policy aims at promoting the following forms of delivery of skills: institution-based skill development including ITIs/Private ITIs/vocational schools/technical schools/polytechnics/professional colleges; learning initiatives of sectoral skill development organised by different ministries/departments; formal and informal apprenticeships and other types of training by enterprises; training for self-employment/entrepreneurial development; adult learning, retraining of retired or retiring employees and lifelong learning; non-formal training including training by civil society organisations; and e-learning, web-based learning and distance learning.
FinanceAll stakeholders, the Government both at Centre and States, the enterprise—public and private, and the direct beneficiary—the individual, would share the burden of mobilising financial or in-kind resources for skill development.
the Plan. The seating capacity also increased to 13.35 lakhs from 7.42 lakhs in 2007. However, the geo-graphic distribution of ITIs/ITCs remained skewed with South and West Zones accounting for 67 per cent of private and government ITIs catering to 51 per cent of the population with 60 per cent of seat-ing capacity and North and East Zones accounted for 33 per cent of ITIs catering to 49 per cent of popula-tion with 40 per cent of seating capacity. Even within each zone, there are significant state-wise variations.
22.67. With the objective of expanding the out-reach of the training facilities to school dropouts/and recognising need for prior learning of workers in the unorganised sector, ‘Modular Employable Skills (MES)’ programme has been initiated by Ministry of Labour and Employment wherein short duration courses are provided to prospective train-ees using both government and private infrastruc-ture. 1,402 modules covering more than 60 sectors
have been developed, 36 Assessing Bodies empan-elled for conducting assessment, 6,951 Vocational Training Providers (VTPs) registered and more than 13.53 lakh persons have been trained/tested up to 31.3.2012.
22.68. In addition the quality of training at ITIs has been improved through up gradation and creation of Centers of Excellence by introducing multi-skilling courses. This is done under public-private-partnership in the form of Institute Man-agement Committees (IMCs) with representatives from industries, government, and academic organisa-tions who play a major in terms of providing practical training and identification of emerging skill demands in the local industry. An interest free loan is provided to the IMC with 10 year moratorium and repay-able in annual equal instalments over 20 year period. The evaluation of such training institutes indicates improvement in physical infrastructure. However,

144 Twelfth Five Year Plan
the shortage of quality trainers remains a cause of concern which needs to be addressed urgently by up grading facilities at Model Industrial Training Institutes (MITIs) and also by capacity enhancement for Training of Trainers under Directorate General of Employment and Training (DGET).
22.69. The Courses in Polytechnics have been diversified to address skilled manpower demand of the service sector besides conventional subjects. Women’s polytechnics continued to offer courses in garment technology, beauty culture, textile design with modern techniques. The number of polytech-nics have increased to 1,914 during the year 2009–10. In addition under the Coordinated Action on Skill Development, Ministry of Human Resource Development has taken initiatives to set up 300 poly-technics through PPP by the State Governments/Union Territories in consultation with CII, FICCI, ASSOCHAM and PHD Chamber of Commerce and 400 additional Polytechnics by the private sector.
22.70. For an effective vocational education sys-tem, it is not only necessary to increase the training capacity, but also maintain a minimum standard of training. For a mandatory accreditation system, appropriate institutional structure has to be cre-ated. The details about the increase in the capacities, accreditation bodies for technical education and for universities and so on is given in Education chapter.
Apprenticeship Training Scheme (ATS)22.71. The Apprentice Training Scheme is imple-mented by Ministries of Labour and Employment and Human Resource Development under the Apprentices Act, 1961. About 254 groups of indus-tries are covered under the Act and about 27,000
establishments engage apprentices. DGE&T is responsible for implementation of the Act in respect of Trade Apprentices in the Central Government Undertakings and Departments. It is done through six Regional Directorates of Apprenticeship Training located at Kolkata, Mumbai, Chennai, Hyderabad, Kanpur and Faridabad. It covers 15–18 year olds, who have completed at least eight years of schooling. Department of Secondary Education in the Ministry of Human Resource Development is respon-sible for implementation of the Act in respect of Graduate, Technician and Technician (Vocational) Apprentices. This is done through four Boards of Apprenticeship Training located at Kanpur, Kolkata, Mumbai and Chennai and is targeted at 19 to 22 year olds who are certificate or diploma or degree hold-ers in engineering and management. The scheme has a focus on manufacturing or non-manufacturing industry and within that also only the organised sec-tor leaving the unorganised sector completely depen-dent on informal system of apprenticeship. The progress under the scheme is given in Table 22.22.
Vocationalisation of School Education22.72. The vocational education was started in schools in 1985 but the progress under the scheme remained very slow as in the beginning of the Eleventh Plan only 3 per cent were enrolled in Vocational courses at the secondary level. The Department of Secondary Education has revamped its existing scheme of Vocationalisation of Secondary School Education in 2011 which envisages strength-ening of 10,000 existing secondary schools with vocational stream and establishment of 100 new vocational schools through State Governments. The scheme envisages provision of assistance to run 500 vocational schools under PPP mode. There is a
TABLE 22.22Apprentices in India (Under the Apprenticeship Training Act, 1961)
Trade Apprentices (Mole) Graduate, Technician and Technician
(Vocational) Apprentices (MHRD)
Year Seat Available
in Lakhs
Seat Utilised
in Lakhs
Per Cent
Utilised
Seat Available
in Lakhs
Seat Utilised
in Lakhs
Per Cent
Utilised
Upto March 2011 3.37 2.21 65.57 1.02 0.65 63.74
Source: Ministry of Labour and Employment.
Employment and Skill Development 145
provision for in-service training of 7 days for 2,000 existing vocational education teachers and induc-tion training of 30 days for 1,000 new vocational education teachers. 250 competency based modules are proposed to be developed for each individual vocational course. The revision in curriculum is mandatory once in three years to ensure that the curriculum is guided by needs of the industry. A separate vocational cell has been established within the Central Board of Secondary Education. There is also provision for assistance to reputed NGOs to run short duration innovative vocational educa-tion programmes. All the components and activities would be guided by the National Skills Qualifications Framework (NSQF).
22.73. The approach so far has been to create stand-alone vocational education facilities. The need of the hour is that secondary schools in every panchayat can be used for vocational training outside the school hours. A formal system of vocational education cer-tification needs to be evolved to certify students and youths to acquire skills through this method. This would require adequate and suitable infrastructure to impart the vocational training.
Promoting Public Private Partnerships22.74. The Eleventh Plan has seen a paradigm shift in skill development strategy wherein Public Private Partnership model has been encouraged in the skill development. Besides involving private sector in upgrading the capacity in the existing institutions both at the ITI and Polytechnic level, an institutional structure in the form of National Skill Development Corporation (NSDC) has been put in place to catalyse the private sector efforts. The NSDC pro-vides soft loans to the private partners for undertak-ing skill activity. NSDC works in around 365 districts in 28 states and 2 Union Territories in both organ-ised as well unorganised sectors. NSDC along with its partners have trained over 1.8 lakh people in the year 2011–12 with an aggregate placement record of around 79 per cent.
22.75. To bring together all stakeholders, namely industry, training providers and the academia. NSDC has been catalysing the setting up of industry
led Sectoral Skill Councils (SSCs) for identified pri-ority sectors. Till March 2012, 11 such SSCs have been approved. These SSCs are expected to lay down the National Occupational Standards for different levels of jobs in their respective sectors, formulate certification and accreditation norms, strive to cre-ate knowledge repository on current requirement of skill development in the industry, assess the supply of skilled workers, identify the demand and supply gap in each sector, and identify trends and future requirements.
Training Programme for the Poor and Vulnerable22.76. Ministry of Rural Development has launched schemes for empowering young people from poor and the weaker sections of the society by imparting skills and providing gainful employment includ-ing ‘Special Projects for Placement Linked Skill Development of Rural BPL Youth’ under Swarna Jayanti Gram Swarozgar Yojana (SGSY-SP) and RUDSETI for setting up a dedicated Skills devel-opment infrastructure in each district in the coun-try aimed towards entrepreneurial development. The SGSY has been restructured and called NRLM/Aajeevika which focusses on harnessing the innate capabilities of the poor and complements them with capacities (information, knowledge, skills, tools, finance and collectivisation) to participate in the growing economy of the country. Ministry has also initiated Himayat, a placement linked skill develop-ment scheme for youth from Jammu and Kashmir. Himayat scheme will cover 1 lakh youth from J&K in the next 5 years and will be implemented through competent training providers, from the private sec-tor and non-profit Organisations. The training pro-viders for placement linked skill training will give a 75 per cent placement guarantee for the trained youth. Placement for youth will be provided all over the country, within J&K and outside. Under SII J&K Scheme, different training strategies will be used for diverse groups of youth—school dropouts, dropouts of XII class level, and those who have had college education. Ministry has also initiated Parvaaz—a pilot programme on ‘Comprehensive Skills and Education Program for Rural BPL Minority Youth’ with the objective of mainstream the minority BPL

146 Twelfth Five Year Plan
youth of the country by empowering them with edu-cation, skills and employment. This would help in bridging social divide.
Skill Development in the Unorganised/Informal Sector22.77. As per 66th NSSO round 2009–2010, 84 per cent of the total workforce was in the unorganised sector and 93 per cent in informal employment (Table 22.5). The sector is heterogeneous which cut across all economic activities in rural and urban areas. It contributes about 60 per cent of the GDP. The unorganised sector is dominated by workers in micro enterprises, unpaid family members, casual labourers, home based workers, migrant labourers, out of school youth and in need of skills, farmers and artisans in rural areas. These groups form a bottom of skill pyramid who have low skills, poor productiv-ity and low income.
22.78. The skill profile among this labour force in young group is distressing. The key issues of skill development in unorganised sector include inad-equacy of current training programme to meet the requirement of large workforce in the informal sec-tor. The formal training system because of its entry requirement and urban buyers needs does not offer skills to people with limited education and when it does, it is not appropriate to those in the rural non-farm sectors. Most workers continue to learn on the job informally at their place of work from other low skilled qualified people. The Modular Employable Skill Programme of the Ministry of Labour; STEP of Women and Child Development; Himayat, Parvaaz and NRLM of Ministry Rural Development; Community Polytechnic Development Programme of Human Resource Development and Programmes of the Ministry of Micro Small and Medium Enter-prises are some of the programmes that are benefit-ting this segment of the workforce. However, given the scale of the problem much more needs to be done in terms of up scaling the training capacities, recognition of prior learning, functional literacy and so on.
22.79. Besides these initiatives, sectoral Ministries of Textiles, Woman and Child Development, Tourism,
Health and Family Welfare, Agriculture, MSME, Urban Development and so on have also initiated large number of programmes to address the training requirement of their sectors and groups.
ISSUES AND PRIORITIES FOR THE TWELFTH PLAN22.80. There is an urgent need to mainstream skill formation in the formal education system and at the same time innovative approaches for the skill cre-ation outside the formal education system. Although the Coordinated Action on Skill Development has brought about a paradigm shift in addressing the issues of relevance in skill development, the gaps in the skill development are to be identified so as to achieve the objectives in terms of quantity, quality, outreach and mobility while building on the founda-tion. The workforce not only needs to be trained to meet the requirement of all sectors and all kinds of jobs but also linking them to job opportunities and market realities. This would facilitate transformation of young population into a productive workforce engaged in economic activities and not unproductive activity. Some of the areas that merit attention are:
• Since over 90 per cent of India’s labour force is engaged in the non-formal sector, the most impor-tant challenge would be to reach out to this sec-tor. An approach would need to be worked out to cater to the skilling needs of this very large section of workforce. Innovative approaches of work-ing through grass-root level organisations such as panchayati raj bodies would need to be considered.
• Putting in place a National Skills Qualification Framework which lays down different level of skills required by industry, which allows multiple points of entry and exit, which recognises prior learning, and which allows for mobility across different levels, as well as between vocational and technical training on the one hand, and general education on the other.
• To put in place a permanent institutional frame-work, entrusted with the requisite authority and resources, and which is responsible solely for skill development in the country.
• Students belonging to the economically weaker sections need to be supported in terms of access

Employment and Skill Development 147
to bank loans on soft terms that are linked to their placement as is the case in the higher education loans.
• To increase the training capacity in the country by adopting myriad approaches—such as facili-
tating capacity creation in public private partner-
ships as being done by NSDC, allowing available
government infrastructure to be used for train-
ing by both the public and private sector, running
training institutions in multiple shifts, increasing
the number of trainers by adding to Teachers’
Training capacity in the country, and by making it
attractive for qualified persons to opt for becom-
ing trainers. As part of this approach, the possi-
bility of using the infrastructure, equipment and
manpower of sick public sector units would also
be explored.
• Further building on the potential of the Modular
Employable Skill Programme by ensuring that
combination of modules sufficient to guarantee
employability are delivered to the trainees intro-
ducing more course modules and strengthening
of assessment and certification systems for quick
delivery.
• Developing a cogent and sustainable approach
to provide for industry participation in skill
development, particularly in the field of develop-
ing course content which is aligned to industry
requirements. Similarly, accreditation and certifi-
cation standards to be developed with industry’s
active participation through the medium of Sector
Skill Councils.
• Developing the Labour Market Information
System for real time information on sectoral basis
to help trainees and make training relevant.
• Making necessary changes to the regulatory frame-
work governing the employment of apprentices so
that this avenue is able to contribute significantly
to the skill development effort in the country. To
achieve this, industry needs to be made an active
partner, and a collaborative approach with indus-
try would be adopted. Such an approach would
permit using the potential offered by MSME units
also. Through the use of policy and other tools,
to encourage the creation of training capacity in
a manner that dovetails with the population and
sectoral requirements. The current lop-sided geo-
graphical distribution of training facilities and
the concentration of training facilities in only a
few sectors would be corrected so that training
capacity is created in the areas of high population and in sectors which have been identified to offer skill gaps.
• Making Skills aspirational among youth, through advocacy campaigns aimed at social change. These efforts would be complemented by neces-sary changes in the regulatory framework to make it economically rewarding for persons to become skilled—such as through providing sufficient dif-ferential in the minimum wages for unskilled, semi-skilled and skilled workers.
22.81. The aim should be to increase the percent-age of the workforce which has received formal skills through vocational education and training from 10.0 per cent at present to 25.0 per cent by the end of the Twelfth Plan. This would mean substantial increase in the skill training capacity in the next five years.
22.82. The approach to the Twelfth Five Year Plan has identified Priority sectors for employment gen-eration and skill development (see Box 22.3 below).
22.83. The key challenges/areas requiring attention are discussed below.
Quality, Quantity, Equity and Systemic Reforms22.84. The priorities/challenges in Skill Development and Training as indicated in the foregoing para-graphs can be grouped under the following: (i) qual-ity and relevance, (ii) quantity, (iii) expansion of outreach and equity, and (iv) systemic reforms.
Quality Issues22.85. Quality Issues: Quality and relevance of skill development are key to India’s global competitive-ness as well as improving an individual’s access to decent employment. To increase the relevance with future labour market including promotion of self-employment, soft skills and entrepreneurship skills need to be made integral parts of skill development.
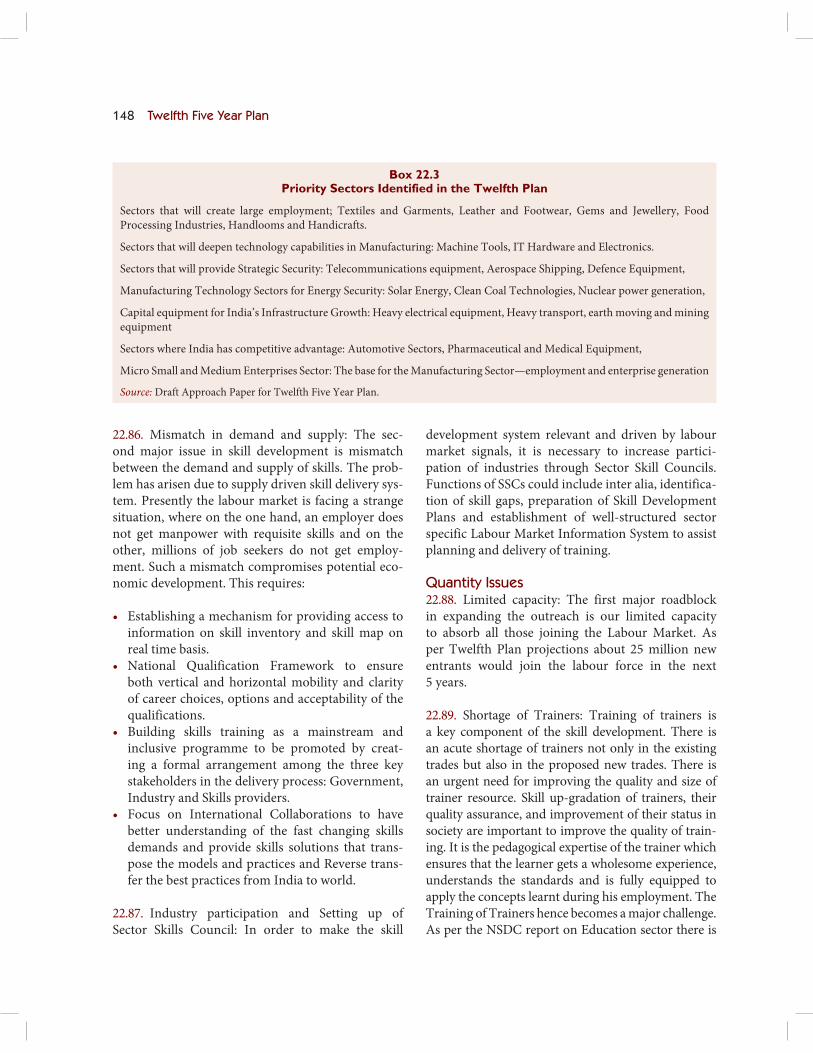
148 Twelfth Five Year Plan
Box 22.3Priority Sectors Identified in the Twelfth Plan
Sectors that will create large employment; Textiles and Garments, Leather and Footwear, Gems and Jewellery, Food Processing Industries, Handlooms and Handicrafts.
Sectors that will deepen technology capabilities in Manufacturing: Machine Tools, IT Hardware and Electronics.
Sectors that will provide Strategic Security: Telecommunications equipment, Aerospace Shipping, Defence Equipment,
Manufacturing Technology Sectors for Energy Security: Solar Energy, Clean Coal Technologies, Nuclear power generation,
Capital equipment for India’s Infrastructure Growth: Heavy electrical equipment, Heavy transport, earth moving and mining equipment
Sectors where India has competitive advantage: Automotive Sectors, Pharmaceutical and Medical Equipment,
Micro Small and Medium Enterprises Sector: The base for the Manufacturing Sector—employment and enterprise generation
Source: Draft Approach Paper for Twelfth Five Year Plan.
22.86. Mismatch in demand and supply: The sec-ond major issue in skill development is mismatch between the demand and supply of skills. The prob-lem has arisen due to supply driven skill delivery sys-tem. Presently the labour market is facing a strange situation, where on the one hand, an employer does not get manpower with requisite skills and on the other, millions of job seekers do not get employ-ment. Such a mismatch compromises potential eco-nomic development. This requires:
• Establishing a mechanism for providing access to information on skill inventory and skill map on real time basis.
• National Qualification Framework to ensure both vertical and horizontal mobility and clarity of career choices, options and acceptability of the qualifications.
• Building skills training as a mainstream and inclusive programme to be promoted by creat-ing a formal arrangement among the three key stakeholders in the delivery process: Government, Industry and Skills providers.
• Focus on International Collaborations to have better understanding of the fast changing skills demands and provide skills solutions that trans-pose the models and practices and Reverse trans-fer the best practices from India to world.
22.87. Industry participation and Setting up of Sector Skills Council: In order to make the skill
development system relevant and driven by labour market signals, it is necessary to increase partici-pation of industries through Sector Skill Councils. Functions of SSCs could include inter alia, identifica-tion of skill gaps, preparation of Skill Development Plans and establishment of well-structured sector specific Labour Market Information System to assist planning and delivery of training.
Quantity Issues22.88. Limited capacity: The first major roadblock in expanding the outreach is our limited capacity to absorb all those joining the Labour Market. As per Twelfth Plan projections about 25 million new entrants would join the labour force in the next 5 years.
22.89. Shortage of Trainers: Training of trainers is a key component of the skill development. There is an acute shortage of trainers not only in the existing trades but also in the proposed new trades. There is an urgent need for improving the quality and size of trainer resource. Skill up-gradation of trainers, their quality assurance, and improvement of their status in society are important to improve the quality of train-ing. It is the pedagogical expertise of the trainer which ensures that the learner gets a wholesome experience, understands the standards and is fully equipped to apply the concepts learnt during his employment. The Training of Trainers hence becomes a major challenge. As per the NSDC report on Education sector there is

Employment and Skill Development 149
an incremental requirement of 86,64,000 teachers and trainers between 2008 and 2022. This fund support should not only allow the State Governments to retain
the trainers for the schools and other institutions but
also invite participation of many more people into the
training industry.
Expansion of Outreach and Equity22.90. India’s large geographical territory comprising
of 6,38,365 villages, 4,378 towns in 35 states/UTs and
640 districts with difficult terrain and varying socio-
economic conditions make the implementation of
standardised skill-training a huge challenge. 11 most
populous States like Bihar, (with a population greater
than that of Germany), Jharkhand, Uttar Pradesh,
Chattisgarh comprising 80 per cent of India’s popu-
lation with little access to skills training need to be
taken up on priority. About 90 per cent of the 15–59
year olds have had no vocational training. Of the
10 per cent who received vocational training, only
2 per cent received formal vocational training.
Therefore, access to skills programmes is a major
challenge. Moreover, many emerging fields are com-
ing up for which vocational training is needed (such
as Nano Technology, Green Initiatives, and so on)
so as to maintain relevance with recent changes.
The need is to implement the customised training
depending on the geographical differences, capaci-
ties of the local people and requirement of the indus-
try. Providing opportunities of skill development to
all sections of society irrespective of any economic,
social, regional, gender, spatial and sectoral divide is
necessary to achieve faster and inclusive growth and
for development of a just and equitable society.
Systemic Reforms22.91. National Skills Qualifications Framework:
Currently there is no system in place which provides
a framework to whole skill development and training
sphere. There are no standards set in many areas cre-
ating problems for all the stakeholders. It is therefore
needed to implement and run NSQF effectively.
22.92. Labour Market Information System: Dynamic
and relevant inputs are important for taking
informed decisions. Presently, there is no system
where the stakeholders of employment and training,
namely Government, Industry, Job seekers, private
vocational training setups and so on can stream rel-evant information on a common ICT platform and benefit there from.
22.93. Testing Bodies: The number of Industrial Training Institutes (ITIs) and Polytechnics have increased significantly over the past years. Also, with the introduction of modular pattern of train-ing, the number of examinations conducted has also increased. All these activities have increased the volume of the work involved, resulting in delay in certification. The successful trainees have to wait for months to obtain the certificates. The assessment and certification bodies could be separated for facili-tating early employment outcomes.
LEARNING FROM OTHER COUNTRIES22.94. As noted above, skill devlopment and voca-tional education is a critical area of concern in the Indian context. As far as enrolment in vocational education and training courses is concerned, India has net enrolment of 3.5 million per year, as com-pared to 90 million in China and 11 million in US. India can learn from the strengths of the vocational education and training systems of other countries, namely, active participation of industry and employ-ers to map current and future skill needs; sharing of work benches by the Industry; creation of asset bank of infrastructure to be used both by the private and the public sector; capacity to effectively train its large young population in Apprenticeship programme through use of MSME clusters; Training of Trainers including testing and certification of vocational teachers may be adopted; Incentives for Industry in terms of tax exemptions in lieu of training and extensive use of ICT.
LEARNING FROM DIFFERENT STATES INITIATIVES22.95. The skill development has been a priority area for government at the State level as well. The States are implementing Central as well as their own schemes which take into account the State issues. Some of the good practices in terms of Skill Voucher, multi skill development centres, addressing needs of

150 Twelfth Five Year Plan
non literates and dropouts and so on are addressing
different challenges, namely expanding outreach,
improving quality, ensuring mobility and flexibility
can be replicated and scaled up to address the issues
at national level. The key learning’s from different
States best practices are:
1. Emphasis on outcome and not infrastructure.
2. Government should ensure level playing field for
private providers vis a vis public institutions.
3. Provide flexible schedule and multi skilling at
own time.
4. Success through innovation in training and
development.
5. Continuous linkage with industry.
6. Encourage Public Private Partnerships.
7. Enhance choice for trainees.
8. Create awareness among the prospective trainee
and employers.
A ROADMAP FOR THE TWELFTH FIVE YEAR PLAN22.96. It emerges from above that at present there is
low penetration of vocational education and train-
ing in India and skills are yet to become aspirational
among the youth. In order to realise the vision of
the PM Council on Skill Development the need of
the hour is to formulate appropriate policies and
Programmes that lead to scaling up of skill efforts,
improve quality and relevance of vocational education
through active industry involvement; Promote Public
Private Partnership in skill development; facilitate
mobility between general and vocational stream; and
creation of credible certification and assessment sys-
tem with industry participation. The success of skill
initiatives depends on creation of awareness among
youth and adequate availability of financial resources.
22.97. In order to address the issues relating to quan-
tity and quality improvement; expansion of outreach
and equity and systemic and institutional reforms
a time bound action plan in terms of well-defined
implementation and operational strategies with
focus on the delivery of the skill is the need of the
hour. The key strategies that need to be followed are
given in the Box 22.4.
Permanent Institutional Structure for Driving the Skill Development Agenda22.98. There is need for an overarching institutional structure that has the authority and responsibility to coordinate the skill development activities of all the other agencies engaged in the same—both at the central and state levels, and to also engage with non-government players, including the corporate and NGO sectors. Accordingly, setting up of a National Skill Development Authority is being considered. The proposed Authority may discharge the functions outlined in Box 22.5.
National Skill Qualification Framework (NSQF)22.99. The national policy on skill development man-dates the necessity of qualification framework to address inter-alia the issues of the fragmentation in the skill system both at the central and the state level; lack of uniformity in nomenclature of courses, dura-tion, curriculum design, content and examination system of various Technical Vocational Education & Training (TVET) courses alongwith recognition of prior learning; easy entry and exit for students between vocational and general education stream as well as to progression in vocational education like in the general education and facilitate mobil-ity between programmes and institutions across the country. The system of multi-entry and multi-exit will enable students to acquire some skills after fin-ishing compulsory general schooling, then enter the labour market and gain some work experience and return to the Vocational Education and Training system to continue their vocational education/train-ing. The system would facilitate credit accumulation and transfer which would convert all forms of learn-ing in higher certificate/diploma and degree. It would be particularly beneficial for relatively poor students, since it would enable them to continue in either the vocational education stream of the secondary system or the ITI system, rather than dropping out from the educational or vocational training space altogether.
22.100. It would facilitate the training system to be in sync with Industry demand and recognition of prior learning. The certification of prior learnt skills would improve the employability and raise the income and also dignity of such skilled workers.
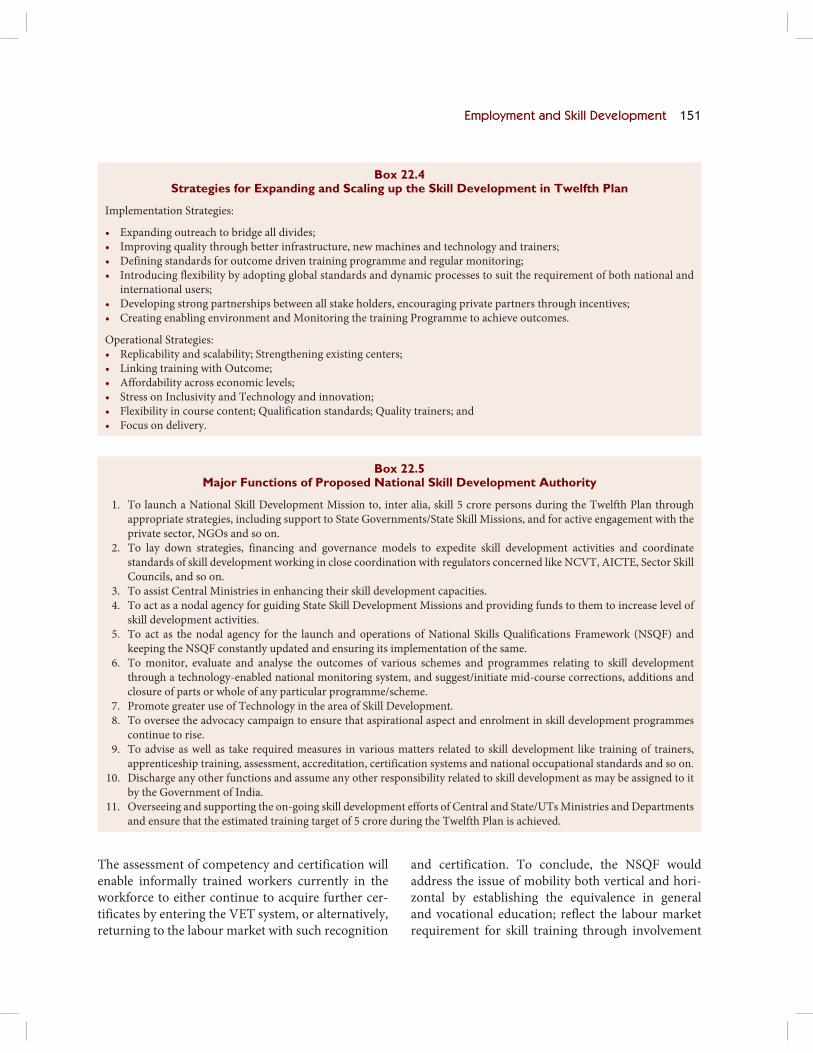
Employment and Skill Development 151
Box 22.4Strategies for Expanding and Scaling up the Skill Development in Twelfth Plan
Implementation Strategies:
• Expanding outreach to bridge all divides;• Improving quality through better infrastructure, new machines and technology and trainers;• Defining standards for outcome driven training programme and regular monitoring;• Introducing flexibility by adopting global standards and dynamic processes to suit the requirement of both national and
international users;• Developing strong partnerships between all stake holders, encouraging private partners through incentives;• Creating enabling environment and Monitoring the training Programme to achieve outcomes.
Operational Strategies:• Replicability and scalability; Strengthening existing centers;• Linking training with Outcome;• Affordability across economic levels;• Stress on Inclusivity and Technology and innovation;• Flexibility in course content; Qualification standards; Quality trainers; and• Focus on delivery.
Box 22.5Major Functions of Proposed National Skill Development Authority
1. To launch a National Skill Development Mission to, inter alia, skill 5 crore persons during the Twelfth Plan through appropriate strategies, including support to State Governments/State Skill Missions, and for active engagement with the private sector, NGOs and so on.
2. To lay down strategies, financing and governance models to expedite skill development activities and coordinate standards of skill development working in close coordination with regulators concerned like NCVT, AICTE, Sector Skill Councils, and so on.
3. To assist Central Ministries in enhancing their skill development capacities.4. To act as a nodal agency for guiding State Skill Development Missions and providing funds to them to increase level of
skill development activities.5. To act as the nodal agency for the launch and operations of National Skills Qualifications Framework (NSQF) and
keeping the NSQF constantly updated and ensuring its implementation of the same.6. To monitor, evaluate and analyse the outcomes of various schemes and programmes relating to skill development
through a technology-enabled national monitoring system, and suggest/initiate mid-course corrections, additions and closure of parts or whole of any particular programme/scheme.
7. Promote greater use of Technology in the area of Skill Development.8. To oversee the advocacy campaign to ensure that aspirational aspect and enrolment in skill development programmes
continue to rise.9. To advise as well as take required measures in various matters related to skill development like training of trainers,
apprenticeship training, assessment, accreditation, certification systems and national occupational standards and so on.10. Discharge any other functions and assume any other responsibility related to skill development as may be assigned to it
by the Government of India.11. Overseeing and supporting the on-going skill development efforts of Central and State/UTs Ministries and Departments
and ensure that the estimated training target of 5 crore during the Twelfth Plan is achieved.
The assessment of competency and certification will enable informally trained workers currently in the workforce to either continue to acquire further cer-tificates by entering the VET system, or alternatively, returning to the labour market with such recognition
and certification. To conclude, the NSQF would address the issue of mobility both vertical and hori-zontal by establishing the equivalence in general and vocational education; reflect the labour market requirement for skill training through involvement

152 Twelfth Five Year Plan
of industry in curriculum development, certification and so on; encourage multi entry and multi exit and recognition of prior learning.
Skilling Workers in the Unorganised/Informal Sector22.101. As indicated in para 22.77, 84 per cent of the workers are employed in the unorganised sector and 93 per cent are engaged in informal employment. Although different Ministries/Departments have taken initiatives however, the scale of problem in the heterogeneous sector dominated by workers in the micro enterprises, unpaid family members, farmers, artisans, out of school youths, casual, migrant and home based workers is huge and requires more con-certed effort to improve their skills. It is estimated that there are about 7,000 clusters in the country of which more than 6,000 are classified as micro enter-prise clusters and around 650 are manufacturing clusters. The skill up gradation can be undertaken in clusters which are providing informal employ-ment. The Ministry of Micro, Small and Medium Enterprises is operating schemes to develop such clusters to become globally competitive as well as to develop entrepreneurs. There is need to adopt the district level programme with the clusters. The skill development in the unorganised sectors requires more. There are 2.6 crore MSMEs in the country which are providing employment to 6 crore persons and manufacture more than 6,000 products. It con-tributes about 45 per cent of the total manufacturing output, 40 per cent share in the exports and contrib-utes 8 per cent to the GDP.
22.102. To promote skill development in unorgan-ised sector following issues need to be addressed:
a) To upscale the training capacities from the pres-ent capacity of training,
b) Skill up-gradation and certification,c) Recognition of prior learning, d) Spreading skill development activities through-
out the country, particularly in the backward areas and the areas affected by extremism and reach the weaker sections of the society through setting up of Skill Development Centres (SDCs),
e) Provision of literacy and basic education,
f) Replication of successful models,g) Provision of mobile training vans for larger out
reach,h) Each MSME cluster can act a centre for appren-
ticeship training,i) Developing an eco-system for improvement in
the success rate of training in self-employment or job employment through the process of Train—Loan-Link—Support,
j) Developing a pool of certified trainers with ade-quate technical competency, and
k) Developing a transparent system for conduct of the programmes, registration of participants and so on and putting it in the public domain.
Fostering Public Private Partnerships22.103. Governments have taken number of steps to catalyse the involvement of private sector in the skill development efforts which range from setting up of institutional framework of NSDC, setting up Industrial Management Committees for up gra-dation of infrastructure, adoption of institutes by industrial houses and so on. However, given the scale of the challenge to train 500 million skilled man-power by 2022, there is need for greater participation on the part of private sector both in terms of tech-nology transfer and actual training both trainees and trainers. This may involve extension of financial sup-port to the private industrial training institutions in modernisation of their infrastructure and expansion. The industries need to be involved in curriculum design to make it more relevant and also in assess-ment and certification. Permitting the private sector to use the unutilised/under-utilised capacity created within the government system would be another cost-effective way to foster the PPP approach. The NGOs can be effective partner for reaching out effec-tively in the remote and difficult areas.
Strengthening and Revamping the Institutional Structure22.104. The introduction of skill framework would require re-engineering of existing institutions and the building of new ones. There is need for a perma-nent institutional structure as indicated in Para 22.98 which can act as focal point for coordinating the efforts of different Central Ministries/Departments

Employment and Skill Development 153
and state governments in the field of skill devel-opment. The proposed new Authority would be responsible for policy formulation, assisting the skill development mission in capacity enhancement and promoting NGOs and Private sector involvement in the skill development.
22.105. Another critical set of new institutions that have to be built are the Sector Skill Councils. For identifying skills availability and for scaling up skill development efforts in different sectors. The Sector Skill Councils can act as a crucial means to promote industry ownership and acceptance of skill devel-opment standards. The role of existing institutions such as the National Council of Vocational Training (NCVT, currently part of the MoLE’s Directorate-General of Employment and Training); the establish-ment of new Regional Directorates of Apprenticeship Training; expanding capacity for instructor training; and so on, need to be reviewed.
22.106. The National Policy on Skill Development has envisaged re-engineering of National Council of Vocational Training (NCVT) to play a greater role in the field of skill development. Presently NCVT is the apex advisory body looking after various func-tions like trade testing and certification, prescribing standards in respect of syllabi and so on for train-ing provided by the ITIs (Government and Private). The NCVT needs to be given autonomy with its own secretariat through a bill in the Parliament. The Ministry of Labour and Employment has already ini-tiated a process to this effect in the Eleventh Plan.
22.107. In addition there is need to have additional Trade Testing Capacity an independent—National Board of Trade Testing Certification (NBTTC), to avoid inordinate delay in issuance of certificates to the students for speedy employment. This cen-tre needs to be independent of the delivery system making assessment more relevant, transparent and swift. The center would design and conduct all India Trade Tests; after evaluation entered the results into the centralised ‘Trade Testing Certification’ sys-tem which would be developed by the NBTTC and accessible through intranet/VPN based internet by each centre. The NBTTC would ensure issuance of
provisional certificate by the centre (Generated on-line by TTC system) to the candidate, printing of trade certificate by NBTTC and sending the same by courier in a pre-defined service level agreement with a logistics partner and provision of an electronic cer-tificate and giving legal sanctity to it.
Expanding the Out Reach to Under-served Areas and North Eastern States through PPP22.108. There is need to set up ITIs and Skill develop-ment centers in the under-served Blocks of the coun-try. MOLE is proposing to set up these institutions under PPP mode in the Kaushal Vikas Yojana. The scheme when implemented would create 3,000 ITIs and 5,000 Skill Development Centers in the country. This would take skill development to the doorstep of the rural population. Skill Development Centers would provide training on short term modular basis course certification system. In addition women skill development would also be promoted through open-ing of new Regional Vocational Training Institutes which would enable them to earn decent employ-ment and gain economic independence. There is also need to set up training institutes in SC/ST, minority and weaker section of the society dominated areas to facilitate their participation in skill development for enhancing their employability.
22.109. Youth from low-income families in rural and semi-urban areas are unable to access vocational training as they cannot afford to pay the fees nor-mally charged by training institutes located primar-ily in urban centres. The existing framework, in both public and private sectors, currently provides formal skill development opportunities to about 1.4 million persons annually, which is far less than the projected requirement. Since the current policy and regulatory framework will not be able to attract the required investment into this sector, there is an urgent need to create an enabling framework that would attract private participation through Public Private Partner-ship (PPP).
22.110. As part of the Government’s initiative to augment the programmes for skill development, the Prime Minister had announced setting up of 1,500 ITIs through Public Private Partnership (PPP) during the

154 Twelfth Five Year Plan
Eleventh Plan. The scheme could not be launched in the Eleventh Plan and it is now proposed to take up 3,000 ITIs during the Twelfth Plan in blocks which are unserved, that is, no government approved ITI is operating in such blocks. For this purpose, the Central Government has prepared a scheme for pri-vate participation in ITIs under the Kaushal Vikas Yojana (KVY). The objective of the scheme is to set up 3,000 ITIs through (PPP) for skill development of about 30 lakh youth, of which 15 lakh would be from socially and economically disadvantaged categories.
22.111. This scheme aims at optimising on the respective strengths of the public and private sector entities engaged in skill development. Mobilising the requisite investments, setting up first-rate ITIs, ensur-ing efficiency in operations and management, and enabling post-training employment will be the pri-mary responsibilities of private sector entities while the Government will provide the enabling frame-work and the requisite financial support especially in respect of students from socially and economically less privileged families. The proposed model would accelerate this much needed skill development pro-gramme and not only provide gainful opportunities to a large number of aspiring youth, but also meet the growing deficit of skilled personnel.
22.112. There is need to enhance the training infrastructure in the North East also to enhance employability and competencies and promotion of self-employment and entrepreneurship amongst youth. The existing programmes of MoLE and Ministry of DONER needs to be strengthened. Ministry of Labour and Employment proposes to initiate schemes to cater to this requirement.
Training of Trainers22.113. The demand for trained instructors is huge as compared with the capacity of instructor train-ing of DGE&T field institutes. Presently, the gross requirement of instructors is 79,000. The additional requirement of instructor per annum is about 20,000 whereas the present instructor training capacity of about 2,000 per annum which is inadequate to meet the demand. There is huge gap and in many insti-tutes there are 60 to 70 per cent vacancies which
would be a serious bottleneck in enhancing skill development target. To address this problem, the facilities of Model ITIs are proposed to be upgraded. This initiative would add further capacity to bridge the gap between the demand and the existing infra-structure in place. The output from such an initiative would be 1,200 trained instructors per year at the rate of 300 trained instructors/MITI every year. As of now there are 4 MITI. There is need for a setting up of dedicated trainers skill institute.
22.114. In addition the industry may be involved in training the trainers. This can be done through vari-ous fellowship programmes, industry exposure to faculty to match the emerging needs of the economy, flexible teaching and cross movement of faculty to industry and industry personnel to institutions to enhance quality of teaching learning process; active participation of industry in training programmes conducted in ITIs and other technical institutions; encouraging employment of retired trained man-power from the defense forces, employ skilled work-ers from the industry and also retired instructors. In addition there is need to strengthen the capacities of the line ministries and institutes involved in curricu-lum development.
Reforming the Apprenticeship System22.115. The Apprenticeship system is in need of major reform in terms of enhancement in both physical and human infrastructure. There is a need to develop a centralised institutional mechanism at the RDATs and a matching Web Portal at the dis-trict/state/national level with transparency in the process of filing applications for apprentice training. The web-based Portal would enable the employers to publish their trade-wise requirements of appren-tices and facilitate apprentices to apply online. These processes may be facilitated by the LMIS. The MoLE is proposing the Amendment in the Apprenticeship Act, 1961. The norms relating to engagement of skilled workers as apprentices under the Apprentice-ship Act 1961 need to be made flexible. The stipend paid may be enhanced linked to minimum wages for the trade at the state level. Industry should be free to pay higher stipend to apprentices if it feels so. Given the need to train larger numbers as apprentices for

Employment and Skill Development 155
eventual employment. The MSME may explore the avenues for engaging apprentices. Further modu-lar courses can be brought under the purview of the Apprenticeship Act.
Credible Assessment and Certification System22.116. Certification and assessment are one of the key drivers leading to quality assurance and enhanced employability which would result in industry engagement. Certification and assessment as a procedure and as an outcome are key aspects for collaboration.
Labour Market Information System (LMIS)22.117. Currently there is no common platform where industry, job seekers and government can share information and take informed decisions. Pro-spective employees may acquire skills which have lit-tle or no demand or may take a career path which has little relevance in the market. The government does not have reliable data source of industry demand/available skills and the labour market conditions with the result effective policy decisions impacting training and enhancing employment potential of youth can-not be taken. This situation is disappointing for both prospective employers and employees resulting in job mismatch and low and inferior quality output. This necessitates the implementation of a Labour Market Information System (LMIS) which would pave the way for a shared platform providing quantitative and qualitative information and intelligence on the labour market to all the stakeholders for making informed plans, choices, and decisions related to their business requirements, career planning, education and train-ing programmes, job search, recruitment, labour policies and workforce investment strategies. LMIS would facilitate formulation of effective policies for filling the skills gap; evaluating results of labour related policies and programmes; providing key indi-cators on demand and supply labour. It would assist the job seekers take informed decisions about their future career development by providing information on the needs of the labour market; identify current and future job market opportunities; provide analysis of the labour market based on the economic develop-ment and also enable employers take decisions about
upgrading their employees’ skills; access informa-tion on skills available in the labour market; different labour characteristics such as labour policies, labour costs and so on.
Making Skills Aspirational through Advocacy22.118. There is great need of attaching prestige to Vocational Training and make it aspirational in the society. To improve the social acceptability, intensive awareness generation is necessary. At present there is lack of awareness about the type of courses, trades and institutions both Government and private and also about opportunities in the field of vocational education and training. The awareness generation requires sensitisation through various audio visual media, skill fair and competitions at District, State and National Level; public campaign about the sig-nificance of the vocational training in enhancing the employability for decent jobs and so on.
22.119. The information can be created and spread through key locations/centers where it is conveni-ently accessible to the target group. In addition to being repository of information these centers can also act as training/testing centers. Universities can facilitate creating a brand value of vocational edu-cation and training by setting up skill development centers with a good degree of autonomy.
22.120. The NSQF would also go a long way to attract students to vocational courses for better career pros-pects than going to a general education system. At present different ministries/departments are creating awareness generation through different medias but in a very limited way. The NSDC is doing advocacy to popularise vocational education and training in the country in a focused manner. The details of the skill development initiatives at the secondary school and higher education are discussed in the respective chapters in the Plan document.
FINANCING SKILL DEVELOPMENT22.121. In India, currently the training programmes both at the Central and the State level are funded from the plan budget. However, the challenge of skilling the youth bulge requires a paradigm shift in the financing pattern of vocational training and

156 Twelfth Five Year Plan
skill development involving innovative solutions. Financing of the skill development involves both mobilisation of resources and allocating the same. The financing should involve public, private and PPP mode. A successful financing model for vocational education and training depends on factors such as demand driven skill system; sustainable funds; trans-parent and outcome based fund allocation; competi-tion for funds among training providers and so on. This can be done when the ad-hoc allocation of funds is stopped and institutions are provided funds for training based on some transparent guidelines both at central and state level requiring placement as an end result (that is, as in the NSDC funding model). Creation of training funds are an increasingly com-mon vehicle for financing training in many countries worldwide A typology of funds for training based on the purpose is given in Table 22.23.
22.122. The strategy for financing the skill develop-ment requires addressing both the aspects of financ-ing, namely resource mobilisation and allocation of resources. The resource mobilisation requires that all the stakeholders, namely Government, students and employers share the burden. While government pro-vides funds through budget, there is role for greater involvement of employers and students in the financ-ing of the training. However, this will happen only if the outcomes of the training are improved in terms of availability of right skilled workers to employers and decent employment to skilled youth. As regards students sharing the cost of training it may be indi-cated that governmentt can offset the adverse impact on the poor students by providing the scholarships/loan on easy terms. In fact large number of Central
Ministries/Departments and State governments are providing scholarships to students of poor and mar-ginalised sections of the society. The private sector needs to take greater responsibility for skill devel-opment. In India, the employers do bear the cost through their own in-service training but the results are not very encouraging. Box 22.6 gives details of successful financing innovation in number of countries.
22.123. The experiences of other countries in terms of innovative financing solutions such as tax deduc-tions; levy grant system; training funds; skill vouchers need to be considered. Across the globe and many of the South Asian and East Asian Countries, National Training Funds (NTFs) or Skill Development fund (Singapore) or Human Resource Development Fund in Malaysia levy reimbursement scheme have been created for financing training. The Training Fund provides an institutional framework for collecting and allocating funds to training providers. The fund has been responsible for massive growth in the train-ing. The fund unifies and augments public funding and allocate resources in line with national priorities. The training funds need to be sustainable and used to provide budgets to institutions training for work-ers for the formal sector, incentives to formal sector enterprises to train their workers through some kind of levy grant scheme, training courses for the unem-ployed and the disadvantaged groups, training for micro enterprises and the informal sector.
22.124. As indicated above in India most of the training is funded by the public resources although in the Eleventh Plan, National Skill development
TABLE 22.23A Typology of Training Funds
Type Main Purpose Financing Sources
Pre-employment Training Fund Finance the expansion and delivery of initial training
before employment
Payroll levy—revenue generating
Enterprise Training Fund Provide incentives to increase in-service training of
workers within enterprises
Payroll levy—incentive schemes
Equity Training Fund Increase opportunities for skills acquisition by
disadvantaged groups not covered by enterprise schemes
Public subsidy, levy or donors
Source: Johanson, R. (2009), A Review of National Training Funds—SP Discussion Paper No. 0922, World Bank, November 2009
(page 6).
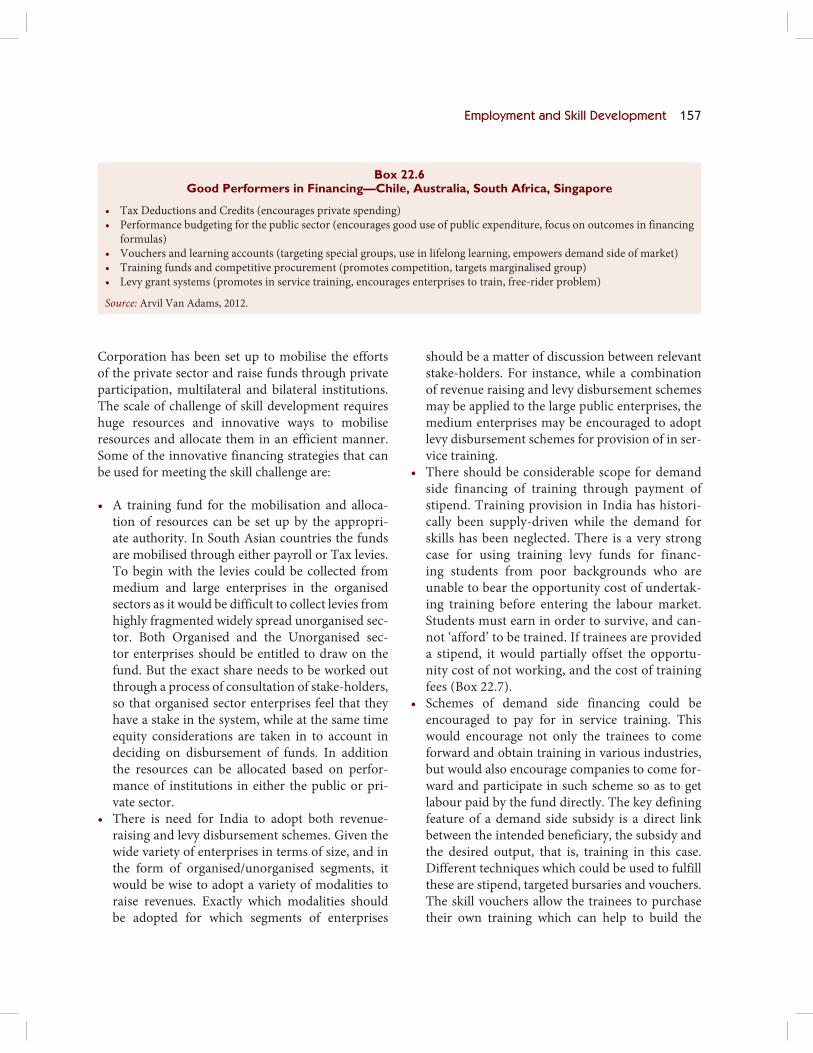
Employment and Skill Development 157
Corporation has been set up to mobilise the efforts of the private sector and raise funds through private participation, multilateral and bilateral institutions. The scale of challenge of skill development requires huge resources and innovative ways to mobilise resources and allocate them in an efficient manner. Some of the innovative financing strategies that can be used for meeting the skill challenge are:
• A training fund for the mobilisation and alloca-tion of resources can be set up by the appropri-ate authority. In South Asian countries the funds are mobilised through either payroll or Tax levies. To begin with the levies could be collected from medium and large enterprises in the organised sectors as it would be difficult to collect levies from highly fragmented widely spread unorganised sec-tor. Both Organised and the Unorganised sec-tor enterprises should be entitled to draw on the fund. But the exact share needs to be worked out through a process of consultation of stake-holders, so that organised sector enterprises feel that they have a stake in the system, while at the same time equity considerations are taken in to account in deciding on disbursement of funds. In addition the resources can be allocated based on perfor-mance of institutions in either the public or pri-vate sector.
• There is need for India to adopt both revenue-raising and levy disbursement schemes. Given the wide variety of enterprises in terms of size, and in the form of organised/unorganised segments, it would be wise to adopt a variety of modalities to raise revenues. Exactly which modalities should be adopted for which segments of enterprises
should be a matter of discussion between relevant stake-holders. For instance, while a combination of revenue raising and levy disbursement schemes may be applied to the large public enterprises, the medium enterprises may be encouraged to adopt levy disbursement schemes for provision of in ser-vice training.
• There should be considerable scope for demand side financing of training through payment of stipend. Training provision in India has histori-cally been supply-driven while the demand for skills has been neglected. There is a very strong case for using training levy funds for financ-ing students from poor backgrounds who are unable to bear the opportunity cost of undertak-ing training before entering the labour market. Students must earn in order to survive, and can-not ‘afford’ to be trained. If trainees are provided a stipend, it would partially offset the opportu-nity cost of not working, and the cost of training fees (Box 22.7).
• Schemes of demand side financing could be encouraged to pay for in service training. This would encourage not only the trainees to come forward and obtain training in various industries, but would also encourage companies to come for-ward and participate in such scheme so as to get labour paid by the fund directly. The key defining feature of a demand side subsidy is a direct link between the intended beneficiary, the subsidy and the desired output, that is, training in this case. Different techniques which could be used to fulfill these are stipend, targeted bursaries and vouchers. The skill vouchers allow the trainees to purchase their own training which can help to build the
Box 22.6Good Performers in Financing—Chile, Australia, South Africa, Singapore
• Tax Deductions and Credits (encourages private spending)• Performance budgeting for the public sector (encourages good use of public expenditure, focus on outcomes in financing
formulas)• Vouchers and learning accounts (targeting special groups, use in lifelong learning, empowers demand side of market)• Training funds and competitive procurement (promotes competition, targets marginalised group)• Levy grant systems (promotes in service training, encourages enterprises to train, free-rider problem)
Source: Arvil Van Adams, 2012.

158 Twelfth Five Year Plan
demand side of the training. They can stimulate competition among the training providers. The key element is competition for the funds.
• Incentivising institutions to generate income from the sale of products and service activities of trainees and to retain it for meeting the operat-ing costs. As per estimates of DGET, 64 per cent of ITIs have started revenue generation activities. This needs to be institutionalised. This would not only facilitate generation of additional resources but would also give exposure to local market and help in market oriented training. This requires change in the training fee policy so that the funds becomes part of the institution’s budget and does not flow back to the government revenues.
• A number of possibilities exist today to enhance financing for skill development. First, the Union government collects a cess upon construction companies with projects of value above a certain threshold. This Construction Workers Cess Fund has accumulated many thousands of crores, which have been lying unutilised for years. Part of these funds could be used for skilling construction workers, who are in the industry which has been expanding employment the fastest in any Indian industry in the last 10 years (as discussed earlier).
• In order to shift away from the existing practice of providing only plan funds for the training, the Indian Banks’ Association (IBA) is working on vocational education loan scheme that would
provide an impetus to the country’s skill mis-
sion, part of a thrust to improve the efficiency
of the labour force and boost the economy. The
scheme will help not just students but also skill
providers complaining of low enrolment due to
financial reasons. No collateral security is con-
templated and the interest rate would be linked
to the base rate of banks. Simple interest will be
charged during the study period and up to the
commencement of repayment. The repayment
schedule is proposed to be dependent on duration
of a course. The skill loan amount may be in the
range of `20,000 to `1.5 lakh. The modalities are
being worked out between the NSDC and the IBA.
A universal vocational loan scheme is expected to
increase financial accessibility for poor students.
Gujarat is experimenting with the Skill voucher
scheme to provide choice to the trainees for train-
ing providers.
• Corporate Social Responsibility: This is another
source of fund to finance the skill training. Both
public sector and private sector companies need
to invest in the skill training as part of their cor-
porate social responsibility. As per law the PSUs
with about `100 crore profit are to invest about
5 per cent in the training. The central government
and state need to proactively involve with the
PSUs to undertake this responsibility and spend
the resources earmarked meaningfully.
Box 22.7Equity Implications of User Fees
The positive financial benefits from cost-recovery through user fees need to be weighed against the potentially adverse effects on equity. Here the tradeoff is clear. Higher, realistic fees may exclude from training those who cannot afford to pay, while low fees may not contribute enough for the provider to recover costs. Negative impacts on access to training opportunities for the poor, minorities, rural populations, and other disadvantaged groups are likely to ensue. Governments can offset the adverse impact of fees on equity by using some of the savings realised from fee income to provide targeted scholarships to low income groups. Theoretically, at least, increased fees could lead to increased equity of access because with the savings the government can afford to finance the enrollment of more low-income students. This, of course, presupposes that the relatively well-off students are willing to pay fees—they will only do so if they perceive the quality of education being provided is good and that they are likely to find employment after graduation. The equity implications of charging fees underscore the widely recognised need to introduce subsidies targeted to at-risk groups, in the form of scholarships and fee discounts. The challenge will lie in developing appropriate mechanisms which will effectively target the poor.
Source: Johanson, R. and Adams A.V. (2004), Skills Development in Sub-Saharan Africa, cited in Skill Development in India—The
Vocational Education & Training System, World Bank, January 2006 (page 74).

Employment and Skill Development 159
TO SUMMARISE, THE TWELFTH PLAN NEEDS TO FOCUS ON
1. Improving the outreach of the skill develop-ment, both quantitatively and qualitatively to bridge the divides, namely spatial, sectoral, regional and gender and so on.
2. Putting in place an institutional mechanism that is focused solely on skill development.
3. Put in place necessary support mechanisms to enable the financial requirements/skill loans for poor students (Credit Guarantee Fund).
4. Development of National Skill Qualification Framework, incorporating the standards devel-oped by Sector Skill Councils, and have in place a regulatory framework to oversee the function-ing and ensure accountability of Sector Skill Councils.
5. Improving quality and quantity by focusing on Training of Trainers.
6. Promoting Public Private Partnership.7. Greater interaction encouraged among indus-
try, academia and skill providers to narrow the gap between the demand and supply of skilled manpower.
8. Focus on Informal sector by finding a model that reaches out to the people, as the livelihood promoting institutions, panchayati raj institu-tions and and NGOs are engaged effectively.
9. Developing ICT based real time labour market information system.
10. An outcome based approach which ensures that the employability created is manifested in immediate, measurable and tangible employ-ment/self-employment of the trainees.
11. An online national register of the persons skilled, and their current engagement—to not
only provide a national database to employers and all other stakeholders, but also to facilitate a transparent monitoring system.
12. Review labour laws which inhibit the hiring of short term interns and trainees.
13. All employment exchanges to come online, and act as pro-active counseling and placement centres.
14. Activating State Skill Missions and make them nodal points for receiving most of the skill related funding from Centre.
15. Setting up of National Skill Registry having facil-ity to link various data bases across Ministries and states to work as a platform to link people seeking training to trainers/sponsoring organ-isations and people having skills to prospective employers.
16. Improving focus of Ministries like Social Justice and Empowerment (SJE), Tribal Affairs (TA), Minority Affairs, Women and Child Development (WCD), Development of North Eastern Region (DONER) and so on, working for disadvantaged sections on skill development programmes so that much larger funding for skill development through them may be ensured.
PLAN OUTLAYS FOR THE MINISTRY OF LABOUR AND EMPLOYMENT22.125. An indicative outlay of `13,223 crore has been made for the Ministry of Labour and Employment to carry implement various schemes. Of this an amount of `7,316 crore is earmarked for Rashtriya Swastahya Bima Yojana and `5,907 crore for other schemes of the Ministry of Labour and Employment.

160 Twelfth Five Year Plan
ANNEXURE 22.1Employment Across Various Sectors (in millions) 1999–2000, 2004–5, 2009–10—on UPSS basis
Sectors Employment Across Various Sectors
(in millions)
Absolute Increase in
Employment (in millions)
1999–2000 2004–05 2009–10 1999–00 to
2004–05
2004–05 to
2009–10
Agriculture 237.67 258.93 244.85 21.25 –14.08
Manufacturing 44.05 55.77 50.74 11.72 –5.03
Non-manufacturing 20.84 29.96 48.28 9.11 18.32
Mining and quarrying 2.17 2.64 2.95 0.47 0.31
Electricity, gas and water supply 1.13 1.30 1.25 0.17 –0.05
Construction 17.54 26.02 44.08 8.48 18.06
Services 94.20 112.81 116.34 18.77 3.53
Trade 36.63 43.36 43.53 6.74 0.17
Hotels and restaurants 4.62 6.10 6.13 1.48 0.03
Transport, storage and communication 14.61 18.47 19.97 3.86 1.5
Banking (and insurance) 2.25 3.10 3.82 0.84 0.72
Real estate, Renting and Business Activities 2.67 4.65 5.75 1.98 1.12
Public administration and defence 10.48 8.84 9.46 –1.64 0.62
Education 8.47 11.43 11.85 2.96 0.42
Health 2.62 3.34 3.59 0.73 0.25
Other Services 11.85 13.51 12.24 1.66 –1.27
Total 396.76 457.46 460.22 60.70 2.76
Source: NSS Employment Unemployment Surveys.
Note: Based on different NSS Rounds.
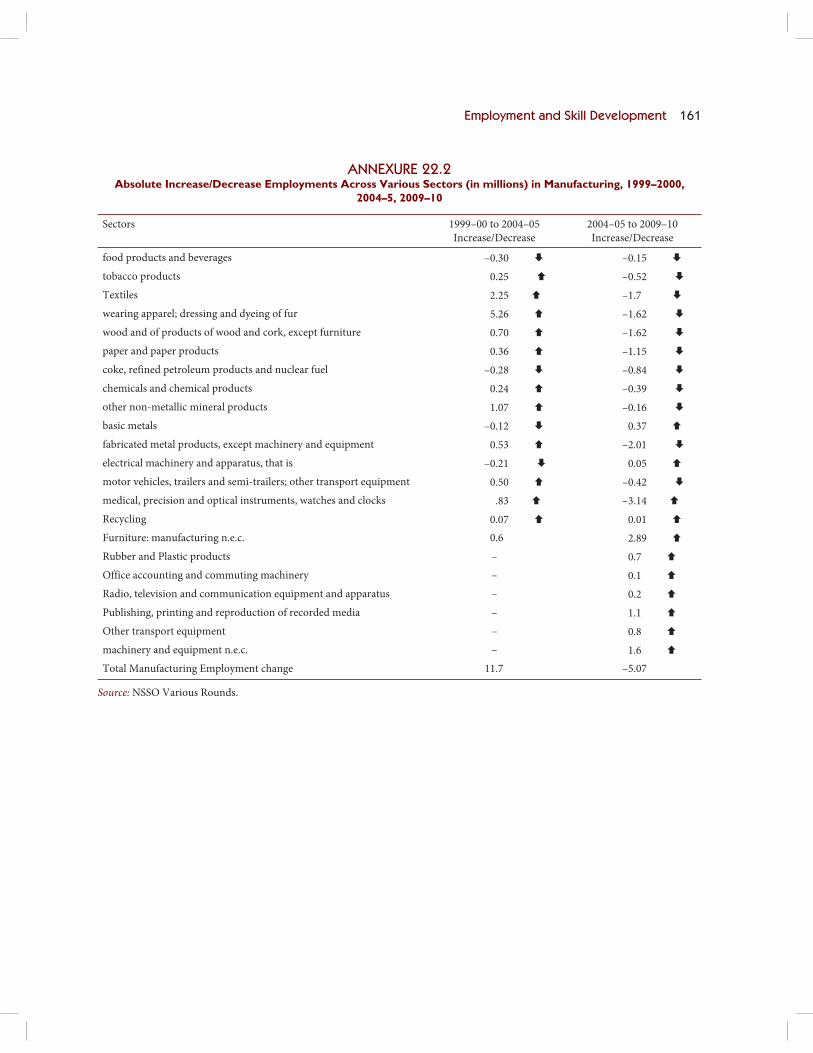
Employment and Skill Development 161
ANNEXURE 22.2Absolute Increase/Decrease Employments Across Various Sectors (in millions) in Manufacturing, 1999–2000,
2004–5, 2009–10
Sectors 1999–00 to 2004–05
Increase/Decrease
2004–05 to 2009–10
Increase/Decrease
food products and beverages –0.30 –0.15
tobacco products 0.25 –0.52
Textiles 2.25 –1.7
wearing apparel; dressing and dyeing of fur 5.26 –1.62
wood and of products of wood and cork, except furniture 0.70 –1.62
paper and paper products 0.36 –1.15
coke, refined petroleum products and nuclear fuel –0.28 –0.84
chemicals and chemical products 0.24 –0.39
other non-metallic mineral products 1.07 –0.16
basic metals –0.12 0.37
fabricated metal products, except machinery and equipment 0.53 –2.01
electrical machinery and apparatus, that is –0.21 0.05
motor vehicles, trailers and semi-trailers; other transport equipment 0.50 –0.42
medical, precision and optical instruments, watches and clocks .83 –3.14
Recycling 0.07 0.01
Furniture: manufacturing n.e.c. 0.6 2.89
Rubber and Plastic products – 0.7
Office accounting and commuting machinery – 0.1
Radio, television and communication equipment and apparatus – 0.2
Publishing, printing and reproduction of recorded media – 1.1
Other transport equipment – 0.8
machinery and equipment n.e.c. – 1.6
Total Manufacturing Employment change 11.7 –5.07
Source: NSSO Various Rounds.
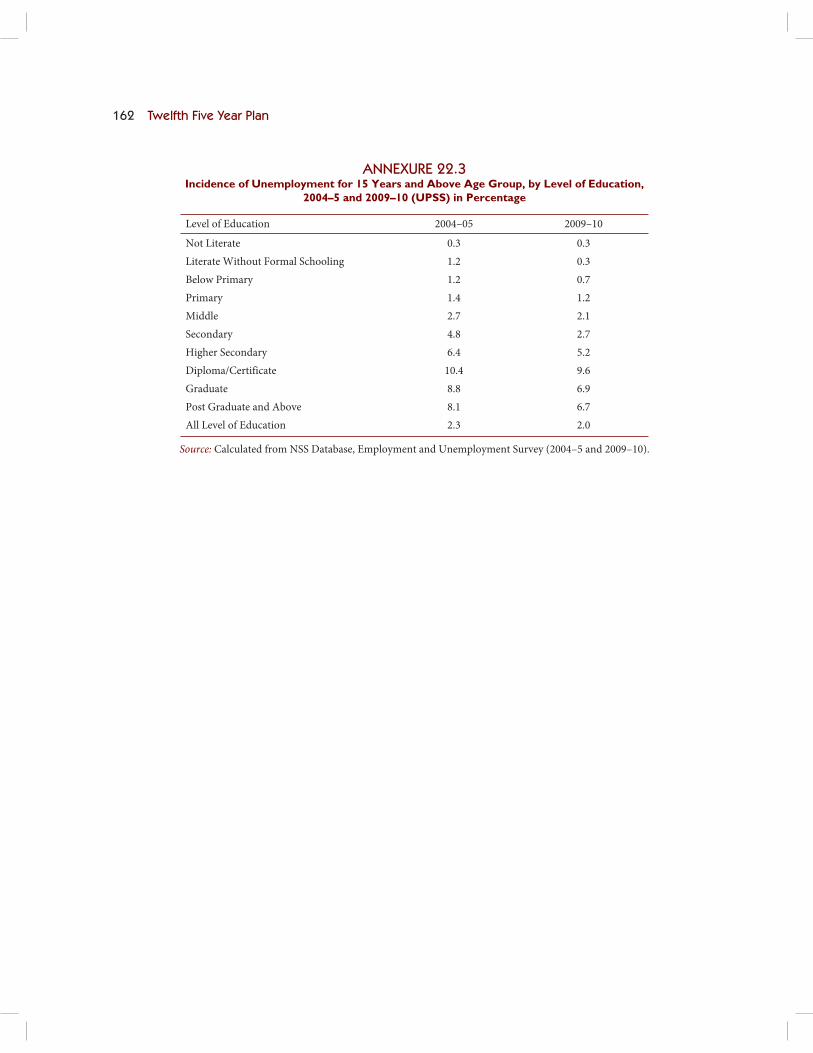
162 Twelfth Five Year Plan
ANNEXURE 22.3Incidence of Unemployment for 15 Years and Above Age Group, by Level of Education,
2004–5 and 2009–10 (UPSS) in Percentage
Level of Education 2004–05 2009–10
Not Literate 0.3 0.3
Literate Without Formal Schooling 1.2 0.3
Below Primary 1.2 0.7
Primary 1.4 1.2
Middle 2.7 2.1
Secondary 4.8 2.7
Higher Secondary 6.4 5.2
Diploma/Certificate 10.4 9.6
Graduate 8.8 6.9
Post Graduate and Above 8.1 6.7
All Level of Education 2.3 2.0
Source: Calculated from NSS Database, Employment and Unemployment Survey (2004–5 and 2009–10).

Employment and Skill Development 163
ANNEXURE 22.4Dependency Ratio Across India States, Census 2001
Ratio—15–59:<15
Persons
Ratio —15–59:>59
Persons
Ratio—WA: Non-WA
Persons
Bihar 1.22 7.72 1.05
Uttar Pradesh 1.26 7.37 1.08
Meghalaya 1.25 11.62 1.13
Rajasthan 1.32 7.84 1.13
Madhya Pradesh 1.40 7.63 1.19
Jharkhand 1.37 9.26 1.19
Arunachal Pradesh 1.36 12.10 1.23
Chhattisgarh 1.51 7.72 1.26
Uttaranchal 1.53 7.23 1.26
Haryana 1.57 7.51 1.30
Assam 1.51 9.67 1.31
Jammu and Kashmir 1.61 8.60 1.35
Orissa 1.76 7.07 1.41
Nagaland 1.60 12.92 1.42
Tripura 1.75 8.11 1.44
Maharashtra 1.84 6.77 1.45
Mizoram 1.67 10.71 1.45
Sikkim 1.70 11.05 1.47
Punjab 1.90 6.60 1.47
West Bengal 1.79 8.37 1.48
Lakshadweep 1.74 9.69 1.48
Himachal Pradesh 1.93 6.63 1.49
Gujarat 1.83 8.72 1.52
Andhra Pradesh 1.88 7.93 1.52
Karnataka 1.89 7.85 1.53
Manipur 1.85 9.01 1.54
Dadra and Nagar Haveli 1.72 15.18 1.55
Delhi 1.92 11.97 1.65
Kerala 2.43 6.05 1.74
Tamil Nadu 2.38 7.22 1.79
Pondicherry 2.40 7.77 1.83
Andaman and Nicobar Islands 2.23 13.39 1.91
Chandigarh 2.27 13.21 1.94
Goa 2.71 7.99 2.02
Daman and Diu 2.47 13.29 2.09
India 1.61 7.64 1.33
Note: WA: Working Age; NWA: Non- Working Age.
NOTE1. Organised and unorganised sectors have been defined as per NCEUS definition.