Employer provided training in Austria: Productivity - EconStor
38
econstor Make Your Publications Visible. A Service of zbw Leibniz-Informationszentrum Wirtschaft Leibniz Information Centre for Economics Böheim, René; Schneeweis, Nicole; Wakolbinger, Florian Working Paper Employer provided training in Austria: Productivity, wages and wage inequality Working Paper, No. 0915 Provided in Cooperation with: Johannes Kepler University of Linz, Department of Economics Suggested Citation: Böheim, René; Schneeweis, Nicole; Wakolbinger, Florian (2009) : Employer provided training in Austria: Productivity, wages and wage inequality, Working Paper, No. 0915, Johannes Kepler University of Linz, Department of Economics, Linz This Version is available at: http://hdl.handle.net/10419/73560 Standard-Nutzungsbedingungen: Die Dokumente auf EconStor dürfen zu eigenen wissenschaftlichen Zwecken und zum Privatgebrauch gespeichert und kopiert werden. Sie dürfen die Dokumente nicht für öffentliche oder kommerzielle Zwecke vervielfältigen, öffentlich ausstellen, öffentlich zugänglich machen, vertreiben oder anderweitig nutzen. Sofern die Verfasser die Dokumente unter Open-Content-Lizenzen (insbesondere CC-Lizenzen) zur Verfügung gestellt haben sollten, gelten abweichend von diesen Nutzungsbedingungen die in der dort genannten Lizenz gewährten Nutzungsrechte. Terms of use: Documents in EconStor may be saved and copied for your personal and scholarly purposes. You are not to copy documents for public or commercial purposes, to exhibit the documents publicly, to make them publicly available on the internet, or to distribute or otherwise use the documents in public. If the documents have been made available under an Open Content Licence (especially Creative Commons Licences), you may exercise further usage rights as specified in the indicated licence. www.econstor.eu
Transcript of Employer provided training in Austria: Productivity - EconStor

econstorMake Your Publications Visible.
A Service of
zbwLeibniz-InformationszentrumWirtschaftLeibniz Information Centrefor Economics
Böheim, René; Schneeweis, Nicole; Wakolbinger, Florian
Working Paper
Employer provided training in Austria: Productivity,wages and wage inequality
Working Paper, No. 0915
Provided in Cooperation with:Johannes Kepler University of Linz, Department of Economics
Suggested Citation: Böheim, René; Schneeweis, Nicole; Wakolbinger, Florian (2009) :Employer provided training in Austria: Productivity, wages and wage inequality, Working Paper,No. 0915, Johannes Kepler University of Linz, Department of Economics, Linz
This Version is available at:http://hdl.handle.net/10419/73560
Standard-Nutzungsbedingungen:
Die Dokumente auf EconStor dürfen zu eigenen wissenschaftlichenZwecken und zum Privatgebrauch gespeichert und kopiert werden.
Sie dürfen die Dokumente nicht für öffentliche oder kommerzielleZwecke vervielfältigen, öffentlich ausstellen, öffentlich zugänglichmachen, vertreiben oder anderweitig nutzen.
Sofern die Verfasser die Dokumente unter Open-Content-Lizenzen(insbesondere CC-Lizenzen) zur Verfügung gestellt haben sollten,gelten abweichend von diesen Nutzungsbedingungen die in der dortgenannten Lizenz gewährten Nutzungsrechte.
Terms of use:
Documents in EconStor may be saved and copied for yourpersonal and scholarly purposes.
You are not to copy documents for public or commercialpurposes, to exhibit the documents publicly, to make thempublicly available on the internet, or to distribute or otherwiseuse the documents in public.
If the documents have been made available under an OpenContent Licence (especially Creative Commons Licences), youmay exercise further usage rights as specified in the indicatedlicence.
www.econstor.eu

Employer provided training in Austria:
Productivity, wages and wage inequality
by
René BÖHEIM, Nicole SCHNEEWEIS, Florian WAKOLBINGER
Working Paper No. 0915
October 2009
DDEEPPAARRTTMMEENNTT OOFF EECCOONNOOMMIICCSS
JJOOHHAANNNNEESS KKEEPPLLEERR UUNNIIVVEERRSSIITTYY OOFF
LLIINNZZ
Johannes Kepler University of Linz Department of Economics
Altenberger Strasse 69 A-4040 Linz - Auhof, Austria
www.econ.jku.at
[email protected] phone +43 (0)70 2468 - 8214, - 28214 (fax)

Employer provided training in Austria: Productivity, wages and wage inequality
René Böheim*, Nicole Schneeweis
** and Florian Wakolbinger
***
Department of Economics
Johannes Kepler University Linz
September 2009
* Department of economics, Johannes Kepler University Linz; IZA, Bonn; Austrian Institute for Economic Re-
search, Vienna; NFN labor and welfare state (www.labornrn.at). **
Department of economics, Johannes Kepler University Linz; NFN labor and welfare state (www.labornrn.at) ***
Gesellschaft für Angewandte Wirtschaftsforschung mbh, Innsbruck, and University of Linz

2
Abstract
We use data on Austrian firms and employees to estimate the effects of employer-provided
training on productivity, wages, and the inequality of wages within firms. While the average
amount spent on employer-provided training is low in general, we find a robust positive elas-
ticity of training on productivity of about 0.04. In-house training is more effective than exter-
nal courses, and language, administrative and personal skills courses are more effective than
sales training and IT-courses. We find a significant relationship between training and wages,
the coefficient is about 0.05. We find no significant effect of training on the inequality of
wages within firms.
JEL Classification: D21, J24
Keywords: employer-provided training, productivity, wages

3
1 Introduction
Human capital is one of the key determinants of economic growth. In Table 1, eco-
nomic development in Austria between 1990 and 2004 is summarized (reproduced from Pen-
der et al., 2007, p37). The numbers show that a large part, about one quarter, of the average
yearly growth rate of 2.4% of GDP is due to technological progress. In addition, increased
human capital, the “quality” of labour, contributes positively to economic growth. Further, if
the amount of human capital is related to a person’s chances on the labour market—which
appears to be a reasonable assumption—, then training and human capital are also related to
labour supply. The expansion of hours worked, the “quantity of labour” did also contribute to
economic growth between 1990 and 2004.
Table 1: Economic growth in Austria, 1990-2004.
Average yearly growth rate
1990/2004 1990/1995 1996/2000 2001/2004
Economic growth, real in % of GDP
2,38 2,62 2,83 1,46
Components:
Capital 1,33 1,33 1,36 1,29
Of which
Quantity 0,96 1,02 1,08 0,71
Quality 0,37 0,31 0,27 0,58
Labour 0,46 0,28 0,80 0,31
Of which
Quantity 0,20 0,02 0,48 0,10
Quality 0,27 0,26 0,32 0,21
Technological
Progress
0,59 1,01 0,68 -0,15
Source: Peneder et al. (2007), p.37.
According to the Continuing Vocational Training Survey (CVTS) of 1999 (Statistik Austria,
2001), about 72% of workplaces with at least 10 employees trained their workers. In 2005,

4
about 81% of workplaces trained their workers. The fraction of workers who attended em-
ployer-provided training was some 31% in 1999 and 33% in 2005. These workers were
trained for about 29 (27) hours in 1999 (2005). According to the survey, employer-provided
training cost some €723 million in 1999, of which about 60% were direct training costs. Indi-
rect costs, i.e., opportunity costs from spending time in training rather than working, made up
the remaining 40%. In 2005, this number was about €594 million with about 56% direct train-
ing costs.
These figures underline that employer-provided training is common and involves serious
amounts of money. Our aim is the evaluation of this investment, for both employers and em-
ployees—how much does productivity increase due to employer provided training, and how
much do workers benefit from attending such courses?
There are few studies that empirically investigate the relationship between employer-provided
training and productivity, mostly due to a serious lack of data. Most of these studies find in-
deed evidence for a positive, in cases even a statistically significant association between train-
ing and productivity. However, as the availability of data is limited, most of these analyses are
cross-sectional and the problem of unobserved heterogeneity is insufficiently solved.
In one of the first empirical works on this topic, Bartel (1994) found that US-firms which in-
troduced training programmes in response to low productivity enjoyed subsequently a signifi-
cant increase in productivity. The estimated return to these programmes was about 0.4%
Zwick (2002), using German data for 1997 to 2000, showed that training is positively related
to productivity, even two years after the training. The relationship is stronger, the more inten-
sive the training was. The estimated return was about 0.4%, i.e., increasing the number of
5
employees who receive training by one percentage point is estimated to increase overall pro-
ductivity by 0.4%.
Dearden, Reed and Van Reenen (2006), using British data, also find a statistically significant
association between training and productivity. In addition, they find that wages are also
higher in workplaces where workers are trained, indicating that some of the productivity gains
from training also accrue to workers.
2 Theoretical Background
The association between a firm’s output and the inputs can be shown in a production
function, typically a Cobb-Douglas specification is used (Bartel, 1995; Dearden et al., 2000).
A simple production function that relates training with output Y for each firm i is:
Yi = Ai Ki β (LUi + τ LTi)
γ , (1)
where A is a (Hicks-neutral) parameter of efficiency, LU and LT indicate the numbers of un-
trained and trained workers and τ describes the productivity gain from training (it is greater
than one if training is productivity-enhancing). β and γ are the shares of capital and labour in
the production process and it is typically assumed that β +γ =1.
Rearranging the formula, the production function can be expressed as:
Yi = Ai Ki β Li
γ (1 + (τ-1) Ti) γ, (2)
where T denotes the intensity of training in firm I, LT/(LU+LT). Taking logs and using ln
(1+x) ≈ x, for small values of x yields the following expression:
ln Yi = ln Ai + β ln Ki + γ ln Li + γ (τ-1) Ti. (3)

6
Under the assumption that workers who are trained are more productive than those who are
not, γ (τ-1) is expected to be greater than 0. Reformulating equation (3) provides an expres-
sion that can be estimated on a random sample of firms:
ln Yi = α + β Xi + θ Ti+ εi, (4)
where α is the intercept of the log-linear equation, X is a vector of firm characteristics, T is an
indicator of training intensity, ε is the error-term and θ is the parameter of interest. This equa-
tion can be estimated using standard econometric methods and a statistically significant value
for θ > 0 indicates a positive relationship between training intensity and a firm’s productivity
A causal interpretation, i.e., training causes productivity, can only be established be-
yond doubt, if training is not correlated with the unobserved factors captured in ε. A positive
value for θ could also arise from selection bias, if firms whose unobserved characteristics are
associated with higher productivity invest more in training than firms whose unobserved
characteristics are associated with lower productivity. Such a biased estimate measures not
only the association between training and productivity, but also the firms’ differences in un-
observed productivity. Alternatively, inverse causality may prevent a causal interpretation.
Inverse causality is present, if more productive firms invest more in training because they
have the money to do so—a positive coefficient would then indicate the positive impact of
productivity on training.
One method to limit a selection bias is the use of panel data, where the firms are observed at
(at least) two points in time. Equation (4) can then be modified to account for repeated obser-
vations on the same firms:

7
ln Yit = α + β Xit + θ Tit+ εi + uit, (5)
where t indexes time. The error term can be separated into a firm-specific time-invariant
component (εi) and an idiosyncratic part (uit). The firm-specific component can be eliminated
from the equation by employing firm fixed-effects and the coefficient on training can be esti-
mated consistently as long as Tit does not correlate with uit .
3 Data
Since there is no single source of data available to address our research questions, we use sev-
eral different surveys to construct samples which allow an empirical evaluation of the rela-
tionship between training and productivity as well as training and wages. The data sources are
surveys on training, business statistics and labour costs. The data were combined by the Aus-
trian Statistical Office, using their database on Austrian businesses.1
3.1 Productivity
This part of our analyses is based on the Continuing Vocational Training Surveys (CVTS),
1999 and 2005. The CVTS surveyed a representative sample of businesses with 10 or more
employees in the production and service sectors (NACE codes C-K and O) on their employer-
provided training. The samples were drawn, stratified by industry classifications and firm
size, from the Statistical Offices’ firm register (Statistik Austria, 2003). Since the samples
were drawn independently, only a small number of firms were surveyed in both years.
We augment the information from the CVTS with information from the Surveys on Structural
Business Statistics (SSBS), 1999 to 2005. The SSBS is an annual survey of businesses with at
1 For reasons of anonymity, all data analyses were undertaken by the Statistical Offices.

8
least 20 employees in the production and service sectors (NACE codes C-K) and was first
conducted in 1997 (Statistik Austria, 2001a). This survey is also based on a stratified random
sample (sectors and firm size) and one part of the sample is replaced each year. The advan-
tage of the SSBS is the availability of information that allows the calculation of the gross
value added, which we use as our indicator of productivity. In addition, the SSBS contain
detailed information on other production factors, such as the structure of the workforce (e.g.,
distribution of men and women, blue- and white-collar workers) and on capital investments.
We selected all businesses that were surveyed in the CVTS and were also surveyed in the
SSBS of the corresponding year.2 Overall, 3,351 businesses were surveyed in the SSBS and
the CVTS (1,955 in 1999 and 1,396 in 2005). After elimination of one observation with miss-
ing information the sample consists of 3,350 observations.
To analyse the robustness of our results, we also identify 203 businesses that were surveyed in
both years. This sample is used for firm-fixed-effects panel regressions. In addition, we
matched 1,739 businesses from the SSBS 2000 with information from the 1999 CVTS to in-
vestigate whether training has long-lasting or lagged effects on productivity. See table 2 for a
summary of our samples.
Our indicator of a firm’s productivity is gross added value at factor costs (Black und Lynch,
2001), which was calculated from the information contained in the SSBS.3 Productivity is
measured at the actual number of working hours, i.e., actual working hours minus hours in
2 All observations were weighted to obtain a sample representative for the distribution in size and across the
economic sectors of the underlying universe of businesses. 3 Gross added value (at factor costs) measures the output of a firm by turnover minus input costs, plus net trans-
fers (subsidies minus taxes).

9
training, to obtain a precise indicator of productivity. All monetary values were deflated to
2005 prices using the harmonised consumer price index.4
Table 2: Overview on samples.
CVTS 1999 Number of observations 2,612
Of which in SSBS 1999 1,955
CVTS 2005 Number of observations 1,456
Of which in SSBS 2005 1,396
Observations with miss-
ing information
1
Pooled 3,350
Panel 203 businesses in both
cross-sections
406
CVTS 1999 Number of observations 2,612
Of which in SSBS 2000 1,739
Lagged 1,739
Figure 1 provides an overview on the average gross value added per employee for the years
1999 to 2005. We see that productivity increased throughout this period. In 1999 it amounted
to about €51,800 and to about €65,000 in 2005.
4 Gross value added should be deflated using a production price index; however, in Austria such an index is not
available for the service sector.

10
Figure 1: Average gross value added per worker, 1999-2005.
45000
50000
55000
60000
65000
70000
1999 2000 2001 2002 2003 2004 2005
Note : Prices of 2005 (HCPI 1996). SSBS, 1999 to 2005 (Statistik Austria, corresponding years).
The CVTS contain several indicators on employer-provided training. We distinguish
between those that provide information on the intensity of the training and those on the qual-
ity of the training. In table 3 we provide a description of the used variables and some sum-
mary statistics.

11
Table 3: Description of variables.
Variable Description Mean SD
Dependent Variables
Value added per hour Gross value added at factor costs per actual working
hour
28.04 105.75
Value added per worker Gross value added at factor cost per worker 47,707.31 165,335.54
Training
Costs Costs for training per employed worker, net of subsi-
dies
145.09 1.062.32
Hours Number of hours in training per employed worker 5.52 42.70
Fraction of . . . training (from total training hours)
Languages Foreign and national languages 0.04
Marketing Marketing and sales training 0.16
Administration Admin, accounting, finances, management and office 0.10
Personal skills Cooperation, interview training, et cet. 0.10
IT Computer skills 0.16
Technical Technical issues and production 0.24
Other E.g., environmental aspects, health and safety, … 0.20
In-house hours Number of training hours provided in-house per em-
ployed worker
1.77 21.44
External hours Number of training hours provided by external training
per employed worker
3.76 34.92
Fraction of external hours at the following institutions (from total number of train-ing hours)
Institutions Public training institutions operated by Trade Unions,
Chamber of Commerce, Chamber of Labour, Adult
Learning Centres 0.40
Business Associated businesses, such as producers, suppliers, or
parent company 0.20
Schools Public or private schools, universities 0.00
Private Private training institutions 0.30
Other 0.10
Workforce
Employees Number of employed workers 63.65 1,319.44
Fraction part-time 0.15
Fraction male white-collar 0.19
Fraction female white-
collar
0.21
Fraction male blue-collar 0.35
Fraction female blue-collar 0.16
Fraction apprentices 0.06
Fraction owner 0.04
Turnover Change in the number of employees relative to the
average number of employees last year
0.04 0.70
Capital

12
Investment assets Investment in assets per employed worker 9,166.99 237,497.31
Investment software Investment in software per employed worker 2,775.33 6,220.68
Capital Capital per employed worker 29,510.21 493,674.07
Other variables
Regional indicators 9 federal states
NACE indicators 8 NACE categories
Legal form indicators 5 groups of legal forms of businesses
Year Dummy variable for 1999
N 3,350
Note: All monetary variables deflated to 2005 prices using the HCPI. All statistics weighted
according to CVTS.
We use value added per actual working hour and value added per employed worker as de-
pendent variables in the productivity regressions; their means are about €28 and €47,700.
Training intensity is measured by the number of hours in training or, alternatively, the net
costs of training. While we might assume that there is a correlation between the costs of train-
ing and the quality of training, we have no direct information on the quality of training. How-
ever, we have information on the training subjects and whether the training is in-house or ex-
ternally organized.
On average, training costs amounted to €145 per worker and the average worker spent 5.5
paid working hours in training per year. About one quarter of all training hours were dedi-
cated to technical training and 16% were dedicated to marketing and sales training and an-
other 16% to IT courses.
Most training was provided not in-house but by external training institutions. About 40% of
these external training hours were provided by public associations (e.g., Chamber of Com-
merce) and about 30% by private training institutions.

13
Table 3, furthermore, shows that the average firm in our sample had about 64 employed
workers, of which about 15% were part-time workers and about 6% apprentices. Amongst
blue-collar workers there were more men than women, amongst white-collar workers the
number of men and women were similar.
Although the data are detailed with respect to workers and training, they are less adequate in
terms of capital. The SSBS provides only information on current investment and not on the
stock of capital. Under the assumption that current investment is used to keep the stock of
capital constant, investment can be used as a proxy for the capital in place. (Investment in
software and patents can be seen as a different channel to increase productivity.)5
3.2 Wages
We investigate the relationship between training and wages by using the Labour Costs Sur-
veys (LCS) and the Structure of Earnings surveys (SES) (Statistik Austria, 2006, 2007). Using
these data we can estimate wage effects on the worker-level, enabling us to control for indi-
vidual characteristics of workers. Our productivity analysis is primarily based on immediate
effects of training, leading to potential downward bias if training effects occur lagged or are
long-lasting. Using the LCS and the SES, we can investigate the effects of training on the
wages two years thereafter (including potential wage contracting after training). The problem
of reversed causality (i.e., productivity induces training) is, less severe in such a specifica-
tion.6
5 As a robustness check, we calculate for all firms in 2005 an alternative measure of the capital stock that is
based on all investments from 1999 to 2005. We obtain qualitative similar results. 6 Although we do not observe any training that took place between these two years, the estimations will still
produce consistent estimates as long as training does not correlate with the error term.

14
The LCS is conducted every four years and surveys businesses with at least 10 employees in
the production and service sectors (NACE codes C-K, excluding L) and covers about 80% of
Austrian employees (Statistik Austria, 2006). The survey is a stratified random sample on
sectors and firm size. The unit of observation is the firm and the data contain detailed infor-
mation on the number of employed workers, wages and indirect labour costs such as contribu-
tions to social security or training costs (Statistik Austria, 2007).
The SES is also conducted every four years and contains information on the employed work-
ers, such as sex, age, education, occupation (SCO), tenure and detailed information on the
composition of wages, such as regular compensation, overtime, sick-pay, and similar (Sta-
tistik Austria, 2006). Workers are sampled according to a firm’s size, in firms with 10 to 19
employees all workers are interviewed, in firms with 50 to 99 employees every fifth worker is
interviewed, and so on. In firms with more than 1,000 employees, every 80th
worker is inter-
viewed (Statistik Austria, 2006). In addition, the data contain information on the firms, such
as their NACE classification, region (NUTS 1), the legal form of the company and whether
the workers are covered by collective bargaining.
We match information from the 2000 LCS, which contains information on training (on the
firm-level) and wages (on the worker-level), with the 2002 SES with observations on 1,784
firms and their 27,182 workers. The match between the 2004 LCS and the 2006 SES results in
a sample of 2,962 firms and their 75,562 workers.7 There are 594 firms in all four surveys
which will allow a longitudinal analysis.
7 The SES sampled in 2002 firms in NACE categories C-K, in 2006 additionally also firms in M-O. The sample
sizes differ accordingly.

15
Estimates on these firms are likely to be biased, as these firms are a selected sample as they
have survived for at least six years and thus are perhaps more productive firms since they
were not squeezed out of the market. Kaniovski and Peneder (2008) give the median life of
Austrian firms at three to four years; however, a quarter of all firms do not survive beyond the
first year. The rates of firms that survive beyond the first year are relatively flat. Descriptive
statistics are presented in table 4. The summary statistics show that the average gross hourly
wage in the SES was about €11.4 in both years; however, the variance was markedly greater
in 2000/02 than in 2004/06.8
The data reflect the employment patterns well (BKA, 2007), for example, the increase in the
number of female workers or the increase in part-time employment. The central explanatory
variable measures training costs and is obtained from the LCS. Training costs amounted on
average to €212 per worker in 2000/02 and, somewhat more, €232 in 2004/06. 9
Other explanatory variables are personal characteristics, such as age or sex, job characteris-
tics, such as tenure or type of contract, and firm characteristics, such as firm size, regional
indicators and industry dummies. We also construct firm-level indicators of the workforce
(the fraction of female workers, fraction of part-time workers, and fraction of blue-collar
workers).
8 This difference is possibly caused by a more heterogeneous sample of workers in 2002 than in 2006.
9 Note that the amount spent on training differs between the samples. Firms in the wage-samples invest more in
training than firms in the productivity-samples; the averages are €145 compared to about €212 (or €232) per
worker. This difference is probably due to different sampling methods, the sample which we use for the wage
analyses is based on firms with at least 10 employees and the sample used for the productivity analyses uses
firms with at least 20 employees,

16
Table 4: Descriptive statistics pooled wage sample.
2000/2 2004/6
Mean SD Mean SD
Dependent Variables
log (gross hourly wage) 2.431 4.067 2.430 2.708
Explanatory Variables
Training costs/employee, (in €1,000) 0.212 2.724 0.232 2.804
Female 0.355 0.401
Age 37.229 11.361 a) 37.553 11.538 a)
Education
Less than / no compulsory schooling 0.003 0.004
Compulsory schooling 0.264 0.220
Apprenticeship 0.442 0.414
Secondary school (vocational) 0.088 0.105
Secondary school (academic) 0.038 0.048
Higher secondary school (vocational) 0.080 0.090
Master, higher vocational school 0.041 0.045
University 0.044 0.075
Part-time 0.169 0.232
Fixed-term contract 0.026 0.050
Blue-collar worker 0.449 0.396
White-collar worker 0.476 0.516
Apprentice 0.044 0.041
Marginally employed 0.031 0.047
Firm size 3,521.38 86,659.96 1,740.02 25,483.39
N of workers 27,182 75,765
N of firms 1,784 2,962
Note: Statistik Austria, LCS 2000, 2004 and SES 2002, 2006. All numbers are weighted, except those marked
with a). Monetary values in 2005 prices, deflated using the HCPI. The larger sample size in 2004/6 is the result of
not only sampling firms in NACE categories C-K, as in 1002, but also in NACE categories M-O.
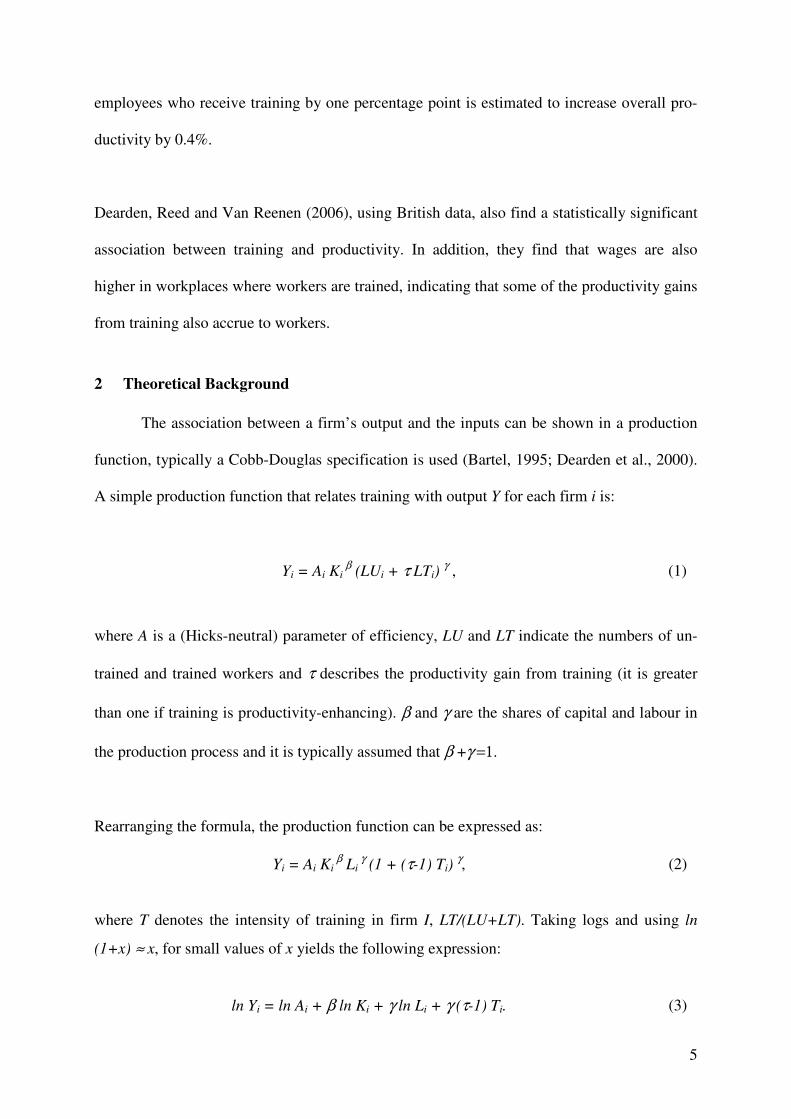
Descriptive statistics for the wage panel sample are presented in table 5. We calculate Gini-
coefficients for the firms’ wage distributions to investigate changes over time, in particular, if
there is any evidence for a relationship with employer-provided training
The amounts spent on employer provided trainings are lower in the panel sample (€ 170 per
employee and year) than in the cross-sections (€ 212 and € 232 respectively). The firm char-
acteristics like fraction of women, white-collar workers or part-time workers are about the
same in the panel and cross-section samples.
17
Table 5: Descriptive statistics wage sample, panel.
Mean Standard Deviation
Dependent Variables
Hourly wages (€) 15.42 21.483
Gini hourly wage 0.209 0.294
p90 hourly wage 19.217 34.666
p50 hourly wage 12.038 13.904
p90/p50 hourly wage 1.581 1.634
Gross annual wage/employee, 2002 31,344.14 49,325.22
Explanatory Variables
Training costs/employee (in € 1000) 0.170 1.140
Fraction female workers 0.338
Fraction white-collar workers 0.439
Fraction part-time workers 0.136
Fraction female part-time workers 0.108
Fraction of workers with degree 0.053
Fraction of workers with apprenticeship 0.371
Fraction of workers with compulsory schooling 0.286
Fraction of workers with no formal schooling 0.003
Fraction of workers with secondary schooling 0.288
Tenure 8.702 16.382
Age 39.312 18.940
Actual working hours 1650.930 714.877
N of firms 594
Note: LCS 2000 and 2004, SES 2002 and 2006.

18
Figure 2 plots the firms’ average gross hourly wage against their average training costs per
employee. The average gross hourly wage was about €15 and firms spent typically less than
€300 on training per employee. The relationship is positive, as indicated by the (red) regres-
sion line.
Figure 2: Hourly wages and training.
Source: Statistik Austria, LCS 2000/2004, SES 2002/2006.

19
Figure 3: Distribution of training costs by firm size.
Source: Statistik Austria, LCS 2000/2004, SES 2002/2006.
Figure 3 presents box plots of training costs by firm size. The bold horizontal line inside the
box indicates the median level of training costs. Figure 3 clearly shows that the larger the
firm, the more is invested into the training of the workers. It is somehow sobering to see that
about half of the firms with more than 10 but less than 50 employees spend nothing on their
workers’ training. In the wage regressions below, we are able to control for firm size, but not
in the productivity regressions.

20
4 Results
4.1 Productivity10
In this section, we present results fort he productivity regressions from the pooled sample and
further results form the lagged as well as the panel sample.
4.1.1 Pooled Sample
Table 6 tabulates the estimated elasticities from four different specifications of equation (4),
the results on other variables are tabulated in the Appendix. In specification A, in addition to
the vector of other control variables, we control for the costs and the amount of training in our
estimation of productivity. In specification B, we additionally control for the type of training
(with languages as reference). Specification C distinguishes between in-house and external
provision of training and specification D uses all available indicators of training.
In all four specifications, we estimate a positive and statistically significant relationship be-
tween training costs and productivity. The elasticities vary, depending on the included ex-
planatory variables, between 0.044 in specification A and 0.039 in specification D. The esti-
mations indicate that firms in which 1% more is spent on training than in other, similar firms,
productivity is greater by about 0.04%. The estimations further suggest that there is no rela-
tionship between the number of training hours and productivity. We also estimate the same
specifications but with productivity per employed worker, and obtain elasticities that are
slightly smaller, 0.03.
10 Material presented in this section is based on Böheim and Schneeweis (2008).

21
Table 6: Estimates of productivity, pooled sample.
Note: ***, ** and * indicate statistical significant values at the 1%, 5% and 10% error level. Estimations based
on CVTS 1999 and 2005 and SSBS 1999 and 2005. Results on other variables are in the Appendix.
Variable Value added per working hour (log)
A B C D
Coefficient
(Standard Error)
Costs (log) 0.044*** 0.042*** 0.040*** 0.039***
(0.008) (0.008) (0.008) (0.008)
Hours (log) 0.003 0.004
(0.003) (0.003)
Fraction of total hours:
Languages (base)
Marketing -0.017 -0.021*
(0.011) (0.012)
Administration 0.025* 0.022
(0.013) (0.014)
Personal skills 0.054*** 0.049***
(0.017) (0.017)
IT -0.025** -0.029**
(0.012) (0.012)
Technical -0.003 -0.009
(0.009) (0.010)
Other -0.009 -0.017*
(0.009) (0.009)
Hours in-house (log) 0.006** 0.006**
(0.003) (0.003)
Hours external (log) 0.002 0.003
(0.003) (0.003)
Fraction of total external hours:
Institutions. (base)
Business 0.011 0.018**
(0.007) (0.008)
Schools -0.079*** -0.073***
(0.020) (0.021)
Private 0.001 0.004
(0.008) (0.009)
Other 0.018* 0.025**
(0.010) (0.011)
Number of observations 3,350 3,350 3,350 3,350

22
Specification D is our preferred specification as we make use of all available information on
training. Overall, the relationship between training and productivity is robust across all speci-
fications. In addition, we find that the type of training matters for productivity, sales training
or IT-course have a significantly lower association with productivity than language courses
(the omitted category), whereas training in personal skills or administrative courses have a
greater, positive association with productivity.11
Training that is provided in-house is esti-
mated to be more productivity-enhancing than external courses.
4.1.2 Lagged Sample and Panel Sample
Our results so far ignore any medium-term effects of training on productivity. It might be the
case that training has a beneficial influence on productivity only after some time. We there-
fore estimated our regressions using a sample where we match the SSBS 2000 with the in-
formation on training from the CVTS 1999.
As shown in table 7, we find a positive association between training and productivity (meas-
ured as gross value added per worker as we have no information on working hours in the
SSBS). The estimated coefficient is about 0.02 and statistically significant in specifications A
and B. Although the estimated coefficient is not significant in specifications C and D, how-
ever, the point estimate has about the same numerical value. Note that the sample size is much
smaller than above.
11 An insignificant relationship between IT and productivity has also been found by other researchers, see
Oliner, Sichel, Triplett and Gordon (1994).

23
Table 7: Estimated productivity, lagged sample
Dependent variable Value added per worker (log)
A B C D
Coefficient
(Standard Error)
Costs (log) 0.020* 0.022** 0.015 0.017
(0.011) (0.011) (0.011) (0.011)
Hours (log) -0.002 -0.003
(0.004) (0.004)
Fraction of total hours:
Languages (base)
Marketing -0.038** -0.040**
(0.016) (0.017)
Administration -0.005 -0.004
(0.021) (0.022)
Personal skills -0.020 -0.020
(0.028) (0.028)
IT 0.018 0.017
(0.016) (0.017)
Technical 0.009 0.010
(0.013) (0.013)
Other 0.008 0.010
(0.015) (0.015)
Hours in-house (log) 0.002 0.002
(0.004) (0.004)
Hours external (log) -0.001 -0.002
(0.004) (0.004)
Fraction of total external hours:
Institutions. (base)
Business -0.005 -0.003
(0.012) (0.013)
Schools 0.005 0.007
(0.030) (0.030)
Private 0.003 0.006
(0.011) (0.011)
Other -0.014 -0.018
(0.017) (0.018)
Number of observations 1,739 1,739 1,739 1.739,
Note: ***, ** and * indicate statistical significant values at the 1%, 5% and 10% error level.
Estimations based on CVTS 1999 and 2005 and SSBS 1999 and 2005.Results on other vari-
ables upon request.
For 203 companies, we have information from the CVTS 1999 and 2005. With this small
panel sample, we investigate whether an increase in training intensity can be associated with

24
productivity gains. The results are reported in table 8. Firm-fixed-effects regressions give es-
timated elasticities of about 0.02. However, the estimates are statistically not significant
Table 8: Estimated productivity, panel sample
Dependent variable Value added per working hour (log)
A B C D
Coefficient
(Standard Error)
Costs (log) 0.025 0.019 0.024 0.017
(0.022) (0.023) (0.022) (0.023)
Hours (log) 0.002 0.003
(0.007) (0.008)
Fraction of total hours:
Languages (base)
Marketing 0.003 0.002
(0.038) (0.040)
Administration 0.012 0.029
(0.043) (0.045)
Personal skills -0.016 -0.001
(0.056) (0.059)
IT 0.025 0.029
(0.028) (0.032)
Technical 0.005 0.022
(0.026) (0.028)
Other -0.022 -0.017
(0.028) (0.027)
Hours in-house (log) 0.002 0.003
(0.006) (0.007)
Hours external (log) -0.002 -0.001
(0.008) (0.008)
Fraction of total external hours:
Institutions. (base)
Business -0.029 -0.043
(0.025) (0.028)
Schools -0.017 -0.031
(0.051) (0.056)
Private 0.028 0.015
(0.024) (0.027)
Other 0.022 0.024
(0.030) (0.030)
Firm-fixed effect included
Number of observations 406 406 406 406
Note: ***, ** and * indicate statistical significant values at the 1%, 5% and 10% error level.
Estimations based on CVTS 1999 and 2005 and SSBS 1999 and 2005.Results on other vari-
ables upon request.

25
4.2 Wages12
Since the wage information from the CVTS and the SSBS is only available at the firm level,
we estimate wage regressions using micro data from the LCS and SES. We estimate three
specifications, where specification A controls for sex, age, tenure, occupation and several firm
characteristics, such as the firm’s sex ratio, the fraction of part-time workers in a firm, aver-
age tenure, firm size, industry, region and an indicator for collective bargaining. In specifica-
tion B we additionally include information on the worker’s contract, the number of overtime
hours, and information on annual leave. In specification C, we include additionally to specifi-
cation A several indicators for compensation schemes, such as e.g., shift work.
The results are given in table 9. In all specifications, we obtain positive and statistically sig-
nificant associations of training and wages. The estimated coefficients are around 0.05.
Workers in firms who invest 1000 Euro more on training earn about 5% higher wages. The
other results are consistent with economic theory and earlier research, such as workers with
more formal education have higher wages than those with less, and so on.
12 This section is based on material presented in Böheim and Wakolbinger (2009).

26
Table 9: Estimated wages.
2000/2 2004/6
A B C A B C
log(hwage) log(hwage) log(hwage) log(hwage) log(hwage) log(hwage)
Training costs/employee (€ 1000) 0.067*** 0.07*** 0.05*** 0.052*** 0.053*** 0.037***
(0.01) (0.01) (0.01) (0.005) (0.005) (0.004)
Individual characteristics
Female -0.145*** -0.154*** -0.107*** -0.131*** -0.135*** -0.097***
(0.008) (0.008) (0.011) (0.005) (0.005) (0.005)
Age 0.011*** 0.006*** 0.01*** 0.011*** 0.007*** 0.01***
(0) (0) (0) (0) (0) (0)
Part-time 0.051*** -0.04***
(0.01) (0.008)
temporary contract -0.012 -0.053***
(0.016) (0.009)
Education (Base: compulsory school)
Apprenticeship 0.202*** 0.058*** 0.194*** 0.206*** 0.042*** 0.197***
(0.008) (0.006) (0.008) (0.006) (0.004) (0.005)
High school degree/master craftsman 0.279*** 0.124*** 0.256*** 0.268*** 0.101*** 0.25***
(0.01) (0.008) (0.012) (0.007) (0.005) (0.006)
University degree 0.497*** 0.347*** 0.41*** 0.421*** 0.253*** 0.366***
(0.021) (0.02) (0.022) (0.012) (0.011) (0.011)
Employee classification (Base: white collar)
Blue collar -0.168*** -0.16***
(0.01) (0.006)
Apprentice -0.956*** -0.967***
(0.016) (0.011)
Marginal employment -0.164*** -0.202***
(0.018) (0.013)
Tenure within firm 0.008*** 0.007*** 0.006*** 0.009*** 0.008*** 0.007***
(0) (0) (0.001) (0) (0) (0)
Firm size (Base: less than 50 employees)
50 -249 emp. 0.017** 0.013** 0.014** 0.041*** 0.023*** 0.026***
(0.008) (0.007) (0.007) (0.006) (0.005) (0.005)
250 - 499 emp. 0.039*** 0.022*** 0.022*** 0.072*** 0.04*** 0.05***
(0.009) (0.008) (0.008) (0.006) (0.005) (0.006)
500 - 999 emp. 0.073*** 0.052*** 0.043*** 0.082*** 0.056*** 0.049***
(0.009) (0.007) (0.009) (0.006) (0.005) (0.006)
> 1000 emp. 0.115*** 0.085*** 0.075*** 0.102*** 0.067*** 0.066***
(0.009) (0.008) (0.009) (0.006) (0.006) (0.006)
Number of observations 27,182 27,182 27,182 75,562 75,562 75,562
Note: ***, ** and * indicate statistical significant values at the 1%, 5% and 10% error level. Estimations based
on LCS 2000 and 2004 and SES 2002 and 2006. Robust standard errors, Results on other variables in the Ap-
pendix.

27
Of course, we cannot interpret these estimates as causal. Furthermore, our analysis is a partial
analysis, holding all other things constant—thus we may not see such big gains if all firms
increased their training. In particular, since firms will select the workers they want to train,
and most likely they select those workers who benefit most from training, we might not see
wages gains if firms were to train all other workers, too.
4.3 Inequality of wages
Using the panel sample of 594 firms that were sampled in all four surveys, we estimate the
firms’ wage distributions, measured by the Gini index, using firm fixed-effects panel regres-
sions. (We do not have panel information on the individual workers).
We do not find statistically significant effects and, consequently, cannot reject the null hy-
pothesis of no relationship between training and the distribution of wages in a firm.13
Indeed,
the only statistically significant coefficient that is obtained from these regressions is on the
average tenure. The positive coefficient point estimate indicates that the greater the change in
the average tenure in a firm, the more unequal the wage distribution became.
13 We also use the p90/p10 measure which provides the same qualitative results.

28
Table 10: Estimated Gini indices, fixed-effects regressions.
Specification A Specification B
Gini Gini
Training costs/employee (€1000) -0.014 -0.015
(0.032) (0.032)
Fraction women 0.013 0.01
(0.053) (0.053)
Fraction white collar workers 0.052 0.058
(0.072) (0.073)
Fraction part-time workers 0.077 0.076
(0.079) (0.078)
Fraction female part-time workers 0.15 0.149
(0.12) (0.117)
Fraction employees compl. Apprenticeship 0.024 0.016
(0.045) (0.045)
Fraction employees
High school/master craftsman 0.076 0.066
(0.049) (0.052)
Fraction employees university degree -0.083 -0.084
(0.272) (0.27)
Average tenure within firm 0.004* 0.004*
(0.002) (0.002)
Average age of employees 0.001
(0.002)
Number of employees (1000) 0.006 0.007
(0.012) (0.012)
Wage/employee (€1000) 0.000
(0.000)
Number of firms 594 594
Note: ***, ** and * indicate statistical significant values at the 1%, 5% and 10% error
level. Estimations based on LCS 2000 and 2004 and SES 2002 and 2006. Robust standard
errors.
5 Summary
We have investigated the association between employer-provided training and productivity
and wages respectively. For our analysis, we have combined several sources of data on Aus-
trian firms.
For the analysis of training and productivity, we have used data from the Continuing Voca-
tional Training Surveys of 1999 and 2005 and have linked these with data from the Surveys
on Structural Business Statistics. We have found a positive elasticity of about 0.04 of training

29
on productivity. Furthermore, using a lagged but smaller sample, we have estimated elastic-
ities of about 0.02 (of training on next year’s productivity). Firm-fixed effects regressions
using a very small sample of 203 firms give elasticities of about 0.02, too, however these es-
timates are statistically not significant. Although the data are the currently best available data
in Austria, they do not allow us to rule out that selection or reversed causality biases the ob-
tained results.
For the analysis of training and wages we have used data from the Structure of Earnings Sur-
veys of the years 2002 and 2006 and have linked them with data from the Labour Cost Sur-
veys of the years 2000 and 2004. This lagged structure (wages are measured two years later
than training) has allowed us to rule out reversed causality effects. While the majority of Aus-
trian small and medium sized firms spend little or no money on employees’ training, we have
found a robust positive coefficient of 0.05.
Concerning the effects of training on the equality of wages within a firm, we would expect the
following result: If only high wage workers are trained, the wages within a firm will diverge
and, vice versa, we will observe a convergence of wages, if only low wage workers have ac-
cess to training. We have estimated the effects of training on the distribution of wages within
firms and do not find a statistically significant relationship. In other words, our results show
neither that training leads to more wage inequality nor to more wage equality within firms.
Since in general wages correlate with productivity (Dostie, 2006), and since we estimate a
positive elasticity of training on productivity, we conclude that employer-provided training is
beneficial for both firms and workers. While the results cannot be interpreted causally, in the
sense that more training leads to more productivity or wages, the results confirm earlier stud-

30
ies and indicate at least that the link between employer-provided training and productivity
warrants further research.
Because the available data do not allow establishing a causal link, we hesitate to give advice
on how to improve economic policy incentives for employer-provided training on the basis of
our results. It is in addition important to distinguish between the firms that train their workers
without any additional incentive and those firms who will respond to such an incentive to
gauge the size of the deadweight loss. We strongly believe that any policy advice requires
more evidence on how firms decide on whom to train, which types of training to provide and
how much to spend on employer-provided training.

31
6 Literature
Bartel, Ann (1995), “Training, wage growth, and job performance: Evidence from a company
database”, Journal of Labor Economics, 13, 401—25.
BKA (Bundeskanzleramt), (2007), Frauen und Männer in Österreich, Statistische Analysen
zu geschlechtsspezifischen Unterschieden, Wien.
Black, Sandra E. and Lisa M. Lynch (2001), “How to compete: the impact of workplace prac-
tices and information technology on productivity”, The Review of Economics and Sta-
tistics, 83/3, 434--445.
Böheim, René und Nicole Schneeweis (2008), „Betriebliche Weiterbildung und Produk-
tivität“, Wirtschaft und Gesellschaft, 34 (1), 57--81.
Böheim, René und Florian Wakolbinger (2009), „Mehr Lohn bei betrieblicher Weiterbildung?
Eine empirische Analyse österreichischer Unternehmen“, Wirtschaft und Gesellschaft
35 (2), 187--213
Dearden, Lorraine, Howard Reed and John van Reenen (2000), “Who gains when workers
train? Training and corporate productivity in a Panel of British industries”, IFS work-
ing paper 00/01, Institute for Fiscal Studies, London.
Dearden, Lorraine, Howard Reed and John van Reenen (2006), “The impact of training on
productivity and wages: Evidence from British panel data”, Oxford Bulletin of Eco-
nomics and Statistics 68/4, 397—421.
Dostie, Benoit (2006). Wages, productivity and aging. IZA Discussion Paper 2496.
Kaniovski, Serguei and Michael Peneder (2008), Determinants of firm survival: A duration
analysis using the generalized gamma distribution, Empirica, 35(1), 41—58.
Oliner, Stephen D., Daniel E. Sichel, Jack E. Triplett und Robert J. Gordon (1994), “Com-
puters and Output Growth Revisited: How Big is the Puzzle?”, Brookings Papers on
Economic Activity, 273—334.

32
Peneder M. (Koord.), Falk M., Hölzl W., Kaniovski S., Kratena K. (2007), „Technologischer
Wandel und Produktivität“, Wifo-Monatsberichte, 80 (1), S. 33-46.
Statistik Austria, 2001a, Leistungs- und Strukturerhebung 1999, Produktion & Dienstleistun-
gen, www.statistik.at, Wien.
Statistik Austria, 2001b, CVTS2, Dokumentation, www.statistik.at, Wien.
Statistik Austria, 2003, Betriebliche Weiterbildung, Online at: www.statistik.at.
Statistik Austria, 2004, Standard-Dokumentation Metainformationen (Definitionen, Er-
läuterungen, Methoden, Qualität) zur Europäischen Erhebung über berufliche Weiter-
bildung in Unternehmen (CVTS2), Bearbeitungsstand: 31.08.2004, Wien.
Statistik Austria, 2006a, Mikrozensus, Dokumentation, Online at: www.statistik.at.
Statistik Austria, 2006b, Standard-Dokumentation Metainformationen zur Verdienststruktur-
erhebung 2002, www.statistik.at, Wien.
Statistik Austria, 2007, Standard-Dokumentation Metainformationen zur Arbeitskostenerhe-
bung 2004, www.statistik.at, Wien.
Zwick, Thomas, 2002, Employee resistance against innovations, International Journal of
Manpower 23, 542-552.
33
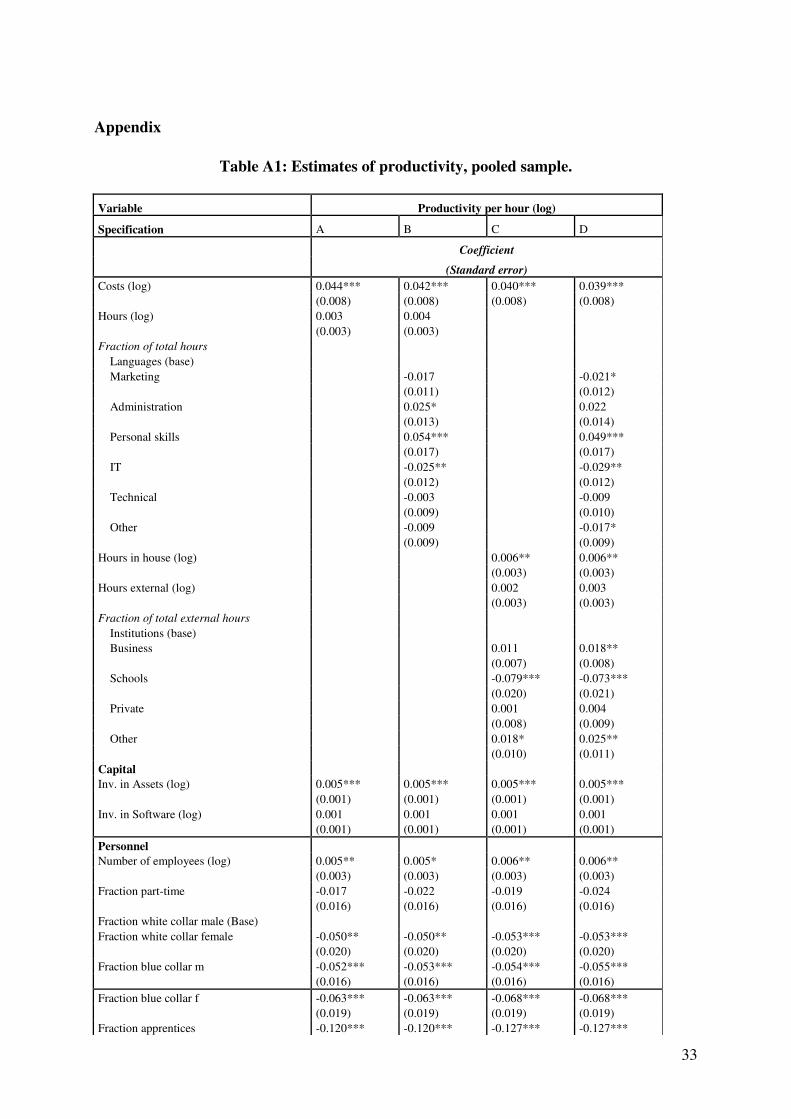
Appendix
Table A1: Estimates of productivity, pooled sample.
Variable Productivity per hour (log)
Specification A B C D
Coefficient
(Standard error)
Costs (log) 0.044*** 0.042*** 0.040*** 0.039***
(0.008) (0.008) (0.008) (0.008)
Hours (log) 0.003 0.004
(0.003) (0.003)
Fraction of total hours
Languages (base)
Marketing -0.017 -0.021*
(0.011) (0.012)
Administration 0.025* 0.022
(0.013) (0.014)
Personal skills 0.054*** 0.049***
(0.017) (0.017)
IT -0.025** -0.029**
(0.012) (0.012)
Technical -0.003 -0.009
(0.009) (0.010)
Other -0.009 -0.017*
(0.009) (0.009)
Hours in house (log) 0.006** 0.006**
(0.003) (0.003)
Hours external (log) 0.002 0.003
(0.003) (0.003)
Fraction of total external hours
Institutions (base)
Business 0.011 0.018**
(0.007) (0.008)
Schools -0.079*** -0.073***
(0.020) (0.021)
Private 0.001 0.004
(0.008) (0.009)
Other 0.018* 0.025**
(0.010) (0.011)
Capital
Inv. in Assets (log) 0.005*** 0.005*** 0.005*** 0.005***
(0.001) (0.001) (0.001) (0.001)
Inv. in Software (log) 0.001 0.001 0.001 0.001
(0.001) (0.001) (0.001) (0.001)
Personnel
Number of employees (log) 0.005** 0.005* 0.006** 0.006**
(0.003) (0.003) (0.003) (0.003)
Fraction part-time -0.017 -0.022 -0.019 -0.024
(0.016) (0.016) (0.016) (0.016)
Fraction white collar male (Base)
Fraction white collar female -0.050** -0.050** -0.053*** -0.053***
(0.020) (0.020) (0.020) (0.020)
Fraction blue collar m -0.052*** -0.053*** -0.054*** -0.055***
(0.016) (0.016) (0.016) (0.016)
Fraction blue collar f -0.063*** -0.063*** -0.068*** -0.068***
(0.019) (0.019) (0.019) (0.019)
Fraction apprentices -0.120*** -0.120*** -0.127*** -0.127***

34
(0.030) (0.030) (0.030) (0.030)
Fraction owners -0.146*** -0.137*** -0.149*** -0.139***
(0.040) (0.040) (0.040) (0.040)
Change since 1 year -0.050*** -0.054*** -0.051*** -0.055***
(0.011) (0.012) (0.011) (0.011)
Region
Upper Austria (Base)
Burgenland 0.017* 0.018* 0.014 0.014
(0.010) (0.010) (0.010) (0.010)
Carinthia 0.001 0.001 -0.002 -0.001
(0.009) (0.009) (0.009) (0.009)
Lower Austria 0.000 -0.002 -0.002 -0.004
(0.006) (0.006) (0.006) (0.006)
Salzburg 0.000 0.001 0.000 0.001
(0.009) (0.009) (0.009) (0.009)
Styria -0.003 -0.005 -0.004 -0.005
(0.008) (0.008) (0.008) (0.008)
Tyrol 0.025*** 0.025*** 0.024*** 0.024***
(0.009) (0.009) (0.009) (0.009)
Vorarlberg 0.024** 0.023** 0.024** 0.024**
(0.011) (0.011) (0.011) (0.011)
Vienna 0.016** 0.014* 0.014* 0.011
(0.008) (0.008) (0.008) (0.008)
ÖNACE Classification
Nace 10 -0.007 -0.002 -0.013 -0.009
(0.157) (0.157) (0.157) (0.156)
...
Nace 74 -0.123*** -0.121*** -0.124*** -0.124***
(0.034) (0.034) (0.034) (0.034)
Legal form
Limited liability (Base)
Limited partnership 0.013* 0.014** 0.013* 0.013*
(0.007) (0.007) (0.007) (0.007)
Stock corporation -0.038** -0.040** -0.039** -0.041**
(0.016) (0.016) (0.016) (0.016)
Individual enterprise -0.005 -0.005 -0.002 -0.003
(0.006) (0.006) (0.006) (0.006)
Other 0.000 -0.002 -0.002 -0.005
(0.009) (0.009) (0.009) (0.009)
Other Control variables
1999 -0.002 -0.004 -0.001 -0.002
(0.005) (0.005) (0.005) (0.005)
Change since 1 year missing 0.140*** 0.142*** 0.139*** 0.140***
(0.041) (0.041) (0.041) (0.041)
employees LSE CTVS -0.005 -0.007 -0.004 -0.008
(0.008) (0.008) (0.008) (0.008)
Constant 4.940*** 4.950*** 4.965*** 4.969***
(0.062) (0.062) (0.062) (0.062)
R-squared 0.195 0.199 0.200 0.204
Number of observations 3,350 3,350 3,350 3,350
Note: ***, ** and * indicate statistical significant values at the 1%, 5% and 10% error level. Estimations based
on CVTS 1999 and 2005 and SSBS 1999 and 2005.

35
Table A2: Estimates of wages, cross-section
2000/2 2004/6
Specification A B C A B C
Dependent variable log(hwage) log(hwage) log(hwage) log(hwage) log(hwage) log(hwage)
Training costs (€ 1000) 0.067*** 0.07*** 0.05*** 0.052*** 0.053*** 0.037***
(0.01) (0.01) (0.01) (0.005) (0.005) (0.004)
Individual characteristics
Female -0.145*** -0.154*** -0.107*** -0.131*** -0.135*** -0.097***
(0.008) (0.008) (0.011) (0.005) (0.005) (0.005)
Age 0.011*** 0.006*** 0.01*** 0.011*** 0.007*** 0.01***
(0) (0) (0) (0) (0) (0)
Part-time 0.051*** -0.04***
(0.01) (0.008)
temporary contract -0.012 -0.053***
(0.016) (0.009)
shift-work 0.072*** 0.095***
(0.006) (0.003)
Education (Base: compulsory school)
Apprenticeship 0.202*** 0.058*** 0.194*** 0.206*** 0.042*** 0.197***
(0.008) (0.006) (0.008) (0.006) (0.004) (0.005)
High school degree/master
craftsman 0.279*** 0.124*** 0.256*** 0.268*** 0.101*** 0.25***
(0.01) (0.008) (0.012) (0.007) (0.005) (0.006)
University degree 0.497*** 0.347*** 0.41*** 0.421*** 0.253*** 0.366***
(0.021) (0.02) (0.022) (0.012) (0.011) (0.011)
Employee classification (Base: white collar)
Blue collar -0.168*** -0.16***
(0.01) (0.006)
Apprentice -0.956*** -0.967***
(0.016) (0.011)
marginal employment -0.164*** -0.202***
(0.018) (0.013)
Tenure within enterprise 0.008*** 0.007*** 0.006*** 0.009*** 0.008*** 0.007***
(0) (0) (0.001) (0) (0) (0)
Occupation
head in administration 0.677*** 0.526*** 0.457*** 0.663*** 0.534*** 0.52***
(0.028) (0.028) (0.054) (0.018) (0.018) (0.018)
…
unskilled labour 0 -0.11*** 0 0.002 -0.125*** -0.001
(0.013) (0.009) (0.012) (0.008) (0.006) (0.008)
Supplements, worked hours, holidays
Supplements in reference
month (€ 1000) 0.383***
0.373***
(0.03) (0.013)
Extra payments (€ 1000) 0.019*** 0.012***
(0.006) (0.001)
Number of paid extra 0.001*** 0.002***

36
hours/month
(0) (0)
Payments for extra hours
(€1000) 0.143***
0.158***
(0.009) (0.007)
holidays 2002 0.005*** -0.002**
(0.001) (0.001)
Firm
Fraction women -0.096*** -0.081*** -0.105*** -0.147*** -0.112*** -0.167***
(0.02) (0.018) (0.018) (0.013) (0.012) (0.012)
Fraction white collar 0.118*** 0.011 0.12*** 0.093*** -0.007 0.095***
(0.018) (0.016) (0.017) (0.011) (0.011) (0.01)
Fraction part-time -0.125*** -0.1*** -0.095*** -0.083*** -0.066*** -0.055***
(0.029) (0.026) (0.028) (0.017) (0.014) (0.016)
Fraction female part-time 0.011 -0.027 0.016 0.006 -0.019 0.019
(0.033) (0.03) (0.031) (0.02) (0.018) (0.019)
Fraction completed apprentice-
ship 0.143*** 0.16*** 0.099*** 0.048*** 0.076*** 0.046**
(0.023) (0.019) (0.021) (0.018) (0.014) (0.017)
Fraction high school degree 0.185*** 0.256*** 0.141*** 0.258*** 0.3*** 0.229***
(0.03) (0.026) (0.027) (0.021) (0.018) (0.02)
Fraction university degree 0.384*** 0.444*** 0.222*** 0.16*** 0.232*** 0.142***
(0.055) (0.051) (0.059) (0.029) (0.026) (0.026)
Firm size (Base: less than 50 employees)
50 -249 emp. 0.017** 0.013** 0.014** 0.041*** 0.023*** 0.026***
(0.008) (0.007) (0.007) (0.006) (0.005) (0.005)
250 - 499 emp. 0.039*** 0.022*** 0.022*** 0.072*** 0.04*** 0.05***
(0.009) (0.008) (0.008) (0.006) (0.005) (0.006)
500 - 999 emp. 0.073*** 0.052*** 0.043*** 0.082*** 0.056*** 0.049***
(0.009) (0.007) (0.009) (0.006) (0.005) (0.006)
> 1000 emp. 0.115*** 0.085*** 0.075*** 0.102*** 0.067*** 0.066***
(0.009) (0.008) (0.009) (0.006) (0.006) (0.006)
ÖNACE Classification
Industrial products 0.155*** 0.098*** 0.132*** 0.119*** 0.068*** 0.1***
… (0.013) (0.01) (0.012) (0.009) (0.008) (0.008)
other services 0.106*** 0.088*** 0.081*** 0.109*** 0.06*** 0.068***
(0.024) (0.019) (0.023) (0.012) (0.011) (0.012)
Nuts 1 Region (Base: East (Vienna, Lower Austria, Burgenland)
South -0.056*** -0.042*** -0.046*** -0.055*** -0.041*** -0.049***
(0.007) (0.006) (0.007) (0.005) (0.004) (0.005)
West 0.003 0.007 0.005 0.021*** 0.026*** 0.021***
(0.006) (0.005) (0.005) (0.004) (0.004) (0.004)
Number of observations 27,182 27,182 27,182 75,765 75,765 75,765
Note: ***, ** and * indicate statistical significant values at the 1%, 5% and 10% error level. Estimations based
on LCS 2000 and 2004 and SES 2002 and 2006. Robust standard errors.