Educational reform and disadvantaged students : are - EconStor
47
econstor Make Your Publications Visible. A Service of zbw Leibniz-Informationszentrum Wirtschaft Leibniz Information Centre for Economics Bishop, John H.; Mane, Ferran Working Paper Educational reform and disadvantaged students : are they better off or worse off? CESifo Working Paper, No. 1309 Provided in Cooperation with: Ifo Institute – Leibniz Institute for Economic Research at the University of Munich Suggested Citation: Bishop, John H.; Mane, Ferran (2004) : Educational reform and disadvantaged students : are they better off or worse off?, CESifo Working Paper, No. 1309, Center for Economic Studies and Ifo Institute (CESifo), Munich This Version is available at: http://hdl.handle.net/10419/18674 Standard-Nutzungsbedingungen: Die Dokumente auf EconStor dürfen zu eigenen wissenschaftlichen Zwecken und zum Privatgebrauch gespeichert und kopiert werden. Sie dürfen die Dokumente nicht für öffentliche oder kommerzielle Zwecke vervielfältigen, öffentlich ausstellen, öffentlich zugänglich machen, vertreiben oder anderweitig nutzen. Sofern die Verfasser die Dokumente unter Open-Content-Lizenzen (insbesondere CC-Lizenzen) zur Verfügung gestellt haben sollten, gelten abweichend von diesen Nutzungsbedingungen die in der dort genannten Lizenz gewährten Nutzungsrechte. Terms of use: Documents in EconStor may be saved and copied for your personal and scholarly purposes. You are not to copy documents for public or commercial purposes, to exhibit the documents publicly, to make them publicly available on the internet, or to distribute or otherwise use the documents in public. If the documents have been made available under an Open Content Licence (especially Creative Commons Licences), you may exercise further usage rights as specified in the indicated licence. www.econstor.eu
Transcript of Educational reform and disadvantaged students : are - EconStor
econstorMake Your Publications Visible.
A Service of
zbwLeibniz-InformationszentrumWirtschaftLeibniz Information Centrefor Economics
Bishop, John H.; Mane, Ferran
Working Paper
Educational reform and disadvantaged students : arethey better off or worse off?
CESifo Working Paper, No. 1309
Provided in Cooperation with:Ifo Institute – Leibniz Institute for Economic Research at the University ofMunich
Suggested Citation: Bishop, John H.; Mane, Ferran (2004) : Educational reform anddisadvantaged students : are they better off or worse off?, CESifo Working Paper, No. 1309,Center for Economic Studies and Ifo Institute (CESifo), Munich
This Version is available at:http://hdl.handle.net/10419/18674
Standard-Nutzungsbedingungen:
Die Dokumente auf EconStor dürfen zu eigenen wissenschaftlichenZwecken und zum Privatgebrauch gespeichert und kopiert werden.
Sie dürfen die Dokumente nicht für öffentliche oder kommerzielleZwecke vervielfältigen, öffentlich ausstellen, öffentlich zugänglichmachen, vertreiben oder anderweitig nutzen.
Sofern die Verfasser die Dokumente unter Open-Content-Lizenzen(insbesondere CC-Lizenzen) zur Verfügung gestellt haben sollten,gelten abweichend von diesen Nutzungsbedingungen die in der dortgenannten Lizenz gewährten Nutzungsrechte.
Terms of use:
Documents in EconStor may be saved and copied for yourpersonal and scholarly purposes.
You are not to copy documents for public or commercialpurposes, to exhibit the documents publicly, to make thempublicly available on the internet, or to distribute or otherwiseuse the documents in public.
If the documents have been made available under an OpenContent Licence (especially Creative Commons Licences), youmay exercise further usage rights as specified in the indicatedlicence.
www.econstor.eu
EDUCATIONAL REFORM AND DISADVANTAGEDSTUDENTS: ARE THEY BETTER OFF
OR WORSE OFF?
JOHN BISHOP FERRAN MANE
CESIFO WORKING PAPER NO. 1309 CATEGORY 4: LABOUR MARKETS
OCTOBER 2004
PRESENTED AT CESIFO/PEPG CONFERENCE ON SCHOOLING AND HUMAN CAPITAL FORMATION IN THE GLOBAL ECONOMY, SEPTEMBER 2004
An electronic version of the paper may be downloaded • from the SSRN website: www.SSRN.com • from the CESifo website: www.CESifo.de
CESifo Working Paper No. 1309
EDUCATIONAL REFORM AND DISADVANTAGED STUDENTS: ARE THEY BETTER OFF
OR WORSE OFF?
Abstract This paper analyzes the effects of increased academic standards on both average achievement levels and on equality of opportunity. The five policies evaluated are: (1) universal Curriculum-Based External Exit Exam Systems, (2) voluntary curriculum-based external exit exam systems with partial coverage such as New York State Regents exams in 1992, (3) state minimum competency graduation tests, (4) state defined minimums for the total number of courses students must take and pass to get a high school diploma and (5) state defined minimums for the number of academic courses necessary to get a diploma. We use international data to evaluate the effects of CBEEES. High school graduation standards differ a lot across states in the U.S. This allowed us to measure policy effects on student achievement and labor market success after high school by comparing states in a multiple regression framework. Our analysis shows that only two of the policies examined deliver on increasing everyone’s achievement and also reduce achievement gaps: universal CBEEES and higher academic course graduation requirements. Other policies were less successful in raising achievement and enhancing equality of opportunity.
JEL Code: H5, I2.
John Bishop
Human Resource Studies Department Cornell University
390, Ives Hall Ithaca, New York 14853
Ferran Mane Department of Economics Rovira i Virgili University
Av. de la Universitat, 1 43204 Reus, Catalonia
Spain [email protected]
Draft paper prepared for presentation at the CESifo-Harvard University/PEPG Conference on “Schooling and Human Capital in the Global Economy: Revisiting the Equity-Efficiency Quandary,” CESifo Conference Center, Munich, September 3-4, 2004.
2
1. Introduction
Political leaders in many nations are looking for ways to better prepare their youth to
compete in the global economy and to help disadvantaged children catch up educationally.
Education policy debates are often framed as striking a balance between the �opposing� goals of
high standards and equality of opportunity. The left and the right wings of the political spectrum
take sides and a stalemate ensues. While some policy choices do present a tradeoff between these
goals, other policy options do not. Accountability advocates, for example, argue that strengthening
school and student accountability will simultaneously raise achievement and enhance equality of
opportunity. Opponents of accountability claim the reverse is true. This paper subjects these
claims to rigorous empirical analysis using both international and U.S. data.
We begin in section 2 by laying out reasons for expecting high or medium stakes external
assessment of student achievement to both raise achievement levels and to close gaps between
advantaged and disadvantaged students. The empirical work presented in section 3 assesses the
effects of student accountability by comparing the achievement levels, school attendance rates and
equality of opportunity outcomes of nations that do and do not have curriculum-based external exit
exam system (CBEEES) like the French Baccalaureate and Britain�s GCSE and A level exams.
Data on 41 countries from the year 2000 Program for International Students Assessment (PISA) are
analyzed.
We next turn to an analysis of U.S. longitudinal data following a cohort of 8th graders in
1988 through young adulthood until the year 2000. The fourth section of the paper describes the
mechanisms by which state governments tried to make schools accountable during the years
National Educational Longitudinal Survey of 1988 (NELS-88) students were attending high school.
The empirical work assesses the effects of four state accountability policies being employed at that
time: (1) state defined minimums for the total number of courses students must take and pass to
get a high school diploma; (2) state defined minimums for the number of academic courses
necessary to get a diploma, (3) states minimum competency graduation tests and (4) a voluntary
curriculum-based external exit exam system�the New York State Regents exams�covering
about 60 percent of high school students. The empirical work that follows in section 5 compares
these four policies to the more traditional spending oriented policies of reducing pupil-teacher
ratios and increasing teacher salaries. The empirical work evaluates the impacts of these policies
3
on test score gains, high school completion, college attendance and completion and labor market
success. The models we estimate include an interaction of a parental socio-economic status (SES)
composite with each of the policy variables. This allows us to calculate separate impact estimates
for low SES, medium SES and high SES students. Section 6 presents a summary of results and
proposes an agenda for future research.
2. External Examinations: Signals of Learning that Encourage High Standards and
Improve Payoffs to Learning
Let us begin by defining what a Curriculum-Based External Examination System is and
is not. CBEEES have the following eight features:
1. Produce signals of accomplishments that have real consequences for the student.
2. Define achievement relative to an external standard, not relative to other students in the
classroom or the school. Fair comparisons of achievement across schools and across
students taught by different teachers are now possible. Costrell's (1994) analysis of the
optimal setting of educational standards concluded that more centralized standard setting
(state or national achievement exams) results in higher standards, higher achievement and
higher social welfare than decentralized standard setting (ie. teacher grading or schools
graduation requirements).
3. Are controlled by the education authority that establishes the curriculum for and funds
K-12 education. When a national or provincial ministry of education sponsors an external
exam, it is more likely to be aligned with the national or provincial curriculum. It is,
consequently, more likely to be used for school accountability; not just as an instrument of
student accountability. Curriculum reform is facilitated because coordinated changes in
instruction and exams are feasible. Tests established and mandated by other organizations�
eg. the SAT-I and the ACT�serve the interests of colleges to sort students by aptitude not
the needs of high schools to reward students who have learned what schools are trying to
teach.
4. Cover the vast majority of students. External exams for elite students (eg. AP exams)
raise achievement levels of these students, but they will also tend to increase achievement
gaps between high SES and low SES students.

4
5. Assess a major portion of what students are expected to know or be able to do. Studying
to prepare for an exam (whether set by one�s own teacher or by a ministry of education)
should result in the student learning important material and developing valued skills.
6. Are collections of End-of-Course Exams (EOCE). Since they assess the content of specific
sequences of courses, alignment between instruction and assessment is maximized and
teacher accountability is enhanced. Teachers become coaches helping their team to battle
with the national or provincial exam. Students should be less likely to pressure teachers to
lower standards.
7. Signal multiple levels of achievement in the subject. If only a pass-fail signal is generated
by an exam, the standard will, for political reasons, have to be set low enough to allow almost
everyone to pass. The achievement of most students will be so far above this level that the
threat of failing the exam will not stimulate them to greater effort (Kang, 1985; Becker and
Rosen, 1992; Costrell, 1994; Betts and Costrell, 2001). CBEEEs signal the student�s
achievement level in the subject, not just whether the student exceeds or falls below a
specific cut point that all high school graduates are required to surpass. Consequently all
students, not just those at the bottom of the class, are given an incentive to study hard to do
well on the exam (Becker and Rosen, 1992). Costrell agrees: "The case for perfect
information [making scores on external examinations available rather than just whether the
individual passed or failed] would appear to be strong, if not airtight: for most plausible
degrees of heterogeneity, egalitarianism, and pooling under decentralization, perfect
information not only raises GDP, but also social welfare (1994, p. 970)."
8. Assess difficult material. Since CBEEES signal the full range of achievement in the
subject, they contain more difficult questions and problems. This induces teachers to spend
more time on cognitively demanding skills and topics.
Systems of curriculum-based external exit examinations (CBEEES) provide a strong and
organic system of accountability. Exam grades typically appear on resumes and are requested on
job applications. Exam grades influence (and in some nations completely determine) whether a
student can enter a university and which university and what field of study they are admitted to.
Where CBEEES are absent, university admission decisions are based on multiple choice format
aptitude tests that are not keyed to the courses taken in secondary school and teacher assessments
of relative performance--rank in class and grades. In nations lacking a CBEEES�Spain and the
5
United States, for example--employers typically pay little attention to achievement in high school
when making hiring decisions. CBEEES also strengthen social incentives to study because students
are no longer competing with each other for a limited number or As and Bs. Everyone can get a 90
or better on the external exam, so students will be less supportive of those who disrupt the class and
more supportive of those who take learning seriously. It no longer makes sense for students to
avoid the more rigorous courses and the more demanding teachers.
CBEEES change how student achievement is signaled. By doing so they transform the
incentives for everyone: parents, teachers and school administrators as well as students. In the U.S.
locally elected school boards and administrators make the thousands of decisions that determine
academic expectations and program quality. When there is no external assessment of academic
achievement, students and their parents benefit little from administrative decisions that opt for
higher standards, more qualified teachers or a heavier student workload. The immediate
consequences of such decisions are all negative: higher local property taxes, more homework,
having to repeat courses, lower GPA's, complaining parents, a greater risk of being denied a
diploma.
This is one of the reasons why 30 percent of American teachers report being pressured by
parents or administrators "to reduce the difficulty and amount of work you assign and �to give
higher grades than students' work deserves" (Hart, 1995)." When the only signal of student
achievement is teacher grades, parents typically prefer high grades not high standards (Figlio and
Lucas, 2002). All students end up learning less. Standards fall most of all in schools serving
students from disadvantaged backgrounds or with limited English proficiency. External exams
prevent teachers from hiding teaching failures by lowering standards to keep failure rates low.
The only response open to them is to demand more of their students so as to maximize their chances
of being successful on the external exams.
Teachers who work in systems with external exams are aware of this. When a proposal
was put forward in Ireland to drop the nation�s system of external assessments and have teachers
assess students for certification purposes, the union representing Ireland�s secondary school teachers
reacted as follows:
Major strengths of the Irish educational system have been:
(i) The pastoral contribution of teachers in relation to their pupils
(ii) The perception of the teacher by the pupil as an advocate in terms of nationally
certified examinations rather than as a judge.

6
The introduction of school-based assessment by the pupil's own teacher for
certification purposes would undermine those two roles, to the detriment of all
concerned....
The role of the teacher as judge rather than advocate may lead to legal
accountability in terms of marks awarded for certification purposes. This would
automatically result in a distancing between the teacher, the pupil and the parent. It
also opens the door to possible distortion of the results in response to either parental
pressure or to pressure emanating from competition among local schools for pupils.
(Association of Secondary Teachers of Ireland, Flyer, 1990, p. 1)
Note how the Irish teachers union feared that switching entirely to internal assessment would
result in teachers being pressured to lower standards.
Without a CBEEES to signal achievement, the benefits of higher standards and greater
effort lose visibility. Graduates will probably do better in difficult college courses and will be more
likely to get a degree, but that benefit is uncertain, far in the future and not visible to parents and
local voters. In this environment, administrators will seek teachers who keep their class orderly and
entertained, who have roots in the community and who are willing to coach. If this is all one
expects of teachers, sufficient numbers can be found at current salary levels. If, however,
administrators were to demand that newly hired teachers have a deep knowledge of their subject and
the ability to teach it to teenagers, they would find that there are not enough qualified teachers to go
around. The shortage would not disappear until much higher salaries were offered. School tax
levies would have to rise. External exams make stake holders care about how well high school
subjects are taught. Hiring better teachers and improving the school's science laboratories now
yields a visible payoff--more students passing the external exams and being admitted to top
colleges. This should induce school districts to compete for talent by offering higher salaries and
better working conditions. When external assessment is absent, school reputations are determined
by things that teachers and administrators have little control over: the socio-economic status of the
student body and the proportion of graduates going to college.
A further benefit of CBEEES is the professional development that teachers receive when
they are brought to centralized locations to grade the extended answer portions of examinations. In
Canada, even teachers who are apposed to diploma exams consider that grading committees are
7
��a wonderful professional development activity�1. Having to agree on what constituted excellent,
good, poor, and failing responses to essay questions or open-ended math problems resulted in a
sharing of perspectives and teaching tips that most found very helpful.
CBEEES are, consequently, hypothesized to influence the priorities of school
administrators, teacher pedagogy, parental encouragement, student effort and achievement. They
are also expected to press school systems to raise achievement of students from disadvantaged
backgrounds.
3. International Evidence on the Effects of CBEEES
3.1 Literature review
The hypothesis that curriculum-based external exit examination systems improve achievement has
been tested by comparing nations and provinces that do and do not have such systems. Five
different international data sets have been examined. In most studies of the effect of CBEEES
national mean test scores (for an age group or a grade) were regressed on per capita gross domestic
product deflated by a purchasing power parity price index, a dummy for East Asian nation and a
dummy for CBEEES. Analyzing 1994-95 Third International Math and Science Study (TIMSS)
data, Bishop (1996, 1997) found that 13 year old students from countries with medium and high
stakes CBEEE systems outperformed students from other countries at a comparable level of
economic development by 1.3 U.S. grade level equivalents (GLE) in science and by 1.0 GLE in
mathematics. Analysis of data from the 1990-01 International Association for the Evaluation of
Educational Achievement�s study of the reading literacy study of 14 year olds in 24 countries found
that students in countries with CBEEES were about 1.0 GLE ahead of students in nations that
lacked a CBEEES (Bishop 1999b). Analysis of data from both waves of TIMSS data collection
also implies that CBEEES have highly significant effects (of about 1.5 GLEs) on the math and
science achievement in 8th grade (Bishop 2003).
Two other studies (Ludger Wößmann (2000, 2002) and Hyea Sook Ryoo (2002) have
conducted hierarchical analyses of the entire TIMSS and TIMSS-R micro data set and included a
comprehensive set of controls for family background, teacher characteristics, school resources and
policies at the individual and school level. Wößmann found that 8th graders in CBEEES nations
1 John Bishop�s interviews with teachers union activists in 1996 in Alberta, Canada.
8
were about 1.1 international grade level equivalents ahead in mathematics and about 0.8
international grade level equivalents ahead in science. He also found that learning gains between 7th
and 8th grade were significantly larger in CBEEES nations. Another two studies compare students
living in different provinces/states in Germany and Canada. Wößmann found that the German
Lander with centralized secondary school exit examinations had significantly higher scores on the
PISA literacy assessments. Students attending school in Canadian provinces with CBEEES were a
statistically significant one-half of a U.S grade level equivalent ahead in math and science of
comparable students living in provinces without CBEEES (Bishop 1997, 1999a).
3.2 New empirical evidence
We will now turn to new analysis of Program for International Student Assessment 2000
data on 41 countries. The Program for International Student Assessment (PISA) is a new system
of international assessments focusing on the reading, mathematics and science literacy of 15-
year-olds. Each participating country selected a nationally representative sample of
approximately 4000 fifteen year olds. The students completed a 20 to 30 minute background
questionnaire and a 90-minute assessment consisting of a mix of multiple choice, short answer,
and extended response questions. �While other studies, such as TIMSS and NAEP, have a strong
link to curriculum frameworks and seek to measure student�s mastery of specific knowledge,
skills and concepts, PISA is designed to measure �literacy� more broadly.� 2 PISA assesses the
cumulative educational experiences of all students at age 15 regardless of the grade levels or type
of institution they are attending. �By assessing students near the end of compulsory schooling in
key knowledge and skills, PISA provides information about how well prepared students will be
for their future lives as they approach an important transition point for education and work.�3
Achievement Levels: The first three rows of Table 1 present an analysis of PISA data on
reading, mathematics and science literacy. The achievement of students with two native-born
parents is analyzed in order to eliminate variation in rates of immigration as a confounding
variable. The base line model has three variables: GDP per capita (to capture national wealth,
the socio-economic background of parents and the efficiency of the nation�s institutions), a
2 M. Lemke et. al., Outcomes of Learning: Results from the 2000 Program for International Student Assessment of15-Year-Olds in Reading, Mathematics, and Science Literacy, 2001. p. 3.3 M. Lemke et. al., p. 3.
9
dummy variable for CBEEES nation and a dummy variable for East Asia intended to capture
cultural differences between East and West. Scores are significantly higher in more developed
nations, East Asian nations and in nations with a CBEEES. Estimated impacts of CBEEES appear
to be comparable to those in TIMSS and IEA reading studies and similar in magnitude to a doubling
of a nation�s productivity and income per capita.4
School Attendance Rates: Many believe a tradeoff exists between the standards and quality
of an educational system and the number of students who can or will stay in school into their late
teens and twenties. Opponents of high or medium stakes student accountability systems often argue
that they will increase dropout rates and reduce college attendance rates. This hypothesis was tested
by calculating how many years youth in each nation spend in school [by summing the net-
enrollment rates of people from age 5 to 65] and then testing what impact CBEEES have on
�expected years of schooling.� The results are presented in the fourth and fifth rows of Table 1.
CBEEES had no effect on expected years of schooling. The only variable with significant effects
on the number of years people spend in school was per-capita GDP.
Rows 6 through 8 present models assessing the effects of CBEEESs on upper-secondary
graduation rates and school attendance rates of 15-19 year olds and 20-24 year olds. These models
included controls for two additional variables previously shown to be important: unemployment
and the availability of career-tech programs in upper-secondary school (Bishop and Mane 2004).
Curriculum-based external exit exams had no significant association with school enrollment rates
but a significant positive relationship with upper-secondary graduation rates.
Here again the productivity level of the country�per capita GDP�was the most
important predictor. The adult unemployment rate had a statistically significant positive
relationship with enrollment rates and graduation rates. The share of upper-secondary students
in career-tech programs also had statistically significant (at the 10 percent level on a two-tail
test) positive relationships with upper secondary graduation rates and the proportion of 15-19
year olds in school or college. The relationship appears to be substantively important. A 10
percentage point increase in the share of upper secondary students in vocational and
prevocational programs is associated with a 2.6 percentage point increase in the high school
graduation rate and a 1.8 percentage point increase in the proportion of 15-19 year olds in school.
4 Models predicting PISA scores of students who speak the school�s language of instruction �most of the time athome� obtain very similar results.

10
Inequality of Opportunity: Table 2 presents our analysis of the effects of CBEEES on three
indicators of inequality of educational opportunity. An appendix of the PISA report presents simple
within-country regressions in which test scores were predicted either by a family wealth index
(based on student reports of home size and possessions) or by an occupational status index for the
family�s bread winner. Large positive parameters imply that the educational success of children
strongly depends on parent SES and that educational opportunities are quite unequal. Small SES
parameters imply that educational opportunities are pretty equal. These PISA estimated SES
parameters become our dependent variables. Results are presented in the top panel of Table 2. If
the coefficient on the CBEEES dummy in the first column is negative, the external exit exams are
providing a bigger boost to the learning of students from disadvantaged backgrounds than
advantaged backgrounds Positive coefficients on CBEEES imply the opposite.
All four of the coefficients are negative and three are significantly negative. This implies
that CBEEES enhance the learning of disadvantaged children more than they enhance the learning
of children from advantaged backgrounds. How big are these effects? The dependent variables
being predicted represent the impact of a one standard deviation increase in family wealth or
occupational status on test scores. In the U.S. families in the bottom quartile on the wealth index
are on average 2.4 standard deviations below the mean for the top quartile. The regression predicts
that CBEEES improve the reading literacy of the children from the bottom wealth quartile by 23
points (-9.7*2.4) more than it improves the reading literacy of students from the top wealth
quartile. This compares quite favorably to our 21.7 point estimate of the average effect of a
CBEEES on children of native-born parents. CBEEES are also predicted to improve math literacy
of the bottom occupational status quartile by 12 points (4.6*2.6) more than for the top quartile. For
science the low SES children improve 14.6 points more than high SES children when they live in a
nation with CBEEES.
The bottom panel of Table 2 presents regressions predicting the test score gap between the
children of native-born parents and immigrant children. These gaps could not be calculated for
countries with very low rates of immigration, so we have fewer observations to include in the
analysis. GDP per capita was never statistically significant when included, so we present results for
a simple regression where the CBEEES dummy predicts the test score gaps. Here again a negative
coefficient on the CBEEES variable implies that gaps between children of native born citizens and
immigrant children are smaller when a nation has a CBEEES. All six coefficients are negative and
three are significantly negative at the five percent level on a one-tail test. Two others are significant
11
at the 10 percent level on a one-tail test. The magnitude (between 20 and 32 points) of the
CBEEES coefficients predicting the gap is roughly equal to the Table 1 estimates of CBEEES
impacts on the children of native-born parents. This implies that CBEEES are predicted to raise the
PISA achievement scores of immigrant children by roughly twice as much as they raise scores of
students with native-born parents.5
In summary, the predictions of the opponents of curriculum-based external exit exams are
decisively rejected by our analysis of international data. The predictions of advocates are supported.
CBEEES increase average achievement levels and tend to reduce achievement differentials between
high SES and low SES students. Years spent in school are unaffected.
What do these positive findings regarding the effects of curriculum-based external exit
exams in other countries suggest about the likely effects of student accountability in the United
States? Only two states�New York and North Carolina�actually have a CBEEES and they
became compulsory and reached universality only during the 1990s. The most popular student
stakes policies in the United States�minimum competency exams and higher course graduation
requirements�are very different from CBEEES. The rest of the paper provides an analysis of
the effects of these policies on students who were in high school between 1988 and 1992. In section
4 we describe these policies. Section 5 uses NELS-88 data to evaluate their impacts on learning,
high school completion, college attendance and labor market outcomes.
4. Policies for Raising Student Achievement and Improving Labor Market Success
In the remainder of the paper we turn our attention to efforts to reform U.S. secondary
schools. We compare the effectiveness of three types of educational initiatives intended to raise
academic achievement and help graduates get better jobs: (A) more spending to reduce class size
and improve teacher quality, (B) higher course graduation requirements and (C) graduation exams.
A. Smaller Class Sizes and Higher Salaries to Attract Better Teachers: There is an
extensive literature on the effects of class size and teacher salaries on student learning. It has been
recently reviewed by Hedges, Laine and Greenwald (1994), Hanushek (1997), Ballou and
Podgursky (1999) and Kruger (2000), so another review is not necessary here.
5 Causation may also run in a circular fashion. Some migrants may be choosing countries like Australia, NewZealand and Canada because they have CBEEES which give their children a better chance to be successful in schoolbecause the CBEEES plays to their strength�willingness to study hard.
12
These policies are costly, however and there is controversy about their cost effectiveness,
so state policy makers have also looked for less expensive ways of increasing student achievement.
Policy makers believed that learning could be increased by getting teachers to set higher standards
and by inducing students to study more diligently. Consequently, many of the education reforms
introduced during the 1980s and 1990s have focused on increasing the academic focus of schools,
raising the standards and expectations of teachers and inducing students to study harder. Four
different policy instruments will be examined.
B. State Set Minimums for the Number of Courses Required to Obtain a High School
Diploma: The National Commission on Excellence in Education recommended in 1983 that all
high school students take at least three credits (full year courses with 120 to 150 hours of
instruction) each in mathematics, science and social studies and four credits of English. This
recommendation represented a major departure from customary course taking patterns at that
time. Only 14 percent of high school graduates in 1982 had completed the package
recommended by the Commission. No state made it a requirement.
Responding to the Commission, many states increased the number of mathematics,
science and social studies courses required to graduate. Seventeen states now require students to
take the thirteen core academic courses recommended by the Commission. The increase in the
payoff to college during the 1980s and toughened graduation requirements appear to be having
the desired effect (Bishop and Mane, 2004b). Low-level math courses are losing popularity and
credits earned in algebra, geometry and higher-level math courses have increased 57 percent.
The number of science courses taken has increased 42 percent. Fifty-five percent of the Class of
1998 completed the 13 credit academic program recommended by the National Commission.
The total number of full-year courses completed during high school has risen from 21.6 in 1982 to
25.9 for the Class of 2000 (NCES, 2004).
There is, however, a potential down side to increased graduation requirements. High
school graduation rates may decline. Put yourself in the shoes of a student who has failed a few
courses and has therefore accumulated only 8 Carnegie units by the end of their second year in
high school. In states that require only 16 Carnegie units to graduate (as Illinois does), getting a
high school diploma still looks feasible. If, by contrast, the state requires 23 Carnegie units to
graduate (as Louisiana and District of Columbia did in 1992), getting a diploma starts looking
very difficult. Economic theory predicts that increases in the total number of courses required to
graduate will induce some students to give up on getting a regular high school diploma and drop
13
out of high school.6 Alternatively students may respond by pursuing a Graduate Equivalency
Diplomas (GED) instead. Tests of these predictions carried out by Dean Lillard and Phillip
DeCicca (2001), Bishop, Mane and Moriarty (2000) and by Bishop, Mane, Bishop and Moriarty
(2001) have found that states with a higher than average total number of courses required for
graduation do indeed have higher dropout rates, lower high school enrollment and graduation rates
and higher numbers of GEDs awarded when other characteristics of the state are controlled.7
In 1980 forty-three states required fewer than 20 Carnegie units to graduate. Now, entering
students face a 24 course minimum in five states, a 22 or 23 course minimum in thirteen states, a 21
course minimum in nine states and a 20 course minimum in another eight states.
Increases in required academic courses often precipitated these increases in total number
of courses required to graduate. However, a different path could have been chosen. The total
number of Carnegie units required to graduate could have been held fixed and the number of
required electives reduced as academic requirements were increased. Would this have avoided
stimulating an increase in dropout rates? Possibly. But, it is also possible that required academic
courses are a bigger barrier to graduation than required electives. At risk students may find
compulsory academic courses more difficult than the electives they would otherwise choose.
Insufficient enrollment can result in the cancellation of an elective course, so their teachers may
be under greater pressure to be entertaining and pass all students. On the other hand, almost all
students have the option of choosing lower track academic classes where regular attendance and
civility is all that is required to pass. These classes are often less demanding than the
heterogeneously grouped elective classes. The class cutting and poor study habits that are the
primary cause of failing grades generate problems in non-academic courses as well as academic
courses. We predict, therefore, that dropout rates and graduation rates will respond to the total
number of course required, not to how they are distributed between electives and academic
6 In models developed by Kang (1985) and Costrell (1994), some of the students faced with higher graduationstandards conclude that the effort necessary to get a diploma is too great and so give up on the idea of getting adiploma. While these theoretical models associate �giving up� with dropping out of school, this is not necessarily thecase. Students who believe they cannot graduate might nevertheless continue to attend high school because they enjoysocializing and playing sports or because they are learning a trade.
7 Dean Lillard and Phillip DeCicca, �Higher Standards, More Dropouts? Evidence within and across Time�(Forthcoming in Economics of Education Review, 2000), pp. 1-33.Dean Lillard and Phillip DeCicca, �The Effects of State Graduation Requirements on High School Dropout Decisions�(College of Human Ecology, Cornell University 1997a), pp. 1-27.Dean Lillard and Phillip DeCicca, �State Education Policy and Dropout Behavior: An Empirical Investigation�(College of Human Ecology, Cornell University, 1997b) pp. 1-23.

14
courses. This, however, is an empirical question that will be tested below by including both (B-
1) the number of required academic courses and (B-2) the total number of courses required to
graduate in our models predicting educational outcomes.
C�1. Minimum Competency Exam Graduation Requirements: In 1996, seventeen
states were awarding high school diplomas only to students who had passed a minimum
competency exam. MCE graduation requirements were often established in response to a
popular perception that the state�s K-12 education system had failed. Generally speaking it has
been southern states and states with large urban populations that have established MCEs. In 1992
about 40 percent of the nation�s public school students lived in states that imposed a MCE
graduation requirement at public high schools.
MCEs raise standards, but not for everyone.8 The standards set by the teachers of honors
classes and advanced college prep classes are not changed by an MCE. Students in these classes
pass the MCE on the first try without special preparation. Typically high school transcripts report
only who has passed the MCE, not how far above the passing standard the student scored. The
higher standards are experienced by the students who are in the school�s least challenging courses.
Since the challenge level of courses is positively correlated with SES, we expect MCEs to have
bigger effects on low SES students than on high SES students.
School administrators will not want to be embarrassed by high failure rates, so they are
likely to focus additional energy and resources on raising standards in the early grades and
improving the instruction received by struggling students. In most states science, history and
civics/government are not covered by the MCE, so their impact on achievement in these subjects is
indirect. Presumably they raise achievement in reading, writing and mathematics and this then
helps students do better in history and science classes and on tests covering these subjects.
MCEs typically set a pretty low minimum standard. In 1996 only 4 of the 17 states with
MCEs targeted their graduation exams at a 10th grade proficiency level or higher. Failure rates for
students taking the test for the first time varied a great deal: from a high of 46% in Texas, 34 % in
8 Minimum competency exams are additions to, not a replacement for teacher imposed standards. In a MCE regime,teachers continue to control the standards and assign grades in their own courses. Students must still get passing gradesfrom their teachers to graduate. The MCE regime imposes an additional graduation requirement and thus cannot lowerstandards (Costrell 1998). The Graduate Equivalency Diploma (GED), by contrast, offers students the opportunity toshop around for an easier (for them) way to a high school graduation certificate. As a result, the GED option lowersoverall standards. This is reflected in the lower wages that GED recipients command. Stephen V. Cameron and JamesJ. Heckman, �The Nonequivalence of High School Equivalents� Working Paper # 3804 (Boston, Mass.: NationalBureau of Economic Research, 1991).
15
Virginia, 30% in Tennessee and 27% in New Jersey to a low of 7% for Mississippi. However,
since students can take the tests multiple times, eventual pass rates for the Class of 1995 were
much higher: 98% in Louisiana, Maryland, New York, North Carolina and Ohio; 96 % in Nevada
and New Jersey, 91% in Texas and 83% in Georgia. 9 Since the tests are designed to determine
who falls below a pretty low standard, they typically do not assess material that college bound
students study in 10th and 11th grade (e.g. Algebra II and geometry proofs). As a result, MCEs
should not be expected to influence learning during high school of students who did well in the
first eight years of school.
C�2: Voluntary End-of-Course Examinations�New York State Regents
Examinations in the Early 1990s: End-of-Course Exams (EOCEs) are different from MCEs in
that they typically assess more difficult material and are taken by students nearing the end of a
specific course or sequence of courses�eg Biology, French, American History or Calculus.10
Teachers are inevitably viewed as responsible, at least in part, for how well their class does on
the exam. EOCEs signal the student�s achievement level in the subject, not just whether the
student exceeds or falls below a specific cut point that all high school graduates are required to
surpass. All students in the class, not just those at the bottom of the class, have an incentive to
study hard to do well on the exam so an EOCE is more likely to improve classroom culture than
a MCE.11 The stakes tend to be different, as well. For voluntary EOCEs, the stakes are
typically getting an A rather than a B in a course or getting college credit for a high school
course. For MCEs, the stakes are getting a high school diploma. To summarize, compared to
MCEs, voluntary EOCEs have lower stakes but set higher standards and apply them pretty much
equally to all students in a particular class, though often not in all classes or for all students in a
school.
Regents Courses and Exams: Begun in the 1860s, New York State�s curriculum-based
Regents Examination System is the oldest American example of end�of-course examinations.
9 American Federation of Teachers, Making Standards Matter:1996 (Washington, DC: American Federation ofTeachers, 1996) p. 30.
10 End-of-course examination (EOCE) are similar to MCEs in the following ways. Both are set by and graded torubrics devised by a state government or a national organization (eg. The College Board) and both carryconsequences for students, the teachers and school administrators.
11 Costrell, Robert M. (1998) �Can Centralized Educational Standards Raise Welfare?� Journal of Public Economics,
16
Sherman Tinkelman, Assistant Commissioner for Examinations and Scholarships described the
system in a 1966 report:
The Regents examinations are closely related to the curriculum in New York State.They are, as you can see, inseparably intertwined..... These instruments presupposeand define standards.... They are a strong supervisory and instructional tool--anddeliberately so. They are effective in stimulating good teaching and good learningpractices.12
They are taken throughout one�s high school career. In 1990 a college bound student taking a full
schedule of Regents courses would typically take Regents exams in mathematics and earth science
at the end of 9th grade; mathematics, biology and global studies exams at the end of 10th grade;
mathematics, chemistry, American history, English and foreign language exams at the end of 11th
grade and a physics exam at the end of 12th grade. To accommodate summer school students and
courses ending in January, the exams are given three times a year.
These external exams have substantial effects on teachers. They often participate in the
grading of Regents exams written by students in their school, so they can see the kinds of
mistakes students are making and use that information to improve their coverage of the material
the following year. Essays are graded by more than one teacher. The exams also provide a
benchmark against which the teacher, her departmental colleagues and administrators may judge
teaching effectiveness. Publication of school level results puts administrators under pressure to
hire teachers who have deep knowledge of their subject and to introduce whole school reform
programs that upgrade instruction in the early grades.
For students the stakes attached to Regents exams were pretty low. Each district decides
whether Regents exam grades are to be a part of the course grade and how much weight to assign to
them. While almost all districts counted Regents exam results as a final exam grade, it is averaged
with quarterly grades so Regents exam scores seldom account for more than one-fifth of the
student�s final grade in a course. Eligibility for a �Regents� as opposed to a local diploma depended
on passing the Regents exams but the benefits of getting a �Regents� diploma were small. While
Regents exam grades appeared on high school transcripts, college admissions decisions depended
primarily on grades and SAT scores, not Regents exam scores or Regents diplomas.13 Many
students saw an advantage in taking easier �local� classes to enhance their GPAs.
12 Sherman N. Tinkelman, "Regents Examinations in New York State after 100 Years" (Albany, N.Y: The Universityof the State of New York, The State Education Department, 1966), p. 12.
13 John H. Bishop, "Nerd Harrassment and Grade Inflation: Are College Admissions Policies Partly Responsible?�Center for Advanced Human Resources Discussion Paper #99-14, (1999c).
17
Regents exams raise standards through a variety of mechanisms. First, in the classes in
which they are used, they push up teaching standards and help motivate students to study and to
cooperate with each other. Students are no longer competing for a limited number of As and Bs.
Now it is possible for everyone in the class to be recognized for excellence in the subject. Secondly,
Regents exam created a signal of competence that some colleges used in making admissions and
placement decisions and this increased the rewards for learning and makes them more visible and
immediate. Thirdly, the share of students taking the externally examined courses and the results of
those exams affect the community�s perception of the performance of the school district�s teachers
and administrators. Property values respond to these perceptions, so school boards have an
incentive to push for better teaching.
The power of these incentives depends, of course, on the share of students taking externally
examined courses. During the 1980s and early 1990s many students were not taking Regents
courses and exams. In 1992 the most popular exam, Course I Mathematics, was taken by 62
percent of students, the Global Studies exam was taken by 57 percent of students and the English
and Biology exams were taken by 50 percent of students. Only 38 percent of graduates earned
Regent�s diplomas signifying completion of a sequence of Regents courses in 1992/3.14 New York
State dealt with this problem by creating and expanding a system of Regents Competency Tests
(RCTs) in reading, writing, math, science, global studies and U.S. history that set a minimum
standard for those not taking Regents courses.
But, did minimum competency exams and increased academic course graduation
requirements cause students to learn more mathematics and science and to become better
readers?15 Are they more likely to go to and complete college? Did they get better jobs? Since
students from low SES backgrounds typically take fewer academic courses during high school, it
is reasonable to hypothesize that MCE and increased course graduation requirements will have
14 Participation rates are calculated by dividing the number of exams taken by the average enrollment per grade inhigh school. The New York State Education Department, �New York: The State of Learning�Statistical Profile ofPublic School Districts� (Albany, February, 1997).
15 Studies using detailed data from high school transcripts have demonstrated that students who take additionalacademic courses have bigger gains on academic tests than other students (Meyer ___, Bishop 1999, Bishop andMane 2005). This does not, however, guarantee that a policy that forces students to take additional academic courseswill generate similar increases in academic learning. Students who take a course voluntarily are likely to learn morethan students who would have preferred to take a different course or study hall instead. The students who are forcedto attend the class may disrupt the learning of others or force teachers to water down the curriculum.
18
bigger effects on disadvantaged students than on high SES students. Is this hypothesis correct?
These questions are addressed in the next section.
19
5. American Evidence on the Effects of Tougher Graduation Requirements: An
Analysis of NELS-88 data
5.1 Data
Our study makes use of micro data from the National Educational Longitudinal Study
(NELS-88), a longitudinal data set that followed a nationally representative sample of 8th graders
in 1988 through the year 1992. In addition, two post-high school follow-ups were conducted in
1994 (two years after scheduled graduation) and in 2000 (eight years after graduation).
Information used in this paper comes from the student, school and family questionnaires. We
studied the full sample of NELS-88 high school graduates, which comprises both graduates and
drop-outs and also students from public and private high schools.
We used the restricted data set that identifies the state in which the student�s high school
was located. This allows us to merge information on state policies and characteristics into the data
set. Four policy variables were defined characterizing graduation requirements.
The first variable measures the state government defined minimum number of academic
courses (English, math, science and social studies) required to get a regular high school diploma.
The second variable is the total number of credits the state required to get a high school diploma16.
We include separate measures of academic and total course requirements because they correlate
only .22 with each other and are likely to have different effects on learning, dropout rates and post
high school outcomes.
The third variable takes on a value of 1 for states with minimum competency exam
graduation requirements in 1992 (Alabama, Florida, Georgia, Hawaii, Louisiana, Maryland,
Mississippi, Nevada, New Mexico, New Jersey, North Carolina, South Carolina, Tennessee, and
Texas) and zero elsewhere17. Thirty-two percent of our sample lived in states that mandate the
MCE and set the graduation standard on the exam. Finally we capture the unique effect of New
York�s package of graduation requirements (including voluntary Regents exams) by defining a
variable that has a value of 1 if the student�s high school was in New York State and 0 elsewhere. 16 Many school districts choose to set higher requirements than the state minimum. States without state-wideminimum course graduation requirements were assigned a value of 13�the lowest minimum total Carnegie unitrequirement for the states with a requirement and a control variable was included in the models.17 When a student moved to another state between 10th and 12th grade an average of the MCE variables for 10th and12th grade was used. Then the MCE variable can have three values: 1, 0 or 0.5, this last representing moving outfrom or in to an MCE state. When information on the state was not available for 10th grade, residence in 12th grade
20
The final two policy variables are teacher salary level (using the salary paid to a first year full-time
teachers in thousands of dollars) and the pupil-teacher ratio at the school18.
Since the outcomes studied are primarily determined by the student�s background and
environment, we control for as many characteristics of the community and the student as
possible in order to increase efficiency and reduce omitted variable bias. Our estimations include
controls for grade point average in 8th grade, an average of 8th grade test scores in English,
mathematics, science and social studies, family socio-economic status and other characteristics
of the student in 8th grade. These included whether the student took remedial courses in 8th grade
or earlier, whether she has taken advanced courses, has a computer at home, TV and homework
hours, reading for pleasure, an indicator for being handicapped, socio-economic status of the
student�s family, logarithm of the number of books in the home, parent involvement index,
family size, marital and parental status in 8th grade, locus of control index, self esteem index and
hours working for pay during 8th grade (and it�s square), an index for smoking in 8th grade,
dummies for race, ethnicity and religion and rural, suburban and urban residence and ten
indicators describing the character and quality of the high school. From the principal�s
questionnaire we took the following indicators of quality of the student�s secondary school:
average teacher salary, the pupil-teacher ratio, percent free lunch, percent students that were
white, school is a vocational high school, percentage of the school�s full-time faculty who are
vocational educators and average enrollment per high school grade (and it�s square). Two other
measures of the quality of the school attended in 10th grade�the average socio-economic status
and 8th grade test scores of students at the school�were calculated by averaging student
responses for each high school in the NELS:88 data base. Controls for characteristics of the regional labor market (SMSA or state) included the
unemployment rate, mean weekly wage in retailing and manufacturing, ratio of the high school
graduate earnings to the high school dropout earnings in 1989, ratio of college graduate earnings
to high school graduate earnings in 1989, ratio of tuition at four year public colleges to the
weekly earnings in retailing and dummies for 4 Census regions.
We are aware that the controls for student, school and labor market characteristics may not
be sufficient to avoid omitted variable bias. States with high course graduation requirements or
with minimum competency exams may be different along unmeasured dimensions that have direct was used and if that was missing as well, 8th grade residence was used. None of the states changed their policiesduring the 1990 to 1992 time period.
21
effects on graduation rates, college attendance and wage levels. A positive selection bias is
unlikely, however, because most states appear to have adopted MCEs and higher course graduation
requirements as a response to a perception that the state�s schools were failing to teach basic skills.
By 1992 MCEs had been adopted by every southern state except Arkansas and Oklahoma. With
the exception of New Mexico, none of the Mountain, Plains or Midwestern states had established a
MCE prior to 1992 (US Department of Education, 1993). All our estimates report Huber-White
robust standard errors that account for the clustering of students within schools and deals with
the problem of the correlation of errors generated by the cluster-based sampling frame.
5.2 Empirical evidence of the effects of graduation requirements: Dropout rates and completion of
high school
Conventional wisdom predicts that higher graduation standards will increase dropout rates,
postpone the graduation of some and prevent the graduation of others and that these effects will be
particularly severe for low SES students (Lillard and DeCicca, 2001). More students, it is
predicted, will also be induced to get a Graduate Equivalency Diploma instead and suffer an
income decline as a result (Kang, 1985; Costrell, 1994). The prediction of economic theory is
unambiguous, however, only when the rewards for getting a diploma and for effective teaching are
unaffected by establishing higher standards. Since MCEs can improve learning and the
information content of the diploma signal, the payoff to getting a diploma and to academic
achievement may increase. The publicity that inevitably attends the publication of school results
on tests will make teachers and administrators more accountable for the achievement of at-risk
students. If the returns to greater student effort and to increased focus on teaching at-risk students
induced by the higher standards do not diminish too rapidly, learning might improve enough to
prevent a decline in graduation rates where MCEs have been established. Nevertheless, the policy
debate is dominated by concerns that higher standards will increase dropout rates, delay some
graduations and prevent others and induce still others to get GEDs, so these are the hypotheses that
will be tested.
Models were estimated predicting whether the student dropout at any time during high
school, whether the student gets her diploma late (in June 1992 when graduation is scheduled) and
18 Both variables come directly from the High School principal questionnaire.

22
whether the student fails to get either a GED or a high school diploma by February of 1994 and also
by June 2000. The estimated model was:
ii14i13i12
i11 i10 i98
i7i6i5i4i3i2i1ii
µPupTchR)(SESβTCHWAGE)(SESβNY)(SESβTOTAL)(SESβACAD)(SESβMCE)(SESβ PupTchRβTCHWAGEβNYβTOTALβACADβMCEβSESβXβαY
+×+×+×+×+×+×+++++++++=
where Yi is a battery of dependent variables for individual i, Xi is a vector of control variables and
MCE, ACAD, TOTAL, NY, TCHWAGE and PupTchR are the policy variables.
SES is a continuous variable measuring the student�s family socio-economic status. We are
particularly interested in the effects of these policies on equality of opportunity, so interactions
were formed between each policy indicator and the socioeconomic status of the student�s parents.19
Interactions were defined by deviating SES and the continuous policy variables from zero and the
forming their product. This insures that the main effect coefficients on the policy variables [β3, β4,
β5, β6, β7, β8] represent both the average effect of the policy and its impact on students at the mid
point of the SES distribution. We also combined interaction and main effects coefficients for each
policy to get separate estimates of the effects of policies on low SES students and high SES
students. We then conducted three hypothesis tests about the impacts of each policy on students at
the mid point of the SES distribution, one standard deviation (SD) above the midpoint and one SD
below the mid point. These tests will allow us to comment on the whether a policy helps one
group more than another.
Results are presented in Table 3.20 Students living in MCE states were NOT more likely
to drop out and NOT more likely to fail to get a diploma or a GED by 1994 or by 2000. SES
interactions were not statistically significant for these completion outcomes. Students living in
MCE states were, however, more likely to experience delays in getting a regular diploma and
also more likely to get a GED rather than the standard diploma. Contrary to our hypothesis,
these two effects became larger as the student�s SES increased. Indeed, effects were so small
for low SES students that we were not able to reject the hypothesis that MCEs had no effect on
GED and delayed graduations of low SES students.
Students living in New York State were significantly more likely to dropout, more likely
to take extra time to get the diploma and more likely to get a GED rather than a regular high
19 We used a composite created by NELS staff from family income and parent�s education and occupation.20 The approximate effect of Xi (at the mean of the dependent variable) on the probability of the event consideredcan be obtained by multiplying βi times P(1-P).

23
school diploma by year 2000. However, they were not significantly less likely to complete high
school by 1994 or 2000 (eg. to get either a diploma or a GED). None of the SES interactions
were significant.
Students living in states with higher elective and non-academic course graduation
requirements were not more likely to drop out of high school. On the other hand, low SES
students (but not middle and high SES students) were significantly more likely to get their
diploma late and to get a GED. We found some weak support for the hypothesis that academic
course graduation requirements have bigger effects on dropout and non-completion rates than
increased elective requirements. Academic course requirements had positive coefficients in all
five models and the effect was significant for �No diploma or GED by 1994� and significant for
the dropout rates of high SES students.
The school resources variables--teacher salaries and pupil teacher ratios--had no effect on
dropout rates or overall completion rates. Teacher salaries were, however, significantly related
to lower probabilities of getting a GED diploma and for high SES students to lower probabilities
of delays in getting a diploma.
5.3 Learning and effort during high school
Table 4 presents models in which we predict test score gains between 8th and 12th grade,
hours of homework per week and self perceived working hard. The number of study halls in a
students schedule is the primary determinant of time spent doing homework at school. Time
spent doing homework at home is probably a better measure of teacher demands and student
effort than homework done at school. Students who dropped out of high school were given the
tests along with those who remained in school so the reduced learning that results from some
students dropping out of school is taken into account. The control variables used here are with one
exception the same as those used in predicting dropping out.21 In order to prevent the error in
measuring true 8th grade achievement from biasing the results, the lagged value of the composite
test did not appear on the right hand side of the regression predicting the gain on the composite
from 8th to 12th grade.
21 The data set and specification employed in this paper is similar to Bishop et al. (2001) �The Role of End-of-Course Exams and Minimum Competency Exams in Standards-Based Reforms.� Brookings Papers on EducationPolicy, edited by Diane Ravitch, (Washington, DC: The Brookings Institution), 267-345. The results are alsosimilar.
24
Our most important finding is that academic course requirements have significant positive
effects on learning. Students in states requiring four extra academic courses to graduate learned
.37 grade level equivalents more in the four core academic subjects [(4*.18)/(.25*7.86)] than
comparable students in other states. Increased elective and non-academic course requirements, by
contrast, had no effect on learning core academic subjects. MCEs also had no effect on learning.
Students living in MCE states reported that they worked harder but that they did less homework in
school.
Our third finding is that end-of-course exams combined with MCEs�or something else in
the New York State policy mix�appears to have had large significant effects on learning during
high school. The New York effect was slightly more than one-half a grade level equivalent. This
occurred despite the fact that dropout rates are higher in New York than in most other states and
dropouts learn considerably less than students who stay in school. NELS:88 students who had
dropped out of school were tested in 1992 along with everyone else. Those who stayed in school
learned enough extra to counterbalance the negative effects of New York�s higher dropout rate.
Reductions in the pupil-teacher ratio are associated with a statistically significant increase
in learning during high school. The regression predicts that reducing the number of pupils per
teacher by four (a one standard deviation change in the variable) will increase learning over the
four year period by about 12 percent of a GLE. This 3 percent increase in the rate of learning
seems to be a rather modest when one considers that the policy requires a 25 percent increase in
the number of teachers at the school (probably implying a 10+ percent increase in costs per
student).
5.4 College attendance and completion
If tougher high school graduation requirements raise the achievement of high school
graduates, as intended, they should increase the proportion of high school graduates going to
college. Analyzing HSB data, Bishop and Mane (1999) found that high school graduates coming
from high schools with an MCE graduation requirement [as reported by the principal] were
significantly more likely to be in college during the four-year period immediately following high
school graduation. Effects were largest for students in the middle and bottom of the test score
distribution and tended to be greater in the 2nd and 3rd years out than in the 1st, 4th and subsequent
years out. Opponents of tougher graduation requirements concede this point but argue that it may
25
be accomplished by reducing the number of high school graduates not by increasing the numbers
attending and completing college.
To avoid this problem we need to study the proportion of 8th graders who subsequently go
to college not the proportion of high school graduates who go to college. Opponents of tougher
graduation requirements predict that the reductions in high school graduation rates they expect to
result will then lower the proportion of 8th graders with low GPAs who eventually attend college.
Proponents of MCEs disagree. They argue that MCE tests assess very basic skills and that students
who cannot, after many tries, pass such tests are not prepared for college level work. Open door
institutions will admit them, but they will need extensive remedial course work and are unlikely to
complete any course of study. It is better, they argue, for high schools to hold all students to
higher standards and that poorly prepared students be told of their deficiencies early in high school
when there is time to do something about it. The result, they argue, will be an increase in the
number of high school graduates who have the skills and knowledge necessary to succeed and
thrive in college. They, therefore, would predict that, even when tougher graduation requirements
delay or prevent some from graduating from high school, the proportion of 8th graders who enter
college on schedule in fall 1992 will not decline and a year or so later college enrollment rates will
be higher. The positive effect of higher expectations in high school on college enrollment rates is
delayed because college retention rates rise and because some enter college one year later due to
delays in completing high school.
Using longitudinal data on students who were in 8th grade in the spring of 1988, logistic
regressions were estimated predicting college enrollment in the fall of 1992 and the spring of
1994 and completion with an Associates or Bachelors degree or better by the year 2000. The
model specifications were the same as those used in the dropout and high school completion
models.22 The results are presented in table 5.
Academic course requirements had no significant effects on college attendance or college
completion. Increases in the total number of courses required to graduate (holding academic
course requirements constant) significantly lowered college attendance rates in spring of 1994.
This negative effect was significantly larger for low SES students. A four credit increase in
elective and non-academic course graduation requirements is predicted to reduce college
22 There were two exceptions to the generalization of identical sets of control variables. The state unemploymentrates and weekly earnings in retailing were updated to 1992 and 1993. The payoff to completing high school wasnot included in the model.
26
enrollment of low SES students by 3.3 percentage points in fall 1992 and by 4.2 percentage
points in spring 1994. These enrollment effects seem to be transitory because neither policy had
significant impacts on the probability of getting college degrees by the year 2000.
MCEs had significant positive effects on college attendance, but only in the sixth year after
8th grade not the fifth year. Students in MCE states had rates of college attendance that were
about 4 percentage points higher in 1994. The positive effect was larger for students from high
SES backgrounds. MCEs had no effect on 1994 college attendance rates of low SES students.
Again these enrollment effects seem to be temporary because attending high school in a MCE
state has no effect on the likelihood of getting college degrees. Attending school in New York
had positive effects on college attendance rates of low SES students in fall 1992. Completion
rates, on the other hand, are lower in New York particularly for high SES students.
Of the six policies reviewed, teacher salary had the most consistent and statistically
significant impact on college attendance and completion. A 15 percent (one standard deviation)
increase in teacher salary raises college attendance rates by 1.8 percentage points and college
completion rates by 2.5 percentage points. The 1992 enrollment effect is 3.3 percentage points
for low SES students. No other SES interactions were significant. Pupil-teacher ratio has
significant effects on college completion but not on enrolment rates. A 25 percent decrease in
the pupil-teacher ratio is associated with a 1.5 percentage point increase in the proportion getting
a Bachelors degree and a 2 point increase in the probability of getting an associates degree or
better.
5.5 Labor market outcomes
Policy makers have justified increased graduation requirements as necessary to prepare
young people to compete in the world economy. MCEs and tougher course graduation
requirements are hypothesized to could improve job opportunities in two ways. First, if they
improve student achievement, they raise worker productivity.23 Even when this does not
23 Brenner, �High school data to predict work performance,� pp. 29-30. [2d reference; see n. 17]Dept. of Labor, �General Aptitude Test Battery Manual.� [2d reference; see n. 17]Hunter and others, �Validity of ASVAB for job performance.� [2d reference; see n. 17]Hartigan and Wigdor, Fairness in Employment Testing. [2d reference; see n. 17]Bishop, �Impact of Academic Competencies,� pp. 127-194. [3d reference; see n. 16]
27
immediately raise workers� earnings, the effect of academic achievement on wages grows with time
and eventually becomes very large24.
The second way MCEs and higher course graduation requirements could improve job
opportunities is by sending a signal to employers that �ALL the graduates of this high school meet
or exceed your hiring standards.� The fact that they have taken a core curriculum and passed the
MCE is the proof. In most communities, competencies developed in the local high school are
poorly signaled to employers. The lack of signals of achievement in high school tends to make
employers with the best jobs reluctant to risk hiring recent high school graduates. Indeed they often
carry in their head very negative stereotypes regarding recent high school graduates. A black
personnel director interviewed for a CBS special on educational reform proudly stated, "We don"t
hire high school graduates any more, we need skilled workers."25 They prefer, instead, to hire
workers with many years of work experience because the applicant's work record serves as a signal
of competence and reliability that helps them identify the most qualified.
Raising course graduation requirements and/or instituting graduation tests, therefore, are
strategies some states have pursued to attract high wage employers and help recent graduates
compete for good jobs. Local Chambers of Commerce have lobbied state government to set higher
graduation standards. When tougher standards were instituted, one would expect local employers to
be aware of the change. Diplomas now signal that the student took a core academic curriculum and
met or exceeded certain minimum standards in core subjects. Because of pooling, all high school
graduates should benefit. Students previously stigmatized by race or social background should
benefit most of all.
Previous studies have found that MCEs raise earnings immediately after high school.26
Have these policies indeed improved the labor market outcomes for recent high school graduates?
24 Taubman and Wales, �Education as an investment,� pp. 95-122. [2d reference; see n. 18]Bishop, �Impact of Academic Competencies,� pp. 127-194. [4d reference; see n. 16]Farber and Gibbons, �Learning and Wage Dynamics,� pp. 1007-47. [2d reference; see n. 18]Altonji and Pierret, �Employer Learning and Stat. Disc.� pp. 1-55. [2d reference; see n. 19]
25 CBS, (1990, September 6) �America�s toughest assignments: solving the education crisis.� New York.
26 Analyzing High School and Beyond data and controlling for college attendance and a host of other variables,Bishop, Moriarty and Mane (1998) found that females graduating from high schools with a minimum competencyexam graduation requirement [student report] earned more than women graduating from schools without an MCE.Concern about the accuracy of student reports of the existence of a MCE at their high school led Bishop and Mane(1999) to reanalyze HSB data using principal reports of the existence of a MCE graduation requirement. They foundeven larger effects. Principal reports of a MCE graduation requirement had positive effects (significant in some butnot all years) on wage rates of male and female graduates and on the earnings of graduates four and five years after
28
To answer this question we estimated models predicting labor market outcomes in 1993-4 and
2000. The early indicators were total number of months worked during the 21 month period from
July 1992 to March 1994, hourly wage rate (logged) and earnings in calendar year 1993. The
three indicators of medium term labor market success were: annual earnings of the job occupied
during the first quarter of the year 2000, the hours worked per week in that job and the hourly wage
rate of that job. Wage rates are not defined for respondents who did not report a job sometime
during 1993-94 or 2000. The other variables treated those who reported no work during the
reference period as a zero (the variable was missing if the individual reported work but did not
report earnings or hours worked).
Since attending college reduces the time available for work, we included an extensive set of
controls for current and past college attendance: the number of semesters of full-time college
attendance during the period from fall 1992 to Spring 1994, number of semesters of part-time
college attendance during that same period, the number semesters attending a two year institution
full-time and the number of semesters of part-time attendance at a two year institution. We also
included controls for �Attending college full time in the first quarter of 2000�, �Attending college
part time in the first quarter of 2000,� �Ever dropped out of high school,� �Obtained a GED,�
�graduated early� and, for late graduates, �the length of the delay in graduation.� In the models
predicting medium term outcomes, we included dummy variables for some college, for �ever
attended a 4 year college�, for earning a vocational certificate, for an associate degree, a bachelors
degree, a masters degrees and graduate or professional degrees. Family structure in 2000 was
controlled by four indicator variables: married male, married female, male with children and
female with children.
Our analyses of the effects of graduation requirements on early labor market outcomes are
presented in Table 6. Increases in the number of elective courses to graduate did not have positive
effects on any labor market indicator. Quite the reverse. Increased elective course requirements
significantly lowered wage rates and earnings both in 1994 and in 2000. The negative effects for
year 2000 are larger for high SES students and essentially zero for low SES students. Academic
course requirements were significantly related to higher wage rates in 1994 and 2000 and to higher
earnings in 2000. This effect did not vary significantly by SES. Being required to take extra
academic courses had a significantly more positive effect on wage rates than elective course graduation. The wage rate effects of MCE�s appeared to be larger for students in the bottom three quarters of the testscore distribution.
29
requirements. This implies that if total graduation requirements are fixed, increasing academic
requirements will increase wage rates by roughly one percentage point for each one credit increase
in academic course requirements. However, when an increase in academic course requirements is
associated with an equal increase in total course requirements, wages and earnings remain
essentially unchanged.
Minimum competency exams, by contrast, had large and significant effects on many of the
labor market indicators. Those who attended high school in MCE states earned 11 percent ($548.)
more in 1993 and 4.2 percent ($1103.) more in 2000. Wage rates were also a significant 2.6
percent higher in 2000. SES interactions are very interesting. Consistent with our hypothesis,
MCE effects were significantly more positive for low SES students in 1993. Contrary to our
hypothesis, this pattern reversed six years later. In 2000, our estimates of the MCE effect is $2375
for high SES graduates and essentially zero for low SES graduates. The confidence intervals for
the coefficients characterizing the effect of attending school in New York are very wide, so nothing
is statistically significant. However, for the year 2000, the coefficients on the NY dummy are very
similar to the coefficients on the MCE dummy including the positive interaction.
Pupil-teacher ratios did not have significant effects on wage rates or earnings. Teacher
salary was negatively related to time spent working in both 1993 and 2000. It was also positively
related to year 2000 wage rates of middle SES and high SES students but not for low SES students.
6. Summary and Policy Implications
The purpose of this paper has been to measure the effects of increased academic
standards on both average achievement levels and on equality of opportunity. The five policies
evaluated were: (1) universal Curriculum-Based External Exit Exam Systems, (2) voluntary
curriculum-based external exit exam systems with partial coverage such as New York State
Regents exams in 1992, (3) state minimum competency graduation tests, (4) state defined
minimums for the total number of courses students must take and pass to get a high school
diploma and (5) state defined minimums for the number of academic courses necessary to get a
diploma. We also measured the effects of school-to-school variations in teacher salaries and
student-teacher ratios for comparison purposes. Since universal curriculum-based external exams
had not been implemented in the U.S. prior to 1992, international data was analyzed to evaluate
30
the effects of CBEEES. High school graduation standards differ a lot across states in the U.S. This
allowed us to measure policy effects on student achievement and labor market success after high
school by comparing states in a multiple regression framework.
In Table 7 we summarize our main findings for test scores, high school attendance and
completion, college attendance and completion and success in the labor market. In the odd
numbered columns we present our estimates of the mean percentage change in each of our eight
outcomes that the regressions predict would be generated by introducing a discrete reform (such
as an MCE or a CBEEES) or by a large (4 credit) increase in the number of courses (academic or
total) required to get a regular diploma. For comparison purposes we also calculate and present
the predicted effects of increasing teacher wages by 30 percent (or two standard deviations) and
decreasing student teacher ratios by 40 percent (eight fewer students per teacher).
In the even numbered columns of the table we present estimates of the effect of each
policy on the size of the GAP between the outcomes of high SES and low SES students. High
status is defined as a SES index that is one standard deviation (.8 units) above the mean. Low
status is one SD below the mean, so the change from low to high is 1.6 units on the SES scale.
Thus a 4 credit increase in academic requirements reduces the size of the test score gap between
high and low SES students by [4*(-.113)*1.6/(1.965)] or -.37 GLE. Since all outcome variables
are scaled so that more is better, a negative number implies that differentials between the
achievements of high and low SES students are diminished by the policy or alternatively that
equality of opportunity is improved. A positive number implies the policy has a more positive
effect on high SES students than low SES students.
Earlier in the paper, we hypothesized that higher minimum course graduation
requirements, MCEs and universal CBEEES (but not voluntary end-of-course exams) would
increase resources and standards in schools serving low SES neighborhoods and induce low SES
students to devote more time to learning core academic subjects. Political leaders pressing for
higher standards and better funding often claim their proposal will not only increase everyone�s
achievement but reduce achievement gaps as well. Only two of the policies examined deliver on
this compound promise: universal CBEEES and higher academic course graduation
requirements. Students facing universal CBEEES have higher upper-secondary graduation rates
and learn substantially more--1.2 GLE extra--and achievement gaps are reduced by 40 percent of
a grade-level equivalent. Implementing universal CBEEES in the U.S. is predicted to reduce the
current 2.5 GLE differential between high and low SES students by 16 percent. A four-credit
31
increase in academic course graduation requirements is predicted to increase average
achievement by .37 GLEs and to reduce the achievement gap by a similar amount. It also
appears to have boosted wages and earnings in 2000 and reduced SES differentials in college
attendance (but not in college completion).
Other policies were less successful in raising achievement and enhancing equality of
opportunity. Increases in state minimum total course graduation requirements did not have
positive effects on any of the outcomes studied. Students from states that required an additional
4 courses to graduate did not learn more, were 4 percent less likely to attend college and earned 3
percent less both immediately after high school and seven years later. This suggests that states
should reduce total course requirements, even while they increase academic course requirements.
State minimum competency exam graduation requirements had no significant
relationship with mean rates of learning or achievement gaps but were associated with higher
rates of college attendance and larger college attendance differentials by SES. The good news is
that all types of students in MCE states earned a good deal more. Middle SES students in MCE
states earned 11 percent more in 1993 and 4.2 percent more in 2000. The short term earnings
benefits of MCEs were significantly larger for low SES students. The medium term benefits of
MCEs, however, were significantly smaller for low SES students.
New York�s hybrid voluntary end-of-course exam/ compulsory minimum competency
exam system of had a large (.55 GLE) impact on test score gains during high school. Since 8th
grade achievement levels were also higher, New York students were about one GLE ahead of
students in other states by the end of high school. None of the SES interactions were statistically
significant. Because the small size of the sample of students from New York in NELS-88,
statistical tests for a New York State effect lack power. Point estimates suggest that while high
school and college graduation rates are not changed much, wages and earnings are higher 8 years
after high school graduation.
Traditional spending-oriented policy recommendations like smaller class sizes and higher
teacher salaries had statistically significant effects on college attendance and completion rates
but no effect on high school attendance or completion or on earnings after high school (holding
educational attainment constant). A 40 percent reduction in the student-teacher ratio increased
learning during high school by roughly a quarter of a grade level equivalent and 4 year college
completion by 10 percent. A 30 percent increase in teacher salary is associated with a 13 percent
increase in 2 or 4 year college completion and a 10 percent increase in BAs awarded. The
32
earnings and productivity benefits of a 4 year college education have a present discounted value
exceeding $600,000 at a 4% real discount rate. Thus the social benefits of the stimulus to
college completion resulting from these traditional spending oriented policy instruments would
be about $24,000 per high school student (assuming our estimates reflect causal effects).
Spending per high school student would need to rise by 20 percent, so costs are high as well.
Nevertheless the four year cost�about $6000 per student�is a good deal smaller than the
benefits. Standards oriented policy proposals are much less costly and seem to produce even
larger benefits. Consequently it seems inevitable that politicians will focus their energies on
refining and adding to their accountability oriented policy initiatives.
33
Bibliography
Association of Secondary Teachers of Ireland (1990). Information Sheet opposing changes in ExaminationSystems.
Ballou, Dale and Michael Podgursky, (1999) �Teacher Training and Licensure: A Layman�s Guide,�Better Teachers, Better Schools, Washington DC: The Fordham Foundation, 31-81.
Becker, William and Sherwin Rosen. (1992) �The Learning Effect of Assessment and Evaluation in HighSchool.� Economics of Education Review, Vol 11, # 2, pp.107-118.
Betts, Julian, (1998) �The Impact of Educational Standards on the Level and Distribution of Earnings.�American Economic Review, vol. 88, no. 1, 266-275.
Betts, Julian and Robert Costrell. (2001) �Incentives and Equity under Standards-Based Reform �Brookings Papers on Education Policy, edited by Diane Ravitch, (Washington, DC: TheBrookings Institution), 9-74.
Bishop, John H.. (1996) "The Impact of Curriculum-Based External Examinations on School Priorities andStudent Learning." International Journal of Education Research. , Vol 23, No. 8.
Bishop, John H. (1997). �The Impact of Curriculum Based External Exit Exams on StudentAchievement�, Journal of Economic Education, Vol 29, # 2, 171-182.
Bishop, John H. (1999a). �Are National Exit Examinations Important For Educational Efficiency?�Swedish Economic Policy Review, Vol. 6, #2, 349-401.
Bishop, John H (1999b) "Nerd Harassment, Incentives, School Priorities and Learning." Earning andLearning: How Schools Matter, eds Susan Mayer and Paul Peterson, (Washington, DC:Brookings Institution Press) 231-80.
Bishop, John H (2003). �What is the Appropriate Role of Student Achievement Standards,� Educationin the 21st Century: Meeting the Challenge of a Changing World, ed. Yolanda Kodrzycki, Boston,MA: Federal Reserve Bank of Boston.
Bishop, John H �School Choice and Diploma Exams,� (2002) Empirical Issues in Canadian Education,Patrice de Broucker and Arthur Sweetman eds. (McGill-Queen's University Press for the JohnDeutsch Institute at Queen's University)
Bishop, John H.; Ferran Mane, Michael Bishop and Joan Moriarty, (2001) �The Role of End-of-CourseExams and Minimum Competency Exams in Standards-Based Reforms� Brookings Papers onEducation Policy, 267-345.
Bishop, John H.., Joan Moriarty and Ferran Mane, (2000). �Diplomas for Learning: not Seat Time,�Economics of Education Review. 19 (3), 333-349.
Bishop, John H and Ferran Mane (2004a). �The Impacts of Career-Technical Education on High SchoolLabor Market Success.� Economics of Education Review. 23 (3), 381-402.
Bishop, John H and Ferran Mane (2004b). �Raising Academic Standards and Vocational Concentrators:Are they Better off or Worse off?�, forthcoming in Education Economics..
Carnoy, Martin and Susanna Loeb �Does External Accountability Affect Student Outcomes?�Educational Evaluation and Policy Analysis Vol. 24, # 4, 2003.
Costrell, Robert. (1994) "A Simple Model of Educational Standards,� American Economic Review, vol. 84,no. 4, pp. 956-971.
Costrell, Robert M. (1997) �Can Centralized Educational Standards Raise Welfare?� Journal of PublicEconomics, Vol. 65, 271-293.
34
Figlio, David and Maurice Lucas. (2001) �Do High Grading Standards Affect Student Performance.� Univ.of Florida, 1-38.
Hanushek Eric A. (1997) Assessing the effects of School Resources on Student Performance: AnUpdate.� Educational Evaluation and Policy Analysis, 19(2): 141-164.
Hart (Peter D.) Research Associates, (1995) "Valuable Views: A public opinion research report on the viewsof AFT teachers on professional issues." Washington D.C.: American Federation of Teachers, 1995,1-24.
Hedges, Larry V., Richard Laine and Rob Greenwald. (1994) �Does Money Matter? A Meta-Analysis ofStudies of Differential School Inputs on Student Outcomes.� Education Researcher, 23(3),(April) :5-14.
Kang, Suk. (1985). "A Formal Model of School Reward Systems." in Incentives, Learning andEmployability, edited by John Bishop, Columbus Ohio: National Center for Research in VocationalEducation.
Kruger, Alan. (2000) �An Economist�s View of Class Size Research.� Paper presented at Conferencetitled �What do we Know about How to Make Small Classes Work?� Washington, DC.
Lemke, M. et al. (2001) Outcomes of Learning: Results From the 2000 Program for International StudentAssessment of 15-Year-Olds in Reading, Mathematics, and Science Literacy. Washington, DC:National Center for Educational Statistics.
Lillard, Dean and Phillip DeCicca (2001), �Higher Standards, More Dropouts? Evidence within and acrossTime�, Economics of Education Review, 8 (2), 133-148..
National Center for Educational Statistics (1992). The Digest of Education Statistics: 1992. Wash. D.C.: USDepartment of Education.
National Center for Educational Statistics (1993). The Condition of Education: 1993. Vol. 1, Wash. D.C.: USDepartment of Education.
Organization of Economic Cooperation and Development, Education at a Glance 2001, CERI, OECD, 1-406.
Organization of Economic Co-operation and Development. Literacy Skills for the World of Tomorrow:Further Results from PISA 2000. Paris, France: Organization for Economic Co-operation andDevelopment, 2003.
Wößmann, Ludger (2000). �Schooling Resources, Educational Institutions, and Student Performance: TheInternational Evidence,� Kiel Working Paper No. 983, Kiel Institute of World Economics,Germany, <http://www.uni-kiel.de/ifw/pub/kap/2000/kap983.htm> 1-88.
Wößmann, Ludger (2002). �How Central Exams Affect Educational Achievement: International Evidencefrom TIMSS and TIMSS-Repeat.� Paper presented at conference on: Taking Account ofAccountability: Assessing Politics and Policy. Kennedy School, 1-62.
Wößmann, Ludger. �Central Exams as the "Currency" of School Systems: International Evidence on theComplementarity of School Autonomy and Central Exams.� DICE Report - Journal forInstitutional Comparisons 1 (4): 46-56, 2003.
Wößmann, Ludger. �The Complementarity of Central Exams and School Autonomy: Theory andInternational Evidence.� Conference on �Institutional Models in Education.� in Frascati Italy, May2004.
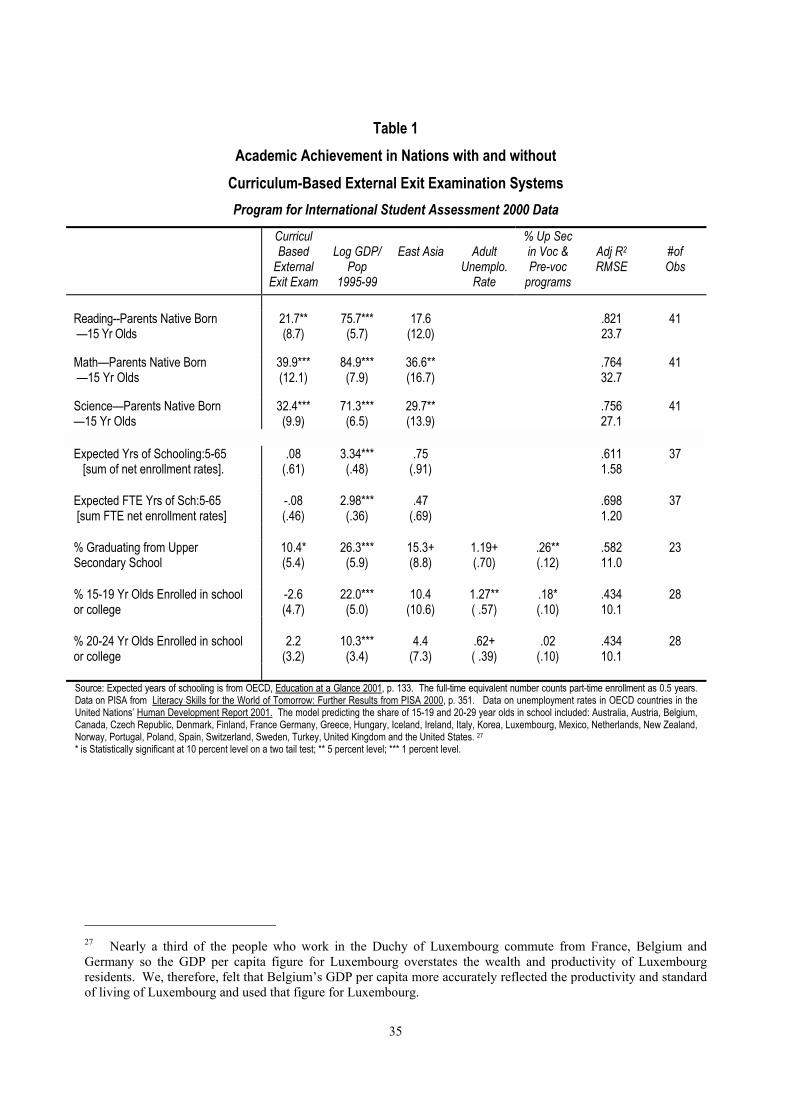
35
Table 1Academic Achievement in Nations with and without
Curriculum-Based External Exit Examination SystemsProgram for International Student Assessment 2000 Data
CurriculBased
ExternalExit Exam
Log GDP/Pop
1995-99
East Asia AdultUnemplo.
Rate
% Up Secin Voc &Pre-voc
programs
Adj R2
RMSE#ofObs
Reading--Parents Native Born �15 Yr Olds
21.7**(8.7)
75.7***(5.7)
17.6(12.0)
.82123.7
41
Math�Parents Native Born �15 Yr Olds
39.9***(12.1)
84.9***(7.9)
36.6**(16.7)
.76432.7
41
Science�Parents Native Born�15 Yr Olds
32.4***(9.9)
71.3***(6.5)
29.7**(13.9)
.75627.1
41
Expected Yrs of Schooling:5-65 [sum of net enrollment rates].
.08(.61)
3.34***(.48)
.75(.91)
.6111.58
37
Expected FTE Yrs of Sch:5-65 [sum FTE net enrollment rates]
-.08(.46)
2.98***(.36)
.47(.69)
.6981.20
37
% Graduating from UpperSecondary School
10.4*(5.4)
26.3***(5.9)
15.3+(8.8)
1.19+(.70)
.26**(.12)
.58211.0
23
% 15-19 Yr Olds Enrolled in schoolor college
-2.6(4.7)
22.0***(5.0)
10.4(10.6)
1.27**( .57)
.18*(.10)
.43410.1
28
% 20-24 Yr Olds Enrolled in schoolor college
2.2(3.2)
10.3***(3.4)
4.4(7.3)
.62+( .39)
.02(.10)
.43410.1
28
Source: Expected years of schooling is from OECD, Education at a Glance 2001, p. 133. The full-time equivalent number counts part-time enrollment as 0.5 years.Data on PISA from Literacy Skills for the World of Tomorrow: Further Results from PISA 2000, p. 351. Data on unemployment rates in OECD countries in theUnited Nations� Human Development Report 2001. The model predicting the share of 15-19 and 20-29 year olds in school included: Australia, Austria, Belgium,Canada, Czech Republic, Denmark, Finland, France Germany, Greece, Hungary, Iceland, Ireland, Italy, Korea, Luxembourg, Mexico, Netherlands, New Zealand,Norway, Portugal, Poland, Spain, Switzerland, Sweden, Turkey, United Kingdom and the United States. 27
* is Statistically significant at 10 percent level on a two tail test; ** 5 percent level; *** 1 percent level.
27 Nearly a third of the people who work in the Duchy of Luxembourg commute from France, Belgium andGermany so the GDP per capita figure for Luxembourg overstates the wealth and productivity of Luxembourgresidents. We, therefore, felt that Belgium�s GDP per capita more accurately reflected the productivity and standardof living of Luxembourg and used that figure for Luxembourg.
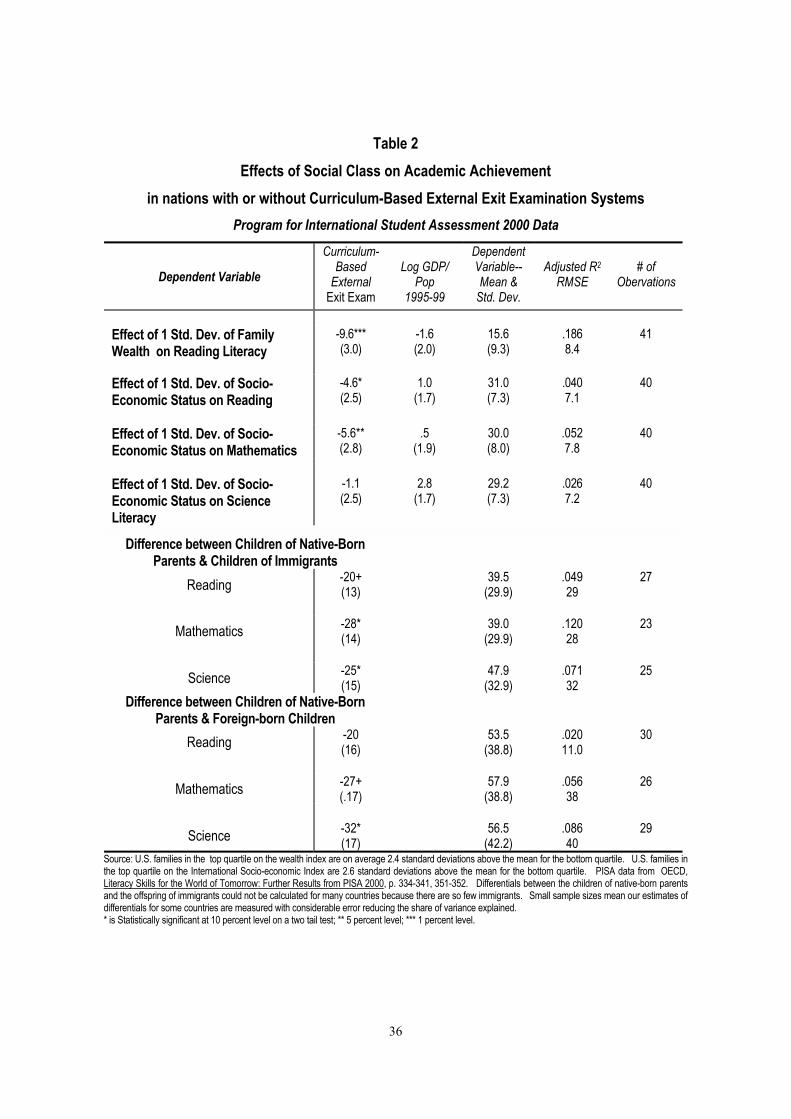
36
Table 2Effects of Social Class on Academic Achievement
in nations with or without Curriculum-Based External Exit Examination SystemsProgram for International Student Assessment 2000 Data
Dependent Variable
Curriculum-Based
ExternalExit Exam
Log GDP/Pop
1995-99
DependentVariable--Mean &
Std. Dev.
Adjusted R2
RMSE# of
Obervations
Effect of 1 Std. Dev. of FamilyWealth on Reading Literacy
-9.6***(3.0)
-1.6(2.0)
15.6(9.3)
.1868.4
41
Effect of 1 Std. Dev. of Socio-Economic Status on Reading
-4.6*(2.5)
1.0(1.7)
31.0(7.3)
.0407.1
40
Effect of 1 Std. Dev. of Socio-Economic Status on Mathematics
-5.6**(2.8)
.5(1.9)
30.0(8.0)
.0527.8
40
Effect of 1 Std. Dev. of Socio-Economic Status on ScienceLiteracy
-1.1(2.5)
2.8(1.7)
29.2(7.3)
.0267.2
40
Difference between Children of Native-BornParents & Children of Immigrants
Reading -20+(13)
39.5(29.9)
.04929
27
Mathematics -28*(14)
39.0(29.9)
.12028
23
Science -25*(15)
47.9(32.9)
.07132
25
Difference between Children of Native-BornParents & Foreign-born Children
Reading -20(16)
53.5(38.8)
.02011.0
30
Mathematics -27+(.17)
57.9(38.8)
.05638
26
Science -32*(17)
56.5(42.2)
.08640
29
Source: U.S. families in the top quartile on the wealth index are on average 2.4 standard deviations above the mean for the bottom quartile. U.S. families inthe top quartile on the International Socio-economic Index are 2.6 standard deviations above the mean for the bottom quartile. PISA data from OECD,Literacy Skills for the World of Tomorrow: Further Results from PISA 2000, p. 334-341, 351-352. Differentials between the children of native-born parentsand the offspring of immigrants could not be calculated for many countries because there are so few immigrants. Small sample sizes mean our estimates ofdifferentials for some countries are measured with considerable error reducing the share of variance explained.* is Statistically significant at 10 percent level on a two tail test; ** 5 percent level; *** 1 percent level.
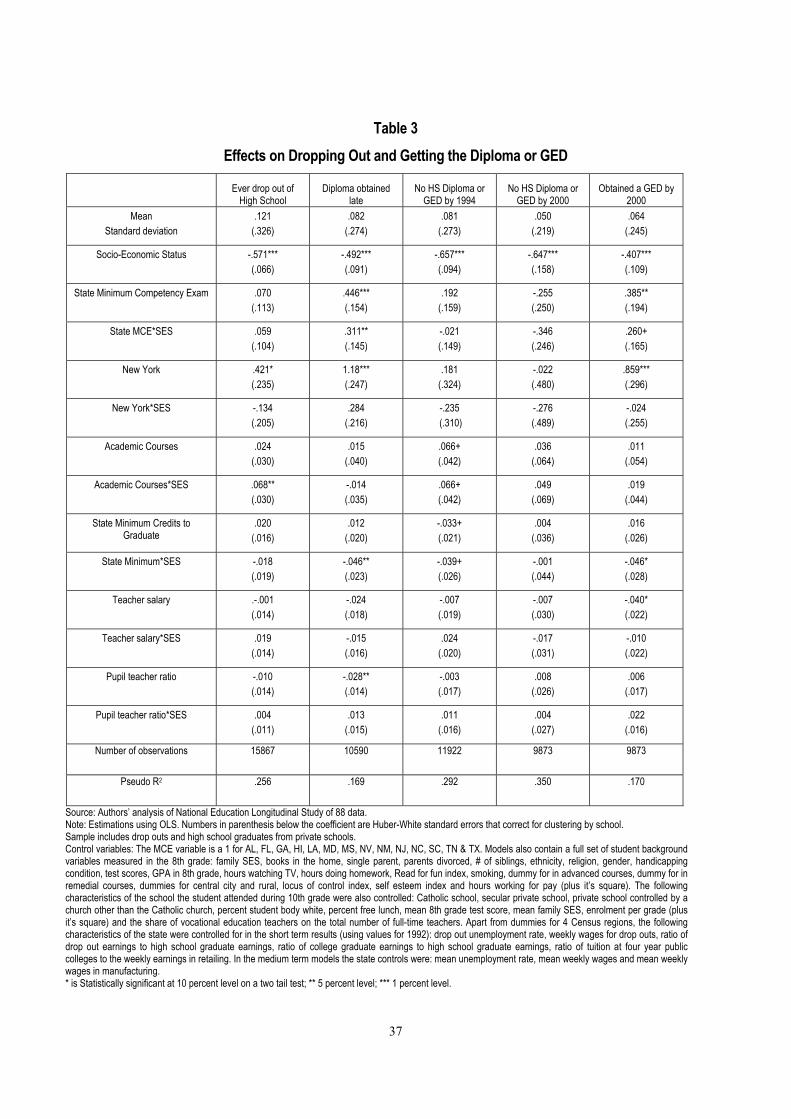
37
Table 3Effects on Dropping Out and Getting the Diploma or GED
Ever drop out ofHigh School
Diploma obtainedlate
No HS Diploma orGED by 1994
No HS Diploma orGED by 2000
Obtained a GED by2000
MeanStandard deviation
.121(.326)
.082(.274)
.081(.273)
.050(.219)
.064(.245)
Socio-Economic Status -.571***(.066)
-.492***(.091)
-.657***(.094)
-.647***(.158)
-.407***(.109)
State Minimum Competency Exam .070(.113)
.446***(.154)
.192(.159)
-.255(.250)
.385**(.194)
State MCE*SES .059(.104)
.311**(.145)
-.021(.149)
-.346(.246)
.260+(.165)
New York .421*(.235)
1.18***(.247)
.181(.324)
-.022(.480)
.859***(.296)
New York*SES -.134(.205)
.284(.216)
-.235 (.310)
-.276(.489)
-.024(.255)
Academic Courses .024(.030)
.015(.040)
.066+(.042)
.036(.064)
.011(.054)
Academic Courses*SES .068**(.030)
-.014(.035)
.066+(.042)
.049(.069)
.019(.044)
State Minimum Credits toGraduate
.020(.016)
.012(.020)
-.033+(.021)
.004(.036)
.016(.026)
State Minimum*SES -.018(.019)
-.046**(.023)
-.039+(.026)
-.001(.044)
-.046*(.028)
Teacher salary .-.001(.014)
-.024(.018)
-.007(.019)
-.007(.030)
-.040*(.022)
Teacher salary*SES .019(.014)
-.015(.016)
.024(.020)
-.017(.031)
-.010(.022)
Pupil teacher ratio -.010(.014)
-.028**(.014)
-.003(.017)
.008(.026)
.006(.017)
Pupil teacher ratio*SES .004(.011)
.013(.015)
.011(.016)
.004(.027)
.022(.016)
Number of observations 15867 10590 11922 9873 9873
Pseudo R2 .256 .169 .292 .350 .170
Source: Authors� analysis of National Education Longitudinal Study of 88 data.Note: Estimations using OLS. Numbers in parenthesis below the coefficient are Huber-White standard errors that correct for clustering by school.Sample includes drop outs and high school graduates from private schools.Control variables: The MCE variable is a 1 for AL, FL, GA, HI, LA, MD, MS, NV, NM, NJ, NC, SC, TN & TX. Models also contain a full set of student backgroundvariables measured in the 8th grade: family SES, books in the home, single parent, parents divorced, # of siblings, ethnicity, religion, gender, handicappingcondition, test scores, GPA in 8th grade, hours watching TV, hours doing homework, Read for fun index, smoking, dummy for in advanced courses, dummy for inremedial courses, dummies for central city and rural, locus of control index, self esteem index and hours working for pay (plus it�s square). The followingcharacteristics of the school the student attended during 10th grade were also controlled: Catholic school, secular private school, private school controlled by achurch other than the Catholic church, percent student body white, percent free lunch, mean 8th grade test score, mean family SES, enrolment per grade (plusit�s square) and the share of vocational education teachers on the total number of full-time teachers. Apart from dummies for 4 Census regions, the followingcharacteristics of the state were controlled for in the short term results (using values for 1992): drop out unemployment rate, weekly wages for drop outs, ratio ofdrop out earnings to high school graduate earnings, ratio of college graduate earnings to high school graduate earnings, ratio of tuition at four year publiccolleges to the weekly earnings in retailing. In the medium term models the state controls were: mean unemployment rate, mean weekly wages and mean weeklywages in manufacturing.* is Statistically significant at 10 percent level on a two tail test; ** 5 percent level; *** 1 percent level.
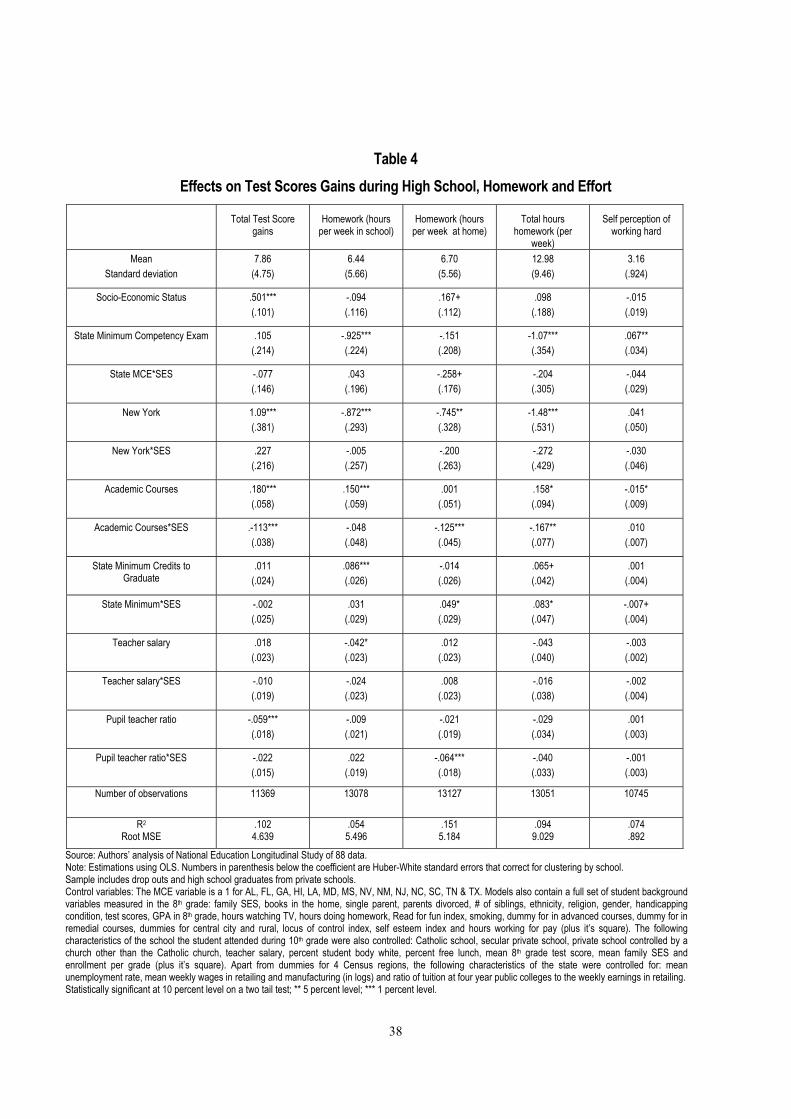
38
Table 4Effects on Test Scores Gains during High School, Homework and Effort
Total Test Scoregains
Homework (hoursper week in school)
Homework (hoursper week at home)
Total hourshomework (per
week)
Self perception ofworking hard
MeanStandard deviation
7.86(4.75)
6.44(5.66)
6.70(5.56)
12.98(9.46)
3.16(.924)
Socio-Economic Status .501***(.101)
-.094(.116)
.167+(.112)
.098(.188)
-.015(.019)
State Minimum Competency Exam .105(.214)
-.925***(.224)
-.151(.208)
-1.07***(.354)
.067**(.034)
State MCE*SES -.077(.146)
.043(.196)
-.258+(.176)
-.204(.305)
-.044(.029)
New York 1.09***(.381)
-.872***(.293)
-.745**(.328)
-1.48***(.531)
.041(.050)
New York*SES .227(.216)
-.005(.257)
-.200(.263)
-.272(.429)
-.030(.046)
Academic Courses .180***(.058)
.150***(.059)
.001(.051)
.158*(.094)
-.015*(.009)
Academic Courses*SES .-113***(.038)
-.048(.048)
-.125***(.045)
-.167**(.077)
.010(.007)
State Minimum Credits toGraduate
.011(.024)
.086***(.026)
-.014(.026)
.065+(.042)
.001(.004)
State Minimum*SES -.002(.025)
.031(.029)
.049*(.029)
.083*(.047)
-.007+(.004)
Teacher salary .018(.023)
-.042*(.023)
.012(.023)
-.043(.040)
-.003(.002)
Teacher salary*SES -.010(.019)
-.024(.023)
.008(.023)
-.016(.038)
-.002(.004)
Pupil teacher ratio -.059***(.018)
-.009(.021)
-.021(.019)
-.029(.034)
.001(.003)
Pupil teacher ratio*SES -.022(.015)
.022(.019)
-.064***(.018)
-.040(.033)
-.001(.003)
Number of observations 11369 13078 13127 13051 10745
R2
Root MSE.1024.639
.0545.496
.1515.184
.0949.029
.074
.892
Source: Authors� analysis of National Education Longitudinal Study of 88 data.Note: Estimations using OLS. Numbers in parenthesis below the coefficient are Huber-White standard errors that correct for clustering by school.Sample includes drop outs and high school graduates from private schools.Control variables: The MCE variable is a 1 for AL, FL, GA, HI, LA, MD, MS, NV, NM, NJ, NC, SC, TN & TX. Models also contain a full set of student backgroundvariables measured in the 8th grade: family SES, books in the home, single parent, parents divorced, # of siblings, ethnicity, religion, gender, handicappingcondition, test scores, GPA in 8th grade, hours watching TV, hours doing homework, Read for fun index, smoking, dummy for in advanced courses, dummy for inremedial courses, dummies for central city and rural, locus of control index, self esteem index and hours working for pay (plus it�s square). The followingcharacteristics of the school the student attended during 10th grade were also controlled: Catholic school, secular private school, private school controlled by achurch other than the Catholic church, teacher salary, percent student body white, percent free lunch, mean 8th grade test score, mean family SES andenrollment per grade (plus it�s square). Apart from dummies for 4 Census regions, the following characteristics of the state were controlled for: meanunemployment rate, mean weekly wages in retailing and manufacturing (in logs) and ratio of tuition at four year public colleges to the weekly earnings in retailing.Statistically significant at 10 percent level on a two tail test; ** 5 percent level; *** 1 percent level.
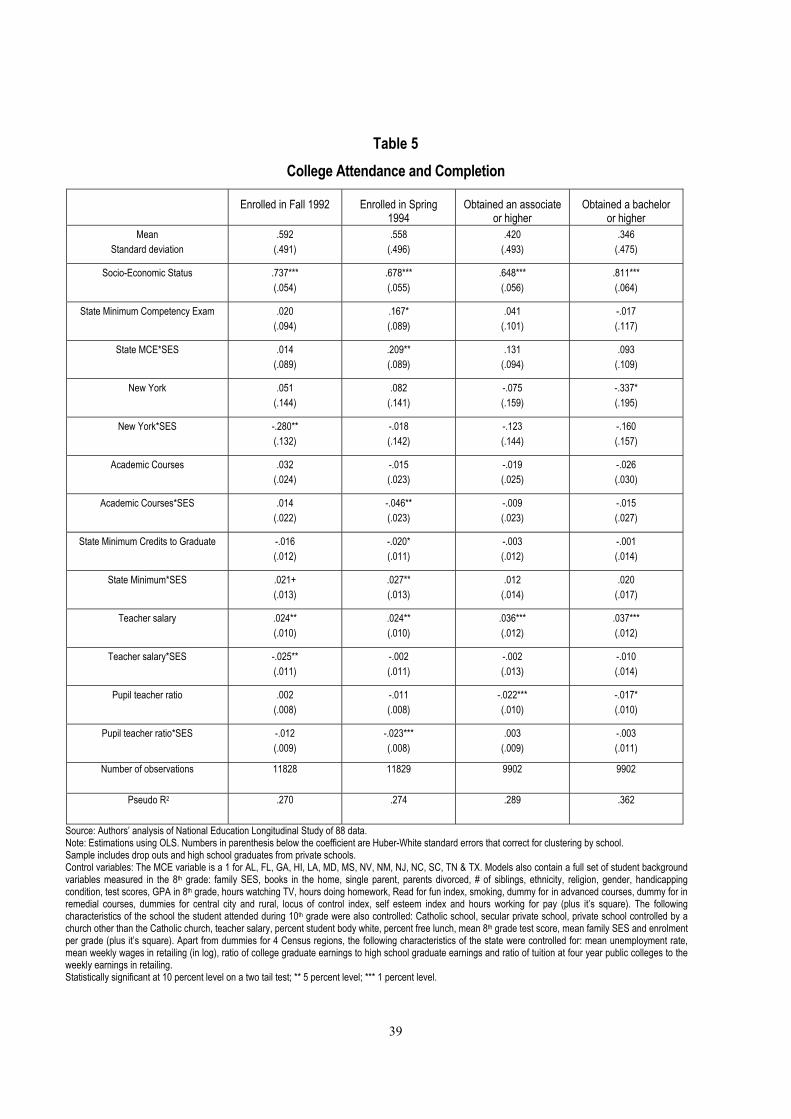
39
Table 5College Attendance and Completion
Enrolled in Fall 1992 Enrolled in Spring1994
Obtained an associateor higher
Obtained a bacheloror higher
MeanStandard deviation
.592(.491)
.558(.496)
.420(.493)
.346(.475)
Socio-Economic Status .737***(.054)
.678***(.055)
.648***(.056)
.811***(.064)
State Minimum Competency Exam .020(.094)
.167*(.089)
.041(.101)
-.017(.117)
State MCE*SES .014(.089)
.209**(.089)
.131(.094)
.093(.109)
New York .051(.144)
.082(.141)
-.075(.159)
-.337*(.195)
New York*SES -.280**(.132)
-.018(.142)
-.123(.144)
-.160(.157)
Academic Courses .032(.024)
-.015(.023)
-.019(.025)
-.026(.030)
Academic Courses*SES .014(.022)
-.046**(.023)
-.009(.023)
-.015(.027)
State Minimum Credits to Graduate -.016(.012)
-.020*(.011)
-.003(.012)
-.001(.014)
State Minimum*SES .021+(.013)
.027**(.013)
.012(.014)
.020(.017)
Teacher salary .024**(.010)
.024**(.010)
.036***(.012)
.037***(.012)
Teacher salary*SES -.025**(.011)
-.002(.011)
-.002(.013)
-.010(.014)
Pupil teacher ratio .002(.008)
-.011(.008)
-.022***(.010)
-.017*(.010)
Pupil teacher ratio*SES -.012(.009)
-.023***(.008)
.003(.009)
-.003(.011)
Number of observations 11828 11829 9902 9902
Pseudo R2 .270 .274 .289 .362
Source: Authors� analysis of National Education Longitudinal Study of 88 data.Note: Estimations using OLS. Numbers in parenthesis below the coefficient are Huber-White standard errors that correct for clustering by school.Sample includes drop outs and high school graduates from private schools.Control variables: The MCE variable is a 1 for AL, FL, GA, HI, LA, MD, MS, NV, NM, NJ, NC, SC, TN & TX. Models also contain a full set of student backgroundvariables measured in the 8th grade: family SES, books in the home, single parent, parents divorced, # of siblings, ethnicity, religion, gender, handicappingcondition, test scores, GPA in 8th grade, hours watching TV, hours doing homework, Read for fun index, smoking, dummy for in advanced courses, dummy for inremedial courses, dummies for central city and rural, locus of control index, self esteem index and hours working for pay (plus it�s square). The followingcharacteristics of the school the student attended during 10th grade were also controlled: Catholic school, secular private school, private school controlled by achurch other than the Catholic church, teacher salary, percent student body white, percent free lunch, mean 8th grade test score, mean family SES and enrolmentper grade (plus it�s square). Apart from dummies for 4 Census regions, the following characteristics of the state were controlled for: mean unemployment rate,mean weekly wages in retailing (in log), ratio of college graduate earnings to high school graduate earnings and ratio of tuition at four year public colleges to theweekly earnings in retailing.Statistically significant at 10 percent level on a two tail test; ** 5 percent level; *** 1 percent level.
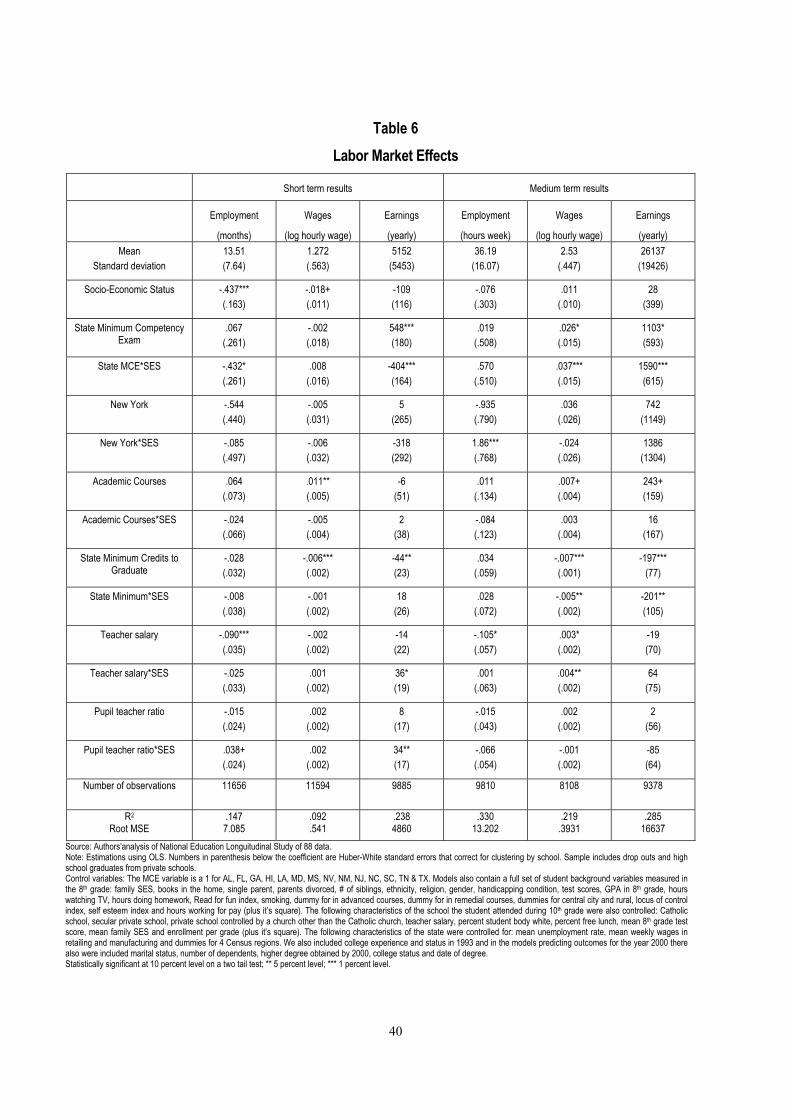
40
Table 6Labor Market Effects
Short term results Medium term results
Employment
(months)
Wages
(log hourly wage)
Earnings
(yearly)
Employment
(hours week)
Wages
(log hourly wage)
Earnings
(yearly)Mean
Standard deviation13.51(7.64)
1.272(.563)
5152(5453)
36.19(16.07)
2.53(.447)
26137(19426)
Socio-Economic Status -.437***(.163)
-.018+(.011)
-109(116)
-.076(.303)
.011(.010)
28(399)
State Minimum CompetencyExam
.067(.261)
-.002(.018)
548***(180)
.019(.508)
.026*(.015)
1103*(593)
State MCE*SES -.432*(.261)
.008(.016)
-404***(164)
.570(.510)
.037***(.015)
1590***(615)
New York -.544(.440)
-.005(.031)
5(265)
-.935(.790)
.036(.026)
742(1149)
New York*SES -.085(.497)
-.006(.032)
-318(292)
1.86***(.768)
-.024(.026)
1386(1304)
Academic Courses .064(.073)
.011**(.005)
-6(51)
.011(.134)
.007+(.004)
243+(159)
Academic Courses*SES -.024(.066)
-.005(.004)
2(38)
-.084(.123)
.003(.004)
16(167)
State Minimum Credits toGraduate
-.028(.032)
-.006***(.002)
-44**(23)
.034(.059)
-.007***(.001)
-197***(77)
State Minimum*SES -.008(.038)
-.001(.002)
18(26)
.028(.072)
-.005**(.002)
-201**(105)
Teacher salary -.090***(.035)
-.002(.002)
-14(22)
-.105*(.057)
.003*(.002)
-19(70)
Teacher salary*SES -.025(.033)
.001(.002)
36*(19)
.001(.063)
.004**(.002)
64(75)
Pupil teacher ratio -.015(.024)
.002(.002)
8(17)
-.015(.043)
.002(.002)
2(56)
Pupil teacher ratio*SES .038+(.024)
.002(.002)
34**(17)
-.066(.054)
-.001(.002)
-85(64)
Number of observations 11656 11594 9885 9810 8108 9378
R2
Root MSE.1477.085
.092
.541.2384860
.33013.202
.219.3931
.28516637
Source: Authors�analysis of National Education Longuitudinal Study of 88 data.Note: Estimations using OLS. Numbers in parenthesis below the coefficient are Huber-White standard errors that correct for clustering by school. Sample includes drop outs and highschool graduates from private schools.Control variables: The MCE variable is a 1 for AL, FL, GA, HI, LA, MD, MS, NV, NM, NJ, NC, SC, TN & TX. Models also contain a full set of student background variables measured inthe 8th grade: family SES, books in the home, single parent, parents divorced, # of siblings, ethnicity, religion, gender, handicapping condition, test scores, GPA in 8th grade, hourswatching TV, hours doing homework, Read for fun index, smoking, dummy for in advanced courses, dummy for in remedial courses, dummies for central city and rural, locus of controlindex, self esteem index and hours working for pay (plus it�s square). The following characteristics of the school the student attended during 10th grade were also controlled: Catholicschool, secular private school, private school controlled by a church other than the Catholic church, teacher salary, percent student body white, percent free lunch, mean 8th grade testscore, mean family SES and enrollment per grade (plus it�s square). The following characteristics of the state were controlled for: mean unemployment rate, mean weekly wages inretailing and manufacturing and dummies for 4 Census regions. We also included college experience and status in 1993 and in the models predicting outcomes for the year 2000 therealso were included marital status, number of dependents, higher degree obtained by 2000, college status and date of degree.Statistically significant at 10 percent level on a two tail test; ** 5 percent level; *** 1 percent level.
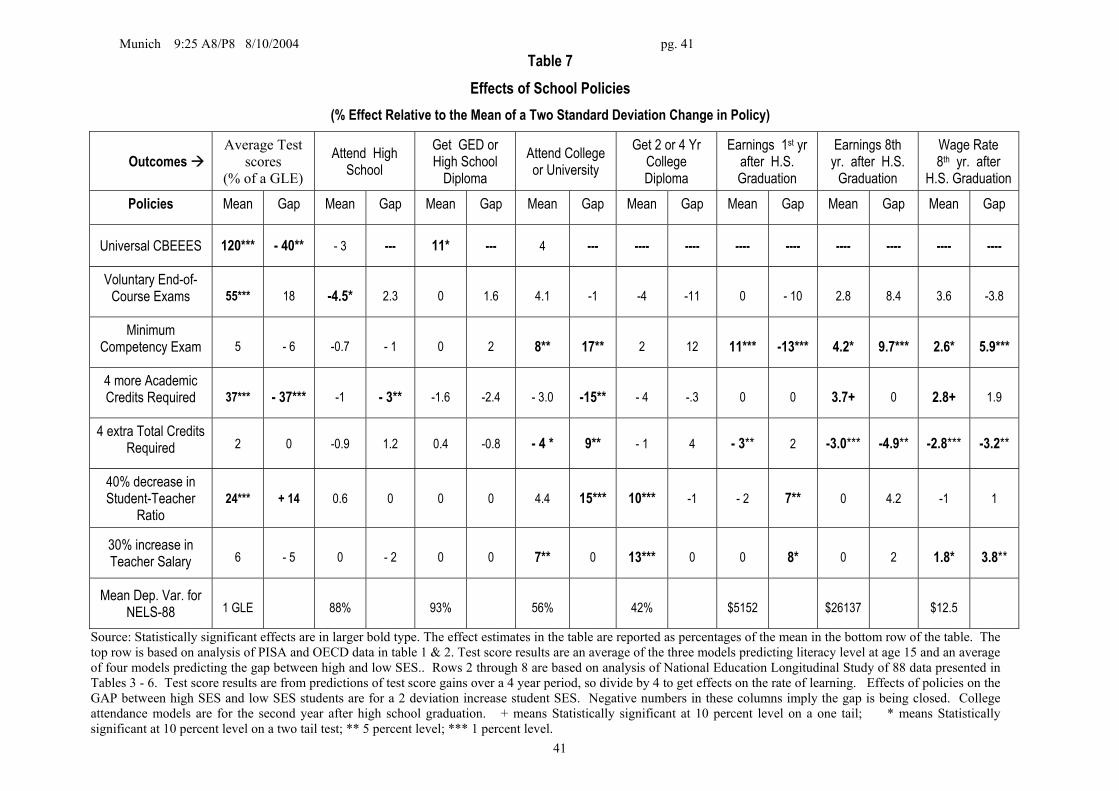
Munich 9:25 A8/P8 8/10/2004 pg. 41
41
Table 7Effects of School Policies
(% Effect Relative to the Mean of a Two Standard Deviation Change in Policy)
Outcomes !Average Test
scores(% of a GLE)
Attend HighSchool
Get GED orHigh School
DiplomaAttend Collegeor University
Get 2 or 4 YrCollegeDiploma
Earnings 1st yrafter H.S.Graduation
Earnings 8thyr. after H.S.
Graduation
Wage Rate8th yr. after
H.S. GraduationPolicies Mean Gap Mean Gap Mean Gap Mean Gap Mean Gap Mean Gap Mean Gap Mean Gap
Universal CBEEES 120*** - 40** - 3 --- 11* --- 4 --- ---- ---- ---- ---- ---- ---- ---- ----
Voluntary End-of-Course Exams 55*** 18 -4.5* 2.3 0 1.6 4.1 -1 -4 -11 0 - 10 2.8 8.4 3.6 -3.8
MinimumCompetency Exam 5 - 6 -0.7 - 1 0 2 8** 17** 2 12 11*** -13*** 4.2* 9.7*** 2.6* 5.9***
4 more AcademicCredits Required 37*** - 37*** -1 - 3** -1.6 -2.4 - 3.0 -15** - 4 -.3 0 0 3.7+ 0 2.8+ 1.9
4 extra Total CreditsRequired 2 0 -0.9 1.2 0.4 -0.8 - 4 * 9** - 1 4 - 3** 2 -3.0*** -4.9** -2.8*** -3.2**
40% decrease inStudent-Teacher
Ratio24*** + 14 0.6 0 0 0 4.4 15*** 10*** -1 - 2 7** 0 4.2 -1 1
30% increase inTeacher Salary 6 - 5 0 - 2 0 0 7** 0 13*** 0 0 8* 0 2 1.8* 3.8**
Mean Dep. Var. forNELS-88 1 GLE 88% 93% 56% 42% $5152 $26137 $12.5
Source: Statistically significant effects are in larger bold type. The effect estimates in the table are reported as percentages of the mean in the bottom row of the table. Thetop row is based on analysis of PISA and OECD data in table 1 & 2. Test score results are an average of the three models predicting literacy level at age 15 and an averageof four models predicting the gap between high and low SES.. Rows 2 through 8 are based on analysis of National Education Longitudinal Study of 88 data presented inTables 3 - 6. Test score results are from predictions of test score gains over a 4 year period, so divide by 4 to get effects on the rate of learning. Effects of policies on theGAP between high SES and low SES students are for a 2 deviation increase student SES. Negative numbers in these columns imply the gap is being closed. Collegeattendance models are for the second year after high school graduation. + means Statistically significant at 10 percent level on a one tail; * means Statisticallysignificant at 10 percent level on a two tail test; ** 5 percent level; *** 1 percent level.
CESifo Working Paper Series (for full list see www.cesifo.de)
___________________________________________________________________________ 1245 Rafael Lalive and Alois Stutzer, Approval of Equal Rights and Gender Differences in
Well-Being, July 2004 1246 Paolo M. Panteghini, Wide vs. Narrow Tax Bases under Optimal Investment Timing,
July 2004 1247 Marika Karanassou, Hector Sala, and Dennis J. Snower, Unemployment in the
European Union: Institutions, Prices, and Growth, July 2004 1248 Engin Dalgic and Ngo Van Long, Corrupt Local Government as Resource Farmers: The
Helping Hand and the Grabbing Hand, July 2004 1249 Francesco Giavazzi and Guido Tabellini, Economic and Political Liberalizations, July
2004 1250 Yin-Wong Cheung and Jude Yuen, An Output Perspective on a Northeast Asia
Currency Union, August 2004 1251 Ralf Elsas, Frank Heinemann, and Marcel Tyrell, Multiple but Asymmetric Bank
Financing: The Case of Relationship Lending, August 2004 1252 Steinar Holden, Wage Formation under Low Inflation, August 2004 1253 Ngo Van Long and Gerhard Sorger, Insecure Property Rights and Growth: The Roles of
Appropriation Costs, Wealth Effects, and Heterogeneity, August 2004 1254 Klaus Wälde and Pia Weiß, International Competition, Slim Firms and Wage
Inequality, August 2004 1255 Jeremy S. S. Edwards and Alfons J. Weichenrieder, How Weak is the Weakest-Link
Principle? On the Measurement of Firm Owners’ Control Rights, August 2004 1256 Guido Tabellini, The Role of the State in Economic Development, August 2004 1257 François Larmande and Jean-Pierre Ponssard, EVA and the Controllability-congruence
Trade-off: An Empirical Investigation, August 2004 1258 Vesa Kanniainen and Jenni Pääkkönen, Anonymous Money, Moral Sentiments and
Welfare, August 2004 1259 Panu Poutvaara and Andreas Wagener, Why is the Public Sector More Labor-Intensive?
A Distortionary Tax Argument, August 2004 1260 Lars P. Feld and Stefan Voigt, Making Judges Independent – Some Proposals
Regarding the Judiciary, August 2004

1261 Joop Hartog, Hans van Ophem, and Simona Maria Bajdechi, How Risky is Investment
in Human Capital?, August 2004 1262 Thomas Eichner and Rüdiger Pethig, Efficient Nonanthropocentric Nature Protection,
August 2004 1263 David-Jan Jansen and Jakob de Haan, Look Who’s Talking: ECB Communication
during the First Years of EMU, August 2004 1264 David F. Bradford, The X Tax in the World Economy, August 2004 1265 Hans-Werner Sinn, Migration, Social Standards and Replacement Incomes. How to
Protect Low-income Workers in the Industrialized Countries against the Forces of Globalization and Market Integration, August 2004
1266 Wolfgang Leininger, Fending off one Means Fending off all: Evolutionary Stability in
Submodular Games, August 2004 1267 Antoine Bommier and Bertrand Villeneuve, Risk Aversion and the Value of Risk to
Life, September 2004 1268 Harrie A. A. Verbon and Lex Meijdam, Too Many Migrants, Too Few Services: A
Model of Decision-making on Immigration and Integration with Cultural Distance, September 2004
1269 Thomas Eichner and Rüdiger Pethig, Economic Land Use, Ecosystem Services and
Microfounded Species Dynamics, September 2004 1270 Federico Revelli, Performance Rating and Yardstick Competition in Social Service
Provision, September 2004 1271 Gerhard O. Orosel and Klaus G. Zauner, Vertical Product Differentiation When Quality
is Unobservable to Buyers, September 2004 1272 Christoph Böhringer, Stefan Boeters, and Michael Feil, Taxation and Unemployment:
An Applied General Equilibrium Approach, September 2004 1273 Assaf Razin and Efraim Sadka, Welfare Migration: Is the Net Fiscal Burden a Good
Measure of its Economics Impact on the Welfare of the Native-Born Population?, September 2004
1274 Tomer Blumkin and Volker Grossmann, Ideological Polarization, Sticky Information,
and Policy Reforms, September 2004 1275 Katherine Baicker and Nora Gordon, The Effect of Mandated State Education Spending
on Total Local Resources, September 2004 1276 Gabriel J. Felbermayr and Wilhelm Kohler, Exploring the Intensive and Extensive
Margins of World Trade, September 2004
1277 John Burbidge, Katherine Cuff and John Leach, Capital Tax Competition with
Heterogeneous Firms and Agglomeration Effects, September 2004 1278 Joern-Steffen Pischke, Labor Market Institutions, Wages and Investment, September
2004 1279 Josef Falkinger and Volker Grossmann, Institutions and Development: The Interaction
between Trade Regime and Political System, September 2004 1280 Paolo Surico, Inflation Targeting and Nonlinear Policy Rules: The Case of Asymmetric
Preferences, September 2004 1281 Ayal Kimhi, Growth, Inequality and Labor Markets in LDCs: A Survey, September
2004 1282 Robert Dur and Amihai Glazer, Optimal Incentive Contracts for a Worker who Envies
his Boss, September 2004 1283 Klaus Abberger, Nonparametric Regression and the Detection of Turning Points in the
Ifo Business Climate, September 2004 1284 Werner Güth and Rupert Sausgruber, Tax Morale and Optimal Taxation, September
2004 1285 Luis H. R. Alvarez and Erkki Koskela, Does Risk Aversion Accelerate Optimal Forest
Rotation under Uncertainty?, September 2004 1286 Giorgio Brunello and Maria De Paola, Market Failures and the Under-Provision of
Training, September 2004 1287 Sanjeev Goyal, Marco van der Leij and José Luis Moraga-González, Economics: An
Emerging Small World?, September 2004 1288 Sandro Maffei, Nikolai Raabe and Heinrich W. Ursprung, Political Repression and
Child Labor: Theory and Empirical Evidence, September 2004 1289 Georg Götz and Klaus Gugler, Market Concentration and Product Variety under Spatial
Competition: Evidence from Retail Gasoline, September 2004 1290 Jonathan Temple and Ludger Wößmann, Dualism and Cross-Country Growth
Regressions, September 2004 1291 Ravi Kanbur, Jukka Pirttilä and Matti Tuomala, Non-Welfarist Optimal Taxation and
Behavioral Public Economics, October 2004 1292 Maarten C. W. Janssen, José Luis Moraga-González and Matthijs R. Wildenbeest,
Consumer Search and Oligopolistic Pricing: An Empirical Investigation, October 2004 1293 Kira Börner and Christa Hainz, The Political Economy of Corruption and the Role of
Financial Institutions, October 2004
1294 Christoph A. Schaltegger and Lars P. Feld, Do Large Cabinets Favor Large
Governments? Evidence from Swiss Sub-Federal Jurisdictions, October 2004 1295 Marc-Andreas Mündler, The Existence of Informationally Efficient Markets When
Individuals Are Rational, October 2004 1296 Hendrik Jürges, Wolfram F. Richter and Kerstin Schneider, Teacher Quality and
Incentives: Theoretical and Empirical Effects of Standards on Teacher Quality, October 2004
1297 David S. Evans and Michael Salinger, An Empirical Analysis of Bundling and Tying:
Over-the-Counter Pain Relief and Cold Medicines, October 2004 1298 Gershon Ben-Shakhar, Gary Bornstein, Astrid Hopfensitz and Frans van Winden,
Reciprocity and Emotions: Arousal, Self-Reports, and Expectations, October 2004 1299 B. Zorina Khan and Kenneth L. Sokoloff, Institutions and Technological Innovation
During Early Economic Growth: Evidence from the Great Inventors of the United States, 1790 – 1930, October 2004
1300 Piero Gottardi and Roberto Serrano, Market Power and Information Revelation in
Dynamic Trading, October 2004 1301 Alan V. Deardorff, Who Makes the Rules of Globalization?, October 2004 1302 Sheilagh Ogilvie, The Use and Abuse of Trust: Social Capital and its Deployment by
Early Modern Guilds, October 2004 1303 Mario Jametti and Thomas von Ungern-Sternberg, Disaster Insurance or a Disastrous
Insurance – Natural Disaster Insurance in France, October 2004 1304 Pieter A. Gautier and José Luis Moraga-González, Strategic Wage Setting and
Coordination Frictions with Multiple Applications, October 2004 1305 Julia Darby, Anton Muscatelli and Graeme Roy, Fiscal Federalism, Fiscal
Consolidations and Cuts in Central Government Grants: Evidence from an Event Study, October 2004
1306 Michael Waldman, Antitrust Perspectives for Durable-Goods Markets, October 2004 1307 Josef Honerkamp, Stefan Moog and Bernd Raffelhüschen, Earlier or Later: A General
Equilibrium Analysis of Bringing Forward an Already Announced Tax Reform, October 2004
1308 M. Hashem Pesaran, A Pair-Wise Approach to Testing for Output and Growth
Convergence, October 2004 1309 John Bishop and Ferran Mane, Educational Reform and Disadvantaged Students: Are
They Better Off or Worse Off?, October 2004