Employees' Trust in Managers in a Downsized Organization - DiVA
149
Employees’ Trust in Managers in a Downsized Organization - A Case Study of how Internal Factors Affecting Employee’s Level of Trust Bachelor dissertation Authors: Akhunov, Otabek FEC 685, November 2006 Eriksson, Jens International business Karlsson, Alexandra Department of Business Administration & Economics Tutors: Ekelund, Christer Fjelkner, Annika Källström, Lisa
Transcript of Employees' Trust in Managers in a Downsized Organization - DiVA

Employees’ Trust in Managers in a
Downsized Organization
- A Case Study of how Internal Factors Affecting
Employee’s Level of Trust
Bachelor dissertation Authors: Akhunov, Otabek
FEC 685, November 2006 Eriksson, Jens
International business Karlsson, Alexandra
Department of Business Administration & Economics
Tutors: Ekelund, Christer
Fjelkner, Annika
Källström, Lisa
Foreword
Kristianstad, November 2006
During the last three and a half years at Kristianstad University, we have gained a
lot of knowledge, experiences and good memories, which will be useful for us in
the future.
We would like to thank our tutors Christer Ekelund and Lisa Källström for their
help and support, during the writing process. Their valuable suggestions and ideas
have helped us to improve the dissertation. We also would like to thank Annika
Fjelkner, for her help with the English language and Pierre Carbonnier for always
taking his time to answer our questions about the statistics.
A special thanks to the employees and managers at Swedish Meats in
Kristianstad, who participated in our case study.
Alexandra Karlsson Jens Eriksson Otabek Akhunov

Abstract
Trust is important to establish a good relationship between employees and
managers in an organization. For the modern organization, trust is important to be
able to survive and be successful in the long run. We believe that the employees
are the key players, which the organization relies on to create value and to be
competitive in the market. The purpose of the dissertation was to find out, how
the managers worked with the internal factors affecting trust during a downsizing
process and to compare the findings with the employees’ level of trust in the
managers. To be able to measure the level of trust, we created the COCR-model,
which we used when we analysed the data from the survey. The result of the
survey showed that the employees had some trust in the managers, and that the
managers had worked actively with almost all internal factors that were measured
in the COCR-model. Our conclusion is that there are external factors affecting
employees’ trust in managers as well. These external factors could be one
explanation why the employees in our case study had some trust in their
managers, even when they had experienced a downsizing. According to us this is
an irrational behaviour, which becomes rational only when the external factors are
considered.
Keywords: trust, distrust, internal factors, downsizing, employees, managers,

TABLE OF CONTENTS 1 INTRODUCTION ............................................................................2 1.1 BACKGROUND............................................................................................... 2 1.2 RESEARCH PROBLEM .................................................................................. 4 1.2.2 Purpose ........................................................................................................... 5 1.3 LIMITATIONS ................................................................................................. 5 1.4 OUTLINE.......................................................................................................... 5 1.5 SUMMARY ...................................................................................................... 7 2 METHODOLOGY...........................................................................8 2.1 DISSERTATION METHOD ............................................................................ 8 2.2 RESEARCH PHILOSOPHY ............................................................................ 9 2.3 RESEARCH APPROACH................................................................................ 9 2.4 STRATEGIES AND TIME HORIZONS ....................................................... 10 2.4.1 Strategies ...................................................................................................... 10 2.4.2 Time Horizons.............................................................................................. 11 2.5 CHOICE OF THEORY................................................................................... 11 2.6 SUMMARY .................................................................................................... 12 3 THEORETICAL FRAMEWORK ...............................................13 3.1. A CONCEPTUAL FRAMEWORK OF SOCIAL SCIENCE ....................... 13 3.1.1 The Micro to Macro Problem....................................................................... 14 3.1.2. Macro and Micro Level of Trust ................................................................. 15 3.2. THE MANAGER AND EMPLOYEE RELATIONSHIP ............................. 15 3.2.1. The Economic Perspective .......................................................................... 15 3.2.2. The Social Perspective ................................................................................ 16 3.2.3. The Law of Agents ...................................................................................... 17 3.3. TRUST ........................................................................................................... 17 3.3.1. The Mental State of Trust............................................................................ 17 3.3.2 The Social-Cognitive Theory ....................................................................... 19 3.3.2.1 The cognitive mental state of trust ............................................................ 20 3.3.2.2 Basic beliefs............................................................................................... 20 3.3.2.3 Trust-Reliance ........................................................................................... 20 3.3.2.4 Non-Social Trust and Social Trust ............................................................ 21 3.4 WHAT HAS DOWNSIZING TO DO WITH TRUST? ................................. 23 3.4.1 Crisis in Relation to Trust ............................................................................ 24 3.5 THE DIMENSIONS OF TRUST.................................................................... 25 3.5.1 The Competence Dimension of Trust .......................................................... 25 3.5.2 The Openness Dimension of Trust............................................................... 25 3.5.3 The Concern Dimension of Trust................................................................. 25 3.5.4 The Reliability Dimension of Trust ............................................................. 26 3.5.5 Summary of Dimensions of Trust ................................................................ 27 3.6 INTERNAL FACTORS WHICH AFFECTS TRUST.................................... 27 3.6.1 Competence.................................................................................................. 27 3.6.2 Teamwork..................................................................................................... 27 3.6.3 Communication ............................................................................................ 28

3.6.4 Integrity ........................................................................................................ 29 3.6.4.1 Employees Well-being ............................................................................... 29 3.6.4.2 Honesty and Openness .............................................................................. 29 3.6.4.3 Consistency................................................................................................ 30 3.6.4.4 Fairness..................................................................................................... 30 3.6.5 Uncertainty ................................................................................................... 30 3.6.6 Opportunistic Behaviour .............................................................................. 30 3.6.7 Positive and Negative Internal Factors......................................................... 31 3.7 DISTRUST...................................................................................................... 31 3.8 LEVEL OF TRUST ........................................................................................ 31 3.8.1 The level of trust and distrust ....................................................................... 31 3.9 SUMMARY .................................................................................................... 33 4 CONSTRUCTING THE COCR-MODEL ..................................35 4.1 THE CONSTRUCTION OF THE COCR-MODEL....................................... 35 4.1.2 The Competence Dimension ........................................................................ 35 4.1.3 The Openness Dimension............................................................................. 35 4.1.4 The Concern Dimension............................................................................... 36 4.1.5 The Reliability Dimension ........................................................................... 37 4.2 COMBINE THE TRUST-DISTRUST GAP WITH THE COCR-MODEL... 38 4.2.1 How to Measure with the COCR-model ...................................................... 39 4.3 SUMMARY .................................................................................................... 40 5 CASE COMPANY – SWEDISH MEATS ...................................42 5.1 THE MEAT SECTOR IN THE EUROPEAN UNION .................................. 42 5.1.1 The Pig Meat Sector ..................................................................................... 42 5.1.2 Limited EU assistance.................................................................................. 43 5.2 SWEDISH MEATS COMMERCIAL ENTERPRISE.................................... 43 5.2.1 Swedish Meats and its Owners..................................................................... 43 5.2.2 Swedish Meats commercial enterprise......................................................... 44 5.2.3 Swedish Meat Co ......................................................................................... 45 5.2.4 Scan Foods AB............................................................................................. 46 5.2.5 Swedish Meats Kristanstad .......................................................................... 46 5.2.5.1 Swedish Meats Kristianstad Section Q...................................................... 48 5.3 SUMMARY .................................................................................................... 48 6 EMPIRICAL METHOD ...............................................................49 6.1 RESEARCH STRATEGY .............................................................................. 49 6.2 THE POPULATION ....................................................................................... 51 6.3 THE QUESTIONNAIRE................................................................................ 51 6.4 THE INTERVIEWS........................................................................................ 53 6.5 OPERATIONALISATION............................................................................. 54 6.5.1The Questionnaire-questions......................................................................... 55 6.5.2 The Interview-questions............................................................................... 56 6.6 THE RESPONSE RATE................................................................................. 58 6.7 RELIABILITY................................................................................................ 58 6.8 VALIDITY...................................................................................................... 60 6.9 GENERALISABILITY................................................................................... 61 6.10 SUMMARY .................................................................................................. 61

7 RESULT OF THE SURVEY ........................................................62 7.1 BACKGROUND TO THE ANALYSIS......................................................... 62 7.2 THE QUESTIONNAIRE................................................................................ 63 7.2.1 Manager A.................................................................................................... 64 7.2.1.1 Competence Dimension............................................................................. 64 7.2.1.2 Openness Dimension ................................................................................. 65 7.2.1.3 Concern Dimension................................................................................... 66 7.2.1.4 Reliability Dimension................................................................................ 67 7.2.1.5 Total trust for Manager A ......................................................................... 68 7.2.2 Manager B .................................................................................................... 69 7.2.2.1 Competence Dimension............................................................................. 69 7.2.2.2 Openness Dimension ................................................................................. 69 7.2.2.3 Concern Dimension................................................................................... 71 7.2.2.4 Reliability Dimension................................................................................ 72 7.2.2.5 Total trust for Manager B ......................................................................... 73 7.2.3 Manager C .................................................................................................... 73 7.2.3.1 Competence Dimension............................................................................. 73 7.2.3.2 Openness Dimension ................................................................................. 74 7.2.3.3 Concern Dimension................................................................................... 75 7.2.3.4 Reliability Dimension................................................................................ 77 7.2.3.5 Total trust for Manager C ......................................................................... 77 7.2.4 Overview of the Managers Total Trust ........................................................ 78 7.2.5 The Level of Total Trust in the Managers.................................................... 79 7.2.5.1 The Total Competence Dimension ............................................................ 79 7.2.5.2 The Total Openness Dimension................................................................. 80 7.2.5.3 The Total Openness Dimension................................................................. 81 7.2.5.4 The Total Reliability Dimension ............................................................... 83 7.2.5.5 Total trust for the Managers ..................................................................... 84 7.3 ANALYSIS OF THE INTERVIEWS WITH THE MANAGERS ................. 86 7.3.1 Competence.................................................................................................. 86 7.3.2 Teamwork..................................................................................................... 86 7.3.3 Communication ............................................................................................ 87 7.3.4 Honesty and openness .................................................................................. 87 7.3.5 Employee well-being.................................................................................... 87 7.3.6 Fairness......................................................................................................... 88 7.3.7 Consistency .................................................................................................. 88 7.3.8 Uncertainty ................................................................................................... 89 7.4 SUMMARY .................................................................................................... 89 8 CONCLUSIONS.............................................................................91 8.1. ANSWERS TO THE RESEARCH QUESTIONS......................................... 91 8.1.1. What is trust?............................................................................................... 91 8.1.2. What creates and destroys trust? ................................................................. 92 8.1.3 How to measure the level of trust employees have for the managers in a downsized organization? ....................................................................................... 93 8.1.4 What internal factors affecting employee’s trust, do managers work with during a downsizing process? ............................................................................... 94 8.2 A COMPARISON BETWEEN THE QUALITATIVE AND THE QUANTITATIVE DATA..................................................................................... 95

8.2.1 The Competence Dimension of Trust .......................................................... 96 8.2.2 The Openness Dimension of Trust............................................................... 96 8.2.3 The Concern Dimension of Trust................................................................. 97 8.2.4 The Reliability Dimension of Trust ............................................................. 99 8.2.5 Conclusion of the Comparison..................................................................... 99 8.3 THE AUTHORS REFLECTIONS................................................................ 100 8.4 PRACTICAL IMPLICATIONS ................................................................... 101 8.5 FURTHER RESEARCH............................................................................... 102 8.6 CRITICISM TO THE DISSERTATION...................................................... 103 8.7 SUMMARY .................................................................................................. 105 REFERENCES ................................................................................106 List of figures Figure 2.1 The research ‘onion’ ........................................................................................................8 Figure 3:1: Colman-Lindenberg diagram (1996). ...........................................................................14 Figure 3.2 shows the social trust mental state of a cognitive agent.................................................23 Figure 3.3 shows. The communication process model....................................................................29 Figure 3.4 shows the trust-distrust gap............................................................................................32 Figure 4.1 shows the relationship between internal factors, the four dimensions and trust in the
COCR-model ..................................................................................................................................37 Figure 4.2 shows the adjusted version of the trust-distrust gap.......................................................38 Figure 5.1 shows the ownership and the organizations democratic structure..................................44 Figure 5.2 shows the over all structure of Swedish Meats Commercial Enterprise ........................45 Figure 5.3 shows Swedish Meats Co organizational structure and its functions.............................46 Figure 7.1: The COCR-model with the calculated mean values .....................................................85 Figure 7.2: The adjusted trust-distrust gap model ...........................................................................86
List of tables Table 7.2.1.1 The Competence Dimension of Manager A................................................................. 64 Table 7.2.1.2 The Openness Dimension of Manager A ...................................................................... 65 Table 7.2.1.3 The Concern Dimension of Manager A ........................................................................ 66 Table 7.2.1.4 The Reliability Dimension of Manager A ..................................................................... 68 Table 7.2.1.5 Summary of the Dimensions of Trust for Manager A................................................... 68 Table 7.2.2.1 The Competence Dimension of Manager B .................................................................. 69 Table 7.2.2.2 The Openness Dimension of Manager B....................................................................... 69 Table 7.2.2.3 The Concern Dimension of Manager B......................................................................... 71 Table 7.2.2.4 The Reliability Dimension of Manager B ..................................................................... 72 Table 7.2.2.5 Summary of the Dimensions of Trust for Manager B ................................................... 73 Table 7.2.3.1 The Competence Dimension of Manager C .................................................................. 74 Table 7.2.3.2 The Openness Dimension of Manager C....................................................................... 74

Table 7.2.3.3 The Concern Dimension of Manager C......................................................................... 75 Table 7.2.3.4 The Reliability Dimension of Manager C ..................................................................... 77 Table 7.2.3.5 Summary of the Dimensions of Trust for Manager C .................................................. 78 Table 7.2.4 Overview of the Managers Trust...................................................................................... 78 Table 7.2.5.1 The Competence Dimension for the Managers ............................................................. 79 Table 7.2.5.2 The Openness Dimension for the Managers.................................................................. 80 Table 7.2.5.3 The Concern Dimension for the Managers ................................................................... 81 Table 7.2.5.4 The Reliability Dimension for the Managers ................................................................ 83 Table 7.2.5.5 The Total Trust for the Managers.................................................................................. 84
Appendices APPENDIX 1A ........................................................................................................ APPENDIX 1B ......................................................................................................... APPENDIX 2A ......................................................................................................... APPENDIX 2B ......................................................................................................... APPENDIX 3 ...................................................................................................... 128 APPENDIX 4 ............................................................................................................

Introduction
2
INTRODUCTION In this first chapter we present the background to the dissertation. We describe
the research problem, purpose and the research questions. The limitations are
presented, as well as, the definitions. Finally, the outline for the dissertation is
presented.
1.1 BACKGROUND In a social context there must be a certain level of trust, to establish an interaction
between two parties. This does not mean that you neither trust nor distrust. On the
contrary, it is all about the level of trust you have. Sometimes you require
different levels of trust for almost identical situations. The reason for this is that
your preferences frame about the situation has changed. For instance, you might
have got new information or you are in a different mental state. Trust is important
to establish relationships or to improve interactions and other forms of exchanges
with the world outside yourself (Falcon, 2005). For the modern organization, trust
is a crucial factor if it wants to survive and be successful in the long run. A reason
for this is that the modern organisation has turned away from the traditional
hierarchical forms towards more network or alliances based organisations. Trust
is a key in networking and that is why trust is important for today’s organisations
(Kramer, 1996). Employees’ trust in management, managers and the organization
is vital, because employees are the organization’s key players. They are the ones
that makes up the bigger part of the organization and where the value is created.
When an organization has downsized it affects the employees in the organization
tremendously (Appelbaum, Close & Klasa, 1999). Therefore, managers need to
know how to maintain or rebuild trust. We believe that this interdependent
relationship between managers and employees, are one of the weakest links that
exist in an organization, and therefore, it could be a hindrance for the organization
in the long run.
Our interest in the concept trust and its effects on managers’ decision making
came from an experience one of us had at a summer job. The employees at the
workplace were asked to answer a questionnaire about their work environment
and their managers. This questionnaire was made by a consult company, on behalf
of the management. The questionnaire was sent by e-mail and when some of the

Introduction
3
employees answered the questions, they deliberately answered dishonestly. What
the employees did was to give the management wrong information, about how
they perceived their work environment and their managers. The reasons for this
behaviour were according to the employees themselves, that the managers could
use this information against them, when they were up for a promotion or
negotiating salaries. We believe that one reason why employees act like this is
lack of trust in the management and the managers.
Behaviours like these are negative both for the employees and the
management/managers in the organization. To get the correct message across at
all levels in an organisation, it is essential for both managers and employees to be
able to communicate properly (Darling & Nurmi, 1995). For example, if
employees give the management/managers wrong information, it could lead to
that the management/managers misinterpret the situation at work, and as a result
of this, wrong decisions could be made. This can become a vicious circle and bad
for the organization in the long run. To break this vicious circle we believe that
trust can be one solution.
We believe that trust between managers and employees are an important factor for
the interactions in the organization. In the business world today when downsizing
seems to have become more of a rule than an exception, the trust employees have
in their organisation and for their management/managers have decreased
(Appelbaum, et al., 1999). In our dissertation the main research question is about
trust. Due to the fact that trust alone is to general, we needed to put it into a
context, namely employees’ trust in managers in a downsized organization. After
we had determined the content of our dissertation, we started to review literature
about trust, and found that it has been defined in many different ways. Since we
were going to write about employees’ trust in managers in a downsized
organization, we chose the definition of trust made by Mishra (1996). She defined
trust as a person who is willing to vulnerable, if he/she believes that the
counterparty is competent, open, concerned and reliable.
Introduction
4
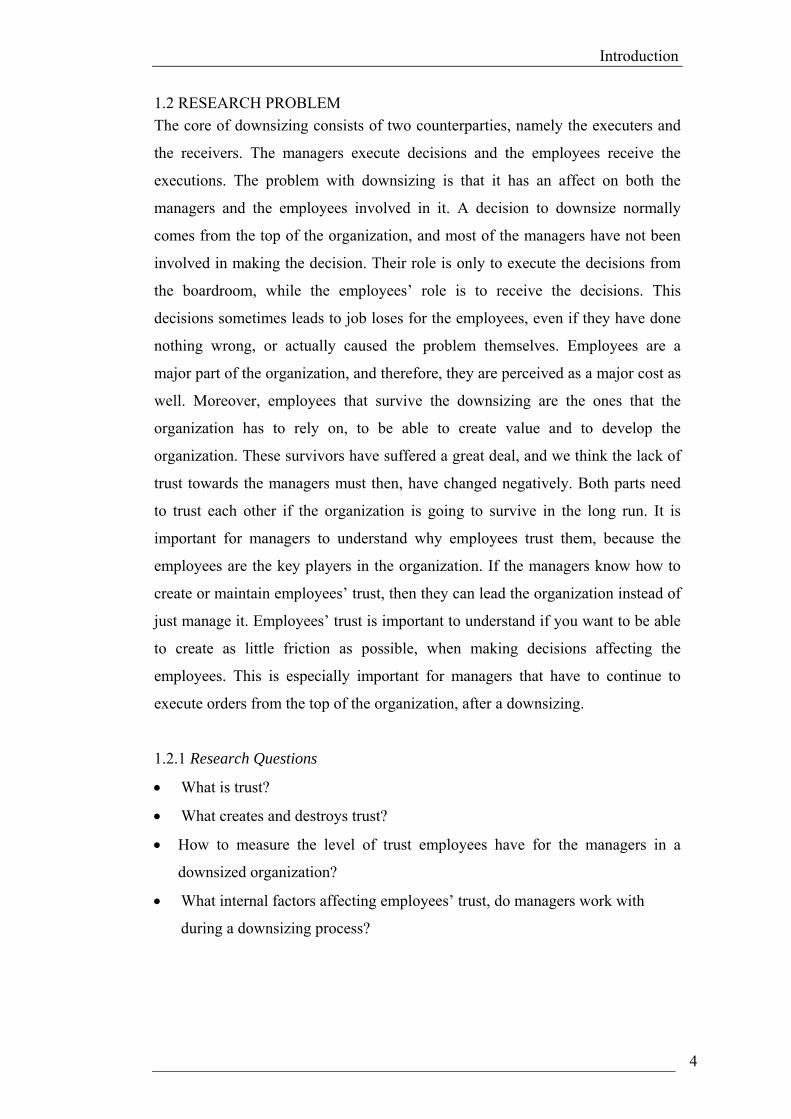
1.2 RESEARCH PROBLEM The core of downsizing consists of two counterparties, namely the executers and
the receivers. The managers execute decisions and the employees receive the
executions. The problem with downsizing is that it has an affect on both the
managers and the employees involved in it. A decision to downsize normally
comes from the top of the organization, and most of the managers have not been
involved in making the decision. Their role is only to execute the decisions from
the boardroom, while the employees’ role is to receive the decisions. This
decisions sometimes leads to job loses for the employees, even if they have done
nothing wrong, or actually caused the problem themselves. Employees are a
major part of the organization, and therefore, they are perceived as a major cost as
well. Moreover, employees that survive the downsizing are the ones that the
organization has to rely on, to be able to create value and to develop the
organization. These survivors have suffered a great deal, and we think the lack of
trust towards the managers must then, have changed negatively. Both parts need
to trust each other if the organization is going to survive in the long run. It is
important for managers to understand why employees trust them, because the
employees are the key players in the organization. If the managers know how to
create or maintain employees’ trust, then they can lead the organization instead of
just manage it. Employees’ trust is important to understand if you want to be able
to create as little friction as possible, when making decisions affecting the
employees. This is especially important for managers that have to continue to
execute orders from the top of the organization, after a downsizing.
1.2.1 Research Questions
• What is trust?
• What creates and destroys trust?
• How to measure the level of trust employees have for the managers in a
downsized organization?
• What internal factors affecting employees’ trust, do managers work with
during a downsizing process?

Introduction
5
1.2.2 Purpose
The purpose of this dissertation is to investigate what internal factors managers
work with during a downsizing process that could have an affect on employees’
trust. Furthermore, the purpose is also to find out if there is a model of how to
measure the level of the employees trust. If not, we intend to develop one. By
conducting a case study, we intend to test the model and also try to find out which
factors, the managers worked with during the downsizing process that affected the
employees’ trust in the managers. Finally, we intend to compare the results from
the case study to find out whether or not the managers work with the internal
factors, had an impact on the employees level of trust.
1.3 LIMITATIONS The scope in this dissertation is limited because it only considers employees trust
in managers in a downsized organization. The managers in question, are only the
closest managers that been involved in executing the downsizing. Furthermore,
our research sample was limited to only one industry as a single embedded case
study, which included only one section of a department at Swedish Meats in
Kristianstad. This can be seen as a limitation due to its geographical closeness.
However, this dissertation only considers the internal factors that affect trust and
not the external ones. It might be other internal factors that affect trust, but we
considered the factors that are already known and mentioned in the literature we
have reviewed. Due to limited time and financial resources we could not conduct
a bigger empirical case study. We have also limited the case study to not include
the organizations culture, since we only investigate one organization, in one
sector in one country. It has to be remembered that in another company, sector or
country the result might be different. Furthermore, in our case study we have only
considered things which happened at Swedish Meats, until the day the survey and
the interviews were conducted.
1.4 OUTLINE In the dissertation we have the following outline.
Chapter 2 In this chapter we will present the methodology. We introduce
the research approach followed by the research philosophy. The
chapter ends with our choice of theory.

Introduction
6
Chapter 3 In this chapter we will present the theoretical framework. First,
we introduce the conceptual framework of social science and
the manager and employee relationship. Second, theories and
definitions about trust and distrust, what downsizing has to do
with trust, the dimensions of trust and the internal factors
affecting trust will be presented. The chapter ends with a
discussion about the levels of trust.
Chapter 4 In this chapter we will present our COCR-model. We explain
the COCR-model and the internal factors relationship to the four
dimensions of trust and the adjusted trust-distrust gap model.
The chapter ends with an explanation of how to measure with
the COCR-model.
Chapter 5 In this chapter we will present the case company, Swedish
Meats. We begin with an introduction of the meat sector in
Europe. The Swedish Meats Commercial Enterprise, its owners
and organization is also presented. The chapter ends with a
presentation of Swedish Meats in Kristianstad and the section of
the department where our research was conducted.
Chapter 6 In this chapter we will present the empirical method. The
research strategy is explained, followed by a presentation of the
questionnaire, interview questions, response rate and the
operationalisation. The chapter ends with a discussion about the
dissertations reliability, validity and generalisability.
Chapter 7 In this chapter we will present the result of the survey. The
answers from the questionnaires and the interviews are
presented and analysed.

Introduction
7
Chapter 8 In this chapter we will present our conclusions. We present the
answers to the research questions, the qualitative and the
quantitative data will be compared, the authors’ reflections, and
the practical implications, suggestions to further research and
criticism to the dissertation.
1.5 SUMMARY Trust is an important factor in the relationship between managers and employees.
Managers and employees are interdependent of each other. This means that a poor
interaction between them can be a weak link for the organization. We believe that
trust makes this link stronger between the two parties, and in the long run, a more
successful and stable organization. The purpose of this dissertation is to find out
which internal factors affect employees’ trust, and how to measure the level of
trust the employees have in the managers.
.

Methodology
8
2 METHODOLOGY In this chapter we present the methodology used for conducting the research. We
describe the method, research philosophy, research approach, strategies, time
horizons and the choice of theory.
2.1 DISSERTATION METHOD There are many different research approaches to base a research on. We chose to
follow the research ‘onion’ to compose our dissertation on, because it gives an
overview of how to write a dissertation. The figure 2.1 shows the research onion’s
different layers of how a research can be conducted. The first outer layer shows
the research philosophies, the second layer shows the research approaches, the
third layer shows the research strategies, the fourth layer shows the time horizons
and finally, the core of the onion shows the methods to collect the data.
Figure 2.1 The research ‘onion’. Data from Research methods for business students, (2006),
Saunders, Lewis & Thornhill.

Methodology
9
2.2 RESEARCH PHILOSOPHY In the research philosophy there are three main processes, which explain the
philosophy of research. Those three are positivism, realism and interpretivism. A
research philosophy emphasized on positivism is based on natural science were an
experiment repeatedly show the same result. This means that the result can be
generalized (Saunders, Lewis & Thornhill 2006).
To have an interpretivistic philosophy means that you have to be critical to the
positivistic tradition. Interpretivistic researchers believe that the “social world of
business and management is far too complex” (Saunders et al., 2006 p. 106) to
draw conclusions of. The realistic research philosophy shares some aspects of
both, positivism and interpretivism. Realistic researchers believe that the true
reality is what our senses shows us, and the theory of realism states, that the
reality is independent forms our minds. (Saunders et al., 2006).
Our dissertation is based on the principles of interpretivism, since the research is
conducted in the field of organizational behaviour. The interpretivistic research
philosophy is used when the researcher wants to understand why people act as
they do in different situations. It is important that the researcher can imagine the
world from the research subject’s view. To generalize the result is not possible,
because all organizations and people are unique, which means they react
differently in different situations (Saunders et al., 2006).
2.3 RESEARCH APPROACH In the research approach there are two kinds of approaches. The first one is a
deductive approach, which according to Saunders et al., (2006) this means that a
theory and a hypotheses is developed and then tested by the research strategy. In
other words, a deductive approach simply covers testing an existing theory
through a series of experiments. According to Robson (2002) this process
includes “deducing a hypothesis", “expressing the hypothesis in operational
terms”, “testing this operational hypothesis”, “examining the specific outcome of
the inquiry” and if necessary “modifying the theory in the light of the findings”
(Saunders et al., 2006 p. 117).

Methodology
10
The second approach, which is an inductive approach, means that the researcher
tries to include the collection of data, and develop theories as a result of the data
analysis. Induction emphasizes gaining insights and understanding of the
research’s context and the meanings that humans attach to events. Furthermore, it
concerns the collection of qualitative data and a flexible research structure that
allows modifications, with a lesser emphasis on generalization (Saunders et al.,
2006).
In our dissertation we have used both a deductive and an inductive approach. Our
purpose with the research was to measure the level of trust the employees have for
the managers, in a downsized organization. We started with a literature review to
find out if there are any possible theories, which we could use to measure the
level of trust. With this as a foundation, we created our own model to be able to
measure the level of trust. In our research we used both quantitative and
qualitative data to be able to measure the level of trust. We did not generalize our
findings, since we only had one specific company where we conducted our
research.
2.4 STRATEGIES AND TIME HORIZONS
2.4.1 Strategies
Our research is an exploratory study since we want to try to find out how certain
internal factors affect trust, and how we can measure the level of trust. The
research strategy we have chosen is a single embedded case study. This means
that we are only going to conduct our research in one company and at one section
of one department. According to Saunders “a single case is used where it
represents a critical case or, alternatively, an extreme or unique case” (Saunders et
al., 2006 p.140). With this research strategy, the researcher wants to achieve a full
perceptive of the research and the processes. In addition, the case study also gives
answers to the questions why, what and how (Saunders et al., 2006). These are
questions, which represents the type of research questions we have formulated.
Methodology
11
2.4.2 Time Horizons
There are two different kinds of time horizons, cross-sectional and longitudinal
studies. A cross-sectional study is called a ‘snapshot’ approach as it involves
examining a particular phenomenon at a particular time. The longitudinal study,
are called the ‘diary’ perspective, which is a method that is stretched over longer
periods of times, providing the capacity to study change and development
(Saunders et al., 2006). Our time horizon is cross-sectional, because of the time
and the financial limitations.
2.5 CHOICE OF THEORY We started to find out what trust is in more general terms and we got into the
social behavioural science. The main task in social science is to explain social
phenomena and not single individuals’ behaviour. In the social science part, we
also mention the micro and macro level of trust. In a social system this is viewed
in two different ways depending on which level it is.
We also reviewed some of the existing literature and theories about the subject
trust. What we found was that trust is a mental state. The next step was to go
deeper into the mental state of trust and find out what it actually is. For this we
had to turn to the social cognitive theory. This theory says that a cognitive agent
can only trust another agent endowed with goals and beliefs. The mental state is
described as a complex attitude from Agent X, towards another agent Y, about its
behaviour or action, which is relevant to achieve the goal (Falcon, 2005).
When we started to conceptualize what downsizing has to do with trust, we turned
to the work written by Mishra, Spreitzer, & Mishra (1998). They argued that to
build an affective work relationship between managers and employees, when an
organization experience a crisis as a downsizing, mutual trust becomes a critical
element. Mishra (1992), identified in her research of the troubled American car
industry, four components or dimensions, that symbolises the employees’ trust for
the managers.

Methodology
12
Mishra’s research became a corner stone in our own research. From this
foundation that trust can be seen as four dimensions we started to create our own
model. With support from other theories we came to the conclusion that these four
dimensions of trust are affected by some internal factors. We also found an article
written by Ullman-Margalit (2001), which stated that trust is a spectrum of
different levels, and at one certain point an individual nether trust nor distrust.
With these researchers’ theories as a foundation, we created a model which
measures the level of trust.
2.6 SUMMARY The research process in this dissertation has followed the structure of the research
‘onion’. We chose the research philosophy based upon the interpretivistic
principle. This means, that we understand that the social world of business, and
management is too complex to draw general conclusions about. The research
approach we used was a mix of the deductive and the inductive approach.
Furthermore, we also chose a research strategy based upon the single embedded
case study strategy. Due to the time limitation and financial resources the strategy
we used was cross-sectional. The main choices of theories we used, to base our
dissertation on, were written by Mishra, and Ullman-Margalit.

The Theoretical Framework
13
3 THE THEORETICAL FRAMEWORK In this chapter we present the theoretical framework. The conceptual framework
of social science is introduced to give a theoretical foundation to our research as
well as the relationship between managers and employees. Different definitions of
trust are presented along with theories about trust and the level of trust. We will
also discuss trust in response to crisis as downsizing, as well, as what internal
factors that affects trust.
3.1. A CONCEPTUAL FRAMEWORK OF SOCIAL SCIENCE The main task in social science is to explain social phenomena and not single
individuals’ behaviour. The focus should be on the social system and its
behaviour instead. A system can differ in its size and form, if it is large or small
does not matter. What is important is that the explanatory should be focused on
the system as a unit, and not on particular individuals or components that makes
the system.
In our case, the social system is the managers and employees because together
they create one acting unit, and the social phenomenon is trust. But how, can
managers and employees be considered as an acting unit? The answer to this
question lies in the asymmetric relationship between them. Due to this
asymmetric relationship they act together as one unit instead of as two separate
and independent ones.
In social science there are two modes of how to explain the social systems’
behaviour. The first mode is a sample of cases or observation of behaviours of the
whole system during a certain period. In other words, you observe changes or
differences in a nation or on managers/employees (macro level) over time and not
the underlying factors. The second mode explains the system’s behaviour, by
examining the internal processes of the system and its elements inside, or at a
level below the system. Coleman (1994, p. 2) refers to the second mode as the
“internal analysis of system behaviour”. This mode observes the internal factors
(micro level) to explain the nation or managers/employees behaviour (macro
level). In our dissertation we are going to explain employees’ trust for managers.
Therefore, the second mode fits our purpose, because the managers/employees
(system) are changing its behaviour (trust), since the manager/employee

The Theoretical Framework
14
(individual) is the internal element in this system and these internal elements are
our research objectives (Colman, 1994).
3.1.1 The Micro to Macro Problem
One thing that has to be emphasised is that there is a major problem with the
second mode, which is known as the micro to macro problem. It is when you base
the explanation of a system’s behaviour from your findings or observations at a
level below the system. The transition between the lower levels (micro) to the
upper system level (macro) is known as a major problem throughout the field of
social science. In economics you find the same weakness in the linkage between
microeconomics and macroeconomics, and the weakness lies in the aggregation
idea and the concept of the perfect rational agent (Colman, 1994)
The figure below shows the Colman-Lindenberg diagram (Ekelund, 2002) of the
multilevel system. The upper horizontal arrow shows the macro level. Arrow 1, 2
and 3 shows the relation between macro (managers/employees) events that affect
the micro (manager/employee) level. This macro effect may change the individual
behaviour or action. Arrow 3 shows that the new change in individual behaviour
affects the macro level. Arrow 3 is what the micro to macro problem is all about.
Macro causes Macro outcomes
1 3
Micro causes 2 Micro action Figure 3:1: Colman-Lindenberg diagram (1996). Data from How to govern relationships and
establish commitments, a study of standardised products in mature industrial markets, (2002),
Ekelund, C. Copenhagen: Business School.
In our dissertation we investigate the employees’ trust in managers and therefore
the macro level in our research is represented by the managers/employees trust
and the micro level manager/employee trust. The figure above shows the three
steps that we take when we search for our answers.
The Theoretical Framework
15
3.1.2. Macro and Micro Level of Trust
In a social system trust is viewed in a different way depending on which level it
is. A macro view in trust differs from a micro one and sometimes this is called the
dynamics of trust.
In the macro level, social organizations are considered to have some influence on
trust. It can be new organizational forms, managers’ philosophies or even
technologies that affect trust. The two main questions here are: 1) “Has trust
declined?” 2) “How can trust be rebuild?”(Kramer, 1996, p. 6).
In the micro level, the psychological foundation of trust and distrust of the
individual is observed. The two main questions here are: 1) “Why do people
trust?” 2) “Why their trust declines or increases?”(Kramer, 1996, p. 6).
3.2. THE MANAGER AND EMPLOYEE RELATIONSHIP What we have argued so far is that we have to make a transition from a macro to
micro level, where our research objective is situated. Another part of our
dissertation is the relationship between managers and employees. This
relationship between an authority and an agent is of great importance, and has
been discussed in both the economic and the social theories. Therefore both need
to be addressed.
3.2.1. The Economic Perspective
In neoclassical economics the focus is on the individual and group choice, based
on a preference of the economic man. A man who is perfectly rational has, perfect
information, and maximises utility and profits. From this theory have the new
institutional economics developed. It takes into consideration, that there are
limited information, bounded rationality and opportunistic behaviour (Phil, 2005).
From this new institutional economics, has the transactional cost theory
developed. The foundation of the transactional cost analysis model (TCA) goes
back to R. Coase who argued, that a firm will continue to expand, until the cost of
doing a transaction within the firm, equals the opportunity cost of doing an
exchange on the open market. Williamson describes the TCA model as an

The Theoretical Framework
16
“examination of the comparative costs” in different “governance structures”
(Williamson, 1996, p. 58).
Basically, the transaction cost theory is about the dilemma that arises, when you
are organizing interdependencies between individuals. The cost of a transaction
depends on the price and the pecking order (Rugman & Brewer, 2001). There are
some limitations to this model, and one of them is that it ignores the internal
transactional cost within the hierarchy (Hollensen, 1998). Another theory that is
directly applicable to the managers and employee relationship is the principle
agent theory. The theory involves two parties’ one agent and one principle. The
agent acts on behalf of the principle due to a contract, which compensates the
agent to do tasks that the principal find useful, but the agent find costly. The
theory considers the problems that occur, when a principle hires an agent when
there is incomplete and asymmetric information (Wikipedia, 2006). This theory
becomes even more complex if you add the multi-tasking concept to the agency
relationship. If the agent have more then one task to do and both of them are
useful for the principle. Two problems arises, first the activities for doing both
tasks are going to “compete for the agents time and attention” (Roberts, 2004, p.
141). The second problem occurs if you can not measure the tasks separately for
performance. To solve the problem with asymmetric information, uncertainty and
risk, the theory states it can be done by motivation, or with more precisely
incentives (Roberts, 2004).
3.2.2. The Social Perspective
In social theory an authority is an agent that has the right to control another
agent’s action. The right exists only when there is a consensus among the
participants, about which agent should hold that right. In a social system a person
is regarded as free when he/she has a wide range of actions, which only he/she has
a legitimate interest in. If a person is unfree, then that person is regarded as being
a property of another agent. The law gives the other person the right to control
your actions. In a manager and employee relationship, the employee gives up the
right to decide his/her action by giving the manager the right to control, through
the law or a contract. When an agent gives up his/her right to control his/her
actions, he/she becomes a subordinate of the other. In return he/she expects to

The Theoretical Framework
17
receive compensation, or some benefits. When two equal agents’ takes form as an
authority and subordinate relationship, the relationship becomes asymmetric, in
other words, it takes the step from the micro to macro level and creates a unit or
system. In this asymmetric relationship the subordinate violates the “principle of
rational action” (Colman, 1994, p. 145), when he/she tries to maximize the
realization of the authority interests rather then his/her own. The reason for this is
as stated before that the authority holds the right to control the subordinate’s
action, due to the law or contract that exists (Colman, 1994).
3.2.3. The Law of Agents
What both the economic and social perspective states, are the importance of law
or a contract. Without this law or contract the authority/principle and
agent/subordinate relationship would not exist. The law of agency has its roots in
the set of common law precedents. As Colman (1994) stated in foundation of
social theory, “Even though the law contains conflicting precedents in many
areas, it nevertheless evolves toward an internally consistent set of principles
concerning social relationships” (Colman, 1994, p. 146). The theory is not been
set down in a concise form, but has been developed through the result from
different cases. One example is the principle of limited liability developed from
English common law; this led to a change in the social structure by creating
corporations and other associations, which are the foundations of today’s modern
society. The law of agents consist of the rights and responsibilities of the
principle, agent and the third party. But the laws central point is about the right to
control (Colman, 1994).
3.3. TRUST
3.3.1. The Mental State of Trust
According to the Oxford Advanced Learner’s Dictionary, trust is defined as “the
belief that somebody or something is good, sincere, honest etc. and will not try to
harm or deceive you” (Oxford, 2000). These words stated above which defines
trust, are the central piece in relationships between people, institutions or in other
forms of partnerships. According to the sociologist Diego Gambetta (2005), who
states that:
The Theoretical Framework
18
Trust is one of the most important social concepts that helps human agents to cope with their social environment and is present in all human interaction. In fact, without trust (in the other agents, in the organization, in the infrastructures, etc.) there is no cooperation and ultimately there is no society (Falcon, 2005).
In other words, you need trust to help you to interact with the world outside
yourself, because the world that we live in, is a world characterised by
uncertainty. Trust’s function is to convince us, that the uncertainty does not harm
or deceive us. When we are sure that the uncertainty is not a threat to us or about
the goal we want to achieve, then we can interact with the world outside.
Many trust theorists have defined the trust concept, but a general definition has
not yet been agreed upon. Reason for this is that the trust concept is used in many
different disciplines, such as economics/organizations, sociology, psychology,
computer science and socio-cognitive approach, where each discipline have
looked at the trust concept through their own lenses. When there is trust in people
or organizations then trust is referred to as behavioural trust (Nooteboom & Six,
2003). Despite differences about the definition of trust, most trust theorists can
agree about one thing, and that is that trust is primarily a psychological state
(Kramer, 1999). Kramer continues to argue that when trust is:
conceptualized as a psychological state, trust then entails a state of perceived vulnerability or risk that is derived from individuals’ uncertainty regarding the motives, intentions, and prospective actions of others on whom they depend (Kramer ,1999 p. 5) .
In other words, trust is a mental state, which regards other individuals, a risk due
to the uncertainty, which derives from the lack of information about that
individual’s behaviour, which they depend on. In the article Familiarity
confidence and trust, Luhman describes trust as “It presupposes a situation of
risk”. “You may or may not buy a used car which turns out to be a lemon”
(Luhman, 2000, p. 3). What Luhman mean is if you trust, then you accept that
there are some risks due to the uncertainty of your actions.

The Theoretical Framework
19
In the article Principle of trust for MAS, Gambetta’s famous definition of trust is
cited: “Trust is the subjective probability by which an individual, A, expects that
another individual, B, performs a given action on which its welfare depends”
(Falcone & Castelfranchi, 1998, p. 1). What Gambetta means with this definition,
is that trust is a form of prediction or an evaluation if another person would act on
a given task, which the former depends on. According to the authors of the article
this definition of trust is “quite poor”, because it only refers to “one dimension of
trust (predictability)” and not the “competence dimension” which is of great
importance for trust (Falcone et al., 1998, p. 1). With the word competence they
mean, if the trusted person (B) has the ability (skills etc) to do the task delegated.
There are many different roles in an organization, and each of them has been
given or delegated certain tasks. This phenomenon can be seen as a network of
social commitments, where everyone is committed to do something for others, but
they are also aware of that others are relying on them and delegating to them. This
reliance or delegation is a pillar of social cooperation between multi agents whose
actions are based upon beliefs, goals and a decision. (Falcone et al., 1998) This
complex mental state is what Falcone and Castelfranchi refer to as trust.
3.3.2 The Social-Cognitive Theory
Above we identified that trust is a mental state. To find out what this mental state
consists of, we turn to the social cognitive theory. Since we need to understand
how the mind works for a trusting Agent, are a cognitive structure of believes and
goals important. According to Fiske and Taylor (1991) a cognitive Agent is
defined as an Agent that can understand the social world around him/her. This
means that they have the ability to understand their own and other people’s
actions (Clegg, Hardy & Nord, 1997). First we start to explain the mental state of
trust, second the basic beliefs, third the trust-reliance, fourth, the
reliance/delegation, fifth the non-social trust and sixth the social trust. To explain
concepts and theories underneath and continuously throughout this dissertation,
manager/managers will be referred to as Agent X (the trustor) and
employee/employees will be referred to as Agent Y (the trustee).

The Theoretical Framework
20
3.3.2.1 The cognitive mental state of trust
The theory says that a cognitive agent can only trust another agent endowed with
goals and beliefs. The mental state is described as a complex attitude from Agent
X, towards another Agent Y about its behaviour or action, which is relevant to
achieve the goal. The mental state of trust consists of four core beliefs. These core
beliefs can be divided into two parts, a basic belief part and a trust-reliance part.
The basic belief part sets the mental evaluation and expectations about Agent Y.
The reliance/delegation part is crucial for actually actions on those evaluations
and expectations you have to achieve your goal. This reliance/delegation or action
is referred to as the mental counter part of trust according to Falcone and
Castelfranchi (1998), (Falcon, 2005).
3.3.2.2 Basic beliefs
If X wants to achieve his goals by using Y. X need to have some basic belief
about Y’s abilities and willingness to do the delegated tasks.
• Competence Belief (abilities, skills etc)
• Disposition Belief (willingness to act, predictability, accessibility)
Conclusion: X has to believe that Y has the skills or the abilities to act to achieve
his goals (Competence Belief). This part is what, Falcone and Castelfranchi
(1998, p. 1), referred to as the “competence dimension”. X also has to estimate or
predict if Y is willing to do the task (Disposition Belief), (Falcon, 2005).
3.3.2.3 Trust-Reliance
If X is going to trust Y he needs to delegate or rely on Y to achieve his/her goal.
The basic beliefs stated above are not enough to achieve reliance or a delegation.
At least one more belief is necessary and that is the dependence belief, because X
must believe he/she depends or needs Y to achieve the goal, otherwise X would
not trust Y. The fulfilment belief is not crucial for establishing a mental state of
trust, because X could trust Y without actually believing that the goal going to be
achieved thanks to Y.
• Dependence Belief (depend or need)
• Fulfilment Belief (“trust that” goal”)
The Theoretical Framework
21
Conclusion: X believes that he/she need or depend on Y to achieve his plan/goal
(Dependence Belief). X believes that the goal going to be achieved thanks to Y
(Fulfilment Belief), according to (Falcone et.al., 1998), (Falcon, 2005).
As we have stated above (3.3.2.1) that reliance or delegation is the mental counter
part of trust. This means that if the mental part of trust is the basic beliefs about
Y’s (abilities, willingness etc) the counter part to those basic beliefs is trust-
reliance described above. In other words, X own needs or dependencies on Y to
achieve X plan or goal.
The strict relationship between trust and reliance/delegation could be described
as: if X thinks that Y’s actions are important for him/her. Then X could start to
rely on Y to achieve his plans. This means that when X relies on Y achievements,
then X is delegating his/her own actions or goals to Y.
This delegation could be weak or strong. In a weak delegation there is no
agreement or bilateral awareness between X and Y. For example, when you sit on
a bus and your stop is coming up, you rely or delegate to some other passenger
(that do not now your intentions) to push the stop button for you. A strong
delegation is base upon Y’s awareness of the X intention to use him/her. If we
apply the strong delegation to the bus situation it could be as: if I sit in the bus but
my arms are broken, I can ask the passenger who sit in front of me to push the
button. Between us we establish a social commitment, awareness and an
agreement for me to use him/her to achieve my goal, which is to get of the bus at
my stop (Falcon et al., 1998, 2001).
3.3.2.4 Non-Social Trust and Social Trust
Non-social trust is when the trusting objectives are non-cognitive and autonomous
agents, for example a chair or car etc. In this situation the mental beliefs are the
four core beliefs stated above (Falcone et al., 1998, 2001).
Social trust is when the trusting objectives are cognitive agents, for example a
manager and an employee. In this situation, the two basic beliefs stated above will
be supported by other beliefs, such as willingness, persistence, self-confidence,
The Theoretical Framework
22
motivation and morality belief. These beliefs together with the trust-reliance part
become a wider and complex mental state of trust compared to the non-social
trust situation.
1. Self-confidence belief (Y knows that he/she can do action)
2. Willingness belief (Y decided and intends to do action)
3. Persistence belief (Y is stable in his intensions, no conflict about the
action)
4. Motivational belief (Y has some motives to do action)
5. Morality belief (Y has been sincere, is honest/truthful))
Conclusion: First, X has to believe that Y has the skills/abilities and confidence
(1.self confidence) to act to achieve his goals. Secondly, X also has to estimate or
predict if Y have decided and intend to do the task (2. willingness). Third, if Y’s
intention to do the task is stable enough and that he/she do not have any conflicts
about the task (3.persistence). Fourth, X also has to believe that Y has some
motives to do the task (4.motivational). Fifth, when Y has promised that he
intend and is committed to do the task, X has the right to believe that Y is sincere,
honest and truthful in his commitments (5. morality), (Falcone et al., 1998,
2001).
The model in figure 3.2 shows a cognitive agent’s mental state of social trust, as
we have described above. This model has been changed from its origin. We
replaced easiness with morality and trustworthiness with motivational. We did
this change to be able to present the complexity of what we presented above, in a
clear way. Trustworthiness can be seen as a motivational belief because if you
feel trusted you may have the motivation to do a task. Easiness is a form of
motivational belief as well, because if something seems easy to do, it may be a
motivation for me to do it. Therefore, both the trustworthiness and easiness can be
seen as a motivational belief. We believe that this modified model is more
significant for the mental state of social trust, due to the fact that it presents all 9
beliefs that we have described above.

The Theoretical Framework
23
Figure 3.2 shows the social trust mental state of a cognitive agent (adjusted). Data from T3 Group
homepage, (2005), Falcon, R. http://www.istc.cnr.it/T3/trust/index.html
3.4 WHAT HAS DOWNSIZING TO DO WITH TRUST? Downsizing could be defined as a reduction of a workforce through a range of
activities aimed at improving efficiency and performance in an organization
(Cascio, 1993). Downsizing has a quite wide impact on the organizational
processes. It affects both the external and internal environments in an
organization, especially its workforce. When the concept downsizing is discussed,
the employees who lose their job seems to be the ones that are most affected by
the downsizing, but the people who still remain in the organization “the survivors
and the organization itself suffer negative affect” as well (Tzafrir & Eitam-Meilik,
2005, p. 198). This negative affect has clearly some impact on the managerial
work. The researcher D’Aveni (1989) states that “Research on decision making
and crisis management shows that the decision making process becomes more
centralized in response to crises such as financial difficulties and downsizing”
(Tzafrir et al., 2005 p. 198). Mishra, Spreitzer, & Mishra (1998) argued that to
build an affective work relationship between managers and employees when an
organization experienced a crisis as a downsizing, mutual trust becomes a critical
element. Appelbaum (1999) stated that “building trust among all members of the

The Theoretical Framework
24
organization, management and employees, is one of the most critical factors in
successful downsizing operations” (Tzafrir et al., 2005 p. 198).
3.4.1 Crisis in Relation to Trust
Herman (1963) defines a crisis as a major threat to the organization, which the
organization must respond to quickly in order to survive (Kramer & Tyler, 1996).
According to this definition the reason to the downsizing is the crisis, and the
downsizing is the action for the organization to survive.
Organizations faced with a crisis react to it in a similar way. According to the
threat-rigidity effect, organizations tend to face crisis by centralising the power
and influence on decision-making. A greater concern for the organizations
efficiency will emerge and the communication complexity will reduce. As a
response on the concern of the organizations effiency the resources will be
conserved, which will lead to a higher rigidity within the organization. This threat
– rigidity affect is supported by D’Aveni (1989). He states that bankrupt firms
suffer from greater centralisation of authority and rigidness in strategies after a
crisis.
Furthermore, in research conducted by Cameron, Kim, & Whettan, (1987);
Cameron, Whetten, & Kim, (1987), about organizations facing a crisis through
decline or downsizing, several negative outcomes has been discovered. The slack
of resources, the morale among the employees, trust, innovation and upward
communication within the organization has decreased. The outcomes that have
increased are centralization, conflicts and unwillingness to take responsibility for
your own actions. Another researcher, Mishra (1992) identified four components
or dimensions of trust, in her research of managers in companies, which have
experienced a crisis. The reason for her research was that she wanted to
investigate the relationship between crisis and trust. She defines trust as: “Trust is
one party’s willingness to be vulnerable to another party based on the belief that
the latter party is (a) competent, (b) open, (c) concerned and (d) reliable”
(Kramer et al., 1996, p. 265). If we apply Mishra’s definition of trust into our
dissertation, it gets the following definition. Trust is when an employee is willing

The Theoretical Framework
25
to be vulnerable, if he/she believes that the manager is competent, open,
concerned and reliable.
3.5 THE DIMENSIONS OF TRUST
3.5.1 The Competence Dimension of Trust
The working relationship within an organization between managers and
employees is based on the employees’ belief in the managers’ competence
according to Gabarro (1987). (In the socio-cognitive theory, this is called
“competence belief”, see 3.3.2.1.1). Kirkpatric & Locke (1991) states that, the
managers’ competence to make the right decisions, and to lead the organization in
the right direction, out of a crisis is important in this dimension of trust (Kramer et
al., 1996). It is quite clear that competence has a crucial roll in a manager and
employee relationship, because if you do not know if a person has the abilities to
act, would you trust him/her?
3.5.2 The Openness Dimension of Trust
Employees’ perception of the managers’ openness and honesty are important
according to Gabarro (1987). Interviews with managers conducted by Mishra
(1992) stated, it is crucial that the employees believe that the managers tells them
the truth, and understand the things they are talking about. Kirkpatrick & Locke
(1991) states that managers, who are perceived as honest by the employees,
promote and implement changes and innovations more effectively. It is also much
easier for them to attract followers, which believe in and understand the necessity,
of the changes and innovations (Kramer et al., 1996).
3.5.3 The Concern Dimension of Trust
Managers can demonstrate concern in different ways. One manager, which
Mishra (1992) interviewed said:
I think the trust factor is that you have the best interest of the people at
heart, and that they believe in what you’re trying to do,[…] if they feel
that you really care[...] My single objective is to make sure that those
people have a livelihood, a future, so that they can take care of those
families. That’s all part of this trust issue (Kramer et al., 1996 p. 268).

The Theoretical Framework
26
This statement can be referred to as the basic beliefs and trust reliance part of the
mental state of trust, we talked about in 3.3.2.2 and 3.3.2.3 (Falcone et.al., 1998,
Falcon, 2005).
According to Kanter (1977, 1983, 1989), managers can demonstrate their concern
by proving that the only thing they care about, is the organizations future and the
employees’ job security. Kotter & Schlesinger (1979) states, managers which
implement an organizational change will be evaluated by the employees, to see if
the change has any positive or negative affect, on the employees’ welfare and
interest. Barber (1993) and Ouchi (1981) state, to trust someone to be concerned
about you, is the same thing as believe that the other person not will act
opportunistic. Opportunistic behaviour means that a person will take unfair
advantages of another person and not been concerned about that persons interests.
The meaning of concern is not to act opportunistic, this means that your own and
other interests have equal value (Kramer et al., 1996). Basically, what has been
described and cited above equals the Oxford Dictionary’s (2000) description of
trust that if you trust, you “will not try to harm or deceive”, (Oxford Dictionary,
2000, p. 1393) in other words you are concerned about my welfare.
3.5.4 The Reliability Dimension of Trust
In this dimension is trust defined as consistency and reliability from the managers
(Kramer et al., 1996). According to McGregor (1967), Ouchi (1981) and Swan
(1988), has the history of the managers actions a great impact on trust. If there has
been inconsistency between what the managers have said, and the action taken
from him/ her, the level of trust will decrease. This dimension involves also the
employees’ expectations about consistent and / or reliable behaviour from the
managers, based on actions made in the past (Kramer et al., 1996). For example,
if X deliver a task to Y with the same positive outcome over and over again, then
Y would begin to trust X. Why? Because X shows that he/she are consistent with
his/her actions (path dependent) and that Y’s expectations about the delivered task
are confirmed. X becomes reliable in Y’s mind and now trusts X.

The Theoretical Framework
27
3.5.5 Summary of Dimensions of Trust
Each of these four dimensions; competence, openness, concern and reliability are
parts of the entire trust. For example, it is possible to have trust in the managers’
competence, and at the same time have distrust in the managers’ reliability,
openness and concern. To trust someone does not mean to have full trust in all
dimensions. It is possible to trust and distrust the same person in different
situation without say that I trust him / her or I distrust him / her according to
Mishra (1992), (Kramer et al., 1996).
3.6 INTERNAL FACTORS WHICH AFFECTS TRUST It takes a lot of time and effort to build and maintain trust in an organization. On
the other hand it can take only one second, one bad decision or action from the
managers to destroy the trust among the employees (Ford, 2006). It is the
managers’ responsibility to create trust in the organization. A lack of trust is a
failure for the managers not for the employees (Hunchak, 2006).
There are both internal and external factors that affect trust in an organization.
External factors can be described as influence from the environment outside an
organization or a relationship. The external factors can both be of physical and
psychological nature (Corntore, Kracher & Widenbeck, 2003). On the other hand,
the internal factors can be described as influence from the environment inside an
organization or a relationship (Kim, Dirks, Cooper & Ferrin, 2006). Positive and
negative internal factors for building and remaining trust are stated below.
3.6.1 Competence
For employees to trust the managers is the same thing as have faith in their
competence to lead their part of the organization. Mayer & Davis (1999) states,
employees must believe that the managers have knowledge, influence, impact and
capability to do what is necessary. This is a subjective factor, since it is depending
on the trustee’s opinion on what the managers’ competence should exist in
(Albrecht, 2002).
3.6.2 Teamwork
Teamwork and cooperation between different levels in an organization can have a
positive impact on the employees’ trust in the managers (Hunchak, 2006).

The Theoretical Framework
28
Managers which encourage teamwork, create a “we-feeling” within the
organization. Employees feel that they are involved in working for the same goal
as the managers and that the managers trust them (Nooteboom et al., 2003). The
employees’ experience from participating in this before is an important
determining factor (Hunchak, 2006). What has happen in the past in the relations
within the organization has an impact on the future trust (Albrecht, 2002).
3.6.3 Communication
A well functioning communication between managers and employees is a key for
gaining trust and confidence in both directions. It is very important that the
managers listen to their employees at all levels in the organization (Ford, 2006).
An open climate without any fear for the managers is good for the communication
in the organization (Hunchak, 2006).
In an organization which has recently downsized it is important that the managers
get the information to all levels, and make sure that the employees interpret it
correct, according to Crosby (1984), (Darling et al., 1995). To send out
information in a correct way is not easy, there are a lot of things that can go
wrong. According to the communication process model there are several factors
that can disturb or influence the original message. The communicator has to
encode the message/idea into words/symbols. Then the message/idea has to be
transmitted in a certain way that fits the target audience best. During this
transmission there are distractions or distortions called “noise” that may have
influenced the original message. When the receiver gets the message it has to be
decoded. An important thing for a communicator is to understand there target
audience before encoding the message, otherwise it could lead to rejection,
disbelief or distrust (Jobber & Fahy, 2006). The figure 3.3 below shows the
communication process described above.

The Theoretical Framework
29
Source Encoded
Message Transmission
Decoded Message
Receiver
Feedback
Noise
Noise
Figure 3.3 shows. The communication process model Data from, Foundation of
marketing (2006), Jobber et al.
3.6.4 Integrity
Mayer and Davis (1999) state, the employees’ opinion about the managers
integrity has an affect on trust. If the managers share the same principles and
values as the employees, and the actions from managers show that these things are
important, increases the employees’ trust in the managers. The most important
things in managers’ integrity are when the managers build / maintain trust with
caring for the employees’ well-being and when the managers are honest,
consistent, fair and in an open way share information with the employees
(Albrecht, 2002).
3.6.4.1 Employees Well-being
Managers can demonstrate that they care about the employees’ well-being by
showing empathy and give extra support to the employees who need it, during the
downsizing period. This is important to be able to keep the employees committed
to the organization. The managers can also work persistent to fulfil their
obligations against the organization and its employees. By doing this they work
for the employees’ well-being, by trying to secure that they have a job to go to,
and get paid for the work they done (Darling et al., 1995).
3.6.4.2 Honesty and Openness
Managers are honest when there is openness about the information. Correct and
appropriate information should be given to employees in time from the managers.
The Theoretical Framework
30
This is particular important if the managers believe that the organization is
standing in front of a crisis (Nooteboom et al., 2003). Butler & Cantrell (1984)
state, openness from the managers is measured as the willingness to share
information with the employees (Nooteboom et al., 2003). The exchange of
information creates trust but only information can never be trust (Fukuyama,
1995).
3.6.4.3 Consistency
Butler & Cantrell (1984) conclude that characteristics for a consistent manager
are reliability, predictability and good judgement. A manager which prove good
judgement in handling different situations demonstrate to be reliable and
predictable (Nooteboom et al., 2003).
3.6.4.4 Fairness
Alexander & Ruderman (1987) state, employees who feel that the managers treat
them fair when it comes to salary, layoffs and promotions are more satisfied with
their job situation and the trust in the managers is higher. It is also important that
the employees feel that the managers treat all the similar employees in the same
way and not favour anyone (Cooper & Rousseau 1995).
3.6.5 Uncertainty
Downsizing is considered to be the most ultimate factor, which destroys trust
among employees. Employees fear that the managers will make poor evaluations
about their work and this will lead to further redundancies (Hunchak, 2006). An
uncertain environment within the organization where nobody knows what will
happen, is a factor which destroys the trust for managers (Cho, 2006).
3.6.6 Opportunistic Behaviour
Opportunistic behaviour is a factor, which destroys trust for the managers among
the employees. Managers act opportunistically when they have “inside”
information, which they use in a way, which is positive for them, but negative for
the organization and the employees (Nooteboom et al., 2003).

The Theoretical Framework
31
3.6.7 Positive and Negative Internal Factors
Competence, communication, teamwork and managers integrity is factors which
have a positive impact on trust, but only if they are perceived positive by the
employees. Otherwise these factors could have equally a negative impact on trust.
We could say that with the former factors, it is all in the eyes of the beholder if it
is positive or negative. A factor that has a negative impact on trust is opportunistic
behaviour, because it violates the social trust created. The uncertainty factor on
the other hand has two sides. One side have a negative impact on trust as we
described above (3.6.5.). The other side works as an opposite of trust, this is
described in the mental state of trust. (3.3.1.).
3.7 DISTRUST Several researchers have recognized that distrust and suspicion are common
problems in many organizations. Grovier (1994) describes distrust as a lack of
confidence in another party, and as a concern that another party maybe is hostile
and act harmfully towards you. This distrust can be triggered by situations as
forewarnings that somebody is dishonest, when expectations are violated or when
one realises that the counterparty has an ulterior motive with his actions. (Kramer
1999). To be able to explain the emergence of distrust, we have to start from a
point with mutual trust between two parties. Let’s pretend that the two parties, X
and Y, have established mutual trust between each other. Then X acts in a way
which is perceived by Y as an violation of the mutual trust. This creates both
emotional and cognitive reactions for Y. The emotional reaction creates feelings
as anger, hurt, fear and frustration. These emotional reaction forces Y to reassess
his feelings for X. The cognitive reactions on the other hand, forces Y to evaluate
how important the violation is, and to find out who was responsible for the
emerged situation. Although Y may have distrust for X, does it not mean that they
no longer interact with each other. Interactions between people are possible, even
if they distrust each other (Kramer, 1996).
3.8 LEVEL OF TRUST
3.8.1 The level of trust and distrust
An individual can trust someone but it does not mean that he does not distrust. If I
distrust you, which means that I do not trust you. But, if I do not trust you then it

The Theoretical Framework
32
must mean that I distrust you? So if I trust you, does it mean that I not trust you?
Not necessarily. Sometimes you do not have answers to why you trust an
individual or distrust him. So that is why you can trust or distrust someone
without it has to mean that you always trust or distrust him. In other words, the
distinction between the above is the level of reasons why you either trust or not.
That is why not-to-trust and not-to-distrust is pointed out in the trust-distrust gap.
The gap between “not to distrust” and “not to trust” is referred to as the “No-
man’s-land”, which represents a range of reasons comprising neither to trust or
distrust (Ullman-Margalit, 2001).
The figure 3.4 shows the trust-distrust gap described by Ullman-Margalit (2001)
above. The left side shows distrust and the right side trust, the gap in the middle
represents the area when you neither trust nor distrust.
Figure 3.4 shows the trust-distrust gap. Data from Trust, Distrust and in between (2001), Ullman-
Margalit. E.
Theoretically we could reach the left- and the right side of the trust-distrust gap so
called ‘full trust’ and ‘full distrust’. Companies with full trust indicates well
orientated communication between manager, employees and managers; reliance
on each individual, reliance on task performance and willingness of telling and
sharing the information without any consideration on competition between
managers and employees. Companies with full distrust indicate the lack of belief
to act on the best interests of the company. Internal negative competition,
uncertainty and communication are on reliance level which means no one trust
anyone. Each individual seeks what is best for their own interest and this affects
the company’s foundation and its existence (Ullman-Margalit, 2001).
In theory every impossible thing is possible that is why a company can reach both
full trust and full distrust as stated above. But in the empiric world the ‘full trust’

The Theoretical Framework
33
and ‘full distrust’ does not exist. Imagine yourself a company without any internal
problem everything in the work is running smoothly and everyone are happy,
truthfully and trustfully to each other 24 hour a day and 365 days in year,
impossible equation which is a dream for every CEO´s in companies around the
world. Then imagine the opposite, a company with ‘full distrust”. There are lack
of communication and interest between managers and employees. The company is
struggling as well with the information dilemma, which means that everyone has
the information, but no one is aware of it. There is also tough competition within
the company, which leads to the survival of the fittest (Ullman-Margalit, 2001).
In reality, to actually measure the level of trust and finding out if you have
acquired full trust/distrust or not are completely irrelevant. It may even be an
impossible task to do. Because, what is actually full trust/distrust? And is full
trust/distrust the same for every moment or situation? How do you now when
trust is maximized? What actually is relevant and possible to do is to find out
where the level of trust is at the moment, in the trust distrust gap.
3.9 SUMMARY We began this chapter with the conceptual framework of social science. This gave
us a comprehensive view of our research, and what the main weaknesses are in
social science research. The relationship between manager and employee was
viewed from an economic and a social perspective. What those perspectives have
in common is the law of agent, and that laws main point discusses the question
about who has the right to control. We searched for an answer about what trust
actually is. We found that trust is defined in many different ways depending on
which area your research belongs to, but what almost every researcher can agree
upon is that trust is a mental state. To get a deeper understanding of what the
mental state of trust is, we chose the socio-cognitive theory to explain the mental
ingredients of trust. We also wanted to find out what downsizing or a crisis has to
do with trust. When an organization experiences a crisis like downsizing, trust is
an important part for the organization, and its survivors, to be able to build a
successful future. We also stated how organizations react in response to a crises
and how trust could be defined for an organization experiencing a crisis.

The Theoretical Framework
34
Each one of the four dimensions of trust that was defined was described. The
internal factors that affect trust positively or negatively were described. We
introduced the trust-distrust gap and explained that it is not about trust or distrust,
it is on the contrary it is about the level of trust.

Constructing The COCR-Model
35
4 CONSTRUCTING THE COCR-MODEL This chapter presents how we created the COCR-model. First, there is a
discussion about which internal factor that belongs to each dimension. Second,
there is a description about how to combine the trust-distrust gap with the COCR-
model. Finally, there is an explanation of how to measure the level of trust with
the COCR-model.
4.1 THE CONSTRUCTION OF THE COCR-MODEL To be able to measure the level of trust in an organization, we had to construct a
model of our own; the COCR-model (C= Competence, O= Openness, C =
Concern and R= Reliability). The model consists of the four dimension described
above; competence, openness, concern and reliability. These dimensions represent
the beliefs the employees need to have for the managers, when being vulnerable
as they are in a downsizing process. The factors affecting trust and the
corresponding dimensions will be presented below.
4.1.2 The Competence Dimension
The competence dimension consists of the factors competence and teamwork. The
competence dimension of trust is a part of the working relationship that exists
between managers and employee (Kramer et al., 1996). For the employee it is
important to have faith in the managers’ competence to lead the organization. The
employee must know or believe that the managers have the crucial skills and the
ability necessary, to run the organization (Albrecht, 2002).
The managers cannot run the organization itself. Teamwork and cooperation
within the organization are necessary for the organization to survive. The
managers’ ability to encourage and manage teamwork and cooperation among the
employees is another measure of the manager’s competence to run the
organization (Hunchak, 2006; Nooteboom et al., 2003).
4.1.3 The Openness Dimension
The openness dimension consists of the factors, honesty, openly share information
and communication. This dimension indicates that the managers should be honest
about the situation the organization is in (Kramer et al., 1996). Honesty and the
managers’ willingness to openly share information with the employees, are two

Constructing The COCR-Model
36
parts of the managers’ integrity, which is a factor affecting this dimension of trust
(Albrecht, 2002). Honesty is about being open and willing to share appropriate
and correct information with the employees (Nooteboom et al., 2003). By
measuring the perceived willingness from the managers to openly share
information, from the employees’ view, indicates how honest the managers are.
To be able to openly share information with the employees, good communication
is necessary (Ford, 2006). If the communication between managers and
employees is not good, the employees can interpret the message the wrong way. If
this happens, it does not matter how honest and open the managers are. The
employee would still interpret the message the wrong way, which may lead to an
incorrect view of the managers (Darling et al., 1995). A situation like this might
decrease the trust (Jobber et al., 2006).
4.1.4 The Concern Dimension
The concern dimension consists of the factors employee well-being, fairness and
opportunistic behaviour. In this dimension the employees evaluates whether the
managers cares about the organization’s future, and at the same time, the welfare
of the employees. It is also important that the managers demonstrate that they are
concerned about the employees’ well-being at work (Kramer et al., 1996).
Managers’ concern for the employees’ well-being and fairness are the two factors
in the manager’s integrity (Albrecht, 2002) that influence the concern dimension.
Caring for the employees’ well-being can be to give extra support to those who
need it during the downsizing period (Darling et al., 1995). Being treated fairly by
the managers (Cooper et al., 1995) also has an influence on the concern
dimension. These are measures of how valuable the managers believe the
employees are, from the employees’ view. If the managers consider them to have
low value for the company, the concern for them is probably low. This can be
reflected on the level of trust the employees have for the managers. If the
employees feel they are not valued, they also have little trust in the managers. The
concern for the employees welfare can the managers demonstrate by work hard
for the organizations survival, which means they can continue to provide work for
the employees in the future (Darling et al., 1995). For the employees it is also
important to trust the managers to act in a way that is favourable for the company,
and not only for the managers’ personal interest. In other words, the employees

Constructing The COCR-Model
37
trust the managers not to act opportunistically (Nooteboom et al., 2003). This is a
measure of how much the manager’s care about the company and the employees’
welfare and in the end, this will be a reflection of the employees trust in the
managers.
4.1.5 The Reliability Dimension
The reliability dimension consists of the factors uncertainty and consistency. This
dimension focuses on the manager’s consistency and reliability, based on what
have happened in the past in the organization (Kramer et al., 1996). Consistency
is a part of the manager’s integrity, which is one of the factors affecting trust. If
the managers have demonstrated to be consistent and reliable in the past, then will
the managers be perceived as predictable, and probably be it in the future to
(Nooteboom et al., 2003). The level of the manager’s consistency has an impact
on the uncertainty within the organization. An uncertain work environment where
nobody knows what will happen within the organization in the future, decrease
the employees’ trust in the managers (Cho, 2006). Consistent managers will
decrease the uncertainty among the employees (Nooteboom et al., 2003). By
measuring the perceived consistency from the managers, and the uncertainty
among the employees, the level of reliability can be determined. In the figure 4.1,
the link between the internal factors, the four dimensions and the total trust is
presented in the COCR-model.
Figure 4.1 shows the relationship between internal factors, the four dimensions and trust in the
COCR-model.

Constructing The COCR-Model
38
4.2 COMBINE THE TRUST-DISTRUST GAP WITH THE COCR-MODEL In our dissertation we have found out that there are internal factors, which affect
trust in the organization. By linking each internal factor to a specific dimension of
trust, which together with the other dimensions represents the total trust. Then we
will get the COCR model in figure 4.1. Which shows that the dimensions of trust
are a part of the whole trust and those internal factors affects the four dimensions
of trust. We will conduct an inquiry survey at our case company, Swedish Meats
in Kristianstad. In this survey we will ask questions concerning the internal
factors mentioned above in the COCR model. Every question will be evaluated by
points, the higher the point is, the higher trust within the organization and the
lower the point is, the lower trust (distrust) in the organization. The answers will
be linked to the dimensions of trust so every question belongs to one of the four
dimensions of trust. This represents the trust in the organization. By using a
statistical program we will be able to measure the mean value for the questions in
our survey. Then it will be possible to point out the measured result in our
adjusted version of the trust-distrust gap.
The figure 4.2 shows the adjusted version of the trust-distrust gap. With this
adjusted version of the trust-distrust gap, we can set out the level of trust mesured
by the COCR-model.
Figure 4.2 shows the adjusted version of the trust-distrust gap. Data from Trust, Distrust and in
between (2001), Ullman-.Margalit. E.
The only change from the original gap is that “not-to-trust” and “not-to-distrust”
is now represented by the line in the middle, which means that neither you trust or
distrust. As it was said before the max point will show that there is full trust in the

Constructing The COCR-Model
39
organization. The lowest point will show that there is full distrust in the
organization.
As can be seen in the figure 4.2, the trust-distrust gap has a scale between 1 and 7,
were each step has a grade: neither trust nor distrust, some trust/distrust, almost
full trust/distrust and full trust/distrust. To overcome the problem with a value that
is located between two grades, we will estimate the level of trust by using the
general principle in mathematics. In other words to round of the value in question
to almost the closed integer, as shown below:
Little distrust 3. 50 to 3. 99 Little trust 4. 01 to 4. 49
Some distrust 3. 49 to 2. 49 Some trust 4. 50 to 5. 49
Almost full distrust 2. 50 to 1. 49 Almost full trust 5. 50 to 6. 49
Full distrust 1. 50 to 1. 00 Full trust 6. 50 to 7. 00
4.2.1 How to Measure with the COCR-model
As been stated above trust consists of four dimensions. Each dimension consists
of several factors that affect trust. These factors will be measured by questions
scaled from 1 to 7, where 1 is full distrust and 7 is full trust, except for the
negative factors, uncertainty and opportunistic behaviour. The scales of these
factors have to be turned around when we make the calculations. This means that
when the respondent answers the questions about uncertainty and opportunistic
behaviour, full distrust will be 7 instead of 1. To solve this problem we will use
the recode function in SPSS. This means for example, that we give the full
distrust value in opportunistic behaviour or in uncertainty the value 1 instead of 7.
The mean value measurement will be used in each step in our model, to avoid the
“comparable problem” with different sums of variables. The mean value in the
trust-distrust gap is 4, which mean neither trust nor distrust. The mean value is 4,
due to the design of the questionnaire, where 4 is equal to neither agree nor
disagree.

Constructing The COCR-Model
40
Instructions to measure trust in the COCR-model
1. Calculate the total in each question. ( 2+2+2+2 = 8 question’s total)
2. Divide the questions total by the amount of answers (on the same question) to
get a Mean value (8 / 4 = 2 question’s mean value)
3. Ad the mean values from the questions to each specific factor.
(Remember that the factors can have more than one question)
(2+2 = 4 factor’s total)
4. To receive the mean value of each factor, divide the value of the total factors
with the amount of questions that belongs to the factor. (4 / 2 = 2 factor’s
mean value)
5. To receive the level of trust in each dimension, ad all mean values from the
factors and divide it with the amount of factors.
(2+2 = 4 / 2 = 2 one dimension of trust)
6. To receive the total level of trust, ad all mean values from the dimensions and
divide it by four (the amount of dimensions).
(2+4+6+8 =20 / 4 = 5 total trust)
The total level of trust is now measured where 1 is equal to full distrust, 4 is equal
to neither distrust nor trust and 7 is equal to full trust.
4.3 SUMMARY In this chapter the COCR-model is constructed. The model consists of the four
dimensions of trust, competence, openness, concern and reliability. Each
dimension consists of different internal factors affecting trust. The competence
dimension consists of the factors competence and teamwork. The openness
dimension consists of the factors communication, honesty and openness. The
concern dimension consists of the factors employee well-being, fairness and
consistency. The reliability dimension consists of the factors uncertainty and
opportunistic behaviour. The purpose with the model is to be able to measure the

Constructing The COCR-Model
41
level of trust the employees have for the managers. The level of trust is measured
by the points the internal factors affecting trust score in the questionnaire. The
mean value is then calculated to find out the total level of trust. The total level of
trust is presented in the modified trust-distrust gap, where 4 is equal to neither
trust nor distrust, 1 is equal to full distrust and 7 is equal to full trust.

Case Company – Swedish Meats
42
5 CASE COMPANY – SWEDISH MEATS In this chapter we present our case company. First, the meat sector in Europe is
introduced. Second, the Swedish Meats Commercial Enterprise is presented.
Finally, we present Section Q where we conducted a part of our case study.
5.1 THE MEAT SECTOR IN THE EUROPEAN UNION In the European Union agriculture sector, the meat sector is considered to be one
of the most important ones. The reasons for this are that meat has for a long time
been vital for the European diet and because of that it has become a central part of
European cuisine and culture. The meat sector consists of farmers, farmer
cooperatives, abattoirs and companies involved in distribution and marketing of
livestock and products. Half of all EU farms have livestock and this kind of
farming stretches throughout the whole EU. Many of them are specialised in
different types of meat productions (Leguen De Lacroix, 2004).
5.1.1 The Pig Meat Sector
EU is after China the second largest producer of pig meat in the world, with a
production of 17.8 million tonnes per year. The increased production in the late
1990s caused a decrease in market prices, but since then the production has
stabilised, and the prices are now on a healthier level. Pig production and
consumption are expected to keep growing but at a lower rate than in the 1990s.
Over time, the pig meat market has faced some unexpected events, that have had
certain consequences and influenced the sectors evaluation some periods. For
example, the BSE scare in the beef sector, which increased the demand for other
kinds of meat, mainly poultry but the pig meat sector profited as well from it.
Another event that disturbed the sector was the outbreak of foot and mouth
disease. This caused restrictions in movements of livestock and several export
bans by third countries, created problems in slaughtering and sales (Leguen De
Lacroix, 2004).

Case Company – Swedish Meats
43
5.1.2 Limited EU assistance
The EU’s pig producers are restricted when it comes to the EU assistance. What
they are allowed to do is a private storage aid, when the circumstances in the
market demand it. This means that pig meat is withdrawn from the market with
help from an EU subsidy. In other words, the EU pig producers do not meet the
requirements for aids payments from the EU. The producers are dependent on the
market price and therefore the competition among the pig producers is severe. But
what the producers indirect benefits from, is what reduces prices of cereals and
other feed ingredients (Leguen De Lacroix, 2004).
5.2 SWEDISH MEATS COMMERCIAL ENTERPRISE
5.2.1 Swedish Meats and its Owners
Swedish Meats is one of the largest food groups in Sweden and it is owned by its
22 500 Swedish farmers, which makes it an incorporated association. Swedish
Meats is engaged in a comprehensive trade of livestock, but the animals for
slaughtering are supplied by the members (farmers) of the association. These
members have therefore a substantial interest and commitment in the association
both as owners and as suppliers of animals. Swedish Meats organization gives all
owners a democratic influence and opportunity to affect the company’s
development. The association is divided in 19 regions, each region have their own
counsel which is chosen by the owners in that region. At the association’s annual
meeting the delegates are chosen from each regional counsel to represent their
region at summon. The associations summon is the top instance for decision
making (Levin, 2006; Mobärg, 2006).
The figure 5.1 shows what has been described above, the ownership and its
democratic structure. Since it is translated from Swedish into English, it is not
looking exactly as the original chart that can be collected on Swedish Meats
Homepage.

Case Company – Swedish Meats
44
Figure 5.1 shows the ownership and the organizations democratic structure in English. Data from
About Swedish Meats, (2006), Mobärg, H. www.swedishmeats.se
5.2.2 Swedish Meats commercial enterprise
Swedish Meats Commercial Enterprise consists of a mother association, Swedish
Meats Co and a couple of subsidiaries and jointly owned companies. In the
Swedish Meats Co, the production is integrated with the sales and marketing of
consumer products under the brand Scan. Swedish Meats propose decentralisation
of responsibility and authority, and their philosophy is that decisions shall be
made as close to the customer as possible.
The Swedish Meats Commercial Enterprise consists of a small group of enterprise
personnel, where the overall functions are gathered. This allows the Swedish
Meats Co to concentrate on the core business and let the enterprise’s personnel
take care of the strategic questions about the future, as partnerships, acquisitions
or organizational design etc. The enterprise personnel coordinate the commercial
enterprise’s subsidiaries.
Swedish Meats Commercial Enterprise’s head office is situated in Stockholm.
4060 employees’ works wihtin the enterprise, 25% of them are women and 75 %

Case Company – Swedish Meats
45
men. 77% are collective employed employees and 23% are employed officials.
Within Swedish Meats the co-worker is viewed as one of the major asset for the
enterprises development. By purposefully invest in the development of the
enterprise leadership, as basic and additional training for production staff, a
personally development program for future managers and specialists,
management development program and other forms of work and service training
(Levin, 2006; Mobärg, 2006).
The organizational chart in figure 5.2 shows the over all structure of Swedish
Meats Commercial Enterprise.
Figure 5.2 shows the over all structure of Swedish Meats Commercial Enterprise in English. Data
from About Swedish Meats, (2006), Mobärg, H. www.swedishmeats.se
5.2.3 Swedish Meat Co
The Swedish Meats Co has a comprehensive view on the businesses and its focus
is on the core business. This means that the whole value chain is gathered
underneath one “roof”, from purchase of animals, planning, quality and
environment, production, marketing and sales. The company also has the
responsibility to develop the brand name Scan (Levin, 2006; Mobärg, 2006).

Case Company – Swedish Meats
46
The organizational chart in figure 5.3 shows Swedish Meats Co organizational
structure and its functions.
Figure 5.3 shows Swedish Meats Co organizational structure and its functions in English. Data
from About Swedish Meats, (2006), Mobärg, H. www.swedishmeats.se.
5.2.4 Scan Foods AB
Scan Foods AB market and sales butchered meat, cured meat and provisions, as
well as, ready cooked meals under the brand name Scan. Scan Foods is a
marketing and sales company within the Swedish Meats Commercial Enterprise.
Because of the special owner structure, they have full control over the whole
value chain from breeding to customer and this is one of the most important core
competencies and competitive advantages they have. Another valuable
competence, due to this owner structure is the long-term co-operation with some
of the leading meat research institutes in the world (Levin, 2006; Mobärg, 2006).
5.2.5 Swedish Meats Kristanstad
In Swedish Meats facilities in Kristianstad, works 810 employees, 95 % are
collective employed employees and 5 % are employed officials. In this factory,
they slaughter 987 844 pigs and 20426 sows a year, the total in tons are 87 739.
This facility’s slaughter capacity is 2 times 260 to 360 pigs an hour and the end

Case Company – Swedish Meats
47
products in cured meat and the provisions are, sausages, Christmas ham, smoked
ham etc.
During 2003 Swedish Meats invested 60 million SEK in the facilities in
Kristianstad to improve and extend the butcher and provision production. This led
to an increased improvement of production, safety, quality and work ergonomics.
This investment did not lead to any increase in employments. But the Kristianstad
facility lost 30 employees due to rationalisation in distribution, sales and
administration. Swedish Meats board also decided 2003 that they would save
substantial costs by moving production of pig slaughter form their facility in
Linköping to Kristianstad, Skara and Uppsala. This cost saving program led to a
decrease of 200 employees in Linköping, and an increase of 80 employees in
Kristianstad, Skara and Uppsala together.
Swedish Meats in Kristianstad continued to rationalise its facilities in 2006 by
closing the hygiene department and put it out on contract instead. 31 of the
employed cleaners choose to stay with Swedish Meats, to wait and see what the
result of the order of priority negotiations said. This had of course an affect on all
departments at the facilities in Kristianstad. The earlier planned rationalisation of
slaughter and butcher department was also carried out and lead to a loss of 50
collective employed employees and one employed official. During this period
there have been other rationalisations as well and the facilities in Kristanstad have
during a period of 5 years been living under a downsizing threat.
Moreover, in October 2006, the board decided to co-ordinate the production of
slaughter, butcher and consumer packed meat. The facility in Helsingborg will be
closed and all the slaughter and butcher production will be moved to Kristianstad.
In addition to that, the facility in Kävlinge will be closed as well and all the
provision production will be moved to the other provision facilities in the
enterprise. Altogether, 100 new jobs are created in the facility in Kristianstad
(Levin, 2006; Mobärg, 2006).

Case Company – Swedish Meats
48
5.2.5.1 Swedish Meats Kristianstad Section Q
We have promised the employees at Section Q total anonymity in our dissertation.
Therefore, we can not name the place or section where they work as well as what
kind of production they work with. Instead we will refer to this part of the
production department as Section Q. Section Q has been downsized in two turns
during the recent year. The staff went from 66-23 employees due to the
downsizing. The first time 11 and the second time 10 of the downsized employees
were transferred to other sections at the production department. During this
period, Section Q also went from working in a two shift cycle to one shift. The
reason for this downsizing was that the production was transferred to Linköping
(Levin, 2006).
5.3 SUMMARY The meat sector in the EU is one of the most important sectors, and the EU is the
second largest producer of pig meat in the world. The pig meat sector has been
affected in both a positive and negative way due to certain events, which has
caused some fluctuation in the market. The pig producers are restricted when it
comes to EU assistance or subsidises. Therefore, the market price is vital for the
pig producers and this causes severe competition among the producers. Swedish
Meats is one of the largest food groups in Sweden and it is owned by its 22 500
Swedish farmers, which makes it an incorporated association. The Commercial
Enterprise consists of the mother association, Swedish Meats Co and several
subsidiaries and jointly owned companies. The Swedish Meats Commercial
Enterprise consists of a small group of enterprise personnel, where the overall
functions are gathered. This allows the Swedish Meats Co to concentrate on the
core business and let the enterprise personnel take care of the strategic questions
about the future, as partnerships, acquisitions or organizational design etc. The
enterprise personnel coordinate the commercial enterprise’s other subsidiaries.
Scan Foods AB owns the brand name Scan, which is a marketing and sales
company within the Swedish Meat Commercial Enterprise. On of Swedish Meats
production facilities are situated in Kristianstad. The last years has the factory in
Kristianstad been rationalised and lost several of its employees. Section Q where
we did our research have lost 50 % of its staff and changed their production from
two shifts to a one shift, due to the downsizing.

Empirical Method
49
6 EMPIRICAL METHOD This chapter describes the research strategy. The population, the questionnaire
and the interviews with the middle managers are described. The
operationalisation is presented and the response rate is calculated. The chapter
ends with a discussion about the dissertations reliability, validity and
generalisability.
6.1 RESEARCH STRATEGY The aim with our dissertation was to find out if it was possible, to measure the
level of trust employees have in their managers, in a downsized organization. We
also wanted to find out what internal factors that affect employees’ trust managers
work with, during a downsizing process.
To answer our research questions, we started with an extensive theoretical review.
From this theoretical foundation, we created the COCR- model to be able to
measure the level of trust employees have in their managers, in a downsized
organization. A case study was conducted at one section of a department at
Swedish Meats in Kristianstad, which recently had downsized 50 % of its
employees. A case study is a good method if you want to explain a particular
situation. In this case it was the trust the employees had for the managers, in a
downsized organization. In a case study, the researcher gets deeper answers on the
questions why, what and how (Saunders et al., 2006). Since we wanted to
compare the outcome from the survey of the employees, and the answers from the
middle managers, a case study was the best research strategy for our dissertation.
A case study can be single or multiple. In a multiple case study the researcher
studies several cases, to be able to generalise the result. A single case study is
conducted when the researcher studies one unique case (Saunders et al., 2006).
Due to several threats the past 4-5 years to downsize Section Q, we believed that
it would be a unique case to study. Due to the Section Q’s unique history, the time
limit and the geographical closeness of two or more firms in the same industry
with a similar background, we decided to conduct a single case study. To collect
all the necessary data to our dissertation, a triangulation technique was used.
Triangulation means that more then one technique was used to collect the data,

Empirical Method
50
and it also increased the chance that the “data are telling you what you think they
are telling you” (Saunders et al., 2006 p.139). We used a combination of semi-
structured interviews with the middle managers, involved with the downsizing
process, together with a survey among the employees at the downsized section.
Some criteria were set before the search of company. The first criterion was that
the company must have finished a downsizing process within the past twelve
months. The first reason to this criterion was that the managers had been involved
with the executing of the downsizing, and that the survivors at the downsized
department or section still worked at the company. The second reason was that the
employees had experienced the downsizing process recently, which means that
the possibility that they remembered what happened during the downsizing
process would be higher. The second criterion was that the downsizing should
have had a significant impact on at least one section of a department. Our
definition of a significant impact is that at least 25% of the employees of a
department or a section had to leave, due to the downsizing. The number of
employees at the section or department before the downsizing had to be at least
50. The reason we chose these numbers as a minimum, was because if 12 people
disappear from a workforce of 50, the change would be significant enough to
make an impact on the “survivors”.
To find companies with these criteria we used the Internet search engine Google.
When we had found a company, which fulfilled the criteria we phoned the
company’s switchboard, and asked to be connected to the right person. When we
got in touch with the right person we gave a short explanation of what we wanted,
and asked if they were interested to participate in our case study. If they were
interested we immediately sent an introduction letter, with further information
about our case study, by e-mail to the person we talked to. The reason we sent the
e-mail immediately was to give all information at one time and keep the interest
up with the contact person. After two days we phoned again to find out if they
were still interested. The reason we waited two days, was to let them have a
chance to talk to their managers, and to find out if there was an interest among the
employees to participate. Swedish Meats were interested to participate in our case
study, so we booked a meeting with the contact person at Swedish Meats. At the

Empirical Method
51
meeting we discussed how to conduct the questionnaires among the employees,
and the interviews with the managers without interrupting the production. We also
got the opportunity to ask questions about the company, which we used when we
constructed, the questionnaire and interview questions.
6.2 THE POPULATION The population we aimed the questionnaire to, were all the “survivors” at the
downsized section. If the entire population consisted of less than 50 cases, then it
would be best to collect data from the entire population (Henry 1990); Saunders et
al., 2006). Since there only remained 23 employees at the downsized section, we
decided not to sample the population. Our contact person at Swedish Meats
helped us to get in touch with the “survivors” at the downsized section. Due to the
LAS, which is a law protecting the employees’ job security in Sweden, the
downsizing affected employees at other sections of the department as well. But
those employees are not in our population due to the limited time.
We also interviewed three middle managers at Swedish Meats in Kristianstad.
Two of them worked daily with the employees at the downsized section. One of
these two has recently got a new post as manager at another section of the
department. The third work with administration at the administration department.
All of them where involved with executing the downsizing. Our contact person at
Swedish Meats helped us to get in touch with these three managers.
6.3 THE QUESTIONNAIRE To collect data from the “survivors” at the downsized section we used as
mentioned above a questionnaire. It is good to use a questionnaire when the
research is explanatory with standardised questions (Saunders et al., 2006). When
constructing the questionnaire, we choose the words in each question very careful.
It is important to write questions, which only can be interpreted in one way by all
respondents. Our intention was to conduct a pilot study of the questionnaire. Since
we could not make a pilot study at Swedish Meats, due to their limited time, and
we did not have access to another similar company, where we could conduct a
pilot study, we had to ask some friends how they perceived the questions. This
had of course a negative effect on the reliability of the survey. We were aware of
this and considered it when we made the conclusions.
Empirical Method
52
The questionnaire consisted of 45 questions, which were divided in 5 sections.
The first section consisted of general questions about the employees. The second,
third and fourth sections consisted of questions about each manager we
interviewed. Each of these sections consisted of the same questions about each
manager. The fifth section consisted of questions about the general work
environment. Of 45 questions were 38 rating questions. We used the Likert-style
rating scale with 7 alternatives, where the respondents indicated how strongly
they agreed or disagreed (Saunders et al., 2006). Question number 7-41 and 43-45
were rating questions. 5 questions were list questions, which mean that the
respondent filled in one of the alternatives. If you are unsure whether the list is
complete, it is possible to ad a category called “other” (Saunders et al., 2006).
Question 1-2 and 5-6 were list questions. Question 5-6 did we ad the category
other, since we were unsure if the list was complete. 2 questions were open
questions (Saunders et al., 2006), since we wanted exact answers. Questions 3-4
were open questions. 1 question was a filter question, which means that only the
respondents who answered yes should fill in the following question. Question 42
was a filter question for question 43. We only used one filter question since the
respondents could easily get annoyed, when they have to skip answering certain
questions (Saunders et al., 2006).
Since the survey was conducted in a Swedish firm the questions were written in
Swedish. The questionnaire was translated to English in the dissertation. To be
sure that the translation was correct, we asked an English teacher to check the
grammar in the questions.
The questionnaire was self-administrated, which means that the respondent filled
in the answers themselves (Saunders et al., 2006). To hand out the questionnaires
we visited the downsized section of the department during a short production
stop. Our contact person had informed the employees about our visit at a staff
meeting, so we were expected. The employees were separated in two rooms so we
took one room each. We started with introducing ourselves and explained what
we wanted to achieve with the questionnaire and the dissertation. To increase the
response rate, we made sure that everybody understood that all answers would be

Empirical Method
53
treated anonymous. Then we delivered the questionnaire. The same information
was also written in the beginning of the questionnaire, in case somebody would be
late, so everybody would receive the same basic information. Since we delivered
the questionnaires ourselves, we made sure that the right persons filled in the
questionnaires. We were also available to answer any questions they had during
the time they filled in the questionnaire. This increased the reliability of the
survey.
6.4 THE INTERVIEWS To collect data from the middle managers, semi-structured interviews were
conducted. Since we wanted the interviews to be more like a conversation, to
make the respondents feel more relaxed, we choose to conduct semi-structured
interviews. A semi-structured interview is, when the researcher has a list of
questions, which will be covered during the interview. The order and the way the
questions are asked can vary from interview to interview. Questions might also be
added during the interview, depending on the flow and content of the
conversation (Saunders et al., 2006).
The number of prepared questions was between 13-15 questions depending on
who the middle manager was. Then we had follow up questions on some
questions depending on the answer. The interviews were mixed with open,
probing, specific and closed questions. Open questions let the respondent develop
and freely answer questions about a specific situation. Probing questions are used
when the researcher ask a further question based on an answer from the
respondent. By doing this the researcher try to gain a deeper understanding of
what the respondent mean with the answer. Specific and closed questions are used
when the researcher would like to receive specific information or confirm facts or
opinions (Saunders et al., 2006). It is not possible to pinpoint which interview
question that belongs to each category of question. Since we used semi-structured
interviews the questions are not in the same order, or asked in the same way,
which makes it impossible to set a number on them.

Empirical Method
54
Since the interviews were conducted in a Swedish firm the questions were asked
in Swedish. The interview questions and the answers are translated to English in
the dissertation.
The interviews were conducted at a conference room at Swedish Meats in
Kristianstad, which made it more convenient for the respondents. All interviews
were audio-recorded and notes were taken in case the audio-recording would be
damaged. The middle managers were interviewed individually, and each
interview took between 15-20 min. To increase our credibility to the respondents,
we began the interviews with introducing ourselves and explain what our
dissertation was about. We also explained that all answers would be anonymous
and we asked if it was okay that we recorded the interview. Then we started with
some “warm up” questions to make them feel relaxed and to try to gain their
confidence, before we asked more delicate questions. The following questions we
asked were based on the questions in the questionnaire, to make it possible to
compare and analyse them. Since we wanted it to be more like a conversation, to
make them talk freely, some questions were asked differently and in a different
order. The awareness of not asking any leading questions was high during the
interviews. We also tried to stay as neutral as possible with our body language
when the respondent answered the questions. To make sure that we interpreted the
answers correct we shortly summarized the answers directly afterwards. This also
gave the respondents a chance to develop the answer further.
6.5 OPERATIONALISATION To be able to measure the level of trust employees have in their managers in a
downsized organization, we created a questionnaire. The respondents indicated
their answers on the questions about different factors affecting trust, on a Likert-
style rating scale, with seven alternatives (Saunders et al., 2006). These answers
would then be put into the COCR-model, which measure the level of trust. The
level of trust would then be compared with the managers’ answers from the
interviews, to see if the level of trust reflected the managers’ work, with creating
or maintain trust among the employees.

Empirical Method
55
6.5.1The Questionnaire-questions
Questions 1 to 4 were asked to find out about the respondents background at
Swedish Meats. Question 4 was asked to make sure that the respondent had been
working at the section before, during and after the downsizing.
Questions 5 to 7 were asked to find out the general level of communication
between managers and employees. Question 8 to 10, 19 to 21 and 30 to 32 were
asked to find out how the communication between each manager and employee is.
Question 11, 22 and 33 were asked to find out how honest and open each manager
is, about sharing information to employees. It is how the employees perceive this,
we intended to measure.
Question 12, 23 and 34 were asked to find out to what degree the employees
perceive each manager to be consistent.
Question 13, 18, 24, 29, 35 and 40, were asked to find out whether each manager
are perceived to care about the employees well-being at work.
Question 14, 25 and 36 were asked to find out if the employees feel that each
manager treat them fairly.
Question 15 to 16, 26 to 27 and 37 to 38 were asked to find out how competent
the employees think that the managers are to fulfil their work.
Question 17, 28 and 39 were asked to find out whether the employees think that
each manager act opportunistic.
Questions 41 to 43 were asked to find out if the employees consider themselves to
work as a team.
Questions 44 to 45 were asked to find out the general level of uncertainty among
the employees.

Empirical Method
56
6.5.2 The Interview-questions
The questions we asked the managers during the interviews reflected the
questions in the questionnaire, so we would be able to compare the results. The
interview questions were also asked in a way that we would be able to answer
research question four. Since we conducted semi-structured interviews (Saunders
et al., 2006), the questions were asked in different ways. Only the prepared
interview questions, not the follow-up questions are stated below.
The questions “how long have you worked here” and “what jobs have you had
within the company” were asked to get some background information about the
managers.
The question “what part did you play in the downsizing process” was asked to
find out what relation the managers had to the employees during the downsizing
process.
To receive information about how the managers work, with the factors affecting
the competence dimension of trust, we asked the following questions: “did you
have any experience about downsizing” and “what possibilities do you have to
increase your competence, does the company invest in courses for you that helps
you in your work as manager”. These questions were asked to find out what kind
of experience the manager had about previous downsizings. We also wanted to
find out if they had taken any courses in management to increase their
competence.
The questions “how involved are you with the employees at Section Q” and
“when you worked as a manager at Section Q did you work as a team, did you
experience any team feeling”, were asked to find out if the managers think it is
important to be involved with the employees’ work. We also wanted to find out if
the managers try to encourage teamwork at Section Q to create a “we-feeling”
among the employees.
To receive information about how the managers work the factors affecting the
openness dimension of trust, the question: “how did you inform about the
downsizing” was asked. We wanted to find out how the managers inform the
Empirical Method
57
employees about important things, which affect the employees and the company.
We also wanted to find out if they are open and willing to share information with
the employees.
To receive information about how the managers work with the factors affecting
the concern dimension of trust, the following questions were asked. The questions
“during your time as a manager for Section Q, what did you do to make the
employees feel OK during and after the downsizing process”, “what did you do to
make the employees feel OK during and after the downsizing process” and “could
every employee at Section Q come and talk openly about how he / she felt about
the situation” were asked to find out if they care about the employees well-being
at work when there is an organizational change process going on. The questions
“what do you do to make the employees feel that they are treated fair by you “
and “was the employees treated fair during the downsizing process, did somebody
get any advantages” were asked to find out how they treat the employees.
To receive information about how the managers work with the factors affecting
the reliability dimension of trust, the following questions were asked. The
question “what did you do to decrease the uncertainty among the employees for
changes within the company during the downsizing period” was asked to find out
what they do to make the employees worry less about the future, during an
organizational change. The question “when you inform the employees about
changes are you absolute sure that this will be executed” was asked to find out if
the manager are consistent with what they say and do. The question “how do you
make sure that the information about downsizing or organizational changes come
to the employees first from the managers and not from media” was asked to find
out the willingness to share information about the company to the employees in a
correct way.
We did not ask the managers any questions about opportunistic behaviour. The
reason for this was that we believed that we would not get any honest answers.

Empirical Method
58
6.6 THE RESPONSE RATE The numbers of employees in our population were 23. Everyone in the population
was at work the day we conducted the survey, so everyone filled in the
questionnaire. In two of the questionnaires were only a few questions answered.
Since we needed an answer on all the questions, to be able to draw as correct
conclusions as possible about the level of trust, we considered these 2
questionnaires as refusal to respond. Since the questionnaire was anonymous we
did not know which respondents who did not fill it in correct. This gave us no
chance to ask them to fill it in again.
The total response rate is the total number of responses, divided with the total
number in sample, minus the ineligible (Saunders, et al., 2003).
Total response rate = 21 = 91 %
23
The active response rate is the total number of responses, divided with the total
number in sample, minus (the ineligible plus the unreachable (Saunders, et al.,
2003).
Active response rate = 21 = 91 %
23
We have not conducted an analysis of the no responses since we only got two of
them. The reason to why they did not answered all the questions, could we only
speculate in. Thus, we were satisfied with a total and active response rate of 91 %.
6.7 RELIABILITY Reliability is whether or not the result will be consistent, if the research will be
conducted in the exact same way again by other researchers (Saunders et al.,
2006).

Empirical Method
59
There are threats to the reliability when conducting a questionnaire. One threat is
participant error. Employees have different levels of enthusiasm during a working
week. Due to this can the result vary (Saunders et al., 2006). We did not have any
possibility to influence what day the employees should fill in the questionnaire,
since they would do it during a planned production stop.
The questionnaire was filled in Thursday afternoon, which means that they might
have been “on a high looking forward to the weekend” (Saunders et al., 2003, p.
149). Another threat to the reliability can be that the respondents interpret the
questions wrong (Saunders et al., 2006). Since we did not conduct a pilot study at
Swedish Meats, this is a threat to the reliability in our dissertation. Participant bias
is also a threat to the reliability. This means that the respondents answer the
questions wrong due to different reasons (Saunders et al., 2006). For example
they might want to give a more positive or negative picture of the situation. Since
we supervised the employees when they filled in the questionnaire, we are certain
about that the right respondent filled in the answers individually. This increased
the reliability of the survey.
There are threats to the reliability when it comes to semi-structured interviews,
which we have conducted in our dissertation. Semi-structured interviews are a
good method when the research subject is dynamic and complex. Since trust is
mental state which can change rather quickly, there is a possibility that the
reliability is not high, and that other researchers conducting the same research will
not get the same result. The reason to this is that the questions and the answers
reflect the situation at the time we conducted the research. Since we conducted
semi-structured interviews, we did not ask the questions in the same order to all
respondents. This had a negative impact on the reliability. On the other hand we
believed that we would get much more information using semi-structured
interviews. A problem that exists irrespective of which kind of interview form is
being used is that the respondents might lie. This is called participant bias, and the
reason to this can be that the organization is “characterised by an authorial
management style” (Saunders et al., 2003, p. 149). Another reason can be fear of
being unemployed, if they do not say what the boss wants them to say. Participant
bias can be decreased by promise them total anonymity (Saunders et al., 2006),
Empirical Method
60
which we did in the beginning of each interview. Another problem is the
interviewer bias. This exists when the interviewer reveal with the body-language
or voice of tone what they think about the answers (Saunders et al., 2006). During
the interviews we tried to stay as neutral as possible to increase the reliability.
6.8 VALIDITY Validity is about whether there is a casual relationship between two variables or
not. To be valid the findings must be what they appear to be (Saunders et al.,
2006). Threats to validity can be things that happened just before the survey
(Saunders et al., 2006). Our aim was to find out the level of trust in a downsized
organization. The week before we conducted our research, the management had
taken a decision to move production from another company in the group of
companies, to the section we did our research at. This had an impact on the
validity of our questionnaire since the respondents might have a more positive
attitude then the week before. This was something that we could not calculate
with, since nobody except from the management knew what was going to happen.
Another threat to validity is that the questions might not measure what the
researcher thinks they measure (Saunders et al., 2006). Most of the questions in
the questionnaire were about the managers and how the employees perceived their
actions in different situations. The mental state of the respondents can have had an
effect on the answers on these questions in the questionnaire. Some of the
respondents might have a disagreement in the past or recently with one or more
managers. This could be reflected in the answers. This has a negative impact on
the validity.
The validity of interviews is about the interviewers’ access to the respondents’
knowledge and experience. It is also important that the interviewer interpret the
respondent’s language correct. Semi-structured interviews have a high validity
since there is an interaction between the interviewer and the respondent. Due to
this it is possible for the interviewer to cover all angles about the topic (Sykes
1991; Saunders et al., 2003). Since we conducted the interviews more like a
conversation, we got the opportunity to receive comprehensive answers to our
questions. Since we managed to cover the topic from different angles with our

Empirical Method
61
questions, we are quite sure that the data from the interviews were what they
appeared to be.
6.9 GENERALISABILITY Generalisability means that the research result should be applicable to all
populations, in the same field of research (Saunders et al., 2006). Since we
conducted a single case study with a small number of samples, we cannot
generalise the result. The aim was not to generalise, instead we wanted to try to
explain a particular situation at a certain time, in one company.
6.10 SUMMARY The research strategy for our dissertation was presented in this chapter. To get a
deeper understanding of our research problem we choose to conduct a case study.
To be able to answer two of our research questions, we conducted semi-structured
interviews with three middle managers, and a questionnaire was handed out,
among the “survivors” at the downsized department Section Q, at Swedish Meats
in Kristianstad. The questions in the questionnaire and the interview questions
were described, and the response rate of the questionnaire, which is 91 %, was
calculated. The reliability, validity and generalisability of the survey, were
discussed in the end of the chapter.

Result of the Survey
62
7 RESULT OF THE SURVEY In this chapter we present the result of our case study. First, there is a description
of how we analysed the data from the questionnaire. Second, we present the result
of the questionnaire for each manager in each dimension, as well as, the total
trust in Section Q. Finally, answers from the interviews are presented under each
factor affecting trust.
7.1 BACKGROUND TO THE ANALYSIS To analyse the questionnaires we used the computer program SPSS. With SPSS
we calculated the mean value, the confidence interval and the p-value by doing a
one sample t-test. These three measurements were the ones we used to analyse the
internal factors, and the dimensions, to finally establish the level of trust for
Section Q. Most of the data from our questionnaire were qualitative data. This
kind of data has above all two main qualities that we wanted to measure, namely
the average of observations and the spread around of that average (Kröner &
Wahlgren, 2002). Before we could start to analyse our data we had to find out if it
was normally distributed. Data could be considered normally distributed if a
variable’s mean value and median are close to each other and if the standard
deviation is less then half of that variable’s mean value (Gunnarson, 2002). We
calculated the median and the standard deviation in SPSS and found that all of our
data in the questionnaire were normally distributed, see appendix 4.
The mean value is a measure of the sum of all the observed values divided with
the number of observations (Kröner et al., 2002). The mean value is the measure
we used in our model to calculate trust.
The confidence interval is a measure of the probability to find a populations real
mean value, within a certain interval from the mean value in our spot test. Small
confidence interval tells us that our spot test can predict the underlying
populations real mean value with great certainty. (Gunnarson, 2002). We used a
95% confidence interval, which means that 95 out of 100 times, the mean value
will be within the confidence interval.

Result of the Survey
63
The p-value is a measure that indicates the probability for the observed result,
given that the null hypothesis is true. A low p-value means that the null
hypothesis can be rejected and the alternative hypothesis could be regarded as
most likely (Gunnarson, 2002). The statistical significance level for the p-value is
to be at 0, 05%, which means that if the p-value is less than 0. 05% the null
hypothesis can be rejected or the alternative hypothesis has a 0. 00 to 0. 05%
chance to be incorrect. To test the p-value we used the test value 4, which means
that we tested the probability that the mean value was higher than 4. If the p-value
is below the significance level 0. 05%, then the null hypothesis can be rejected
and our hypothesis H1 is more likely to be true. In other words, its less than 5 %
chance that employees feel distrust towards the managers.
Our hypothesis is that when an organization has downsized the employees
distrusts the managers. But since SPSS could not do a p-value test that considered
values that were 4 and less, we had to make a hypothesis with an opposite
meaning than the one stated above, to be able to do a p-value test. This idea about
making a hypothesis with an opposite meaning was approved by a teacher in
statistics, Pierre Carbonnier 10 of November 2006. The reversed hypothesis (H1)
is:
• H1 When an organization has downsized the employees trust the
managers.
7.2 THE QUESTIONNAIRE 21 employees answered the questionnaire, of them are 61. 9 % women and 38.
1% men. 42. 9% of those 21 employees are between 36- 45 years old, 28. 6 % are
over 46 years old. 19. 0 % is between 26-35 years old and only 9. 5 % are under
25 year old. The average years worked in the company are 12. 9 years and the
average years worked in section Q are 9. 29 years. 75. 2 % of the employees are
informed about the downsizing through a staff meeting and 23. 8 % are informed
by the media. 57. 1 % says that they were informed of the downsizing by
Manager B, 23. 8% by Manager A, 9. 5 % by Manager C and 9. 6 % by another
person.

Result of the Survey
64
The other questions in the questionnaire were analysed in relation to the
managers, the internal factors and the four dimensions. We used our COCR-
model to present the level of trust in each step, until we reach the total trust the
employees had for Manager A, Manager B and Manager C. The reason why we
call them Manager A, Manager B and Manager C is because we promised them
total anonymity. Manager A and Manager B worked at the production together
with the employees during the downsizing process. Manager C worked at the
administrative department.
7.2.1 Manager A
7.2.1.1 Competence Dimension
In the Competence dimension for Manager A, the only internal factor that is
analysed is the competence, since the other factor teamwork applies to all
managers. Due to this, teamwork has to be disregarded from analysing Manager
A’s competence. The table 7.2.1.1 shows Manager A’s competence dimension.
Table 7.2.1.1 The Competence Dimension of Manager A Internal Factors Mean Confidence interval P-value Lower Upper Competence 4. 60 3. 89 5. 30 0. 475 Total Competence 4. 60 3. 89 5. 30 0. 0475
The competence factor is measured by questions 15 and 16. The mean value is
4. 60 and the confidence interval is between 3. 89 and 5. 30. This means that the
employees trust Manager A to some extent, that Manager A has some competence
to do his job. But since the lower part of the interval is less than 4, it means that
there is a chance that within this 95% interval, there is a probability that the
employees can have some distrust for Manager A. The p-value is below the
significance level, this indicates that H0 could be rejected and that there is a 4.
75% chance that the employees have distrust of Manager A. In other words, its
more likely that the employees have trust in Manager A (H1). Manager A’s total
competence is the same as for the competence factor.

Result of the Survey
65
7.2.1.2 Openness Dimension
In the openness dimension for Manager A, the internal factors that are analysed
are communication, honesty and openness. One question is excluded in the
communication factor and that is question 7, because it applied to all managers.
Therefore it has been disregarded from the communication factor. The table
7.2.1.2 shows Manager A’s openness dimension.
Table 7.2.1.2 The Openness Dimension of Manager A Internal Factors Mean Confidence interval P-value Lower Upper Communication 4. 65 4. 02 5. 28 0. 0215 Honesty & Openness 4. 33 3. 51 5. 15 0. 2030 Total Openness 4. 49 3. 83 5. 15 0. 0680
The communication factor is measured by the questions 8, 9 and 10. The mean
value is 4. 65 and the confidence interval is between 4. 02 and 5. 28. This means
the employees trust Manager A to some extent, that Manager A have the abilities
to communicate. The p-value is below the significance level, this indicates that H0
can be rejected and that there is a 2. 15% chance that the employees have distrust
of Manager A. In other words, it is most likely that employees have some trust in
Manager A (H1).
The factor honesty and openness is measured by the question 11. The mean value
is 4, 33 and the confidence interval is between 3. 51 and 5. 15. This means that
the employees have little trust that Manager A is honest and open when sharing
information with them. But since the lower part of the interval is less than 4, and
the mean value is quite close to 4. 00, it means that there is a chance that within
this 95% interval there is a probability, that the employees can have some distrust
for Manager A. The p-value is over the significance level, this indicates that H0
cannot be rejected and that there is a 20. 03% chance that the employees have
distrust of Manager A. Therefore we cannot say how likely it is that the
employees trust Manager A (H1).

Result of the Survey
66
Manager A’s total mean value in the openness dimension indicates that the
employees have some trust in Manager A’s abilities to communicate and to be
open and honest about sharing information. But according to the confidence
interval, there is a chance that employees have distrust. The p-value is over the
significance level. This indicates that H0 cannot be rejected and that there is a
6. 80% chance that the employees have some distrust of Manager A. Therefore
we cannot say how likely it is that the employees trust Manager A (H1).
7.2.1.3 Concern Dimension
In the Concern dimension for Manager A, the internal factors that are analysed are
employees’ well-being, fairness and opportunistic behaviour. The table 7.2.1.3
shows Manager A’s openness dimension.
Table 7.2.1.3 The Concern Dimension of Manager A Internal Factors Mean Confidence interval P-value Lower Upper Employee Well-being 5. 40 4. 90 5. 91 0. 0000 Fairness 4. 62 3. 70 5. 55 0. 0895 Opportunistic behaviour 4. 52 3. 64 5. 41 0. 1150 Total Concern 4. 84 4. 41 5. 29 0. 0005
The employee well-being factor is measured by the questions 13 and 18. The
mean value is 5. 40 and the confidence interval are between 4. 90 and 5. 91. This
means the employees trust Manager A to some extent, that Manager A cares about
their well-being, and stand up for them in Section Q. The p-value is below the
significance level. This indicates that H0 can be rejected and that there is less than
0. 00% chance, that the employees have distrust of Manager A. In other words it
is very likely that employees have some trust in Manager A (H1).
The fairness factor is measured by question 14. The mean value is 4. 62 and the
confidence interval are between 3. 70 and 5. 55. This means the employees trust
Manager A to some extent, that Manager A treats them fair compared to other

Result of the Survey
67
employees with similar experience. But since the lower part of the interval is less
than 4, it means that there is a chance that within this 95% interval, there is a
probability that the employees can have some distrust for Manager A. The p-value
is over the significance level. This indicates that H0 cannot be rejected and that
there was an 8. 95% chance that the employees have distrust of Manager A.
Therefore we cannot say how likely it is that the employees trust Manager A (H1).
The opportunistic factor is measured by question 17. The mean value is 4. 52 and
the confidence interval is between 3. 64 and 5. 41. This means the employees
distrust Manager A to some extent, that Manager A acts opportunistically, in other
word, that he makes some decisions based on what is best for him. Since the
lower part of the interval is less than 4, it means that there is a chance that within
this 95% interval, there is a probability that the employees can have some trust for
Manager A. The p-value is over the significance level. This indicates that H0
cannot be rejected, and that there is an 11. 50% chance that the employees have
some trust in Manager A. Therefore, we can not say how likely it is that the
employees distrust Manager A (H1).
Manager A’s total mean value in the concern dimension indicates that the
employees have some trust in Manager A’s concern for them. According to the
confidence interval there is no chance, that employees have some distrust within
the interval. The p-value is below the significance level. This indicates that H0 can
be rejected and that there is a 0. 0005% chance, that the employees have distrust
of Manager A. Therefore we can say it is most likely that the employees have
trust in Manager A (H1).
7.2.1.4 Reliability Dimension
In the Reliability dimension for Manager A, the only internal factor that is
analysed is consistency, since the other factor uncertainty, applies to all managers.
Due to this, the factor uncertainty has to be disregarded when analysing Manager
A’s reliability. The table 7.2.1.4 shows Manager A’s reliability dimension.

Result of the Survey
68
Table 7.2.1.4 The Reliability Dimension of Manager A Internal Factor Mean Confidence interval P-value Lower Upper Consistency 4. 57 3. 80 5. 34 0. 0685 Total Reliability 4. 57 3. 80 5. 34 0. 0685
The consistency factor is measured by question 12. The mean value is 4. 57 and
the confidence interval are between 3. 80 and 5. 34. This means the employees
trust Manager A to some extent that Manager A is consistent between with what
he says and what he does. The p-value is over the significance level, this indicates
that H0 cannot be rejected and that there is a 6. 85% chance that the employees
have distrust of Manager A., Therefore, we cannot say how likely it is that the
employees trust Manager A (H1). Manager A’s total reliability is the same as for
the consistency factor.
7.2.1.5 Total trust for Manager A
The total trust for Manager A consisted of the four dimensions analysed above.
Together these dimensions symbolises the total trust for Manager A. The table
7.2.1.5 shows the total of Manager A’s four dimensions and trust.
Table 7.2.1.5 Summary of the Dimensions of Trust for Manager A Dimensions Mean Confidence interval P-value Lower Upper Competence 4. 60 3. 89 5. 30 0. 0475 Openness 4. 49 3. 83 5. 15 0. 0680 Concern 4. 84 4. 41 5. 29 0. 0005 Reliability 4. 57 3. 80 5. 34 0. 0685 Total Trust 4. 62 4. 10 5. 15 0. 0115
The total trust for Manager A is measured by the four dimensions. The mean
value is 4. 62 and the confidence interval is between 4. 10 and 5. 15. This means

Result of the Survey
69
that the employees have trust to some extent in Manager A. The p-value is below
the significance level. This indicates that H0 can be rejected and that there is
1. 15% chance, that the employees have distrust of Manager A. In other words it
is very likely that employees have trust in Manager A (H1).
7.2.2 Manager B
7.2.2.1 Competence Dimension
In the Competence dimension for Manager B, the only internal factor that is
analysed is competence, since the other factor teamwork, applies to all managers.
Due to this, the factor teamwork has to be disregarded when analysing Manager
B’s competence. The table 7.2.2.1 shows Manager B’s competence dimension.
Table 7.2.2.1 The Competence Dimension of Manager B Internal Factors Mean Confidence interval P-value Lower Upper Competence 5. 69 5. 09 6. 29 0. 0000 Total Competence 5. 69 5. 09 6. 90 0. 0000
The competence factor is measured by question 26 and 27. The mean value is
5, 69 and the confidence interval is between 5.09 and 6. 90. This means the
employees almost have full trust, that Manager A has some competence to do his
job. The p-value is below the significance level. This indicates that H0 can be
rejected and that there are less than 0.00% chance that the employees have distrust
of Manager B. In other words it is very likely, that employees almost have full
trust in Manager B (H1). Manager B’s total competence is the same as for the
competence factor.
7.2.2.2 Openness Dimension
In the openness dimension for Manager B, the internal factors that is analysed are
communication, honesty and openness. One question is excluded in the
communication factor and that is question 7, because it applies to all managers.
Therefore it has been disregarded from the communication factor. The table
7.2.2.2 shows Manager B’s openness dimension.
Table 7.2.2.2 The Openness Dimension of Manager B

Result of the Survey
70
Internal Factors Mean Confidence interval P-value Lower Upper Communication 4.89 4. 44 5. 34 0. 0005 Honesty & Openness 4. 67 3. 97 5. 36 0. 0295 Total Openness 4. 78 4. 29 5. 26 0. 0015
The Communication factor for Manager B is measured by the question 19. 20 and
21. The mean value is 4. 89 and the confidence interval are between 4. 44 and
5. 34. This means the employees trust Manager B to some extent, that Manager B
has some abilities to communicate. The p-value is below the significance level.
This indicates that H0 can be rejected and that there is a 0. 05% chance, that the
employees have distrust of Manager B. In other words it is most likely that the
employees have trust in Manager B (H1) .
The factor honesty and openness is measured by the question 22. The mean value
is 4. 67 and the confidence interval are between 3. 97 and 5. 36. This means the
employees trust Manager B to some extent, that Manager B is honest and open
when sharing information with them. Since the lower part of the interval is less
than 4, it means that there is a chance that within this 95% interval, there is a
probability that the employees can have little distrust for Manager B. The p-value
is below the significance level. This indicates that H0 can be rejected and that
there is a 2. 95% chance, that the employees have distrust of Manager B. In other
words, it is most likely that employees have some trust in Manager B (H1).
Manager B’s total mean value in the openness dimension indicates that the
employees have trust to some extent in Manager B’s abilities to communicate and
to be honest and open when sharing information. According to the confidence
interval there is no chance that employees have some distrust within the interval.
The p-value is below the significance level. This indicates that H0 can be rejected
and that there is a 0. 15% chance that the employees have distrust of Manager B.
Therefore we can say it is most likely that the employees have some trust in
Manager B (H1).

Result of the Survey
71
7.2.2.3 Concern Dimension
In the Concern dimension for Manager B, the internal factors that are analysed are
employees’ well-being, fairness and opportunistic behaviour. The table 7.2.2.3
shows Manager B’s openness dimension.
Table 7.2.2.3 The Concern Dimension of Manager B Internal Factors Mean Confidence interval P-value Lower Upper Employee Well-being 5. 23 4. 66 5. 82 0. 0000 Fairness 4. 86 3. 97 5. 75 0. 0290 Opportunistic behaviour 3. 24 2. 39 4. 09 0. 0380 Total Concern 4, 44 3, 96 4, 93 0, 0350
The internal factor employee well-being is measured by question 24 and 29. The
mean value is 5. 23 and the confidence interval are between 4. 66 and 5. 82. This
means the employees trust Manager B to some extent, that Manager B cares about
their well-being and stands up for them in Section Q. The p-value is below the
significance level. This indicates that H0 can be rejected, and that it is less than 0.
00% chance that the employees have distrust of Manager B. In other words it is
very likely that employees have some trust to Manager B (H1).
The fairness factor is measured by question 25. The mean value is 4. 86 and the
confidence interval are between 3. 97 and 5. 75. This means the employees trust
Manager B to some extent, that Manager B treats them fair compared to other
employees with similar experience. Since the lower part of the interval is less than
4, it means that there is a chance that within this 95% interval, there is a
probability that the employees can have little distrust for Manager B. The p-value
is below the significance level. This indicates that H0 can be rejected and that it is
2. 90% chance that the employees have distrust of Manager B. In other words it is
very likely that employees have some trust in Manager B (H1).
The opportunistic factor is measured by question 28. The mean value is 3. 24 and
the confidence interval are between 2. 39 and 4. 09. This means the employees
distrust Manager B to some extent that Manager B acts opportunistically. In other

Result of the Survey
72
words, makes some decisions based upon what is best for him. The p-value is
below the significance level. This indicates that H0 can be rejected and that it is a
3. 80% chance, that the employees have some trust of Manager B. In other words
it is very likely that employees have some distrust in Manager B (H1).
Manager B’s total mean value in the concern dimension indicates that the
employees have little trust in Manager B’s concern for them. According to the
confidence interval there is a chance that employees had little distrust. The p-
value is below the significance level. This indicates that H0 can be rejected and
that there is a 3. 50% chance, that the employees have distrust of Manager B.
Therefore we can say it is most likely that the employees have some trust in
Manager B (H1).
7.2.2.4 Reliability Dimension
In the Reliability dimension for Manager B, the only internal factor that is
analysed is consistency, since the other factor uncertainty, applies to all managers.
Due to this, the factor uncertainty has to be disregarded when analysing Manager
B’s reliability. The table 7.2.2.4 shows Manager B’s reliability dimension.
Table 7.2.2.4 The Reliability Dimension of Manager B Internal Factors Mean Confidence interval P-value Lower Upper Consistency 4. 81 4. 07 5. 55 0. 0170 Total Reliability 4. 81 4. 07 5. 55 0. 0170
The factor consistency is measured by question 23. The mean value is 4. 81 and
the confidence interval are between 4. 07 and 5. 55. This means the employees
trust Manager B to some extent that Manager B is consistent with what he says
and what he does. The p-value is below the significance level. This indicates that
H0 can be rejected and that there is 1. 70% chance, that the employees have
distrust of Manager B. In other words it is more likely that employees have some
trust in Manager B (H1).

Result of the Survey
73
7.2.2.5 Total trust for Manager B
The total trust for Manager B consists of the four dimensions analysed above.
Together these dimensions symbolises the total trust for Manager B. The table
7.2.2.5 shows the total of Manager B’s four dimensions and trust.
Table 7.2.2.5 Summary of the Dimensions of Trust for Manager B Dimensions Mean Confidence interval P-value Lower Upper Competence 5. 69 5. 09 6. 29 0. 0000 Openness 4. 78 4. 29 5. 26 0. 0015 Concern 4. 44 3. 96 4. 93 0. 0350 Reliability 4. 81 4. 07 5. 55 0. 0170 Total Trust 4. 93 4. 43 5. 43 0. 0005
The total trust for Manager B is measured by the four dimensions. The mean
value is 4. 93 and the confidence interval is between 4. 43 and 5. 43. This means
the employees trust Manager B to some extent. The p-value is below the
significance level. This indicates that H0 can be rejected and that there is 0. 05%
chance, that the employees have distrust of Manager B. In other words it is more
likely that employees have some trust to in Manager B (H1).
7.2.3 Manager C
7.2.3.1 Competence Dimension
In the Competence dimension for Manager C, the only internal factor that is
analysed is the factor competence, since the other factor teamwork, applies to all
managers. Due to this teamwork has to be disregarded when analysing Manager
C’s competence. The table 7.2.3.1 shows Manager C’s competence dimension.

Result of the Survey
74
Table 7.2.3.1 The Competence Dimension of Manager C Internal Factors Mean Confidence interval P-value Lower Upper Competence 4. 76 4. 03 5. 50 0. 0215 Total Competence 4. 76 4. 03 5. 50 0. 0215
The competence factor is measured by question 37 and 38. The mean value is
4. 76 and the confidence interval are between 4. 03 and 5. 50. This means the
employees trust Manager C to some extent, that Manager C has some competence
to do his job. The p-value is below the significance level. This indicates that H0
can be rejected and that there are 2. 15% chance, that the employees have distrust
of Manager C. In other words it is very likely that employees have some trust in
Manager C (H1). Manager C’s total competence is the same as for the factor
competence.
7.2.3.2 Openness Dimension
In the openness dimension for Manager C, the internal factors that are analysed
are communication, honesty and openness. One question is excluded in the
communication factor and that is question 7, because it applies to all managers.
Therefore it has been disregarded when analysing the communication factor. The
table 7.2.3.2 shows Manager C’s openness dimension.
Table 7.2.3.2 The Openness Dimension of Manager C Internal Factors Mean Confidence interval P-value Lower Upper Communication 5. 08 4. 63 5. 52 0. 0000 Honesty & Openness 4. 57 4. 15 4. 99 0. 0005 Total Openness 4. 83 4. 47 5. 18 0. 0000
The Communication factor is measured by the questions 30, 31 and 32. The mean
value is 5. 08 and the confidence interval are between 4. 63 and 5. 52. This means
the employees trust Manager C to some extent, that Manager C has some abilities
to communicate. The p-value is below the significance level. This indicates that

Result of the Survey
75
H0 can be rejected and that there is less than 0. 00% chance, that the employees
have distrust of Manager C. In other words it is most likely that employees have
some trust in Manager C (H1).
The honesty and openness factor is measured by question 33. The mean value is
4. 57 and the confidence interval are between 4. 15 and 4. 99. This means the
employees trust Manager C to some extent, that Manager C is honest and open
when sharing information with them. The p-value is below the significance level.
This indicates that H0 can be rejected and that there is a 0. 05% chance, that the
employees have distrust of Manager C. In other words it is most likely that
employees have some trust in Manager C (H1).
Manager C’s total mean value in the openness dimension indicates that the
employees have some trust, in Manager C’s abilities to communicate and to be
honest and open when sharing information. According to the confidence interval,
there is no chance that employees have some distrust within the interval. The p-
value is below the significance level. This indicates that H0 can be rejected and
that there is less than a 0. 00% chance, that the employees have distrust of
Manager C. Therefore we can say it was most likely that the employees have
some trust in Manager C (H1).
7.2.3.3 Concern Dimension
In the Concern dimension for Manager C, the internal factors that are analysed are
employees’ well-being, fairness and opportunistic behaviour. The table 7.2.3.3
shows Manager C’s concern dimension.
Table 7.2.3.3 The Concern Dimension of Manager C Internal Factors Mean Confidence interval P-value Lower Upper Employee Well-being 5. 26 4. 84 5. 68 0. 0000 Fairness 4. 90 4. 33 5. 48 0. 0020 Opportunistic behaviour 3. 33 2. 47 4. 20 0. 0625 Total Dimension 4. 50 4. 14 4. 86 0. 0045

Result of the Survey
76
The employee well-being factor is measured by question 35 and 40. The mean
value is 5. 26 and the confidence interval are between 4. 84 and 5. 68. This means
the employees trust Manager C to some extent, that Manager C cares about their
well-being and stands up for them in Section Q. The p-value is below the
significance level. This indicates that H0 can be rejected and that there is less than
0. 00% chance that the employees have distrust of Manager C. In other words it is
very likely that employees have some trust in Manager C (H1).
The factor fairness is measured by question 36. The mean value is 4. 90 and the
confidence interval are between 4. 33 and 5. 48. This means the employees trust
Manager C to some extent, that Manager C treats them fair compared to other
employees with similar experience. The p-value is below the significance level.
This indicated that H0 can be rejected and that there is a 0. 20% chance, that the
employees have distrust of Manager C. In other words it is very likely that
employees have some trust in Manager C (H1).
The factor opportunistic behaviour is measured by question 39. The mean value is
3. 33 and the confidence interval is between 2. 47 and 4. 20. This means the
employees distrusted Manager C to some extent that Manager C acts
opportunistically. In other words, makes some decisions based upon what is best
for him. The p-value is over the significance level. This indicates that H0 can not
be rejected and that there is a 6. 25% chance, that the employees have trust in
Manager C. Therefore we can not say how likely it is that the employees’
distrusted Manager C (H1).
Manager C’s total mean value in the concern dimension indicates that the
employees have trust to some extent that Manager C’s has some concern for them.
According to the confidence interval there is no chance that employees have some
distrust within the interval. The p-value is below the significance level, this
indicates that H0 can be rejected and that there is a 0. 45% chance that the
employees have distrust of Manager C. Therefore we can say it is most likely that
the employees have some trust to in Manager C (H1).

Result of the Survey
77
7.2.3.4 Reliability Dimension
In the Reliability dimension for Manager C, the only internal factor that is
analysed is the factor consistency, since the other factor uncertainty, applies to all
managers. Due to this the factor uncertainty has to be disregarded when analysing
Manager C’s reliability. The table 7.2.3.4 shows Manager C’s reliability
dimension.
Table 7.2.3.4 The Reliability Dimension of Manager C Internal Factors Mean Confidence interval P-value Lower Upper Consistency 4. 86 4. 33 5. 38 0. 0015 Total Reliability 4. 86 4. 33 5. 38 0. 0015
The factor consistency is measured by question 34. The mean value is 4. 86 and
the confidence interval are between 4. 33 and 5. 38. This means the employees
trust Manager C to some extent that Manager C is consistent with what he says
and what he does. The p-value is below the significance level. This indicates that
H0 can be rejected, and that there is more than a 0. 15% chance, that the
employees have distrust of Manager C. In other words it was very likely that
employees have some trust in Manager B (H1).
7.2.3.5 Total trust for Manager C
The total trust for Manager C consists of the four dimensions analysed above.
Together these dimensions symbolises the total trust for Manager C. The table
7.2.3.5 shows total of Manager C’s four dimensions and the trust.

Result of the Survey
78
Table 7.2.3.5 Summary of the Dimensions of Trust for Manager C Dimensions Mean Confidence interval P-value Lower Upper Competence 4. 76 4. 03 5. 50 0. 0215 Openness 4. 83 4. 47 5. 18 0. 0000 Concern 4. 50 4. 14 4. 86 0. 0045 Reliability 4. 86 4. 33 5. 38 0. 0015 Total Trust 4. 74 4. 45 5. 17 0. 0005
The total trust for Manager C is measured by the four dimensions. The mean
value is 4. 74 and the confidence interval is between 4. 45 and 5. 17. This means
the employees trust Manager C to some extent. The p-value is below the
significance level. This indicates that H0 can be rejected, and that there is 0. 05%
chance, that the employees have distrust of Manager C. In other words it is very
likely that employees have some trust in Manager B (H1).
7.2.4 Overview of the Managers Total Trust
The table below shows the managers total trust and its significance level.
Table 7.2.4 Overview of the Managers Trust Manager Trust Confidence interval P-value Lower Upper Manager A 4. 62 4. 10 5. 15 0. 0115 Manager B 4. 93 4. 43 5. 43 0. 0005 Manager C 4. 74 4. 45 5. 17 0. 0005
All mangers have almost the same level of total trust and the confidence intervals
are all over 4. 00. This means that employees 95 % of the time have trust in the
managers. The p-value for all managers are below the significance level, which
indicates that H0 can be rejected, and that there is more likely that employees have
some trust in the managers, rather then distrust (H1).

Result of the Survey
79
7.2.5 The Level of Total Trust in the Managers
To find out the level of total trust employees have for the managers, the total
mean value of each internal factor has to be established. This is done by adding
the same internal factor from each manager together. When the communication
factor is calculated in the openness dimension, question 7 also has to be added
together with each manager’s communication factor. The reason for this is that
question 7 affects all three managers.
The total level of trust for each dimension can then be calculated, except for the
competence dimension and the reliability dimension. In the competence
dimension, the factor teamwork has to be added, and in the reliability dimension,
the factor uncertainty, has to be added, to get the total value in each of the two
dimensions. When this is done and all four dimensions are calculated, we add
them together, and then the total level of trust can retrieved.
7.2.5.1 The Total Competence Dimension
In the competence dimension for the managers the factors competence and
teamwork are analysed. The table 7.2.5.1 shows the total competence dimensions
for the managers.
Table 7.2.5.1 The Competence Dimension for the Managers Internal Factors Mean Confidence interval P-value Lower Upper Competence 5. 01 4. 49 5. 54 0. 0005 Teamwork 4. 71 4. 12 5. 31 0. 011 Total Competence 4. 87 4. 40 5. 33 0. 0005
The competence factor is measured by Manager A, Manager B and Manager C’s
competence factors. The mean value is 5. 01 and the confidence interval is
between 4. 49 and 5. 54. This means the employees trust the Managers to some
extent, that the Managers have some competence to do their job. The p-value is
below the significance level. This indicates that H0 can be rejected, and that there
is a 0. 05% chance, that the employees have distrust of the Managers. In other
words it is very likely that the employees have some trust in the managers (H1).
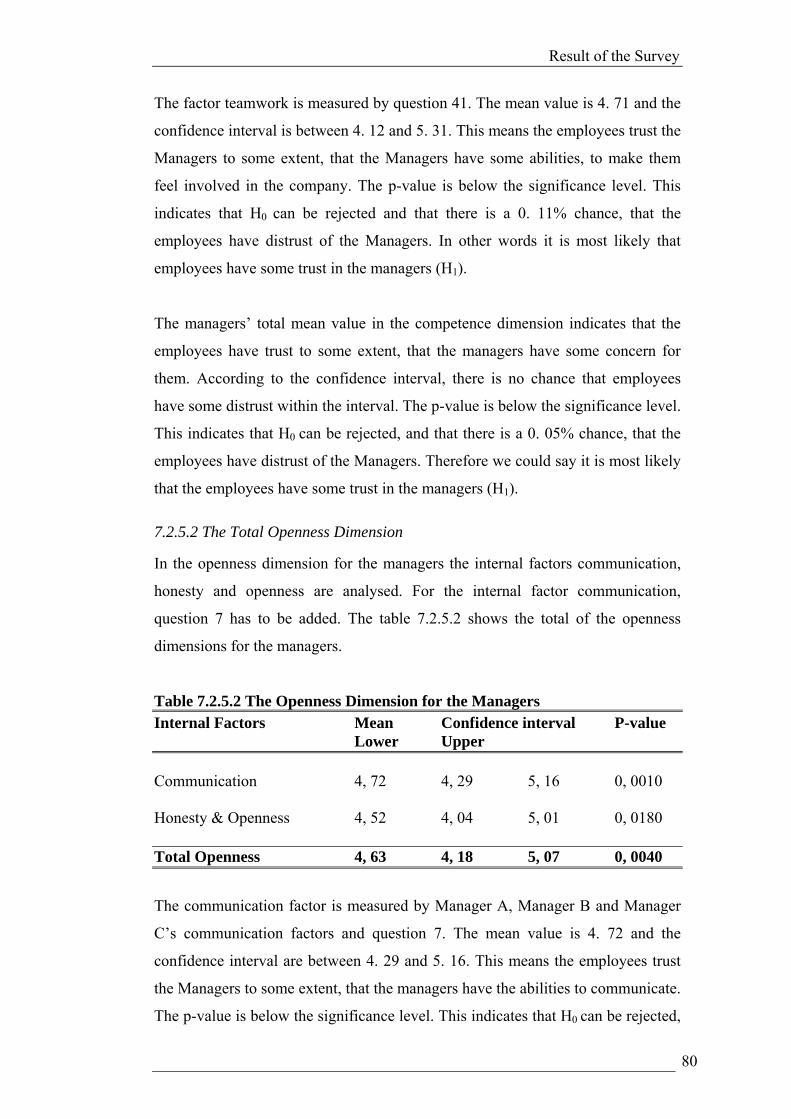
Result of the Survey
80
The factor teamwork is measured by question 41. The mean value is 4. 71 and the
confidence interval is between 4. 12 and 5. 31. This means the employees trust the
Managers to some extent, that the Managers have some abilities, to make them
feel involved in the company. The p-value is below the significance level. This
indicates that H0 can be rejected and that there is a 0. 11% chance, that the
employees have distrust of the Managers. In other words it is most likely that
employees have some trust in the managers (H1).
The managers’ total mean value in the competence dimension indicates that the
employees have trust to some extent, that the managers have some concern for
them. According to the confidence interval, there is no chance that employees
have some distrust within the interval. The p-value is below the significance level.
This indicates that H0 can be rejected, and that there is a 0. 05% chance, that the
employees have distrust of the Managers. Therefore we could say it is most likely
that the employees have some trust in the managers (H1).
7.2.5.2 The Total Openness Dimension
In the openness dimension for the managers the internal factors communication,
honesty and openness are analysed. For the internal factor communication,
question 7 has to be added. The table 7.2.5.2 shows the total of the openness
dimensions for the managers.
Table 7.2.5.2 The Openness Dimension for the Managers Internal Factors Mean Confidence interval P-value Lower Upper Communication 4, 72 4, 29 5, 16 0, 0010 Honesty & Openness 4, 52 4, 04 5, 01 0, 0180 Total Openness 4, 63 4, 18 5, 07 0, 0040
The communication factor is measured by Manager A, Manager B and Manager
C’s communication factors and question 7. The mean value is 4. 72 and the
confidence interval are between 4. 29 and 5. 16. This means the employees trust
the Managers to some extent, that the managers have the abilities to communicate.
The p-value is below the significance level. This indicates that H0 can be rejected,

Result of the Survey
81
and that there is a 0. 10% chance, that the employees have distrust of the
Managers. In other words it is most likely that employees have some trust in the
managers (H1).
The honesty and openness are measured by Manager A, B and C’s honesty and
openness factors. The mean value is 4. 52 and the confidence interval is between
4. 04 and 5. 01. This means the employees trust Managers to some extent, that the
Managers are honest and open when sharing information with them. The p-value
is below the significance level. This indicates that H0 can be rejected, and that
there is a 1. 80% chance, that the employees have distrust of the Managers. In
other words it is most likely that employees have some trust in the managers (H1).
The Managers’ total mean value in the openness dimension indicates that the
employees have trust to some extent in the managers’ abilities to communicate
and to be honest and open when sharing information. According to the confidence
interval, there is no chance, that employees have some distrust within the interval.
The p-value is below the significance level. This indicates that H0 can be rejected,
and that there is a 0. 40% chance, that the employees have distrust of the
Managers. Therefore we can say it is most likely that the employees have some
trust in the managers (H1).
7.2.5.3 The Total Openness Dimension
In the Concern dimension for the managers the internal factors employee well-
being, fairness and opportunistic behaviour are analysed. The table 7.2.5.3 shows
the total of the concern dimensions for the managers.
Table 7.2.5.3 The Concern Dimension for the Managers Internal Factors Mean Confidence interval P-value Lower Upper

Result of the Survey
82
Employee Well-being 5. 30 4. 90 5. 70 0. 0000 Fairness 4. 79 4. 17 5. 42 0. 0075 Opportunistic behaviour 3. 70 3. 31 4. 09 0. 0595 Total Concern 4. 60 4. 29 4. 90 0. 0005
The employee well-being is measured by Manager A, B and C’s employee well-
being factors. The mean value is 5. 30 and the confidence interval are between 4.
90 and 5. 70. This means the employees trusted Managers to some extent that the
Managers care about their well-being and stand up for them in Section Q. The p-
value is below the significance level. This indicates that H0 can be rejected, and
that there is less than a 0. 00% chance, that the employees have distrust of the
Managers. In other words it is most likely that employees have some trust for the
managers (H1).
The total fairness is measured by Manager A, Manager B and Manager C’s
fairness factors. The mean value is 4. 79 and the confidence interval are between
4. 17 and 5. 42. This means the employees trusted Managers to some extent that
the Managers treats them fair, compared to other employees with similar
experience. The p-value is below the significance level. This indicates that H0 can
be rejected, and that there is 0. 75% chance, that the employees have distrust of
the Managers. In other words it is very likely that employees have some trust for
the managers (H1).
The opportunistic behaviour is measured by Manager A, Manager B and Manager
C’s opportunistic behaviour factors. The mean value is 3. 70 and the confidence
interval is between 3. 31 and 4. 09. This means the employees trusted Managers
to some extent that the Managers to some extent acted opportunistically. In other
words, makes some decisions based upon what is best for them. The p-value is
over the significance level. This indicates that H0 can not be rejected, and that
there is a 5. 95% chance, that the employees have trust of the Managers.
Therefore we cannot say how likely it is that the employees distrust the managers
(H1).

Result of the Survey
83
The managers’ total mean value in the concern dimension indicates that the
employees have some trust in the managers concern for them. According to the
confidence interval there is no chance, that employees have some distrust within
the interval. The p-value is below the significance level. This indicates that H0 can
be rejected, and that there is a 0. 05% chance, that the employees have distrust of
the Managers. Therefore we can say it was most likely that the employees have
some trust in the managers (H1).
7.2.5.4 The Total Reliability Dimension
In the reliability dimension for the managers, the internal factors consistency and
uncertainty are analysed. The table 7.2.5.4 shows the total of the reliability
dimensions for the managers.
Table 7.2.5.4 The Reliability Dimension for the Managers Internal Factors Mean Confidence interval P-value Lower Upper Consistency 4. 75 4. 20 5. 30 0. 0050 Uncertainty 4. 64 3. 93 5. 36 0. 0380 Total Reliability 4. 69 4. 28 5. 11 0. 001
The consistency is measured by Manager A, Manager B and Manager C’s
consistency factors. The mean value is 4. 75 and the confidence interval is
between 4. 20 and 5. 30. This means the employees trusted Managers to some
extent that the Managers are consistent with what they say and what they do. The
p-value is below the significance level. This indicates that H0 can be rejected, and
that there is 0. 50% chance, that the employees have distrust of the Managers. In
other words it is very likely that employees have some trust in the managers (H1).
The uncertainty factor is measured by question 44 and 45. The mean value is
4, 64 and the confidence interval is between 3. 93 and 5. 36. This means the
employees trust Managers to some extent, that the Managers have some abilities,
to reduce the feeling of uncertainty among the employees. Since the lower part of
the interval is less than 4, it means that there is a chance that within this 95%
interval, there is a probability that the employees can have little distrust for the

Result of the Survey
84
managers. The p-value is below the significance level. This indicates that H0 can
be rejected, and that there is 3. 80% chance, that the employees have distrust of
the Managers. In other words it is most likely that employees have some trust in
the managers (H1).
The managers’ total mean value in the reliability dimension indicates that the
employees have some trust that the managers are reliable. According to the
confidence interval, there is no chance that employees have some distrust within
the interval. The p-value is below the significance level. This indicates that H0 can
be rejected, and that there is 0. 001% chance, that the employees have distrust of
the Managers. In other words it is very likely that employees have some trust in
the managers (H1).
7.2.5.5 Total trust for the Managers
The total trust for the managers consisted of the four dimensions analysed above.
Together these dimensions symbolised the total trust for the managers. The table
7.2.5.5 shows total of the managers’ four dimensions of trust and the total trust.
Table 7.2.5.5 The Total Trust for the Managers Dimensions Mean Confidence interval P-value Lower Upper Competence 4. 87 4. 40 5. 33 0. 001 Openness 4. 63 4. 18 5. 07 0. 004 Concern 4. 60 4. 29 4. 90 0. 001 Reliability 4. 69 4. 28 5. 11 0. 001 Total Trust 4. 70 4. 37 5. 02 0, 000
The total trust for the managers is measured by the four dimensions. The mean
value is 4. 70 and the confidence interval is between 4. 37 and 5. 02. This means
the employees trust Managers to some extent. The p-value is below the
significance level. This indicates that H0 could be rejected, and that there is less
than 0. 000% chance, that the employees have distrust of the managers. In other
words it is very likely that the employees have some trust in the managers (H1).

Result of the Survey
85
In figure 7.1, the COCR-model shows the relationships between the internal
factors, the dimensions and the total level of trust. Each internal factor is
presented with its own mean value. Together those mean values makes up the
mean value of the dimension they belong to. Finally the dimension and its mean
values represent the total trust. The total level of trust the employees have for the
managers in Section Q is 4. 70.
The figure 7.1: The COCR-model with the calculated mean values.
In the figure 7.2, the total level of trust is presented in the adjusted version of the
“trust-distrust gap”. The total trust that employees have for the managers in
Section Q is 4. 70. This means that the employees have some trust in the
managers, as can be seen in the figure below.

Result of the Survey
86
The figure 7.2. shows the adjusted version of the trust-distrust gap. Data from Trust, Distrust and
in between (2001), Ullman-.Margalit. E.
7.3 ANALYSIS OF THE INTERVIEWS WITH THE MANAGERS We have interviewed three middle managers who were recently involved in a
downsizing process at Section Q at the Swedish Meats facilities in Kristianstad.
The managers have worked between 15-45 years at different positions at Swedish
Meats in Kristianstad. Two of the managers, Manager A and Manager B, worked
in the production with the employees during the downsizing. The third manager,
Manager C, worked at the administrative department. We call them Manager A, B
and C, since they were promised anonymity. At the interviews we asked the
managers how they have worked with the internal factors affecting trust during
the downsizing process. Some of the answers from the interviews will be
presented below. To read the entire interview, see appendix 3.
7.3.1 Competence
The managers have participated in several courses to be able to carry out their role
as managers. They all had the theoretical competence to be able to handle a
downsizing, but only Manager C had practical experience. Both Manager A and
Manager C stated that you do not learn how to act in a downsizing process by
attending courses, it is something you will learn how to handle by time. Manager
A said: You have to talk to each individual, explain the situation and why we have
to do as we do. Then you have to deal with their reactions the best you can.
7.3.2 Teamwork
Both Manager A and Manager B were involved with the daily production at
Section Q during the downsizing process. They believe that teamwork is
important, to be able to carry out the work in a good way. Manager A stated that
he had worked very hard to create a we-feeling among the employees at Section
Q. He believed that it was important that everybody felt that they could help each
other out, if some of them had a lot of work to do. Manager A thought that the
team-feeling was really strong at Section Q at the time when we conducted the
Result of the Survey
87
case study. Manager B had worked more with creating a team-feeling between the
managers at the department. He believed that it was more important now that they
work as a team and help each other out, since they were fewer employees at
Section Q.
7.3.3 Communication
The managers informed the employees about the downsizing at a staff-meeting.
The intention was to inform all of the affected employees, who were at work that
day, before the media got the information. At the staff-meeting they informed
about the organizational change and the reason for it. After the negotiations with
the Union, they had a meeting with each employee that had to leave the company,
due to the downsizing. To inform employees at other departments, about what
happened they used the intranet and the closed-circuit televisions. Information
about changes in the production the employees got at a staff-meeting and from the
closed-circuit televisions where they informed about volumes, and if there was
something they need to work extra on.
7.3.4 Honesty and openness
From the answers the managers gave during the interviews, the impression was
that they wanted to be open and honest, about what would happen within the
company in the future. Their intention was to inform the employees about things
affecting the company, before it leaked out to the media. But sometimes it was the
media, not the managers who informed the employees. It was not always that the
middle managers could influence the flow of information. As Manager A stated,
since they are middle managers, it is not always that their superior managers
informed them, about things that would happen within the company in the near
future. Manager A and Manager B were aware of that the employees sometimes
thought they got to little information. Manager B said: I did not have all the
answers to all the questions.
7.3.5 Employee well-being
None of the managers had been working actively with the employees’ well-being
during the downsizing process. They said during the interviews that the door was
always open, if anyone wanted to talk to them about how they felt at work.

Result of the Survey
88
Manager A said that this was nothing he had been working with actively. He
thought that the employees knew him well enough, since the time before he
became a manager, to come and talk to him if they wanted. Manager A had the
opinion that most of the employees rather talked to a colleague, but some of the
employees had come in to his office and cried a bit, due to the downsizing.
Manager B stated that sometimes when the employees had problems at work, they
came and talked to him instead of talking to their closest manager. He thought
that the reason to this was that he had worked there for a very long time, so the
employees knew him very well.
7.3.6 Fairness
During the interview Manager A stated, that he was very careful with how he
treated the employees. He thought it was very important not to favour any
employee, or treat males and females different. He also had a salary-system based
on performance. Manager B and Manager C admitted that all the employees had
not been treated fairly, during the downsizing process. Some of the employees
had been transferred to another section of the department, due to the downsizing
and the LAS 22 (a law in Sweden which protect the employees’ job security). The
reason for this was that they had to have the right mix of competence at Section
Q. Manager C was very anxious to state that they had followed the law, when
they transferred the employees to other sections of the department, against their
requests.
7.3.7 Consistency
According to Manager C signals have been sent out twice about downsizings that
were never executed. He was aware of that this has decreased the trustworthiness
of the information from the managers. He also stated that some employees have
left the company, since they have trusted these signals from the managers that a
downsizing was coming up in the near future. On the other hand, Manager A
stated that he was always sure about that what he said to the employees would be
executed in the future.

Result of the Survey
89
7.3.8 Uncertainty
To decrease the uncertainty, Manager A informed the employees about what
would happen within the company in the future. He believed that the key to
decrease the uncertainty among the employees was to inform plenty of time in
advance, before the changes would be executed. Manager B and Manager C could
only give examples of how they decreased the uncertainty among the employees
that had to leave Swedish Meats, due to the downsizing.
7.4 SUMMARY The typical person who worked in Section Q was a woman between 36-45 years
old. She had been an employee at Swedish Meats for 12. 9 years, and had worked
in Section Q for 9. 29 years. When she was informed about the company’s
downsizing it was through a staff meeting held by Manager B. Manager B was the
manager that the employees trusted most, closely followed by Manager C and
Manager A. The total trusts the employees had in the managers, had the mean
value 4. 70 and its location in the adjusted version of the trust-distrust gap model
is just above average. Translated to words, this means that the employees trusted
the managers to some extent. Manager A and B worked closely together with the
employees in the production, while Manager C worked with the administrational
part of the downsizing. All of them had been involved in the downsizing process.
Manager C was the only one who had practical experience of downsizing. Both
Manager A and B worked to achieve a high team-feeling among the employees.
The managers informed the employees about the downsizing at a staff meeting
but the intranet and the closed-circuit televisions were also used to reach the
employees. The managers tried to be open and honest about sharing information,
but a problem was that they are only middle managers and sometimes do not
know the whole story. None of the managers has worked actively with the
employees’ well-being. Manager A stated that he was very precise with how he
treated the employees. Manager B and C admitted that some of the employees had
not been treated fairly. Manager C said that there had been a lack of consistency
between words and actions between him and the employees. On the other hand,
Manager A said that he was always sure that everything he told the employees
would be executed in the future. Manager A thought that he decreased the
employees’ uncertainty by informing them plenty of time in advance about future

Result of the Survey
90
events. Manager B and C could not say what they did to decrease the uncertainty
for the remaining employees during the downsizing process.

Conclusions
- 91 -
8 CONCLUSIONS In this chapter we will answer the research questions. A comparison between how
the managers worked with the factors affecting trust and the level of trust in each
dimension of trust are presented. Furthermore, the authors’ reflections, the
practical implications, suggestions for future research and criticism are
discussed.
8.1. ANSWERS TO THE RESEARCH QUESTIONS In this part of the dissertation the answers to the research questions are presented.
First we explain what trust is. Second, there is a discussion of what creates and
destroys trust. Third, we describe how to measure the level of trust with the
COCR model, which we created. Finally we will answer how the managers
worked with the factors affecting trust during the downsizing process.
8.1.1. What is trust?
When we wrote the theoretical chapter, we found that trust has a very broad
definition. If you look up the word trust in the Oxford Advanced Learner’s
Dictionary, trust is defined as “the belief that somebody or something is good,
sincere, honest etc. and will not try to harm or deceive you” (Oxford, 2000). This
definition says that trust is a form of belief about somebody or something that
reduces any uncertainty that might exist. In the business world, most companies
want to establish a good relationship with their customers and suppliers, in other
words, they want their customers and suppliers to be able to rely on them. To be
able to exchange the goods, services and products, it is important that customers
can trust the way you are doing business. This reliance you have for your
customers or vice versa, is one part of the trust concept (Falcon et al., 1998,
2001). So far we have argued that trust is a central piece in the relationship
between people and other forms of partnerships.
Furthermore, as stated above, trust has a very broad definition, and researchers
have not yet been able to agree upon a complete general definition of trust. The
reason for this is that the trust concept is used in many different disciplines, such
as economics/organizations, sociology, psychology, computer science and the
socio-cognitive approach (Kramer, 1999; Falcon, 2005). What the researchers can
agree upon is that trust is primarily a form of a psychological state (Kramer,
Conclusions
- 92 -
1999). In other words, it is a mental state that regards other individuals as a risk
due to uncertainty, which is deriving from the lack of information about that
individuals’ behaviour (Kramer, 1999).
The answer to the question “what is trust?”, is that trust is first and foremost a
mental state. According to the social cognitive approach we used, this mental state
consists of a wide range of beliefs and goals. The question was asked to find out
what the essence of trust actually is. Only when we knew the answer to the first
question, could we answer the second question, and find out what creates and
destroys trust.
8.1.2. What creates and destroys trust?
After conceptualizing what trust is, we moved on to find an answer to the second
question. Since it was not enough for us to only know what trust is, we wanted to
find out if there are any factors that create and destroys trust. This was important
for us to know, to be able to build the COCR-model, which will be discussed in
chapter 8.1.3. It takes a lot of time and effort to create trust in an organization and
between individuals. Not to mention how difficult it is to maintain that created
trust. According to Ford (2006), is it enough with one bad decision or action from
the managers to destroy the trust among the employees. Furthermore, Hunchak
(2006) states that it is the managers’ responsibility to create trust in the
organization, which means that it is the managers who bear the burden to create
and maintain trust.
In our theoretical review we found factors that we believed were important to
recognize and spend time on, for managers who want to create and maintain trust.
The search was restricted to only internal factors affecting trust, and the external
factors were excluded. Then we categorized the factors in positive and negative
internal factors. The positive internal factors are: competence (Albrecht, 2002),
teamwork (Hunchak, 2006; Nooteboom et al., 2003), communication (Ford 2006;
Darling et al., 1995), employee well-being (Darling et al., 1995), honesty,
openness, consistency (Nooteboom et al., 2003), and fairness (Cooper et al.,
1995). It is important to keep in mind that these internal factors only have an
positive impact on trust if the employees perceive the managers to work with

Conclusions
- 93 -
them in a positive way. The factor opportunistic behaviour has only a negative
impact on trust, since a manager who acts opportunistically only violates the trust
(Nooteboom et al., 2003). Uncertainty is a factor which has both a positive and a
negative impact on trust. Since the world today is characterised by uncertainty,
trust exists as an insurance that the uncertainty will not harm or deceive us
(Falcon, 2005). It is the managers’ capability to decrease the employees’ worries
about this, which can have a positive impact on trust (Cho, 2006).
To conclude, we have found that there are both positive and negative internal
factors that affect trust. Of these factors it is only the positive factors that can both
create and destroy trust. The negative factors can only destroy trust. When we had
the answer to the question, what creates and destroys trust, we could start to
develop our model of how to measure trust.
8.1.3 How to measure the level of trust employees have for the managers in a
downsized organization?
When we had answered the second question, we turned to the researcher Mishra
(1992) who identified four components or dimensions of trust. The reason for her
research was that she wanted to find out how the trust is considered when an
organization experienced a crisis. Her findings in combination with the factors we
identified in question two are the core of our model to measure employees’ trust
for managers in a downsized organization. Those four components or dimensions
of trust are: competence, openness, concern and reliability. Each of these four
dimensions represents the employees’ trust in the managers. After we had
conceptualized the four dimensions we found that each dimension is affected by
some of the internal factors we identified in the second question. And those
factors vs. dimension are:
1. The competence dimension of trust consists of competence and teamwork.
2. The openness dimension of trust consists of communication, honesty and
openness.
3. The concern dimension consists of employee well being, consistency and
opportunistic behavior.
4. The reliability dimension consists of consistency and uncertainty.
Conclusions
- 94 -
With these internal factors and dimensions we could create our own model, which
was one of the questions in the beginning of the dissertation. So the COCR-
model, which was presented in chapter, four, figure 4.1 is the model we have
created to be able to measure the employees’ trust for the managers in a
downsized organization.
To be able to measure the level of trust, we conducted an inquiry survey in our
case company, Swedish Meats in Kristianstad. The questions we formulated to
measure the internal factors mentioned in the second research question. Every
question was evaluated by points and by using a statistical program we were able
to measure the mean-value of each question in our survey. Then it was possible
for us to set out the result in our adjusted trust- distrust gap (figure 4.2 in chapter
4).
The analysis of the case study in chapter 7, indicates that the employees total trust
in the managers was 4. 70 and the confidence interval were between 4. 37 and 5.
02. This means that the employees had some trust in the managers. The p-value
was below the significance level, this indicated that there was a tendency towards
some trust in the managers. The significance level has proved that it was below 0.
000% chance that employees had distrust to some extent.
The mentioned result shows, that it is possible to measure the level of trust the
employees have in the managers with our COCR-model.
8.1.4 What internal factors affecting employee’s trust, do managers work with
during a downsizing process?
The managers did not work with all of the internal factors affecting trust. There
was a difference between the managers, and the factors affecting trust they
worked with. Some of the factors they had been working with actively, and some
of them they had almost not given any priority to at all.

Conclusions
- 95 -
To increase their competence, the managers have participated in several courses,
to be able to carry out their work as managers. Both Manager A and Manager B
had been working actively with the factor teamwork, but in different areas.
Manager A had worked a lot with getting the employees together, and work as a
team. Manager B had worked more with getting the managers at the department,
to work as a team. When it comes to the factor communication, the managers used
both traditional and new ways to communicate with the employees. They
informed the employees about more important things, like downsizings, at a staff
meeting, while they used the intranet and the closed-circuit televisions for more
general information. The closed-circuit televisions they have only used for a few
months, so this way of communicating was quite new at Swedish Meats in
Kristianstad. The managers did not work actively with being honest and openly
share information with the employees. They only had an intention to inform the
employees about what would happen within the company in the future, before it
leaked out to the media. Neither had the mangers been working actively with the
employees’ well-being. A long time ago had they said to the employees that their
door was always open if they felt like talking to them. The managers admitted that
this was nothing they had been working with actively. The factor fairness the
managers had worked with in different ways. The salary-system used is based on
performance, and Manager A stated that he was very precise with treating
everyone of the employees in the same way. Manager B and Manager C admitted
that during the downsizing process, some of the employees were treated unfairly
from a human perspective, but according to the law they were treated fairly and
correctly. Only Manager A worked actively with being consistent, by always
making sure that the information about changes etc. always would be executed in
the future. Manager A was also the only one of the managers we interviewed that
could give an example of how he worked with decreasing the uncertainty among
the employees. Manager A stated that he believed it was important to inform the
employees plenty of time in advance before things happened.
8.2 A COMPARISON BETWEEN THE QUALITATIVE AND THE QUANTITATIVE DATA At the interviews, we asked the managers how they worked with the internal
factors affecting trust, during the downsizing process. Their answers are
compared with the level of trust for each factor and each dimension, to see if it is

Conclusions
- 96 -
possible to draw any conclusions, from how the managers have worked with the
factors affecting trust, and the level of trust.
8.2.1 The Competence Dimension of Trust
The competence dimension consists of the factors competence and teamwork. The
total level of trust in the factor competence was 5. 01. This means the employees
had some trust in the managers’ competence. The managers have worked with
increasing their competence by participating in several management courses.
They have also worked between 15-45 years at different positions at Swedish
Meats, which have given them a lot of practical experiences. Only Manager C had
previous experience of downsizing, but it seems if both Manager A and Manager
B had the knowledge and capability to execute the downsizing, according to the
total level of trust for the factor competence.
The total level of trust in the factor teamwork was 4. 71. This means the
employees had some trust in the managers’ ability to make them feel involved in
the company. Manager A and Manager B, who worked in the daily production
with the employees during the downsizing, stated that teamwork is very important
to carry out the work at Section Q. Manager A stated that he had worked a lot
with getting the group together, and that the team-feeling among the employees at
Section Q, was really strong. According to the total level of trust in the factor
teamwork, was the team-feeling rather strong among the employees when we
conducted our case study. Since we did not know on what level the team-feeling
was before Manager A started to work with getting the group together, we could
not conclude whether or not he has succeeded with his work. What we could
conclude are, that he was not that well aware of how the employees felt about
working in a team.
8.2.2 The Openness Dimension of Trust
The openness dimension consists of the factors communication, honesty and
openness. The total level of trust in the factor communication was 4. 72. This
means that the employees had some trust in the managers’ abilities to
communicate. The managers worked with both new and old tools when it came to
communication. To inform the employees about changes in the production or

Conclusions
- 97 -
organizational changes, like downsizing, they gathered the affected employees to
a staff-meeting. Since a few months they had used closed-circuit television, to
inform about volumes, and if there was something they need to work extra on.
According to the total level of trust in the factor communication, the managers
should further improve the communication with the employees.
The total level of trust in the factors honesty and openness was 4. 52. This means
that the employees had some trust in that the managers were honest and openly
shared information with them. During the interviews with the managers, we got
the impression that they wanted to be open and honest about what would happen
within the company in the future, but we did not get the feeling that they worked
with it actively. They stated that their intention was to always inform the
employees about things affecting the company, before the information leaked out
to the media. Both Manager A and Manager B said that they were aware of that
the employees sometimes thought they got to little information. But as Manager B
said: I do not have all the answers to all the questions. Manager A stated that, it is
not always that their superior managers are open and honest with them, and
inform them about what will happen within the company in the future. According
to the total level of trust in the factor honesty and openness, the managers should
be more honest, open and willing to share information. The problem with being
honest and openly share information with the subordinates, could be a problem
higher in the hierarchy, since both Manager A and Manager B sometimes thought
they got to little information themselves
8.2.3 The Concern Dimension of Trust
The concern dimension consists of the factors employee well-being, fairness and
opportunistic behaviour. The total level of trust in the factor employee well-being
was 5. 30. This means that the employees had some trust that the managers cared
about their well-being at work. None of the managers have been working with the
employees’ well-being actively. The managers stated during the interviews that
they have told the employees that their door was always open if they felt like
talking to them. Both Manager A and Manager B thought that the employees
knew them so well, that they knew they could come and talk to them, even if they
do not remind them about it. According to the total level of trust in the factor

Conclusions
- 98 -
employee well-being, should the managers work more with the employee well-
being. Apparently was it not enough for the employees to know the managers for
a long time, to feel that they could come and talk to them. It is also possible that
the employees’ felt that it was not enough to only be able to talk to the managers,
to feel that the managers’ cared about them. The employees might want the
managers to show concern for them in other ways.
The total level of trust for the factor fairness was 4. 79. This means that the
employees had some trust that the managers treated them fairly, compared to
other employees with similar experience. Manager A worked with being fair, by
being very precise with how he treated the employees. He did not treat males or
females differently. The salary system used at Section Q is based on performance
to increase the fairness. During the downsizing process some of the employees
were transferred to other sections of the department against their own requests.
Manager B and Manager C admitted that the employees were not treated fairly
from a human perspective, but according to the law, were the employees treated
fairly. Manager B and Manager C worked in those cases, to treat the employees as
fair as possible according to the law. Even though the law supported the transfers,
this might have decreased the trust in the managers to act fairly, for the remaining
employees. On the other hand, should an equal salary-system and managers
whom do not favour anyone, increase the trust in the managers to be fair. Maybe
have the mangers actions with these two factors neutralized each other since the
total level of trust for the factor fairness is 4. 79.
The total level of trust in the factor opportunistic behaviour was 3. 70. This means
that the employees had some distrust in the managers’ actions. They believed the
managers to some extent acted opportunistically, which means that the managers
acted in favour for their own personal interest and not the company’s. We did not
ask the managers any questions about opportunistic behaviour, due to the fact that
we probably not would have got any honest answers, even though they were
promised total anonymity.

Conclusions
- 99 -
8.2.4 The Reliability Dimension of Trust
The reliability dimension consists of the factors consistency and uncertainty. The
total level of trust in the factor consistency was 4. 75. This means that the
employees had some trust in the managers to be consistent, with what they said
and how they acted. Manager A worked with being consistent, by always be
certain that the information he gave was correct. For example, he never informed
the employees about anything, unless he was absolutely sure that it would be
executed. On the other hand, Manager C stated that there had been inconsistency
twice when he had informed the employees at Section Q about downsizings,
which never were executed. Even though he was aware of that it is a problem, he
could not give any example of how he worked to be more consistent. According
to the total level of trust in the factor reliability, was the employees’ opinion that
the managers were inconsistent to a high degree. The reason to this might be that
the managers in the past have informed about downsizings, which never been
executed.
The total level of trust in the factor uncertainty was 4. 64. This means that the
employees had some trust in the managers’ ability to reduce the feeling of
uncertainty among the employees. During the interviews with the managers, could
only Manager A give an example of how he worked with decreasing the
uncertainty among the employees. Manager A believed it was important to inform
about changes plenty of time in advance, to decrease the uncertainty among the
employees. According to the total level of trust for the factor uncertainty, was this
not enough. The employees had a high feeling of uncertainty, which they only had
some trust for the managers’ ability to be able to reduce.
8.2.5 Conclusion of the Comparison
The total level of trust for the three middle managers in our case study was 4. 70.
This means that the employees had some trust in the middle managers. The
employees had some trust for the managers in each dimension of trust, which also
was reflected in the total level of trust for the managers. Whether the downsizing
had a negative or positive impact on the employees’ trust in the managers, was
impossible for us to draw any conclusions about. What we could conclude was
that the employees had some trust in the managers. We could also conclude that

Conclusions
- 100 -
the managers have worked actively with 6 out of 9 internal factors in the COCR-
model during the downsizing processes. Those factors were; competence,
teamwork, communication, fairness, uncertainty and consistency. The internal
factors they have not worked with actively are; employee well-being,
opportunistic behaviour, honesty and openness. There is no evidence that the
internal factors the managers worked with had any impact on the employees’ level
of trust.
8.3 THE AUTHORS REFLECTIONS When we began to write our dissertation we assumed, that the employees should
have distrust in the managers, in a recently downsized organization. This
assumption was what we based our hypothesises on. The hypothesis was, when an
organization has downsized, the employees have distrust for the managers. The
result of the case study showed that the total level of trust was 4. 70. This means
that the employees had some trust in their managers. The level of trust was the
same in all dimensions. This result surprised us, because how can employees in a
recently downsized organization trust their managers? Rationally they should
distrust them. For instance when you work in a company and the managers
downsize 50% of your colleges at your department, rationally, would you not feel
insecure, afraid or uncertain about your own situation? Then why do these
employees at Section Q have this irrational behaviour? We believe the answer to
this question lies within the three reasons, we are going to discuss below.
First, we believe that one reason could be the external factor that the employees
are used to the constant threat to be downsized. This might have caused a trivial
attitude among the employees, towards the threat about downsizing. In other
words, the employees have been informed and lived with this threat daily for the
past 4-5 years. It means that the content of downsizing has lost its threatening
influence on the employees, since it has become a part of their daily lives.
A second reason could be that during the downsizing process, some employees
voluntarily left the company. Our opinion is therefore, that the remaining
employees have higher motivation to stay within company, and the fact that they
not had to leave the company.

Conclusions
- 101 -
A third reason could be the external factors, for example the Union and LAS, a
law that protects the employees’ job security. These external factors affect the
employees trust towards the managers, because they have the Union’s support
behind them during the downsizing process, and LAS that protects the employees’
job security. Furthermore, in LAS §22 says that during a downsizing process, you
have to follow the rule “last in, first out”. This reduces the employees’
uncertainty, therefore this might have a positive impact on the employees trust in
the managers, since they know that the managers have to follow the law and if
they do not follow the law, they Union will help the employees to protect their
rights.
We believe that the reasons discussed above can explain why the employees
according to the COCR-model, have some trust in the managers, and why their
irrational behaviour is not that irrational, in their case.
8.4 PRACTICAL IMPLICATIONS In this dissertation we created a model to be able to measure the level of trust
employees have in managers in a downsized organization. Since the measured
value does not say much about the level of trust, therefore we needed a scale that
showed the level of trust. This scale was taken from the trust-distrust gap, a model
which we modified to fit with our requirements. These two models are
interdependent with each other and therefore they should be seen as one entire
model.
This model could be used for companies or external business consults to find out
the level of trust the employees in an organization have in their managers after a
downsizing process. For a company and its managers it is important to know if
the employees trust them. Because employees are key players in an organization
and we believe that if they do not trust their managers, this may lead to poor
results and implications for creating value. With our developed model, you are
able to find out the level of trust among the employees and use this information in
the management strategic planning and decision making. Of course this model is
just a test model, which needs further developments, and therefore its application

Conclusions
- 102 -
is limited. But we believe its practical implications first and foremost lies as a
foundation for future research in estimating trust.
Another goal for us was to find out what internal factors affect employees trust in
managers during a downsizing process. These factors are important for the
managers to be aware of, if they want to build or increase the trust among the
employees, even if the organization has not downsized.
8.5 FURTHER RESEARCH After conducting our case study, we think that the following would be interesting
to study in the future:
• We conducted a single case study at one department in one company. It
would be interesting to extend the research to more than one company, to
investigate if there are any similarities in the way the managers’ work with
the factors affecting trust.
• Our case study focuses on the internal factors affecting trust. A case study
which also includes the external factors affecting trust would be interesting
to conduct, to find out what impact the external factors have on the
employees’ trust in the managers.
• A follow up study on Section Q at Swedish Meats, which investigates
whether the level of trust has changed or not, and the reasons to it, would be
interesting to conduct in the future.
• It would also be interesting to conduct a study about whether employees
trust in managers has any impact on the productivity within the company.
• It would also be interesting to study if the employees’ trust is different in
different types of organisational forms. Swedish Meats is an incorporated
association, which means that delegates represent the owners from regional
councils at the annual summon. In a corporation the owners or the

Conclusions
- 103 -
shareholders are allowed to participate in the annual summon. Could this
difference in the organisational form have different impact on the trust
between employees and managers?
• Since our research has been about employees’ trust in the managers, we
have realised that the middle managers seems to be under heavy pressure in
a downsizing organization. Therefore, it would be interesting to investigate
the middle mangers’ trust in a downsizing environment. Since they are
pressured form two ways, from the management at the top of the
organization and from the employees at the bottom of the organization.
8.6 CRITICISM TO THE DISSERTATION There are some weaknesses in our dissertation, which we are aware about. They
are presented and discussed below.
• We decided to conduct semi-structured interviews with the middle managers
at Swedish Meats. We thought that this interview form would give us more
comprehensive and developed answers. Unfortunately did the managers’
succeed in not answer all the questions we asked, without us notice it during
the interviews. This is a weakness in our dissertation, since we could not
compare each manager’s answer, to the level of trust in the COCR-model.
We think that more experiences in conducting interviews, is necessary to be
able to conduct a good semi-structured interview.
• The questions 42 and 43 about teamwork in the questionnaire were asked in
a wrong way. We believe that some of the respondents might have
interpreted the questions wrong, due to the reason that some of them
answered “no” on question 42 (a filter-question) and then they also
answered on question 43, which they should not have done. Since we cannot
eliminate the fact that some of the respondent might have interpreted the
question as if they “worked as a team”, and not as what we really asked
about, if they had team-feeling in Section Q. The answers to these questions
were not included when we calculated the level of trust with our COCR-
model. The reason to this was that we wanted to avoid a misleading result of

Conclusions
- 104 -
the factor teamwork, and in the end a wrong measure of the total level of
trust. Since a pilot-study not was conducted, we cannot eliminate the fact,
that the respondents interpreted other questions in the questionnaire wrong.
• The level of trust was not measured before the downsizing process began at
Swedish Meats. A weakness is then that we cannot determine whether the
level of trust has decreased or increased due to the downsizing.
• In the COCR-model, we only included the most common internal factors
affecting trust, which we found during the literature review. Of course there
are also external factors affecting the employees trust for the managers. Due
to the limited time, the external factors were not included in the dissertation.
• We should have measured the level of trust with two different models. Then
it had been possible to draw conclusion about how to improve the COCR-
model.
• Before we created the COCR-model, we should have interviewed a few
employees at Section Q to find out what internal factors they believe are
important for their trust in the managers. This strategy would have given us
a more precise model to measure the employees’ level of trust in the
managers. It would also have given us, the opportunity to evaluate,
according to the employees, if the managers worked with the right factors
affecting trust.
• A multiple embedded case study had been a better choice of strategy,
because then we could have been able to draw more exact conclusions. We
would also have had more evidence to back up the findings and conclusions.

Conclusions
- 105 -
8.7 SUMMARY In this chapter we answered the four research questions that were stated in first
chapter of the dissertation. The answer to the first question; what is trust? Was
that trust is a mental state and according to the social-cognitive approach this
mental state consisted of a wide range of beliefs and a goal. The answer to the
second question; What creates and destroys trust? Was that there is both
positive and negative internal factors that affects trust. The positive internal
factors were competence, teamwork, employee well-being, honesty and openness,
consistency and fairness. And the negative internal factors were opportunistic
behaviour and uncertainty. The answer to the third question; How to measure
the level of trust employees have for the managers in a downsized
organization? Was that we created a model based upon the internal factors that
creates and destroys trust and a definition of trust made by a researcher, Mishra
(1992) of the four dimensions of trust; competence, openness, concern and
reliability. We named this model the COCR-model and together with an already
existing model developed by Ullman-Margalit (2001) the trust-distrust gap,
which we adjusted so we could pin point the measured level of trust. The answer
to the four question; What internal factors affecting employee’s trust, do
managers work with during a downsizing process? Was that the managers had
worked with 6 out of 9 internal factors in the COCR-model. The factors the
managers had worked with were; competence, teamwork, communication,
fairness, uncertainty and consistency. And the factors they had not worked
actively with were; employee well-being, opportunistic behaviour, honesty and
openness. We could not draw any conclusion from comparing the quantitative and
qualitative data, since there are not enough evidence that the internal factors the
managers worked with and how much they worked with them had any spill over
affect on the employees trust. Instead our conclusion of why the employees had
some trust for the managers, is that it had to do with external factors, such as ; a
constant threat to be downsized, the union and the LAS.

REFERENCES
Books:
Clegg, S., Hardy, C., Nord. W. (1997) Handbook of Organizational Studies.
London: Sage Publications Ltd.
Colman, J. (1994). Foundations of social theory. United States of America:
Harvard University press.
Cooper, C., Rousseau. D. (1995) Trends in Organizational Behaviour. Surrey:
Biddles Ltd.
Fukuyama, F. (1995). The Social Virtues and the Creation of Prosperity. London:
Penguin Books.
Hornby, A S, (2000). 6th edition). Oxford Advanced Learners’s Dictionary.
Oxford New York: Oxford University press.
Jobber, D., Fahy, J. (2006). (2rd ed.). Foundations of marketing. UK: McGraw-
Hill Education Ltd.
Kramer, R.M., & Tyler, T.R. (1996). Trust in Organizations. Frontiers of theory
and research. USA: Sage Publications, Inc.
Kröner, S., Wahlgren, L. (2002). Praktisk statistik. Lund: Studentlitteratur.
Nooteboom, B., Six, F. (2003). The Trust Process in Organizations Empirical
Studies of the Determinants and the Process of Trust Development. Cornwall:
MPG Books Ltd.
Roberts, J. (2004). The modern firm: organizational design for performance and
growth. New York: Oxford university press.
Saunders, M., Lewis, P., Thornhill. A. (2006) Research Methods for Business
Students. England: Prentice Hall.
LAS §22, 1976:580, Sveriges Rikes Lag (2005). Nordstedts Juridik.
Articles:
Albrecht, S.L. (2002) Perceptions of Intergrity, Competence and Trust in Senior
Management as Determinants of Cynicism Toward Change. Public
administration & management: An interactive journal 7, 4, 320-343.
Appelbaum, S., Close, T., Klasa, S. (1999) Downsizing an Examination of some
Successes and even more Failurs. Management Decision (37/5) 424-436.

Cho, V. (2006) A study of the roles of trust and risks in informaton-oriented
online legal services using an integrated model, Information and
Management, (4/43) 502-520.
Darling, J., Nurmi, R. (1995) Downsizing the mulinational firm: key variable for
excellence, The Leadership & Organizational Development Journal, (5/16)
22-28.
Ford, D.W. (2006) The Impact of Leadership Communication, FBI Law
Enforcement Bulletin, (5/75), 7-8.
Hennart, J-F. (2001). The Transaction Cost Theory of the Multinational
Enterprise. The Oxford Handbook of International Business. Editors Rugman,
A.M., Brewer, T.L. Oxford University Press.
Hollensen, S. (1998). Global marketing, a market-responsive approach. Prentice
Hall Europe.
Hunchak, D. (2006) Misleading trust, Industrial Engineer: IE, (7/38) 10-10.
Kim, P., Dirks, K., Cooper, C., Donald, L., Ferrin, D. (2006) When more blame is
better than less: The implications of internal vs. external attribution for the
repair of trust after a competence-vs. integrity/based trust violation.
Organizational Behaivour and Human Decisions Processes (99) 49-65.
Kramer, R. M. (1999). Trust and distrust in organisations: emerging perspectives
and enduring questions. Annual Review of Psychology, Vol. 50 pp.569-98.
Pihl, H. (2005). The MNE as a Coordinative Spider in a Global Web – The
Economic Theory of the MNE Reconsidered. University of Kristianstad.
Tzafrir, S.S. & Eitam-Meilik, M. (2005, October) The impact of downsizing on
trust and employee practices in high tech firms: A longitudinal analysis.
Journal of high technology management research 16, 193-207.
Williamson, O. (1996). Transaction Costs Economics. The Mechanisms of
Governace, Oxford University Press.
Internet:
Corntore. C., Kracher, B., Wiedenbeck. S. (2003). On-line Trust: Concepts,
Evolving Themes, a Model. Electronic version. [Online].Retrieved November
28, 2006 from World Wide Web. www. sciencedirect.com
Falcone R., & Castelfranchi, C. (1998). Principles of trust for MAS: cognitive
anatomy, social importance, and quantification. Electronic version. [Online].

Retrieved September 15, 2006 from World Wide Web.
http://www.istc.cnr.it/T3/download/Trust-for-MAS.pdf
Falcone, R., & Castelfranchi, C. (2001). Social Trust: A Cognitive Approach.
Electronic version. [Online]. Retrieved September 15, 2006 from World Wide
Web. http://www.istc.cnr.it/T3/download/Social-trust.pdf
Falcon, R. (2005, July 4). T3 Group homepage. [Online].Retrieved September 15,
2006 From World Wide Web. http://www.istc.cnr.it/T3/trust/index.html
Gunnarson, R. (2002, October 31). Copyright, Dept of prim health care Göteborg
University, research methodology web site. [Online]. Retrieved Novermber
17, 2006 From World Wide Web. http://infovoice.se/fou.
Leguen De Lacroix, E. (2004, October). The meat sector in the European Union.
[Online]. Retrieved October 30, 2006 from World Wide Web.
http://www.ec.europa.eu/agriculture/publi/fact/meat/2004_en.pdf
Levin P. (2006) Swedish Meats Company information. [Online]. Retrieved
October 26, 2006 From Swedish Meats Intranet.
Luhmann, N. (2000). Familiarity, Confidence, Trust: Problems and alternatives.
[Online]. Retrieved September 15, 2006 from World Wide Web.
www.sociology.ox,ac.uk/papers/luhmann94-107.pdf
Mobärg, h. (2006, Oct) About Swedish Meats. [Online]. Retrieved October 30,
2006 From World Wide Web. www.Swedishmeats.se
Muirhead, J. (2006). EU-25 Livestock and Products annual 2006. [online]
Retrieved October 30, 2006 From World Wide Web.
http://www.thepigsite.com/articles/7/markets-and-economics/1719/eu25-
livestock-and-products-annual-2006)
The Directorate General Communication. (2006). Key figures for the sector.
[Online]. Retrieved October 30, 2006 from World Wide Web.
http://ec.europa.eu/agriculture/markets/pig/index_en.htm
Ullman-Margalit, E. (2001, September). Trust, Distrust and in between. [Online].
Retrieved September 15, 2006 from World Wide Web.
http://www.law.nyu.edu/clppt/program2001/readings/ullman_margalit/Trust,
%20distrust%20and%20in%20between.pdf
Wikipedia. “Principle-agent problem.” (2006), Principle-agent problem, Retrieved
18 Dec, 2006, from http://en.wikipedia.org/wiki/Principal-agent_problem.

APPENDIX 1A
E-mail and Introduction Letter Translated in English E-Mail Hi Per! We send as agreed an description of what we want to investigate at Scan in our dissertation. Please see the attached file. Looking forward to a positive response from you! Best Regards Alexandra Karlsson E-mail Phone Attached File Introduction letter Hi! Refer to phone call with Per Levin 061002. We write our bachelor dissertation in International Business at the University of Kristianstad. Our dissertation is about trust between employees and managers in a downsized company. The aim with our dissertation is to find out which factors that affect trust in an company in crisis, and how the managers can act to create or remain the trust that might have been destroyed at a downsizing. We believe that this is important since the “survivors” in the company shall continue to perform and produce value for the company and its customers. We would like to interview some of the managers who were involved in deciding and executing the downsizing for example, staff manager, production manager and if it is possible the CEO. We would also like to conduct a questionnaire among the employees. We are aware of that it is not possible to conduct a questionnaire among all the employees at the company, due to a time limit for both parts. Therefore have we planned to only conduct the questionnaire at the department that have been most affected by the recently downsizing. The reason for this is that we would like to get a high validity of the result. The interview will take about 15 min and it will take about 5 min to fill in the questionnaire. All answers will of course be treated confidential, even the company if you so wish.

If you have the possibility to participate, we would like to conduct the survey week 42 or 43. The reason to why we would like to conduct the survey at Scan is that you are one of the best in your branch and a company which most of the households in Sweden are aware about. We look forward to positive respond from you. Best regards Alexandra Karlsson Phone: E- mail: Jens Eriksson Otabek Akhunov

APPENDIX 1B Original E-Mail and Introduction Letter E-Mail Hej Per! Översänder enligt överenskommelse en beskrivning av vad vi vill undersöka på Scan i vårt examensarbete. Vänligen se bifogat dokument. Ser fram emot ett positivt svar från Er! Vänliga Hälsningar Alexandra Karlsson E-mail: Tfn: Bifogad fil Introduktionsbrev Hej! Refererar till telefonsamtal med Per Levin 061002. Vi skriver just nu vår kandidatuppsats i Internationell Ekonomi vid Högskolan i Kristianstad. Vår uppsats kommer att handla om förtroendet mellan ledning/chefer och anställda i ett företag som drabbats av uppsägningar. Målet med uppsatsen är att reda ut vilka faktorer som påverkar förtroendet mest vid en krissituation och hur cheferna skall kunna försöka motverka det negativa förtroendet, som kan finnas kvar hos kvarvarande anställda efter en nedskärning. Vi anser att detta är viktigt då dessa ”överlevande” medarbetare skall fortsätta att prestera och skapa värde för företaget och dess kunder. Vi skulle vilja intervjua några av de personer som varit delaktiga i besluts och genomföringsprocessen, tex. avdelningschef, personalchef, VD, samt genomföra en enkätundersökning bland de anställda. Vi är dock medvetna om att en undersökning av hela företaget inte är genomförbart pga., tidsbrist från Er och vår sida. Därför har vi endast tänkt rikta in oss på en avdelning, allra helst den avdelning som påverkats mest, för att få ett så pass giltigt undersökningsresultat som möjligt. Vi beräknar att intervjuerna kommer att ta ca 15 min att genomföra och att det tar ca 5 min att svara på enkäten. Alla kommer givetvis att vara anonyma, även företaget om Ni har önskemål om det. Om ni har möjlighet att ställa upp, skulle vi vilja genomföra denna undersökning v. 42 eller 43.

Vi vill just göra denna undersökning hos Er på Scan då ni är främst i Er bransch och ett företag som de allra flesta hushåll i Sverige känner till. Vi hoppas på ett positivt svar från Er Vänliga Hälsningar Alexandra Karlsson Tfn: E- mail: Jens Eriksson Otabek Akhunov

APPENDIX 2A
Questionnaire Translated in English
Hi!
We write our Bachelor Dissertation at the University of Kristianstad. The dissertation is about trust between managers and employees in a downsized organization. As your department have recently been downsized, are your opinions very important. We would be very happy and grateful if you would like to fill in this questionnaire. All answers will be treated confidential.
1. Sex Male Female
2. Age -25 26-35 36-45 46-
3. Numbers of years at the company:……………
4. Numbers of years at the present department:…………….
5. How were you informed about the latest downsizing? (Choose one
alternative)
Private meeting Staff meeting Letter
Phone call Intranet/ closed circuit televisions
E-Mail Media/ The news Workmate
Other………….
6. Who were you informed by?
Manager A Manager B Manager C
Other
Fill in the alternative which fits best on the following questions

7. What do you think about the way your were informed about the
downsizing?
1 2 3 4 5 6 7 Very bad Neither good or bad Very good
The following questions is about Manager A
8. I think that information about the company from Manager A is easy to
understand
1 2 3 4 5 6 7 Totally disagree Totally agree
9. I think it is easy to talk to Manager A about things which consider the
company
1 2 3 4 5 6 7 Totally disagree Totally agree
10. I feel that Manager A listens to what I have to say about the company
1 2 3 4 5 6 7 Totally disagree Totally agree
11. I think that Manager A is open about changes in the company which will
affect me
1 2 3 4 5 6 7 Totally disagree Totally agree
12. I think that Manager A always keeps his promises
1 2 3 4 5 6 7 Totally disagree Totally agree

13. I feel that Manager A during changes shows that he thinks it is important
that I feel OK at work
1 2 3 4 5 6 7 Totally disagree Totally agree
14. I feel that Manager A treats me and my workmates with similar
experiences fairly
1 2 3 4 5 6 7 Totally disagree Totally agree
15. I think that Manager A has the competence to effective lead the work
1 2 3 4 5 6 7 Totally disagree Totally agree
16. I believe that Manager A always makes decisions based on the
departments best
1 2 3 4 5 6 7 Totally disagree Totally agree
17. I believe that Manager A makes decisions concerning his own interests
1 2 3 4 5 6 7 Totally disagree Totally agree
18. I believe that Manager A fights to keep the production at our department
in Kristianstad
1 2 3 4 5 6 7 Totally disagree Totally agree
The following questions are about Manager B.
19. I think that information about the company from Manager B is easy to
understand
1 2 3 4 5 6 7 Totally disagree Totally agree

20. I think it is easy to talk to Manager B about things which consider the
company
1 2 3 4 5 6 7 Totally disagree Totally agree
21. I feel that Manager B listens to what I have to say about the company
1 2 3 4 5 6 7 Totally disagree Totally agree
22. I think that Manager B is open about changes in the company which will
affect me
1 2 3 4 5 6 7 Totally disagree Totally agree
23. I think that Manager B always keeps his promises
1 2 3 4 5 6 7 Totally disagree Totally agree
24. I feel that Manager B during changes shows that he thinks it is important
that I feel OK at work
1 2 3 4 5 6 7 Totally disagree Totally agree
25. I feel that Manager B treats me and my workmates with similar
experiences fairly
1 2 3 4 5 6 7 Totally disagree Totally agree

26. I think that Manager B has sufficient competence about the work on our
department
1 2 3 4 5 6 7 Totally disagree Totally agree
27. I believe that Manager B always makes decisions based on the
departments best
1 2 3 4 5 6 7 Totally disagree Totally agree
28. I believe that Manager B makes decisions concerning his own interests
1 2 3 4 5 6 7 Totally disagree Totally agree
29. I believe that Manager B fights to keep the production at our department
in Kristianstad
1 2 3 4 5 6 7 Totally disagree Totally agree
The following questions are about Manager C.
30. I think that information about the company from Manager C is easy to
understand
1 2 3 4 5 6 7 Totally disagree Totally agree
31. I think it is easy to talk to Manager C about things which consider the
company
1 2 3 4 5 6 7 Totally disagree Totally agree
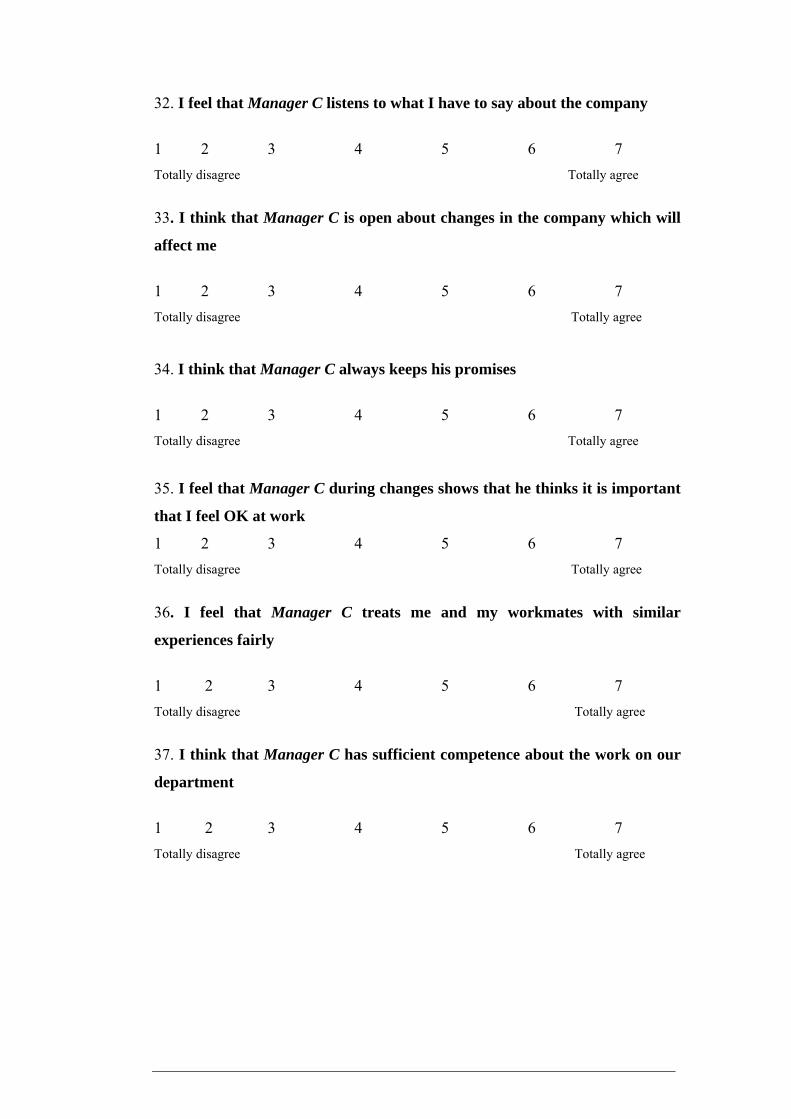
32. I feel that Manager C listens to what I have to say about the company
1 2 3 4 5 6 7 Totally disagree Totally agree
33. I think that Manager C is open about changes in the company which will
affect me
1 2 3 4 5 6 7 Totally disagree Totally agree
34. I think that Manager C always keeps his promises
1 2 3 4 5 6 7 Totally disagree Totally agree
35. I feel that Manager C during changes shows that he thinks it is important
that I feel OK at work
1 2 3 4 5 6 7 Totally disagree Totally agree
36. I feel that Manager C treats me and my workmates with similar
experiences fairly
1 2 3 4 5 6 7 Totally disagree Totally agree
37. I think that Manager C has sufficient competence about the work on our
department
1 2 3 4 5 6 7 Totally disagree Totally agree

38. I believe that Manager C always makes decisions based on the
departments best
1 2 3 4 5 6 7 Totally disagree Totally agree
39. I believe that Manager C makes decisions concerning his own interests
1 2 3 4 5 6 7 Totally disagree Totally agree
40. I believe that Manager C fights to keep the production at our department
in Kristianstad
1 2 3 4 5 6 7 Totally disagree Totally agree
41. The way we work at, makes me feel involved with the company
1 2 3 4 5 6 7 Totally disagree Totally agree
42. I think we work as a team (teamwork) at Section Q
Yes No (go to question 44)
43. What is your experience of teamwork at Section Q
1 2 3 4 5 6 7 Very bad Neither good or bad Very good
44. I feel uncertainty about future changes which can affect me negatively
1 2 3 4 5 6 7 Totally disagree Totally agree

45. I am afraid to be perceived as ineffective and therefore lose my job
1 2 3 4 5 6 7 Totally disagree Totally agree
Thank you for participating!
Otabek Akhunov
Jens Eriksson
Alexandra Karlsson

APPENDIX 2B Original Questionnaire
Hej!
Vi skriver just nu vår kandidatuppsats vid Högskolan i Kristianstad. Uppsatsen handlar om förtroendet mellan chefer och anställda i ett företag som har drabbats av nedskärningar. Då er avdelning har drabbats av nedskärningar det senaste året, är Dina åsikter mycket värdefulla. Vi skulle bli mycket glada och tacksamma om Du vill fylla i denna enkät. Alla svar kommer att behandlas anonymt.
1. Kön Man Kvinna
2. Ålder -25 26-35 36-45 46-
3. Antal år på företaget:……………
4. Antal år på nuvarande avdelning:…………….
5. Hur blev Du informerad om den senaste nedskärningen? (Välj ett
alternativ)
Enskilt möte Personalmöte Brev
Telefonsamtal Intranät/interntv E-Mail
Media/Nyheterna Arbetskamrat Annat………….
6. Vem blev Du informerad av?
Chef A Chef B Chef C
Annan
Ringa in det alternativ som passar in bäst på följande frågor.
7. Vad anser Du om sättet Du blev informerad på angående nedskärningen?
1 2 3 4 5 6 7 Mycket dåligt Varken eller Mycket bra

Följande frågor handlar om Chef A
8. Jag anser att information angående företaget från Chef A är lätt att förstå
1 2 3 4 5 6 7 Instämmer inte Varken eller Instämmer helt
9. Jag tycker det är lätt att samtala med Chef A om frågor som rör företaget
1 2 3 4 5 6 7 Instämmer inte Varken eller Instämmer helt
10. Jag känner att Chef A lyssnar på vad jag har att säga angående företaget
1 2 3 4 5 6 7 Instämmer inte Varken eller Instämmer helt
11. Jag anser att Chef A gärna delar med sig av information om förändringar
i företaget som påverkar mig
1 2 3 4 5 6 7 Instämmer inte Varken eller Instämmer helt
12. Jag anser att Chef A alltid genomför vad han har sagt och lovat mig
1 2 3 4 5 6 7 Instämmer inte Varken eller Instämmer helt
13. Jag känner att Chef A visar vid förändringar att han tycker det är viktigt
att jag mår bra på arbetsplatsen
1 2 3 4 5 6 7 Instämmer inte Varken eller Instämmer helt
14. Jag känner att Chef A behandlar mig och anställda med liknande
erfarenheter lika
1 2 3 4 5 6 7 Instämmer inte Varken eller Instämmer helt
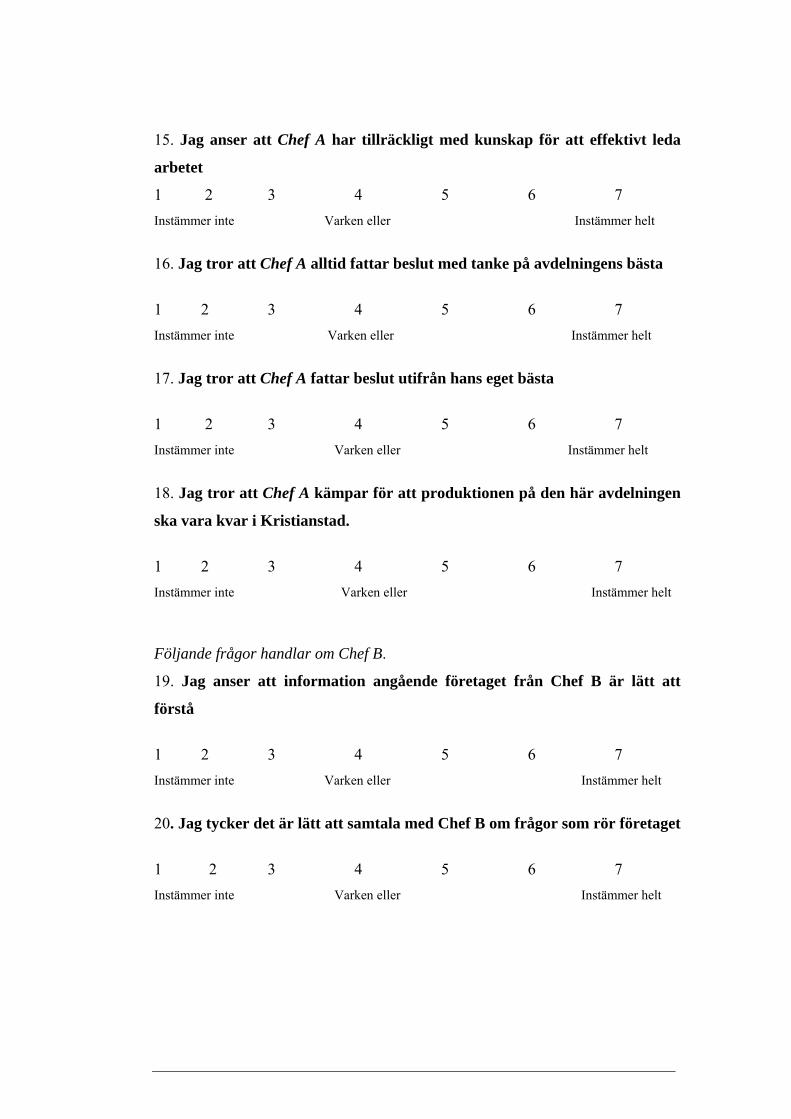
15. Jag anser att Chef A har tillräckligt med kunskap för att effektivt leda
arbetet
1 2 3 4 5 6 7 Instämmer inte Varken eller Instämmer helt
16. Jag tror att Chef A alltid fattar beslut med tanke på avdelningens bästa
1 2 3 4 5 6 7 Instämmer inte Varken eller Instämmer helt
17. Jag tror att Chef A fattar beslut utifrån hans eget bästa
1 2 3 4 5 6 7 Instämmer inte Varken eller Instämmer helt
18. Jag tror att Chef A kämpar för att produktionen på den här avdelningen
ska vara kvar i Kristianstad.
1 2 3 4 5 6 7 Instämmer inte Varken eller Instämmer helt
Följande frågor handlar om Chef B.
19. Jag anser att information angående företaget från Chef B är lätt att
förstå
1 2 3 4 5 6 7 Instämmer inte Varken eller Instämmer helt
20. Jag tycker det är lätt att samtala med Chef B om frågor som rör företaget
1 2 3 4 5 6 7 Instämmer inte Varken eller Instämmer helt
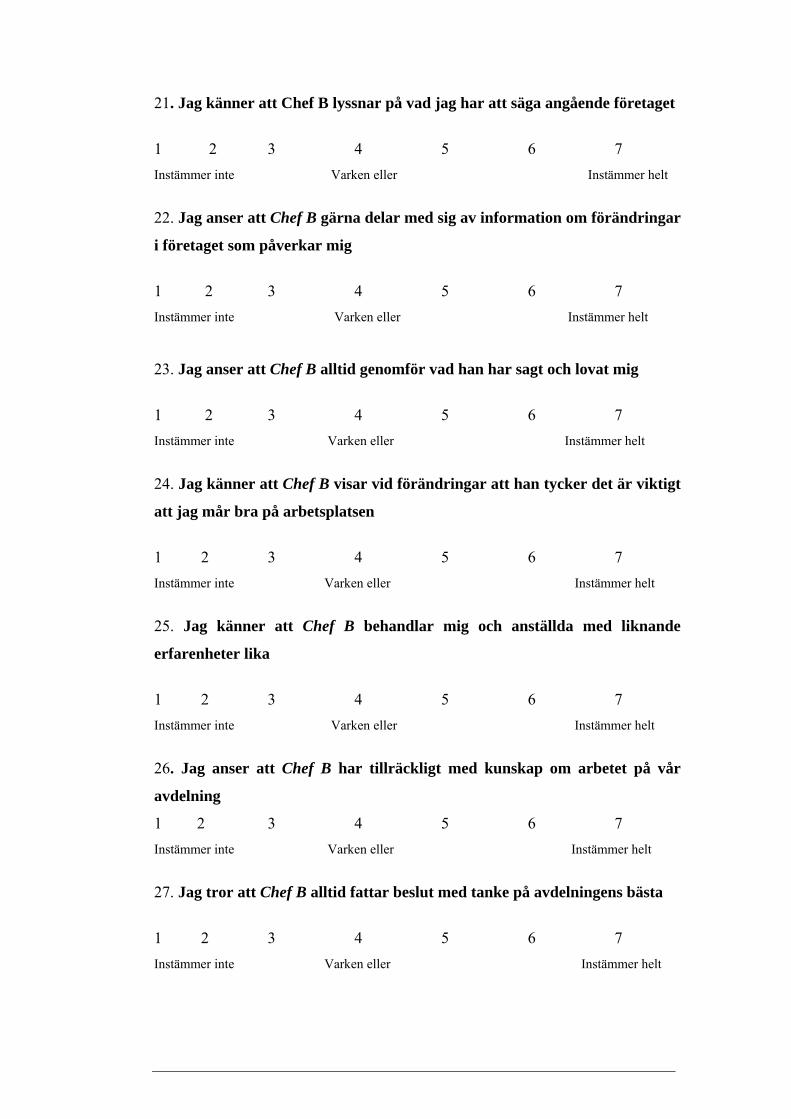
21. Jag känner att Chef B lyssnar på vad jag har att säga angående företaget
1 2 3 4 5 6 7 Instämmer inte Varken eller Instämmer helt
22. Jag anser att Chef B gärna delar med sig av information om förändringar
i företaget som påverkar mig
1 2 3 4 5 6 7 Instämmer inte Varken eller Instämmer helt
23. Jag anser att Chef B alltid genomför vad han har sagt och lovat mig
1 2 3 4 5 6 7 Instämmer inte Varken eller Instämmer helt
24. Jag känner att Chef B visar vid förändringar att han tycker det är viktigt
att jag mår bra på arbetsplatsen
1 2 3 4 5 6 7 Instämmer inte Varken eller Instämmer helt
25. Jag känner att Chef B behandlar mig och anställda med liknande
erfarenheter lika
1 2 3 4 5 6 7 Instämmer inte Varken eller Instämmer helt
26. Jag anser att Chef B har tillräckligt med kunskap om arbetet på vår
avdelning
1 2 3 4 5 6 7 Instämmer inte Varken eller Instämmer helt
27. Jag tror att Chef B alltid fattar beslut med tanke på avdelningens bästa
1 2 3 4 5 6 7 Instämmer inte Varken eller Instämmer helt

28. Jag tror att Chef B fattar beslut utifrån hans eget bästa
1 2 3 4 5 6 7 Instämmer inte Varken eller Instämmer helt
29. Jag tror att Chef B kämpar för att produktionen på den här avdelningen
ska vara kvar i Kristianstad.
1 2 3 4 5 6 7 Instämmer inte Varken eller Instämmer helt
Följande frågor handlar om Chef C.
30. Jag anser att information angående företaget från Chef C är lätt att
förstå
1 2 3 4 5 6 7 Instämmer inte Varken eller Instämmer helt
31. Jag tycker det är lätt att samtala med Chef C om frågor som rör företaget
1 2 3 4 5 6 7 Instämmer inte Varken eller Instämmer helt
32. Jag känner att Chef C lyssnar på vad jag har att säga angående företaget
1 2 3 4 5 6 7 Instämmer inte Varken eller Instämmer helt
33. Jag anser att Chef C gärna delar med sig av information om förändringar
i företaget som påverkar mig
1 2 3 4 5 6 7 Instämmer inte Varken eller Instämmer helt
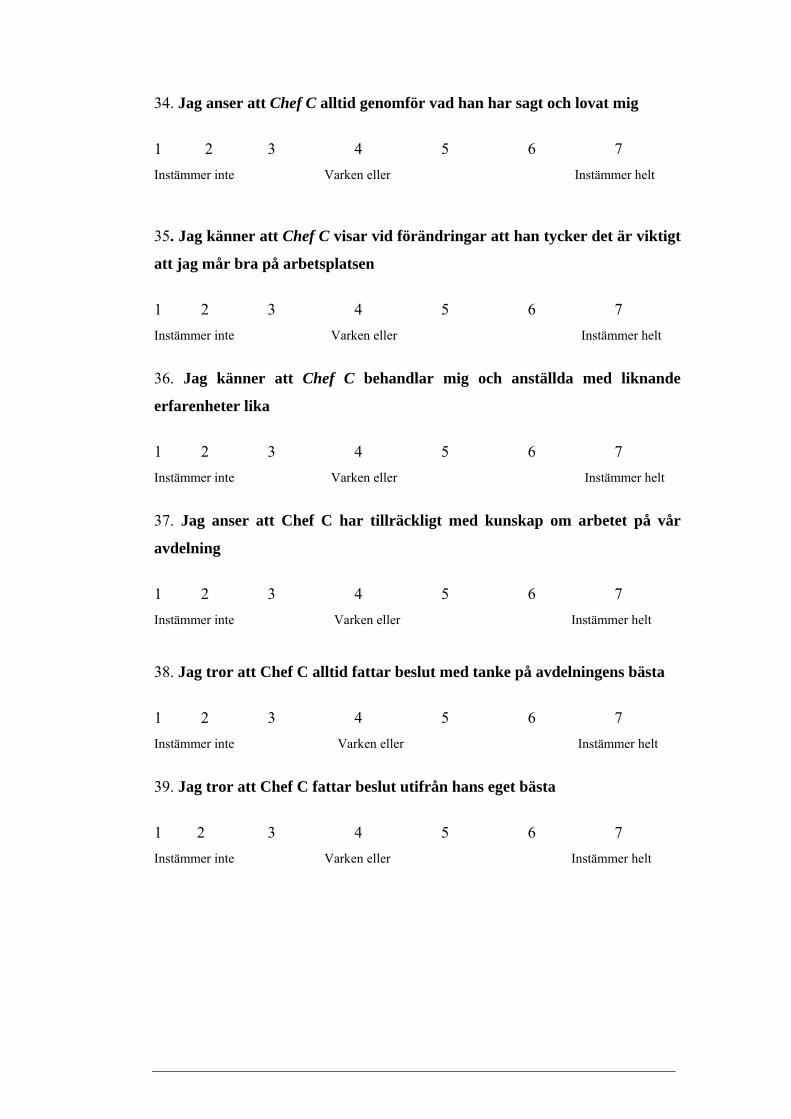
34. Jag anser att Chef C alltid genomför vad han har sagt och lovat mig
1 2 3 4 5 6 7 Instämmer inte Varken eller Instämmer helt
35. Jag känner att Chef C visar vid förändringar att han tycker det är viktigt
att jag mår bra på arbetsplatsen
1 2 3 4 5 6 7 Instämmer inte Varken eller Instämmer helt
36. Jag känner att Chef C behandlar mig och anställda med liknande
erfarenheter lika
1 2 3 4 5 6 7 Instämmer inte Varken eller Instämmer helt
37. Jag anser att Chef C har tillräckligt med kunskap om arbetet på vår
avdelning
1 2 3 4 5 6 7 Instämmer inte Varken eller Instämmer helt
38. Jag tror att Chef C alltid fattar beslut med tanke på avdelningens bästa
1 2 3 4 5 6 7 Instämmer inte Varken eller Instämmer helt
39. Jag tror att Chef C fattar beslut utifrån hans eget bästa
1 2 3 4 5 6 7 Instämmer inte Varken eller Instämmer helt

40. Jag tror att Chef C kämpar för att produktionen på den här avdelningen
ska vara kvar i Kristianstad.
1 2 3 4 5 6 7 Instämmer inte Varken eller Instämmer helt
41. Sättet vi arbetar på gör att jag känner mig involverad i företaget
1 2 3 4 5 6 7 Instämmer inte Varken eller Instämmer helt
42. Jag tycker att vi arbetar som ett lag (teamwork) på avdelningen
Ja Nej (gå till fråga 44)
43. Vad är din erfarenhet av hur ”teamwork” fungerar på avdelningen
1 2 3 4 5 6 7 Mycket dåligt Varken eller Mycket bra
44. Jag känner att det finns osäkerhet för fler förändringar som kan påverka
mig negativt
1 2 3 4 5 6 7 Instämmer inte Varken eller Instämmer helt
45. Oro finns för jag uppfattas som ineffektiv och därmed förlorar jobbet
1 2 3 4 5 6 7 Instämmer inte Varken eller Instämmer helt
Tack för Din medverkan!
Otabek Akhunov
Jens Eriksson
Alexandra Karlsson

APPENDIX 3
Interviews with the middle Managers
We have interviewed three middle managers which where recently involved in a
downsizing process, on Section Q at Swedish Meats in Kristianstad. The
managers had different roles in the downsizing process. What they had in
common was that they all have worked close with the fired employees and the
survivors. The managers have worked at Swedish Meats in Kristianstad between
15-45 years at different positions. Questions about their background and time of
employment at Swedish Meats were asked in the beginning of the interviews. The
reason to why we summarize this information is, that we promised them total
anonymity. Due to this we call them Manager A, Manager B and Manager C. The
part of Swedish Meats we conducted the survey at, are referred to as Section Q.
Interview with Manager A.
What part did you play in the downsizing process?
My part was to carry out the practical downsizing, how to organize the work at
Section Q in the future. I was involved with reducing the employees from 66-23,
and at the same time we went from working in two shifts to working in one shift. I
have also informed the employees about how we were going to execute these
organizational changes.
How did you inform about the downsizing?
We gathered all the employees at the entire department. It was Manager B that
gave the information. At this time did he only informed about the downsizing and
the reason to it, not the amount of redundancies or which of them that were
affected. Those issues did we discuss later with each of them that had to leave
Section Q.
Did you have any experiences of downsizing?
No, I came directly from school when I began working at Section Q. I had worked
at Section Q for five years before I became manager. So I was totally green when
I began here. But I have learned by time. The company have a lot of times been
threatening to shut down. We should have been gone by 2005 but we still exist.
The staffs still believe that the production will continue here.
What possibilities do you have to increase your competence? Does the
company invest in courses for you that help you in your work as manager?
I have taken a lot of courses to be able to carry out my role as manager. But how
to act in a downsizing process is nothing that you will learn by attend courses. I
had about 60 employees and they all reacted in different ways. There is no model
you can follow. You just have to talk to each individual, explain the situation and
why we have to do as we do. Then you have to deal with their reaction the best
you can.
When you worked as a manager at Section Q did you work as a team, did
you experience any “team-feeling”?
The team-feeling is really strong at Section Q. We work everyone for one. Earlier
it was more like they only worked at one machine all the time. But I have worked
rather hard with getting the group together. I want them to feel that if one have a
lot of work to do, then someone else will come and help them out. I think that the
team-feeling is really strong at the moment.
During your time as a manager for Section Q, what did you do to make the
employees feel OK during and after the downsizing process?
Actually, I was lucky. The ones that worked for me had been employed for so
many years that they did not have to leave the company. What I could do was to
offer them a job at another department in Kristianstad. Of course they wanted to
stay at Section Q, but since I could offer them another job, I did not receive that
strong reaction from them. The information about the downsizing did not come as
a bolt from the blue. They have been warned about this for a long time that the
production should be moved to another city. I got that information about six
months before this was to be executed. So I informed the employees at a staff-
meeting right away about how the situation would be like in six months. I have
given them time to get used to the new situation.

What do you do to make the employees feel, that they are treated fair by
you?
That is a difficult question. I have a salary system based on performance. I am
very precise with how I treat the employees. I do not make any differences if it is
a male or a female. I do not favour anyone, I treat them all in the same way.
What did you do to decrease the uncertainty among the employees for
changes within the company during the downsizing period?
As I said earlier, I inform the employees in advance about what will happen in the
future. At my staff meetings we discuss what, when and why things will happen
or change in the future. If we receive extra production, I inform the staff about it
2-5 days before it will happen, if it change the way we work. It is not possible to
inform about it only one day in advance. If that happens they are not that willing
to cooperate. If there will be huge organizational changes in the way we work, I
start to inform them about it one or two months in advance, then it goes much
easier.
When you inform the employees about changes are you absolute sure that
this will be executed?
Yes, when I inform about changes I am totally sure about it.
When we walked in the hallway, we saw closed-circuit televisions, what kind
of information are published on them?
It is a quite new system, we only had it for 2-3 months. We use it to inform about
volumes and if it is something we need to work extra on.
Do you inform about major organizational changes like downsizing or things
written about it in the newspapers at the closed-circuit televisions?
No, we always have a meeting when we inform about things like that.
When the employees receive information about downsizing or organizational
changes, do they get the information first from you / another manager or the
media?

Unfortunately, sometimes do they get the information from the newspaper first.
How do the employees react when this happens?
Most of the times are the information from media not correct. There is usually
something that is correct but a lot of it is not. This creates a huge irritation among
the employees and it is really bad that they hear it first from media and not from
us.
What do you do when this happens?
I have to inform the employees about the situation, if the information from media
is correct or not. A lot of times have the information from media been incorrect.
But it has happened that the information from media is correct. When this
happens, the employees get really irritated. What I can do in that situation is to
inform them and then almost apologize for not informing them on time. Most of
the times this happens is it about huge organizational changes. And it is not
always that I as middle manager receive information about it. One time it was a
leak to a newspaper about an organizational change but I had nothing to do with
the plans on the organizational change. A lot of these things can I not influence.
But I think it works better now. We have been much better on it.
Could every employee at Section Q come and talk openly to you about how
he / she felt about the situation?
There are a lot of employees who rather talks to a colleague. But some of them
came in to me and show what they felt and cried a bit. But for some employees it
is a bit susceptibility to show their feelings for me.
Have you said to them that they can come to you and talk?
I said it for a long time ago, but it is nothing that I have worked that much with.
But since I have worked with them for several years before I became manager,
they all know who I am and how I work and they know they can come and talk if
they feel for it. Both about private stuff and about the work situation. But there
are some which do not dare.

Does the company offer any preventive healthcare for the employees?
We have massage four days a week where every employee can attend one hour /
week. It cost them one hour salary but they can do it during their work time. They
also have 1000:- which they can use to swim card etc. We also rent gyms where
they can play football etc.
Did they attend in the preventive healthcare even when they knew that they
have to leave Section Q?
It is difficult to say whether they did or not, I think it decreased a bit. I believe
that they wanted to prove that they wanted to stay at Section Q and worked harder
instead. This is only my speculations I do not have any statistics on this, it is more
a feeling I have.
Interview with Manager B
What part did you play in the downsizing process?
My role was to execute the downsizing. I have worked a lot with moving the
products from Kristianstad to Linköping where it is produced today. I have also
been involved with the redundancies. Manager C and I have helped each other a
lot in this process. We also had a very good relation with the Union.
Did you have any experiences of downsizing?
It was the first time that I experienced a downsizing at the department I am
working at. It was a new experience for me and it was very hard work, since it
was a lot of colleagues I had for several years that had to leave Section Q.
What possibilities do you have to increase your competence? Does the
company invest in courses for you that help you in your work as manager?
Oh yes, I have participated in several courses.
How involved are you with the employees at Section Q?
It is another manager who leads the work but I work a lot on the floor together
with them. I am very involved with the production. The employees know me very
well. A know the name on everyone working at the entire department. Sometimes
it happens that they come to me when they have a problem, but I do not want to
go behind their closest managers back, so I tell them to talk to him instead. I have
a very good contact with the employees at Section Q.
Do you work with creating a team-feeling among the employees?
I believe it is important that everyone feel that they are involved in the work they
carry out. I have always tried to work as a team with the other managers who lead
the work on the floor. I believe it is even more important now when we have
decreased the number of employees. We help each other more today, if one
manager on one section of the department needs more employees for a short time,
then we lend that manager some employees.
How did you inform about the downsizing?
We had a big staff-meeting on the entire department where we informed about the
decision that was made on moving the production from Kristianstad to Linköping.
This decision did not only involve the employees at Section Q. Since we followed
the LAS-list we had to transfer the employees to different parts of the department.
What did you do to make the employees feel OK during and after the
downsizing process?
We have lived with a threat to shut the company down during the past five years.
We are not as many as we were then but we are still here so the employees have
been quite chastened. The employees have been amazing, nobody have slow
down their work and they have also worked overtime without complaining. The
employees have dealt with this very good. Even the transfer of employees within
the department has gone much better then expected.
Could every employee at Section Q come and talk openly to you about how
he / she felt about the situation?
Yes, I don’t think that has been a problem. We have had staff-meetings and then
have some of the employees thought that they got to little information. I think it is
always like that in a situation like this, that the employees feel they get to little
information, but I have to have something to inform about to. I do not have all the
answers to all the questions.

Was the employees treated fair during the downsizing process, did somebody
get any advantages?
We made a few exceptions at Section Q. There were a lot of females and very few
males working there. Since the work is quite heavy we choose to keep some of the
males instead of the females. We had to refer to the competence that the males
had. But the females did not have to leave the company. They where transferred
to another part of the department. We tried to be as fair as possible and there has
not been any big controversy with the Union. There were a few females which
thought that they had been treated unfair, but we solved it and everyone involved
got satisfied with the solution.
What did you do to decrease the uncertainty among the employees during the
downsizing process?
There where employees who wanted to leave because they wanted to do
something else with their lives. We helped some of them to start study and some
of them got a few extra salaries.
A lot of them has come to us and said that they wanted to quit their jobs, and
asked us to help them to do something else. I think that a lot of people feel that
they might not want to stay at the department for 50 years. The employees who
said, that they wanted to quit or that they wanted to study have we helped through
Lernia.
Interview with Manager C
When did the downsizing start at Section Q?
It began spring 2006 and it has been in two turns, where about 20 employees had
to leave at each turn.
What was the reason to downsize Section Q?
For some years ago, a decision was made that all the production of X should be
produced in Linköping. But they did not have capacity for it then, so we had to
produce them here, until spring 2006 when they had the capacity.
Do you think that there will be any further downsizing at Section Q?
Today, there are no intentions to further downsize Section Q.

What part did you play in the downsizing process?
Me and my colleague D job were to inform and negotiate with the Union. We had
to inform all the employees which where affected by the downsizing. Both those
who had, to leave the company and those who had the opportunity to be
transferred to another section of the department. Our job was also to collect
requests about section of the department, the employees would like to be
transferred to.
Did you have any experiences of downsizing?
Yes, we have had bigger downsizings at other departments between 2003 and
2005. The first time it was a bit fumbling for me. But I have learned by time how
to talk and negotiate with the Union and employees in these situations. So I would
say that I have experience from previous downsizing.
What possibilities do you have to increase your competence? Does the
company invest in courses for you that help you in your work as manager?
Yes, I have participated in different courses to be able to do my job, for example
conflict handling. Participating in a course can never be compared with how it is
reality.
How involved are you with the employees at Section Q?
When the decision was taken to transfer the production to Linköping, we
informed all the affected employees on the entire department. Then we put the
information on our intranet or the closed-circuit televisions, so all the other
employees where informed about what happened within the company. When
Manager B had informed the employees, I started to negotiate with the Union
about which employees that have to leave, or be offered to be transferred to
another section of the department. Then we informed all the employees what we
had decided in the negotiations with the Union. Then we talked to the affected
employees in private. Manager B talked to the employees which were offered a
job on another section of the department. These employees had also opportunity,
to visit the section they were offered a transfer to. My job was to talk to the
employees, which had to leave the company.

What did you do to make the employees feel OK during and after the
downsizing process?
There is something called TSL. Every employee that gets unemployed can receive
19 000:- for a changeover. If the employee were interested by this, they were
contacted by a consult from Lernia, which we cooperated with during this
process. The employees got 3-4 meetings with the consult and learned how to
write a CV and received information about what kind of job they could apply for,
with their specific background. We received follow ups from Lernia during the
process which was 3-4 months. Some of the participants wanted to do it by
themselves and some wanted to be helped all way through. The information we
got was that this program was very popular among the participants.
If the participants have not got a job during this time did you help them
further?
No after these 3-4 months we have not have any contact with them. Some of them
which had worked more then a year here, have used their right to precedence,
when they applied for other jobs at Swedish Meats. If they had the right
competence they have got the job.
Could every employee at Section Q come and talk openly to you about how
he / she felt about the situation?
Most of the time we get some responsorial from Lernia what the participants
considered about the program. I have almost always a final meeting with the
employee leaving us, where we can talk about what they feel and so on, so they
just do not leave us. I use to have this talk when they leave their keys and passing
cards and so on. But a lot of times when I have had this meeting, it is with
employees who voluntary leave the company, because they want to do something
else, studying etc. At both of the downsizings at Section Q, have 5-6 employees
voluntary left the company.
At these final meetings do you think that the employees are honest with what
they say?
I am not sure about that. I hope they are honest with what they feel, but it is not
impossible that they lie about some things.
Have you noticed that somebody are talking bad about what happened
during the downsizing process behind your back?
It happened maybe once or twice, but most of the times I heard positive things
about it. I have meet some of them private and asked them how it has gone. Many
of them have found new jobs which they like and moved on with their lives.
When you inform the employees about changes are you absolute sure that it
will be executed?
Well, Section Q has been threatening to shut down for the past 4-5 years. During
these years we have constantly looked for organizational changes for the entire
department. Two times have we sent out signals that we shall downsize the
department but it was never executed. Due to this we have lost some employees,
because they felt uncertainty about the future at Swedish Meats. This has also
leaded to that some employees do not take information about downsizing
seriously. When we began to execute the downsizing the spring 2006, it came as a
chock for some of them.
Was the employees treated fair during the downsizing process, did somebody
get any advantages?
During the two turns at Section Q were 20 employees forced to leave, 12-13 of
them where transferred to another section of the department. At these two turns,
there were most females that had to be transferred, even if they had worked there
longer then the males. We want to follow the rule last in first out, but we also
have the right to consider the competence and make exceptions from this rule at
transfers. The reason to do this was that we needed the right mix of competences
at Section Q. The affected females responded negatively to the fact that they had
to be transferred and not the males. But when they been a while at their new jobs I
asked them if they liked it there. The answer I got was that everything had turned
out very well for them in the end.

Did you explain the reasons to why you transferred the females instead of the
males with the affected females?
Yes, we did.
What did you do to decrease the uncertainty among the employees during the
downsizing process?
It is always difficult, I mean you always want that everything shall turn out as
well as possible for the employees. We help the employees to go on with their
lives if they want that, I think about the cooperation we had with Lernia. When
we get in to these situations like a downsizing, we investigate if there are any
employees who do not want to work here anymore, because they do not like it or
if they want to study. These people are almost always worried about what will
happen if I quit my job, they are worried about their financial situation etc. I can
not help them with their financial situation, but my door is always open if they
want to come and talk to me about these things. I think it is very important that
they get a chance to talk about it, to decrease the worry about the future.
How do you make sure that the information about downsizing or
organizational changes comes to the employees first from the managers and
not from media?
We have very important networks that start at these situations. First we inform the
Union, second we get the information to the affected departments and finally we
inform the media. Before we inform the media is it very important that all the
employees, who are at work that they are informed. It is a very hard works to
make sure that information does not leak to the media, before we have informed
the employees.

Statistics
21 21 21 21 21 210 0 0 0 0 0
4,48 4,71 4,76 4,33 4,57 4,484,00 4,00 5,00 4,00 5,00 4,00
1,537 1,707 1,411 1,798 1,690 1,834
ValidMissing
N
MeanMedianStd. Deviation
Jag anser attinformationangående
företaget frånProduktionsle
daren/Arbetsledaren
är lätt attförstå
Jag tycker derär lätt att
samtala medProduktionsle
daren/Arbetsledaren
om frågorsom rör
företaget
Jag känner attProduktionsle
daren/Arbetsledarenlyssnar på vad
jag har attsäga
angåendeföretaget
Jag anser attProduktionsle
daren/Arbetsledaren
gärna delarmed sig avinformation
omförändringar iföretaget sompåverkar mig
Jag anser attProduktionsle
daren/Arbetsledaren
alltidgenomför vadhan har sagtoch lovat mig
Jag känner attProduktionsle
daren/Arbetsledaren
visar vidförändringar
att han tyckerdet är viktigt
att jag mår brapå
arbetsplatsen
Statistics
21 21 21 21 210 0 0 0 0
4,62 4,43 4,76 3,48 6,335,00 4,00 5,00 3,00 7,00
2,037 1,938 1,700 1,940 1,065
ValidMissing
N
MeanMedianStd. Deviation
Jag känner attProduktionsle
daren/Arbetsledaren
behandlarmig och
anställda medliknande
erfarenheterlika
Jag anser attProduktionsle
daren/Arbetsledarenhar tillräckligtmed kunskapför att effektivtleda arbetet
Jag tror attProduktionsl
edaren/Arbetsledaren alltid fattarbeslut medtanke på
avdelningens bästa
Jag tror attProduktionsle
daren/Arbetsledarenfattar beslututifrån hanseget bästa
Jag tror attProduktionsle
daren/Arbetsledarenkämpar för attproduktionenpå den här
avdelningenska vara kvar i
Kristianstad
APPENDIX 4
Manager A
Normally Distributed Data
Question 8 Question 9 Question 10 Question 11 Question 12 Question 13
Question 14 Question 15 Question 16 Question 17 Question 18

Statistics
21 21 21 21 21 210 0 0 0 0 0
5,43 4,81 4,43 4,67 4,81 4,146,00 4,00 4,00 5,00 5,00 4,00
1,207 1,250 1,207 1,528 1,632 1,982
ValidMissing
N
MeanMedianStd. Deviation
Jag anser attinformationangående
företaget frånProduktionschefen är lätt att
förstå
Jag tycker detär lätt att
samtala medProduktionsch
efen omfrågor som rör
företaget
Jag känner attProduktionschefen lyssnar
på vad jag haratt säga
angåendeföretaget
Jag anser attProduktionsch
efen gärnadelar med sigav information
omförändringar iföretaget sompåverkar mig
Jag anser attProduktionsch
efen alltidgenomför vadhan har sagtoch lovat mig
Jag känner attProduktionschefen visar vidförändringar
att han tyckerdet är viktigt
att jag mår brapå
arbetsplatsen
Statistics
21 21 21 21 210 0 0 0 0
4,86 5,52 5,86 4,76 6,335,00 6,00 6,00 5,00 7,00
1,957 1,662 1,276 1,868 1,017
ValidMissing
N
MeanMedianStd. Deviation
Jag känner attProduktionsch
efenbehandlarmig och
anställda medliknande
erfarenheterlika
Jag anser attProduktionsch
efen hartillräckligt medkunskap om
arbetet på våravdelning
Jag tror attProduktionsch
efen alltidfattar beslut
med tanke påavdelningens
bästa
Jag tror attProduktions
chefenfattar beslututifrån hanseget bästa
Jag tror attProduktionschefen kämpar
för attproduktionenpå den här
avdelningenska vara kvar i
Kristianstad
Manager B
Normally Distributed Data
Question 19 Question 20 Question 21 Question 22 Question 23 Question 24
Question 25 Question 26 Question 27 Question 28 Question 29
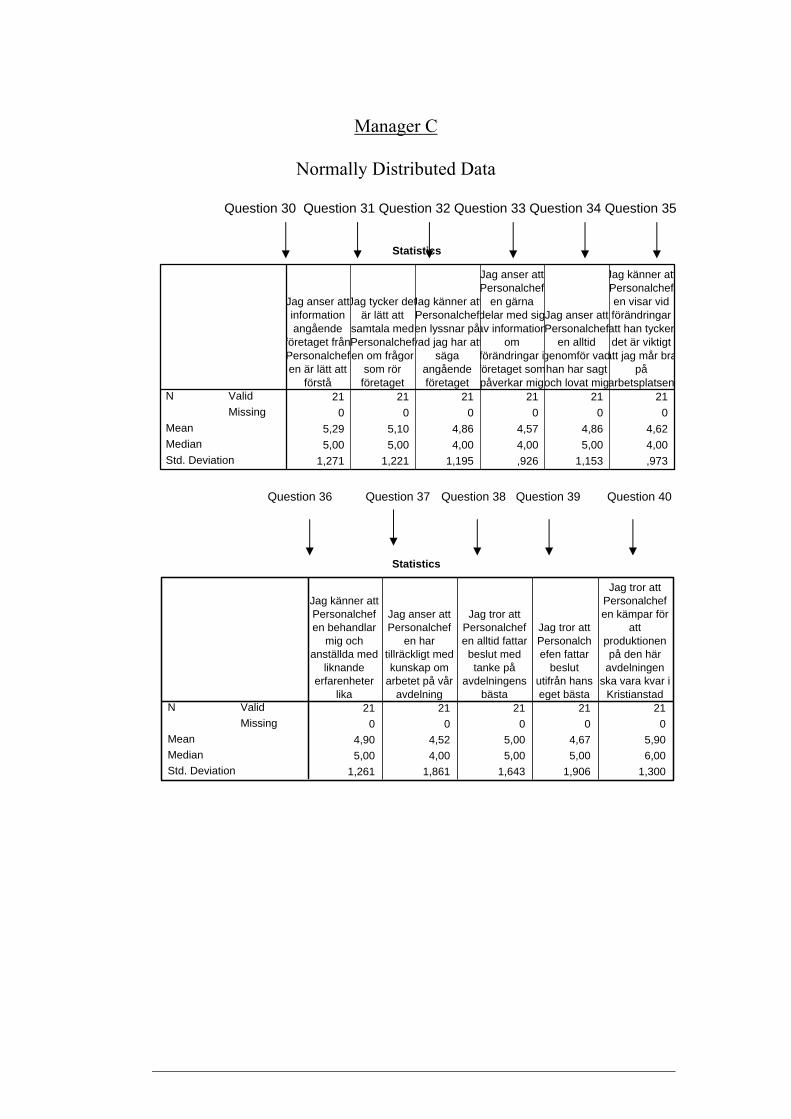
Statistics
21 21 21 21 21 210 0 0 0 0 0
5,29 5,10 4,86 4,57 4,86 4,625,00 5,00 4,00 4,00 5,00 4,00
1,271 1,221 1,195 ,926 1,153 ,973
ValidMissing
N
MeanMedianStd. Deviation
Jag anser attinformationangående
företaget frånPersonalchefen är lätt att
förstå
Jag tycker detär lätt att
samtala medPersonalchefen om frågor
som rörföretaget
Jag känner attPersonalchefen lyssnar påvad jag har att
sägaangåendeföretaget
Jag anser attPersonalchef
en gärnadelar med sigav information
omförändringar iföretaget sompåverkar mig
Jag anser attPersonalchef
en alltidgenomför vadhan har sagtoch lovat mig
Jag känner attPersonalchefen visar vidförändringar
att han tyckerdet är viktigt
att jag mår brapå
arbetsplatsen
Statistics
21 21 21 21 210 0 0 0 0
4,90 4,52 5,00 4,67 5,905,00 4,00 5,00 5,00 6,00
1,261 1,861 1,643 1,906 1,300
ValidMissing
N
MeanMedianStd. Deviation
Jag känner attPersonalchefen behandlar
mig ochanställda med
liknandeerfarenheter
lika
Jag anser attPersonalchef
en hartillräckligt medkunskap om
arbetet på våravdelning
Jag tror attPersonalchefen alltid fattar
beslut medtanke på
avdelningensbästa
Jag tror attPersonalchefen fattar
beslututifrån hanseget bästa
Jag tror attPersonalchefen kämpar för
attproduktionenpå den här
avdelningenska vara kvar i
Kristianstad
Manager C
Normally Distributed Data
Question 30 Question 31 Question 32 Question 33 Question 34 Question 35
Question 36 Question 37 Question 38 Question 39 Question 40

Statistics
21 21 21 21 21 210 0 0 0 0 0
4,29 4,71 1,38 4,62 6,14 3,144,00 5,00 1,00 5,00 7,00 3,00
1,678 1,309 ,498 1,284 1,590 2,372
ValidMissing
N
MeanMedianStd. Deviation
Vad anser Duom sättet Du
blevinformerad på
angåendenedskärninge
n?
Sättet viarbetar pågör att jagkänner miginvolverad i
företaget
Jag tycker attvi arbetar
som ett lag(teamwork)
påavdelningen
Vad är dinerfarenhet av
hur"teamwork"fungerar påavdelningen
Jag känner attdet finns
osäkerhet förfler
förändringarsom kan
påverka mignegativt
Oro finns förjag uppfattassom ineffektivoch därmed
förlorar jobbet
Questions 7, 41, 42, 43, 44 and 45
Normally Distributed Data
Question7 Question 41 Question 42 Question 43 Question 44 Question 45